International QEEG Certification Board Blueprint Coverage
This unit addresses VI. Clinical and Cognitive Aspects (6.5 hours).
This unit covers Developmental Changes in the EEG, the Origins of the EEG, EEG Signatures Requiring Referral, Brodmann Area Functions and Network Connections, LORETA Interpretation and Training, General Cognitive and Clinical Changes After Neurofeedback Training, and How Clinical Presentation May Affect the EEG.
DEVELOPMENTAL CHANGES IN THE EEG
This section describes EEG rhythms and their amplitude and frequency changes across the life cycle.
Delta (0.5-3 Hz)
There are two delta rhythms, a slow oscillation under 1 Hz and a traditional 1-4 Hz oscillation. The slow 0.3-0.4 Hz oscillation originates in the neocortex and persists when the thalamus is removed. Thalamo-cortical neurons generate the 1-4 Hz oscillations observed during human stage-3 sleep. Slow neocortical oscillations may synchronize the thalamic delta rhythm (Steriade, 2005).
Delta activity is generated by cortical neurons when other connections do not activate them and is found predominantly in frontal areas. Delta is associated with sleep and infancy. Delta is associated with sleep and infancy. During stage-3 sleep, delta allows astrocytes to rebuild their stores of glycogen. Clinicians observe delta in clients diagnosed with ADHD, brain tumors, learning disorders, and traumatic brain injury (TBI). Rhythmic high-amplitude delta is associated with TBI, mainly if localized. Diffuse delta may be found in ADHD and learning disorders.
Normal Amplitudes
Delta should not be present in significant amounts in the awake adult EEG. "Apparent" delta is usually an eye movement artifact. Some delta activity probably occurs in the waking adult EEG.
The mechanisms that generate the theta rhythm are poorly understood. Theta differs depending on location and source. Amzica and Lopes da Silva (2011) consider the classic septal/diagonal band pacemaker model incomplete. Hippocampal interneurons, which innervate the hypothetical medial septum pacemaker, exercise top-down control. The hypothalamic supramammillary nucleus, with extensive connections to the brainstem, diencephalon, and medial septum, may also pace and modulate hippocampal theta. Further, a non-cholinergic theta source has been found within the entorhinal cortex of the hippocampus.
Theta is associated with creativity, global synchronization, memory formation, and recall. Increased theta amplitudes correspond with hypo-perfusion and decreased glucose metabolism.
Excessive frontal theta is linked with depression, daydreaming, distractibility, and inattention. A theta/beta (T/B) ratio of 3.0 may indicate ADHD depending on age, as T/B ratios are developmentally mediated (Monastra et al., 1999).
Normal Amplitudes
Theta voltage is age-related in the awake EEG. Voltage diminishes from age 8-30 with minimal amounts over age 30. A typical 6-7 Hz rhythm in the frontal midline (FCz) is associated with mental activity such as problem-solving and a wide variety of other functions. This rhythm appears to be limbic in origin. It is higher in amplitude and more synchronous when processing the feedback that an error has occurred. The 4-Hz rhythm is associated with childhood pleasurable experiences and memory searches in adults.
Rhythmic Slow Wave (RSW or Theta)
Inhibit theta to remediate symptoms. Reward posterior RSW in alpha/theta training for addictions, global synchronization, optimal performance, and PTSD. RSW is generally not increased frontally. Clinicians may train for increases or decreases in phase synchrony. RSW is mainly seen in the frontal-midline (FCz) when awake with eyes open. The limbic system and thalamus generate RSW. Depending on location, RSW may be slowed-alpha as thalamic output slows.
The 8-13-Hz alpha rhythm differs from spindle waves in both its source and the activity during which it is
observed. Alpha 1 (low alpha) ranges from 8-10 Hz and alpha 2 (high alpha) from 10-13 Hz (Thompson & Thompson, 2016). Alpha rhythms depend on the interaction between rhythmic burst firing by a subset of thalamocortical (TC) neurons linked by gap junctions and rhythmic inhibition by widely distributed reticular nucleus neurons (Hughes & Crunelli, 2005). The alpha rhythm is maintained and propagated by cortical networks (Amzica & Lopes da Silva, 2018). Graphic of thalamocortical architecture courtesy of the Laboratory of Neuro Imaging and Martinos Center for Biomedical Imaging, Consortium of the Human Connectome Project.
Researchers have correlated the alpha rhythm with
relaxed wakefulness. There are age- and function-related differences. Spindle waves, in contrast, originate in the thalamus and occur during
unconsciousness and stage 2 sleep (Steriade, 2005).
Alpha is the dominant rhythm in adults and is located posteriorly. The 8-10 Hz range is associated with ADHD, daydreaming, fogginess, OCD, and TBI. Frontal asymmetry is associated with depression. The 10-12 Hz range is seen with inner calm (calm and alert) and meditation. Clinicians train alpha amplitude and phase synchrony up or down for remediation of symptoms, depending on location.
Posterior Dominant Rhythm (PDR)
The posterior alpha rhythm is visible at about 4 months with a frequency of around 4 Hz. Between 3-5 years, this rhythm is approximately 8 Hz with amplitudes as high as 100 μV. From 6-15 years, this rhythm is 9 Hz by age 7 and 10 Hz by ages 10-15 with a mean amplitude of 50-60 μV. Girls show a statistically faster acceleration of posterior alpha frequency than boys. From 13-21 years, the mean alpha frequency is 10 Hz, and amplitudes decline throughout this period. Faster alpha frequencies are associated with higher IQ and better memory performance.
The typical adult alpha frequency ranges from 9.5-10.5 Hz. Alpha below 8 Hz is considered abnormal. There are age-related differences. Alpha frequency declines after age 70. Adult amplitudes are 50 μV or less:
60% have ~ 20-60
μV
28% have < 25
μV
6% have > 60
μV
Higher alpha amplitudes are observed over the non-dominant (right) hemisphere (alpha asymmetry). Most studies show no effect of handedness. Asymmetry is generally no more than 20 μV or 20% of the greater of the two amplitudes (Amzica & Lopes da Silva, 2018).
Causes of Excessive Alpha Amplitudes
Sleep deprivation or metabolic exhaustion can result in high amplitude and slowing of the peak frequency and persistent alpha during an eyes-open condition. Meditation practices can cause increased amplitudes and slowing, a faster alpha response to an eyes-closed condition, and persistent alpha in an eyes-open condition. Marijuana use and abuse can cause increased amplitudes and slowing, persistent alpha in an eyes-open condition, depending on the type of marijuana. These effects can persist for many years following abstinence.
While the 7-11-Hz mu rhythm usually overlaps with the alpha range, its morphology deviates from the alpha waveform as one end is pointed. The mu rhythm can be recorded at C3 and C4 in a minority of subjects and may represent suppression of hand movement or imagining hand movement (Thompson & Thompson, 2016).
Mu rhythms appear to regulate motor cortex activities via prefrontal cortical mirror neurons. These circuits may play a critical role in imitation learning and our ability to understand the actions of others. Mu rhythms facilitate the conversion of visual and auditory input into integrated skill-building functions. Attenuation of the mu rhythm appears to be associated with the activation of this function (Pineda, n.d.). The mu rhythm is highlighted below.
This second example of the mu rhythm shows a classic 10-11 Hz and
19-20 Hz "Owl Eye" presentation.
Synchronous "Alpha"
Various sensory systems such as our auditory, somatosensory, and visual systems produce localized and semi-independent "alpha" activity. Synchronous, distributed alpha integrates perception and facilitates action. Synchronous "alpha" appears to block the localized alpha-like patterns such as mu and the posterior rhythm in favor of more broadly distributed network integration.
Sensorimotor Rhythm (13-15 Hz)
The sensorimotor rhythm (SMR) is beta 1 located on the sensorimotor strip (C3, Cz, C4). SMR amplitude increases when the motor circuitry is idle. SMR increases with stillness and decreases with movement. Deficient SMR may be observed in movement spectrum complaints like hyperactivity and tics. SMR appears as sleep spindles during stage-2 sleep. SMR is associated with neutral blood perfusion of the brain and resting levels of glucose metabolism. Clinicians typically reward increased SMR amplitude to calm hyperactivity and during theta/beta ratio training.
Beta consists of rhythmic activity between 13-38 Hz. There are four beta ranges: beta 1 (12-15 Hz), beta 2 (15-18 Hz), beta 3 (18-25 Hz), and beta 4 (25-38 Hz). Beta is located mainly in the frontal lobes. Beta is associated with focus, analysis, and relaxed thinking (Thompson & Thompson, 2015).
Excessive beta is observed in anxiety, depression (asymmetry), insomnia, OCD, and sleep disorders. Deficient beta is seen in ADHD, cognitive decline, and learning disorders.
Since beta overlaps with the EMG range, clinicians must be careful when up-training this rhythm and use an EMG inhibit. Beta is generated by the brainstem and cortex and is associated with hyper-perfusion and increased glucose metabolism.
Fast 20-35-Hz oscillations are generated by activation of the mesencephalic reticular formation. Thalamocortical, rostral thalamic intralaminar, and cortical neurons spontaneously oscillate in this range. This activity is primarily seen in the frontal lobes and is associated with hyper-perfusion and increased glucose metabolism. Persistent excessive activity can lead to metabolic exhaustion.
This activity may be associated with peak performance and cognitive processing and related to specificity and precision in information processing. Excessive high beta is associated with alcoholism, anxiety, OCD, rumination, and worry.
Clinicians often inhibit high beta activity but rarely reward it.
Amzica and Lopes da Silva (2011)
concluded that gamma oscillations might speed information distribution and processing. Gamma bursts occur during problem-solving, and the absence of gamma is associated with cognitive deficits and learning disorders. Gamma synchrony is related to cognitive processing and is essential in coding by contributing specificity and precision to information processing. Gamma is theorized to serve as a "binding rhythm" that integrates sensory inputs into perception and consciousness.
Local activity is a composite of local and network influences. Network communication systems and local cortical functions show different characteristics across the cortex and produce unique and specific EEG patterns in other regions.
With the EEG, we can follow the progression from stimulus to behavior response. This allows us to determine the correct function at each step and identify causal factors in dysfunctional outcomes or responses.
Source of the Scalp EEG
The scalp EEG results from the summation of large areas of gray matter activity. Areas are polarized synchronously due to the input of oscillatory or transient evoked activity. These areas comprise thousands of cortical columns containing large pyramidal cells aligned perpendicularly to the cortical surface.
Pyramidal neurons are found in all cortical layers, except layer 1, and represent the primary type of output neuron in the cerebral cortex.
The scalp EEG results from the summation of EPSPs and IPSPs in thousands of cortical columns containing large pyramidal cells perpendicular to the cortical surface. The columns are synchronously polarized (made more negative) and depolarized (made less negative) due to the input of oscillatory or transient evoked activity.
Local Field Potentials
The local field potential (LFP) is the aggregate effect of the firing of the interconnected pyramidal neurons within the cortical columns, plus additional mechanisms like glial cell modulation of the cortical electrical gradient.
Caption from Wikipedia's article on Neural Oscillation. Simulation of neural oscillations at 10 Hz. The upper panel shows spiking of individual neurons (with each dot representing an individual action potential within the population of neurons). On the lower panel, the local field potential reflects their summed activity. This figure illustrates how synchronized patterns of action potentials may result in macroscopic oscillations that can be measured outside the scalp.
Do not confuse the "spiking" of individual neurons with epileptogenic spikes in the scalp EEG.
Scalp Electrical Potentials
Scalp electrical potentials represent the sum of all available electrical fields. Fields of opposite polarity (+/-) cancel each other out so that scalp potentials are greater when large aggregates of neurons polarize and depolarize synchronously. The scalp EEG represents a weighted sum of all active currents with the brain that generate open fields, including non-cortical sources.
Action potentials reflect neuronal output. They are seen in extracellular recordings as fast (~300 Hz)
activity that exceeds 90 mV lasting less than 2 ms. Action potentials play a minor role in scalp surface EEG. They fall below 60 V outside of a 50-μm (0.050-mm) radius. Scalp electrodes are several centimeters from cortical neurons and are generally aligned away from the scalp. Therefore, action potentials are unlikely to contribute significant voltages to the scalp EEG.
Local Field Potentials Regulate Neuron Excitability and Firing
Neurons are most likely to fire during the depolarizing phase of the local field potential. Neurons are more excitable when they are "in phase" with respect to the local field potential (LFP) and are inhibited when they are out of phase with the LFP. Thus, at any instant of time, the amplitude and frequency of the EEG are regulated by the LFP, which in turn, is influenced by oscillatory mechanisms such as slow cortical potentials.
The EEG is a moment-to-moment measure of the excitability of action potential firing, like gates opening and closing on the half cycle.
The synchronous activity of large pyramidal neurons networked in cortical columns creates the EEG.
The Composition of the EEG
The EEG is composed of electrical potentials, varying in two dimensions, frequency and amplitude.
Sources of IPSP and EPSP Inputs
Many sources contribute input that results in IPSP and EPSP activity within cortical neurons. These sources primarily contribute influences such as oscillatory generator input or ascending event-related evoked input.
The
eyes open again at 14’31”, and alpha attenuates (alpha blocking). This shows the posterior dominant rhythm (generally known as "alpha") appearing in the eyes-closed condition when visual sensory input is stopped. The attenuation or blocking of this rhythm as sensory input returns in the eyes-open condition.
The diagram below, which shows bidirectional connections between the thalamus and cortex, was modified from the original on www.lib.mcg.edu.
Caption by W. D. Jackson, PhD, and S. D. Stoney, PhD (2006): Thalamocortical cells are subject to excitatory drive from their system afferents, from monosynaptic corticothalamic fibers, and from the brainstem reticular formation (ascending reticular activating system, ARAS). They receive inhibitory drive from local interneurons and neurons in the reticular nucleus of the thalamus (RNT). Note that the RNT neurons are excited by activity in thalamocortical cells and corticothalamic cells. The connections are precisely organized. For example, each column in a primary cortical area sends corticothalamic fibers back to the same part of its specific thalamic nucleus that sends its thalamocortical fibers to that cortical column. The corticothalamic fibers also synapse on the RNT cells receiving input from that part of the thalamic nucleus. Each cortical receiving area is said to be "reciprocally connected" with its specific thalamic nucleus. Like the thalamocortical cells, RNT cells and cortical neurons also receive excitatory drive from the ARAS.
The EEG is generated by thalamocortical (alpha) and cortical-cortical
(beta) sources.
Neurons in the ascending reticular activating system produce event-related potentials in response to diverse stimuli like a flashing light or sound. Event-related potentials (ERPs) are the brain's response to externally applied stimuli, events, or cognitive/motor tasks. They are time-locked measures of brain electrical activity.
Dipole Generators
Large cortical pyramidal neurons organized in macrocolumns are oriented with an apical dendrite projecting toward the scalp and an axon descending in the opposite direction. An "Equivalent Dipole Generator" usually represents the sum of all multipolar current sources. Summed generators are modeled as dipoles to aid the conceptual understanding of the electrical fields involved.
EEG Signals (Brainwaves)
The EEG represents changes in a brain area's electrical activity (potential) compared to a "neutral" site or another brain area. The EEG is displayed as oscillations or voltage fluctuations, which show a "wave" pattern when plotted on a graph.
"These oscillations are generated spontaneously in several areas of the cerebral cortex as neuronal networks transiently form assemblies of synchronously firing cells." Klaus Linkenkaer-Hansen.
Sink, Source, and Dipole
We can describe pyramidal cells in terms of their sink, source, and dipole. A sink (-ve), which may be located at the bottom, middle, or top of the apical dendrite, is where positive ions enter the dendrite. Cation (positive ion) entry gives the extracellular space a negative charge. The source (+ve) is where the current exits the cell. Finally, the dipole is the field created between the sink and source (Thompson & Thompson, 2016).
The graphic below from Euroform Healthcare: Conduction Studies depicts current entering the apical dendrite (sink) of a pyramidal neuron where an afferent neuron has generated an EPSP. The current leaves the neuron (source) from the dendrite or cell body.
The postsynaptic potentials (EPSPs and IPSPs) propagated by the apical dendrites in layers 2 and 3 create an extracellular dipole layer parallel to the cortical surface. The dipole layer's electrical polarity is the opposite of the deeper cortical layers 4 and 5 (Fisch, 1999).
A cortical dipole is created when pyramidal neurons depolarize simultaneously. This phenomenon is called local synchrony. Fewer than 5% of pyramidal neurons can generate more than 90% of the power in the EEG signal because most pyramidal neurons usually fire asynchronously so that their potentials counteract each other. A small fraction of these neurons firing in step can produce visible changes in EEG feedback. This creates the potential for operant conditioning to help clients learn to modify EEG activity through neurofeedback.
Cortical dipoles have three properties: site (depends on source), size (oscillation frequency and voltage), and relative position with respect to sulci and gyri (Collura, 2014).
The EEG is Mainly Sensitive to Radially Oriented Dipoles
Evolution has convoluted the human brain to increase its computing power without enlarging the skull. This enfolding has created two easily visible anatomical features: gyri and sulci.
Recall that a gyrus is a ridge of the convoluted cerebral cortex, while a sulcus is a valley. The graphic below is courtesy of Wikipedia.com from the article Sulcus (neuroanatomy).
The EEG is composed of electrical potentials that vary along the dimensions of amplitude and frequency.
EEG Amplitude
The "amount" or amplitude and the "pattern" or morphology of any EEG frequency band reflect the number of neurons discharging simultaneously at that frequency. Lower neuron firing rates correspond to lower signal amplitude.
Amplitude measures the amount of energy in the signal and is usually expressed in microvolts.
Greater synchrony in firing among neurons results in higher amplitude, as shown with alpha in the graphic below.
Greater firing synchrony produces larger EEG potentials that can be measured from the scalp surface.
The EEG plots voltage changes over time, which can be displayed on a graph. The sampling rate is the number of measurements per second (Hz). Precision is the number of voltage gradations or steps.
The analog-to-digital (A/D) converters that transform voltages into numerical values vary in precision: more bits correspond to greater accuracy. The graphic below shows precision differences using 12-14-bit (grey) and 20-24-bit A/D converters.
The generation of oscillatory activity, sometimes called spindle behavior, is likely due to the interaction between thalamocortical relay neurons (TCR), reticular nucleus neurons (RE), and interneurons. These interactions are mediated by diverse neurotransmitters, including acetylcholine and GABA.
The various spindle frequencies, which have often been interpreted as reflecting different types of oscillations, merely depend on various durations of the hyperpolarizations (negative shifts) in thalamic-cortical relay neurons. Long duration hyperpolarizations, as during ... deeply EEG-synchronized states, are associated with 7 Hz or even lower-frequency spindles, while relatively short hyperpolarizations result in ... higher frequencies (14 Hz) (Steriade, 2005).
The Purpose of Oscillatory Activity
A single neuron can influence multiple postsynaptic targets located between 0.5 and 5 mm away with conduction periods of between 1 and 10 ms. This time difference becomes progressively more pronounced when more complex events involve progressively larger assemblies of neurons. It may take hundreds of thousands of neurons, stimulating multiple postsynaptic neurons, for the desired outcome to occur. When these many neurons are involved, it becomes increasingly clear that there is a need for organization and structure to manage this diverse activity.
Timing is everything since action potentials arrive from a large number of sources. The nervous system must correctly register arrival times to recognize a face, recall a name, or remember personal history and context.
"Oscillatory classes in the cerebral cortex show a linear progression of the frequency classes on the log scale. In each class, the frequency ranges ('bandwidth') overlap with those of the neighboring classes, so that frequency coverage is more than four orders of magnitude" (Buzaki, 2006).
Frequency Determines Complexity
The wavelength or frequency of the EEG band determines how long the processing window will remain open and, therefore, the size of the neuronal pool involved. Because of the distances involved, longer wavelengths (slower frequencies) allow larger groups of more distant neurons to be assembled and coordinated. Different frequencies organize different types of connections and different levels of computational complexity.
Short time windows of fast oscillators facilitate local integration, primarily because of the limitations of axon conduction delays. Fast oscillations favor local decisions. Slow oscillators can involve many neurons in large and/or distant brain areas. Slow oscillations favor complex, global decisions.
Complexity Versus Frequency
Complex tasks involving sensory integration and decision-making were associated with 4-7 Hz synchronization. Intermediate tasks such as identifying spoken and written words and pictures increased 13-18 Hz beta activity. Simpler, more localized tasks, such as the visual processing of grid displays, were associated with faster-frequency activity (24-32 Hz) (Sarnthein et al., 1998; Von Stein et al., 1999).
Traveling Waves Help Coordinate Widespread Brain Networks
Zhang et al. (2018) proposed that traveling waves between 2 to 15 Hz, moving at 0.25-0.75 meters per second across the cortex, mediate large-scale coordination of brain networks and support connectivity.
Summary of EEG Oscillations
When the CNS processes incoming content, separate areas detect features of salient content, including visual, auditory, tactile, kinesthetic, and olfactory information. The CNS shares, integrates, compares current with previous content, analyzes, and makes decisions regarding memory and responses. Interacting networks linked by electrical and chemical signals perform this work. We record the electrical potentials generated by this complex and dynamic network activity as the EEG.
Sensory evoked potentials are a subset of event-related potentials (ERPs)
Event-related potentials (ERPs) represent the brain's responses to external stimuli, events, or cognitive/motor tasks. ERPs can be detected throughout the cortex.
Investigators monitor ERPs by placing electrodes at areas like the midline (Fz, Cz, and Pz). A computer analyzes a subject's EEG responses to the same stimulus or task over many trials to subtract random EEG activity. ERPs always have the same waveform morphology. Their negative and positive peaks occur at regular intervals following the stimulus.
Sensory evoked potentials are a subset of ERPs
elicited by external
sensory stimuli (auditory, olfactory, somatosensory, and visual). They have a negative peak at
80-90 ms and a positive peak at about 170 ms following stimulus onset. The orienting
response ("What is it?") is
a sensory ERP. The N1-P2 complex in
the auditory cortex of the temporal cortex reveals whether an
uncommunicative person can hear a stimulus.
Motor ERPs are detected over the
primary motor cortex (precentral gyrus) during movement, and their
amplitude is proportional to the force and rate of skeletal muscle
contraction (Thompson & Thompson, 2016).
Slow cortical potentials modulate the excitability of associated neurons
Slow cortical potentials (SCPs) are
gradual changes in the membrane potentials of cortical dendrites that
last from 300 ms to several seconds. These potentials include the
contingent negative variation (CNV), readiness potential,
movement-related potentials (MRPs), and P300 and N400 potentials, and exclude event-related potentials (ERPS)
(Andreassi, 2007).
SCPs modulate the firing rate of cortical pyramidal neurons by exciting
or inhibiting their apical dendrites. They group the classical EEG rhythms using these synchronizing mechanisms
(Steriade, 2005).
The contingent negative variation (CNV) is a steady, negative shift in
potential (15 µV in young adults) detected at the vertex. This
slow cortical potential may reflect expectancy, motivation, intention to
act, or attention. The CNV appears 200-400 ms after a warning signal
(S1), peaks within 400-900 ms, and sharply declines after a second
stimulus that requires the performance of a response (S2). John Balven adapted the graphic below from Stern, Ray,
and Quigley (2001).
The readiness potential is a slow-rising, negative potential (10-15
µV) detected at the vertex before voluntary and spontaneous
movement. This slow cortical potential precedes voluntary movement by 0.5
to 1 second and peaks when the subject responds. This potential is
separate from the CNV. John Balven adapted the graphic below from Stern, Ray, and Quigley (2001).
Movement-related potentials (MRPs) occur at 1 second as subjects prepare for
unilateral voluntary movements.
MRPs are distributed bilaterally with maximum amplitude at Cz. The
supplementary motor area and primary motor and somatosensory cortices
generate these potentials (Babiloni et al., 2002).
P300 and N400 ERPs are classified as long-latency potentials due to their
extended latencies
following stimulus onset.
The P300 potential is an event-related potential (ERP) with a 300-900-ms
latency.
The largest amplitude positive peaks are located over the parietal lobe. Researchers
elicit the P300 potential by exposing subjects to an odd-ball stimulus, a
meaningful
stimulus that is different from others in a series (a colored playing card
presented in a series of monochrome cards). The P300
potential may reflect an event’s subjective probability, meaning, and
transmission of information. Research shows this is separate from
the contingent negative variation (CNV) (Stern, Ray, & Quigley, 2001).
Shorter P300 latencies may reflect better allocation of attention, and
researchers have measured longer P300 latencies in ADD than non-ADD
samples. Experimental subjects show longer latencies when lying than when
telling the truth (Farwell & Donchin, 1991; Thompson & Thompson, 2016).
The N400 potential is an
event-related potential (ERP) elicited when we encounter semantic
violations like ending a sentence with a semantically incongruent word
("The handsome prince married the beautiful fish"),
or when the second word of a pair is unrelated to the first (BATTLE/GIRL). Warren and
McIlvane (1998) speculate that the N400 potential is evoked
whenever a general conceptual system that produces category judgments
encounters a mismatch that violates equivalence relations. Halgren and
colleagues (2002) consider it an index of the difficulty of semantic
processing.
A Deep Dive Into SCPs
In 1875, Richard Caton identified what may have been the first evidence of SCPs in an article in the British Medical Journal titled "The Electric Currents of the Brain."
He stated, "The cortex's Direct Current baseline waxes negative whenever it is more active. Gradients of 150-200 μV/mm are noted." He later noted, "when any part of the gray matter is in a state of functional activity, its electric current usually exhibits negative variation." Some later researchers suggested that this signaled the discovery of the "steady potential" or the DC potential of the brain. However, others have noted the possibility of equipment-based artifacts in his recordings (Niedermeyer, 1999).
From the late 1800s through the early 1900s, research into brain electrical activity turned toward observations of electrical stimulation and spontaneous electrical activity in animal studies. As technology improved, the ability of researchers to identify EEG rhythms also improved. Hans Berger is famous for his description of alpha-blocking with cognitive activity, made possible partly because of his use of more sensitive equipment (Niedermeyer, 1999).
Subsequent research into the electrical characteristics of the human brain became primarily focused on phasic phenomena from AC-coupled recordings. This trend continues today with the current practice of EEG biofeedback or neurofeedback, focusing primarily on training AC frequencies, generally in the range of 1 to 60 Hz.
The study of SCPs continued in physiology and animal research. Only recently has there been increased interest in observing SCPl values in the human EEG and correlating them with cognitive activity, sensory processing, and motor activity. SCPs are distinguished from short-latency, event-related potentials (ERP) up to 500 ms. SCPs reflect cortical processes that require more than one second to complete and are associated with more global, task-related activities. Such changes occur in task-specific areas of the cortex and can be displayed using topographic maps. Areas of activation show surface negative potential changes (Altenmuller & Gerloff, 1999).
Operant conditioning of SCP changes is an even more recent study area. One reason for increased interest in SCP training is the excellent work done by Birbaumer and colleagues (1999) at the University of Tubingen in Germany, demonstrating that SCPs can be operantly conditioned with positive outcomes for a variety of disorders. The recent availability of DC-coupled amplifiers for EEG recording has also contributed to this interest (Altenmuller & Gerloff, 1999).
According to Niedermeyer (1999), "DC" can mean several things. DC means direct current, which is a current without oscillations. From an electrophysiological perspective, "DC shifts" are ultra-slow potentials below the typical EEG in the oscillation frequency and are generally around 0.1-0.2 cycles per second. However, they may extend up to 1 cycle per second. So SCPs are not true direct current, though their oscillations are so slow that they are "DC-like" phenomena.
DC also refers to "direct coupling" (Niedermeyer, 1999) and describes a type of amplifier that does not use capacitors between the amplification stages and uses an infinite time constant to provide for optimal DC recording. Until recently, this has been quite difficult to achieve for EEG recording. Most conventional EEG amplifiers use capacitors in the input stage, which reject DC voltages and create a finite time constant that interferes with access to DC phenomena.
An approximation of DC information can be obtained from an alternating current amplifier by using a rectifier or extending the time constant to approximately 10 seconds (Kotchoubey et al., 1999). A thorough discussion of amplifier characteristics is beyond the scope of this article. Several excellent chapters relating to this subject can be found in Niedermeyer and Lopes da Silva (1999).
The source and nature of slow cortical potentials are in dispute. The prevailing theory holds that negative SCPs result from synchronous postsynaptic potentials in the apical dendrites of cortical pyramidal cells. Others hold that SCPs are supported and produced by glial cells within the cortex. It appears that pyramidal neurons may be the source of these potentials and that the glial system is the "sink" in electrical terms (Strehl, 2005, personal communication).
Increased neuronal activity is associated with an increased outflow of potassium ions leading to increased extracellular potassium concentrations. Glial cells depolarize when extracellular potassium concentrations increase, resulting in intracellular and extracellular current flows similar to typical neuronal synaptic transmissions (Speckmann & Elger, 1999). Since glial cells are widely interconnected and have extensive processes, it appears likely that the glial system is responsible for the potential changes that produce SCP values recorded from the scalp in response to neuronal activity.
Despite some discussion regarding the source of SCP activity, it is clear that scalp SCPs represent the cortex's excitability potential. SCP negativity is associated with increased cortical excitability. High cortical negativity has been correlated with a greater likelihood of seizures (Speckmann et al., 1984) and migraines (Siniatchkin et al., 2000) in susceptible individuals.
SCP positivity is associated with increased cortical inhibition. Higher-than-expected positive SCPs have been noted in children with elevated blood lead levels (PbB; Otto & Reiter, 1984). Children diagnosed with ADHD show deficient SCP self-regulation skills compared with controls (Heinrich et al., 2004). SCPs have been used to monitor the depth of anesthesia during surgical procedures (Sebel et al., 1997) because they appear to be excellent indicators of the arousal level.
Recent studies have used SCPs to evaluate various task-oriented responses. Birbaumer and colleagues have trained SCPs to reduce seizures (Daum et al., 1993; Kotchoubey et al., 1997, 1999, 2001, 2002), and other groups have applied SCP feedback training to improve ADHD (Heinrich et al., 2004; Strehl, 2004, personal communication) and schizophrenia (Schneider et al., 1992).
SCP feedback training appears to be an approach that targets general characteristics of arousal using a single measure, compared to other types of EEG training that often reward increases and/or decreases in certain combinations of frequencies to accomplish changes in arousal. SCP feedback may provide a less complex approach to training neuronal activity in the clinical setting, providing greater accessibility via clinician-supervised home training devices.
Most research to date has been conducted using the Cz electrode site. However, at least one investigation involved training left hemisphere language sites. This approach demonstrated improved word processing results following the negativity training condition and diminished performance following the positivity condition (Pulvermuller, 2000). Studying the effects of SCP training at other electrode sites would be interesting.
Some efforts have been to identify SCP values using multiple electrodes in a quantitative EEG assessment paradigm. Basile and colleagues (2004) used four 32-channel DC-coupled amplifiers to identify differences in SCP responses in schizophrenic patients compared with normal controls. They found significant variations in response patterns, with normal controls showing simply-organized positivity and negativity patterns, while schizophrenic patients showed much more complex, fragmented patterns of activation and inhibition.
There are only a few clinically available DC-coupled amplifiers capable of accurately monitoring SCP activity. An Internet search yielded several devices aimed at the research institution market with correspondingly high prices and a couple of other devices with prices within a clinical practice’s reach. A new 32-channel DC-coupled data acquisition device for quantitative EEG assessments has also recently been released.
One potential attraction of using a DC amplifier is the capability of monitoring and/or training both SCPs and typical EEG frequencies. This is because DC amplifiers are optimized for SCP and have the capacity to record faster frequencies. This is particularly true for amplifiers with better analog-to-digital (AD) conversion characteristics (bit size, not sampling rate) because this allows them to record AC potentials without exceeding amplifier capabilities, which can be a problem in an amplifier without capacitors at the input stages.
Higher analog-to-digital (A/D) conversion values (more bits of data per sample) allow newer DC amplifiers to process EEG at a much lower voltage while retaining a high degree of resolution for signals that are often in the millivolt range (compared to microvolt values for most EEG signals).
The training of SCP shifts is a fairly new endeavor. Much remains to be learned about the effects of training both the positivity and negativity conditions at various electrode sites for individuals with various presenting concerns and specific neurophysiological characteristics.
This author's recent, brief clinical experiences suggest that training SCP using new, more accurate amplifiers may result in more pronounced changes occurring more quickly. This occurred on several occasions, even when using previously well-tested protocols alternating 8- to 10-second trials of both the positivity and negativity conditions. Thus, it will be important to develop protocols with more specificity and flexibility to meet the needs of non-homogeneous client populations that also consider changes in equipment and software characteristics that may affect the rate of skill acquisition and subsequent outcomes.
The author would like to thank Ute Strehl of the University of Tubingen in Germany, David Sever of Mind Alive, LTD in Canada, and Erwin Hartsuiker of Mind Media BV in the Netherlands for technical assistance in preparing this article.
EEG SIGNATURES REQUIRING REFERRAL
Abnormal EEG patterns include abnormal slow activity, paroxysmal epileptogenic abnormalities, and abnormal periodic paroxysmal patterns.
At the end of this section, we examine generally benign EEG activity, including BETS, POSTS, RMTD, SREDA, and wicket waves, that do not require referral.
Abnormal Slow Activity
Abnormal slow activity includes generalized intermittent slow activity, focal and lateralized intermittent slow activity, and persistent slow activity.
Paroxysmal epileptogenic abnormalities include
interictal epileptiform discharges (focal, generalized), ictal, secondary bilateral synchrony, and epileptiform patterns of doubtful significance.
Interictal epileptiform discharges
typically consist of individual spikes and sharp waves and complexes that contain both waveforms that last less than 2 seconds (Fisch, 1999). Graphic courtesy of Teppei Matsubara.
Amplitude is classified as low (less than 20 µV), typical (20-50 µV, depending on age), and high (60-200+ µV). Duration is described as very brief (less than 10 s), brief (10-60 s), intermediate duration (1-1.5 min), prolonged (5-60 min), and protracted (greater than 60 min).
Common EEG Acronyms for Rhythmic and Periodic Patterns
The common EEG acronyms reviewed in this section include LPDs, BIPDs, GPDs, GRDA, IRDA, LRDA, PLEDs, BIPLEDs, FIRDA, GPEDs, Mf, SIRPIDs, and SW.
PLEDS are periodic lateralized epileptiform discharges. They are lateralized or focal and exhibit regular periodic, negative spike-and-sharp wave patterns with a 20-1000 ms duration and 50-300 µV amplitude.
BIPLEDS are bilateral independent periodic lateralized epileptiform discharges. They are asynchronous discharges that occur independently in both hemispheres, appear as sharp waves or spikes, 40-100 µV in bipolar montages, and recur at rates from 0.5-1.5 Hz.
FIRDA is frontal intermittent rhythmic delta activity. Structural brain lesions and encephalopathy are independently associated with the occurrence of FIRDA. Asymmetric FIRDA may be associated with an underlying brain lesion.
Generally benign EEG
activity includes BETS, POSTS, RMTD, SREDA, and wicket waves.
BETS are benign epileptiform transients of sleep. This activity is also called BSSS for benign small sharp spikes or benign sporadic sleep spikes. Sharp waves are seen alone or as a low-amplitude spike and a smaller after-going slow wave. BETS can be monophasic or diphasic and occur during light sleep. There is no disturbance of background activity, and it does not progress. BETS often appears in an ear reference, and when seen elsewhere, it is due to reference contamination. BETS are seen in adults during drowsiness, but it disappears in deeper sleep.
SREDA (or SCREDA) is sub-clinical rhythmic electrographic discharges in adults. In the bilateral synchronous parieto-temporal sharp theta rhythm graphic below, black arrows show the onset of periodic posterior-predominant sharply contoured waveforms. The waveforms become rhythmic and then resolve at the latter portion of the figure.
Throughout the cortex, there are variations in the organization of cells and their axons and differences in cell anatomy, which can be used to define and differentiate areas of the cerebral cortex.
The German anatomist Korbinian Brodmann produced cytoarchitectural maps of the cerebral cortex using Nissl staining, which outlines cell bodies. Brodmann divided the neocortex into 47 different numbered zones, each with its distinctive anatomy.
Researchers have revised the Brodmann maps and correlated areas with their functions. The Brodmann maps below were contributed by Mark Dow, Research Assistant at the Brain Development Lab, the University of Oregon to Wikimedia Commons.
Network Connections
Neural networks are systems of interconnected ensembles of neurons that collaborate to achieve a goal (Thompson & Thompson, 2016).
Networks communicate and perform functions via hub- or node-based communication systems. Connectome graphic from van den Heuvel and Sporns (2011).
Connectivity
Networks like the Affect, Attention, Default, Executive, and Salience systems synchronize the activity of cortical and subcortical regions to perform functions. Connectivity is the degree of synchrony between the oscillations of specialized brain regions (nodes) within a network (Bastos & Schoffelen, 2016). Strongly connected brain regions are called hubs. Hubs can be
primarily connected to nodes (vertices) within their local modules (sets of interconnected nodes) or nodes in more distant modules
(Bullmore & Sporns, 2009).
Neurofeedback training can increase or decrease connectivity using a normative database. For example, BrainMaster's BrainAvatar software allows clinicians to train specific networks, like the Default Mode Network (DMN).
See the Assumptions unit for an in-depth discussion of the Affective, Default Mode, Executive, Motor, Network, Oculomotor, Salience, and Social Networks.
Phase Reset Coordination of Neural Networks
Phase refers to the degree to which the peaks and valleys of EEG
waveforms coincide. Phase measures the time shift between EEG activity in two brain regions. Phase represents the number of elements in a network times the delay in that network. The graphic below shows in-phase and out-of-phase waveforms.
Phase reset (PR) is defined by a sudden change in phase difference (phase shift duration or SD) followed by a period of phase locking (lock duration or LD). PR = SD + LD (Thatcher et al., 2009). The graphic below shows multiple signals phase locking.
Gap junction coupling explains phase locking and phase shifting (Hughes & Crunelli, 2007).
Resetting the phase of ongoing oscillatory activity to endogenous (internal) or exogenous (environmental) cues facilitates coordinated information transfer within circuits and between distributed brain areas. Phase resetting is a critical marker of dynamic state changes within functional networks (Voloh & Womelsdorf, 2016).
Phase rests create a neural context, a narrow band of frequencies that uniquely characterize the activated circuits. They impose coherent low-frequency phases to which high-frequency activations can synchronize. These are identifiable as cross-frequency correlations that span large distances. Phase rests are critical for neural coding models that depend on phase, increasing the informational content of neural representations. They likely originate from the dynamics of canonical E-I circuits that are anatomically ubiquitous.
Phase resets reorganize oscillations in diverse task contexts: attentional stimulus selection, classical conditioning, cross-modal integration, sensory perception, and spatial navigation. Phase resets can drive changes in ensemble organization, functional networks, neural excitability, and overt behavior.
The graphic below shows low- and high-frequency oscillations resulting from phase reset decreases and increases in neural activity, respectively.
The brain is organized into interactive functional distributed networks with spatial, temporal, and content-based relationships.
These networks interact through feedback loops and transiently organized aggregates of neurons, all mediated by rhythmic, oscillatory electrical discharges that ultimately produce the EEG.
This process is further controlled/informed by selective attention to specific categories of interest.
Each type of local cognitive, sensory processing, or emotional network produces oscillatory activity and contains internal stabilizing characteristics. These local networks exist within a global dynamic network
system that links and provides an interactive capacity to the smaller networks, also operating within an oscillatory framework.
The central nervous system processes incoming content. Separate regions process specialized content (e.g., auditory, kinesthetic, tactile, visual). Content is shared, integrated, compared to previous content, and analyzed. Decisions are made regarding memory and responses. All of this central nervous system activity occurs within interacting networks linked by electrical/chemical signals. Electrical discharges from network activity are recorded from the scalp surface as the EEG.
Network Overview
The networks most relevant to attention include the executive, affective, motor, oculomotor, and social circuits.
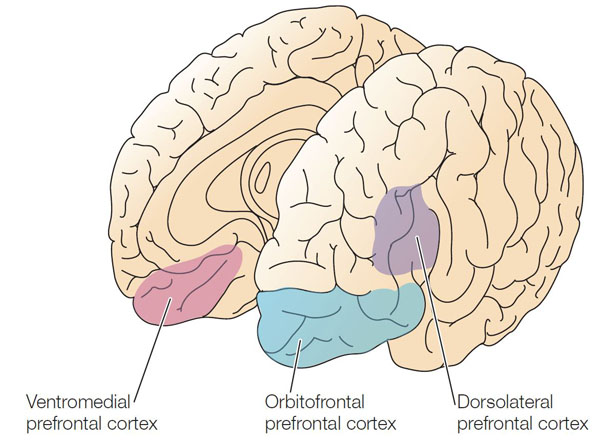
Executive Network
The dorsolateral prefrontal cortex plays a critical role in executive functions, which Kropotov (2009) described as "the coordination and control of motor and cognitive actions to attain specific goals." Executive functions include allocation of attention, cognitive inhibition, behavioral inhibition, working memory, and cognitive flexibility. The executive network focuses and maintains continuous attention. The diagrams below were adapted from Alexander et al. (1986) and Thompson and Thompson (2016).
DLPC = dorsolateral prefrontal cortex, PPC = posterior parietal cortex, APA = arcuate premotor area, GPi = globus pallidus internal segment, SNr = substantia nigra, pars reticulata, VA = ventral anterior nucleus of the thalamus, MD = medial dorsal nucleus of the thalamus.
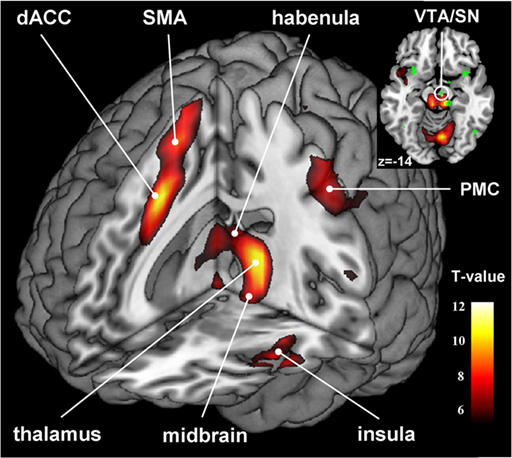
Affective Network
The pre- and subgenual areas of the anterior cingulate cortex (ACC) participate in affective circuits triggered when we make mistakes. The dorsal rostral cingulate zone monitors cognitive activity to predict when errors are likely, and greater executive control may be needed (Thompson & Thompson, 2016).
HC = hippocampal cortex, EC = entorhinal cortex, STG = superior temporal gyrus, ITG = inferior temporal gyrus, posterior parietal cortex, GPi = globus pallidus internal segment, SNr = substantia nigra, pars reticulata, MD = medial dorsal nucleus of the thalamus.
Motor Network
The supplementary motor area (SMA), in concert with the premotor cortex, primary motor cortex, sensorimotor cortex, and cerebellum, plans, initiates, and inhibits voluntary movements and muscle contractions (Breedlove & Watson, 2020; Thompson & Thompson, 2016).
SMA = supplementary motor area, APA = arcuate premotor area, PMC = primary motor cortex, PSC = primary somatosensory cortex, GPi = globus pallidus internal segment, SNr = substantia nigra, pars reticulata, VL = ventral lateral nucleus of the thalamus.
Oculomotor Network
The frontal eye field (FEF), in concert with the dorsolateral prefrontal cortex, posterior parietal cortex, basal ganglia, and thalamus, programs and initiates voluntary eye movements, inhibits eye movements toward distracting stimuli, and allows us to return our focus to locations we've experienced in the past (Thompson & Thompson, 2016).
FEF = frontal eye field, DLPFC = dorsolateral prefrontal cortex, PPC = posterior parietal cortex, GPi = globus pallidus internal segment, SNr = substantia nigra, pars reticulata, VA = ventral anterior nucleus of the thalamus, MD = medial dorsal nucleus of the thalamus.
Social Network
The orbitofrontal cortex (OFC), along with the basal ganglia and thalamus, orchestrates the highest level of emotional processing in the nervous system. The social network is responsible for socially responsible behavior, empathy, behavioral inhibition, emotional regulation, and sound judgment (Thompson & Thompson, 2016).
OFC = orbitofrontal cortex, STG = superior temporal gyrus, ITG = inferior temporal gyrus, ACC = anterior cingulate cortex, GPi = globus pallidus internal segment, SNr = substantia nigra, pars reticulata, VA = ventral anterior nucleus of the thalamus, MD = medial dorsal nucleus of the thalamus.
Attentional Processes
Attention is the selection of sensory information or cognition for enhanced processing. We can overtly or covertly attend to stimuli. In overt attention, our attentional focus and sensory orientation coincide. For example, you parse this sentence as you focus your gaze on it. In covert attention, we shift our attentional focus from our sensory orientation. For example, you attend to a reminder on the corner of your screen while you gaze at this sentence. While the midbrain superior colliculus is mainly implicated in overt attention, it may also regulate covert attention (Breedlove & Watson, 2020).
Attention is more selective than arousal, which is our overall level of alertness (Breedlove & Watson, 2020).
Research using divided attention tasks, where subjects simultaneously process multiple stimuli, shows that attentional resources are finite. The challenge of attending to more than one target at a time increases when they occupy different spatial locations. When we attend to a stimulus, we shift our attentional spotlight (focus) to select a stimulus for enhanced analysis (Bee & Micheyl, 2008).
Perceptual load (stimulus processing demands) determines the level at which an attentional bottleneck (stimulus selection) occurs. Complex stimuli, which involve a high perceptual load and monopolize processing resources, result in early selection where we filter out lower priority competing stimuli before preliminary perceptual and semantic analysis. Conversely, simple stimuli, which involve a low perceptual load and leave free processing resources, result in late selection where we filter out competing stimuli after performing extensive analysis (Lavie et al., 2004).
The Pulvinar Mediates Attentional Shifts
The pulvinar nucleus, which comprises the posterior quarter of the human thalamus, processes visual information and directs attention. The pulvinar plays a pivotal role in processing visual information and shares widespread connections with the cingulate, parietal cortex, and superior colliculus. The pulvinar is crucial for orienting, shifting attention, and filtering out irrelevant stimuli. Tasks that present subjects with more distracting stimuli increase pulvinar activation, as shown by functional MRI (fMRI) (Buchsbaum et al., 2006).
Overall, the pulvinar guides the processing of relevant information in wide-ranging cortical networks based on dynamically changing attentional priorities (Breedlove & Watson, 2020; Saalmann et al., 2012).
Cortical Regions That Guide Attention
The dorsal frontoparietal system, which is comprised of the intraparietal sulcus and frontal eye field, is responsible for top-down direction of attention (Breedlove & Watson, 2020). The intraparietal sulcus (IPS), located in the parietal lobe, provides voluntary top-down steering of attention (Corbetta & Shulman, 1998).
The frontal eye field (FEF), found in the premotor region of the frontal lobes, directs gaze towards targets selected by the IPS (Paus et al., 1991). Target selection is guided by cognitive goals (top-down processing) rather than stimulus characteristics (bottom-up processing). The dorsal frontoparietal system is shown below in gold.
In contrast, the temporoparietal junction (TPJ), where the superior temporal gyrus and inferior parietal lobe intersect, mediates bottom-up shifts in attention
in response to stimulus attributes (Corbetta & Shulman, 2002). The TPJ functions like a circuit breaker by overruling immediate attentional priorities and reallocating attentional resources to a new target (Breedlove & Watson, 2020). The bottom-up system is shown above in blue. IPL stands for inferior parietal lobe, STG for superior temporal gyrus, IFG for inferior frontal gyrus, and MFG for middle frontal gyrus.
Two Cortical Networks Regulate Attention
Two
cortical networks cooperatively regulate subcortical and cortical systems to produce a coherent perceptual experience (Breedlove & Watson, 2020). A dorsal frontoparietal system provides top-down control of endogenous attention (voluntary attention), directing the attentional spotlight to support cognitive system priorities. A right temporoparietal system provides bottom-up control of exogenous attention (involuntary reflexive attention), which redirects attention based on the novelty or importance of incoming stimuli.
Extensive interconnections between the two networks allow us to fluidly redirect attention from stimuli that are forebrain priorities (IPS) to those that are unexpected.
The insula, which is a cortical region located within the lateral sulcus, functions as an integrative and organization hub for the salience network. The insula integrates interoceptive awareness, emotional experience, and external perception to facilitate an individual's global perception of the world and its relationship. The insula directs specific networks in processing salient stimuli and the generation of appropriate responses to stimuli (Wiebking & Northoff, 2014).
The insula appears to provide an interface between the human brain's cognitive, homeostatic, and affective systems. It, therefore, provides a link between the areas of the brain involved in monitoring internal signals and those engaged in watching incoming external sensory streams. The insula detects salient events via afferent pathways and switches between other large-scale networks when these events are recognized to guide attention and working memory.
The anterior and posterior insula interact to regulate
autonomic responses to salient stimuli. Interactive communication between the insula and anterior cingulate cortex facilitates access to the motor system (Menon & Uddin, 2010).
This network appears to help us switch between task-oriented (executive) and default mode (attention) networks (Seeley et al., 2007; Shirer et al., 2012).
The graphic below from Menon and Uddin (2010) shows the salience network (right anterior insula and anterior cingulate cortex), central executive network (right dorsolateral prefrontal cortex and right posterior parietal cortex), and default mode network (ventromedial prefrontal cortex and posterior cingulate cortex).
Default Mode Network (DMN)
Brain regions are selectively active when we are conscious (Breedlove & Watson, 2020). The default mode network (DMN) consists of frontal, temporal, and parietal lobe circuits active during spontaneous cognition like introspection, daydreaming, and streams of consciousness. The DMN appears to contribute flexible memory retrieval and idea generation, which are critical elements of creativity. The DMN is relatively inactive when pursuing external goals (Andrews-Hanna et al., 2010).
The DMN may contribute to creative fluency, generating innovative ideas like alternative uses for everyday objects. A study of neurosurgical patients showed that left DMN stimulation reduced the number of uses but not their originality (Shofty et al., 2022).
Understanding Ourselves
The posterior cingulate cortex (PCC) and precuneus combine bottom-up attention with information from memory and perception. The ventral (lower) part of the PCC activates in all tasks which involve the DMN, including those related to the self or others, remembering the past, thinking about the future, processing concepts, and spatial navigation. The dorsal (upper) part of PCC mediates involuntary awareness and arousal. The precuneus is concerned with visual, sensorimotor, and attentional information.
The medial prefrontal cortex (mPFC) participates in decisions about the self, such as personal information, autobiographical memories, future goals and events, and decision-making regarding those close to us like family members. The ventral (lower) part is involved in positive emotional information and reward.
The angular gyrus connects perception, attention, spatial cognition, and action and helps us recall episodic memories.
Understanding Others
The major functional hubs include the PCC, mPFC, and angular gyrus. The dorsal medial prefrontal cortex (dmPFC) analyzes others' objectives. The temporoparietal junction (TPJ) constructs theories of mind, which are models of others' cognitive processes, emotions, knowledge, and motivation. The lateral temporal cortex is concerned with short-term verbal memory, naming, and reading.
Finally, the anterior temporal pole is part of a bilateral semantic system representing object concepts and a left hemisphere-dominant network concerned with naming and understanding object names.
Autobiography and Future Simulations
The major functional hubs include the PCC, mPFC, and angular gyrus. The hippocampus forms new declarative memories. The parahippocampal cortex (PHC) mediates spatial memory, navigation, and high-level visual processing like facial recognition. The retrosplenial cortex (RSC) is involved in episodic memory, navigation, predicting future events, and analyzing visual scenes. Finally, the posterior inferior parietal lobe (pIPL) integrates sensory information and participates in top-down attentional orienting.
LORETA INTERPRETATION AND TRAINING
LORETA, sLORETA, and eLORETA
Low resolution electromagnetic tomography (LORETA) is Pascual-Marqui, Michel, and Lehman's (1994) mathematical inverse solution to identify the cortical sources of 19-electrode quantitative data acquired from the scalp. In this context, tomography refers to two-dimensional coronal, horizontal, and sagittal brain slices. LORETA does not identify subcortical sources like the amygdala or thalamus located below the cortical hemispheres (Thompson & Thompson, 2015).
LORETA represents cortical sites using three-dimensional voxels, which are volumetric units. While its original voxels had a 7-mm spatial resolution (7 mm x 7 mm x 7 mm), the spatial resolution has increased to 5 mm (5 mm x 5 mm x 5 mm). LORETA values are expressed in amperes per cubic centimeter.
LORETA assigns each voxel x, y, and z Talairach coordinates referencing the original Talairach atlas and subsequent atlases like the Montreal Neurological Institute (MNI) atlas. Talairach coordinate assignment is based on vertical distance from a horizontal line from the anterior commissure (origin) to the posterior commissure. For example, x46, y33, z40 corresponds to Brodmann area 8.
These stereotaxic coordinates are primarily independent of brain shape and volume, which has permitted their use in other imaging methods (e.g., positron emission tomography (PET) and magnetic resonance imaging (MRI). Graphic courtesy of BrainMaster Technologies.
Standardized LORETA (sLORETA) achieves a resolution of 1 cubic centimeter. Smaller voxels more precisely localize cortical EEG sources of surface potentials. sLORETA estimates individual voxel's electrical potentials without regard to their frequency. sLORETA values are expressed in normalized F values. This refinement of LORETA trades absolute units of current density for reduced noise and more precise source localization. This is important because LORETA's "three-sphere model," which assumes different cortex, skull, and skin conductivity, suffers from artifacts ("ghost images") and limited source localization (Thompson & Thompson, 2015). Graphic courtesy of BrainMaster Technologies.
A third version of LORETA, eLORETA, exact low resolution brain electromagnetic tomography, claims no localization error (Thompson & Thompson, 2015). Graphic of theta distribution courtesy of Canuet et al. (2011).
Laplacian Analysis
Surface Laplacian (SL) analysis, which is also called current source density (CSD) and scalp current density (SCD), is a family of mathematical algorithms that
provide two-dimensional images of radial current flow from cortical dipoles to the scalp. Positive values represent the current flow from the cortex to the scalp (sources). Negative values represent the current flow from the scalp to the brain (sinks).
Unlike the LORETA family of inverse solutions, SL analysis is independent of reference recording procedures--all reference schemes will yield the same current flow estimates and polarity. SL analysis better localizes the EEG signal than surface potentials because it minimizes scalp EEG blurring produced by volume conduction. Finally, unlike inverse solutions, SL makes no assumptions about different tissue conductivity, functional neuroanatomy, cortical geometry and shape, and EEG sources (Kayser & Tenke, 2015).
GENERAL COGNITIVE AND CLINICAL CHANGES AFTER NEUROFEEDBACK TRAINING
This section covers
Attention Deficit Hyperactivity Disorder, Mild Closed Head Injuries and Traumatic Brain Injury, Substance Use Disorder, Epilepsy, Anxiety and Anxiety Disorders, Post-Traumatic Stress Disorder, Depression, and Tinnitus.
The Centers for Disease Control and Prevention (Schwartz & Cohen, 2013) estimates that 11% of school-aged children and almost 20% of high school boys are medically diagnosed with ADHD in the US.
Boys are diagnosed with ADHD 4-5 times more often than girls (Costello et al., 2003). Their parents are more likely to pursue treatment due to their more severe symptoms or greater degree of impairment (Beidel et al., 2014). Girls are more likely to show inattention and are less likely to be diagnosed with a learning disability, comorbid depression, oppositional defiant disorder, or conduct disorder than their male classmates (Biederman et al., 2002; Spencer et al., 2007).
Almost half of the children diagnosed with ADHD exhibit difficulty learning, communicating, and interacting with their classmates. Roughly 80% misbehave, frequently very seriously (Goldstein, 2011; Mash & Wolfe, 2010).
Neurofeedback Studies
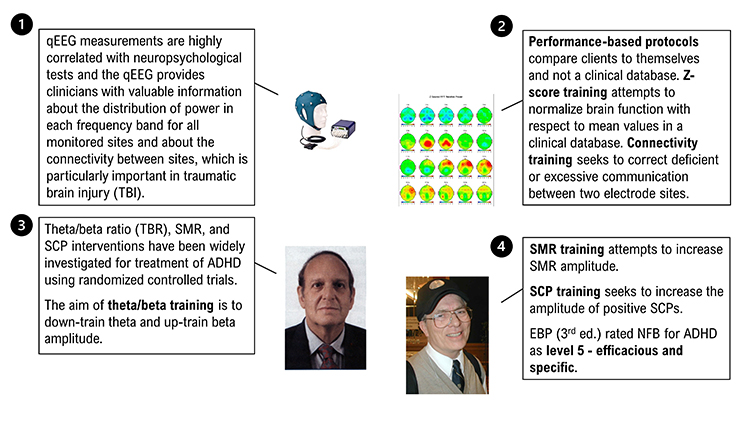
Theta/beta ratio (TBR), SMR, and SCP interventions have been widely investigated using randomized controlled trials. The aim of theta/beta training is to down-train theta and up-train beta amplitude. SMR training attempts to increase SMR amplitude. SCP training seeks to increase the amplitude of positive SCPs.
Lubar, Swartwood, Swartwood, and O'Donnell
(1995) reported that training to reduce slow EEG activity
increased WISC-R and Test of Variables of Attention (TOVA) scores. Full-scale
WISC-R scores increased about 12 points. The increase in TOVA scores
correlated with decreased slow EEG activity.
Lubar (1995) followed 52 patients
treated with NF for as long as 10 years. Their improvement on the
Connors scale, used to measure attention, remained stable at follow-up.
Rossiter and La Vaque (1995) matched
and randomly assigned 46 participants to either Ritalin or NF.
Both groups improved on TOVA measures of inattention, impulsivity,
information processing, and response variability.
Linden, Habib, and Radojevic's (1996)
controlled study of 18 children demonstrated that NF to
increase beta and suppress theta activity increased intelligence scores
and reduced inattention rated by their parents compared to a
wait-list control group.
Thompson and Thompson (1998) reported
the successful treatment of 98 children and 13 adults over 40 50-minute
sessions using Lubar's ADHD protocol. The percentage of children using
Ritalin declined from 30% at the start of the study to 6% post-treatment.
Theta/beta ratios significantly declined for children but not for
adults. Study participants achieved impressive pre-treatment to
post-treatment gains on intelligence, TOVA, and Wide Range Achievement
Test scores. Lynda and Michael Thompson are pictured below.
Case studies by Ramos (1998) and
Wadhwani, Radvanski, and Carmody (1998)
support the efficacy of NF for ADD and ADHD.
Camp (1999) reported that theta
suppression biofeedback training compared favorably with cognitive
behavior modification, based on pre-treatment to post-treatment changes in
48 children on TOVA, parent and teacher ratings, and ADHD scales.
The Kaiser and Othmer (2000)
multi-center study involved 1,089 patients aged 5 to 67 years. It
demonstrated that SMR-beta NF training produced significant
gains on TOVA measures of attentiveness, impulse control, and response
variability.
Carmody and colleagues (2001) randomly assigned 16 children (ages 8-10) to either EEG
biofeedback or a wait-list control condition. Eight of the 16 children were diagnosed with ADHD, and 8 had received
no diagnosis of any disorder. In the EEG biofeedback condition, participants received 3-4 weekly sessions of EEG
biofeedback (using a synthesis of Protocols 1 and 3) for 6 months and completed 36-48 sessions.
The children
diagnosed with ADHD who received EEG biofeedback decreased impulsivity as measured by the TOVA, and their
teachers' ratings of attentiveness on the School Version of the Attention Deficit Disorders Evaluation Scale (ADDES) improved. Selected qEEG measures did not
consistently validate improvement by participants in the EEG biofeedback condition.
Monastra, Monastra, and George (2002)
compared 49 children diagnosed with ADHD who participated in 1-year
multimodal program (Ritalin, parent counseling, and academic
consultation) with 51 children who participated in the multimodal program
combined with NF (weekly 30 to 40-min sessions using the Lubar
protocol with a cash reward for increased frontal cortical arousal).
Both
groups significantly improved performance on TOVA and the Attention
Deficit Disorders Evaluation Scale when medicated with Ritalin, but only
the group that received NF maintained performance gains when
unmedicated. A qEEG scan only showed reduced cortical slowing in children
who received NF. Parenting style moderated behavioral symptoms
at home but not in the classroom. Vincent Monastra is pictured below.
Fuchs, Birbaumer, Lutzenberger, Gruzelier, and
Kaiser (2003) compared the efficacy of 3 months of
sensorimotor rhythm (12-15 Hz) and beta1 (15-18 Hz) NF against
methylphenidate in 46 ADHD children. The children were assigned to the
NF (22) and medication (12) based on their parents' preference
(the assignment was nonrandom). Both treatment groups improved on all TOVA
subscales and speed and accuracy on the d2 Attention Endurance Test.
Teacher and parent ratings of ADHD behaviors on the IOWA-Conners Behavior
Rating Scale also improved for both groups.
Monastra and colleagues (2005) assigned a more conservative rating of probably
efficacious for
EEG biofeedback for ADHD in an AAPB White Paper. Despite significant
improvement in about 75% of patients in the published studies they
examined, the authors concluded that more randomized, controlled group
studies that control for therapist and patient characteristics are
needed to calculate the percentage of patients diagnosed with ADHD who
will achieve these gains in typical clinical settings.
NF appears to be superior to no treatment and equivalent to
stimulant medication. Patients require at least 20 sessions and as many
as 50 sessions to produce clinical improvement.
Gevensleben and colleagues (2009)
conducted a multisite randomized controlled study of 102 children diagnosed with ADHD using NF training that combined blocks of theta/beta and slow cortical potential NF and computer-based attention skills training control. The combined NF group was superior to the control group on parent and teacher ratings, and both NF protocols produced comparable changes. These gains were maintained at a 6-month follow-up (Gevensleben et al., 2010).
Sherlin, Arns, Lubar, and Sokhadze (2010) argued that NF for
ADHD is safe, should be reclassified as level 5: efficacious and specific, produces long-term effects that last
from 3-6 months, and may produce clinical results like stimulant medications. While NF effectively
treats inattention and impulsivity, they suggested that medication may be more appropriate when the primary
symptom is hyperactivity and that NF may be successfully combined
with medication.
Duric and colleagues (2012) conducted a randomized
controlled trial of 91 children and adolescents diagnosed with ADHD assigned to 30 NF sessions, methylphenidate, or NF with methylphenidate. Parent ratings of core ADHD symptoms improved for all three groups, and there were no group differences. NF achieved equal efficacy to methylphenidate.
The American Academy of Pediatrics (2012)rated biofeedback
for child and adolescent attention and hyperactivity behaviors Level 1- Best support.
Pigott, De Biase, Bodenhamer-Davis, and Davis (2013)
provided a comprehensive review of NF efficacy for ADHD and persuasively argued that it should
receive a level-5 classification. The authors emphasized that compared with stimulant medication, only
NF has demonstrated effectiveness at 2-year follow-up.
Meisel and colleagues (2013) reported a randomized controlled trial of 23 children diagnosed with ADHD who either completed 40 theta/beta NF sessions or received methylphenidate.
While both groups improved on parent and teacher ratings of functioning and core ADHD symptoms, only the NF group improved on academic performance at 6-month follow-up.
In their review of recent studies, Arns and Strehl (2013) concluded that in randomized controlled trials where theta/beta or slow cortical potential NF were active treatments and either cognitive training or EMG biofeedback were controls, NF produced significant improvements in teacher ratings.
Steiner and colleagues (2014) conducted a randomized controlled study of 104 children assigned to either NF, cognitive training (CT), or control conditions. At a 6-months follow-up, the NF group sustained greater gains on the Conners 3-P, Executive Functioning, Hyperactivity/Impulsivity, and Behavior Rating Inventory of Executive Function (BRIEF) subscales than the CT or control groups. Moreover, the NF group maintained their stimulant dosage while the CT and control groups increased their dosage.
Below is a NeXus-10 ® BioTrace+ caterpillar game. The three caterpillars represent the theta, SMR, and beta
frequency bands.
Clinical Efficacy
Arns, Heinrich, and Strehl (2016) rated neurofeedback
for ADHD as level 5 - efficacious and specific in Evidence-Based Practice in
Biofeedback and Neurofeedback (3rd ed.). This rating was supported by at least two independent multi-center RCTS where NFB was evaluated against a cognitive training control and at least two independent RCTs in which NF was comparable to methylphenidate.
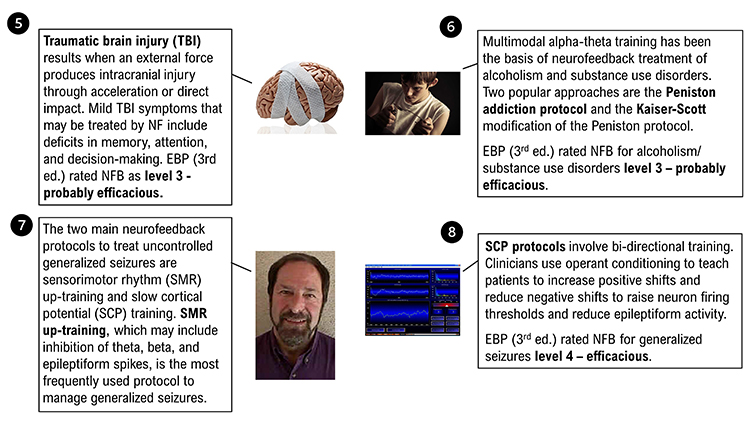
Mild Closed Head Injuries and Traumatic Brain Injury (TBI)
Traumatic brain injury (TBI) results when an external force produces intracranial
injury through acceleration or direct impact. Mild TBI symptoms that NF may treat include deficits in memory, attention, and decision-making (National Institute of Neurological Disorders and Stroke, 2008). Check out Siddharthan Chandran's TED Talk Can the Damaged Brain Repair Itself?
Ayers (1995) reported treating 32 level-two coma patients, who were
comatose for
more than 2 months, noninvasively with NF. There is a generalized response where patients move aimlessly and inconsistently in a level-two coma on the Rancho Los Amigos Cognitive Scale. If they open their
eyes, patients do not focus on objects.
Twenty-five of 32 patients emerged from their comas after 1-6 treatments.
NF for coma involved inhibiting 4-7 Hz activity and
reinforcing the replacement of 4-7 Hz with 15-18 Hz activity.
Ayers and colleagues started NF for open head trauma at the
somatosensory cortex. They trained these patients to decrease 4-7 Hz
activity and increase 15-18 Hz activity.
Thornton (2000) reported that NF improves the memory of
TBI patients. Tinius and Tinius (2000) found that it improves
attention, problem-solving, and task performance. Keller's (2001)
controlled study showed that beta training significantly improved attention compared to matched controls.
Another controlled study by Schoenberger, Shif, Esty, Ochs, and
Matheis (2001) showed that NF enhanced cognitive function and self-reported depression
and fatigue.
Walker, Norman, and Weber (2002) reported that 88% of mild TBI
patients achieved over 50% improvement in EEG coherence. All patients who had been previously employed resumed
work after completing their training.
Thornton and Carmody (2013) reported auditory and visual memory gains in 15 TBI patients who received NF training for qEEG power and connectivity in an uncontrolled pre-test/post-test study.
Clinical Efficacy
Foster and Thatcher (2016) rated neurofeedback
for TBI as level 3 - probably efficacious in Evidence-Based Practice in
Biofeedback and Neurofeedback (3rd ed.). Since TBI is a heterogeneous disorder, the authors caution that efficacy depends on selecting appropriate individualized treatment.
The U.S. National Longitudinal Alcohol Epidemiologic Study estimated that the lifetime prevalence for adult alcoholism ranges between 13.5-23.5%. In the past year, 7.5-9.5% of adults experienced alcohol abuse and dependency. Twenty percent of hospitalized adults are alcoholics. The CDC estimates that over 38 million adults engage in binge drinking four times a month (Thompson, 2014).
Neurofeedback Protocols
Researchers often observe deficient slow-wave activity (delta, theta, and
alpha) and excessive beta activity in alcoholics. Alcohol consumption
slows their alpha frequency and increases its amplitude (Peniston &
Kulkosky, 1990). The Menninger Clinic ON-OFF-ON training and alpha-theta protocol provided components of the Peniston Protocol, which has been effectively used to treat alcoholism.
The Menninger ON-OFF-ON EEG protocol teaches a
patient to increase the
amplitude within a frequency band, reduce the amplitude, and then
increase the amplitude again during 100- or 200- second segments. For example, a
patient may increase 8-13 Hz alpha activity for 100 s, decrease it for
100 s, and then increase it for 100 seconds. This approach may produce superior
control compared to procedures that only train alpha or theta
increase (Norris, 1988).
The Menninger alpha-theta protocol places the active electrode 1 centimeter
above and left of the inion (the bony prominence located on the back of
the head) with a reference on the left earlobe. This protocol teaches EEG
control using 100- or 200-seconds “ON-OFF-ON” exercises.
Temperature and frontal SEMG biofeedback precede alpha-theta training.
Patients receive 3-4 weekly sessions of temperature biofeedback followed
by 3-4 weekly sessions of frontal SEMG biofeedback. Judy Green has
likened the temperature and SEMG biofeedback sessions to settling
elementary school students in their seats so they can pay attention
without distraction. These sessions also teach patients the strategy of passive
volition (allowing), which is critical to alpha-theta training.
The patient then receives 10-12 bi-weekly sessions of alpha-theta
biofeedback using ON-OFF-ON exercises. Training attempts to gradually
slow the EEG until the patient can increase alpha and theta amplitude
without falling asleep.
Egner, Strawson, and Gruzelier (2002) addressed whether the
effects of alpha-theta
NF depend on with-session EEG changes or are non-specific and
shared with other relaxation procedures. They compared the effect of
contingent and noncontingent alpha-theta NF on theta/alpha
ratios within and across sessions.
The contingent group achieved
increased within-session theta/alpha ratios, while the noncontingent
group did not. The contingent group also achieved higher theta/alpha
ratios than the noncontingent group during some training sessions.
There were no group differences in subjective reports of activation
since both groups reported significantly lower activation following
training. Both contingent and noncontingent NF were relaxing.
This study validated the assumption underlying alpha-theta NF
that accurate feedback results in higher within-session theta/alpha
ratios than does noncontingent NF.
The Peniston addiction protocol (1989) is a multimodal approach that
incorporates biofeedback and non-biofeedback components. Patients
start with visualization training, receive 6 temperature biofeedback
sessions, learn rhythmic breathing techniques, participate in autogenic
training exercises, learn to construct personalized imagery, and
experience guided imagery (where the therapist directs the patient
visualization). This training prepares patients for 30 alpha-theta
sessions in which they learn to slow the EEG to increase alpha
and theta amplitude using the Menninger alpha-theta training procedure.
Following the alpha-theta biofeedback sessions, the supervising physician
may need to adjust medication.
Experimental patients who received Peniston and Kulkosky’s alpha-theta
protocol for alcoholism and control patients were assessed over a
24-month follow-up period. Across this period, 8 of the 10 experimental
patients and none of the 10 controls maintained abstinence from alcohol.
Due to the Peniston-Kulkosky addiction protocol's multimodal nature, we cannot identify the components responsible for clinical improvement. Further clinical research that "dismantles" this protocol will be required to isolate the active treatment components.
Kaiser and Scott (Kaiser et al., 1999; Scott et al., 2002, 2005)
modified the Peniston protocol to increase its success with patients dependent on cannabis and stimulants. The Kaiser-Scott protocol, which starts with NF ADHD training and then progresses to the Peniston protocol, has improved retention and abstinence in these hard-to-treat populations.
This video takes the viewer through an alpha-theta training demonstration using the Nexus/Biotrace system (Mind Media, Roermond, The Netherlands) using the training approach developed by John Anderson. The demonstration uses saved session data to illustrate the functions and discuss the threshold settings and training concepts.
Neurofeedback Studies
Peniston and Kulkosky (1990) reported
that patients who received alpha-theta NF achieved
significantly greater decreases on Millon Clinical Multiaxial Inventory
factors than those who received conventional medical treatment.
Alcoholics who received alpha-theta NF improved on schizoid,
avoidant, passive-aggressive, schizotypal, borderline, paranoid, anxiety,
somatoform, dysthymic, alcohol abuse, psychotic thinking, psychotic
depression, and psychotic delusional factors.
Schneider et al. (1993) reported that
6 of 10 male alcoholics remained abstinent 4 months after completing
slow cortical potential NF.
Taub and colleagues (1994)
randomly assigned 118 chronic alcoholics to one of four treatments:
Alcoholics Anonymous and counseling (RTT), RTT combined with
Transcendental Meditation, RTT combined with SEMG biofeedback, or RTT plus
sham neurotherapy. The sham NF condition involved "electrocranial stimulation" and not alpha-theta biofeedback. Rates of
self-reported abstinence were 25%, 65%, 55%, and 28%, respectively. While
the addition of Transcendental Meditation and EMG biofeedback seemed to
increase abstinence, sham neurotherapy did not. The addition of
Transcendental Meditation or EMG biofeedback to RTT produced abstinence
rates comparable to those reported for the addition of alpha-theta
biofeedback.
In a controlled study, Saxby and Peniston (1995) demonstrated that alpha-theta NF could reduce depression in alcoholics and increase the rate of abstinence assessed over a 21-month follow-up period.
Kelley’s (1997) 3-year
follow-up study of 20 Native American alcoholic inpatients reported the
following changes: increased EEG synchrony and alpha-theta amplitudes,
extinction of drinking behavior, less personally damaging behavior (81%),
and lower Beck Depression Inventory scores.
Burkett and colleagues (2003) conducted an open-label uncontrolled study of the Scott-Kaiser modification of the Peniston protocol with 270 male homeless patients addicted to crack cocaine
who also received faith-based interventions within a residential setting. At 1-year follow-up, data from 94 patients who completed treatment showed abstinence from alcohol or other drugs in 53.2% and drug use only 1-3 times in 23.4%, corroborated by urinalysis. A follow-up report on 87 patients who completed treatment documented improvement on urinalysis, length of residential stay, and self-reported depression (Burkett et al., 2005).
Bodenhamer-Davis and Calloway (2004) conducted an uncontrolled trial of 16 outpatients diagnosed with chemical dependency in which they administered alpha-theta NF. At 74- to 98-month follow-up,
81.3% were abstinent, and rates for re-arrest and loss of probation were lower than for a comparison group.
Scott, Kaiser, Othmer, and Sideroff (2005) randomly assigned patients with mixed
substance abuse to EEG biofeedback or a control group. The EEG biofeedback group stayed in treatment longer than
the control group. Seventy-seven percent of patients who completed EEG training remained abstinent at 12 months
compared with 44% of controls.
Sokhadze, Cannon, and Trudeau (2008) found that alpha-theta training for alcoholism
and a combination of alpha-theta training, beta training for polydrug abuse (including stimulants), and
residential treatment were probably effective.
Clinical Efficacy
Sokhadze and Trudeau (2016) rated neurofeedback
for alcohol/substance use disorders as level 3 - probably efficacious in Evidence-Based Practice in
Biofeedback and Neurofeedback (3rd ed.). The authors extended this rating to stimulant abusers treated with the Scott-Kaiser modification of the Peniston Protocol.
Petit mal seizures feature loss of consciousness without
abnormal movement (patient appears to be daydreaming). The patient,
typically a child, may suffer hundreds of these seizures daily for
periods lasting up to 30 seconds.
Check out the Epilepsy Therapy Project video Understanding Partial Seizures.
The sensorimotor cortex is a central cortical area defined by the central
sulcus (fissure of Rolando) separating the frontal and parietal lobes.
Sterman (1977) recorded the EEG over the left sensorimotor cortex from
sites 10% and 30% lateral to the vertex (slightly medial to C3 and T3).
The sensorimotor rhythm (SMR) is an EEG rhythm from 12-14 Hz located over
the sensorimotor cortex (central sulcus). This rhythm is associated with
inhibition of movement and reduced muscle tone.
Demographics
In the United States, about 2% of adults experience a seizure, and two-thirds of these patients do not have additional episodes. Those who experience two or more seizures are diagnosed with epilepsy, which is frequently idiopathic (no identified cause) or symptomatic (identified cause like a brain tumor). Age of seizure onset provides a guide to its likely cause (Adamolekun, 2013).
Neurofeedback Protocols
The two main neurofeedback protocols to treat uncontrolled generalized seizures are sensorimotor rhythm (SMR) up-training and slow cortical potential (SCP) training.
SMR Up-training
SMR up-training, which may include inhibition of theta, beta, and epileptiform spikes, is the most frequently used protocol to manage generalized seizures (Tan et al., 2009). The graphic below shows a NeXus-10 SMR display.
For example, Sterman's protocol trains an epileptic patient to increase SMR (12-14 Hz)
amplitude
and duration while theta (4-7 Hz), beta (20+ Hz), epileptiform spikes,
and EMG artifact are suppressed during 36 sessions. The aim is to
normalize the waking and sleep EEG with elevated SMR and suppressed theta
and beta activity.
SCP Training
SCP training has emerged as an alternative to SMR training for generalized tonic-clonic
seizures, especially in Europe. SCPs consist of positive and negative event-related EEG waveforms that last several seconds (slower than 1 Hz). Positive SCPs are associated with cortical hyperpolarization and inhibited neuronal firing. Conversely, negative shifts reflect cortical depolarization and increased neuronal firing. SCP protocols involve bi-directional training. Clinicians use operant conditioning to teach patients to increase positive shifts and reduce negative shifts to raise neuron firing thresholds and reduce epileptiform activity. This
strategy has also been successfully applied to treat migraines. The graphic below shows a NeXus-10 SCP display.
Neurofeedback Studies
Elbert et al. (1991)
conducted a double-blind, randomized controlled study of 14 patients with seizures not controlled by medication. They assigned patients to either 28 1-hour sessions of bidirectional SCP or alpha training. At 1-year follow-up, all patients in the SCP group and only 1 in the alpha group reduced seizure frequency.
Rockstroh et al. (1993) reported a pre-test/post-test study of 28 1-hour sessions of bi-directional SCP training for 25 uncontrolled epilepsy patients. Follow-up data from 18 participants, who monitored their seizure frequency through training and 1-year follow-up, showed reduced seizure frequency.
Kotchoubey et al. (1996) reported that SCP
NF decreased the baseline seizure frequency in
drug-resistant epileptics and Kotchoubey et al. (1997) showed that this improvement was
maintained 6 months post-treatment.
Kotchoubey, Busch, Strehl, and Birbaumer (1999) concluded that
SMR and SCP protocols improve epilepsy control in about 66% of
patients. While the mechanism underlying SCP training remains unclear, it
may involve increased 6.0-7.9 Hz theta activity during training trials
without feedback.
Joy Andrews et al. (2000) found that a NF protocol
involving five consecutive days of
training enabled 79% of patients to control their seizures.
Sterman (2000) summarized 18
peer-reviewed studies in which 174 patients were trained using his SMR
protocol. The outcome data were impressive; 82% clinically improved,
reducing seizures by more than 30%. The average seizure reduction exceeded 50%. Many studies found decreased seizure severity. Five
percent of patients remained seizure-free for as long as one year. In those studies where researchers recorded
pre-treatment and
post-treatment EEG amplitudes, 66% normalized their EEG power spectra.
Kotchoubey et al. (2001) treated patients with refractory epilepsy
with an anti-epileptic drug and
psychosocial counseling, a breathing training control group, or SCP
NF in a non-randomized clinical study in which participants selected their treatment. Only the drug and SCP
groups significantly reduced seizure frequency.
La Vaque (2003) considers slow cortical potential
(SCP) training to be highly effective in controlling "drug-resistant" epilepsy.
Marson and Ramaratnam (2003) reviewed randomized controlled trial studies and
reported a significant reduction in median seizure activity in one study.
Sheth, Stafstrom, and Hsu (2005) examined 16 studies of biofeedback treatment of
refractory epilepsy, including contingent negative variation (CNV), slow cortical potential (SCP), and galvanic
skin response (GSR). While most studies involved 1-8 patients, one enrolled 83 patients. Epilepsy symptoms
improved in 82% of patients who received biofeedback training. Both the EEG and GSR treatments produced
significant gains.
Strehl and colleagues
(2005) reported that 70% of SCP training treatment success with drug-resistant patients could be predicted by initial cortical excitability (negative SCP amplitude), location of epileptic foci (sites that trigger seizures), and personality. Successful patients did not exhibit large negative SCP amplitudes at the start of training, did not have left temporal foci, and reported lower life satisfaction and high reactivity to stressors.
Ramaratnam, Baker, and Goldstein (2005),
in a Cochrane Database Systematic Review, challenged the efficacy of
NF for epilepsy due to methodological flaws and a small sample
size.
A meta-analysis by Tan and colleagues (2009) reviewed
nine studies that used SMR and one that used SCP neurofeedback. They found consistent reductions in seizure frequency for drug-resistant patients and successful reduction in seizure frequency by 79% of patients who received SMR training.
Clinical Efficacy
Tan and Wong (2016) rated SCP and SMR neurofeedback
for epilepsy as level 4 - efficacious in Evidence-Based Practice in
Biofeedback and Neurofeedback (3rd ed.).
Anxiety and Anxiety Disorders
Generalized anxiety disorder (GAD) is defined by excessive anxiety and
worry most of the time for at least 6 months (Beidel, Bulik, & Stanley, 2014). Chronic overarousal
results in fatigue and insomnia, worsened by changes in their circadian rhythm due to their job or
travel (McGrady & Moss, 2013).
Patients perceive their worrying as outside their control. They present with physical (muscle tension) and
cognitive symptoms (the belief that worrying can prevent an adverse event). They are usually diagnosed with a second
disorder (Beidel, Bulik, & Stanley, 2014).
Specific phobia involves significant emotional distress, excessive anxiety,
or fear about an object or situation that disrupts everyday performance. DSM-5 lists five specifiers: animal
phobias, natural environment phobias, blood/injection/ injury phobias, situational phobias, and other phobias
(Beidel, Bulik, & Stanley, 2014).
DSM-5 classifies Post-traumatic stress disorder (PTSD) as one of the Trauma and Stress-Related Disorders. PTSD is a response to a traumatic event
like assault, military combat, or rape that may be experienced firsthand or observed (American Psychiatric Association, 2013).
Demographics
Estimated lifetime prevalence rates for anxiety disorders in the United States are panic disorder (2.3-2.7%),
generalized anxiety disorder (4.1-6.6%), OCD (2.3-2.6%), PTSD (1-9.3%), and social phobia (2.6-13.3%). The
male-to-female ratio for a lifetime anxiety disorder is 3 to 2 (Yates, 2014).
Overview
Most controlled, randomized experiments have found that
neurofeedback and biofeedback (electrodermal, SEMG, and temperature)
produce comparable anxiety reductions to relaxation procedures like
meditation and progressive relaxation. Biofeedback and relaxation
procedures may achieve equivalent results because anxiety involves
disordered attention and cognition in addition to abnormal physiological
arousal. In some cases, biofeedback may be superior to relaxation procedures and may produce additive effects
when combined with medication.
Neurofeedback Studies
Rice, Blanchard, and Purcell (1993)
studied 45 patients with generalized anxiety. Thirty-eight of these
patients satisfied the DSM-III criteria for Generalized Anxiety Disorder
(GAD) and 7 were subclinical for GAD and only met 2 of these criteria.
They randomly assigned patients to one of five conditions: frontal EMG
biofeedback, EEG biofeedback to increase alpha, EEG biofeedback to
decrease alpha, pseudomeditation, or a wait-list control. For the two
EEG biofeedback conditions, the electrodes were placed at Oz, the right
mastoid process, and the forehead. All four treatment groups received
eight 60-minute sessions and achieved significant reductions on
STAI-Trait Anxiety scores and Psychosomatic Symptom Checklist (PSC)
scores.
Only the alpha-increase condition decreased heart rate reactivity to
stressors. Subjects in the frontal EMG, alpha-increase, and alpha
suppression conditions maintained improvement in STAI-Trait Anxiety and
PSC scores at 6 weeks post-treatment. The alpha-increase and
alpha-suppression groups showed further improvement in
Psychosomatic Symptom Checklist scores at 6 weeks post-treatment.
Vanathy, Sharma, and Kumar (1998) randomly assigned participants who met the diagnostic
criteria for Generalized Anxiety Disorder (GAD) to a wait-list control, alpha-increase biofeedback, or
theta-increase biofeedback. EEG biofeedback consisted of 15 sessions to enhance alpha or theta and
suppress beta.
Both the alpha-increase and theta-increase groups reduced self-reported (STAI-State Anxiety) and blind
observer-rated anxiety (Hamilton Anxiety Rating Scale) in comparison to the control group. These results may
have been due to Type 1 error caused by multiple t-tests without statistical correction. The
authors' failure to observe changes in EEG power in the alpha or theta bands following EEG training suggests
that non-specific treatment components, and not EEG training, may have produced clinical improvement, assuming
that the findings of symptom improvement were valid.
Agnihotry, Paul, and Sandhu (2007) conducted a randomized controlled study of 45 patients diagnosed with Generalized Anxiety Disorder, which compared frontalis SEMG relaxation, EEG training to increase alpha, and a control group. Both the SEMG and EEG groups reduced STAI-State Anxiety and Trait Anxiety scores. Galvanic skin resistance (more resistance means less SNS activation) increased for both groups, with more significant gains for the SEMG group. At a 2-week follow-up, the SEMG group maintained the largest gains on all three measures.
Biofeedback Studies
Corrado, Gottlieb, and Abdelhamid (2003) reported that chronic pain patients who
received a combination of finger temperature and SEMG biofeedback showed reduced anxiety and physical
complaints compared to those in a pain education control group.
Coy, Cardenas, Cabrera, Zirot, and Claros (2005) found that combining the
antidepressant imipramine and biofeedback resulted in more significant anxiety reduction than imipramine alone.
Reiner (2008) reported an uncontrolled pre-test/post-test study of 24 patients diagnosed with an anxiety disorder and receiving outpatient CBT who practiced at home using a portable HRVB device.
Nineteen participants who completed the study reduced Spielberger State-Trait Anger Expression Inventory (STAEI) and Spielberger State-Trait Anxiety Inventory (STAI-Y) scores and increased Pittsburgh Sleep Quality Index (PSQI) scores and sleep duration. Participants who practiced more frequently achieved more significant improvements on these measures.
Mikosch and colleagues (2010) conducted a randomized controlled study of 212 patients scheduled for elective coronary angiography (CA), which compared an intervention group that received psychological support, abdominal breathing instruction, and one session of HRVB with a control group that received TAU and information. While both groups reduced Spielberger State-Trait Anxiety Inventory (STAI) scores after the CA, the intervention group showed the largest decrease, and its scores were normal.
Ratanasiripong, Sverduk, Prince, and Havashino (2012) reported a randomized controlled study of 30 undergraduates, which compared counseling plus HRVB with a counseling comparison group. While both groups reduced Beck Anxiety Inventory scores, the HRVB group showed more significant improvement.
Clinical Efficacy
Moss (2016) rated biofeedback
for anxiety and anxiety disorders as level 4 - efficacious in Evidence-Based Practice in
Biofeedback and Neurofeedback (3rd ed.).
Ginsberg, Foster, and Tan (2016) and Foster and Thatcher (2016) separately rated biofeedback
and neurofeedback for PTSD as level 3 - probably efficacious in Evidence-Based Practice in
Biofeedback and Neurofeedback (3rd ed.). This rating was limited by the small sample sizes and combination of biofeedback and neurofeedback with other treatments.
Update: Multiple independent RCTs warrant a level 5 - efficacious and specfic rating for panic disorder. In addition, studies support a level 4 - efficacious rating for PTSD.
Multiple pathways to depression include polygenic dysfunction involving the lateral and medial orbitofrontal cortex and limbic
system, and environmental factors (McGrady & Moss, 2013).
Depression is associated with activation of the lateral orbitofrontal cortex, which signals that our behavior has not been rewarded. This activation may be related to feelings of loss and disappointment. Since this region communicates with networks responsible for our self-concept, this may also lower self-esteem (Cheng et al., 2016).
Depression also involves reduced activation of reward circuitry in the medial orbitofrontal cortex and its communication with autobiographical memory systems. These changes may contribute to depressed patients' lack of enjoyment of daily activities and difficulty remembering happy experiences.
The CDC estimated the prevalence of depression in adults from 2006-2008. The CDC classified 9% of 235,067 adults with current depression and 3.4% with major depressive disorder (Halverson, 2014). The lifetime prevalence of major depressive disorder (MDD) is 20% in women and 12% in men. MDD is diagnosed twice
as often in women as in men (Aronson, 2005).
If untreated, 25-30% of adult depressive attempt or commit suicide. Most cases of major depression involve
another comorbid psychological disorder that is primary (Zimmerman et al., 2002). Only 21% of annual cases of
depression are adequately treated (Kessler et al., 2003).
Neurofeedback and Biofeedback Protocols
EEG and functional MRI (fMRI) are the primary NF interventions, and EMG and HRV are the central biofeedback interventions for depression. NF EEG protocols attempt to correct frontal alpha asymmetry or enhance parietal-occipital upper alpha. The rationale for alpha asymmetry neurofeedback for mood disorders is
that the left frontal cortex mediates approach behavior while the right
mediates negative affect.
Clinical depression is associated
with less activation of the left frontal lobe than the right. Since alpha
is an "idling frequency," this asymmetry is seen when the alpha amplitude is
greater in the left (F3) than the right frontal
lobe (F4). The goal of alpha asymmetry
NF for depression is to correct this imbalance, decreasing
left frontal alpha with respect to right frontal alpha.
Successful NF training increases the activation of the left hemisphere with respect to the right.
Before EEG asymmetry training, patients are trained using diaphragmatic
breathing and autogenic phrases to teach them to relax and warm their
hands. The hand-warming criterion is 95 degrees F.
Patients are seen once or twice a week for one-hour sessions, which
consist of 30 minutes of EEG training followed by 30 minutes of
psychotherapy. Scalp sites F3 and F4 are used and are referenced to
CZ. A bell or
clarinet tone reinforces behavior when the asymmetry score exceeds
0 (right alpha amplitude exceeds left).
Typically, it is desirable for 15-18 Hz amplitude to be higher and 8-11 Hz amplitude to be lower at F3 compared to F4.
fMRI protocols attempt to up-regulate the activity of targeted regions that mediate positive emotion.
Neurofeedback Studies
EEG Studies
Baehr et al. (1999) reported that 3
of 6 patients discontinued antidepressant medication before the close of
the fourth treatment quarter and that their proportion of A (alpha
asymmetry) scores remained stable.
Case
studies reported by Kumano et al. (1996)
and Rosenfeld (2000) and a pilot
study by Waldkoetter and Sanders (1997)
support the Baehr et al. (1999)
finding that NF can reduce the symptoms of clinical
depression.
Corrado and Gottlieb (1999) compared
biofeedback-assisted relaxation with a wait-list control condition in
chronic pain patients. The biofeedback-assisted relaxation group
achieved improved Beck Depression Inventory scores.
Rosenfeld (2000) summarized a series of case studies involving patients diagnosed with depression. Before NF sessions, patients were trained to breathe diaphragmatically for 15-30 minutes and to warm their hands to a criterion of 95 degrees F. Active electrodes at F3 and F4 were both referenced to Cz. Training sessions conducted twice a week and were divided into 50% NF and 50% psychotherapy. As the alpha asymmetry score improved in four cases, Beck Depression Inventory (BDI) and Minnesota Multiphasic Personality Inventory (MMPI) depression scores declined.
Baehr, Rosenfeld, and Baehr (2001) reported follow-up data for three of six patients
diagnosed with unipolar depression who had completed 27 sessions of alpha asymmetry training. The authors compared
pre-treatment and follow-up alpha asymmetry and Beck Depression Inventory scores. All three patients had achieved
normal right hemisphere alpha asymmetry scores and Beck scores by the completion of their training and maintained
these gains at 1- to 5-year follow-up.
Choi et al. (2011) conducted a randomized controlled trial of 24 right-handed depressed patients who had not received psychoactive drugs within 2 months of the study. The researchers placed active electrodes at F3 and F4, referenced to Cz, and utilized Rosenfeld’s asymmetry protocol. Training sessions comprised six 4-minute trials separated by 30-second rest periods. They trained participants twice a week for 5 weeks. Following NF training, participants received self-training to reproduce the mental state they experienced during NF without equipment twice a week for 1 month. The psychotherapy placebo sessions were also conducted for 5 weeks. After these sessions, they were referred to other therapists who provided traditional psychotherapy for depression as required.
Only the NF group increased right frontal alpha power and asymmetry scores and a significant improvement on the HAM-D and BDI-II scales. Six (50%) of the NF participants and none of the psychotherapy placebo participants achieved a clinical response.
Functional MRI Studies
Real-time functional MRI NF (rtfMRI-nf) interventions are designed to increase the metabolism of brain regions, like the ventromedial prefrontal cortex, that mediate positive affect.
Linden et al. (2012) reported an open-label pilot study of fMRI NF for 16 participants diagnosed with Recurrent Depressive Disorder. In the fMRI NF condition, the researchers trained 8 participants during four sessions to up-regulate brain regions responsive to positive emotions using a visual display updated every 2 seconds. Each session consisted of three 7-minute trials. In the control condition, the researchers instructed 8 participants to utilize positive imagery techniques employed by the fMRI NF participants during four sessions conducted outside the scanner. The fMRI NF group successfully up-regulated the target areas (left or right ventromedial prefrontal cortex, insula, dorsolateral prefrontal cortex, medial temporal lobe, or the orbitofrontal cortex). While the fMRI NF group improved on the Hamilton Depression Rating Scale (HDRS), the control group did not change.
Young et al. (2014) randomly assigned unmedicated participants diagnosed with major depressive disorder to either receive rtfMRI-nf from the left amygdala (experimental; n = 14) or the left intraparietal sulcus (control; n = 7). Training sessions consisted of seven 8-minute 30-second runs. The experimental group increased left amygdala activation when recalling positive autobiographical memories within the first training session. This training effect was maintained during transfer runs in which participants did not receive NF. In contrast, the control group did not increase the activation of the intraparietal sulcus. While the experimental group decreased Profile of Mood States (POMS) depression scores, it was not superior to the control group. The experimental group decreased State-Trait Anxiety Inventory (STAI) state and trait scores, and the two groups only differed on state anxiety. Finally, the experimental group increased Visual Analog Scale (VAS) happiness ratings, and this gain was more significant than in the control group.
Biofeedback Studies
Surface EMG Biofeedback
Durmus, Alayli, and Canturk (2005)
randomly assigned 50 female patients diagnosed with knee osteoarthritis to biofeedback-assisted isometric exercise or electrical stimulation. For both groups, 20 minutes of therapy was applied 5 days a week for 4 weeks. Patients were evaluated before and after treatment. Both groups showed significant improvements in pain, measured by the Western Ontario McMaster Universities Osteoarthritis Index (WOMAC), and physical function scores. They demonstrated significant improvements in anxiety and depression scores on the Hospital Anxiety Depression (HAD).
Heart Rate Variability Biofeedback
HRVB is possibly efficacious for depression, and its effects may be mediated by the diaphragm's stimulation of vagal afferent nerves (Gevirtz, 2013). This hypothesis is supported by findings that vagal nerve stimulation in some studies improved intractable depression.
Karavidas and colleagues (2007) administered 10 weekly sessions of heart rate
variability (HRV) biofeedback to 11 patients diagnosed with major depressive disorder (MDD). By session 4, these
patients showed significant improvement on the Hamilton Depression Scale (HAM-D) and the Beck Depression Inventory
(BDI-II). They maintained these changes over the remaining 6 weeks of training.
Siepmann et al. (2008) conducted an open-label controlled pilot study with 38 participants. They placed 14 depressed individuals in the HRVB condition. Additionally, they randomly assigned 12 healthy individuals to HRVB and active control (watch the same HRVB display without instructions) conditions. The decision to assign all depressed individuals to the HRVB condition and none to the active control condition undermined the internal validity of this design for these participants. All participants received three treatment sessions per week for 2 weeks. While depressed individuals significantly reduced Beck Depression Inventory (BDI) scores, decreased Spielberger State-Trait Anxiety Inventory (STAI) scores and heart rate, and increased HRV compared to baseline, healthy participants who received HRVB or the active control treatment did not change.
Zucker et al. (2009) conducted a controlled pilot study with 38 participants recruited from a residential therapeutic community for substance use disorder e diagnosed with PTSD symptoms. They randomly assigned individuals to either HRVB (StressEraser) or progressive muscle relaxation (PMR) recording. They instructed participants to practice 20 minutes per day and complete weekly logs. The HRVB group achieved lower Beck Depression Inventory (BDI-II) scores and increased HRV (SDNN) compared to the PMR group. Both groups significantly reduced PTSD symptoms on the Posttraumatic Stress-Total (PTS-T) scale and PTSD Checklist-Civilian Version (PCL-C). Increased HRV predicted improvement, even when respiration rate was statistically controlled.
Patron et al. (2013) studied 26 individuals with depressive symptoms following cardiac surgery. They randomly assigned participants to either five 45-minute sessions of HRVB or treatment as usual (TAU). HRVB was superior to TAU in increasing respiratory sinus arrhythmia (RSA), heart rate speeding and slowing across the breathing cycle, and decreasing the Centre for Epidemiologic Studies of Depression (CES-D) values from pre- to post-treatment. Improvement was correlated with increased RSA.
Clinical Efficacy
Shaffer and Zerr (2016) rated neurofeedback (alpha-asymmetry and fMRI protocols) and biofeedback (HRVB) for depressive disorders as level 4 - efficacious in Evidence-Based Practice in
Biofeedback and Neurofeedback (3rd ed.).
Update: Several independent RCTs warrant a level 5 - efficacious and specific rating for biofeedback and neurofeedback interventions for depression.
The biofeedback studies
(House, 1978; Walsh & Gerley, 1985; Weise et al., 2008) provided surface EMG and finger temperature biofeedback. The neurofeedback studies (Crocetti, Forti, & Del Bo, 2010; Dohrmann, Elbert, Schlee, & Weisz, 2007) provided feedback to modify power in the delta and tau bands of the EEG and to down-regulate real-time functional MRI (rtfMRI) activity in cortical auditory processing regions.
Clinical Efficacy
Shaffer and Mannion (2016) rated biofeedback for tinnitus as level 3 - probably efficacious and neurofeedback for tinnitus as level 2 - possibly efficacious in Evidence-Based Practice in
Biofeedback and Neurofeedback (3rd ed.). These ratings were limited by the reliance of many of the reviewed studies on a single-group pre-test/post-test design, which precluded drawing causal conclusions.
HOW CLINICAL PRESENTATION MAY AFFECT THE EEG
Glossary
50/60 Hz: external artifacts transmitted by nearby electrical sources.
acetylcholine: an amine neurotransmitter that binds to nicotinic and muscarinic
ACh receptors.
acetylcholine esterase (AChE): the enzyme that deactivates ACh.
AChE-R: an abnormal form of acetylcholine esterase (AChE), which may render
dendrites with acetylcholine receptors more excitable when stressed.
action potential: a propagated electrical signal that usually starts at a neuron’s
axon hillock and travels to presynaptic axon terminals.
active electrode: an electrode placed
over a site that is a known EEG generator like Cz.
adenylate cyclase: at a metabotropic receptor, an enzyme that transforms ATP
into the second messenger cyclic AMP.
afferent: a neuron that transmits sensory information towards the central
nervous system, or from one region to another.
all-or-none law: once an action potential is triggered in an axon, it is
propagated, without decrement, to the end of the axon. The amplitude of the action potential is unrelated to the
intensity of the stimulus that triggers it.
alpha-blocking: the replacement of the alpha rhythm by low-amplitude
desynchronized beta activity during movement, attention, mental effort
like complex
problem-solving, and visual processing.
alpha rhythm: 8-12-Hz activity that depends on the interaction between rhythmic burst firing by a subset of thalamocortical (TC) neurons linked by gap junctions and rhythmic inhibition by widely distributed reticular nucleus neurons. Researchers have correlated the alpha rhythm with "relaxed wakefulness." Alpha is the dominant rhythm in adults and is located posteriorly. The alpha rhythm may be divided into alpha 1 (8-10 Hz) and alpha 2 (10-12 Hz).
alpha spindles: regular bursts of alpha activity.
amplitude: the strength of the EEG signal measured in microvolt or picowatts.
amygdala: a limbic system structure plays a crucial role in learning about the consequences of our actions and creating declarative memories for events with emotional significance.
angular gyrus: the region located near the superior temporal lobe (BA 39) and involved in reading, math, and copying writing.
anterior: near or toward the front of the head, for example, the anterior
cingulate.
anterior cingulate cortex (ACC): a division of the prefrontal cortex (Fpz, Fz, Cz, Pz) that plays a vital
role in attention and is activated during working memory. The ACC mediates emotional and physical pain and has cognitive (dorsal anterior cingulate) and affective (ventral anterior cingulate) conflict-monitoring components.
anterior commissure: a bundle of nerve fibers that crosses the midline and connects the left and right temporal lobes, hippocampus, and amygdala.
apical dendrite: a dendrite that arises from the top of the pyramid and extends
vertically to layer 1 of the neocortex.
arousal: a process that combines alertness and wakefulness, produced by at least
five neurotransmitters, including acetylcholine, histamine, hypocretin, norepinephrine, and serotonin.
artifact: false signals like 50/60Hz noise produced by line current.
asynchronous waves: neurons depolarize and hyperpolarize independently.
basal forebrain: a cholinergic network located in the ventral frontal lobe and anterior hypothalamus that influences cerebral blood flow and cognitive activity.
basal ganglia: these forebrain structures consist of an egg-shaped nucleus
that contains the putamen and globus pallidus and a tail-shaped structure called the caudate,
which together are responsible for the production of movement. The basal ganglia have also been implicated in
obsessive-compulsive disorder, Parkinson’s disease, and Huntington’s chorea.
beta rhythm: 12-38-Hz activity associated with arousal and attention generated by brainstem mesencephalic reticular stimulation that depolarizes neurons in both the thalamus and cortex. The beta rhythm can be divided into multiple ranges: beta 1 (12-15 Hz), beta 2 (15-18 Hz), beta 3 (18-25 Hz), and beta 4 (25-38 Hz).
channel: an EEG amplifier output that is the result of scalp electrical activity from three electrode/sensor connections to the scalp.
cell body or soma: contains machinery for cell life processes and receives and integrates EPSPs and IPSPs from axons generated by axosomatic synapses (junctions between axons and somas). The cell body of a typical neuron is 20 μm in diameter, and its spherical nucleus, which contains
chromosomes comprised of DNA, is 5-10 μm across.
central nervous system (CNS): the division of the nervous system that includes the brain, spinal cord, and retina.
classical routes for EEG activation: specific sensory pathways like the visual
(retina to the visual cortex), auditory (cochlea to the auditory cortex), and somatosensory (chemoreceptors and
mechanoreceptors to the somatosensory cortex) systems. Increased transmission of information through these
pathways desynchronizes EEG activity in the cortical regions to which these afferent neurons project, as
specialized circuits of neurons independently process this information.
coherence: the degree of coupling between separate cortical regions and reflects neural network connectivity and dynamics. Coherence evaluates the linear association or correlation between the EEG waveforms recording from two different scalp locations (two referential montages).
co-modulation: the degree of association in the magnitude of signals detected from two different sources (sites). Co-modulation, which can be measured using the Pearson Product-Moment Correlation Coefficient, shows the degree to which signals strengthen and weak in a correlated manner.
connectivity: the degree of synchrony between the oscillations of specialized brain regions (nodes) within a network.
contingent negative variation (CNV): a steady, negative shift in potential (15
μV in young adults) detected at the vertex. This slow cortical potential may reflect expectancy,
motivation, intention to act, or attention. The CNV appears 200-400 ms after a warning signal (S1), peaks within
400-900 ms, and sharply declines after a second stimulus that requires the performance of a response (S2).
corticothalamic network: a unified network that generates diverse types of brain
rhythms grouped by slow cortical oscillations.
delta rhythm: 0.05-3-Hz oscillationsgenerated by thalamocortical neurons during stage-3 sleep.
depolarize: to make the membrane potential more positive by making the inside
of the neuron more positive with respect to its outside.
derivation: the assignment of two electrodes to an amplifier's inputs 1 and 2.
desynchronization: the absence or loss of coordinated neuronal firing and synchronization of brain waves.
desynchrony: pools of neurons fire independently due to stimulation of specific sensory pathways up to the midbrain and high-frequency stimulation of the reticular formation and nonspecific thalamic projection nuclei.
differential amplifier (balanced amplifier): a device that boosts the difference between two inputs: the active (input 1) and reference (input 2).
dipole: the electrical field generated between the sink (where current enters the neuron) and the source (place at the other end of the neuron where current leaves) may be located anywhere along the dendrite.
EEG activity: a single wave or successive waves.
EEG artifacts: noncerebral electrical activity in an EEG recording can be divided into physiological and exogenous artifacts.
EEG power: the signal energy in the EEG spectrum. Most EEG power falls
within the 0-20 Hz frequency range. EEG power is measured in microvolts or picowatts.
electrode: a specialized conductor that converts biological signals
like the EEG into currents of electrons.
electroencephalogram (EEG): the voltage difference between at least two
electrodes, where at least one electrode is located on the scalp or inside the brain. The EEG is a recording of
both EPSPs and IPSPs that occur primarily in dendrites in pyramidal cells located in macrocolumns, several mm in
diameter, in the upper cortical layers.
excitatory postsynaptic potential (EPSP): a brief positive shift in a
postsynaptic neuron's potential produced when neurotransmitters bind to receptors and cause positive
sodium ions to enter the cell. An EPSP pushes the neuron towards the excitation threshold when it can initiate
an action potential.
extracellular dipole layers: macrocolumns of pyramidal cells, which lie
parallel to the surface of the cortex, send opposite charges towards the surface and the deepest of the 5-7 layers
of cortical neurons.
facultative pacemaker theory: Anderson and Anderson's (1968) theory that thalamic neurons activate cortical neurons and thalamic inhibitory interneurons via recurrent collaterals.
fast cortical potentials: EEG rhythms that range from 0.5 Hz-100 Hz. The main
frequency ranges include delta, theta, alpha, sensorimotor rhythm, and beta.
frequency (Hz): the number of complete cycles that an AC signal
completes in a second, usually expressed in hertz.
frequency synchrony: when identical EEG frequencies are detected at two or
more electrode sites. For example, 12 Hz may be simultaneously detected at O1-A1 and O2-A2.
gamma rhythms: a 28-80 Hz rhythm that includes the 38-42 Hz Sheer rhythm and is associated with learning and problem-solving, meditation, mental acuity, and peak brain function in children and adults.
global loops: cortical macrocolumns separated by as much as 7 cm and receive shared input fire synchronously to generate delta and theta rhythms.
gray matter: brain tissue that looks grayish brown and comprises cell
bodies, dendrites, unmyelinated axons, glial cells, and capillaries.
ground electrode: a sensor placed on an earlobe, mastoid bone, or the scalp that is grounded to the amplifier.
hertz (Hz): unit of frequency measured in cycles per second.
high alpha (alpha 2): 10-12-Hz alpha associated with open awareness.
high beta (beta 4): 25-38-Hz activity mostly seen in the frontal lobes and is associated with hyper-perfusion and increased glucose metabolism. High or fast beta activity may be related to peak performance and cognitive processing and related to specificity and precision in information processing. Excessive high beta is associated with alcoholism, anxiety, OCD, rumination, and worry.
high-frequency filter (HFF): a filter that attenuates frequencies above a cutoff frequency.
hubs: highly centralized nodes through which other node pairs communicate;
hubs allow efficient communication.
hyper-coherence: excessive coupling due to a failure to selectively activate cortical regions. Hyper-coherence may interfere with multitasking and rapid decision-making.
hyperpolarize: a negative shift in membrane potential (the inside becomes more
negative with respect to the outside) due to the loss of positive ions or gain of negative ions.
hypnogogic hypersynchrony: the abrupt appearance of low-amplitude spikes that resembles epileptiform activity in an otherwise normal record.
hypo-coherence: deficient coupling due to a breakdown in communication between regions that should generally communicate with each other. Hypo-coherence often results from traumatic brain injuries.
impedance (Z): the complex opposition to an AC signal measured in
Kohms.
impedance meter: device that uses an AC signal to measure
impedance in an electric circuit, such as between active and reference
electrodes.
impedance test: automated or manual measurement of skin-electrode impedance.
inion: the bony prominence on the back of the skull.
International 10-10 system: a modified combinatorial system for electrode placement that expands the
10-20 system to 75 electrode sites to increase EEG spatial resolution and improve detection of localized evoked
potentials.
International 10-20 system: a standardized procedure for placing 21
recording and one ground electrode on adults.
kappa rhythm: bursts of alpha or theta and is detected over the temporal lobes
of subjects during cognitive activity.
lambda waves: saw-toothed transient waves from 20-50 mV in amplitude and
100-250 ms in duration detected over the occipital cortex during wakefulness. These positive deflections are
time-locked to saccadic movements and observed during visual scanning, as during reading.
Layers I-III: cortical layers that receive corticocortical afferent fibers
that connect the left and right hemispheres.
Layer III: the cortical layer that is the primary source of efferent
corticocortical fibers.
Layer IV: the cortical layer that is the primary destination of
thalamocortical afferents and intra-hemispheric corticocortical afferents.
Layer V: the cortical layer that is the primary origin of efferent fibers that
target subcortical structures that have motor functions.
Layer VI: the cortical layer that projects cortico-thalamic efferent fibers to
the thalamus, which, together with the thalamocortical afferents, creates a dynamic and reciprocal relationship
between these two structures.
local loops: neighboring cortical macrocolumns that share input generate frequencies above 30 Hz in the high-beta and gamma ranges.
local synchrony: synchrony that occurs when the coordinated firing of cortical neurons produces high-amplitude EEG signals.
locus coeruleus system: the noradrenergic branch of the ascending reticular activating system that projects to the thalamus, limbic system, and cerebral cortex, and contributes to wakefulness and vigilance for salient stimuli. Subnormal norepinephrine transmission may contribute to ADHD.
low alpha (alpha 1): 8-10-Hz alpha below a client's peak alpha frequency when eyes are closed.
macrocolumns: circuits of cortical pyramidal neurons several millimeters in diameter
that create extracellular dipole layers parallel to the surface of the cortex, that send opposite charges towards
the surface and the deepest of the 5-7 layers of cortical neurons. Since the pyramidal neurons are all
aligned with the cortical surface, the postsynaptic potentials at cells within the same macrocolumn add together
because they have the same positive or negative charge. The macrocolumns fire synchronously.
mastoid bone: the bony prominence behind the ear.
microvolt (μV): the unit of amplitude
(signal strength) that is one-millionth of a volt.
module: a set of interconnected nodes in a neural network.
monopolar recording: a recording method that uses one active and
one reference electrode.
montage: a grouping of electrodes (combining derivations) to record EEG activity.
motor unit: an alpha motor neuron and the skeletal muscle fibers
it innervates.
mu rhythm: 7-11-Hz waves resemble wickets and appear as several-second trains over central or centroparietal sites (C3 and C4).
nasion: the depression at the bridge of the nose.
neural network: a system of interconnected ensembles of neurons that collaborate to achieve a goal. These networks communicate and perform functions via hub- or node-based communication systems.
node: a vertex within a neural network.
notch filter: a filter that suppresses a narrow band of frequencies, such as those produce by line current at 50/60Hz.
ohm (Ω): the unit of impedance or resistance.
phase: the degree to which the peaks and valleys of EEG waveforms
coincide. Phase measures the time shift between EEG activity in two brain regions.
phase reset: a sudden change in phase difference (phase shift duration or SD) followed by a period of phase locking (lock duration or LD). PR = SD + LDs.
phase synchrony: synchrony when identical EEG frequencies are detected at two
or more electrode sites, and the peaks and valleys of the EEG waveforms coincide. This is also called global
synchrony. For example, EEG training may produce phase-synchronous 12-Hz alpha waves at O1-A1 and O2-A2.
posterior dominant rhythm (PDR): the highest-amplitude frequency detected at the posterior scalp when eyes are closed.
preauricular point: the slight depression located in front of the ear and above the earlobe.
Quantitative EEG (qEEG): digitized statistical brain mapping
using at least a 19-channel montage to measure EEG amplitude within
specific frequency bins.
raphe system: the midline network of cell bodies within the brainstem and midbrain that may influence alertness and vigilance through reciprocal connections with the suprachiasmatic nucleus of the hypothalamus.
reference electrode: an electrode placed on the scalp, earlobe, or mastoid.
referential (monopolar) montage: the placement of one active electrode (A) on the scalp and a neutral reference (R) and ground (G) on the ear or mastoid.
regional loops: cortical macrocolumns that share input and are separated by several centimeters generate alpha and beta rhythms.
resonant loops: the synchronous firing by macrocolumns that share afferent input to generate an electrical potential.
sequential (bipolar) montage: placement of active (A) and reference (R) sensors on active scalp sites and the ground (G) to an earlobe or mastoid.
slow cortical potentials (SCPs): gradual changes in the membrane potentials of
cortical dendrites that last from 300 ms to several seconds. These potentials include the contingent negative
variation (CNV), readiness potential, movement-related potentials (MRPs), and P300 and N400 potentials. SCPs
modulate the firing rate of cortical pyramidal neurons by exciting or inhibiting their apical dendrites. They
group the classical EEG rhythms using these synchronizing mechanisms.
synchronous: adverb meaning that groups of neurons depolarize and
hyperpolarize simultaneously.
synchronous "alpha": network-wide "alpha" that integrates perception and facilitates action. This distributed activity appears to block localized alpha-like patterns such as mu and the posterior rhythm in favor of more broadly distributed network integration.
synchrony: the coordinated firing of pools of neurons. EEG signals can display
local synchrony, frequency synchrony, and phase synchrony.
thalamus: the forebrain structure above the hypothalamus that consists of specialized nuclei that process and relay data to and from the telencephalon (cerebral cortex, basal ganglia, and limbic system). The thalamus analyzes all sensory data except olfaction before distributing this information to the cortex via thalamocortical afferent fibers. The thalamus contributes to SCPs, delta, theta, alpha, SMR activity, and beta-gamma activity.
theta rhythm: 4-8-Hz rhythms generated a cholinergic septohippocampal system that receives input from the ascending reticular formation and a noncholinergic system that originates in the entorhinal cortex, which corresponds to Brodmann areas 28 and 34 at the caudal region of the temporal lobe.
tragus: the flap at the opening of the ear.
+ve: The source is the place at the other end of the neuron where the current
leaves. The source is symbolized by +ve.
-ve: A sink is where the current enters the neuron. Positive sodium ion entry into
a neuron creates an active sink, symbolized by -ve.
vertex (Cz): the intersection of imaginary lines drawn from the nasion to inion and between the two preauricular points in the International 10-10 and 10-20 systems.
vigilance system: in Sterman’s model, a system that consists of both
specific brainstem nuclei (e.g., locus coeruleus and raphe nuclei) and their diffuse connections with the
thalamus and other subcortical structures, and the cortex. Several neurotransmitter systems mediate vigilance,
including cholinergic/glutamatergic (reticular formation), noradrenergic (locus coeruleus), and serotonergic
(raphe) neurons.
TEST YOURSELF ON CLASSMARKER
Click on the ClassMarker logo below to take a 10-question exam over this entire unit.
REVIEW FLASHCARDS ON QUIZLET PLUS
Click on the Quizlet Plus logo to review our chapter flashcards.
Visit the BioSource Software Website
BioSource Software offers Functional Neuroanatomy, which reviews critical behavioral networks, and qEEG100, which provides extensive multiple-choice testing over the IQCB Blueprint.
Assignment
Now that you have completed this module, explain why low-and-balanced skin-electrode impedances are important in neurofeedback training. Describe the precautions you take to achieve acceptable impedance values. How do you measure impedance with your neurofeedback system?
Cacioppo, J. T., & Tassinary, L. G. (Eds.). (1990). Principles of
psychophysiology. Cambridge University Press.
Collura, T. F. (2014). Technical foundations of neurofeedback. Taylor & Francis.
Dahl, M. J., Mather, M., & Werkle-Bergner, M. (2022). Noradrenergic modulation of rhythmic neural activity shapes selective attention. Trends in Cognitive Sciences, 26(1), 38-52. https://doi.org/10.1016/j.tics.2021.10.009
Demos, J. N. (2019). Getting started with neurofeedback (2nd ed.). W. W. Norton & Company.
Fisch, B. J. (1999). Fisch and Spehlmann's EEG primer (3rd ed.). Elsevier.
Floyd, T. L. (1987). Electronics fundamentals: Circuits, devices, and
applications. Columbus: Merrill Publishing Company.
Grant, A. (2015). Four elements earn permanent seats on the periodic table. Science News.
Hindriks, R., & van Putten, M. J. A. M. (2013). Thalamo-cortical mechanisms underlying changes in amplitude and frequency of human alpha oscillations. NeuroImage, 70, 150-163. https://doi.org/10.1016/j.neuroimage.2012.12.018
Hugdahl, K. (1995). Psychophysiology: The mind-body perspective. Harvard University Press.
Hughes, J. R. (1994). EEG in clinical practice (2nd ed.). Butterworth-Heinemann.
Khazan, I. Z. (2019). Biofeedback and mindfulness in everyday life: Practical solutions for improving your health and performance. W. W. Norton & Company.
Izhikevich, E. M., & Edelman, G. M. (2008). Large-scale model of mammalian thalamocortical systems. Proceedings of the National Academy of Sciences of the United States of America, 105(9), 3593-3598. https://doi.org/10.1073/pnas.0712231105
Klass, D. W. (2008). The continuing challenge of artifacts in the EEG. EEG artifacts. American Society of Electroneurodiagnostic Technologists, Inc. https://doi.org/10.1080/00029238.1995.11080524
Kubala, T. (2009). Electricity 1: Devices, circuits, and materials (9th ed.). Cengage Learning.
Peek, C. J. (2016). A primer of traditional biofeedback instrumentation.
In M. S.
Schwartz, & F. Andrasik (Eds.). (2016). Biofeedback: A practitioner's guide (4th ed.).
The Guilford Press.
Picton, T. W., & Hillyard, S. A. (1972). Cephalic skin potentials in electroencephalography. Encephalogr Clin Neurophysiol, 33, 419-424. https://doi.org/10.1016/0013-4694(72)90122-8
Pfister,
H., Kaynig, V., Botha, C. P., Bruckner, S., Dercksen, V., & Hege, H.-C. (2012). Visualization in connectomics. Mathematics and Visualization, 37. https://doi.org/10.1007/978-1-4471-6497-5_21
Silberstein, R. et al. (1993) unpublished data cited in Nunez, Neocortical dynamics and human EEG rhythms. Oxford University Press.
Stern, R. M., Ray, W. J., & Quigley, K. S. (2001). Psychophysiological
recording (2nd ed.). Oxford University Press.
Thatcher, R. W. (2012). Coherence, phase differences, phase shift, and phase lock in EEG/ERP analyses. Developmental Neuropsychology, 37(6), 476-496. https://doi.org/10.1080/87565641.2011.619241
Thomas, C. (2007). What is a montage? EEG instrumentation. American Society of Electroneurodiagnostic Technologists, Inc.
Thompson, M., & Thompson, L. (2015). The biofeedback book: An
introduction to basic concepts in applied psychophysiology (2nd ed.). Association for Applied Psychophysiology and Biofeedback.


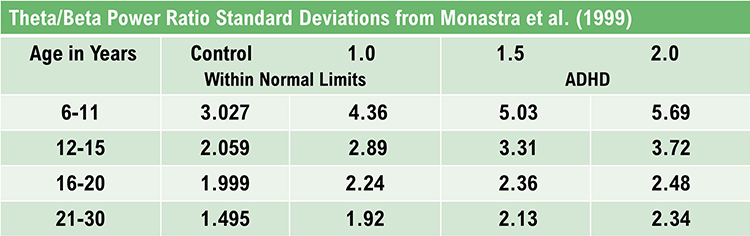
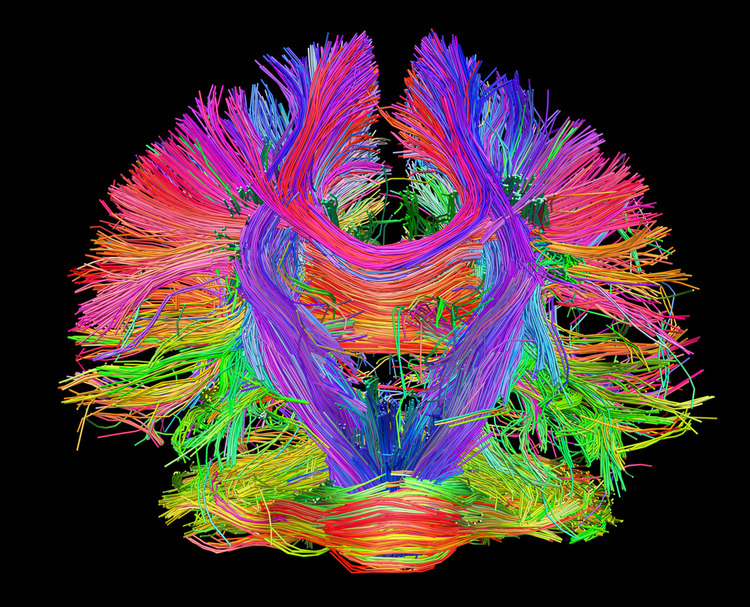
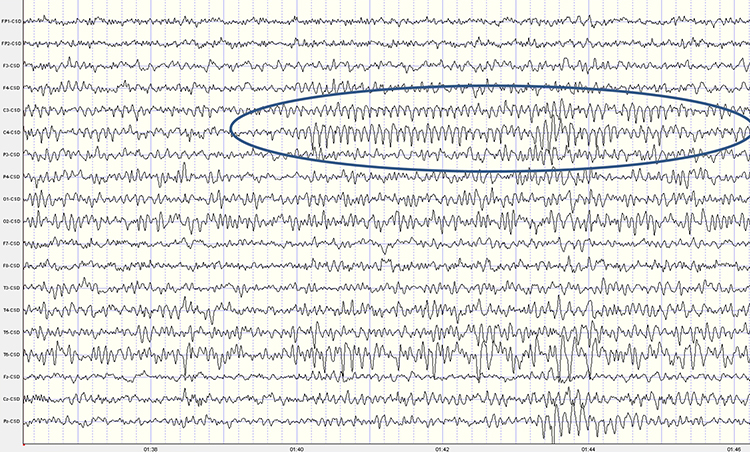
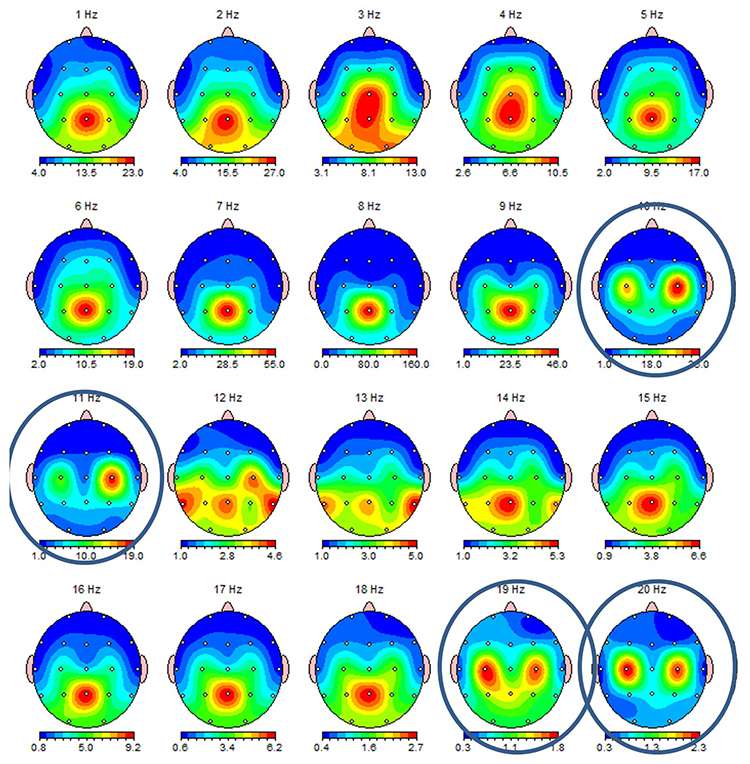
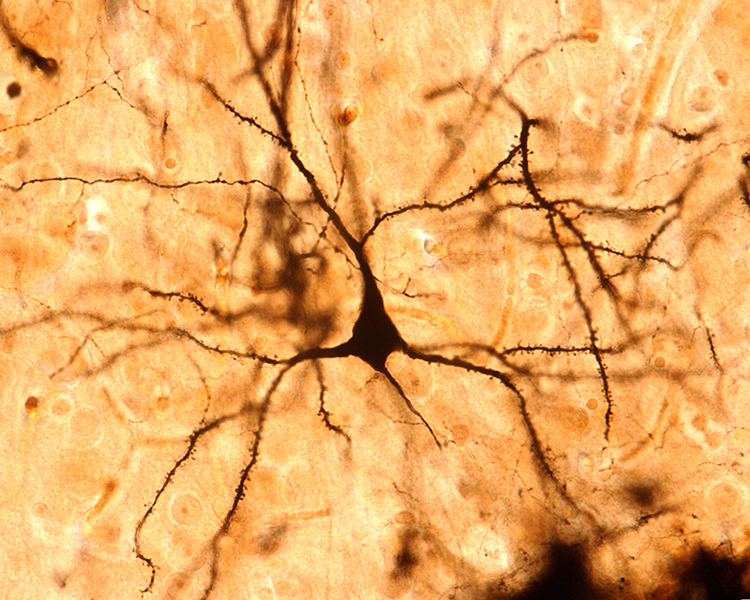
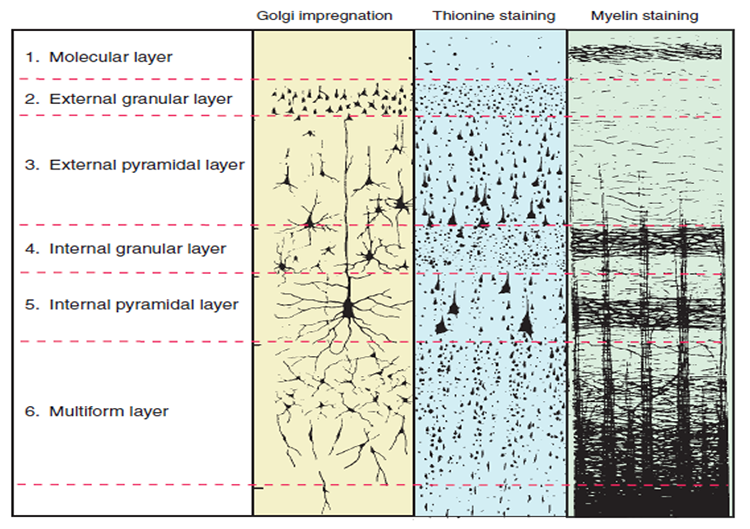
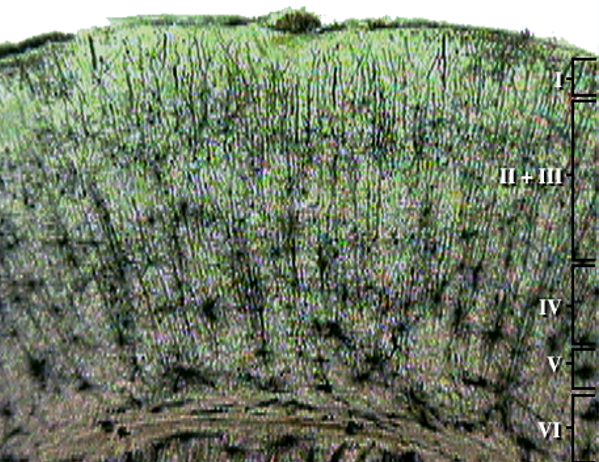
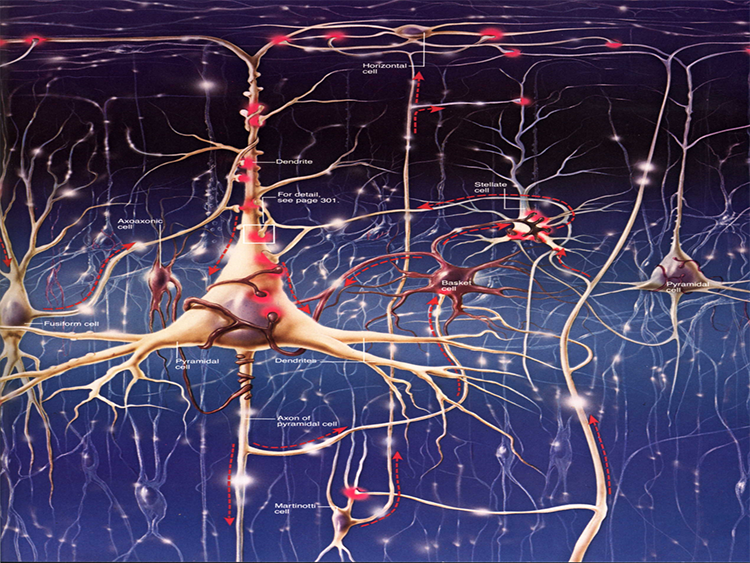
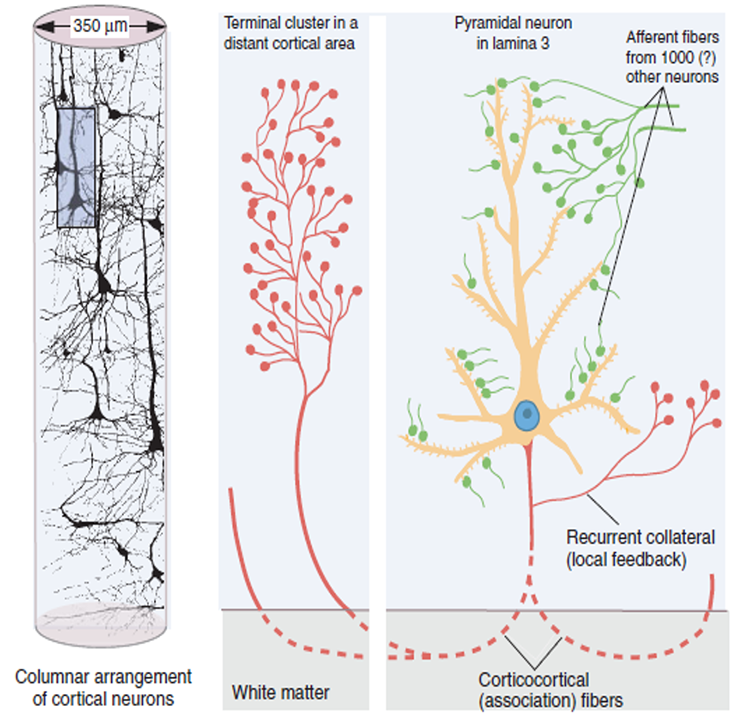
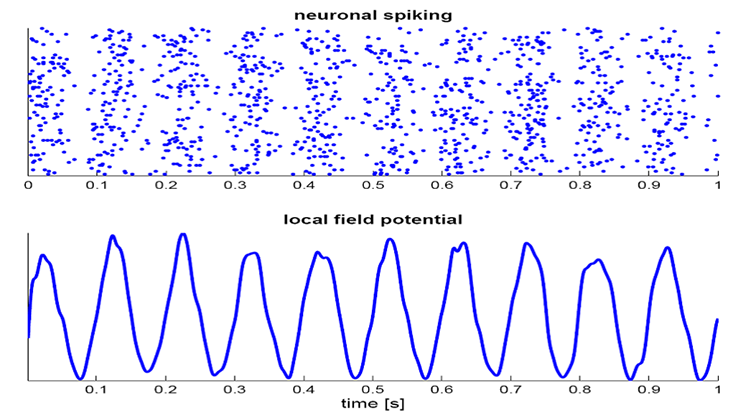
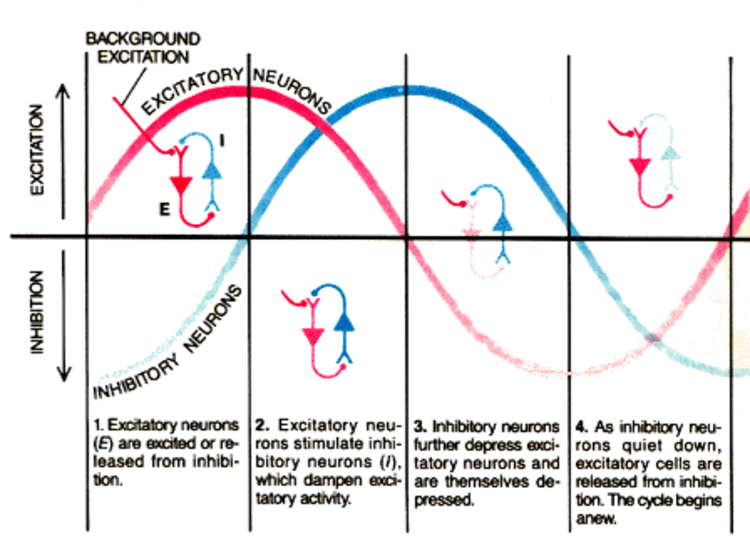
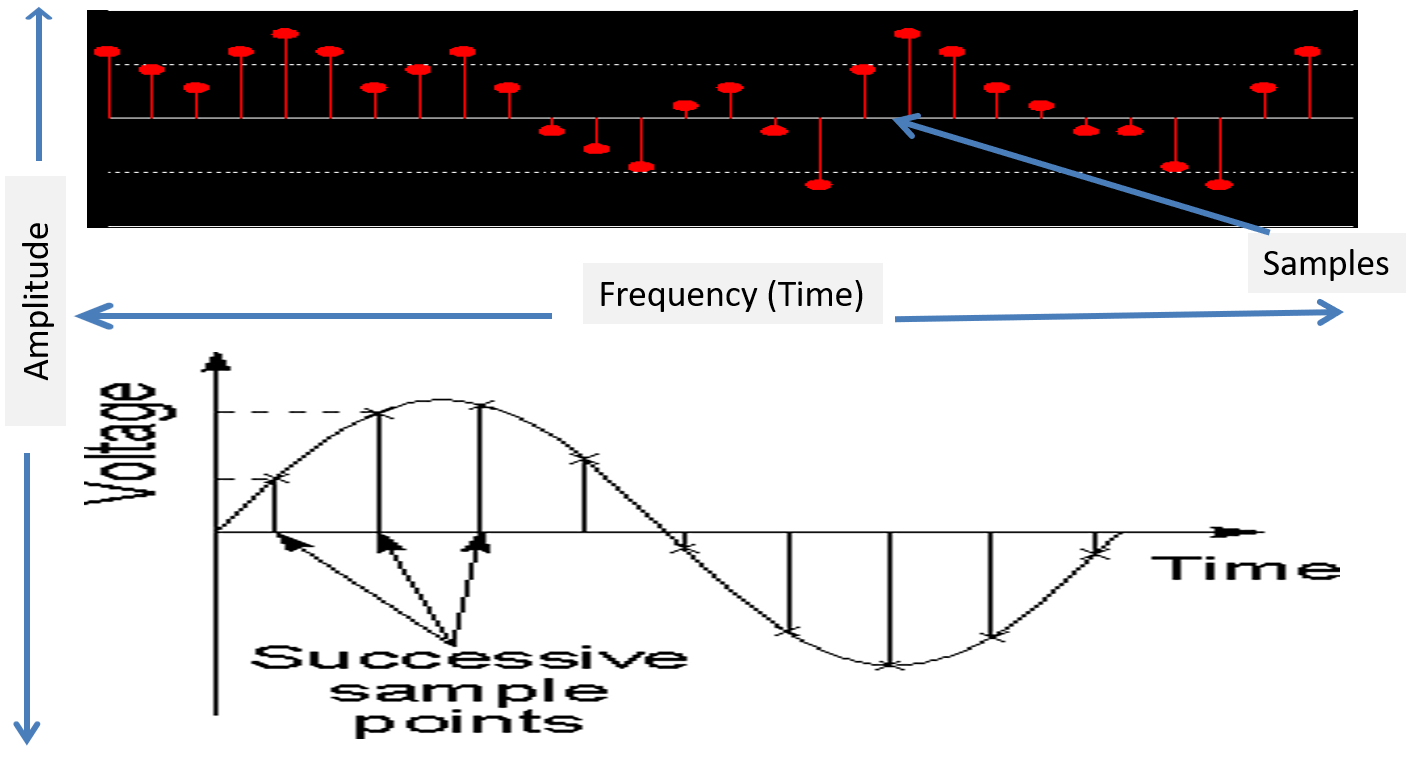
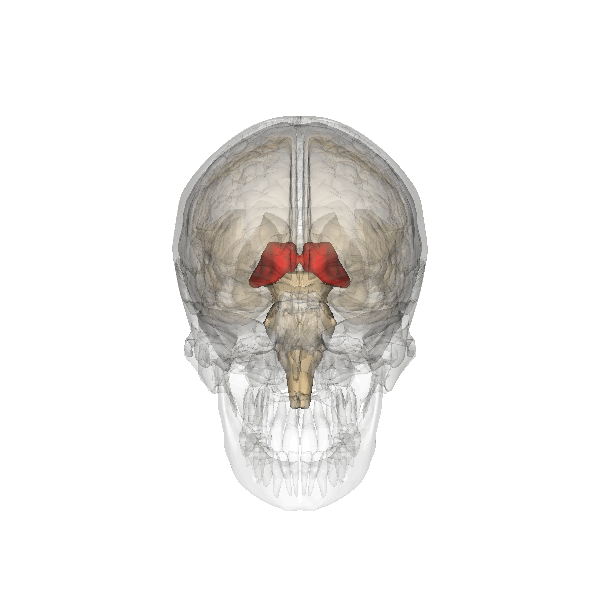
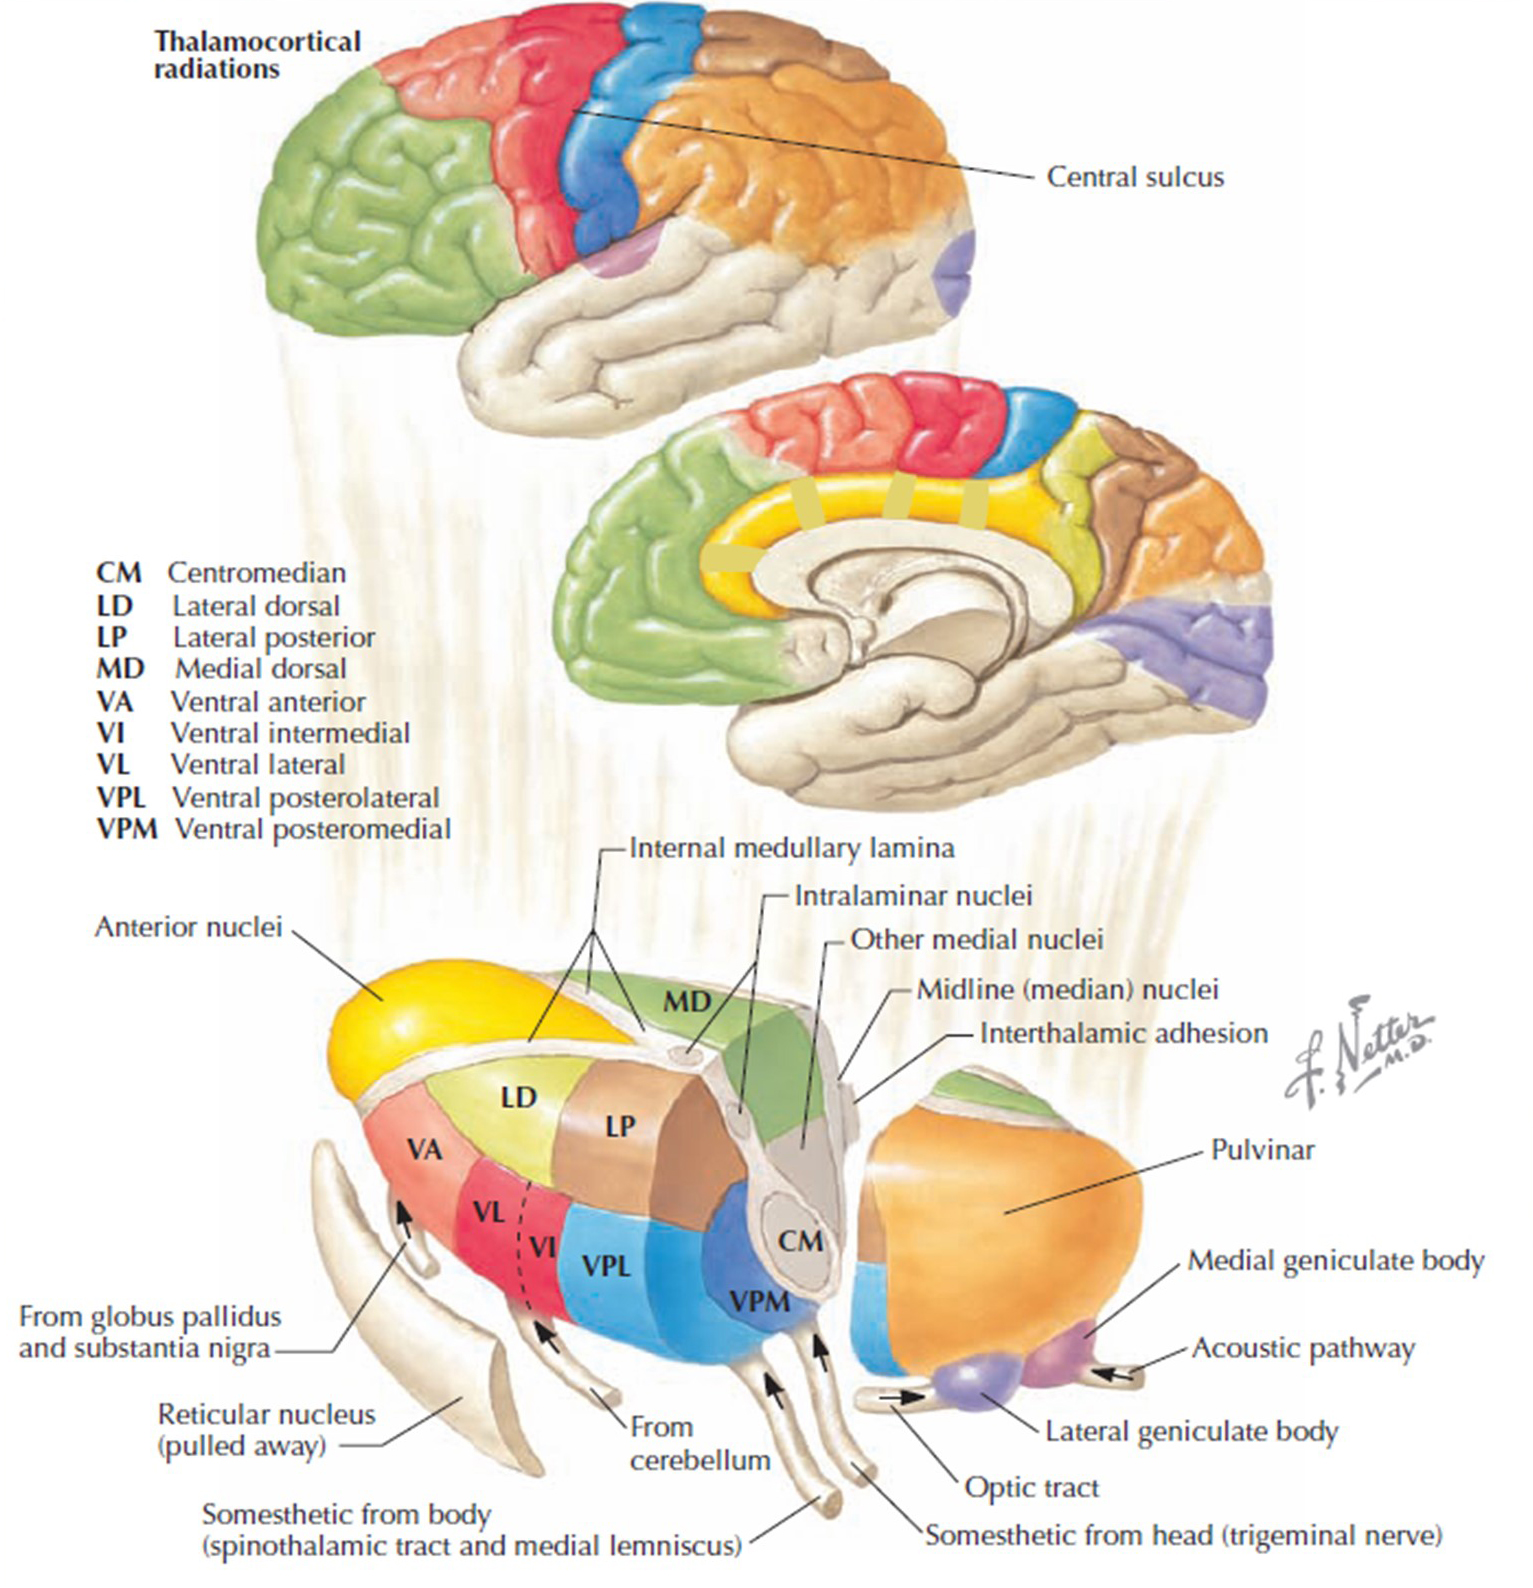
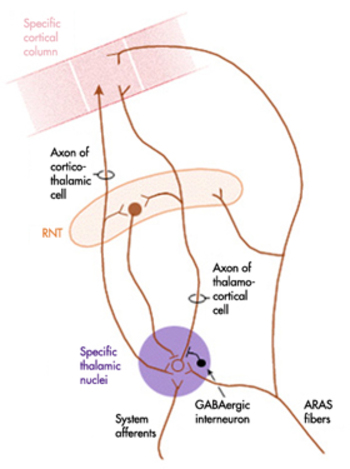
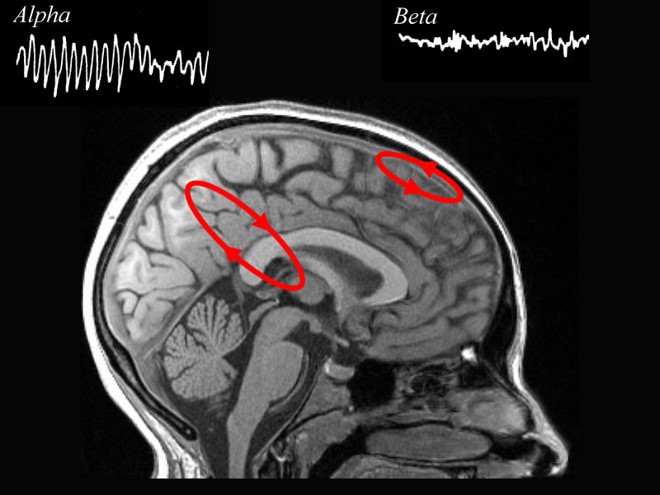
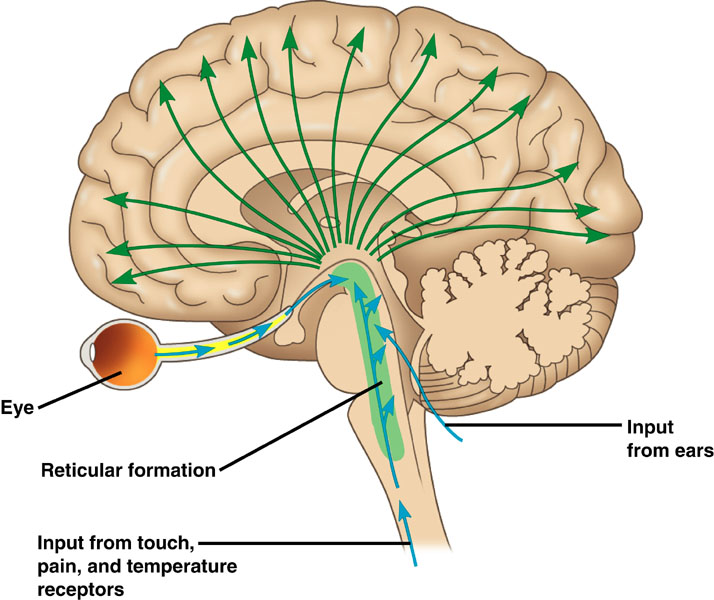
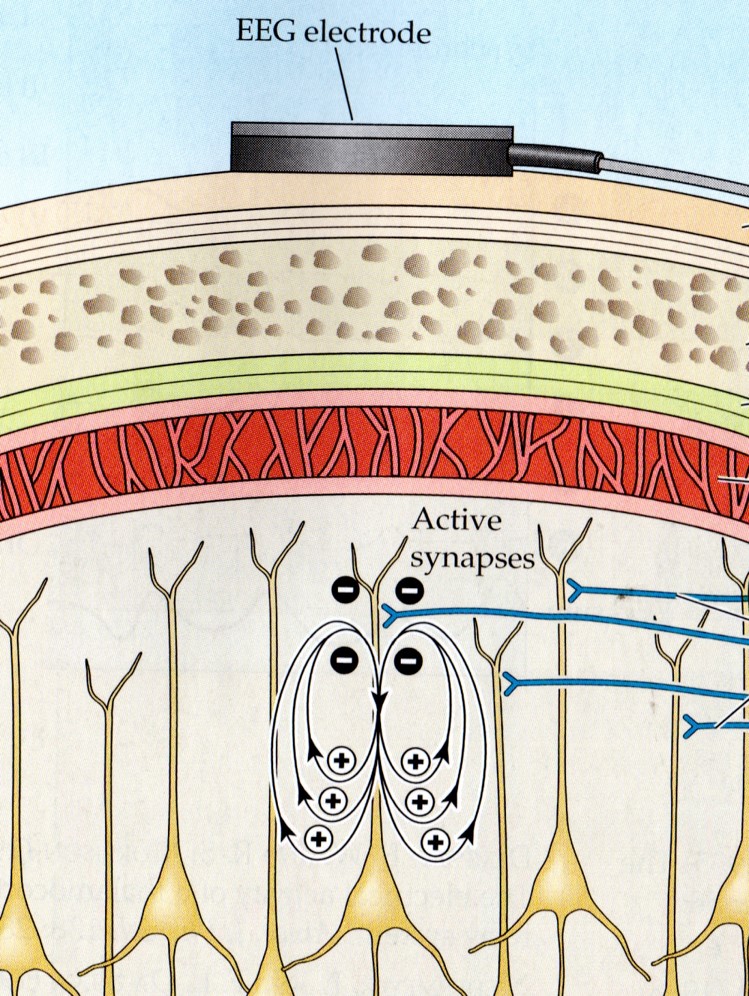
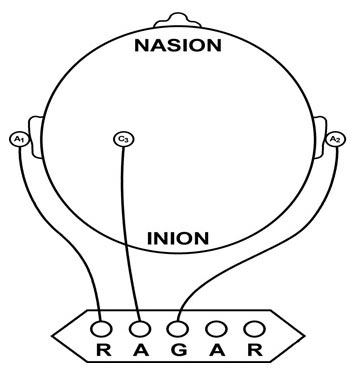

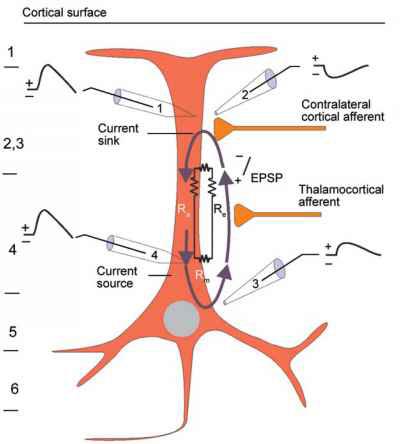
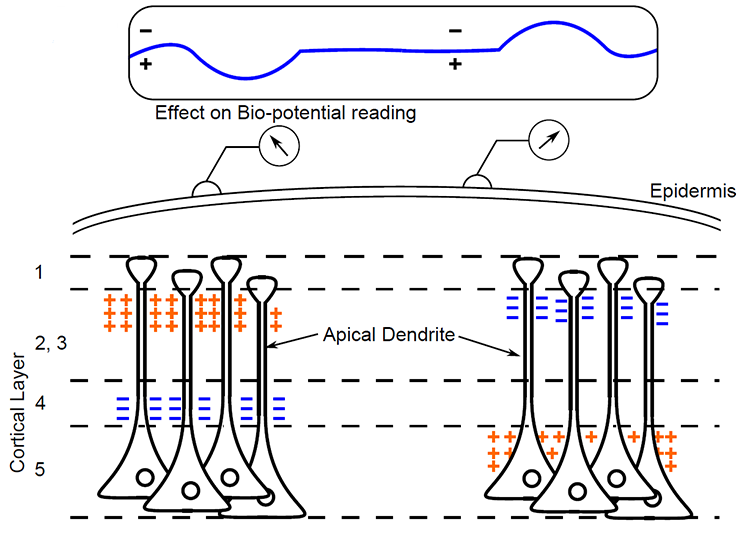
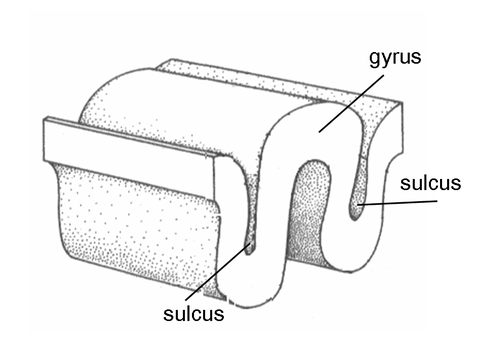
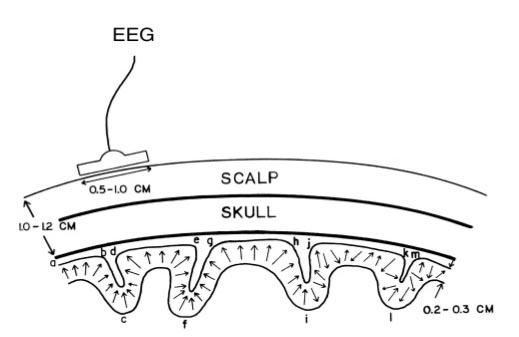
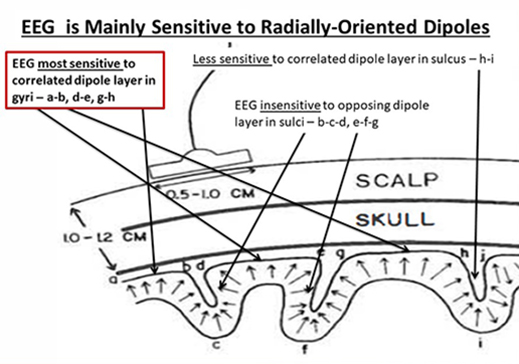
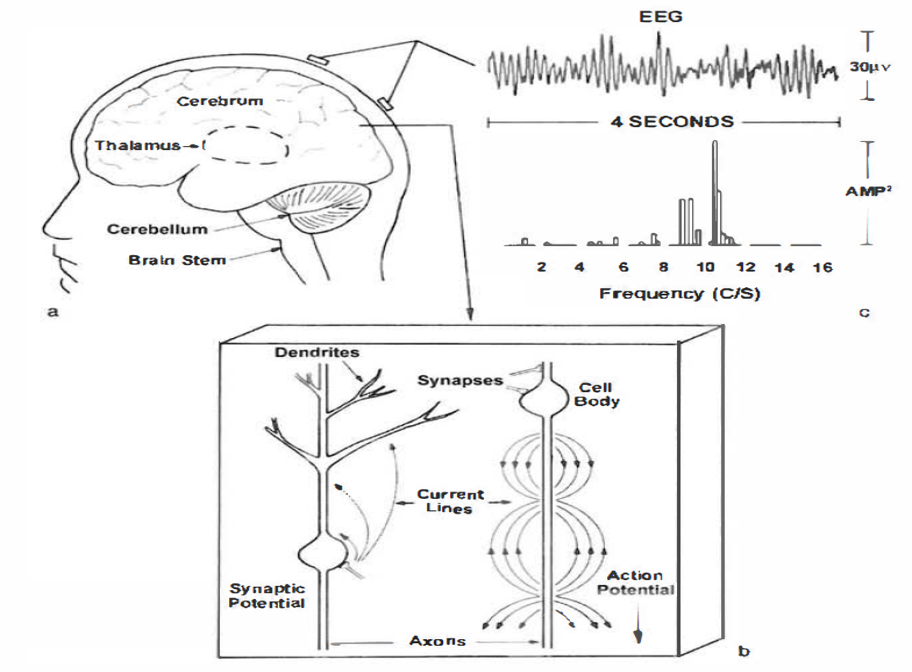
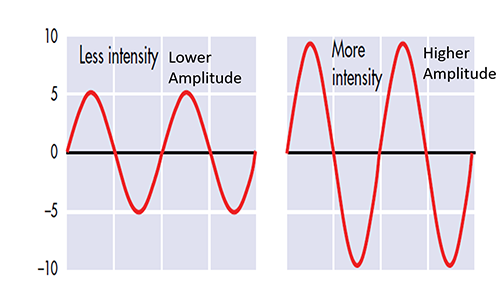
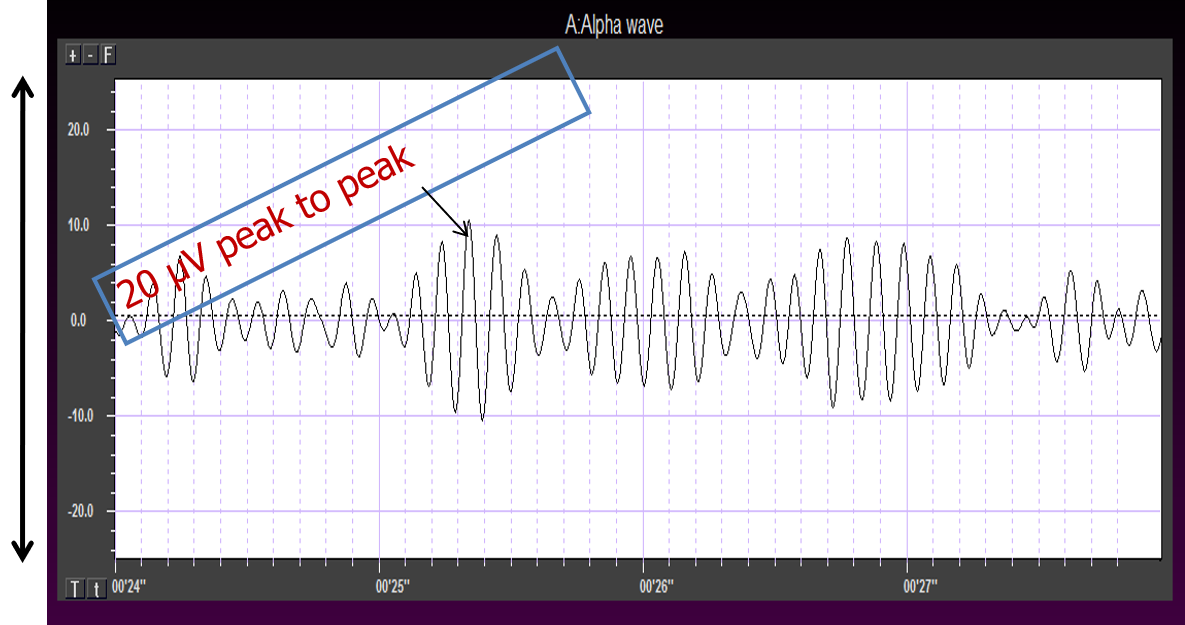
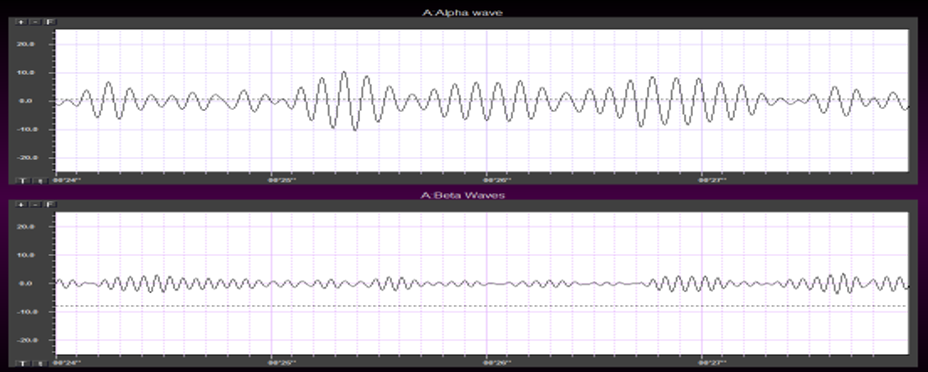
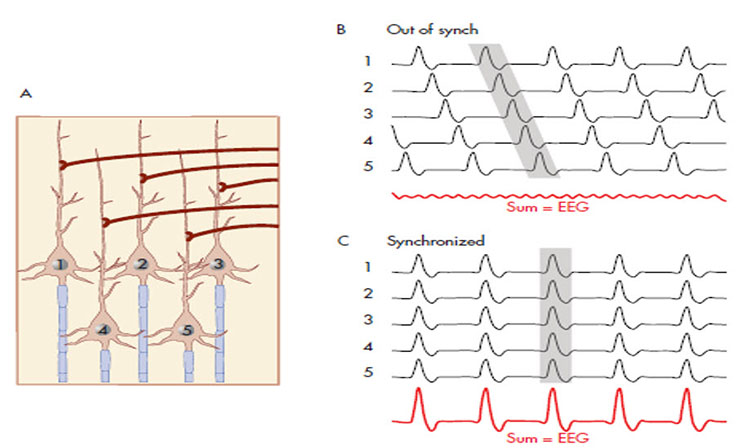
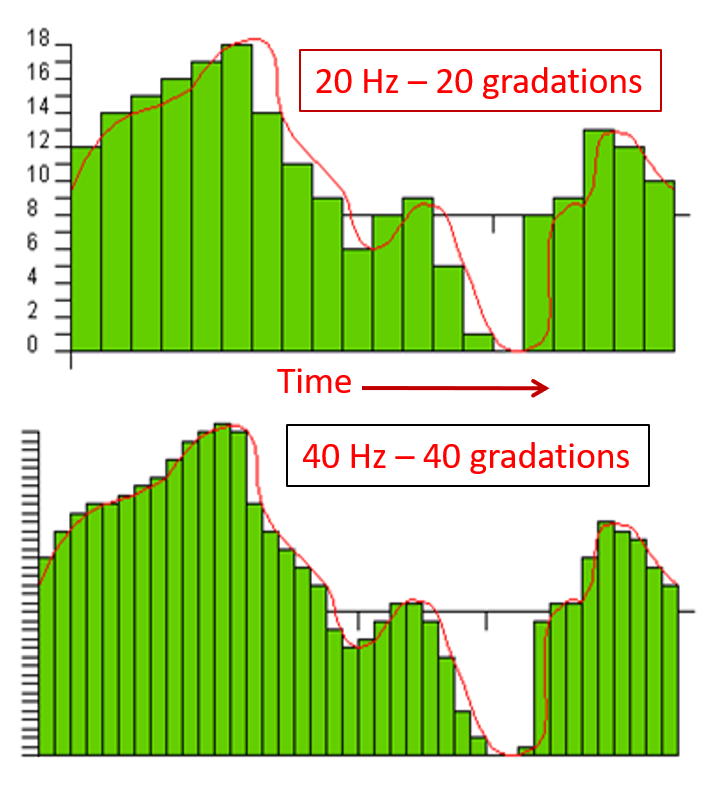
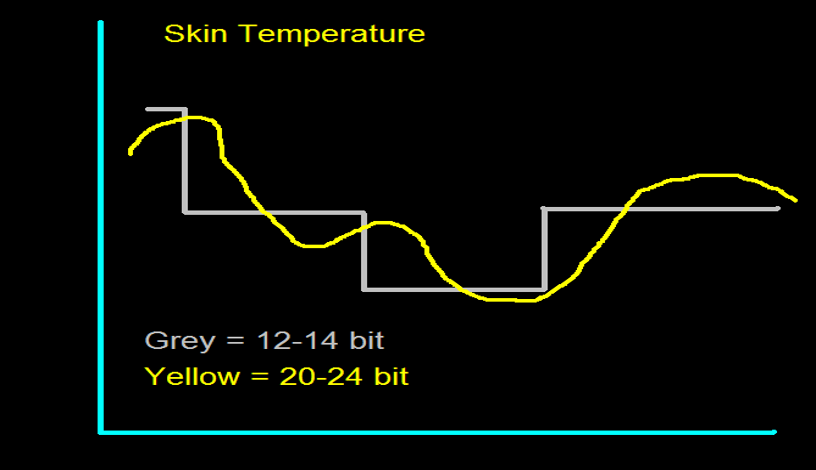

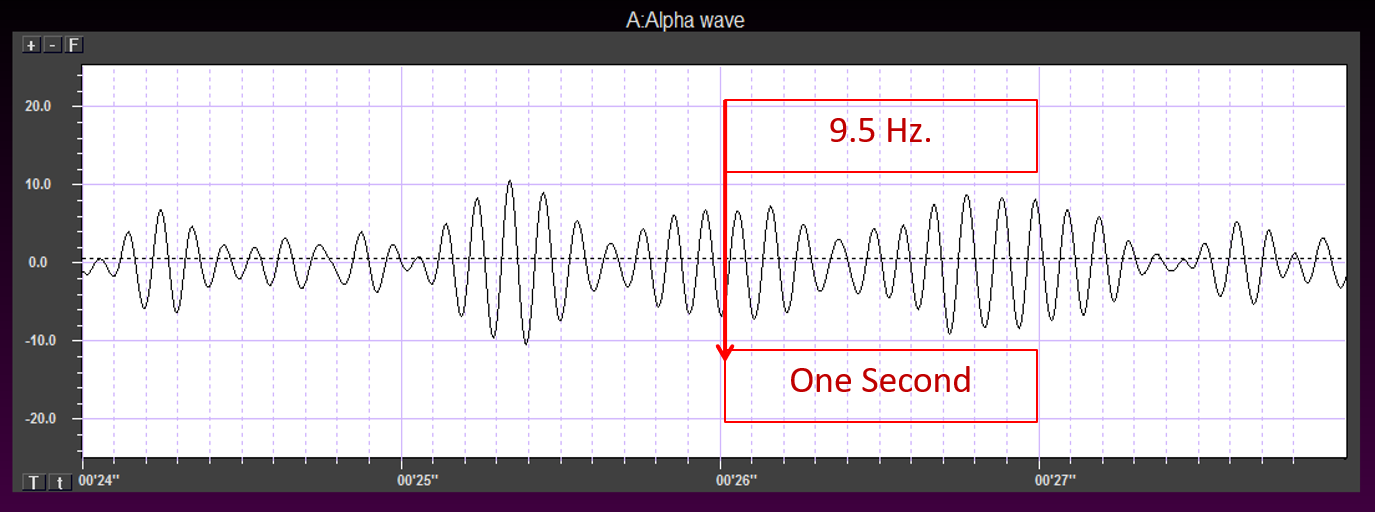
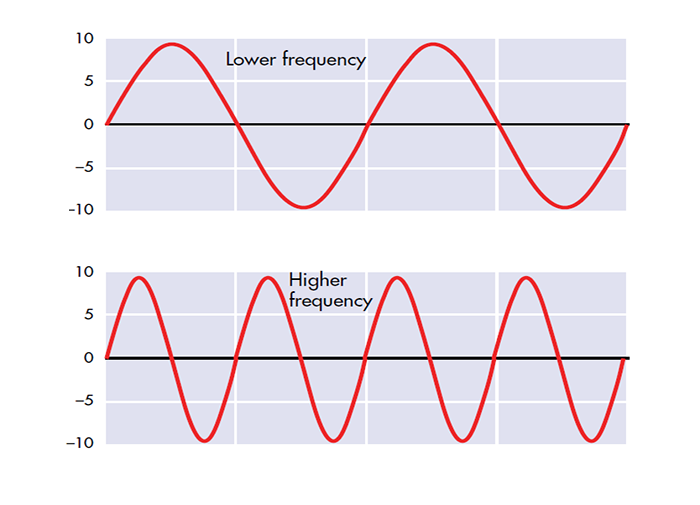
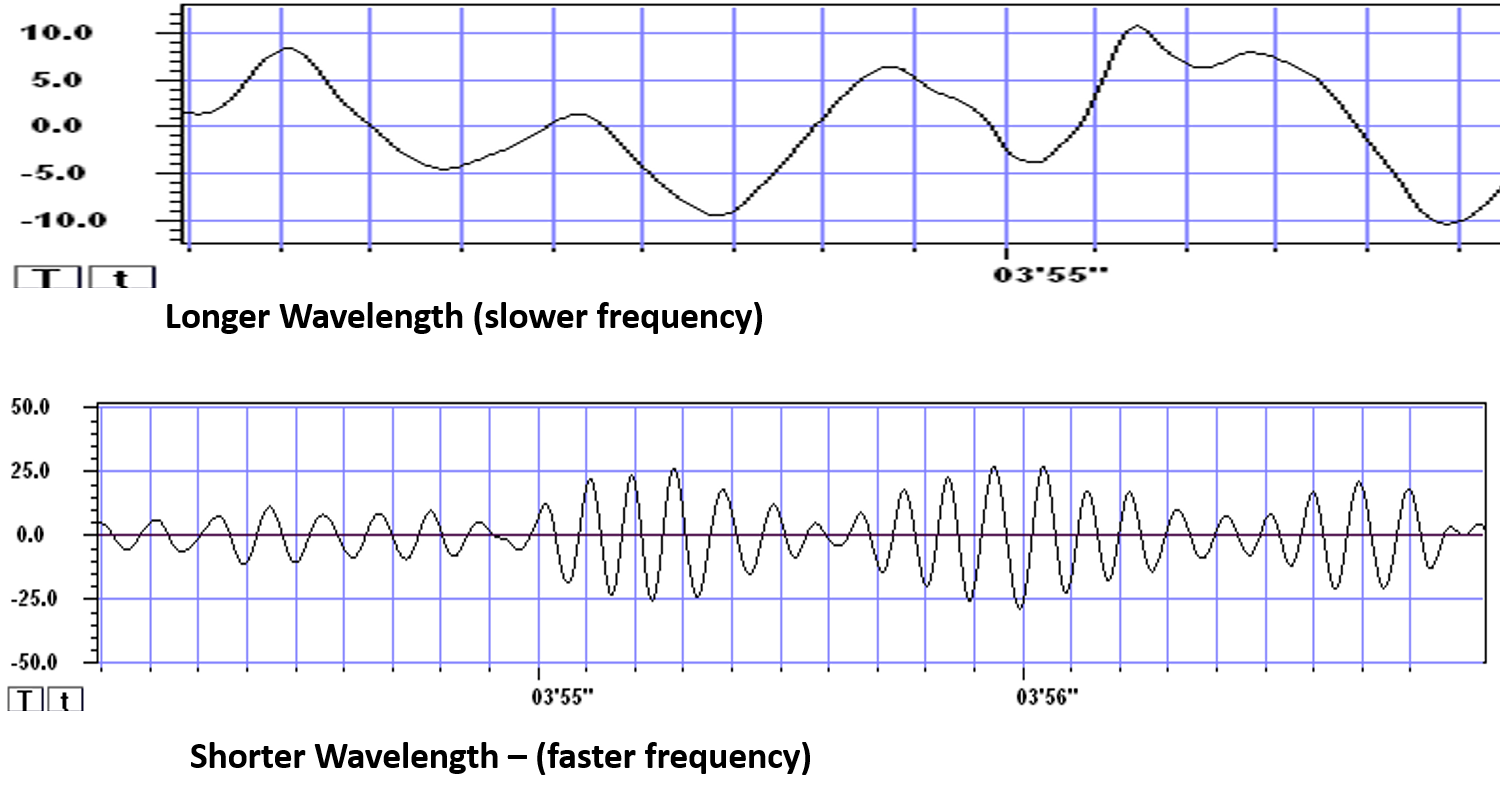
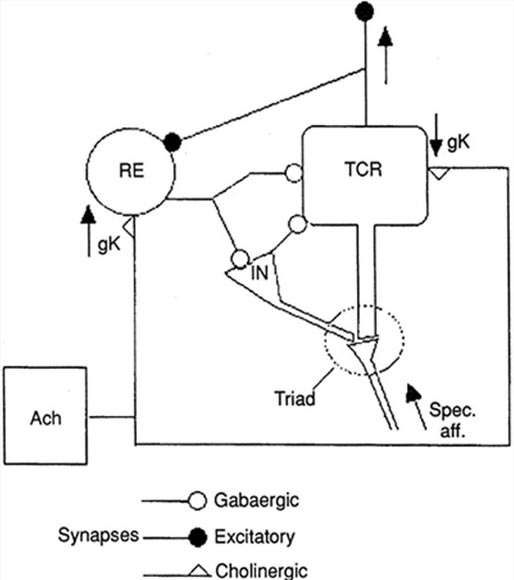
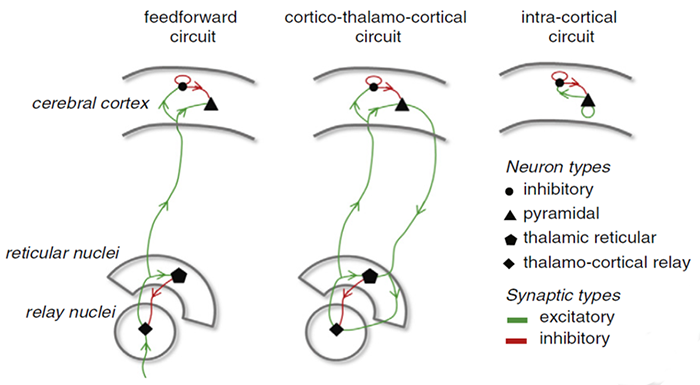
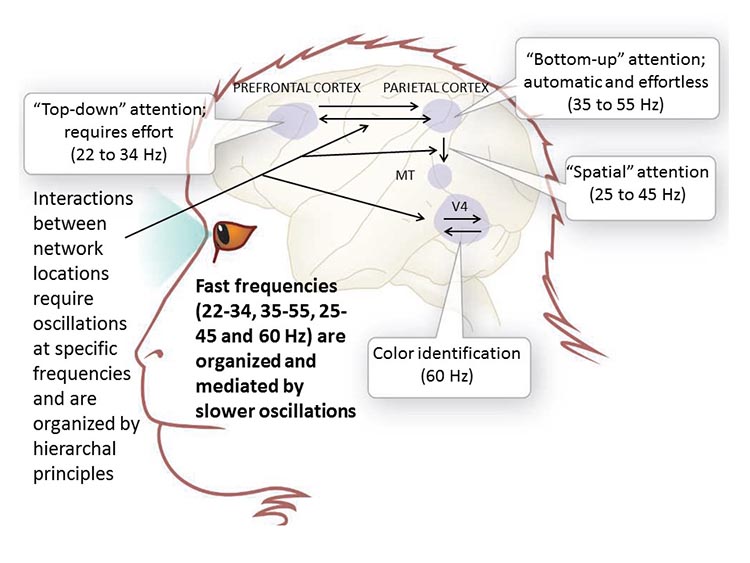
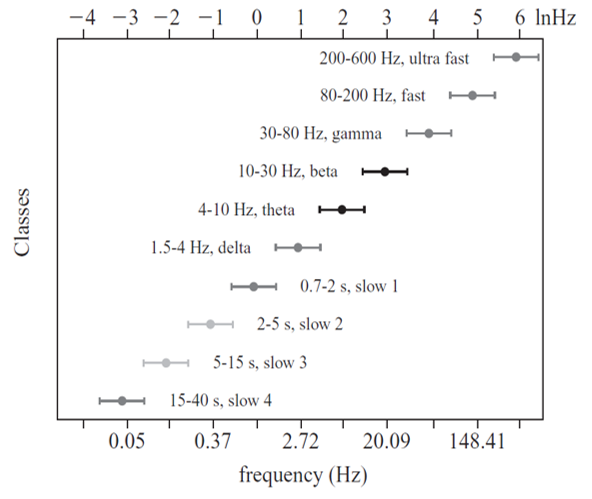
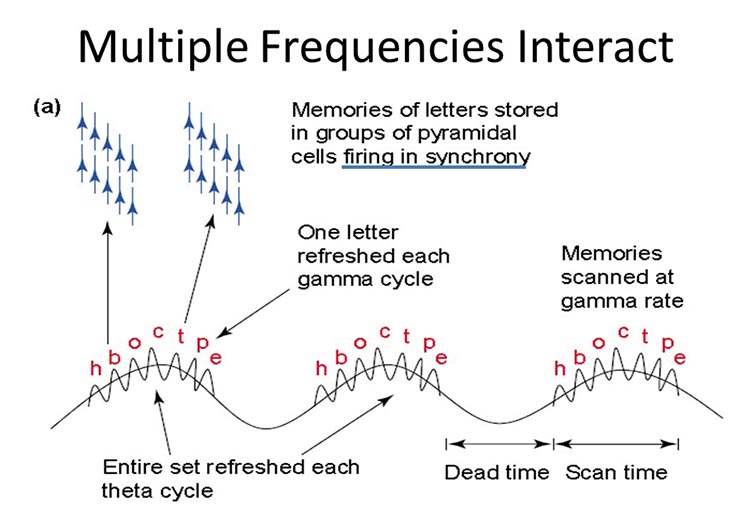
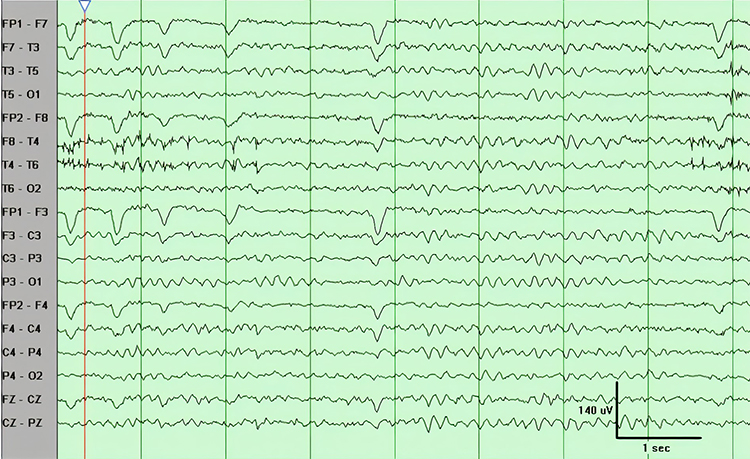
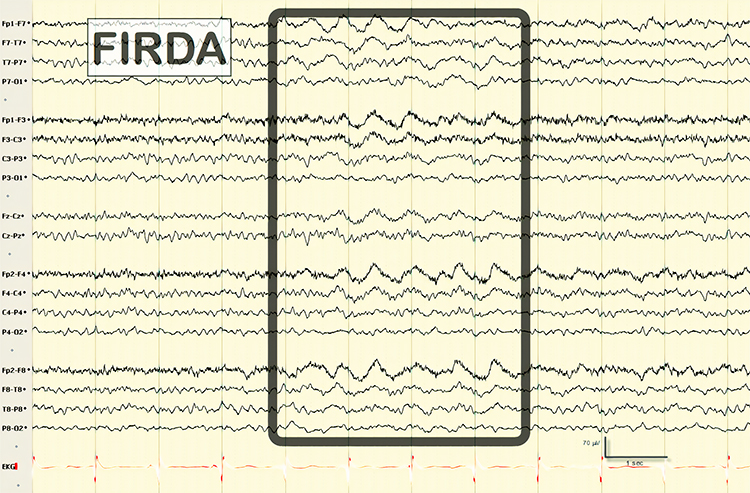
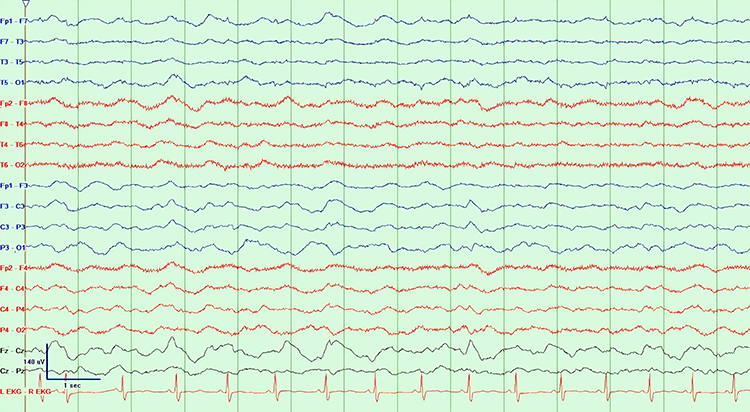
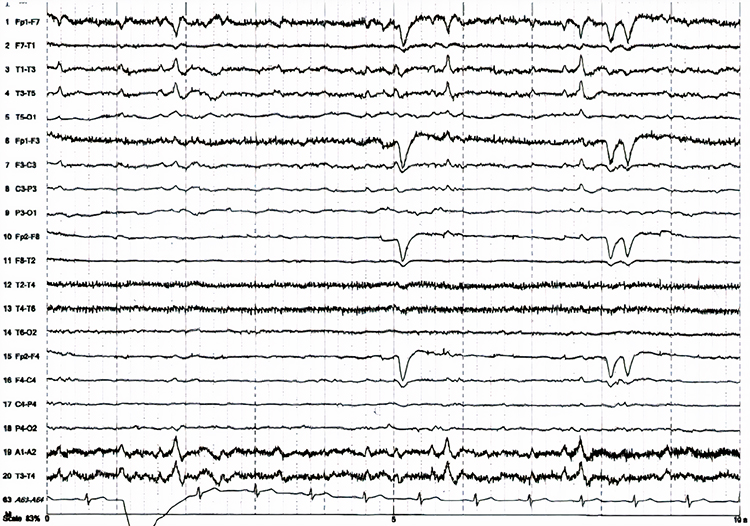
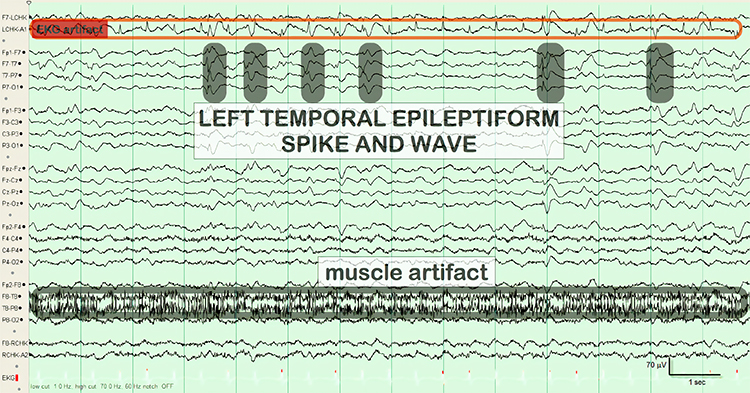
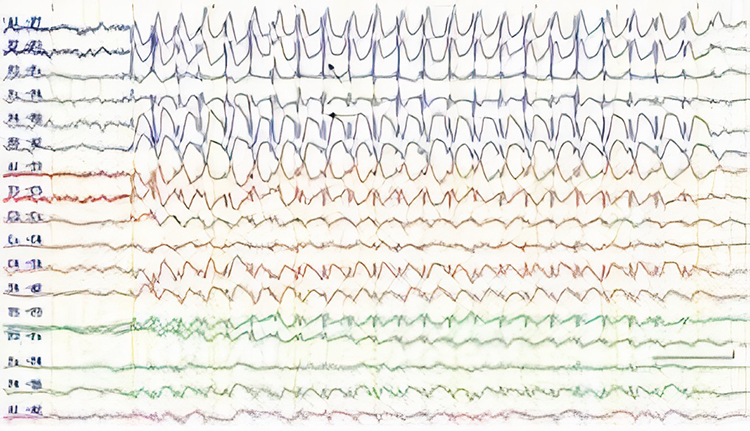
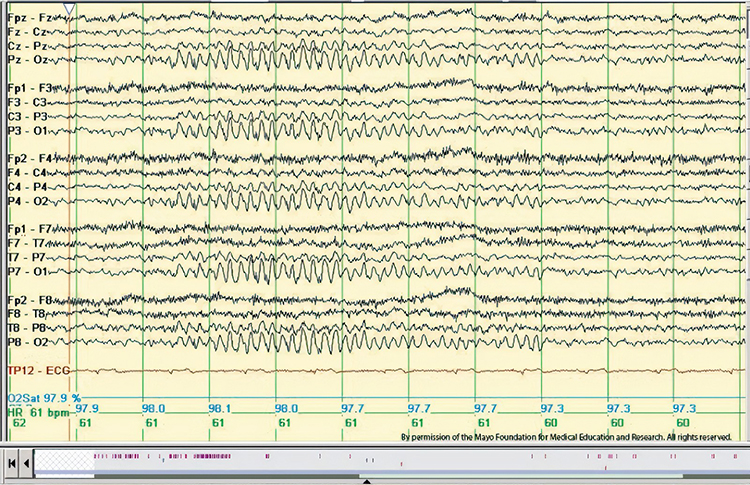
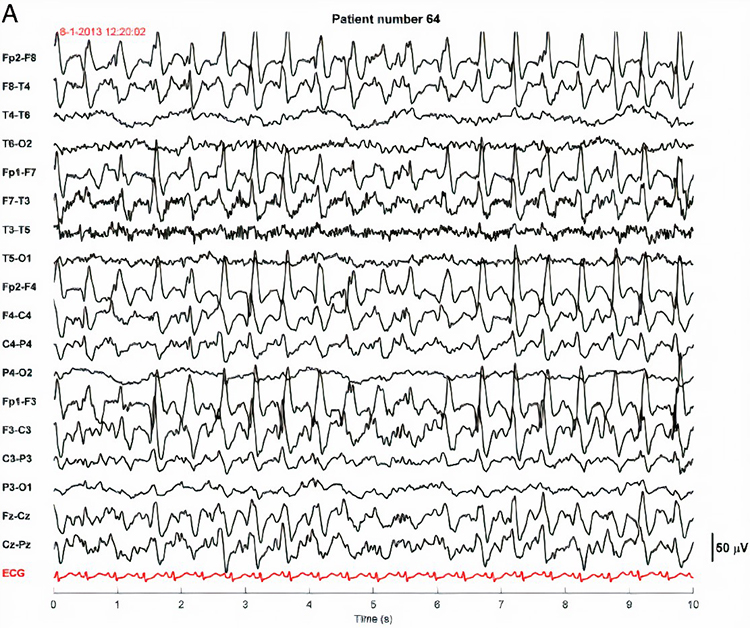
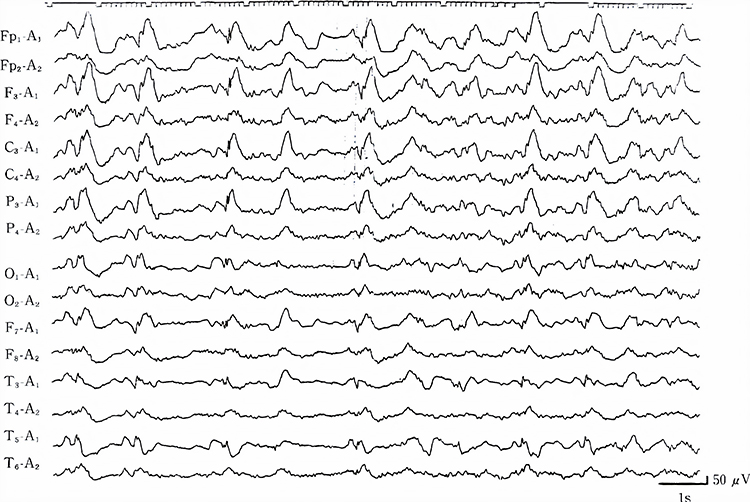
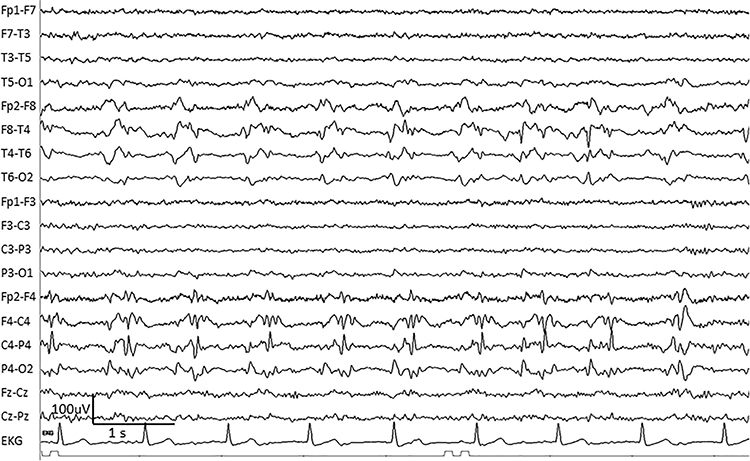
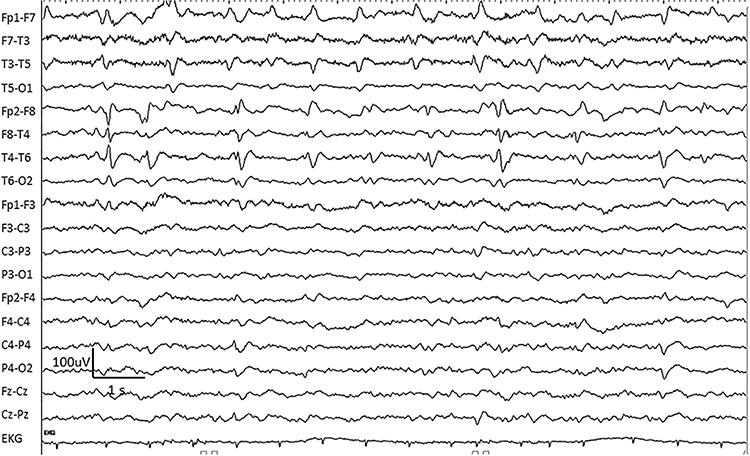
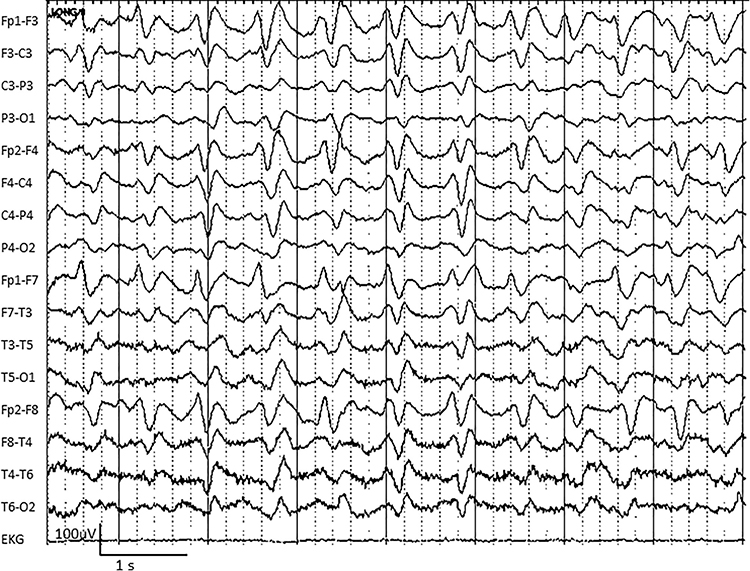
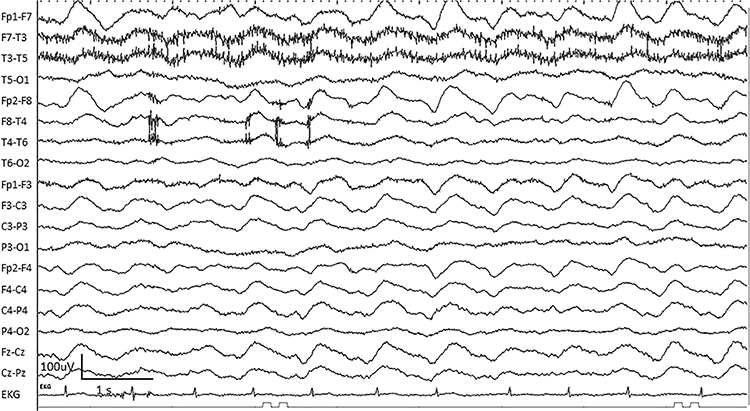
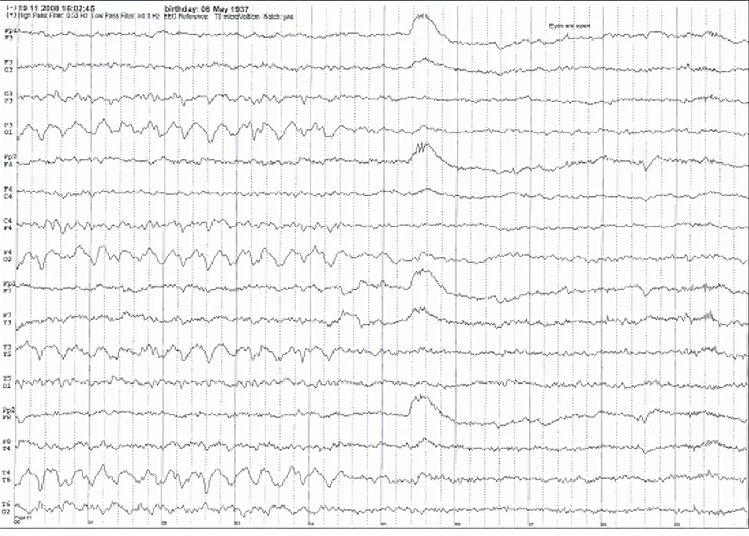
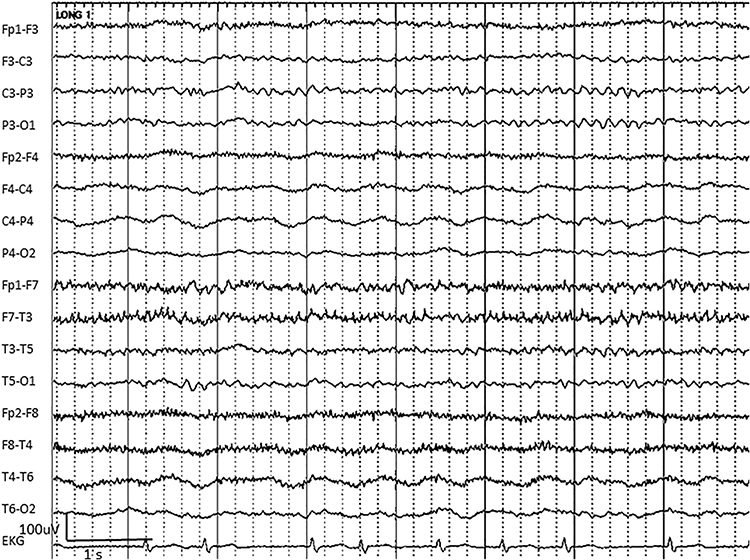
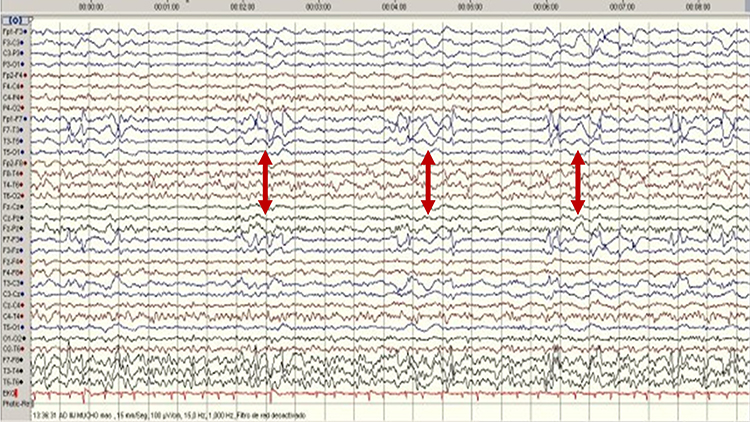
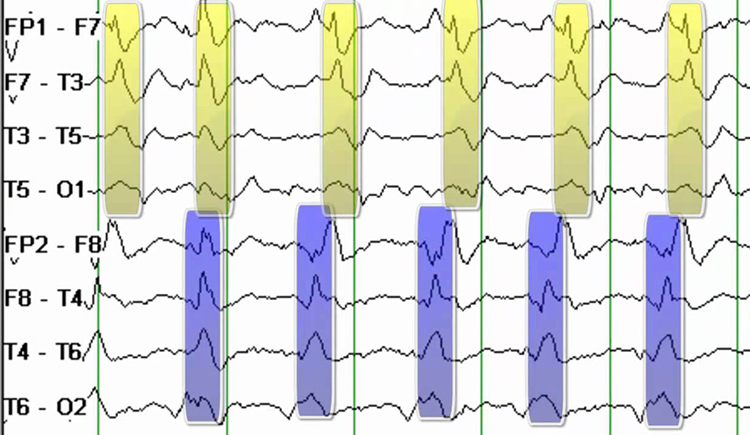
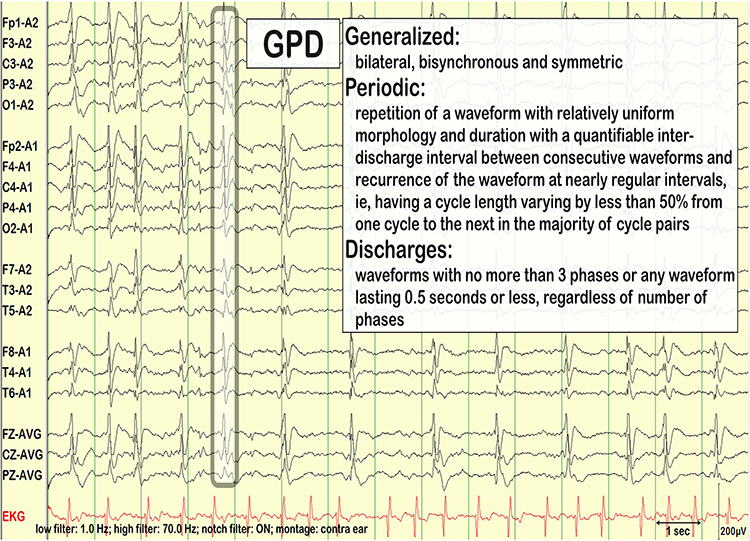
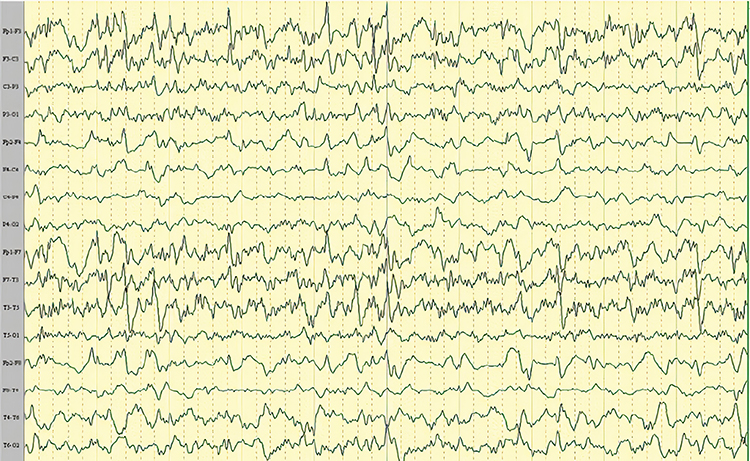
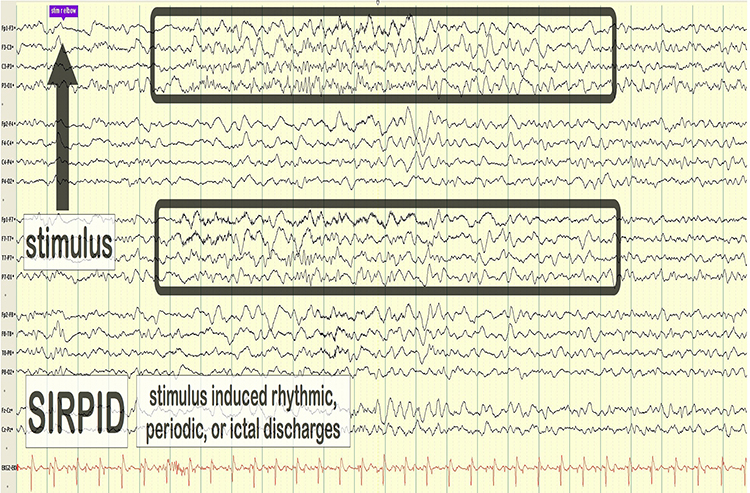
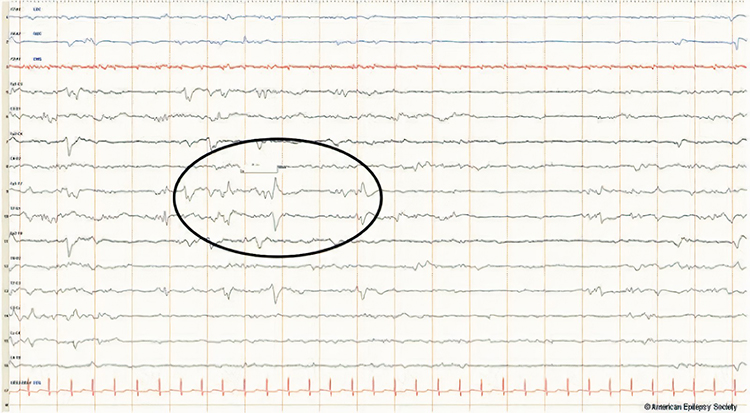
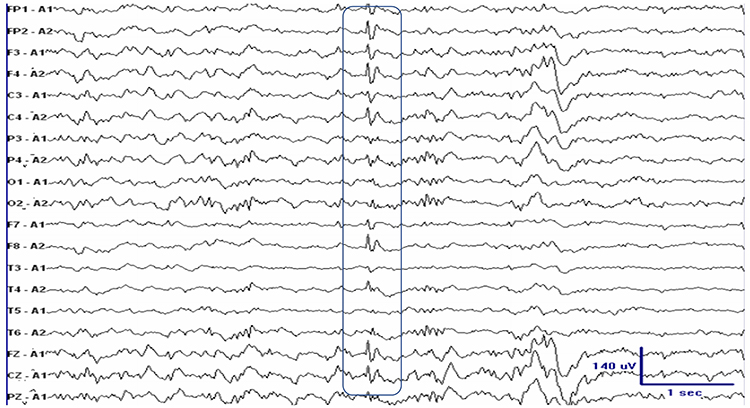
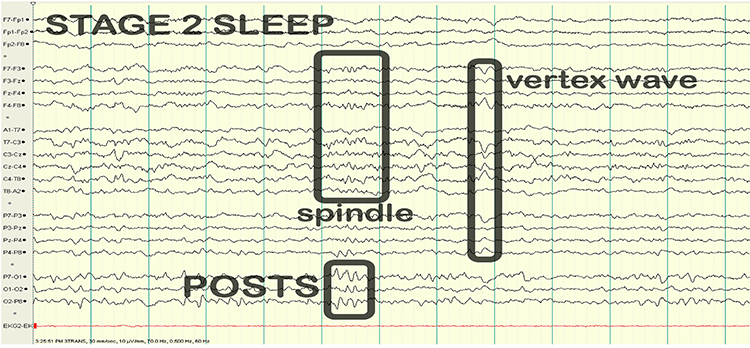
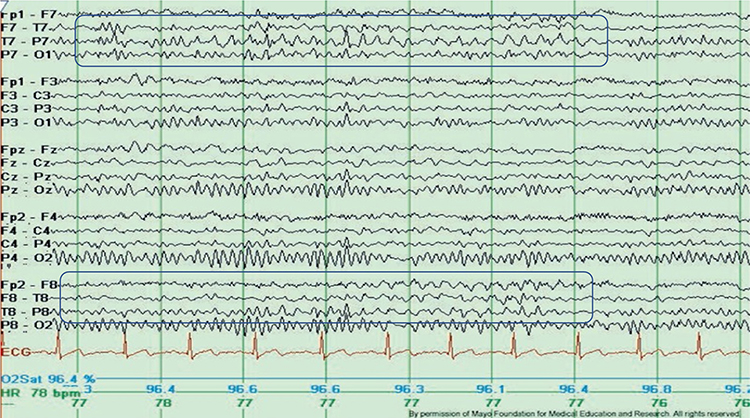
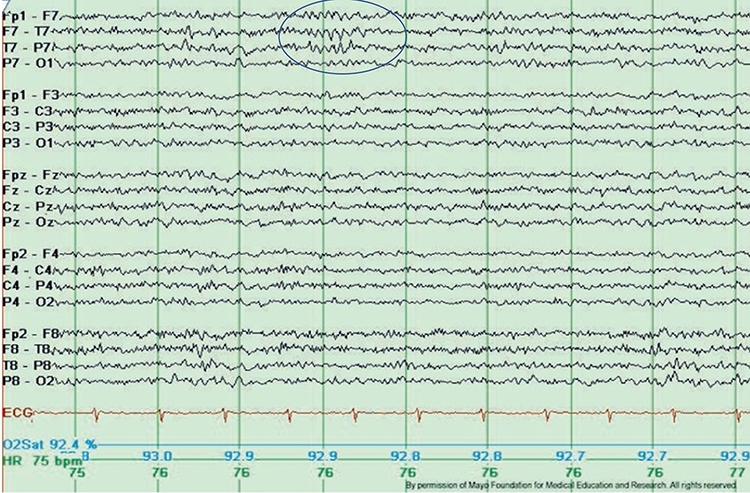
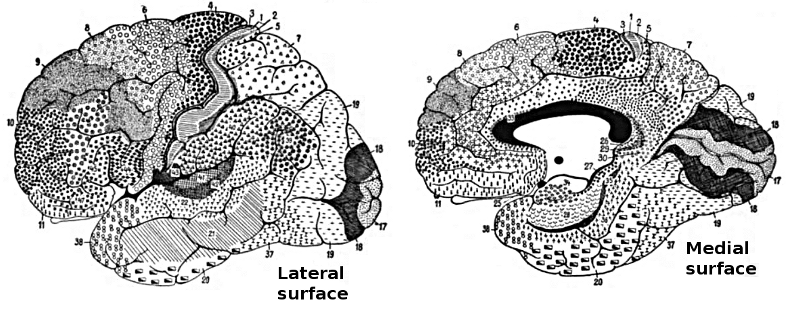
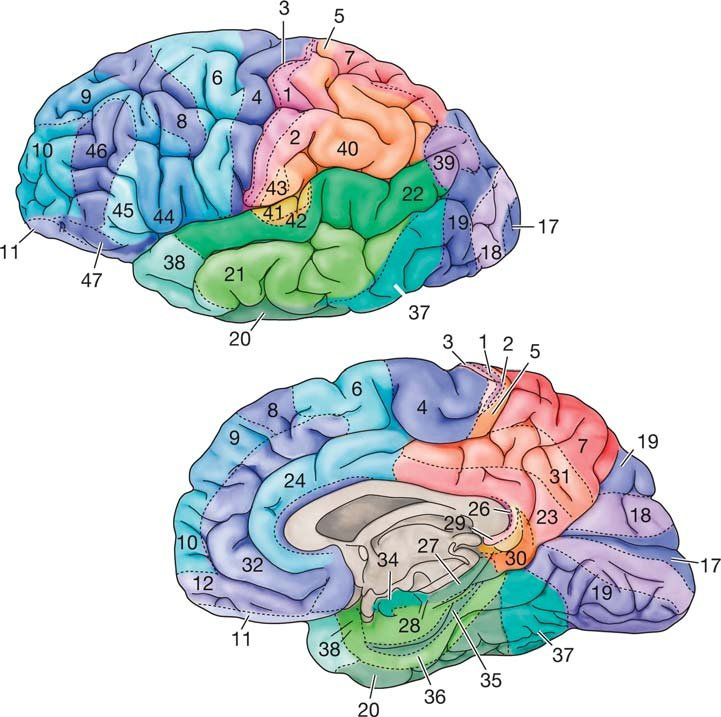
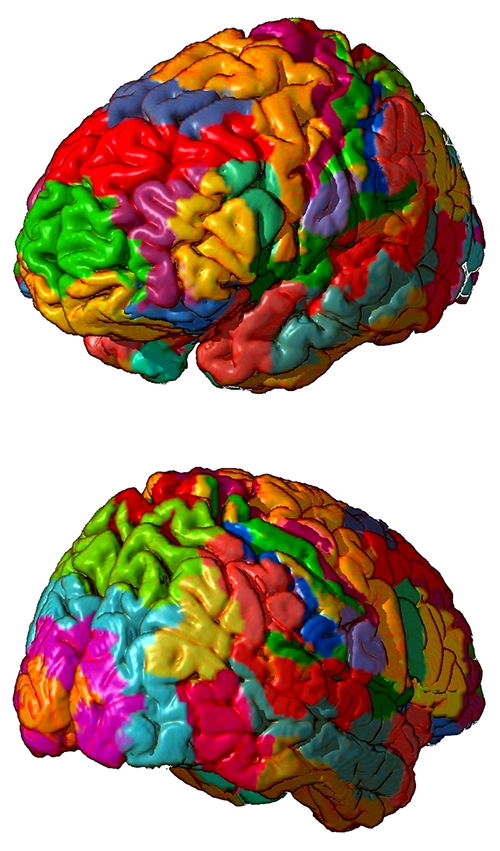
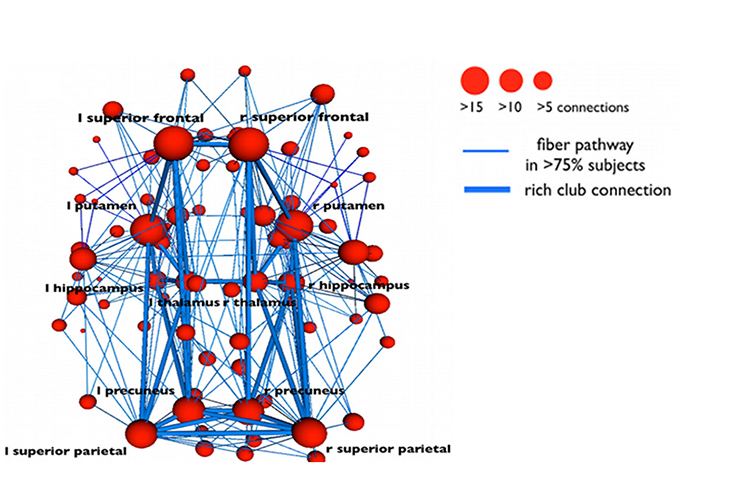
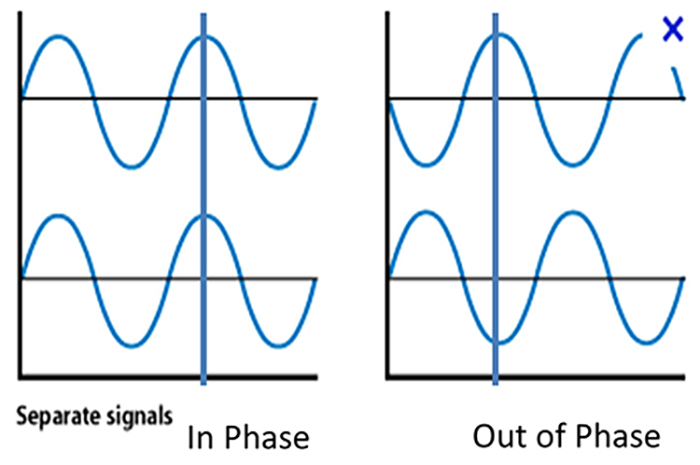
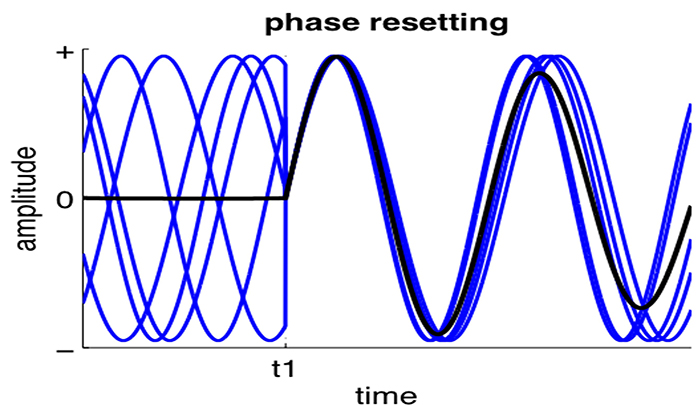
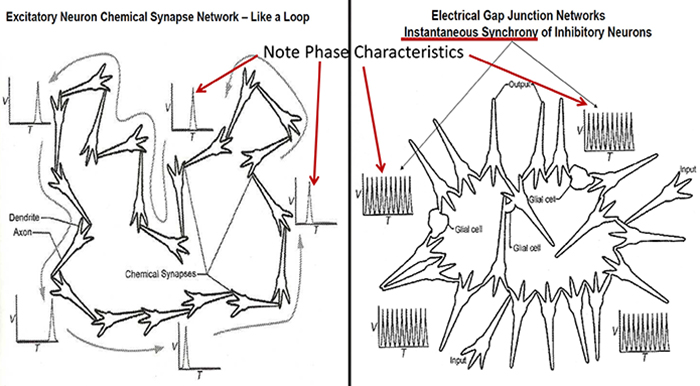
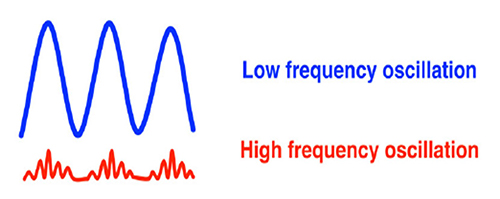
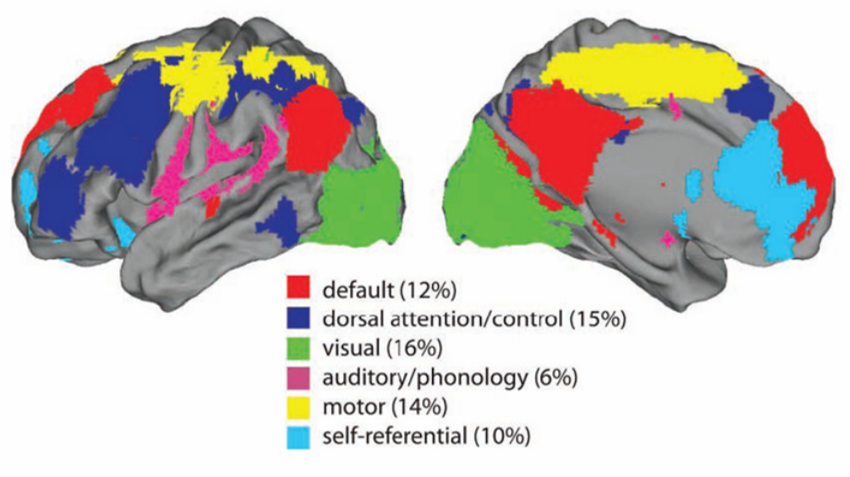
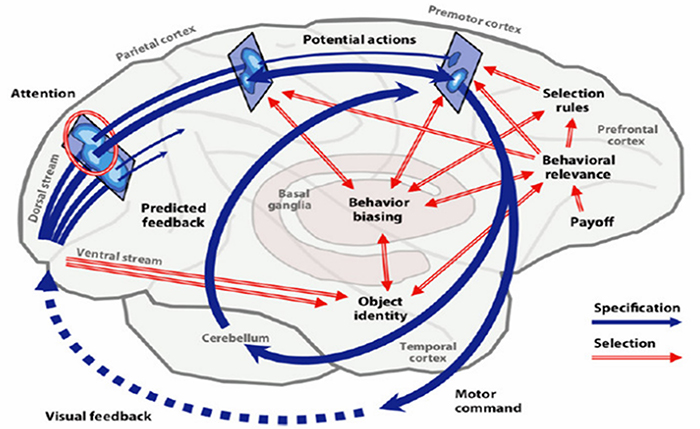
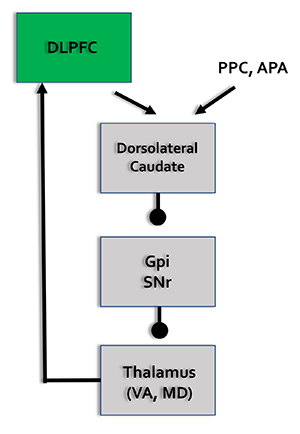
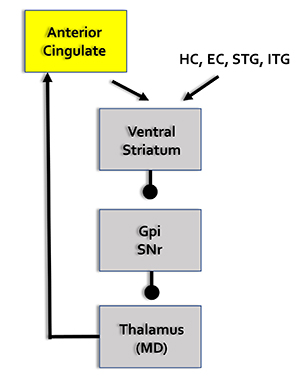
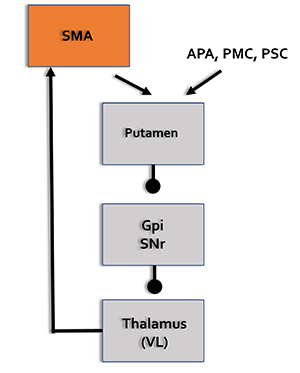
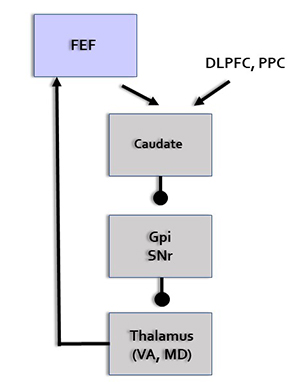
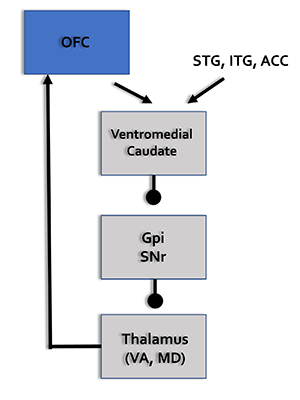
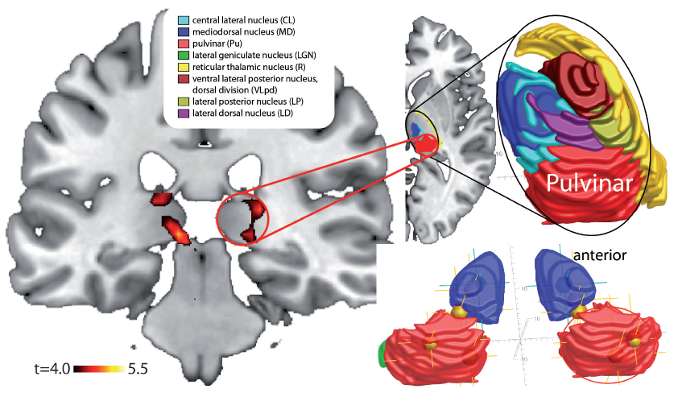
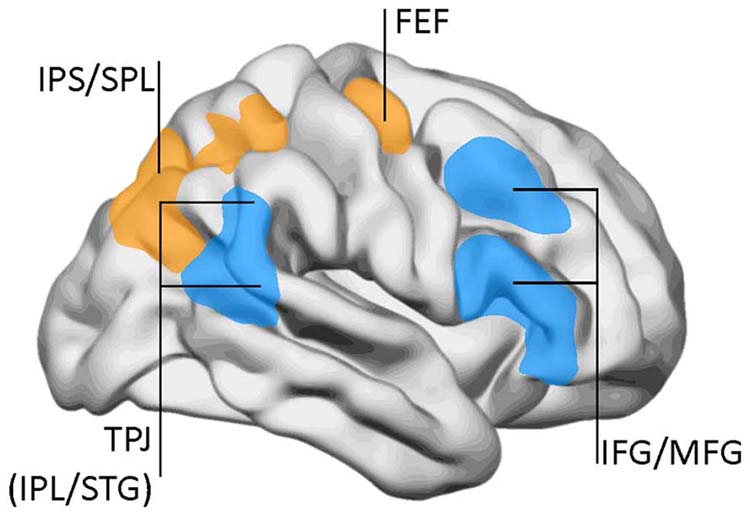
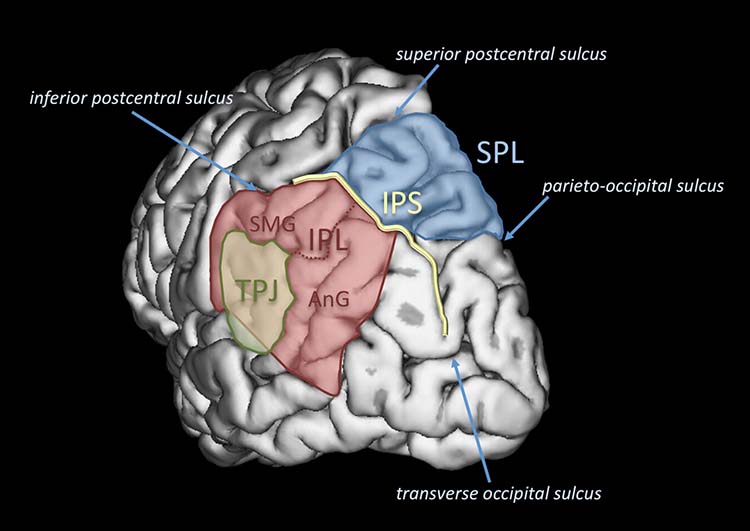
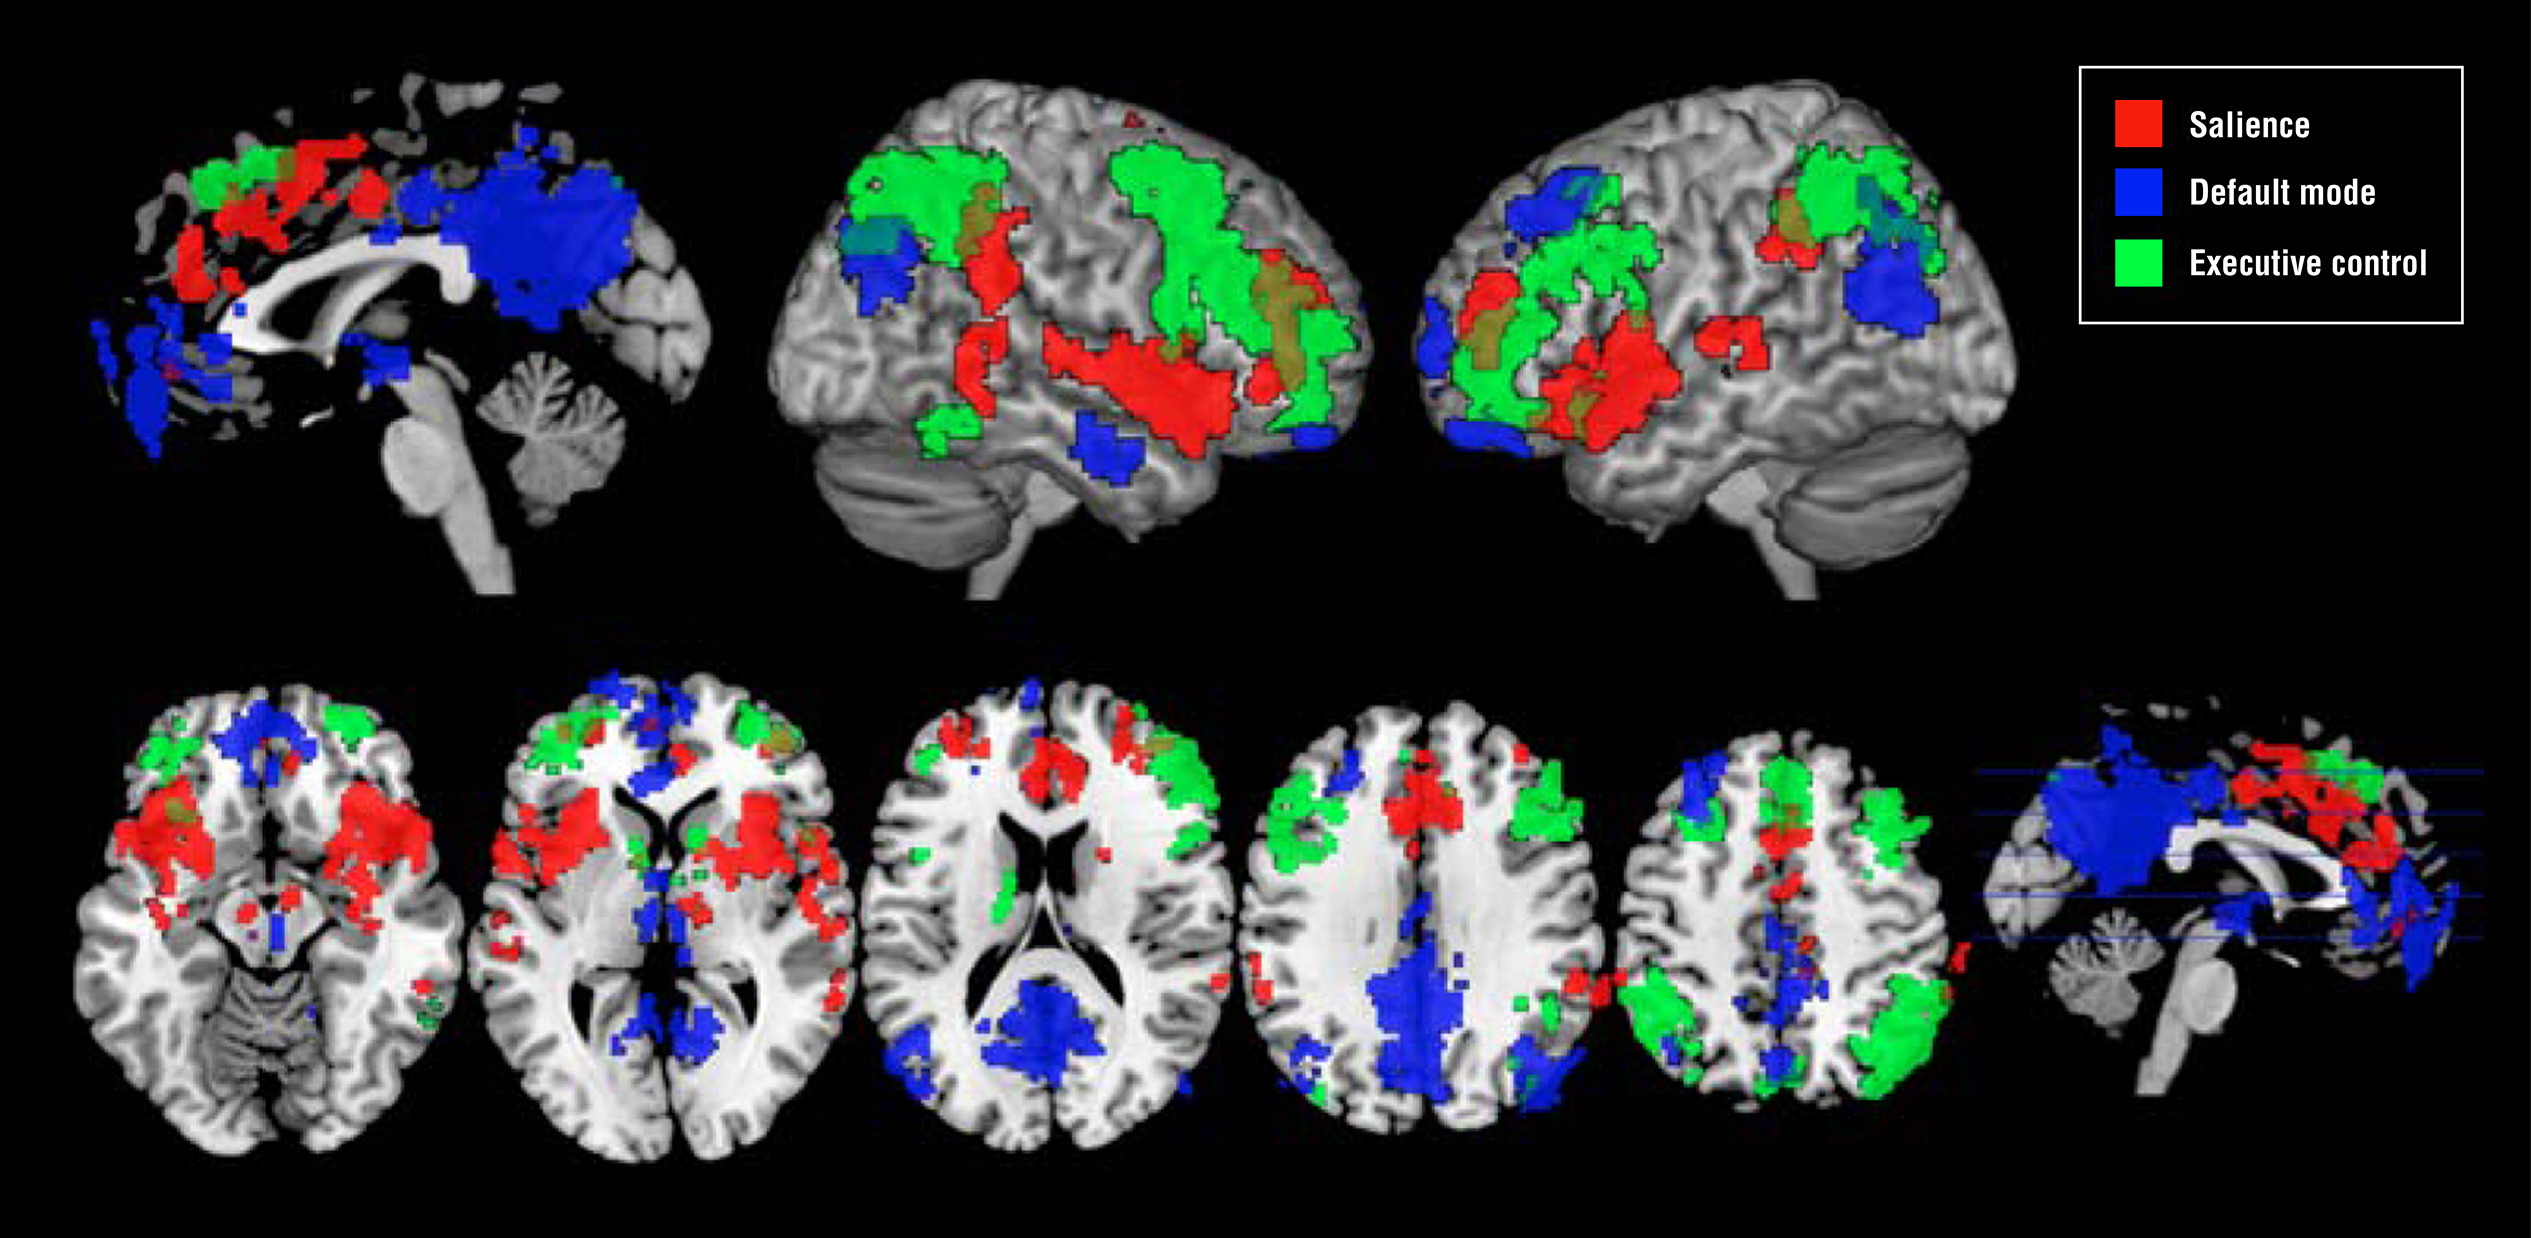
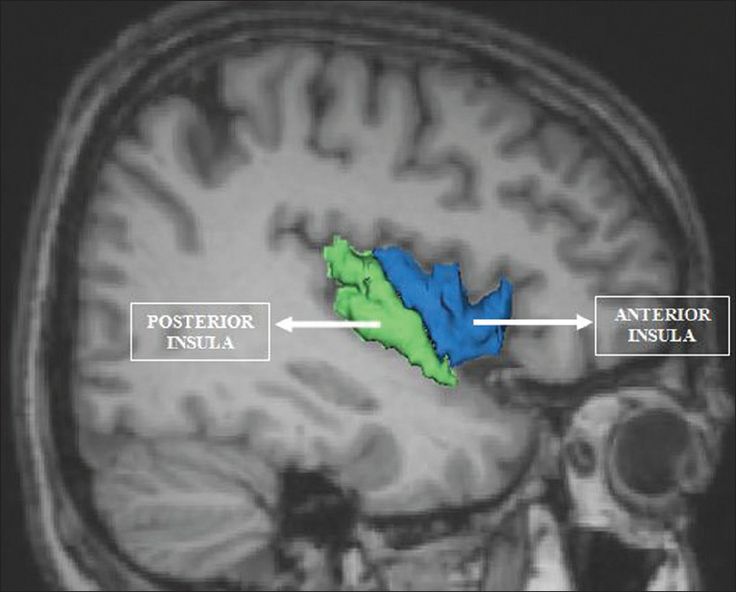
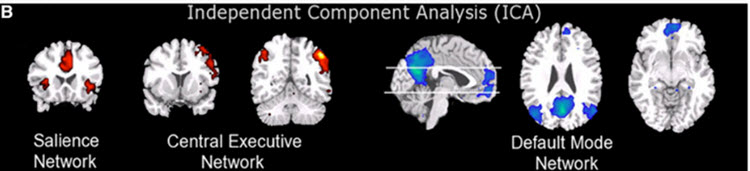
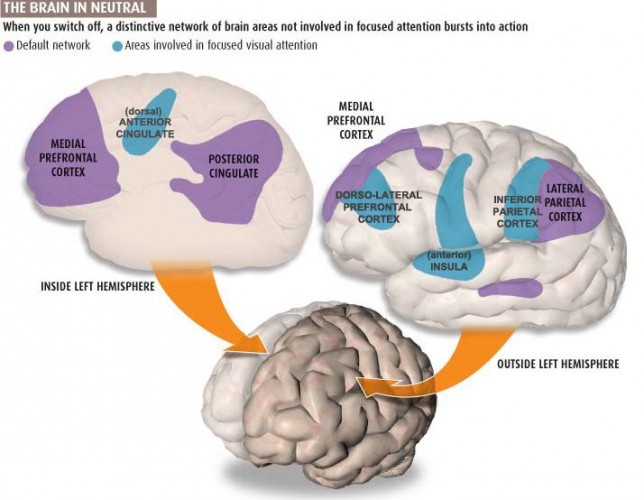
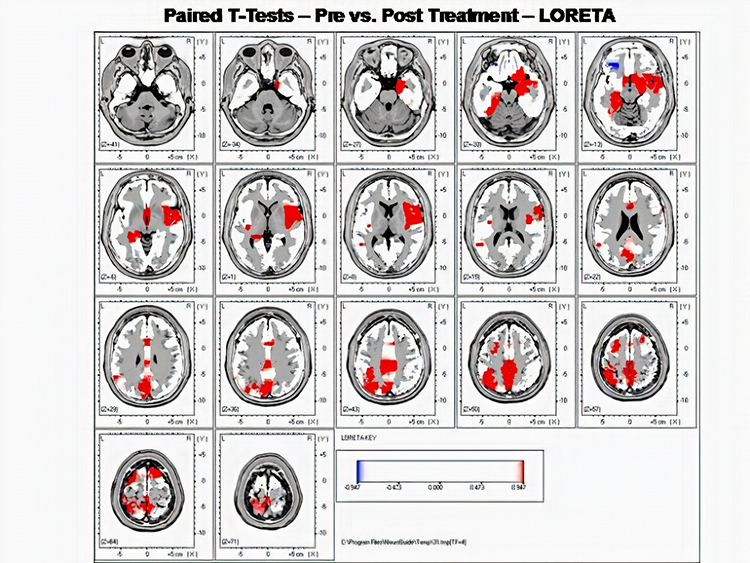
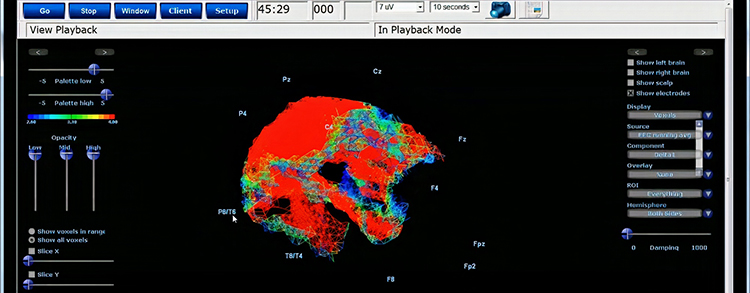
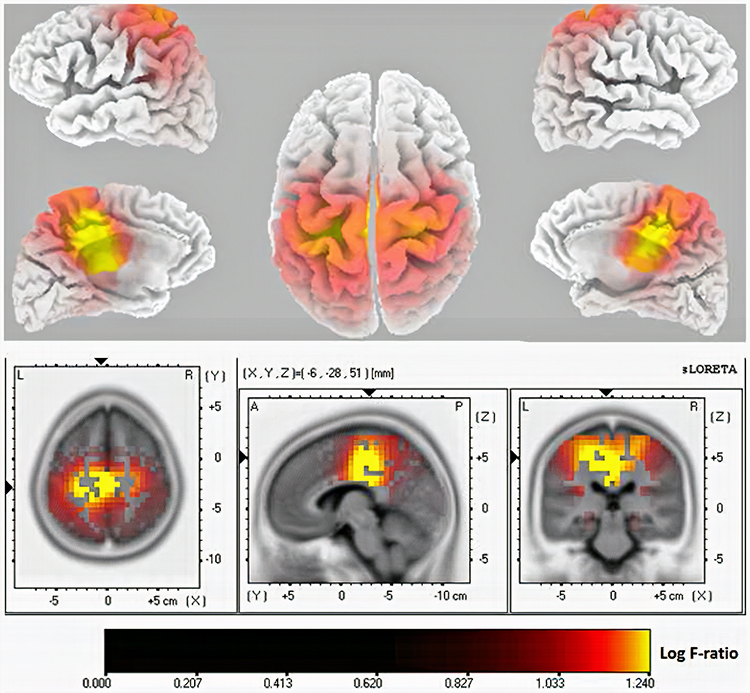
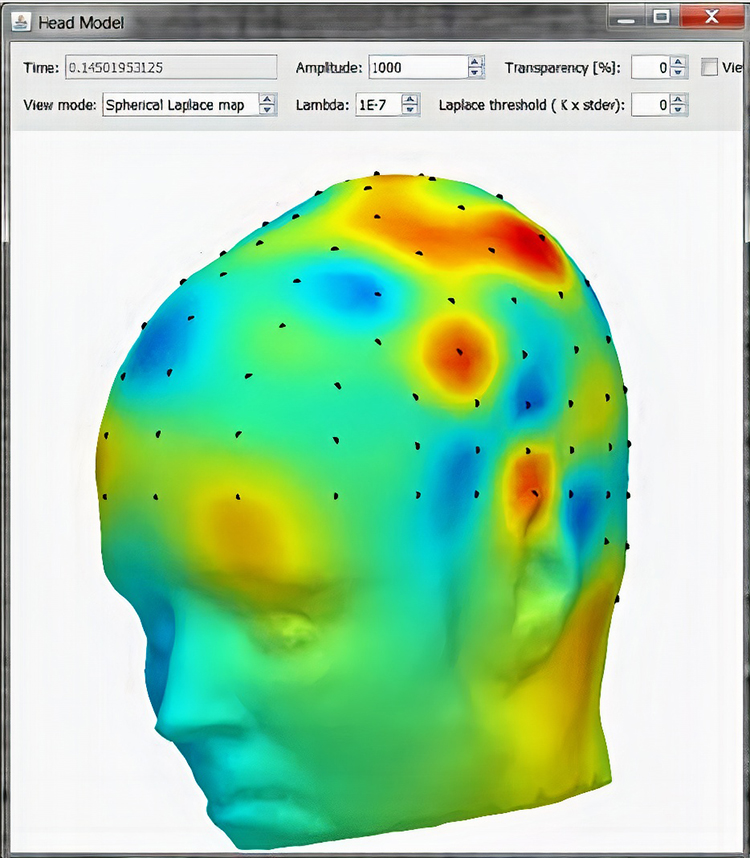


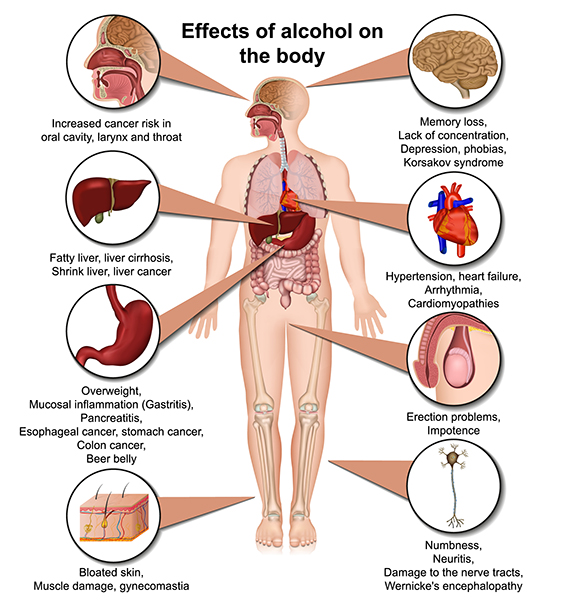
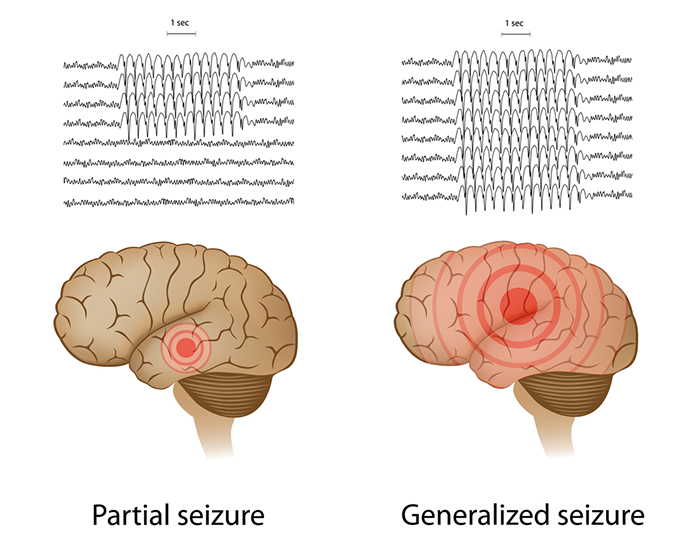
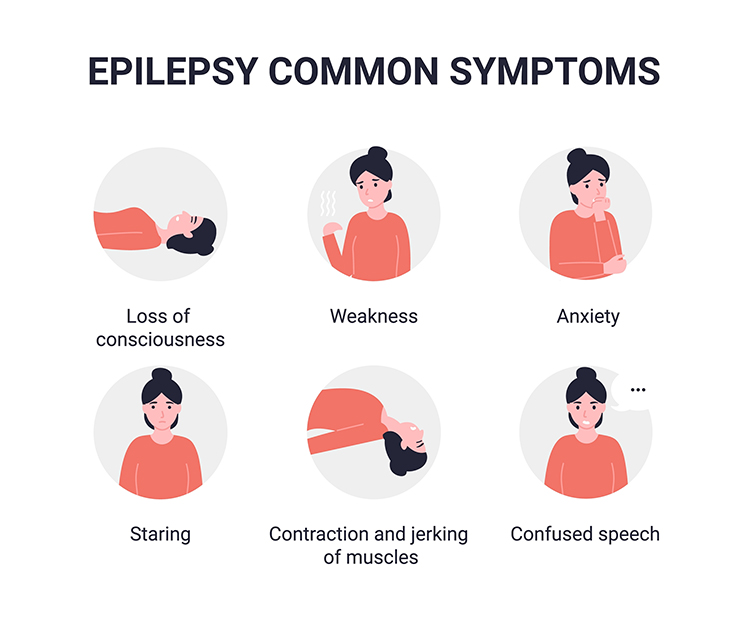 Graphic © Steve Buckley/Shutterstock.com shows a 2-year-old boy with 24-hour EEG electrodes to find the source of his seizures.