
Signal Processing
EEG waveforms may be described by their frequency, shape, and amplitude. The amount of energy within an EEG frequency band may be quantified using peak-to-peak and root mean square methods. Data acquisition systems transform the raw analog signal into a digital form. High sampling resolutions measured in digital bits are required to accurately sample DC and AC components and a wide range of signal voltages. A minimum sampling rate of twice the highest frequency is necessary when performing Fast Fourier Transform analysis. After the EEG signal has passed through several amplification stages, it is filtered to exclude unwanted frequencies and minimize artifact and distortion.
The EEG spectrum is composed of frequency bands which are further subdivided. EEG frequency bands are correlated with unique subjective states like internal focus and conscious problem-solving. Clinicians and researchers use LORETA, sLORETA, eLORETA, and surface Laplacian analysis to localize the cortical source of the scalp EEG.
Finally, professionals need to recognize and understand the significance of clinically significant raw waveforms like the kappa rhythm, lambda waves, vertex sharp transients, mu waves, spike and wave, SMR, sleep spindles, and K-complexes. The graphic below © engagestock/Shutterstock.com.
BCIA Blueprint Coverage
This unit addresses III. Instrumentation and Electronics - C. Signal Processing.

This unit covers Analog, Raw EEG, Basic Signal Measurement Terms, Filtering Methods, Subjective Characteristics of Frequency Bands, Waveform Morphology, Source Localization, and Clinically Significant Waveforms.
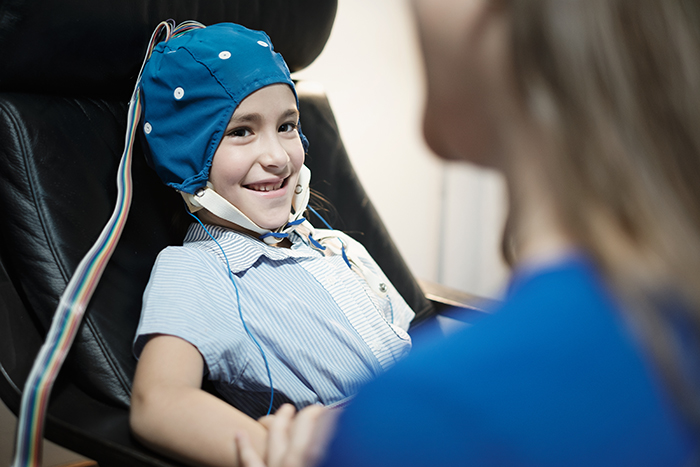
ANALOG, RAW EEG
EEG activity ranges from DC (slow cortical potentials) to gamma (34-60+ Hz) (Collura, 2014). Hertz (Hz) is an abbreviation for cycles per second. The raw EEG signal consists of oscillating electrical potential differences detected from the scalp. Raw or wave displays plot voltage using a bipolar (positive/negative) scale with zero in the middle. This is the analog form of the signal in which voltage continuously varies instead of digital representation using 0s and 1s. The graphic © John S. Anderson shows the voltage as µV peak to peak.
BASIC SIGNAL MEASUREMENT TERMS
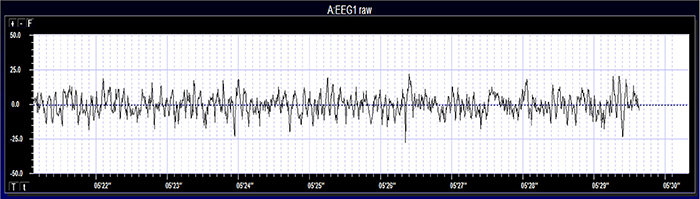
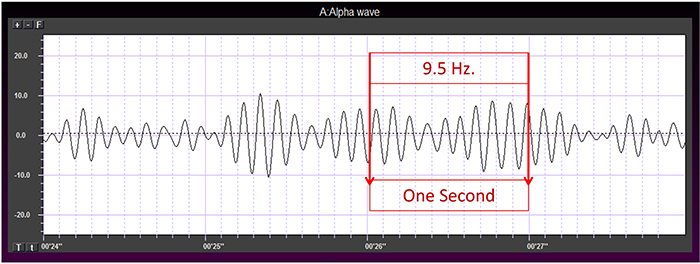
EEG waveforms share the features of frequency and shape (Libenson, 2010). Frequency measures the speed and is the number of cycles completed each second. The higher the frequency (f), the shorter the wavelength (λ). The mathematical relationship is f = 1/λ. To measure frequency in the raw waveform, count the number of peaks or zero crossings and divide by 2. Graphic © John S. Anderson.
Amplitude measures size, which is the "amount" of energy within an EEG frequency band. The amplitude and morphology of any EEG frequency band reflect the number of neurons discharging simultaneously at that frequency. High amplitude means that many neurons are depolarizing and hyperpolarizing at the same time.
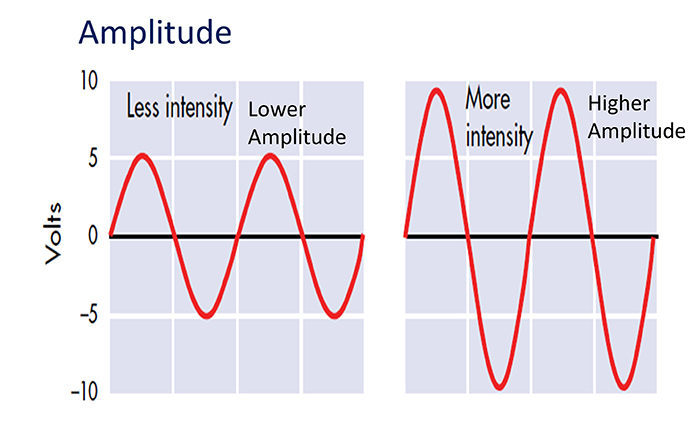
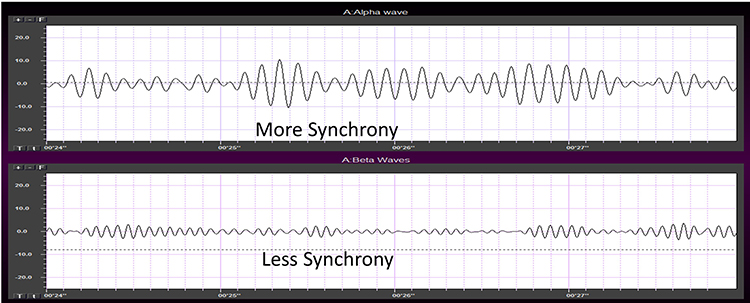
Greater synchrony among neurons firing results in higher amplitude (Demos, 2019). Graphic © John S. Anderson.
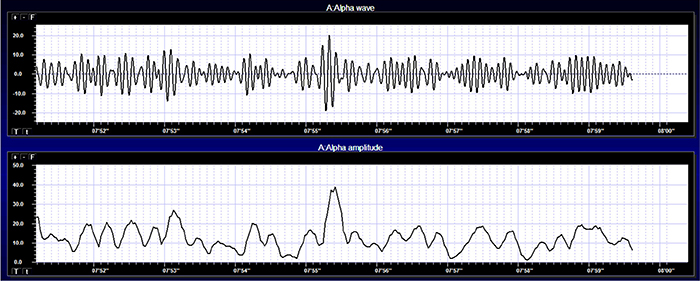
Amplitude displays show voltage using a scale where all values are positive (greater than zero). They only show voltage changes, not the signal waveform. Graphic © John S. Anderson shows the oscillating raw alpha waveform (top) and alpha amplitude (bottom).
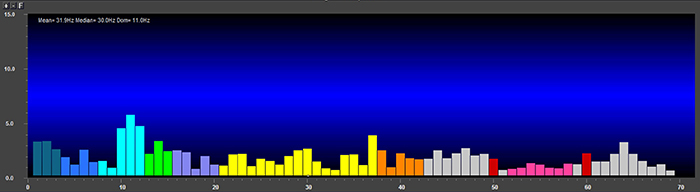
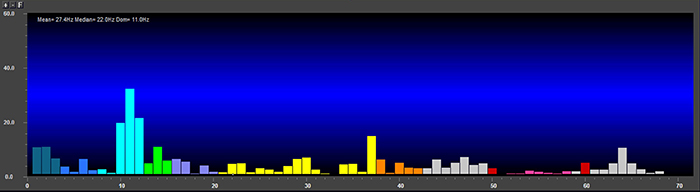
Magnitude represents the average amplitude over a unit of time using quantification methods like peak-to-peak (P-P) and root mean square (RMS). The peak-to-peak method measures waveform "height" from peak to trough. In contrast, the root mean square method calculates the area under the EEG waveform and is analogous to the weight of an object (Collura, 2014). The graphic below that illustrates EEG spectrum magnitude © John S. Anderson.
EEG signal power is magnitude squared and may be expressed as microvolts squared or picowatts/resistance. Most qEEG databases convert power into standard deviations, whereas the Jewel database transforms amplitudes into standard deviations or Z-scores (Demos, 2019). The graphic below © John S. Anderson shows the EEG power spectrum instead of the magnitude spectrum.
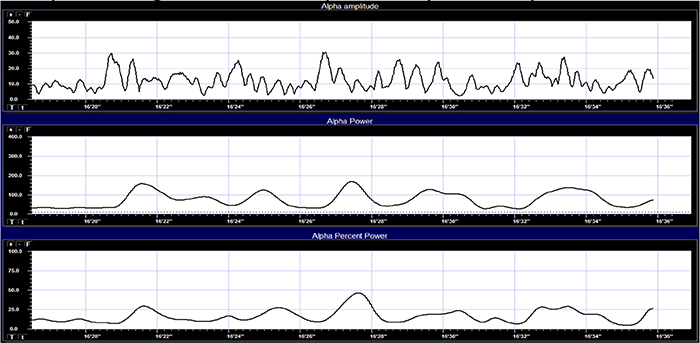
Percent power is the power within a frequency band expressed as a percentage of total EEG power. The graphic below © John S. Anderson shows alpha amplitude, alpha power, and alpha percent power.
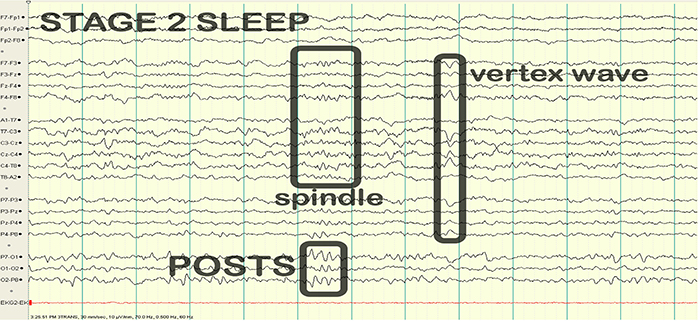
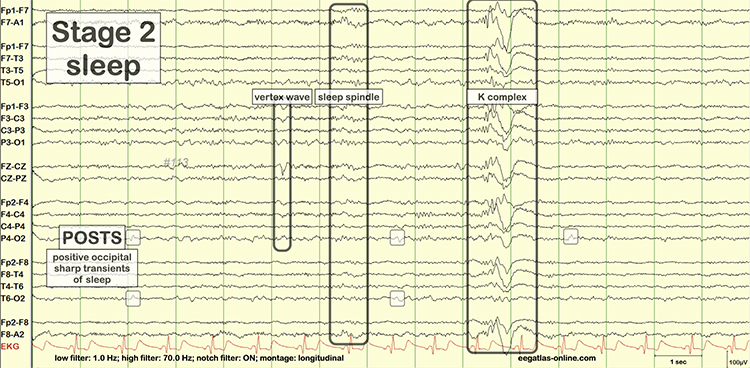
EEG waveforms may assume a distinctive shape or morphology like POSTs (positive occipital sharp transients of sleep), spindles (oscillations), and vertex (V) waves that appear over Cz during stage 2 sleep. The graphic below © eegatlas-online.com shows stage 2 sleep.
FILTERING METHODS AND SUBJECTIVE CHARACTERISTICS OF FREQUENCY BANDS
Sampling
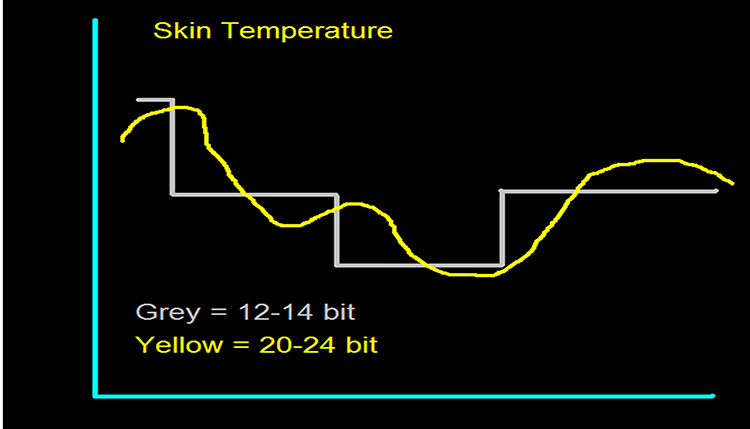
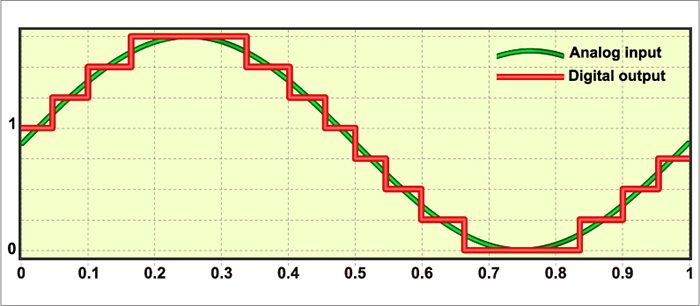
Data acquisition systems digitize and process the raw EEG signal. Digitization transforms the raw signal into a digital form. An analog-to-digital converter (ADC) samples the analog signal (transforms it into numerical values) with a sampling resolution, sampling rate, and epoch length.The sampling resolution is the number of digital bits used to represent a signal. Each bit (binary digit) is assigned a binary value of 0 or 1. Systems that sample the EEG signal utilize from 8-24 bits. The advantages of 24-bit sampling are an accurate sampling of the EEG signal's DC and AC components and the ability to sample a wide range of signal voltages called the dynamic range (Collura, 2014). Graphic © John S. Anderson.
The sampling rate is the number of times that the ADC samples the EEG signal per second. A rate of twice the highest frequency is the minimum acceptable sampling rate when performing Fast Fourier Transform (FFT) analysis. Graphic © John S. Anderson.
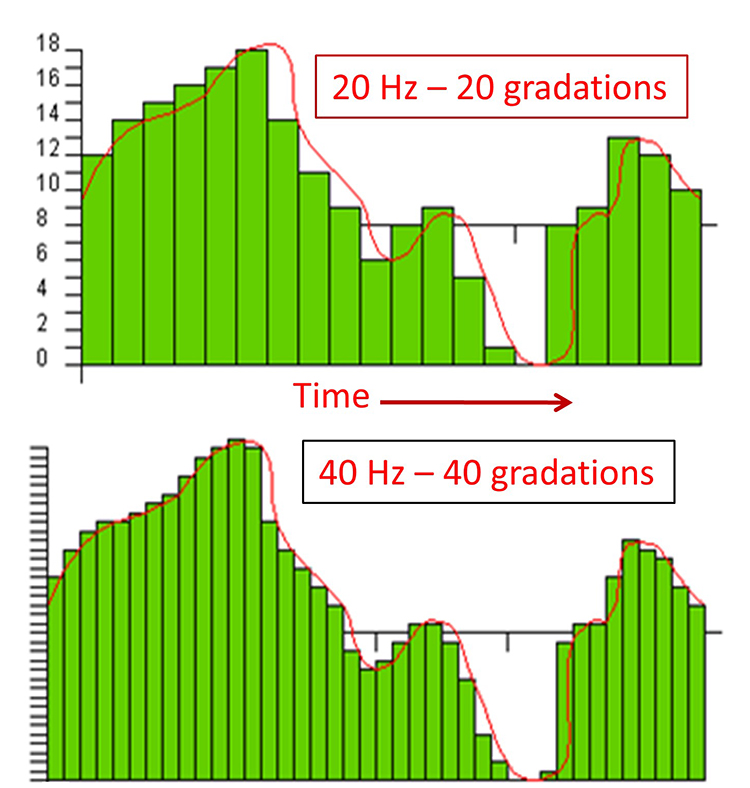
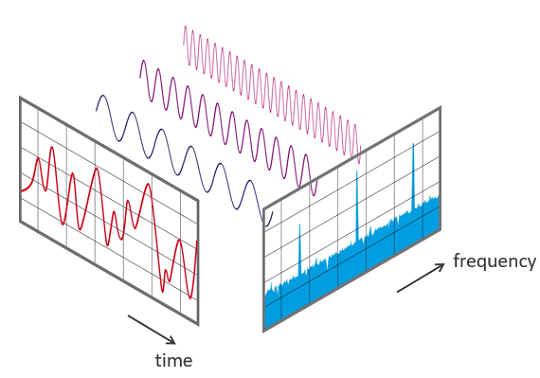
A FFT is a mathematical transformation that converts a complex signal into component sine waves whose amplitude can be calculated. The graphic below shows the decomposition of the original signal (left) into its sinewaves of different frequencies (center) and is courtesy of NTi Audio.
A rate of twice the highest frequency is insufficient to visually represent the EEG signal since it only samples the highest frequency twice per cycle. This low rate also allows the harmonics of 50/60 Hz noise (which can extend to several hundred hertz) to contaminate the EEG signal. For example, when there is a 240-Hz harmonic of 60Hz noise, sampling at 256 samples per second (sps) can result in a spurious 16-Hz waveform (Collura, 2014). Faster sampling rates are desirable, particularly when resolving high-frequency signals. A sampling rate of 512 sps is a good choice for frequencies up to 64 Hz, and 1024 sps is suitable for frequencies up to 128 Hz. However, a sampling rate of 256 sps is considered adequate for most purposes
FFT analysis breaks the EEG signal into 1- to 2-s chunks called epochs. Epoch length sets the lowest and highest frequencies that the FFT can represent (Collura, 2014). Graphic © John S. Anderson shows the conversion of a complex signal using FFT.
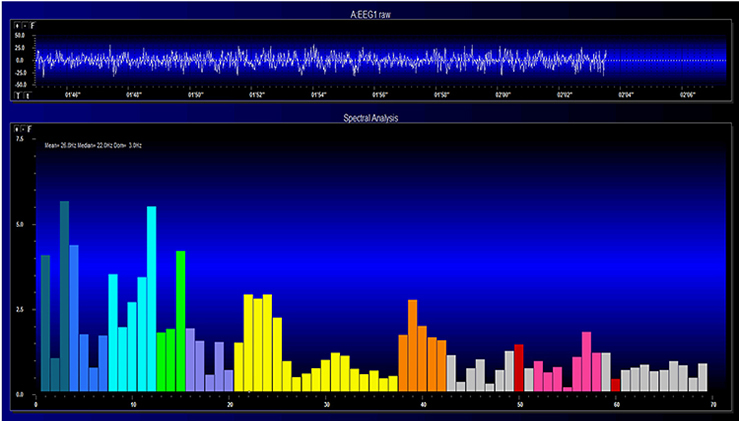
The FFT power spectral analysis video below © John S. Anderson. The top window shows the raw EEG signal, and the bottom window features a spectral display created using FFT analysis.
Joint time-frequency analysis (JTFA) computes values on each data point at rates up to 256 times per second without using a fixed epoch length. Where FFT simultaneously calculates amplitudes for all frequency bands, JTFA analyzes preselected bands. The JFTA graphic © John S. Anderson.
Filtering the Data
After a differential amplifier boosts the EEG signal, it is filtered and then amplified by a second single-ended amplifier. Filters exclude unwanted EEG frequencies to detect activity of clinical interest and minimize artifact and distortion. Filters exclude unwanted EEG frequencies to detect activity of clinical interest and minimize artifact and distortion. Clinical EEG analysis uses low-frequency, high-frequency, bandpass, and notch filters (Libenson, 2010). Clinicians must disable filters to examine EEG morphology (Demos, 2019).
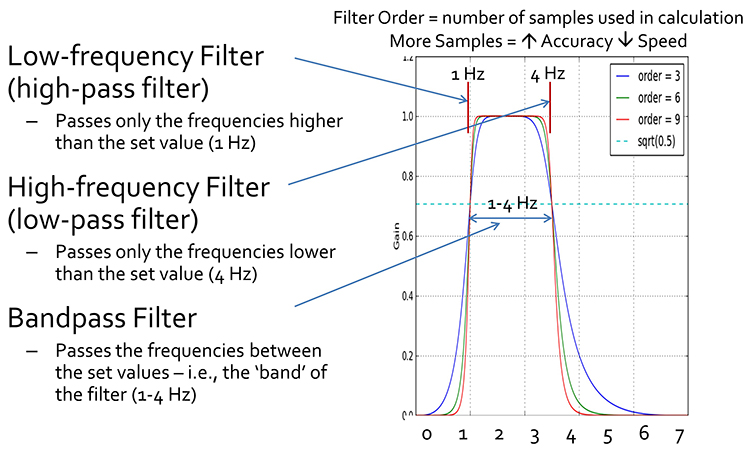
A low-frequency filter (high-pass filter) filters out low-frequency activity and passes only the frequencies above a set value (e.g., 1.6 Hz).
A high-frequency filter (low-pass filter) filters out high-frequency activity and passes only the frequencies lower than the set value (e.g.,15 Hz). This filter can help reduce the distortion that EMG artifact causes to the raw EEG waveform (Thompson & Thompson, 2015).
"However, use of filters to remove EMG artifact must be used with care because muscle artifact is broadband so that the remaining signal might well contain subtle but significant muscle artifact in roughly the 15-30 Hz range, where genuine EEG power is typically low. Such subtle artifact could substantially reduce signal-to-noise ratio in the beta band” (Nunez & Srinivasan, 2006).
A bandpass filter passes the frequencies between the set values, which constitute the "band" of the filter. The graphic © John S. Anderson.
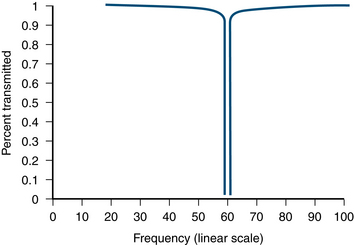
A notch filter excludes a narrow frequency band to control 50/60Hz artifact produced by line current (Libenson, 2010). A 60-Hz notch filter attenuates adjacent frequencies (e.g., 58 Hz and 61 Hz). The 60-Hz notch filter graphic is courtesy of Wikipedia.
Analog and Digital Filters
Analog filters contain analog circuits designed using components like capacitors, resistors, and operational amplifiers. Analog filters represent voltage as continuously varying. Most analog filters use the infinite impulse response (IIR) approach, described below.Digital filters use digital processors, like a digital signal processing (DSP) chip, to exclude unwanted frequencies. First, an analog-to-digital converter (ADC) samples and digitizes the analog signal, representing signal voltages as binary numbers. Second, a DSP chip performs calculations on the binary numbers. Third, a digital-to-analog converter (DAC) may transform the sampled, digitally filtered signal back to analog form. Graphic © Foud A. Saad/Shutterstock.com.
Three main methods of digital filtering are finite impulse response (FIR), infinite impulse response (IIR), and Fast Fourier Transformation (FFT). Digital filters primarily sample data within a bandpass (e.g., 13-15 Hz) but do not wholly exclude frequencies above and below this frequency range. These frequencies are attenuated to varying degrees (Thompson & Thompson, 2015).
FIR filters continuously update their averaging of EEG voltage with new data points. A filter's order is determined by the number of data points that it averages. A higher-order filter more sharply attenuates frequencies outside the bandpass. Software may allow you to select both filter type and order. FIR filters attenuate frequencies above and below the bandpass more gradually than IIR and FFT filters.
Higher-order filters trade off precision for speed. The output of a higher-order filter provides a more accurate picture of the power in a specified band but does so more slowly than a lower-order filter. Recall that the order of a filter refers to the number of data samples used to calculate the output. A higher-order filter computes an output using more samples and is more accurate but introduces a longer delay, as each sample represents a period.
IIR filters assign frequency components to discrete bins as the signal is amplified. Demos (2019) likens these filters to a sieve that admits the signal of interest while discarding frequencies that won't be trained or measured. IIR filters are recursive because they use part of their output as input. IIR filters attenuate frequencies outside the bandpass more sharply than FIR filters with the same order, have greater time delay (that depends on frequency) due to greater filter sharpness, achieve faster computation due to their lower order, and are less stable than FIR filters.
FFT filters use Fast Fourier transforms to calculate the average voltage of an EEG signal's component frequencies for a specified time. This period must be at least as long as the most extended frequency period or wavelength. Therefore, to adequately represent 1 Hz (wavelength of 1000 ms) activity in the EEG using a FFT, at least 1 s of data must be used. This results in a too-slow response to provide the optimal representation of the data for real-time training - generally considered to be 250 ms or less. Because of this, FFTs are used for offline signal analysis and processing (qEEG) but not for either amplitude or z-score neurofeedback training.
Demos (2019) likens these filters to slicing a pie. FFT filters attenuate frequencies outside the bandpass more sharply than FIR filters and require greater computing power (Fisch, 1999; Thompson & Thompson, 2015).
Digital filtering methods enjoy four advantages over analog filters. First, clinicians can retrospectively adjust filter settings when reviewing the EEG record since digital filters are programmable. Second, digital filters can be designed to minimize phase distortion (displacement of the EEG waveform in time). Third, digital filters can achieve greater stability over time and across various frequencies. Fourth, digital filters can more accurately process low-frequency signals.
Since different digital filters can produce widely different statistics for the same frequency range, use the same filter for all statistical calculations (Thompson & Thompson, 2015).
Single-Hertz Bins
Neurofeedback providers using products like the Neuroguide LifeSpan database use single-hertz bins to determine the best training range for each client. They locate the highest amplitude bin (highest z-score) and select a range centered on that bin. Deviations from normal are correlated with clinically significant conditions. For example, lower than normal PDRs may index cognitive decline. For example, if the highest amplitude bin was 9 Hz, you could choose an 8-10 Hz training range. The wider the range, the less specific the training is to the highest amplitude bin (Demos, 2019).Single-hertz bins also help identify the posterior dominant rhythm (PDR), the highest amplitude frequency detected at the posterior scalp. The PDR is measured with eyes closed, and interpretation is based on age. Normal values are 6 Hz for 1-year-olds, 8 Hz for 8-year-olds, 9 Hz for 10-12-year-olds, and 10 Hz for 13-14 year-olds. For adults, normal values are between 9 and 11 Hz (Demos, 2019).
Subjective Characteristics of Frequency Bands
Most EEG power or signal energy falls within the 0-20 Hz frequency range. You may recall that hertz (Hz) is an abbreviation for cycles per second. The dominant frequency is the frequency with the greatest amplitude. It is at least 13 Hz in awake adults. EEG power is measured in microvolts or picowatts.
Higher frequencies reflect cognitive activity and active processing of sensory input. They involve relatively desynchronized activity like alert wakefulness and REM sleep. Lower frequencies reflect strongly synchronized activity like interactive neuronal communication, control of network activity, nondreaming sleep, and coma.
The table below is adapted from Wilson et al. (2011) and based on Thompson and Thompson (2015). Different authors define frequency bandpasses differently. For example, delta 0.5-3 Hz or 1-4 Hz.
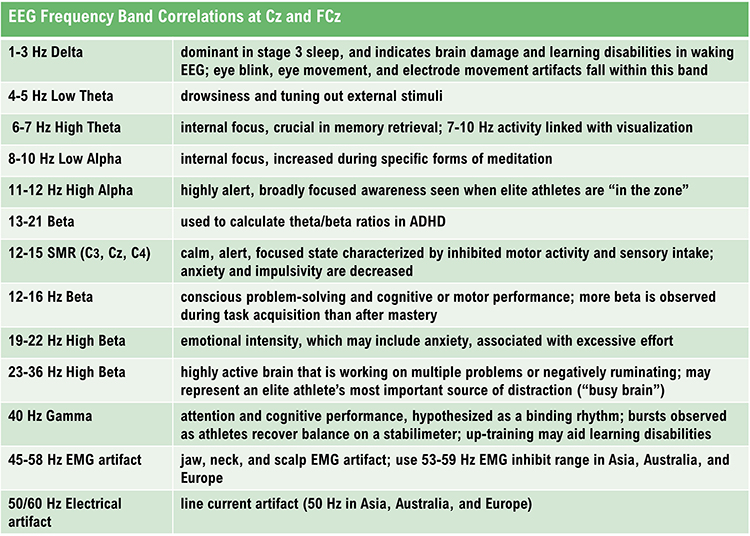
DELTA (0.05-3 HZ)
The delta rhythm ranges from 0.05-3 Hz with 20-200 microvolt synchronous waves. Microvolt means one-millionth of a volt. Synchronous means that groups of neurons depolarize and hyperpolarize at the same time. Graphic © John S. Anderson.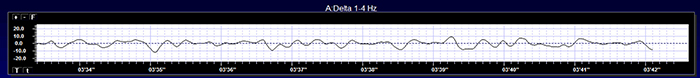
Delta comprises less than 5% of a healthy adult's percent of amplitude compared with 70% for occipital alpha (Thatcher, 1999). The greatest amplitude or signal strength is found in the central region of the scalp. The delta rhythm is the dominant frequency from ages 1-2 and is associated in adults with deep sleep and brain pathologies like trauma and tumors, and learning disability (Hugdahl, 1995; Thompson & Thompson, 2015).
Sleep deprivation can increase delta amplitude. Adult high-amplitude rhythmic delta indicates pathology like traumatic brain injury (TBI). Undergraduates performing problem-solving tasks exhibit arrhythmic delta (Lubar et al., 2001). Children diagnosed with ADHD or learning disabilities may present with diffuse delta and theta. When this occurs, clinicians may inhibit 2-7 Hz instead of 4-7 Hz. Amplitude training is appropriate for inhibiting but not rewarding delta (Demos, 2019).
Low-amplitude delta may be associated with ADHD, anxiety, insomnia, and TBI. Z-score training is safest for uptraining delta (Demos, 2019).
The movie below is a 19-channel BioTrace+ /NeXus-32 display of delta activity © John S. Anderson. Brighter colors represent higher delta amplitudes. Higher peaks represent higher delta amplitudes in the graphs at the end of each line. Frequency histograms are displayed for each channel.
THETA (3-8 HZ)
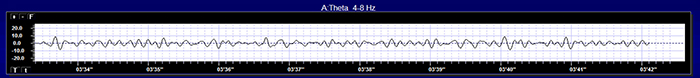
The theta rhythm ranges from 3-7 Hz, 4-7 Hz, or 4-8 Hz with 20-100 microvolts (Thompson & Thompson, 2015). Theta may be arrhythmic or rhythmic (Demos, 2019). Theta is seen during drowsiness or starting to sleep, hypnagogic imagery (intense imagery experienced before sleep onset), and hypnosis.The greatest amplitude is found in the frontal and temporal regions of the scalp. Since there may be several theta generators, the theta rhythm is associated with different behavioral processes. The theta rhythm is associated with creativity, but also with anxiety, daydreaming, depression, inattention, and minor TBI. Excessive left hemisphere (LH) theta may be associated with depression, and right hemisphere (RH) theta may be linked to anxiety (Demos, 2019). Graphic © John S. Anderson.
Childhood Disorders
The theta rhythm is the dominant frequency in healthy young children (Thompson & Thompson, 2015). Theta amplitudes and normative theta-to-beta ratios are higher in children than older adults. Children diagnosed with ADHD often have higher ratios than children without ADHD. Theta-to-beta ratios greater than 3:1 may indicate a slow-wave disorder, and children with a slow-wave disorder may have ratios as high as 6:1 (Demos, 2019).Two strategies to reduce high theta-to-beta ratios are amplitude training (down-training theta) and ratio training (rewarding decreases in the theta-to-beta ratio) (Demos, 2019).
Cognitive Decline
Brief memory lapses (senior moments) are associated with LH bursts of rhythmic temporal theta (BORTTs) due to sleepiness or reduced hippocampal perfusion. Assessment and training should incorporate memory tasks. The protocol should inhibit LH temporal lobe theta, particularly at T3. Where BORTTs are produced by drowsiness, training should include behavioral interventions to reduce insomnia (Demos, 2019).While alpha/theta protocols to treat substance use disorders up-train theta, this should be proscribed in epilepsy in the frontal lobes, where it could impair attention or decisions, or in PSTD due to the risk of provoking flashbacks (Demos, 2019).
The movie below is a 19-channel BioTrace+ /NeXus-32 display of theta activity © John S. Anderson. Brighter colors represent higher theta amplitudes. Frequency histograms are displayed for each channel.
ALPHA (8-13 HZ)
The alpha rhythm ranges from 8-12 Hz or 8-13 Hz with 20-60 microvolt synchronous waves. Alpha is the PDR in adults (Rowan & Tolunsky, 2003). Low alpha extends from 8-10 Hz, and high alpha ranges from 11-12 Hz or 11-13 Hz. Low and high refer to frequency and not amplitude.Alpha is defined by its waveform and not by its frequency. For example, a sinusoidal alpha waveform in children may occur at 7 Hz.
Alpha is an idling frequency produced when pools of thalamic neurons fire synchronously as when the eyes are closed. Separate generators produce frontal and occipital alpha. Graphic © John S. Anderson.
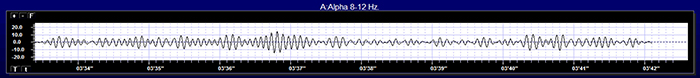
Alpha activity can be observed in about 75% of awake, relaxed individuals. Alpha amplitude is highest in the occipital region and decreases toward the frontal region, where it is the lowest. Alpha spindles, trains of alpha waves visible in the raw EEG, are observed during drowsiness, fatigue, and meditative practice (Demos, 2019; Simon et al., 2011).
Anxiety and TBI can reduce alpha activity during baselines. Since concentration and thinking can suppress alpha, instruct clients to refrain from these activities during recording (Demos, 2019).
Higher peak alpha frequencies may be healthier because they represent faster processing speeds. Peak frequencies slow with age and specific medication. The alpha rhythm is replaced by low-amplitude desynchronized beta activity during movement, complex problem-solving, and visual focusing. This phenomenon is called alpha blocking (Hugdahl, 1995; Thompson & Thompson, 2015).
Clinicians may be concerned with both high and low alpha amplitudes. Elevated LH alpha may signal depression or learning disabilities. Elevated anterior alpha may accompany ADHD, depression, fogginess, and TBI. Widespread 8-12 Hz alpha in both hemispheres may indicate reduced processing speed. Finally, low-amplitude alpha with high-amplitude beta may signify anxiety or vascular headache (Demos, 2019).
The movie below is a 19-channel BioTrace+ /NeXus-32 display of alpha activity under eyes-closed and eyes-open conditions © John S. Anderson.
SENSORIMOTOR RHYTHM (13-15 HZ)
The sensorimotor rhythm (SMR) ranges from 12-15 or 13-15 Hz and is located over the sensorimotor cortex (central sulcus). SMR activity is associated with a state of relaxed wakefulness and motor inhibition.Please click on the podcast icon below to hear a lecture over the second half of this unit.

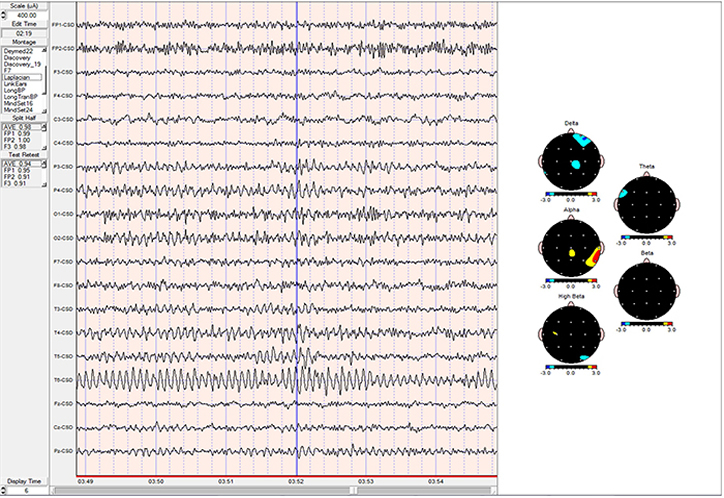
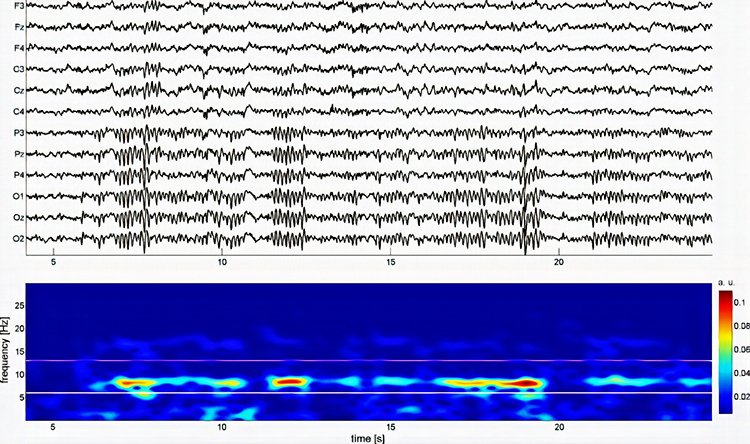
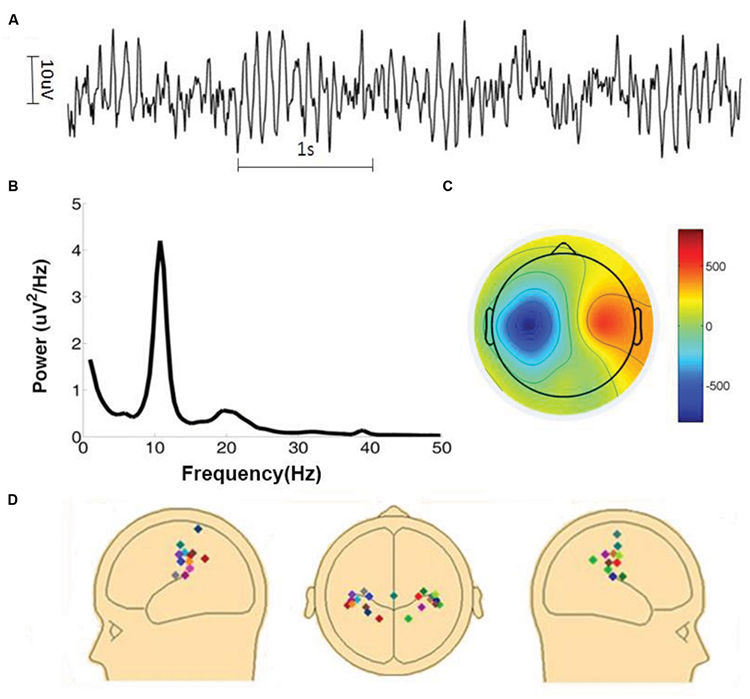
The waves are synchronous. The sensorimotor rhythm may signal an internal focus (Demos, 2019). SMR, like alpha, is an idling rhythm. SMR is associated with the inhibition of movement and reduced muscle tone. The SMR is generated by thalamic ventrobasal relay cells and reentrant thalamocortical loops (Thompson & Thompson, 2015). Siang Yin created the graphic below. A = raw waveform; B = power spectrum, C = topographic plot, and D = sites where SMR was detected.
The movie below is a 19-channel BioTrace+ /NeXus-32 display of SMR activity © John S. Anderson. Brighter colors represent higher SMR amplitudes. Frequency histograms are displayed for each channel. Notice the runs of high-amplitude SMR activity.
BETA (over 12 HZ)
The beta rhythm exceeds 12 Hz with 2-20 microvolts asynchronous waves. Asynchronous means the neurons depolarize and hyperpolarize independently. The beta rhythm is distributed across the scalp with the highest amplitude in the frontal and precentral areas. Whereas the sensorimotor cortex generates the sensorimotor rhythm, beta is generated in the brainstem and cortex. Ascending sensory traffic from the brainstem can override thalamic pacemakers (Andreassi, 2000), and specific cortical regions can produce localized beta activity beneath active electrodes (Thompson & Thompson, 2015). Graphic © John S. Anderson.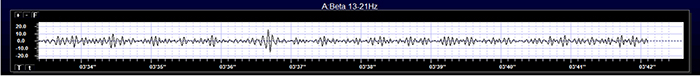
Beta is divided into narrower bands associated with cortical performance and subjective experience. These bands include low beta, high beta, and gamma. Demos (2019) advises that you should specify the actual range of interest.
Low Beta (16-20+ Hz)
The cortex produces low beta when we solve problems like multiplication. When a child correctly answers a math problem, the 17-Hz amplitude may increase while theta and 8-10 Hz alpha amplitude simultaneously decrease. While detected between 12-15 Hz, it is less often seen above 20 Hz (Thompson & Thompson, 2015).High Beta (20-35 Hz)
High beta is correlated with multi-tasking and optimal performance and anxiety, migraine, obsessive-compulsive disorder (OCD), rumination, and worrying. While elevations may indicate a range of disorders, they may represent the brain's compensation for elevated theta. Clinicians rarely reinforce high beta. Instead, they may inhibit high beta and theta (Demos, 2019).Beta Spindles
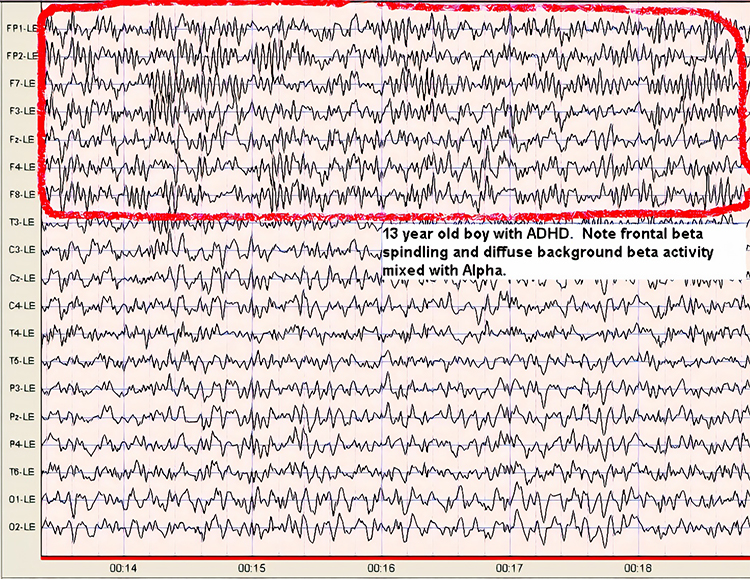
Beta spindles are trains of spindle-like waveforms with frequencies lower than 20 Hz but more often fall between 22 and 25 Hz. Beta spindles may signal ADHD, especially with tantrums, anxiety, autistic spectrum disorders (ASD), epilepsy, and insomnia (Arns et al., 2015; Demos, 2019; Thompson & Thompson, 2015).
19-21 Hz or 20-23 Hz
Clients diagnosed with anxiety disorder frequently show increased power in the 19-21 Hz or 20-23 Hz range compared with 16-18 Hz. Elevations in these ranges may be associated with emotional intensity. The Thompsons (2015) advise clinicians to use open-ended questions to question clients about their mental activity and emotional state when these bands are elevated without telegraphing their expectations.
24-36 Hz
Clients who are distressed, hypervigilant, and who overthink, worry, and ruminate may show marked elevations in this range. A peak in this range may be associated with family or personal substance use disorder and may indicate the instrumental use of drugs to control anxiety. High-amplitude beta in this range is not always a negative indicator since it is also observed when highly intelligent individuals multi-task (Thompson & Thompson, 2015).
The movie below is a 19-channel BioTrace+ /NeXus-32 display of low beta (13-21 Hz) and high beta (22-34 Hz) activity © John S. Anderson. Brighter colors represent higher beta amplitudes. Frequency histograms are displayed for each channel.
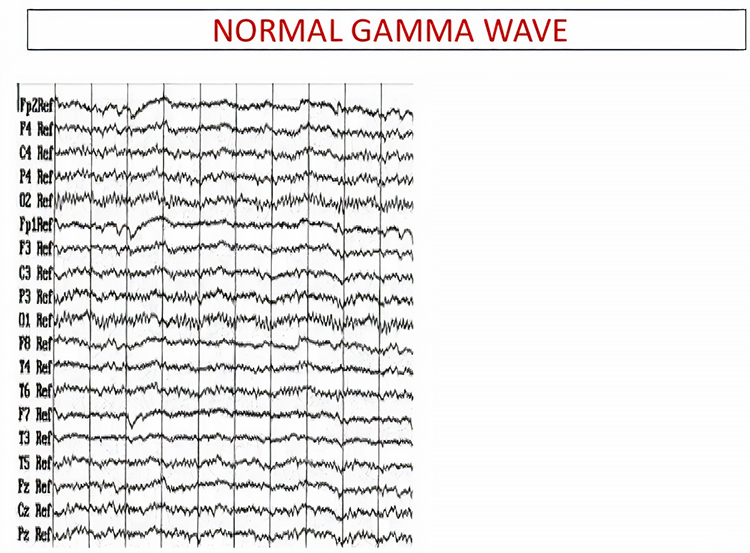
GAMMA (28-80 Hz)
Gamma ranges from 28-80 Hz and includes the Sheer rhythm, which extends from 38-42 Hz. Gamma is not localized but is distributed across the scalp. The overlap between gamma (28-80 Hz) and surface EMG (SEMG) (13-200 Hz) requires that clinicians examine the raw EEG to ensure that training does not reward muscle contraction. Gamma--especially the Sheer rhythm--is associated with learning and problem-solving, meditation, mental acuity, and peak brain function in children and adults. Deficient gamma correlates with deficits in abstract reasoning and memory consolidation (Demos, 2019; Thompson & Thompson, 2015).
There is an increase in 40-Hz activity when individuals perform cognitively demanding tasks. Deficits in this band are associated with learning disorders. This rhythm increases when individuals integrate several attributes into a unified percept (Thompson & Thompson, 2015). For example, 40-Hz activity increases when subjects learn to perceive
meaningful patterns like a Dalmatian concealed by a black and white
background. For this reason, the Sheer rhythm is theorized to be a binding rhythm.
The Sheer rhythm is also associated with peak performance. For example, 40-Hz activity is generated when athletes correct their balance after leaning forward on a balance board. Athletes who have sustained a concussion and suffer impaired balance do not increase 40-Hz power (Demos, 2019; Thompson & Thompson, 2015).
The movie below is a 19-channel BioTrace+ /NeXus-32 display of gamma activity ©
John S. Anderson. . Brighter colors represent higher gamma amplitudes. Frequency histograms are displayed
for each channel. Notice that the mean frequency falls between 38 and 39 Hz.
Waveform Morphology
A wave is a change in the potential difference between two EEG electrodes. Waveform and morphology refer to the shape of the signal generated by oscillating potential differences. Neurofeedback professionals examine the raw waveform's morphology before considering the filtered and quantified EEG (Demos, 2019). EEG activity means a single wave or series of waves (Fisch,1999).
We can distinguish between regular and irregular activity. A regular or monomorphic series of waves are rhythmic with the same frequency and morphology. Rhythmic waves that resemble sine waves are called sinusoidal.
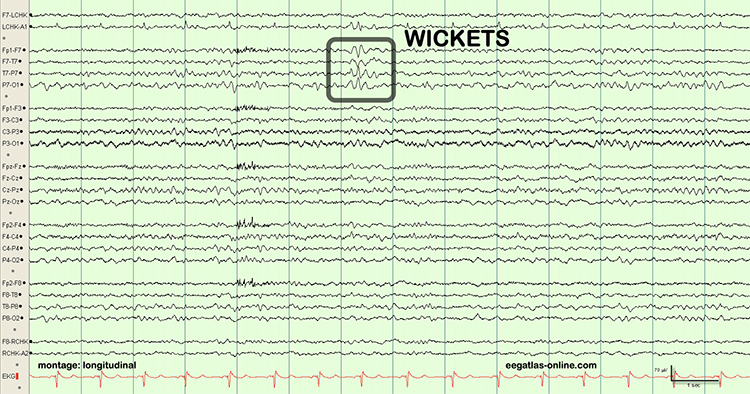
Regular waves may be arch-shaped and resemble wickets. Graphic © eegatlas-online.com.
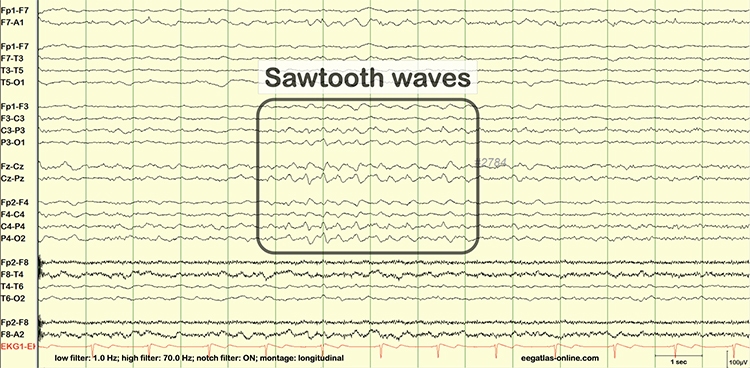
Saw-toothed waves resemble asymmetrical triangles. Graphic © eegatlas-online.com.
Irregular waves continuously change shape and duration. The graphic below shows runs of irregular high-amplitude delta waves.
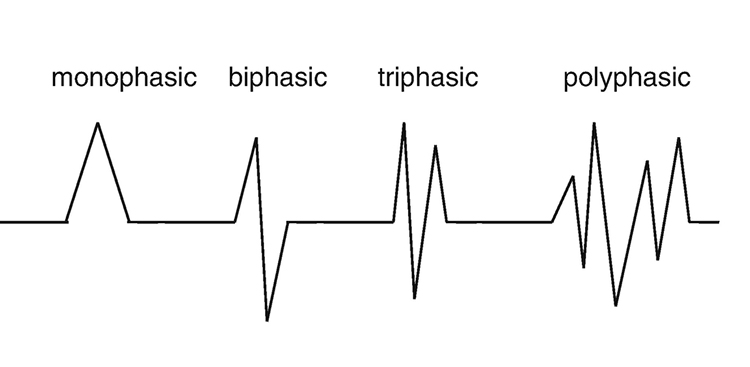
EEG waves may be monophasic or polyphasic. Monophasic waves possess a single upward or downward deflection. Two polyphasic waveforms containing waveforms with two or more elements are diphasic and triphasic waves. Diphasic waves have two elements--one positive and one negative. Triphasic waveforms contain three elements with alternating directions.
A transient is a single wave or series of waves distinct from background EEG activity.
![]()
Sharp transients are waves with steep peaks that are not produced by epilepsy.
![]()
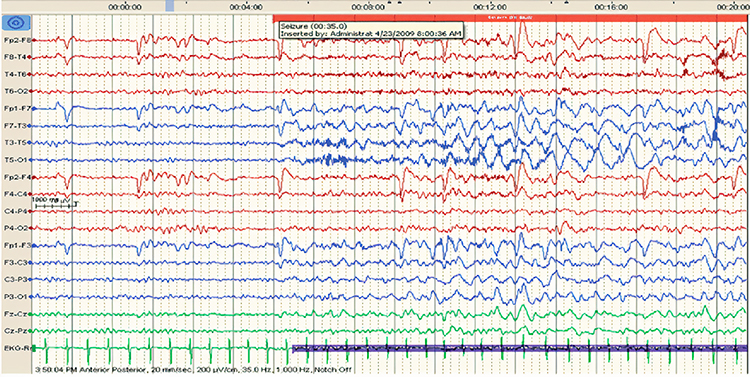
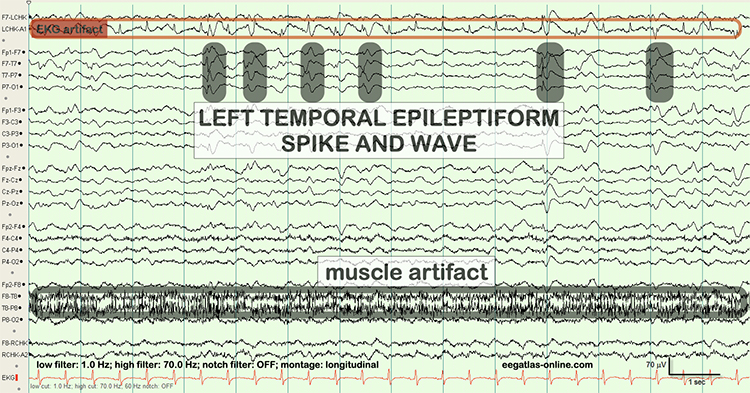
In contrast, epileptiform activity consists of spikes and sharp waves. An epileptiform spike has a sharp appearance and lasts 20-70 ms. Watch the Blausen Epilepsy and Seizure animations. Graphic © eegatlas-online.com.
Less steeply shaped sharp waves last 70-200 ms. Complex denotes a series of waves that share a similar shape.
See the K-complex in the EEG record below. Graphic © eegatlas-online.com.
Source Localization
LORETA, sLORETA, and eLORETA
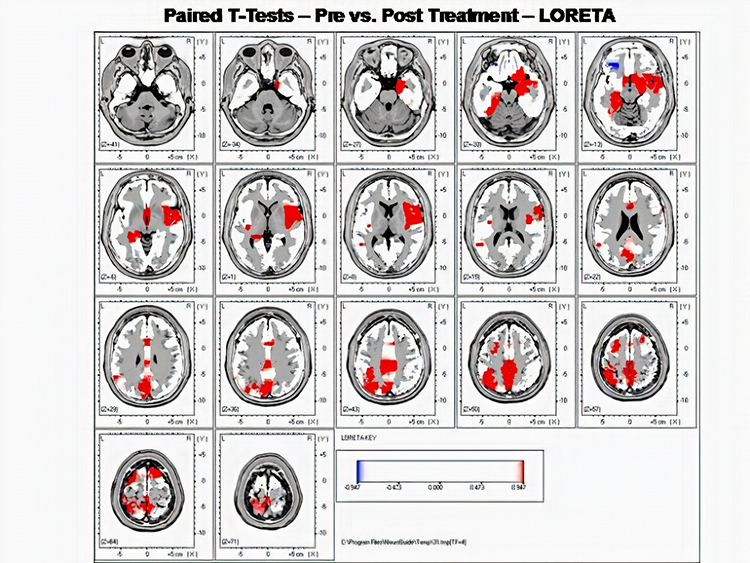
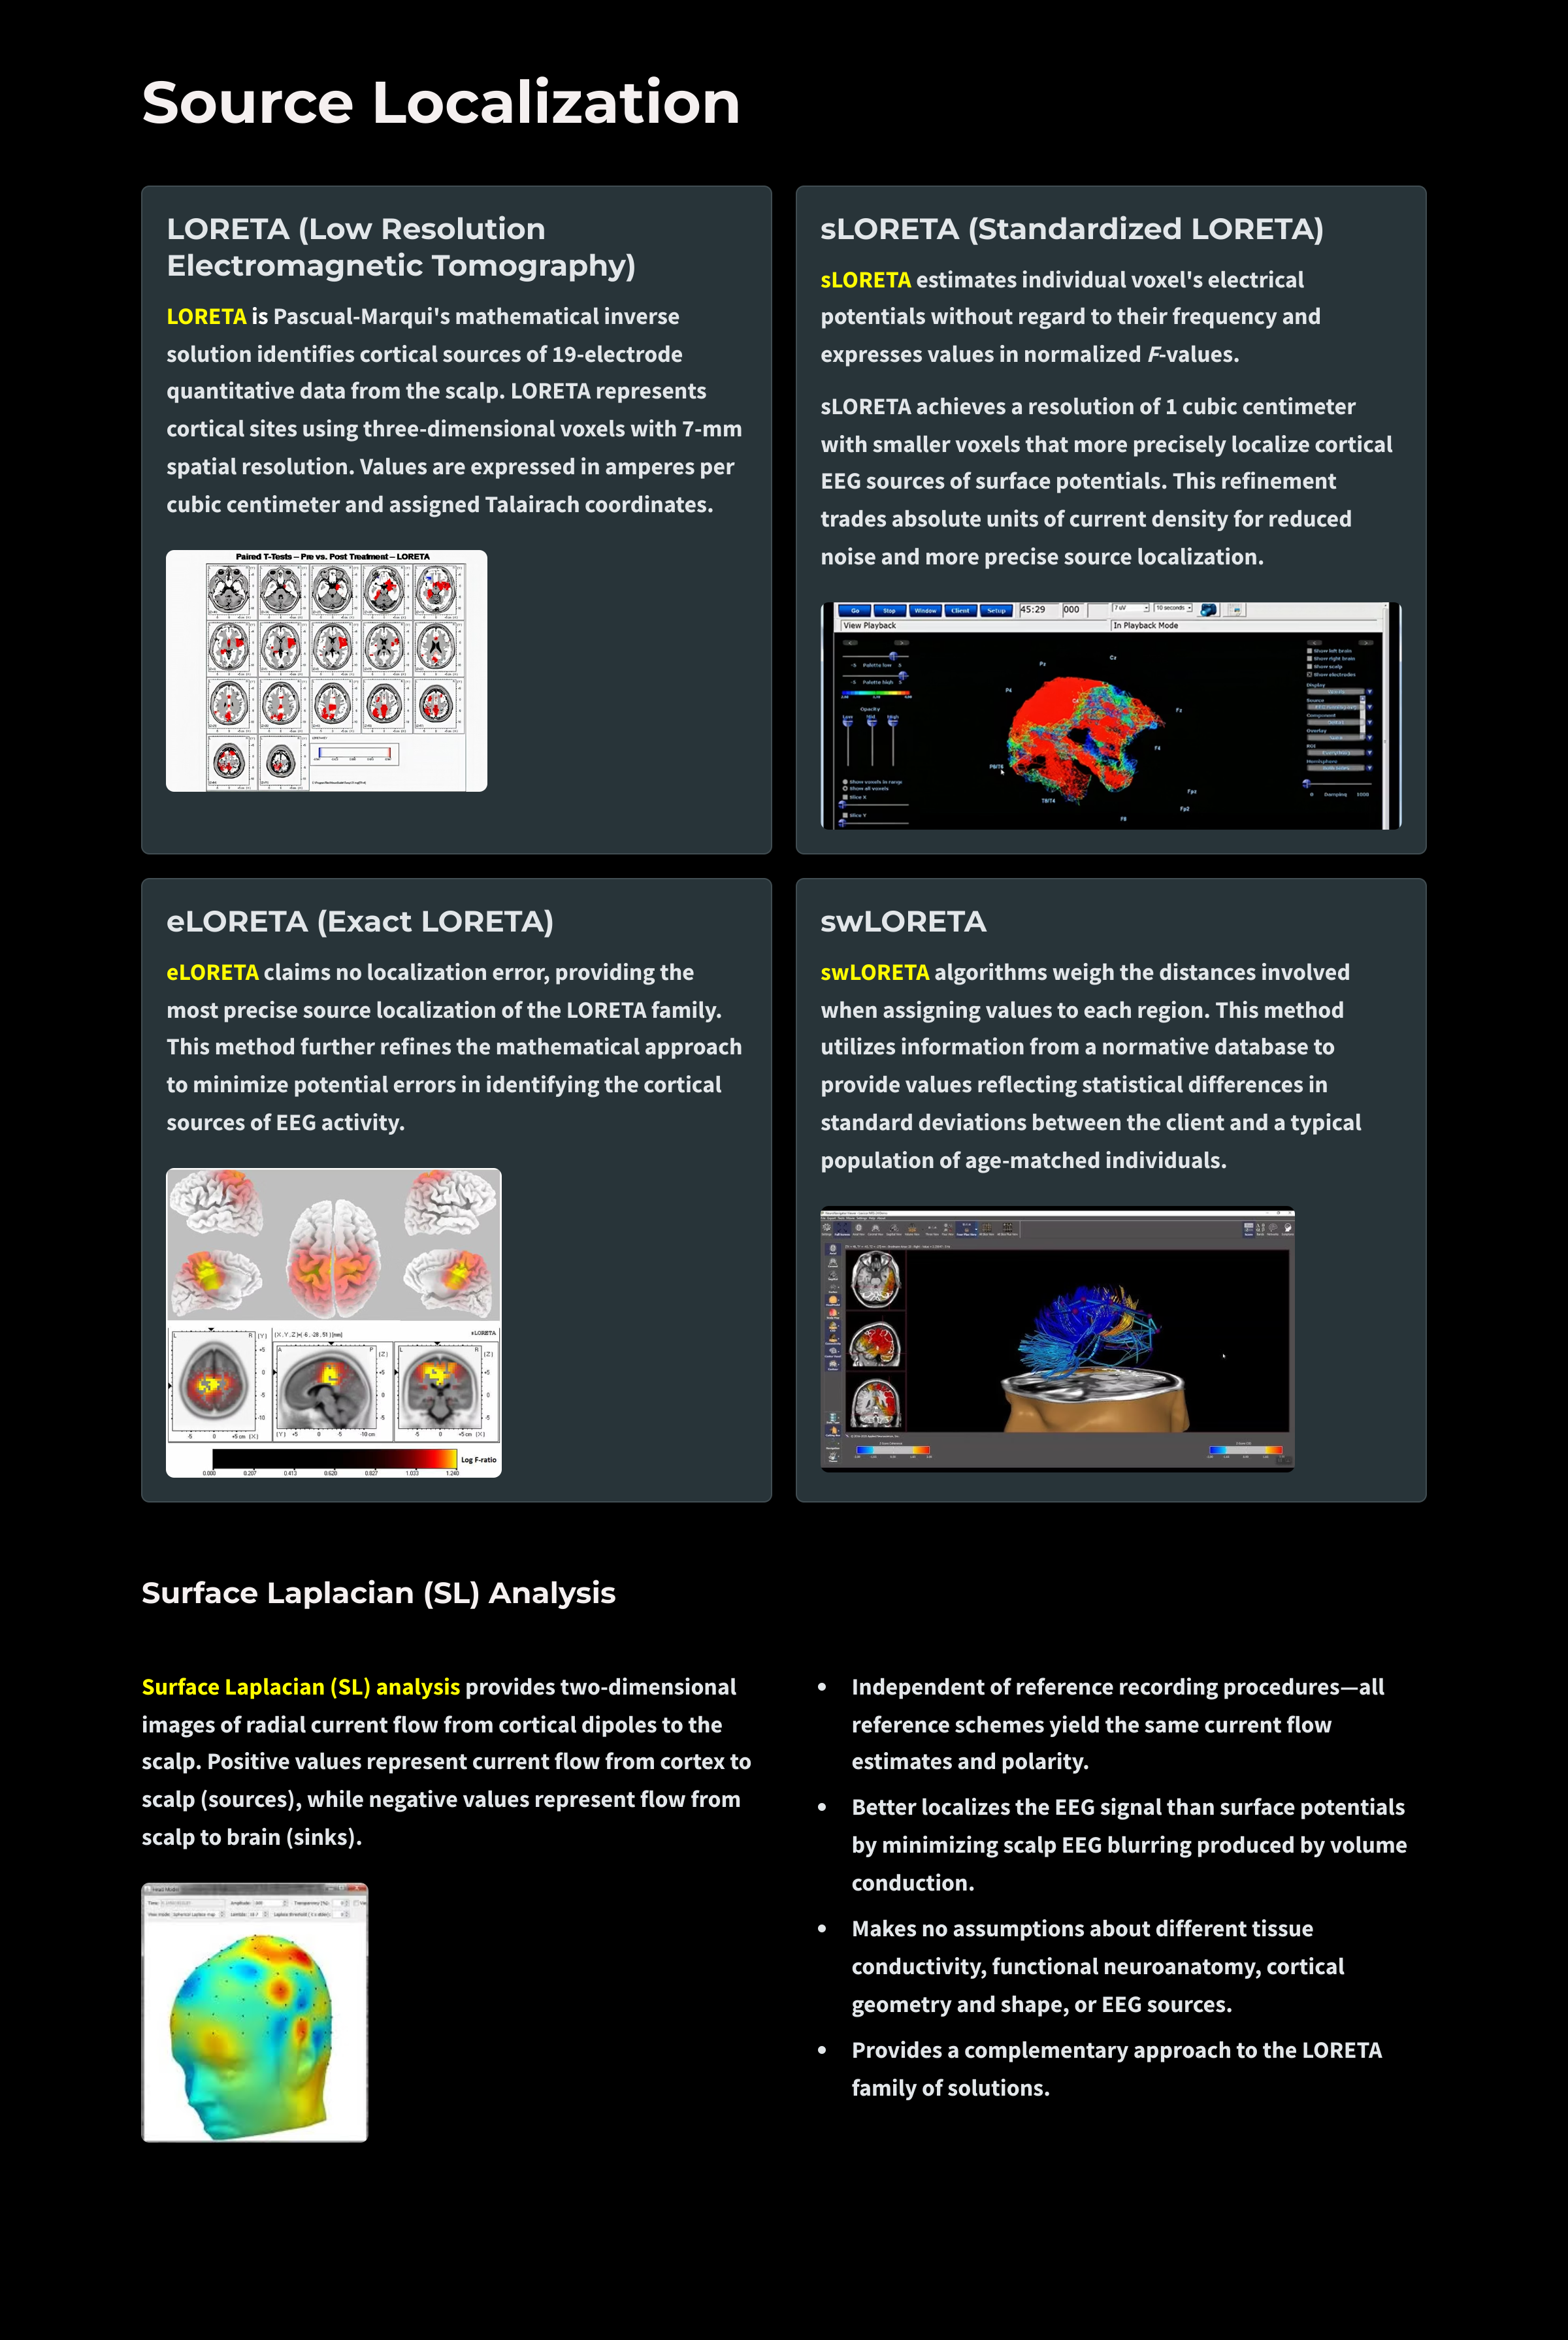
Low resolution electromagnetic tomography (LORETA) is Pascual-Marqui, Michel, and Lehman's (1994) mathematical inverse solution to identify the cortical sources of 19-electrode quantitative data acquired from the scalp. In this context, tomography refers to two-dimensional coronal, horizontal, and sagittal brain slices. LORETA does not identify subcortical sources like the amygdala or thalamus located below the cortical hemispheres (Thompson & Thompson, 2015).LORETA represents cortical sites using three-dimensional voxels, which are volumetric units. While its original voxels had a 7-mm spatial resolution (7 mm x 7 mm x 7 mm), the spatial resolution has increased to 5 mm (5 mm x 5 mm x 5 mm). LORETA values are expressed in amperes per cubic centimeter.
LORETA assigns each voxel x, y, and z Talairach coordinates referencing the original Talairach atlas and subsequent atlases like the Montreal Neurological Institute (MNI) atlas. Talairach coordinate assignment is based on vertical distance from a horizontal line from the anterior commissure (origin) to the posterior commissure. For example, x46, y33, z40 corresponds to Brodmann area 8.
These stereotaxic coordinates are primarily independent of brain shape and volume, which has permitted their use in other imaging methods (e.g., positron emission tomography (PET) and magnetic resonance imaging (MRI). Graphic courtesy of BrainMaster Technologies.
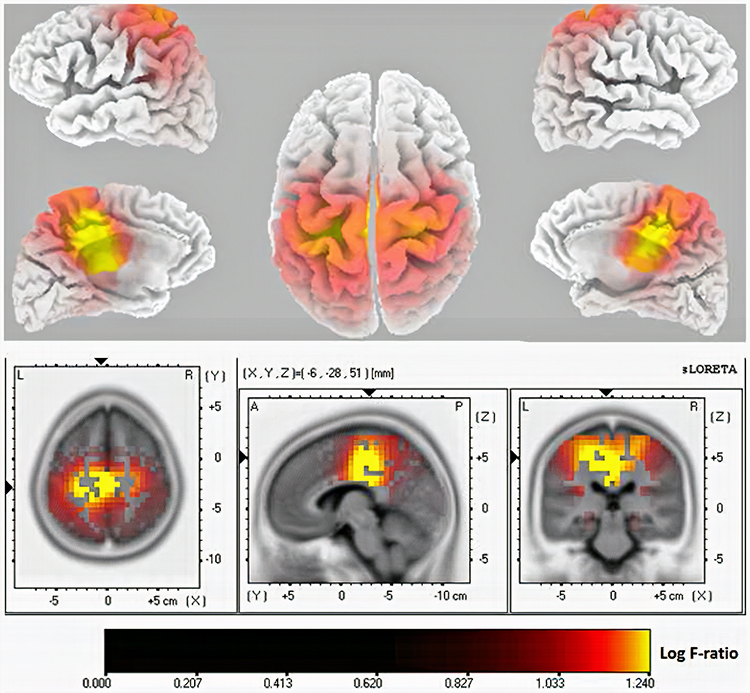
Standardized LORETA (sLORETA) achieves a resolution of 1 cubic centimeter. Smaller voxels more precisely localize cortical EEG sources of surface potentials. sLORETA estimates individual voxel's electrical potentials without regard to their frequency. sLORETA values are expressed in normalized F values. This refinement of LORETA trades absolute units of current density for reduced noise and more precise source localization. This is important because LORETA's "three-sphere model," which assumes different cortex, skull, and skin conductivity, suffers from artifacts ("ghost images") and limited source localization (Thompson & Thompson, 2015). Graphic courtesy of BrainMaster Technologies.
A third version of LORETA, eLORETA, exact low resolution brain electromagnetic tomography, claims no localization error (Thompson & Thompson, 2015). Graphic of theta distribution courtesy of Canuet et al. (2011).
Laplacian Analysis
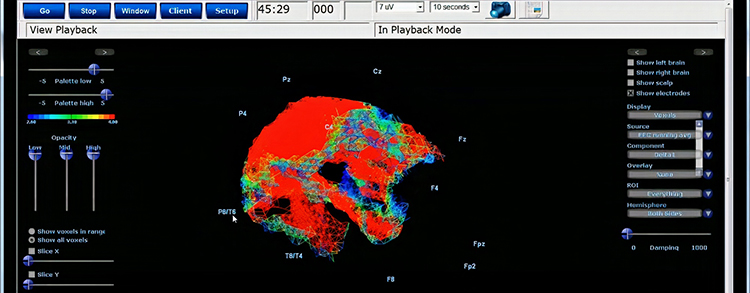
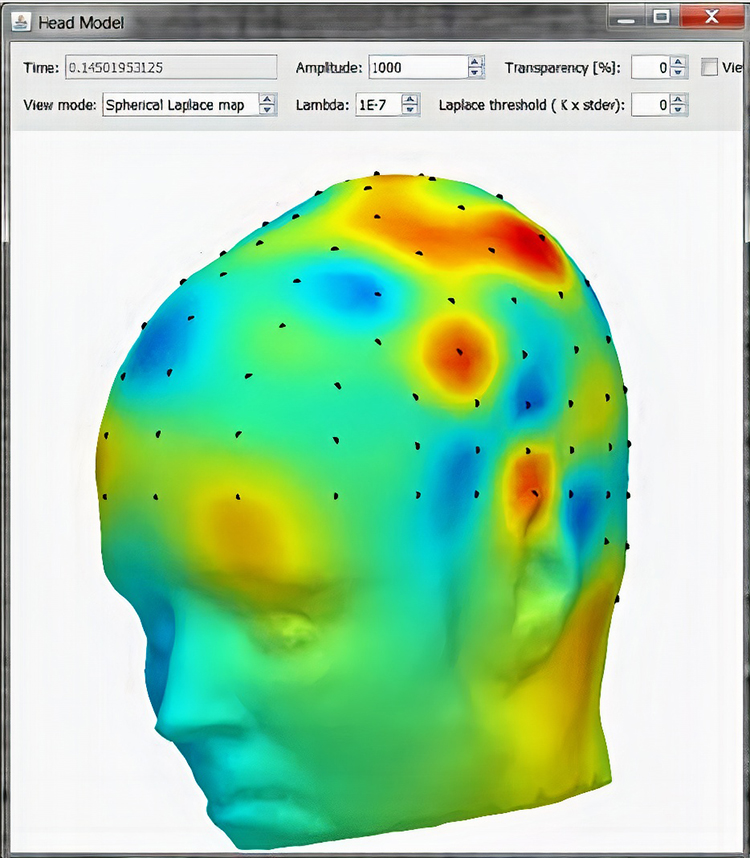
Surface Laplacian (SL) analysis, which is also called current source density (CSD) and scalp current density (SCD), is a family of mathematical algorithms that provide two-dimensional images of radial current flow from cortical dipoles to the scalp. Positive values represent the current flow from the cortex to the scalp (sources). Negative values represent the current flow from the scalp to the brain (sinks).Unlike the LORETA family of inverse solutions, SL analysis is independent of reference recording procedures--all reference schemes will yield the same current flow estimates and polarity. SL analysis better localizes the EEG signal than surface potentials because it minimizes scalp EEG blurring produced by volume conduction. Finally, unlike inverse solutions, SL makes no assumptions about different tissue conductivity, functional neuroanatomy, cortical geometry and shape, and EEG sources (Kayser & Tenke, 2015).
Clinically Significant Raw Waveforms
Clinically significant raw waveforms include kappa rhythm, lambda waves, vertex sharp transients, mu waves, spike and wave, SMR, sleep spindles, and K-complexes.
Kappa Rhythm
The kappa rhythm consists of very low amplitude activity in the alpha or theta range detected over temporal sites during mental activity. Their source (cortical effort or eyelid flutter) is controversial (Fisch, 1999).Lambda Waves
Lambda waves are positive sawtooth-shaped sharp transients detected from occipital sites when individuals view detailed images. Lambda waves last about 200-250 ms and appear as positive occipital sharp transients (POSTs) detected during sleep. These waves won't be observed in clinical EEGs unless the assessment includes viewing complex images. While the presence or absence of lambda waves is not abnormal, striking asymmetry may indicate an abnormality located on the lower amplitude side (Fisch, 1999). Graphic © eegatlas-online.com.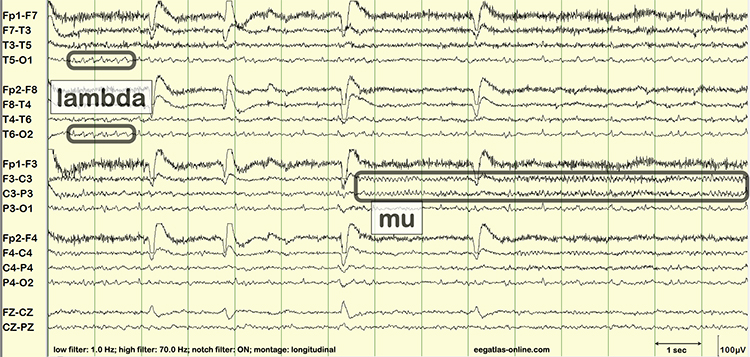
Vertex Sharp Transients
Negative polarity vertex sharp transients (V waves) are detected at the vertex in sleep records but are not usually observed during wakefulness. Rare in adults and more easily elicited in children, V waves may be evoked by unexpected stimuli like clapping. They may be a late evoked potential component independent of sensory modality and not confined to a specific sensory region. Their amplitude is greater during sleep than wakefulness (Fisch, 1999). Graphic © eegatlas-online.com.Mu Waves
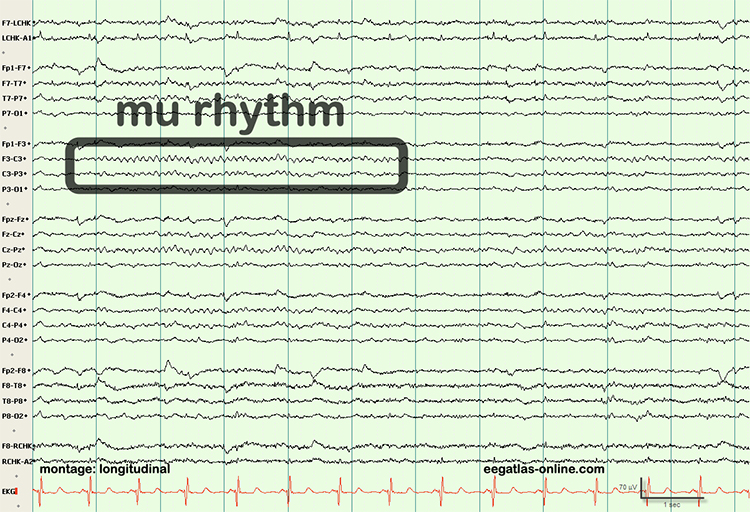
The mu rhythm is observed in less than 7% of EEG records, more often in younger adults (Thompson & Thompson, 2015). These 7- to 11-Hz waves resemble wickets and appear as several-second trains over sensorimotor, and less commonly, parietal sites. View the raw EEG at C3 and C4. Mu waves have been associated with mirror neurons and may be observed in children and adults on the autism spectrum. Clinicians inhibit mu activity during training and do not reinforce mu amplitude (Demos, 2019).Clinicians must distinguish the mu rhythm from alpha since they share common frequencies. Alpha waves are sinusoidal instead of wicket-shaped. Mu activity increases when clients reduce motor activity. Mainly contralateral mu activity is suppressed by making a fist, while alpha is not. The alpha rhythm is blocked when clients open their eyes; the mu rhythm is unaffected. The mu rhythm may be evoked by visual scanning tasks (Demos, 2019; Fisch, 1999). Graphic © eegatlas-online.com.
Spike-and-Wave Complexes
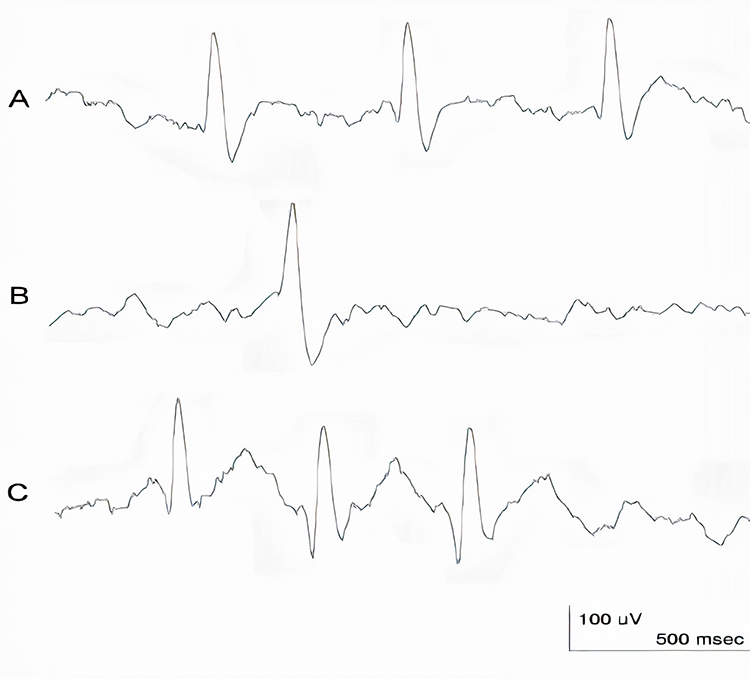
Spike-and-wave complexes consist of a spike that is succeeded by a slow wave. In the graphic below,A shows spikes, B represents sharp waves, and C is a spike-and-wave complex. Spike-and-wave complexes have a frequency of 3 Hz with amplitudes over 160 microvolts. They are observed in absence seizures (Thompson & Thompson, 2015).
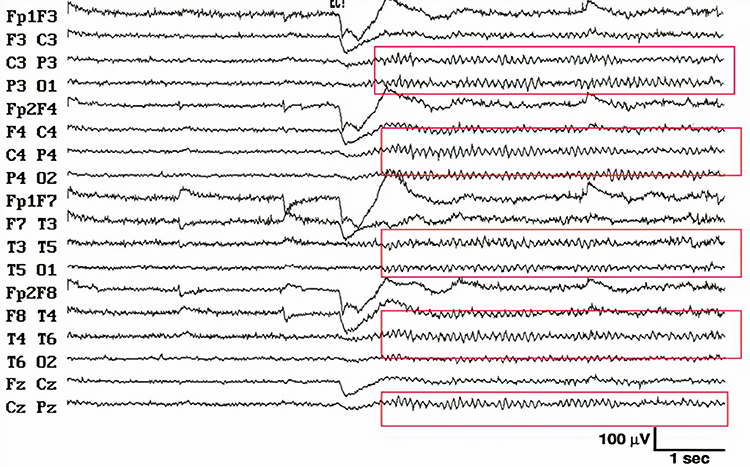
Sensorimotor Rhythm (SMR)
The 13-15 Hz spindle-shaped sensorimotor rhythm (SMR) is detected from the sensorimotor strip when individuals reduce attention to sensory input and reduce motor activity. Where we observe these frequencies at other scalp locations, they appear as desynchronized beta without spindling. The spindle shape is better visualized in microelectrode recordings than scalp EEGs. Since SMR is associated with mental calm and thinking before acting, clinicians may uptrain this rhythm in clients diagnosed with ADHD (Thompson & Thompson, 2015).
Sleep Spindles
Sleep spindles range from 12-15 Hz and last from 0.5 to several seconds. They resemble SMR spindles, occupy the same frequencies, and are concentrated at central sites. Unlike SMR, which is confined to the sensorimotor strip, sleep spindles are widely distributed over the scalp and are observed during Stage 2 and 3 sleep (Thompson & Thompson, 2015). Graphic © eegatlas-online.com.K-Complexes
K-complexes are also observed in Stage 2 sleep. These sharp negative waveforms reach amplitudes over microvolts, succeeded by a more prolonged moderate-to-high-amplitude positive wave. Graphic © eegatlas-online.com.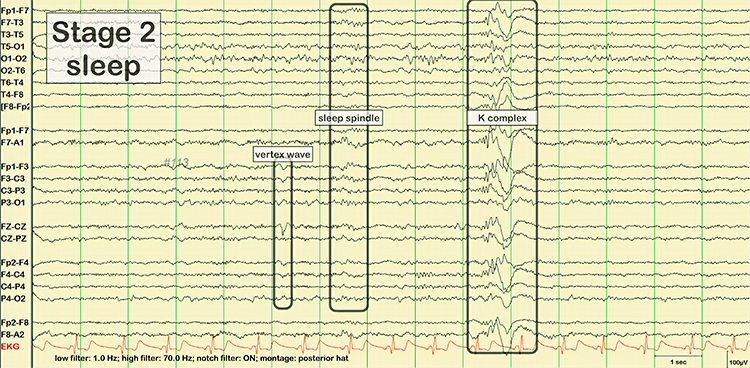
Glossary
alpha blocking: the replacement of the alpha rhythm by low-amplitude desynchronized beta activity during movement, attention, mental effort like complex problem-solving, and visual processing.
alpha rhythm: 8-12-Hz activity that depends on the interaction between rhythmic burst firing by a subset of thalamocortical (TC) neurons linked by gap junctions and rhythmic inhibition by widely distributed reticular nucleus neurons. Researchers have correlated the alpha rhythm with "relaxed wakefulness." Alpha is the dominant rhythm in adults and is located posteriorly. The alpha rhythm may be divided into alpha 1 (8-10 Hz) and alpha 2 (10-12 Hz).
alpha spindles: trains of alpha waves that are visible in the raw EEG and are observed during drowsiness, fatigue, and meditative practice
amplitude: the strength of the EMG signal measured in microvolts or picowatts.
analog: the representation of a signal by a continuously variable physical property like voltage.
analog filter: analog circuits designed using components like capacitors, resistors, and operational amplifiers designed to remove or enhance signal components.
analog-to-digital (A/D) converter: an electronic device that converts continuous signals to discrete digital values.
asynchronous waves: EEG activity where neurons depolarize and hyperpolarize independently.
beta rhythm: 12-38-Hz activity associated with arousal and attention generated by brainstem mesencephalic reticular stimulation that depolarizes neurons in both the thalamus and cortex. The beta rhythm can be divided into multiple ranges: beta 1 (12-15 Hz), beta 2 (15-18 Hz), beta 3 (18-25 Hz), and beta 4 (25-38 Hz).
beta spindles: trains of spindle-like waveforms with frequencies that can be lower than 20 Hz but more often fall between 22 and 25 Hz. They may signal ADHD, especially with tantrums, anxiety, autistic spectrum disorders (ASD), epilepsy, and insomnia.
bit: binary digit; the smallest measurement unit for quantifying information that assumes a value of 0 or 1.
bit number: the number of voltage levels that an A/D converter can discern. A resolution of 16 bits means that the converter can discriminate among 65,536 voltage levels.
complex: a series of waves that share a similar shape.
delta rhythm: 0.05-3 Hz oscillations generated by thalamocortical neurons during stage 3 sleep.
desynchrony: pools of neurons fire independently due to stimulation of specific sensory pathways up to the midbrain and high-frequency stimulation of the reticular formation and nonspecific thalamic projection nuclei.
digital: representation of a signal property like voltage using a series of the digits 0 and 1.
digital filter: a circuit that uses digital processors, like a digital signal processing (DSP) chip, to remove or enhance signal components.
digitization: encoding analog information like continuously changing voltage into a series of the digits 0 and 1.
diphasic waves: waves that possess two elements--one positive and one negative.
dominant frequency: the frequency with the greatest amplitude; at least 13 Hz in awake adults.
dynamic range: the ability to sample a wide range of signal voltages.
EEG activity: a single wave or series of waves.
epileptiform activity: spikes and sharp waves associated with seizure disorders.
epoch: signal sampling period; commonly, a 1-s sample of EEG activity.
exact low resolution brain electromagnetic tomography (eLORETA): a version of LORETA that claims no localization error.
Fast Fourier Transform (FFT): a mathematical transformation that converts a complex signal into component sine waves whose amplitude can be calculated.
FFT filter: a filter that uses Fast Fourier transforms to calculate the average voltage of an EEG signal's component frequencies for a specified period.
filter: an electronic circuit that removes or enhances signal components.
FIR filter: a filter that continuously updates its averaging of EEG voltage with new data points.
frequency: the number of complete cycles that an AC signal completes in a second, usually expressed in hertz.
gamma: 28-80 Hz rhythm that includes the 38-42 Hz Sheer rhythm and is associated with learning and problem-solving, meditation, mental acuity, and peak brain function in children and adults.
hertz (Hz): unit of frequency measured in cycles per second.
high beta: 20-35 Hz rhythm correlated with multi-tasking and optimal performance and anxiety, migraine, obsessive-compulsive disorder (OCD), rumination, and worry.
high-frequency filter (HFF; low-pass filter): a filter that attenuates frequencies above a cutoff frequency.
IIR filter: a recursive filter that uses part of its output as input. IIR filters attenuate frequencies outside the bandpass more sharply than FIR filters with the same order, have greater time delay (that depends on frequency) due to greater filter sharpness, achieve faster computation due to their lower order, and are less stable than FIR filters.
irregular waves: EEG waves that continuously change shape and duration.
Joint time-frequency analysis (JTFA): an algorithm that computes values on each data point at rates up to 256 times per second without using a fixed epoch length. Where FFT simultaneously calculates amplitudes for all frequency bands, JTFA analyzes preselected bands.
K-complex: sharp negative waveforms that reach amplitudes over microvolts succeeded by a longer moderate-to-high-amplitude positive wave observed in Stage 2 sleep.
kappa rhythm: very low amplitude activity in the alpha or theta range detected over temporal sites during mental activity.
low beta: 16-20+ Hz rhythm associated with successful problem-solving.
low resolution electromagnetic tomography (LORETA): Pascual-Marqui's (1994) mathematical inverse solution to identify the cortical sources of 19-electrode quantitative data acquired from the scalp.
low-frequency filter (high-pass filter): a circuit that filters out low-frequency activity and passes only the frequencies above a set value (e.g., 1.6 Hz).
magnitude: the average amplitude over a unit of time using quantification methods like peak-to-peak (P-P) and root mean square (RMS).
microvolt: one-millionth of a volt.
monomorphic waves: series of waves that are rhythmic with the same frequency and morphology.
morphology: the shape of the signal generated by oscillating potential differences.
mu rhythm: 7-11-Hz waves resemble wickets and appear as several-second trains over central or centroparietal sites (C3 and C4).
notch filter: a circuit that suppresses a narrow band of frequencies, such as those produced by line current at 50/60Hz.
order: the maximum delay in samples used in creating each output sample.
peak-to-peak (p-p): a signal quantification method that measures waveform "height" from peak to trough.
percent power: the expression of power within a frequency band as a percentage of total EEG power.
polyphasic waves: waveforms with two or more elements; diphasic and triphasic waves.
posterior dominant rhythm (PDR): the highest-amplitude frequency detected at the posterior scalp when eyes are closed.
power: amplitude squared and may be expressed as microvolts squared or picowatts/resistance.
Quantitative EEG (qEEG): digitized statistical brain mapping using at least a 19-channel montage to measure EEG amplitude within specific frequency bins.
raw EEG signal: oscillating electrical potential differences detected from the scalp.
reference electrode: an electrode that is placed on the scalp, earlobe, or mastoid.
regular waves: rhythmic waves with the same frequency and morphology.
root mean square (RMS): a signal quantification method that calculates the area under the EEG waveform and is analogous to the weight of an object.
sampling rate: the number of times per second that an ADC samples the EEG signal.
sampling resolution: the number of digital bits used to represent a signal.
saw-toothed waves: waves that resemble asymmetrical triangles.
sensorimotor rhythm (SMR): 13-15 Hz spindle-shaped sensorimotor rhythm (SMR) detected from the sensorimotor strip when individuals reduce attention to sensory input and reduce motor activity.
sharp transients: waves with steep peaks that are not produced by epilepsy.
sharp waves: steeply-shaped waves with 70-200 ms duration.
Sheer rhythm: a 38-42 Hz rhythm associated with learning and problem-solving, meditation, mental acuity, and peak brain function in children and adults.
sinusoidal: rhythmic waves that resemble sine waves.
sleep spindle: waves that range from 12-15 Hz and last from 0.5 to several seconds widely distributed over the scalp and are observed during Stage 2 and 3 sleep.
spike: a waveform with a sharp appearance that lasts 20-70 ms.
spike-and-wave complexes: spikes that are succeeded by slow waves.
standardized LORETA (sLORETA): a refinement of LORETA that estimates each voxel's electrical potentials without regard to their frequency, expresses normalized F-values, and achieves a 1-cubic-cm resolution.
surface Laplacian (SL) analysis: a family of mathematical algorithms that provide two-dimensional images of radial current flow from cortical dipoles to the scalp.
synchrony: the coordinated firing of pools of neurons due to pacemakers and mutual coordination.
Talairach coordinate: coordinate assignment based on vertical distance from a horizontal line from the anterior commissure (origin) to the posterior commissure; referenced to the Talairach or Montreal atlases.
theta rhythm: 4-8-Hz rhythms generated a cholinergic septohippocampal system that receives input from the ascending reticular formation and a noncholinergic system that originates in the entorhinal cortex, which corresponds to Brodmann areas 28 and 34 at the caudal region of the temporal lobe.
transient: a single wave or series of waves distinct from background EEG activity.
triphasic wave: a wave that consists of three elements with alternating directions.
vertex (Cz): the intersection of imaginary lines drawn from the nasion to inion and between the two preauricular points in the International 10-10 and 10-20 systems.
vertex sharp transient (V wave): a negative-polarity waveform detected at the vertex in sleep records but are not usually observed during wakefulness.
voxel: a volumetric unit.
wave: a plot of voltage using a bipolar (positive/negative) scale with zero in the middle; the analog form of the signal in which voltage continuously varies.
waveform: the shape of the signal that is generated by oscillating potential differences between two electrodes.
TEST YOURSELF ON CLASSMARKER
Click on the ClassMarker logo below to take a 10-question exam over this entire unit.

REVIEW FLASHCARDS ON QUIZLET PLUS
Click on the Quizlet logo to review our chapter flashcards.

Visit the BioSource Software Website
BioSource Software offers Physiological Psychology, which satisfies BCIA's Physiological Psychology requirement, and Neurofeedback100, which provides extensive multiple-choice testing over the Biofeedback Blueprint.

Assignment
Now that you have completed this module, write down the frequency bands you uptrain and downtrain in clinical or peak performance practice and explain the rationale for these choices.
References
Collura, T. F. (2014). Technical foundations of neurofeedback. Taylor & Francis.
Demos, J. N. (2019). Getting started with neurofeedback (2nd ed.). W. W. Norton & Company.
Fisch, B. J. (1999). Fisch and Spehlmann's EEG primer (3rd ed.). Elsevier.
Hugdahl, K. (1995). Psychophysiology: The mind-body perspective. Harvard University Press.
Kayser, J., & Tenke, C. E. (2015). On the benefits of using surface Laplacian (current source density) methodology in electrophysiology. Int J Psychophysiol, 97(3), 171-173. https://dx.doi.org/10.1016%2Fj.ijpsycho.2015.06.001
Libenson, M. H. (2010). Practical approach to electroencephalography. Saunders Elsevier.
Lubar, J. F. (2001). Rationale for choosing bipolar versus referential training. Journal of Neurotherapy, 4(3), 94–97.
Nunez, P. L., & Srinivasan, R. (2006). Electric fields of the brain (2nd ed.). Oxford University Press.
Rowan, A. J., & Tolunsky, E. (2003). Primer of EEG with a mini-atlas. Butterworth-Heinemann.
Simon, M., Schmidt, E. A., Kincses, W. E., Fritzsche, M., Bruns, A., Aufmuth, C., Bogdan, M., Rosenstiel, W., & Schrauf, M. (2011). EEG alpha spindle measures as indicators of driver fatigue under real traffic conditions. Clinical Neurophysiology, 122(6), 1168–1178. https://doi.org/10.1016/j.clinph.2010.10.044
Thompson, M., & Thompson, L. (2015). The biofeedback book: An introduction to basic concepts in applied psychophysiology (2nd ed.). Association for Applied Psychophysiology and Biofeedback.