Developing Treatment Protocols
What You Will Learn in This Chapter
How did neurofeedback evolve from a handful of pioneering laboratory experiments into a diverse clinical field with multiple competing training approaches? In this chapter, you will trace that journey, from the earliest alpha and SMR training experiments of the 1960s through the sophisticated database-guided methods that clinicians use today. Along the way, you will meet the key figures whose observations, experiments, and clinical innovations shaped how practitioners design neurofeedback protocols.
You will examine how quantitative EEG databases and clinical assessment tools have transformed protocol development from an intuitive art into an increasingly evidence-informed science. Whether you work in a VA hospital, a private clinic, or a performance optimization setting, understanding this evolution will help you make better-informed decisions about which protocols to select and why. By the end, you will be equipped to evaluate the strengths and limitations of the major schools of thought that guide current practice.
BCIA Blueprint Coverage: This unit addresses VII. Developing Treatment Protocols - A. Evolution of Neurofeedback Protocols (7A) and B. Steps in Protocol Development and Treatment Planning (7B).
Learning Objectives
After completing this section, you will be able to:
Describe the historical evolution of neurofeedback training protocols from early alpha and SMR experiments to modern approaches.
Explain the contributions of key pioneers including Kamiya, Sterman, Lubar, Monastra, and the Othmers to neurofeedback protocol development.
Compare and contrast normative database, clinical database, and z-score approaches to training protocol design.
Identify the factors that contribute to an effective neurofeedback training protocol.
Evaluate the strengths and limitations of different schools of thought in neurofeedback training.
Overview
This section introduces the concept of a neurofeedback protocol, explains how protocols developed historically, and examines what makes a protocol effective. You will see how early observational discoveries evolved into structured training approaches and why the definition of "protocol" matters for your clinical practice.
The development of neurofeedback training protocols has been an evolutionary process. Some protocols grew out of early observational results from research studies, while others emerged from deliberate attempts to modify the human or animal EEG. The term protocol refers to a rigorously organized plan for teaching individuals to achieve proficiency through instruction and practice. In neurofeedback, this means using reinforcement and real-time feedback to help a person develop improved skill in a specific cognitive, mental, or central nervous system task.
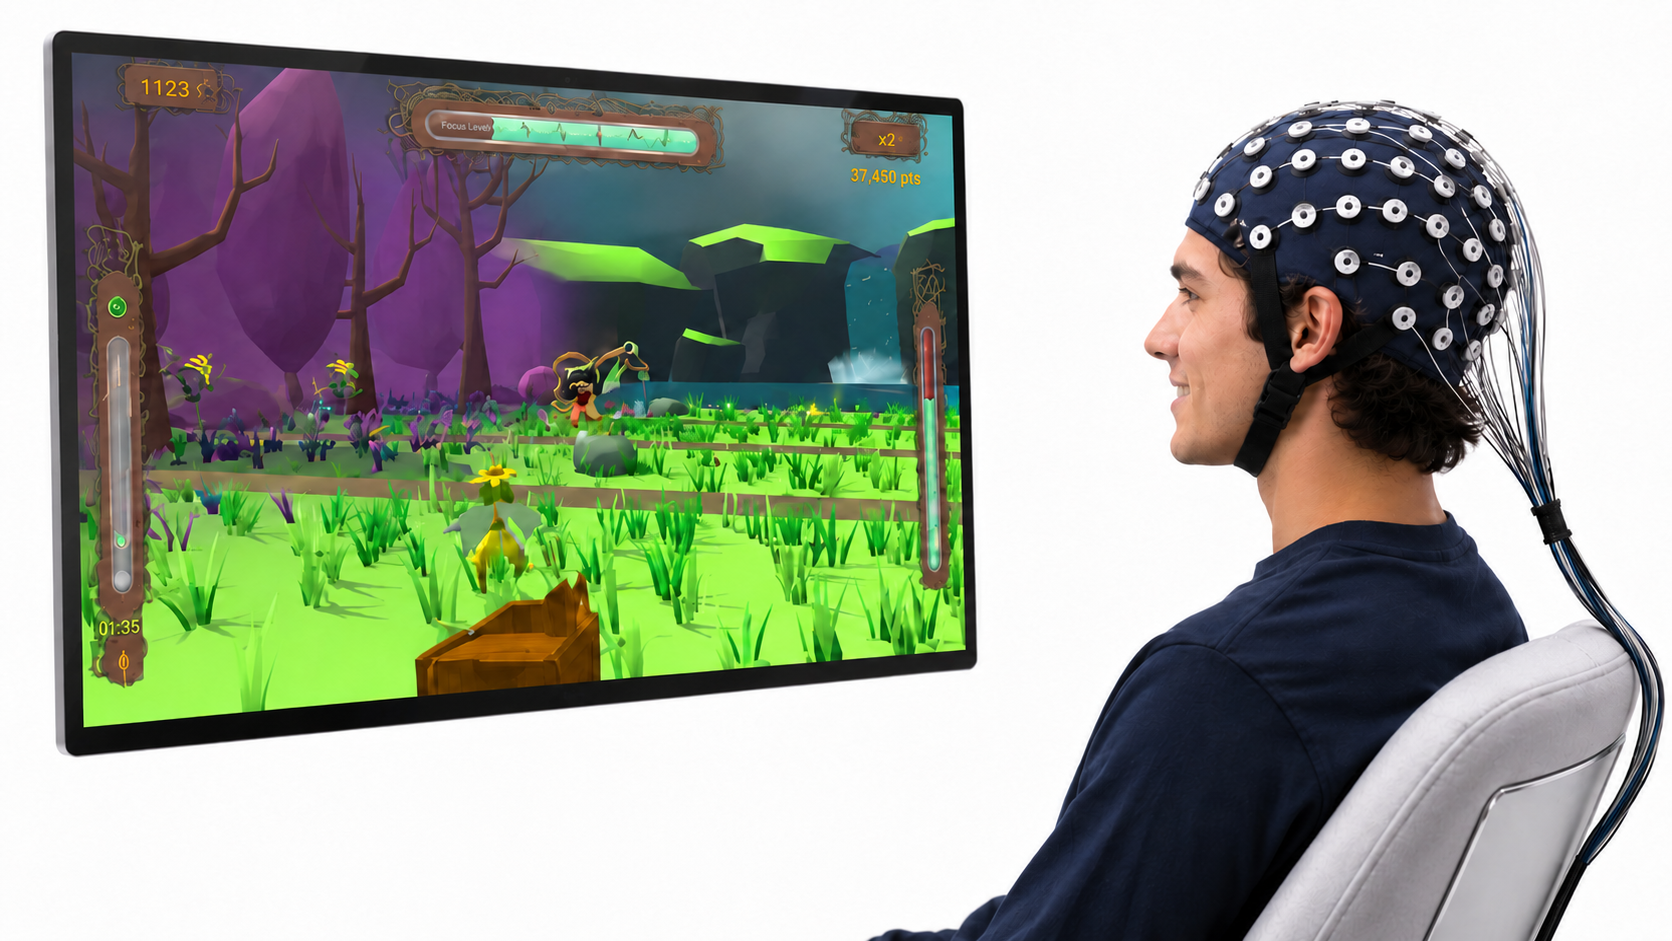
The National Institutes of Health offers a complementary definition: a protocol is "a detailed plan of a scientific or medical experiment, treatment, or procedure" that specifies what will be done, how, and why (National Cancer Institute, n.d.). This more research-oriented framing highlights an important point: a well-designed protocol is not just a set of equipment settings but a carefully reasoned training plan in which the clinician has identified a target condition and chosen a specific approach to address it. Generally accepted definitions describe neurofeedback as a process of operant conditioning that leads to self-regulation of brain activity, or as Marzbani and colleagues (2016) put it, a kind of biofeedback that teaches self-control of brain functions by measuring brain waves and providing a feedback signal.
However, Strehl (2014) argued that the learning process behind neurofeedback requires more than operant conditioning and simple feedback alone. We must also account for classical conditioning, skill learning, and motivational factors. As she noted, all types of learning, including neurofeedback, result from trial and error, conscious and unconscious responses to events, and an awareness of results. To help clients transfer these new skills into everyday life (a process called generalization), clinicians need to incorporate a behavioral therapy approach into the training process.
In clinical practice, "protocol" has come to mean a set of training guidelines applied based on specific assessment criteria or, in some cases, a simple diagnostic category such as attention deficit hyperactivity disorder (ADHD). Preset training approaches have been helpful by allowing new practitioners to begin treating clients without necessarily understanding all of the science behind each choice. However, this ease of use has sometimes led minimally experienced clinicians to apply protocols without proper assessment or monitoring, potentially missing negative consequences of inappropriate training. Therefore, protocols should always be applied with an understanding of why an approach is appropriate for a given client, grounded in adequate assessment and a level of licensure, certification, training, and experience that qualifies the practitioner to provide care.
Neurofeedback protocols are structured training plans that use reinforcement and real-time feedback to help clients develop improved self-regulation of brain activity. Effective protocols require more than simple operant conditioning; they must also account for classical conditioning, skill learning, motivational factors, and generalization to daily life. While standardized protocols have made neurofeedback more accessible, they must always be applied with proper assessment, ongoing monitoring, and sound clinical judgment.
BCIA Blueprint Coverage
This unit covers VII. Developing Treatment Protocols - A. Evolution of Neurofeedback Protocols and B. Steps in Protocol Development and Treatment Planning.

This unit covers the History of Neurofeedback Training Protocols, Defining an Effective Training Protocol, and Primary Schools of Thought in Neurofeedback Training.
History of Neurofeedback Training Protocols
This section traces the origins of neurofeedback through the work of two foundational researchers, Joe Kamiya and Barry Sterman. You will learn how Kamiya's alpha training experiments launched the field and how Sterman's work with cats led to the first clinical applications for epilepsy. Together, these pioneers established the core principle that specific EEG patterns can be identified, trained through operant conditioning, and produce lasting behavioral changes.
The story begins with the alpha rhythm, the first EEG pattern identified by Hans Berger in 1929. Alpha activity is generally defined as oscillations in the 8-12 Hz range and is associated with relaxed wakefulness. Two early researchers, Joe Kamiya and Barry Sterman, took this foundational knowledge in dramatically different directions, and their parallel discoveries would shape the entire field of neurofeedback.
Kamiya
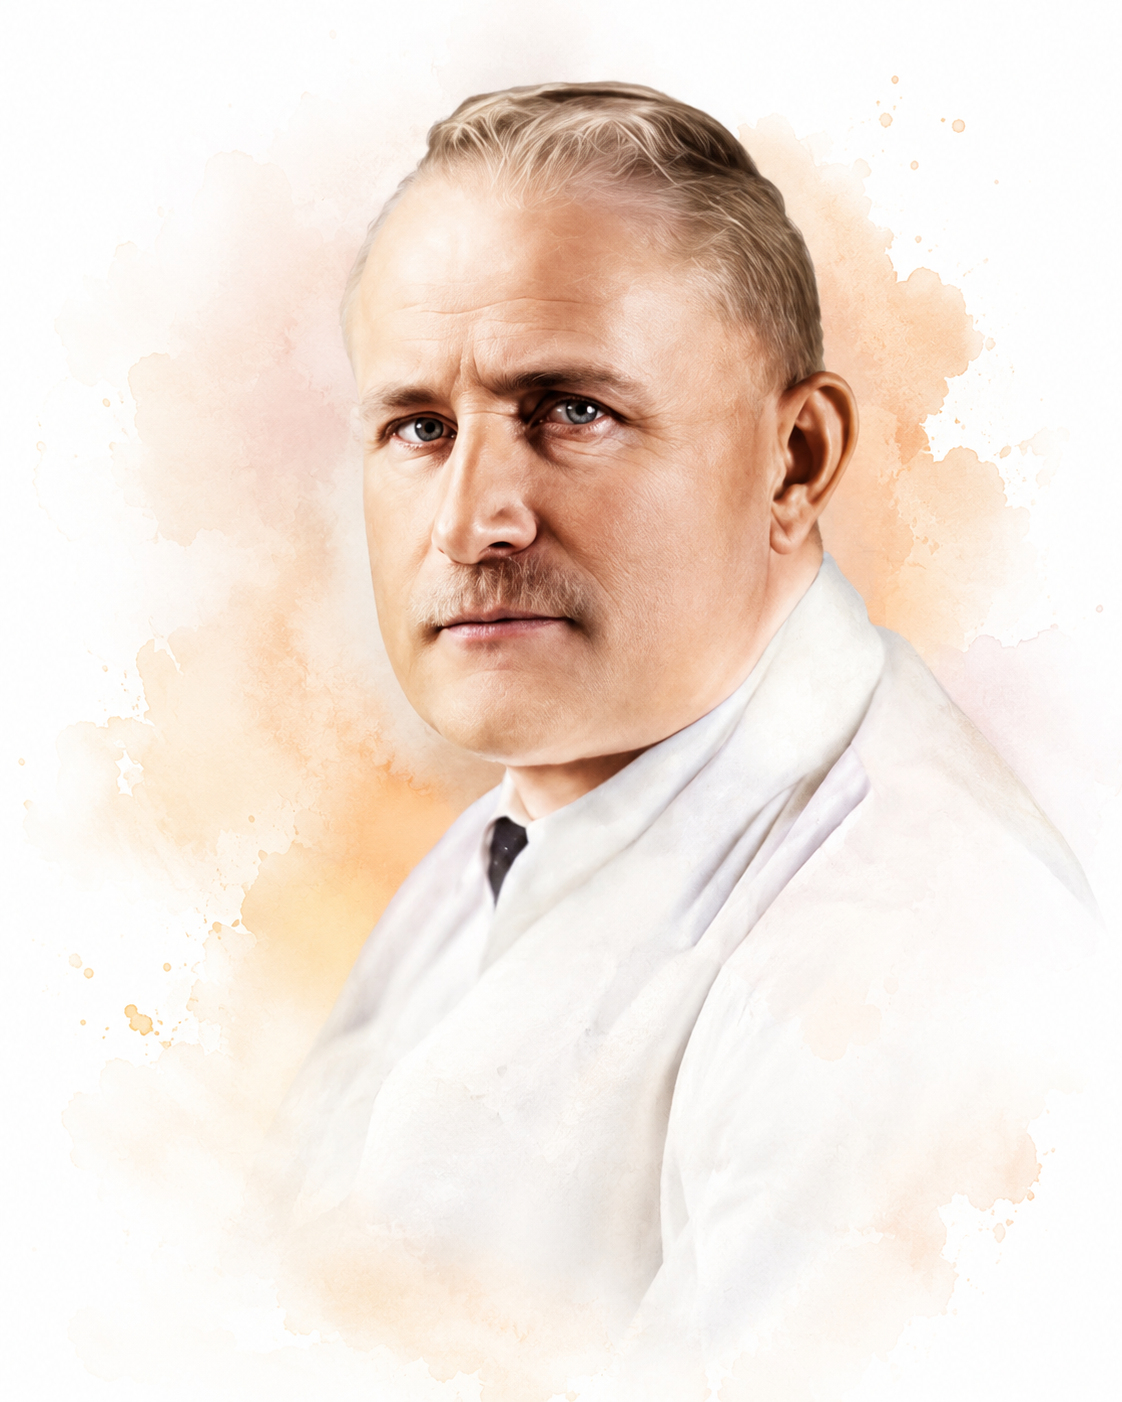
Joe Kamiya (1968) set out to answer a deceptively simple question: could people learn to recognize their own alpha activity and voluntarily increase it? His earliest experiments began in 1958 at the University of Chicago (Kamiya, 2011), work later described in Neurofeedback: The First Fifty Years (Evans et al., 2020).
Kamiya ran the work in two stages. In the first, a tone sounded at irregular intervals and subjects guessed whether alpha had been present at that moment, receiving right-or-wrong feedback; some approached perfect discrimination. In the second, a tone stayed on for as long as alpha amplitude (the strength of the EEG signal, measured in microvolts) exceeded a set threshold, and subjects were asked to increase the percentage of time it sounded. This was likely the first instance of EEG training in history, and it demonstrated something remarkable: with feedback, people could learn to control a brain rhythm they could not consciously feel.
Kamiya's discovery rippled outward through the field. His work led to research at the Menninger Foundation by Elmer and Alyce Green and Dale Walters, and Eugene Peniston's experience at Menninger resulted in the alpha-theta training protocol (Peniston & Kulkosky, 1989, 1990). Kamiya's research also influenced Fehmi's work with alpha synchronization (Fehmi & Robbins, 2008), Budzynski's twilight learning (Budzynski, 1977, 1996; Sittenfeld et al., 1976), Hardt's alpha training (Hardt, 2007; Hardt & Kamiya, 1978), and Scott's addiction disorder treatment programs. Of all the alpha-related protocols that emerged from this lineage, Peniston's alpha-theta protocol is the most widely taught, and it will be covered in detail in the section on training protocols. Its evidence base has also been formally audited (Graap & Freides, 1998); Peniston (1998) replied acknowledging errors and conceding that which component of the protocol produces its effects remains unknown.
Sterman
While Kamiya explored alpha, Barry Sterman took a different path, one that began with cats, classical conditioning, and a serendipitous discovery that would change the field forever. Sterman credits the Russian physiologist Ivan Pavlov, who developed the theory of classical conditioning, as a key influence on his early work (Sterman, 1996). His initial interest was the concept of internal inhibition and its relationship to sleep onset, and he chose to study this through EEG recordings in cats using operant conditioning techniques rather than the classical conditioning methods Pavlov had employed (Roth et al., 1967; Sterman & Wyrwicka, 1967; Wyrwicka & Sterman, 1968).
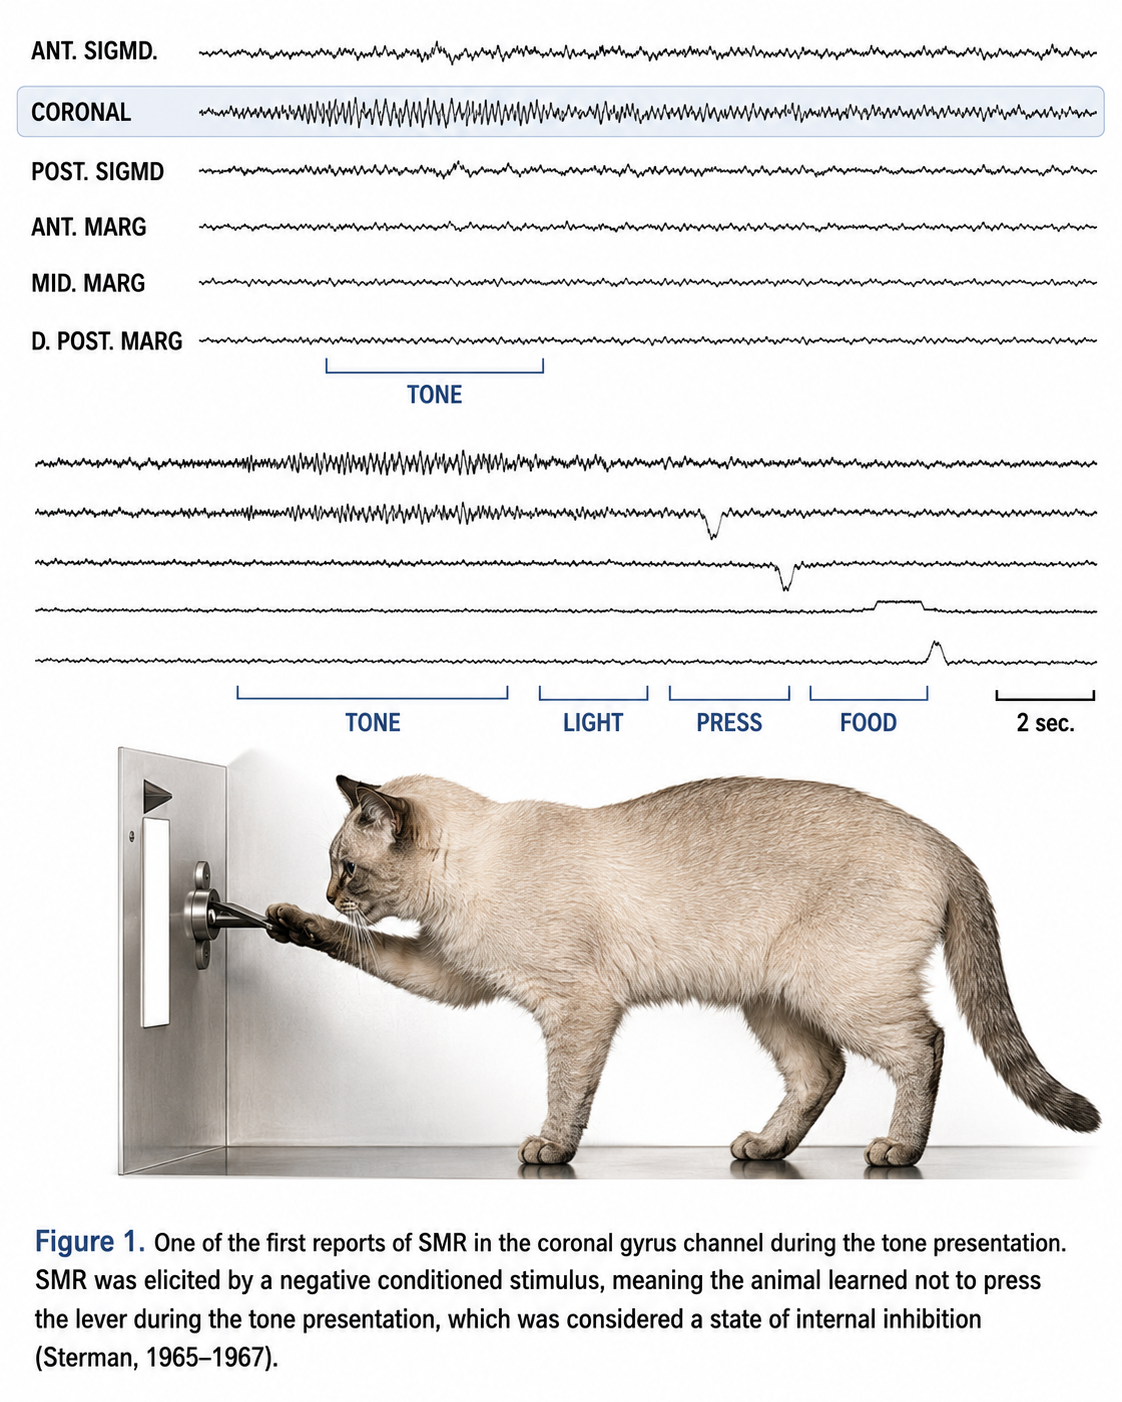
The experimental setup was elegant in its simplicity. Cats were first trained to press a bar to receive food. Then a tone was introduced: pressing the bar during the tone prolonged it, but waiting until the tone stopped and then pressing delivered the food immediately. In his 1996 paper, Sterman reported two distinct EEG patterns emerging from this paradigm. One pattern was associated with the learned suppression of bar pressing during the tone, and the other was related to the experience of receiving the food reward.
The suppression-related pattern appeared over the cat's sensorimotor cortex: the coronal gyrus, tissue involved in processing sensation and coordinating movement. Sterman later characterized it as spanning 12-20 Hz with a spectral peak near 12-15 Hz, although the band actually rewarded in the cat experiments was 12-14 Hz. Because of this localization, Sterman named it the sensorimotor rhythm (SMR). He noted its resemblance to sleep spindles, the rhythmic bursts of 11-16 Hz activity, most commonly 12-14 Hz, that are the defining feature of stage N2 sleep (Berry et al., 2016).
The reward-related pattern was a slower rhythm appearing over posterior cortex after the food reward, which he labeled post-reinforcement synchronization (PRS; Clemente et al., 1964). Because these were intracranial recordings in the cat, PRS carries no 10-20 system scalp coordinate.
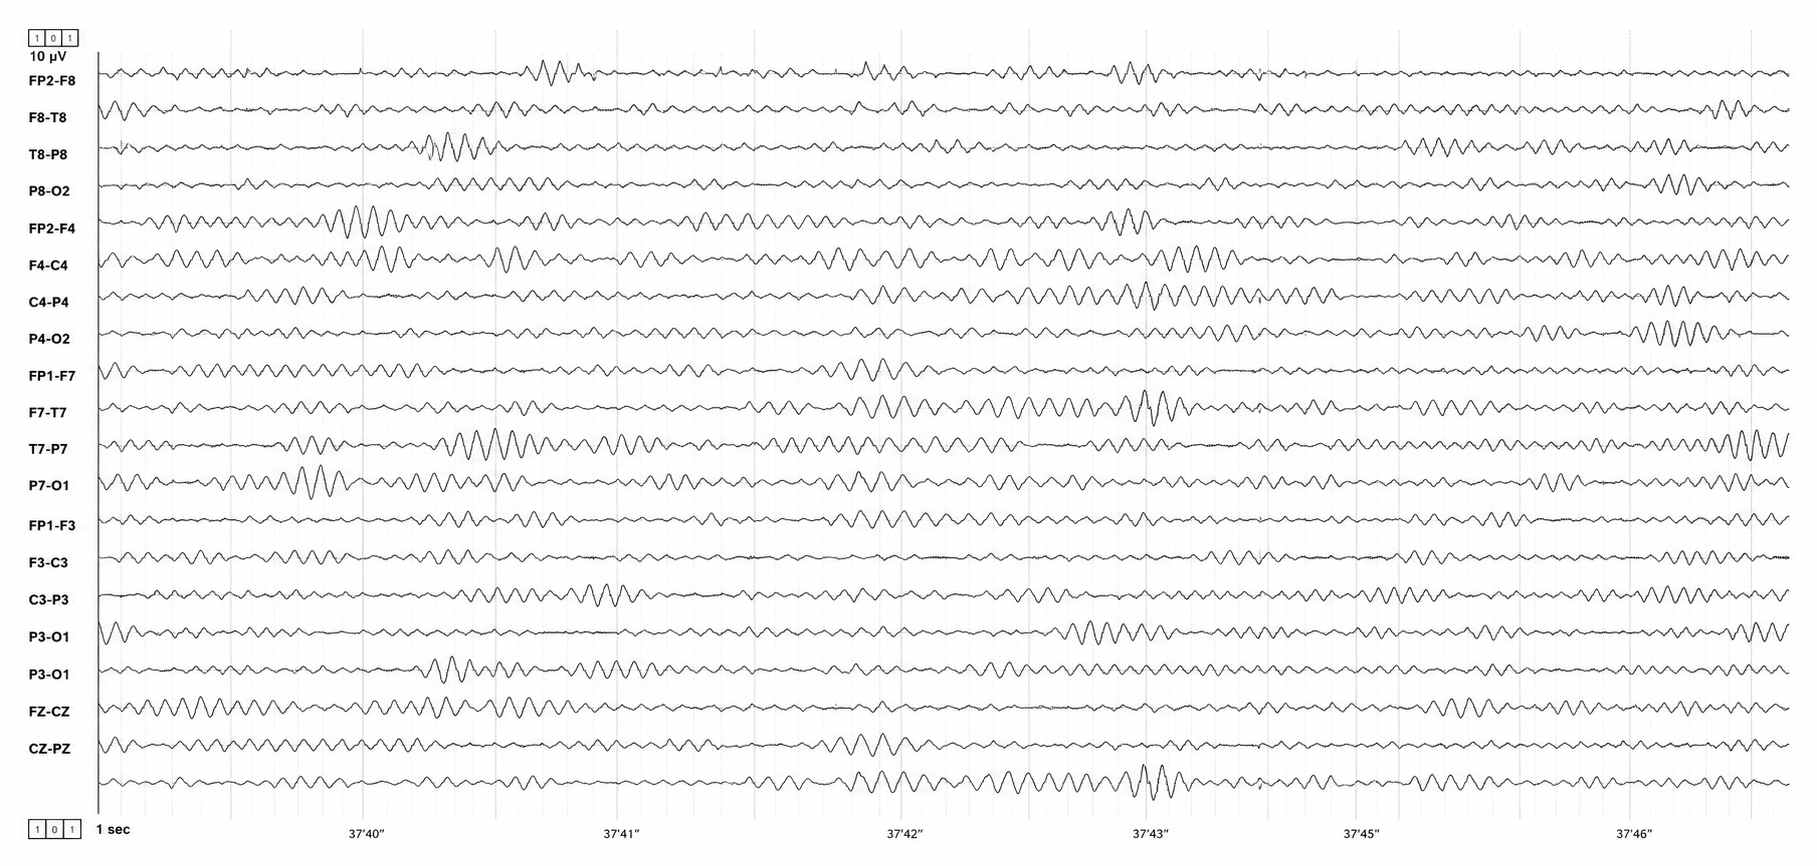
This tracing has been passed through a narrow filter that keeps only the 12-15 Hz band and discards everything else, so what is displayed is a single frequency band lifted out of a much busier raw record. Activity in this band is called the sensorimotor rhythm when it is recorded over the sensorimotor strip; applied to other derivations, the same filter simply shows whatever 12-15 Hz activity is present there.
Having identified these two clear patterns, Sterman's team attempted to operantly condition them. They focused first on SMR, using a signal detection filter centered at 13 Hz that activated the feeder when 12-14 Hz activity reached a defined amplitude and duration (Sterman, Wyrwicka, et al., 1969; Wyrwicka & Sterman, 1968). The cats proved amenable to this training, learning to produce the rhythm voluntarily, typically generating 150 to 200 conditioned responses before becoming satiated. The behavioral hallmark of this conditioned response was not simple physical stillness but a progressive process: first a reduction in muscle tone, then sustained immobility, and finally the increased production of the 12-15 Hz rhythm.
Further studies traced SMR's origin to the somatosensory relay nuclei of the thalamus, specifically the ventral basal nuclei (Howe & Sterman, 1972). These relay cells normally fire in random bursting patterns as they transmit incoming sensory input, but during increased SMR production, they shifted to a more rhythmic pattern that suppressed somatosensory information conduction (Howe & Sterman, 1973). This finding connected SMR training to the broader thalamocortical relay (TCR) system, the complex circuitry that regulates the transmission of sensory information through the thalamus to the cortex. We adapted this graphic created by Zachary Barry and featured in Wikipedia's article Recurrent ThalamoCortical Resonance.
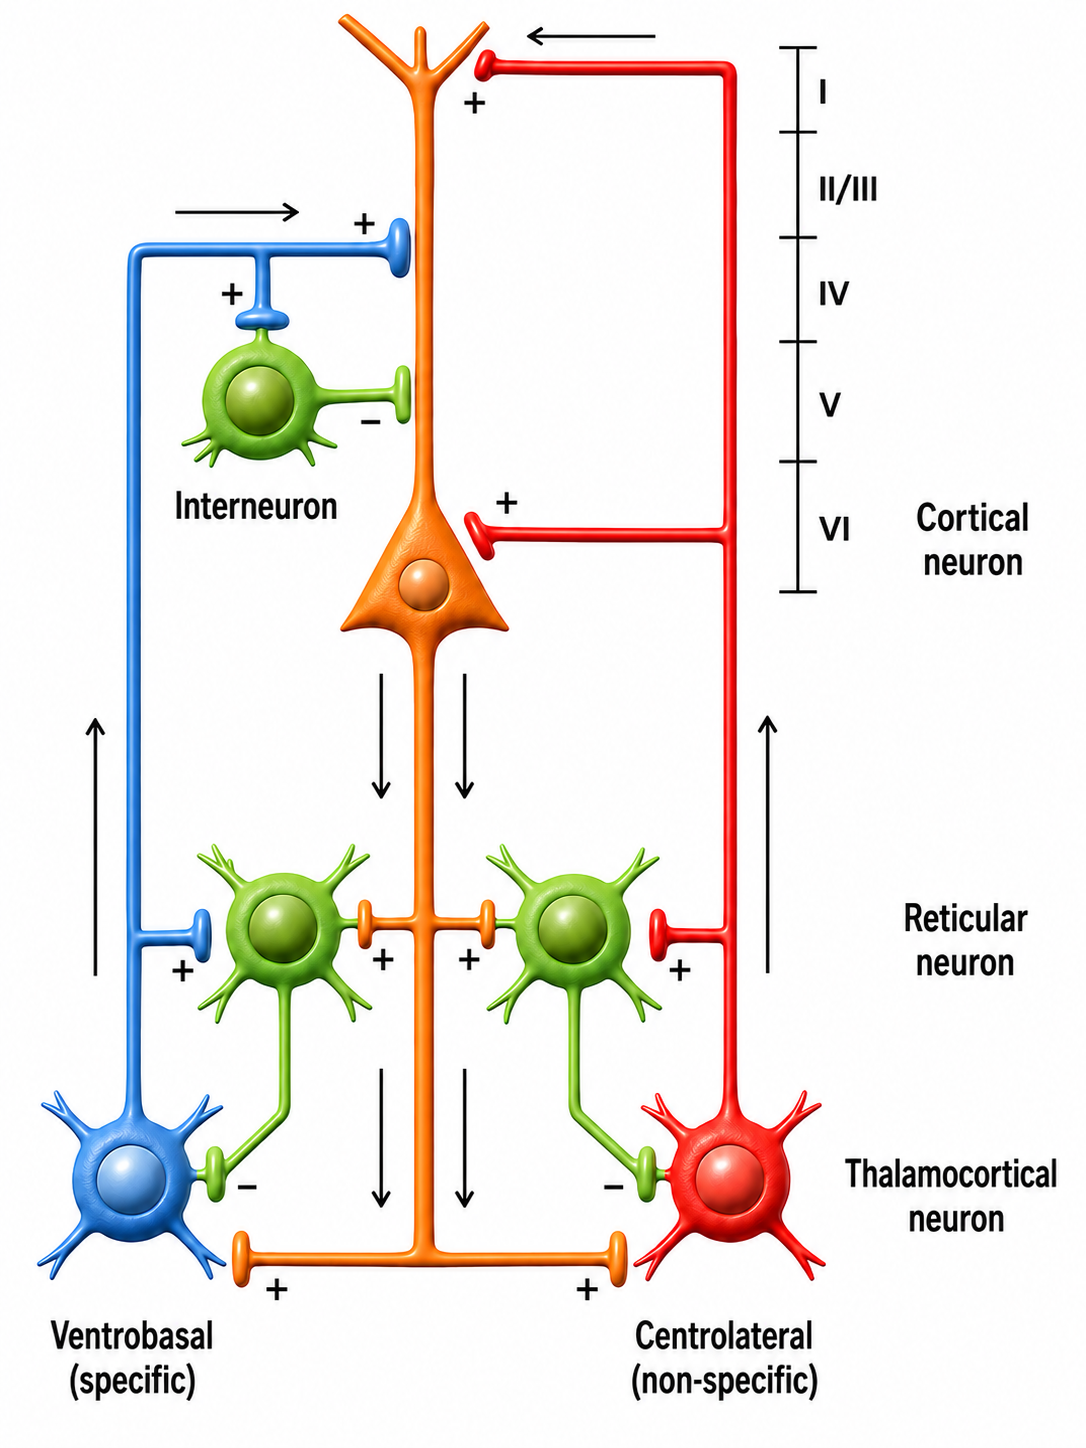
A variety of neurochemical mechanisms either facilitate the transmission of ascending sensory information or block it by replacing it with rhythmic activity patterns transmitted to specific cortical regions. When this rhythmic activity appears in visual processing areas, it is known as the alpha rhythm, also called the posterior dominant rhythm (PDR), the highest-amplitude frequency detected at the back of the scalp when the eyes are closed. The movie below is a 19-channel BioTrace+ /NeXus-32 display of alpha activity under eyes-closed and eyes-open conditions © John S. Anderson.
The responsiveness of cortical neurons to these thalamic bursting patterns depends on what other tasks those neurons are engaged in and their overall level of excitation. When the oscillatory discharges that include SMR rhythms are propagated for extended periods, particularly during fatigue and drowsiness, they can lead to increased rhythmicity, synchronization, and slower EEG frequencies in the theta range (generally 4-8 Hz). Much of the information Sterman and his colleagues developed from these studies was entirely new at the time but has since become accepted science in our understanding of arousal, inhibition, and the behavioral and attentional characteristics associated with different EEG patterns (Sterman, 1996).
The movie below is a 19-channel BioTrace+ /NeXus-32 display of SMR activity © John S. Anderson. Brighter colors represent higher SMR amplitudes. Frequency histograms are displayed for each channel. Notice the runs of high-amplitude SMR activity.
Then came the serendipitous discovery that would launch clinical neurofeedback. Some of the cats previously trained to produce increased SMR were later included in a study of the toxic effects of monomethylhydrazine (MMH), a component of rocket fuel (Sterman, LoPresti, et al., 1969, 2010). The SMR-trained cats showed a striking difference: significantly increased latency before seizure onset compared to untrained cats, and in some cases, complete absence of convulsions. The initial findings were classified under the auspices of the U.S. Air Force and not published in typical journals, but they have since become available and serve as the foundation for subsequent research on SMR training's protective effect against seizures.
Crucially, these cats had not received SMR training for over three months before the drug test, demonstrating that the protective effect persisted well beyond the training period. Sterman concluded that SMR training could provide effective protection against seizures (Sterman et al., 2010). Building on this finding, Sterman published a landmark 1972 single-case report (Sterman & Friar, 1972). That paper announced, as work then in preparation, that a rhythm similar to the cat SMR could be recorded from the human rolandic cortex and brought under operant control through EEG biofeedback; the full demonstration was published two years later (Sterman et al., 1974).
They then applied SMR biofeedback training to a patient with a 7-year history of convulsive disorder who was experiencing seizures approximately twice per month despite trying several anticonvulsant medications. After the third session, the patient demonstrated control of the SMR response, and no seizures were reported for three months; a single seizure followed a change of medication, after which seizure control resumed. As training continued, the patient also showed improvements in social engagement, personal confidence, appearance, and sleep quality. Subsequent studies by Sterman and others produced over 25 years of peer-reviewed research demonstrating the effectiveness of neurofeedback training for seizure reduction, although a review by Monderer and colleagues (2002) noted that the absence of rigorously controlled studies means the relationship between neurofeedback and seizure frequency cannot yet be firmly established.
Two parallel lines of discovery founded the field of neurofeedback. Kamiya demonstrated that people could learn to recognize and voluntarily control their alpha rhythm, inspiring a generation of researchers including Peniston, Fehmi, Budzynski, and Hardt. Sterman identified the sensorimotor rhythm in cats, demonstrated it could be operantly conditioned, and then made the serendipitous finding that SMR-trained cats resisted chemically induced seizures, leading directly to the first human neurofeedback applications for epilepsy. Together, these pioneers established the foundational principles that specific EEG patterns can be identified, trained through feedback, and produce lasting clinical changes.
Defining an Effective Training Protocol
This section examines what research tells us about designing effective neurofeedback protocols and how new practitioners typically learn their craft. You will explore findings from Rogala and colleagues (2016) on electrode placement and frequency targeting, and you will see why specificity matters, even though the evidence linking it to behavioral outcomes remains incomplete.
The challenges of establishing efficacy for behavioral interventions like neurofeedback are well documented (see the Research Evidence Basis for Neurofeedback section). Notably, the Monderer and colleagues (2002) review of neurofeedback for epilepsy included studies that used a variety of approaches beyond SMR training, such as slow cortical potential training and training to inhibit epileptiform activity (spikes and sharp waves associated with seizure disorders), without evaluating whether specific training approaches were applied appropriately. In light of Strehl's (2014) argument that operant conditioning alone is insufficient, it appears that simply providing feedback without incorporating the additional learning components she identified may reduce the effectiveness of otherwise promising protocols.
Rogala and colleagues (2016) attempted to identify the "dos and don'ts" of effective neurofeedback training. Among their positive recommendations: position electrodes above well-identified cortical sources of the frequency being trained; their own example is frontal-midline placement for frontal-midline theta. They also noted that multiple electrodes in the target area increase the chance of collecting feedback from all the regions engaged in the target activity, and proposed, as a direction for future protocol development, weighting the feedback signal across several recording electrodes. On the cautionary side, they found a negative correlation between the number of bands composing the feedback signal and the success of training, and their do's-and-don'ts list says plainly to use single-band protocols.
Ultimately, Rogala and colleagues found that lack of specificity in training approaches tended to produce less clear and easily measurable results. However, they did not conclude that improved behavioral outcomes were directly attributable to this narrower focus, making their findings somewhat inconclusive. In practice, new practitioners typically learn neurofeedback through mentorship, an apprenticeship-like model in which their protocol choices reflect the training philosophy of their instructors. Understanding this context is essential as we turn to the major schools of thought that have shaped the field.
Research by Rogala and colleagues (2016) suggests that more specific electrode placement and frequency targeting tend to produce clearer results, though the relationship between measurement specificity and behavioral outcomes remains inconclusive. Effective protocols require more than operant conditioning alone, and new practitioners typically learn approaches through mentorship, reflecting the apprenticeship-like nature of the field.
Primary Schools of Thought in Neurofeedback Training
This section surveys the major clinical approaches that have emerged from the pioneers discussed above. You will trace how Ayers, Lubar, Monastra, and the Othmers each developed distinct training philosophies, and how those philosophies continue to shape the protocols practitioners use today, from VA clinics to private practices to performance training centers.
Ayers
One of the earliest neurofeedback practitioners was Margaret Ayers, who developed her initial interest in EEG while working in Barry Sterman's laboratory at the Veterans Administration Center in Sepulveda, California. Ayers developed training protocols by evaluating subtle EEG patterns using an all-digital, real-time neurofeedback system that she described as evolved from missile guidance software; the published specification for her Neuropathways instrument is a sampling rate of 250,000 samples per second (Hammond, 2005). That resolution, she reported, allowed her to identify patterns that she then correlated with known medical diagnoses (Ayers & Montgomery, 2007). These are developer and clinician claims that have not been independently validated.
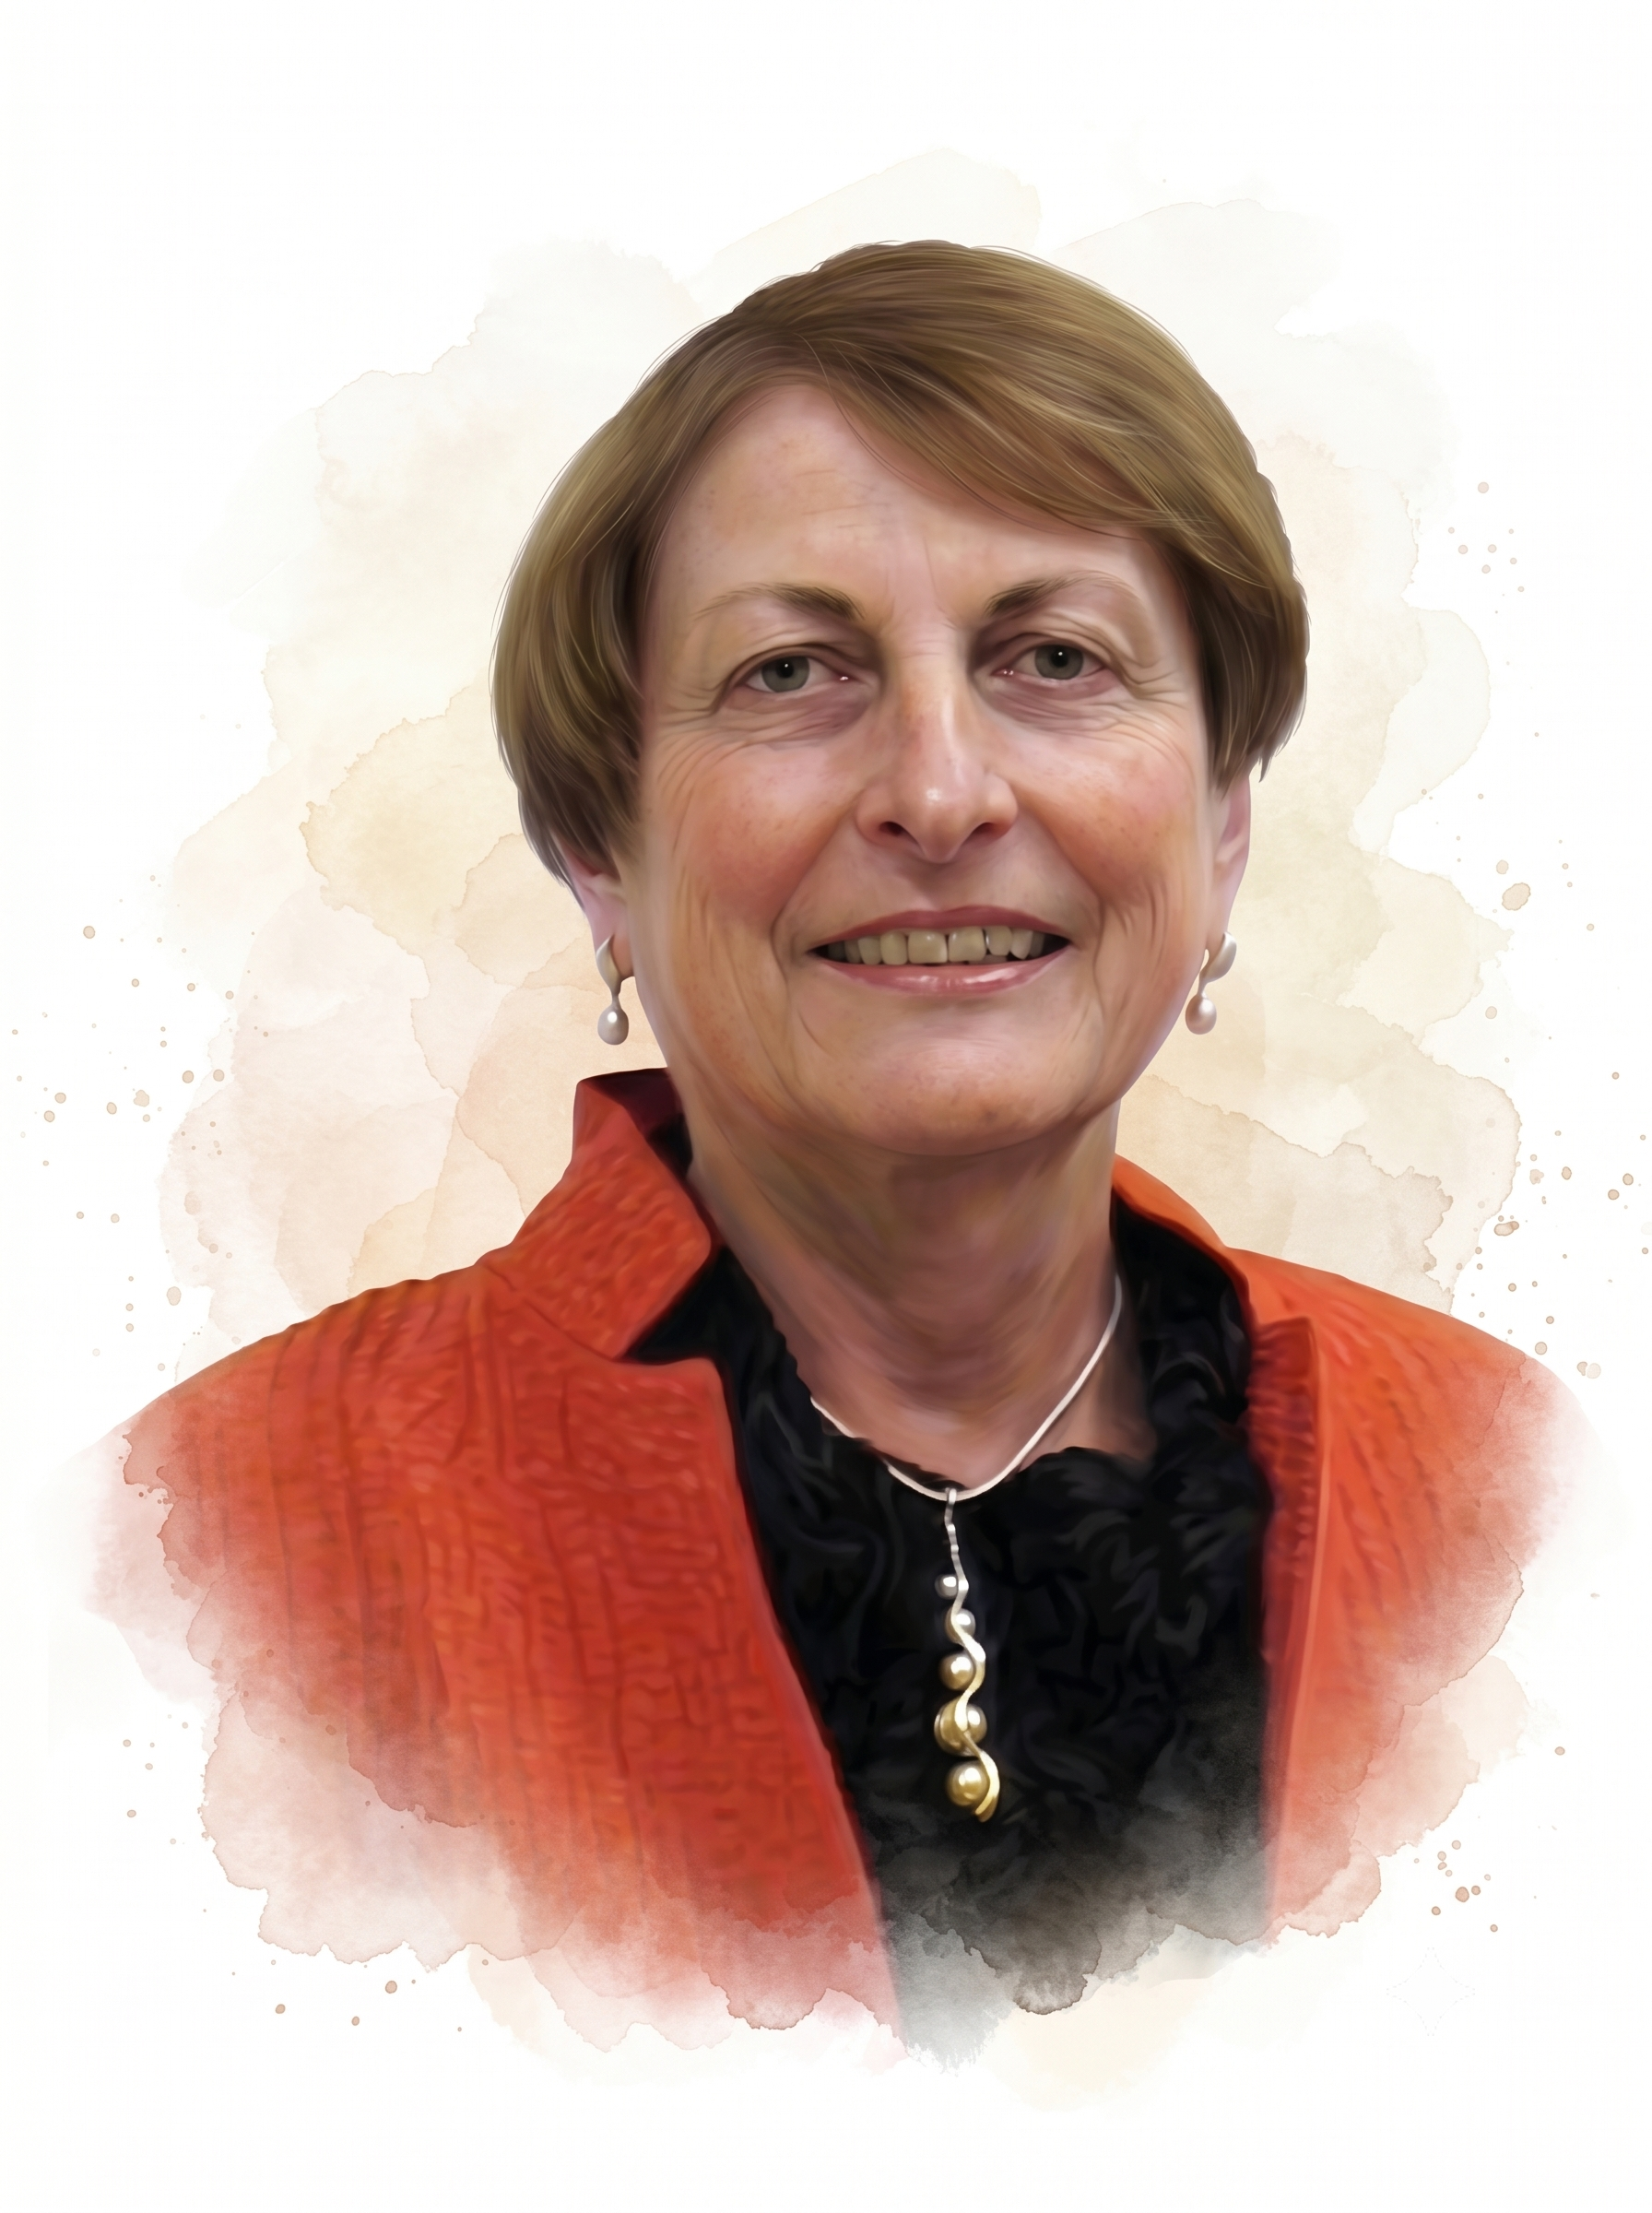
Ayers based her approaches on her knowledge of neurophysiological characteristics of the brain in correlation with client symptoms (Montgomery, 2019). One of her most important contributions was working with individuals who had sustained traumatic brain injuries, including those in persistent coma states (Ayers, 1995). That report is a two-page unrefereed conference abstract without methods or statistics, never followed by a full paper; Byers (1998) is a bibliography rather than a study. Neither can carry an outcome claim.
Her training approaches focused mainly on inhibiting unwanted slow activity in the theta frequency band (4-8 Hz). The published description of her protocol is inhibition of 4-7 Hz with mild reinforcement of 15-18 Hz (Hammond, 2005). That strategy reflected her clinical observation that excessive theta was a common feature of brain injury. Her partner, Penny Montgomery, continues this work today.
Lubar
Joel Lubar at the University of Tennessee followed directly in Sterman's footsteps, replicating and extending the SMR work to seizure disorders. In 1976, he published an uncontrolled case series of eight patients with severe epilepsy, aged 10 to 29, trained to increase SMR activity (12-14 Hz) (Lubar & Bahler, 1976). A parallel 4-7 Hz filter was not used to train theta downward; it flagged epileptiform spike activity, slow waves, and movement, and SMR feedback was withheld whenever that filter fired.
Most patients showed some degree of improvement, and two who had been having multiple seizures per week became seizure-free for periods of up to one month. Seizure intensity and duration also decreased. The patients who improved were also the ones whose SMR increased in amount and amplitude, but the paper reports no correlation statistic, and without a control group that association is not evidence of a causal link.
In 1981, Lubar published a study (Lubar et al., 1981) that its authors describe as a double-blind crossover design. There was no separate control group: eight patients with medically refractory mixed seizures served as their own controls, with four months of baseline, two months of false (noncontingent) feedback, and then a ten-month ABA-patterned training program. Five of the eight showed a decrease in mean monthly seizure rate.
During these years of studying SMR training, Lubar and his colleagues noticed improvements in behavior and cognitive function similar to those Sterman had reported. This observation led them to study SMR training's impact on individuals diagnosed with what was then called "minimal brain dysfunction syndrome," the research label of the 1960s, alongside DSM-II's "hyperkinetic reaction of childhood" (1968) and the World Health Organization's "hyperkinetic disorder," which ICD retained until 2022. DSM-III renamed it attention deficit disorder in 1980, and DSM-III-R gave it its current name, attention deficit hyperactivity disorder (ADHD), in 1987.
Using an ABA study design (a small-N design in which a training phase is followed by a reversal phase and then by reinstatement of the original contingency), Lubar and colleagues demonstrated that behaviors improved with increases in SMR and decreases in 4-7 Hz activity, that problematic behavior returned when the contingency was reversed, and then improved again when the original contingency resumed (Lubar & Shouse, 1976; Shouse & Lubar, 1979). Both reports are very small: a single child, medicated with methylphenidate throughout the training phases, in 1976, and four children in 1979, three of whom acquired the response. This finding launched the widespread use of neurofeedback for ADHD, with rewarding increases in 12-15 Hz and decreasing 4-7 or 4-8 Hz becoming standard practice. Positive effects have since been reported in clinical, research, and school environments, although the reports cited here are unpublished project manuscripts rather than peer-reviewed trials (Anderson, 1994-1998, unpublished project report manuscripts).
Monastra
Vincent Monastra built on Lubar's work by developing a specific assessment process for ADHD that uses the theta/beta ratio (T/B ratio), the ratio between the amount of 4-8 Hz theta and 13-21 Hz beta activity, recorded from a single channel at the vertex, the 10-20 system location Cz (Monastra et al., 1999, 2001). Sensitivity refers to a measure's ability to correctly identify individuals who have a given condition, while specificity refers to its ability to correctly exclude those who do not. The T/B ratio has been the subject of several large, multi-site studies examining both of these properties.
The strongest of these studies in terms of design, multi-site participation, and variable control (Snyder et al., 2008) showed a sensitivity of 87% and a specificity of 94%, for an overall accuracy of 89% in a clinical sample of 159 children and adolescents. For comparison, the parent and teacher rating scales collected in the same study, including the Conners' Rating Scales-Revised, reached overall accuracies of only 47% to 58%. Snyder and colleagues are explicit that their results do not support using EEG as a stand-alone diagnostic, only as a complement to clinical evaluation. Monastra's work led to a training technique that targeted the overall T/B ratio rather than training individual frequency components with narrower bands such as 12-15 Hz or 15-18 Hz. Many practitioners have used this approach with reported success, though others argue it lacks the specific frequency targeting needed for optimal results.
Othmers
Susan and Siegfried Othmer have been among the most influential, and at times controversial, figures in the neurofeedback field. They initially studied with Margaret Ayers when she worked with their son, Brian, who experienced temporal lobe epilepsy. After several transitions, they developed a training institute and began working with clients while training new practitioners.

In the early 1990s, the Othmers' training generally followed standard operant conditioning concepts from Sterman and Lubar, using a central midline electrode at Cz with protocols that rewarded increases in either 12-15 Hz or 15-18 Hz while inhibiting 4-8 Hz theta and 20-30 Hz beta (personal experience, John Anderson, 1992). This evolved into a hemispheric balancing approach, training to increase 15-18 Hz at C3 (left sensorimotor area) and 12-15 Hz at C4 (right sensorimotor area), with session time at each site titrated specifically for each client.
The Othmers then shifted to a bipolar or sequential montage, a recording method in which each channel takes its two inputs from two active scalp electrodes, with no common reference, rather than the referential (monopolar) montage that used an ear reference with the active electrode on a scalp location. In a bipolar montage, both the positive and negative inputs sit on the scalp, and an ear electrode, if present, serves only as the amplifier's ground, as the accompanying diagram shows. Initially these were placed at C3-C4 or T3-T4, but the locations continued to evolve through clinical experimentation. Susan Othmer developed a protocol guide in a flowchart design that directed clinicians through combinations of sensor locations and frequency bands until the most effective combination for a given client was identified. They began calling this optimal response frequency (ORF) training (Othmer in Evans, 2020).
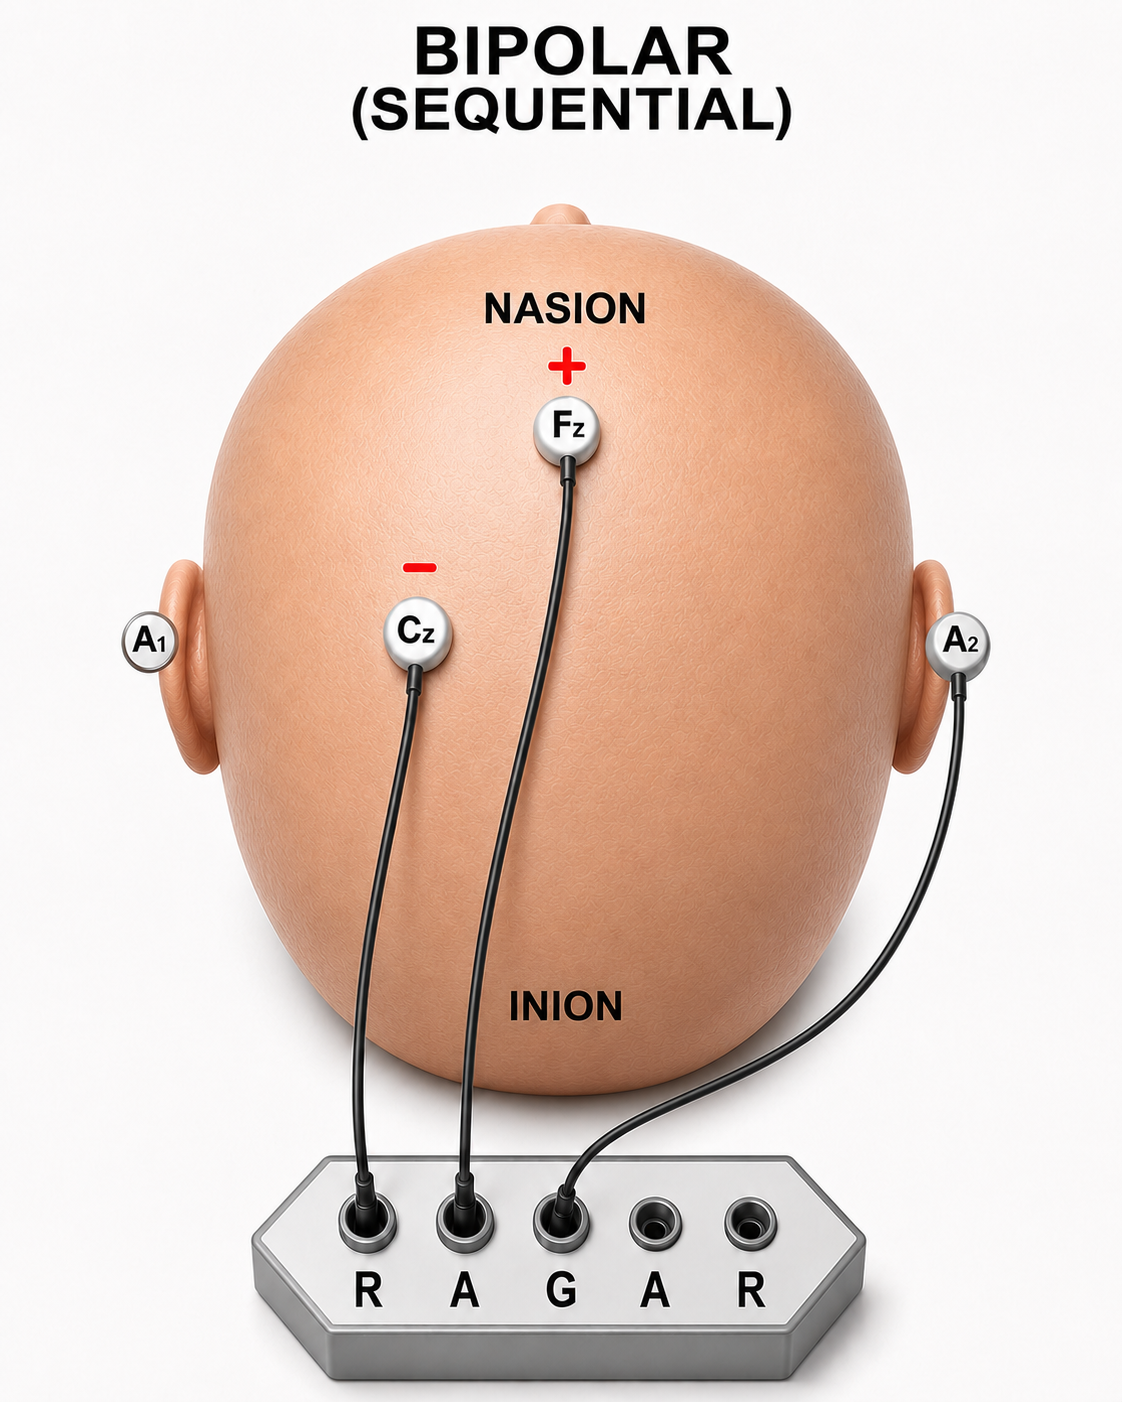
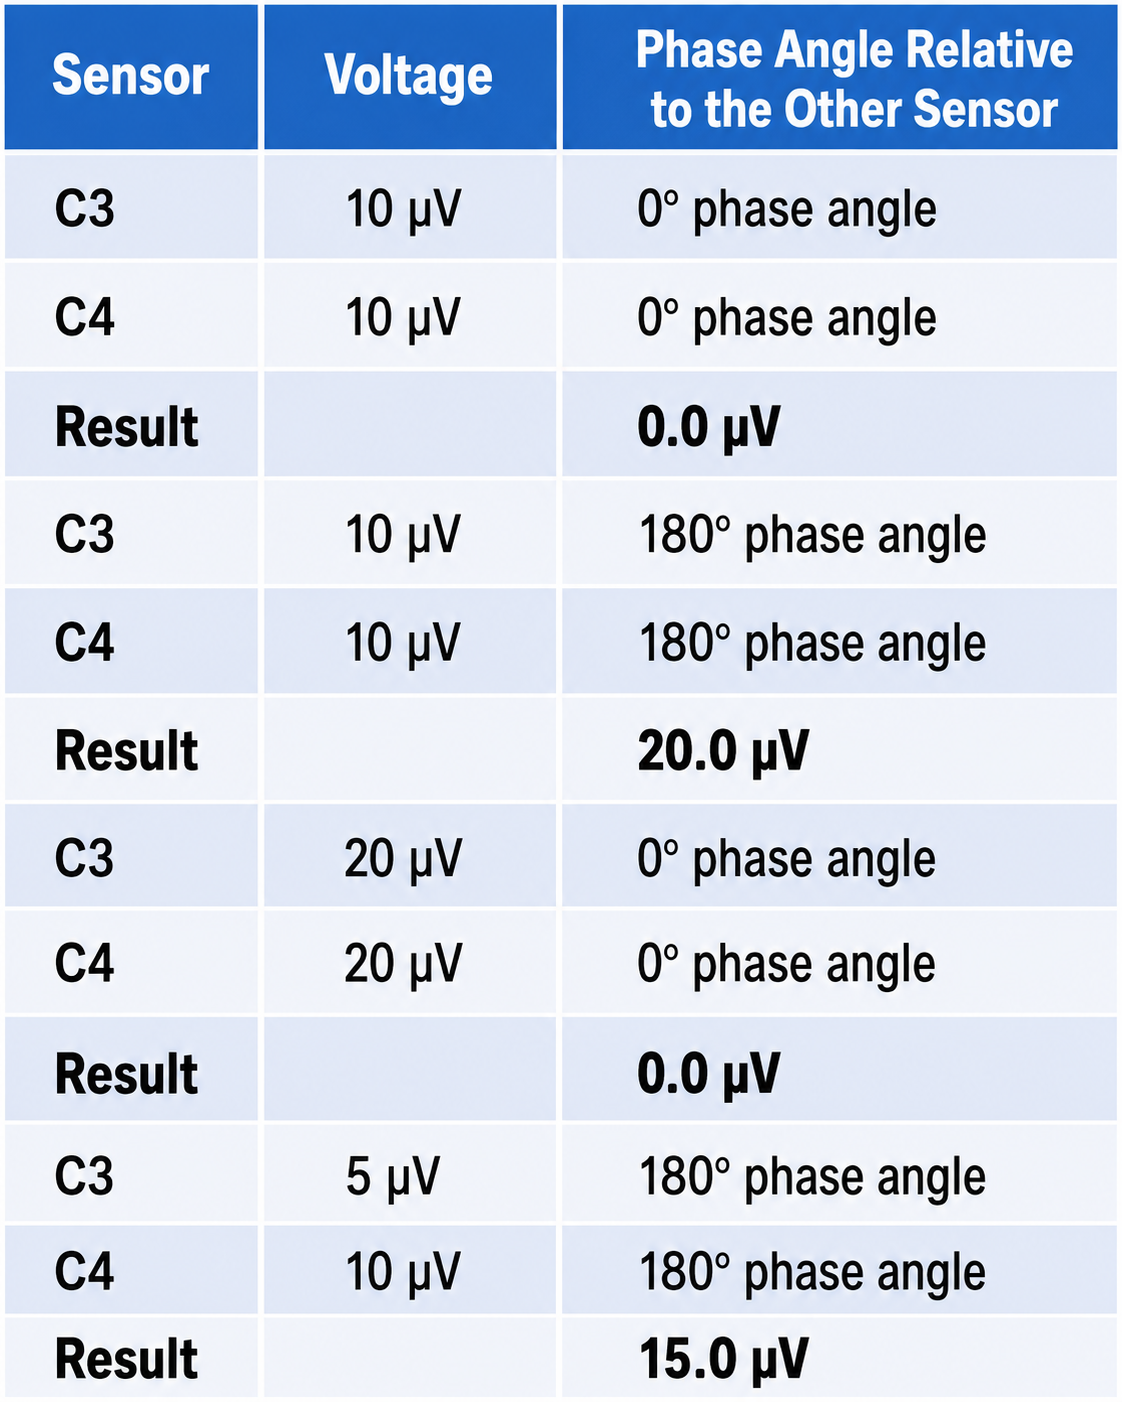
A key element of ORF training was finding the optimal response frequency within an individual session by shifting the reward band to higher or lower values. These values often ended up in very low frequencies in the theta and delta ranges, sparking intense criticism from others in the neurofeedback community who charged that the Othmers were reinforcing frequencies that could trigger seizures. Much of this concern stemmed from a misunderstanding of common-mode rejection (CMR), a property of differential amplifiers that is covered in detail in Neurofeedback Tutor: An Introduction. CMR is critical to understand when using a bipolar montage because the clinician is not training to increase or decrease absolute voltage; instead, the amplifier amplifies the difference between the signals at the two electrode locations while rejecting anything that is the same.
Because of CMR, an apparent increase in 12-15 Hz actually represents a change in the relative amount of that frequency between the two sensor locations. The displayed signal therefore depends both on the phase relationship between the two sensors, whether the EEG waveforms are oscillating in synchrony or out of phase, and on how far their voltages differ. If voltage increases equally at both sensors while phase remains constant, no change appears in the displayed signal; if voltage stays the same but phase shifts, the apparent voltage changes. This principle is demonstrated in the table below. All examples assume a frequency of 10 Hz.
The theory behind the Othmers' bipolar approach was that training for a greater difference between sensor locations required the client's brain to communicate internally and exercise greater coordination between training sites, resulting in better overall self-regulation. They and their students applied these approaches and reported excellent results, often supported by objective testing such as continuous performance tests (Kaiser, 1998; Kaiser & Othmer, 2000; Linden et al., 1996; Lubar, 1995; Othmer et al., 1999; Putman et al., 2005).
The Othmer method ultimately evolved toward training in frequencies below 0.1 Hz, known as infra-low frequencies (ILF). This shift generated further controversy because these portions of the EEG frequency spectrum are poorly understood and fall within the range occupied by common artifacts: eye blinks, eye movements, cable sway, electrodermal responses, and electrode drift. Siegfried Othmer, who holds a doctorate in physics, has explained that proprietary signal processing methods address these artifact concerns (personal communication, 2021). The published reports of ILF training are case series, book chapters, and clinical observations rather than controlled trials (Legarda et al., 2011; Othmer & Legarda, 2011; Sasu & Othmer, 2020).
Following the move to ILF training, the Othmers continued to incorporate alpha-theta training using a two-channel sum training approach and have recently added two-channel synchrony training in the alpha and gamma frequency bands. They have a large following, and many clinics and individual practitioners employ their methods with reported positive results. However, a clear mechanistic explanation of what is being trained in the ILF protocol remains elusive and awaits future research.
The primary schools of thought in neurofeedback include Ayers' focus on inhibiting unwanted theta activity in TBI clients, Lubar's replication and extension of Sterman's SMR work to ADHD populations, Monastra's theta/beta ratio approach, and the Othmers' evolving methodology from standard SMR training through bipolar montage work to infra-low frequency training. Each approach reflects different assumptions about how the brain can best be trained, and practitioners typically learn their methods through mentorship relationships with these pioneers or their students.
Mark Smith
Another prominent clinician, Mark Smith, pursued a parallel approach to low-frequency training that he terms infra-slow frequency (ISF) training, using different amplifiers and software from the Othmers. Smith initially trained with the Othmers but then developed his own method for providing feedback on activity below 0.1 Hz. Over time, he incorporated z-score training, a neurofeedback protocol that reinforces closer approximations of client EEG values to those in a normative database, using the NeuroGuide database developed by Robert Thatcher. He also incorporated quantitative EEG assessment, learning from Jonathan Walker, MD, and others.
Smith's explanation of his ISF approach, developed in collaboration with Thomas Collura (Smith et al., 2014), is that the training tracks slow potential trends in the infra-slow range rather than the amplitude fluctuations derived from conventional peak-to-peak digital processing; in the published account, feedback is delivered when the infra-slow amplitude departs by more than about 15% from a damped running average. As noted in the article, the time constant involved is quite long, requiring significant time (approximately 3 minutes in the cited example) for the filters to return to baseline following a significant shift in the signal being measured.
As with the Othmers' ILF training, significant voltage shifts from eye movements, blinks, electrodermal activity, and cable sway artifacts present a challenge in this frequency range. The published literature does not fully address how these artifact issues are mitigated, leaving questions about the validity of the training signal. There may, however, be additional signal processing beyond what is described. Regardless of these unanswered questions, the clinical results using a combination of ISF, z-score, synchrony, and referential enhancement training have been positive, and published clinical examples and book chapters (Smith et al., 2014, 2017, 2018) support continued investigation.
qEEG-Based Neurofeedback Training
This section explains how quantitative EEG assessment transformed protocol development from intuition-based to data-driven. You will learn how the Fast Fourier Transform made brain mapping possible, how normative databases were developed, and why even objective data requires careful clinical interpretation. Understanding these advances is directly relevant to practitioners in any setting, from VA clinics using standardized assessments to private practices designing individualized training plans.
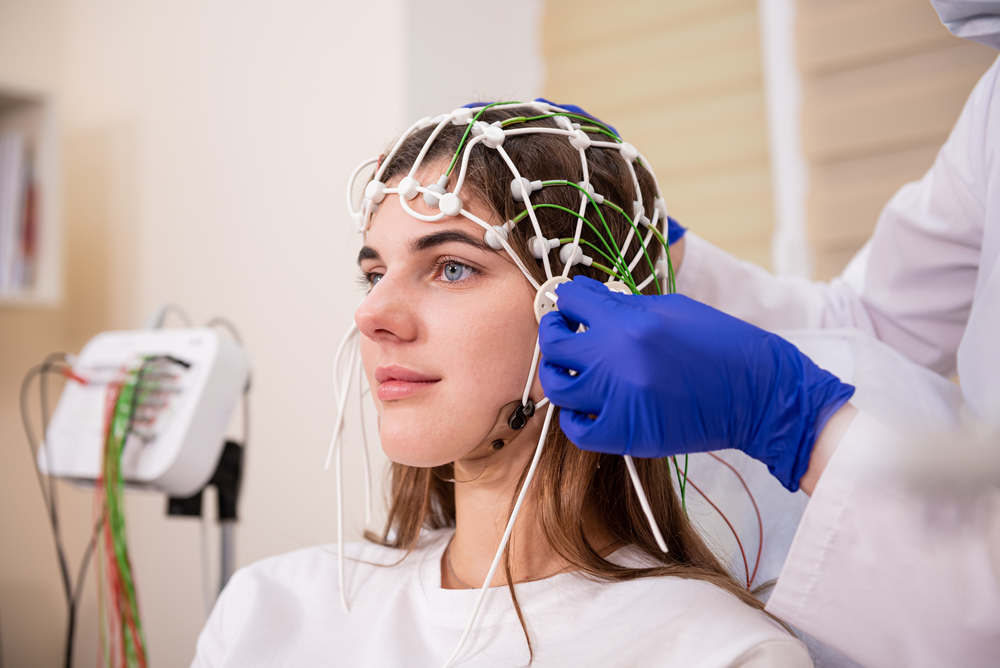
The quantitative approach to neurofeedback gained momentum as high-quality EEG recording devices capable of simultaneously recording from 19 scalp electrode locations became available, along with software for generating topographic images from the recorded data. The mathematical breakthrough that made this possible was the Fast Fourier Transform (FFT) algorithm, developed in 1965 (Cooley & Tukey, 1965; Dumermuth & Flühler, 1967). The FFT deconstructs the complex EEG signal, which contains multiple frequency components with different amplitudes and characteristics, into frequency and power (amplitude squared) spectral displays, initially as numerical tables and later as topographic brain maps. EEG cap graphic © Roman Zaiets/shutterstock.com.
As inexpensive and powerful personal computers became available in the 1990s, clinicians and researchers could harness these computational methods to identify the EEG components associated with various conditions and disorders. This was greatly facilitated by the development of EEG normative databases, collections of EEG data from carefully screened, symptom-free individuals that serve as a reference standard. Key databases were developed by E. Roy John at New York University, Robert Thatcher at the University of Maryland, Frank Duffy of Harvard University, and others.
Developmental equations describing the normal EEG proved closely similar in large groups of healthy children in the United States and in Sweden, and independent of cultural, ethnic, socioeconomic, and sex factors (John et al., 1980). Reliability has also been studied (Fein et al., 1983; Oken & Chiappa, 1988), and the picture there is more mixed: Oken and Chiappa found that mean band power varied by less than 10% within a single recording but that individual parameters could vary by as much as 50% in a subject, and cautioned against reading changes of that size as meaningful. Know your own instrument's variability before you interpret a change as a treatment effect.
As Thatcher (1998) described, normative database comparisons offered three key advantages: they helped assess the client's neuropsychological status, they identified strengths and weaknesses in the client's neurophysiology to guide training protocol design, and they aided in evaluating results following intervention. Many clinicians adopted this approach: if an area of the brain showed excess or deficient activity in one or more frequencies compared to the normative sample, that area became the training target. This often led to resolution of presenting complaints that were potentially associated with these underlying patterns of dysregulation.
The benefits for protocol development seemed straightforward: no need to guess at the training location based on neuroanatomy alone, no need to guess at the target frequency, no need to guess whether to reward increases or decreases, and training results were verifiable through follow-up qEEG assessment. However, as database-guided training progressed, significant difficulties emerged. The most prominent, frequently cited by neurologists (Nuwer & Coutin-Churchman, 2014), was the problem of artifacts, contamination of the EEG signal by non-brain electrical activity. Graphic © eegatlas-online.com.
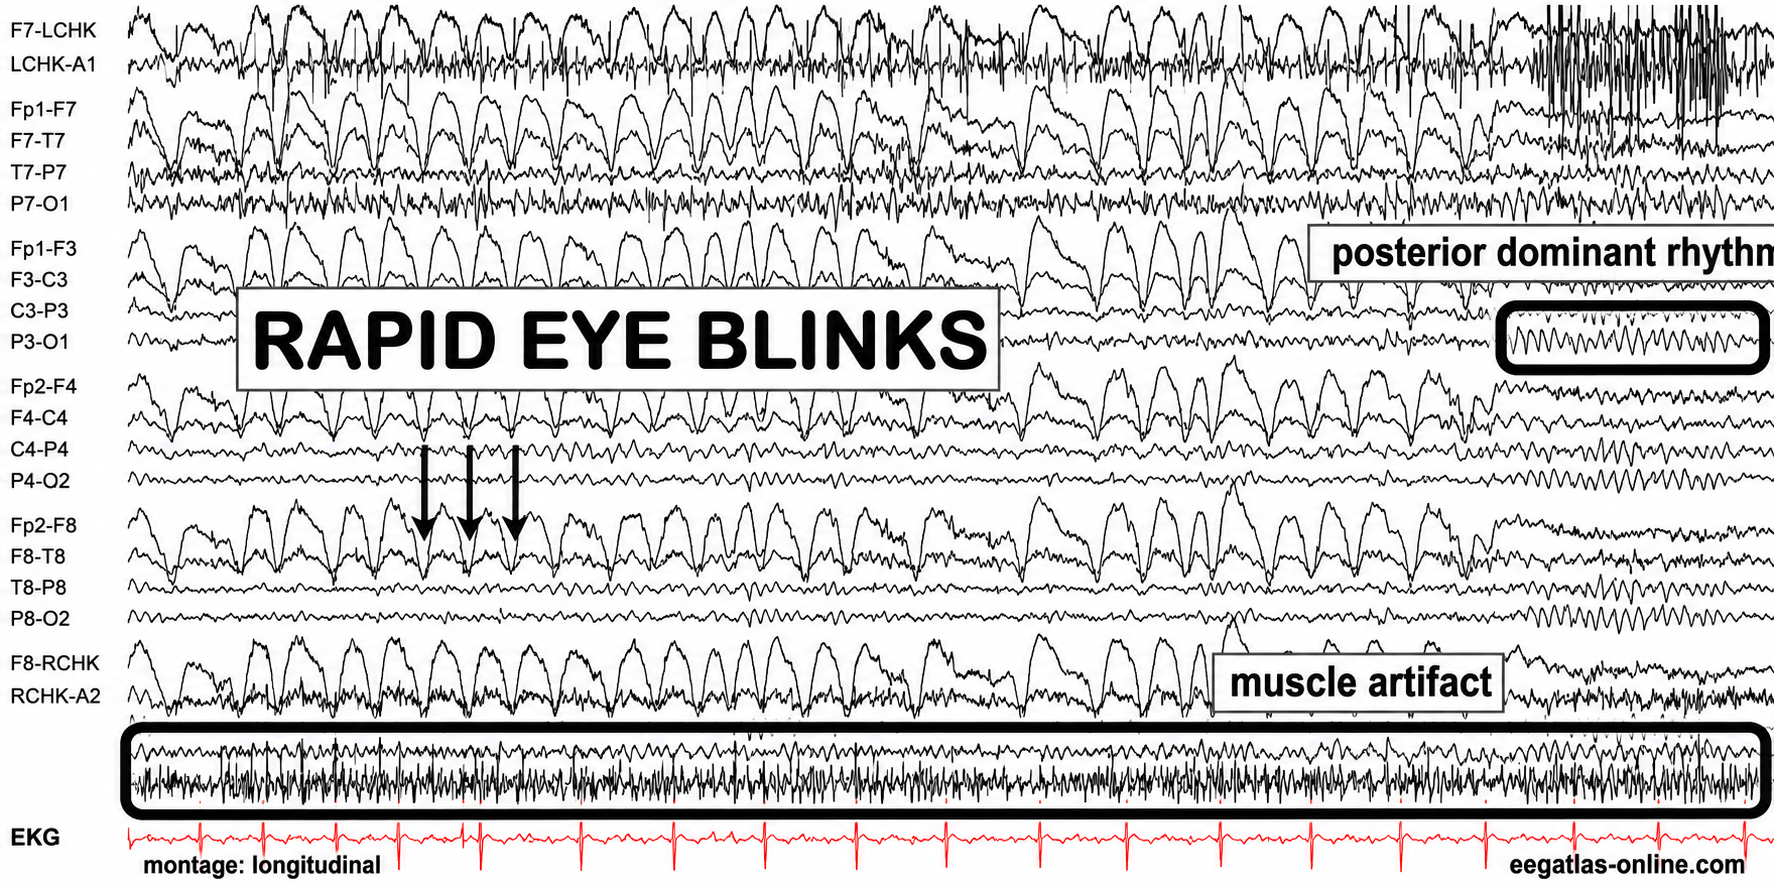
Graphic adapted from © eegatlas-online.com. This recording captures rapid eye-blink artifact with superimposed muscle artifact in a longitudinal bipolar EEG montage. The tracing shows repetitive, high-amplitude, sharply contoured anterior transients produced by rapid blinking, maximal in the frontopolar and frontal derivations and diminishing posteriorly. These stereotyped blink waveforms recur in close succession and obscure the underlying EEG background, particularly across FP1-F7, FP1-F3, FP2-F4, and FP2-F8 chains. A separate band of irregular high-frequency activity labeled muscle artifact is visible near the lower portion of the recording, consistent with concurrent facial, scalp, or jaw EMG contamination. In contrast, the labeled posterior dominant rhythm is seen over posterior channels as a more regular occipital rhythm, helping distinguish physiologic cerebral activity from ocular and myogenic artifact. The EKG channel at the bottom provides cardiac timing and is not time-locked to the blink or muscle bursts.
Inexperienced practitioners with minimal EEG training often made errors in data selection and artifact rejection. Eye artifact, for example, is slow (1-4 Hz) and high in amplitude (50-100 microvolts or higher), placing it squarely in the delta frequency band but at much higher voltages than typical resting delta activity. This artifact contamination inflated frontal delta values when compared to a normative database, producing false-positive findings. Additional artifacts, including EMG (muscle) contamination that artificially elevated beta and high-beta frequencies, cable sway artifact in the delta range, and electromagnetic interference at the 50 or 60 Hz line frequency, which sits above the beta band but leaks into fast-beta and gamma bins, compounded these problems.
A second major error was training every finding that deviated from normal values. In some cases, this resulted in clients reporting worsening symptoms, the return of previously resolved symptoms, or even the emergence of serious new problems. Clinicians gradually recognized that not all abnormal or out-of-range qEEG findings reflect pathology; some represent compensatory patterns through which the brain attempts to find balance, or homeostasis. Removing these compensatory patterns often produced the negative effects observed. This understanding led to a more refined approach: target only the specific symptom or network most problematic for the client and incorporate mechanisms to detect and correct for undesirable shifts in EEG variables.
Quantitative EEG databases transformed neurofeedback protocol development by enabling objective, data-driven identification of training targets. However, challenges emerged including artifact contamination from inexperienced practitioners, the risk of training compensatory EEG patterns, and the complexity of interpreting database reports. These difficulties highlighted the need for proper training in EEG interpretation and led to the development of more sophisticated approaches like z-score training.
The Development of Z-Score Training
This section covers how z-score training emerged as a direct response to the limitations of earlier database-guided approaches. You will learn how this method works, how it has evolved from simple two-channel systems to 19-channel LORETA-based training, and why it has gained widespread acceptance.
To address the need for real-time, database-guided neurofeedback, Robert Thatcher, developer of the NeuroGuide database, collaborated with Thomas Collura of BrainMaster Technologies to create Live Z-Score Training (LZT). Thatcher, Lubar, and Koberda (2019) date the development and testing of real-time comparison against a healthy reference database to 2004-2006, building on four-channel EEG biofeedback available since the 1990s. The concept was straightforward: provide clients with real-time information about how closely their EEG matched a database of age-matched typical controls. A two-channel configuration yields roughly 76 z-scores and a four-channel configuration up to 248, covering absolute and relative power (amplitude squared), power ratios, amplitude asymmetry, coherence, and phase for the standard EEG frequencies. The client's values were compared to the normative data and displayed as standard deviations, with the goal of training toward z-zero, the statistical mean of the normative population.
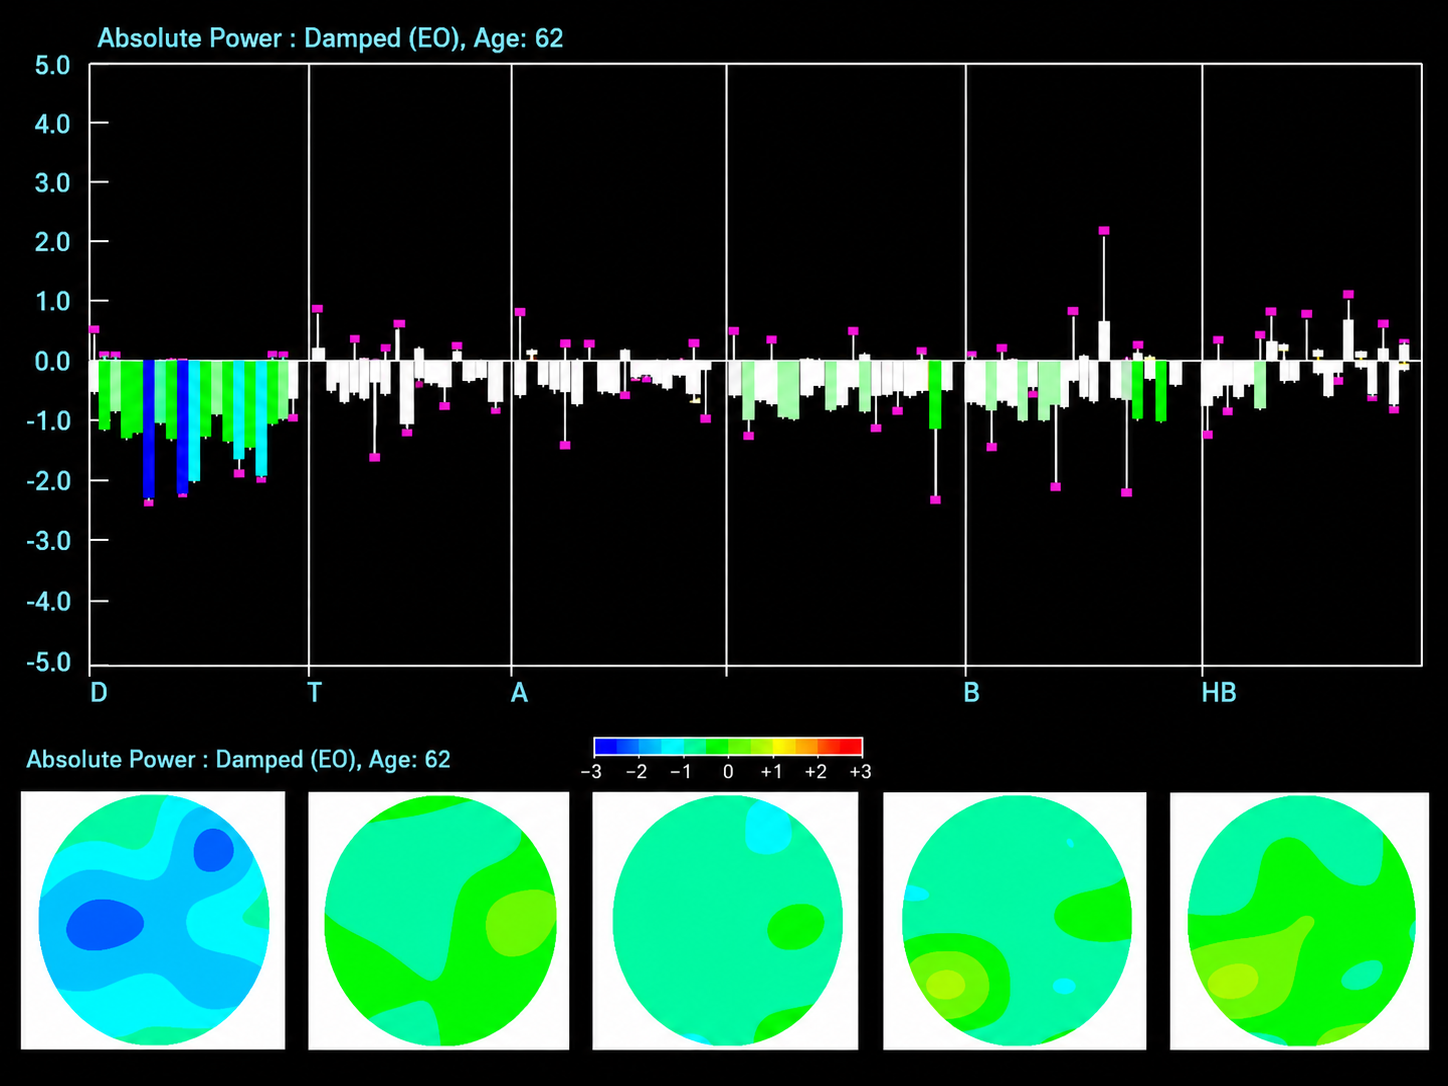
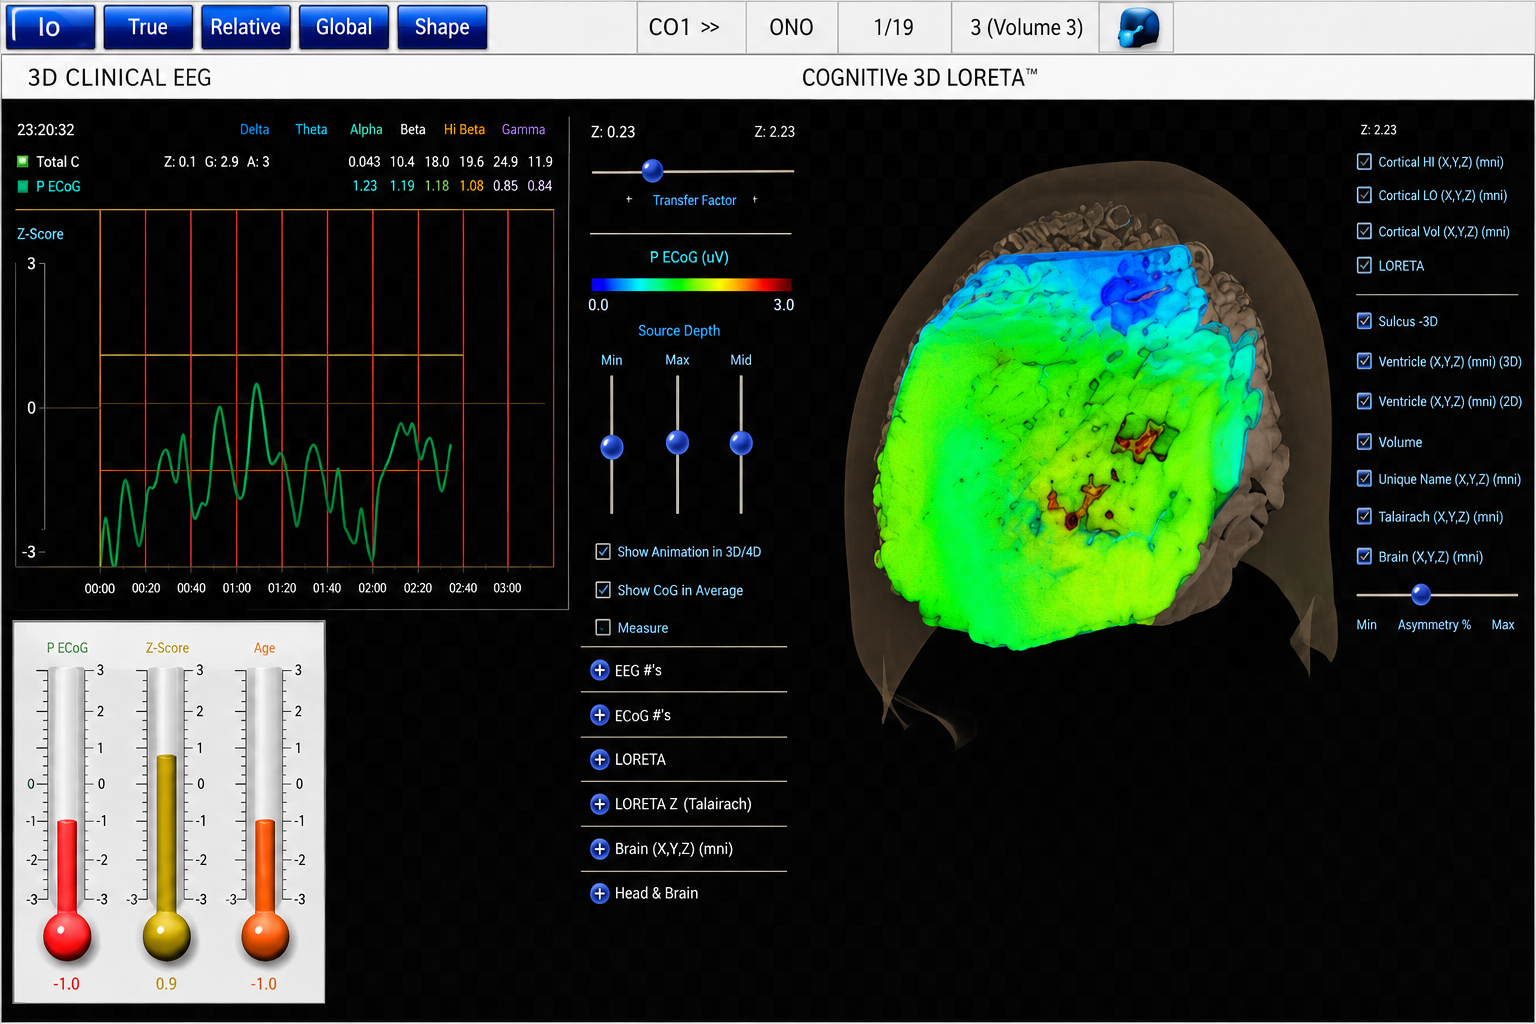
Subsequent advances expanded the method to 19-channel real-time surface z-score training, and then to 19-channel LORETA z-score training, using the mathematical inverse solution of Pascual-Marqui and colleagues (1994) to estimate cortical sources of EEG activity and train in three dimensions. Robert Thatcher and his team went on to adopt swLORETA, which adds a lead-field weighting to sLORETA to improve robustness under realistic noise and sensitivity to deep sources (Palmero-Soler et al., 2007). The database developer maintains a bibliography of more than 50 z-score neurofeedback publications (https://www.appliedneuroscience.com/PDFs/Z_Score_NFB_Publications.pdf). Read it as a map of activity rather than an efficacy corpus: it mixes peer-reviewed articles with book chapters, newsletter pieces, a dissertation, and single-case reports, and contains no randomized controlled trials.
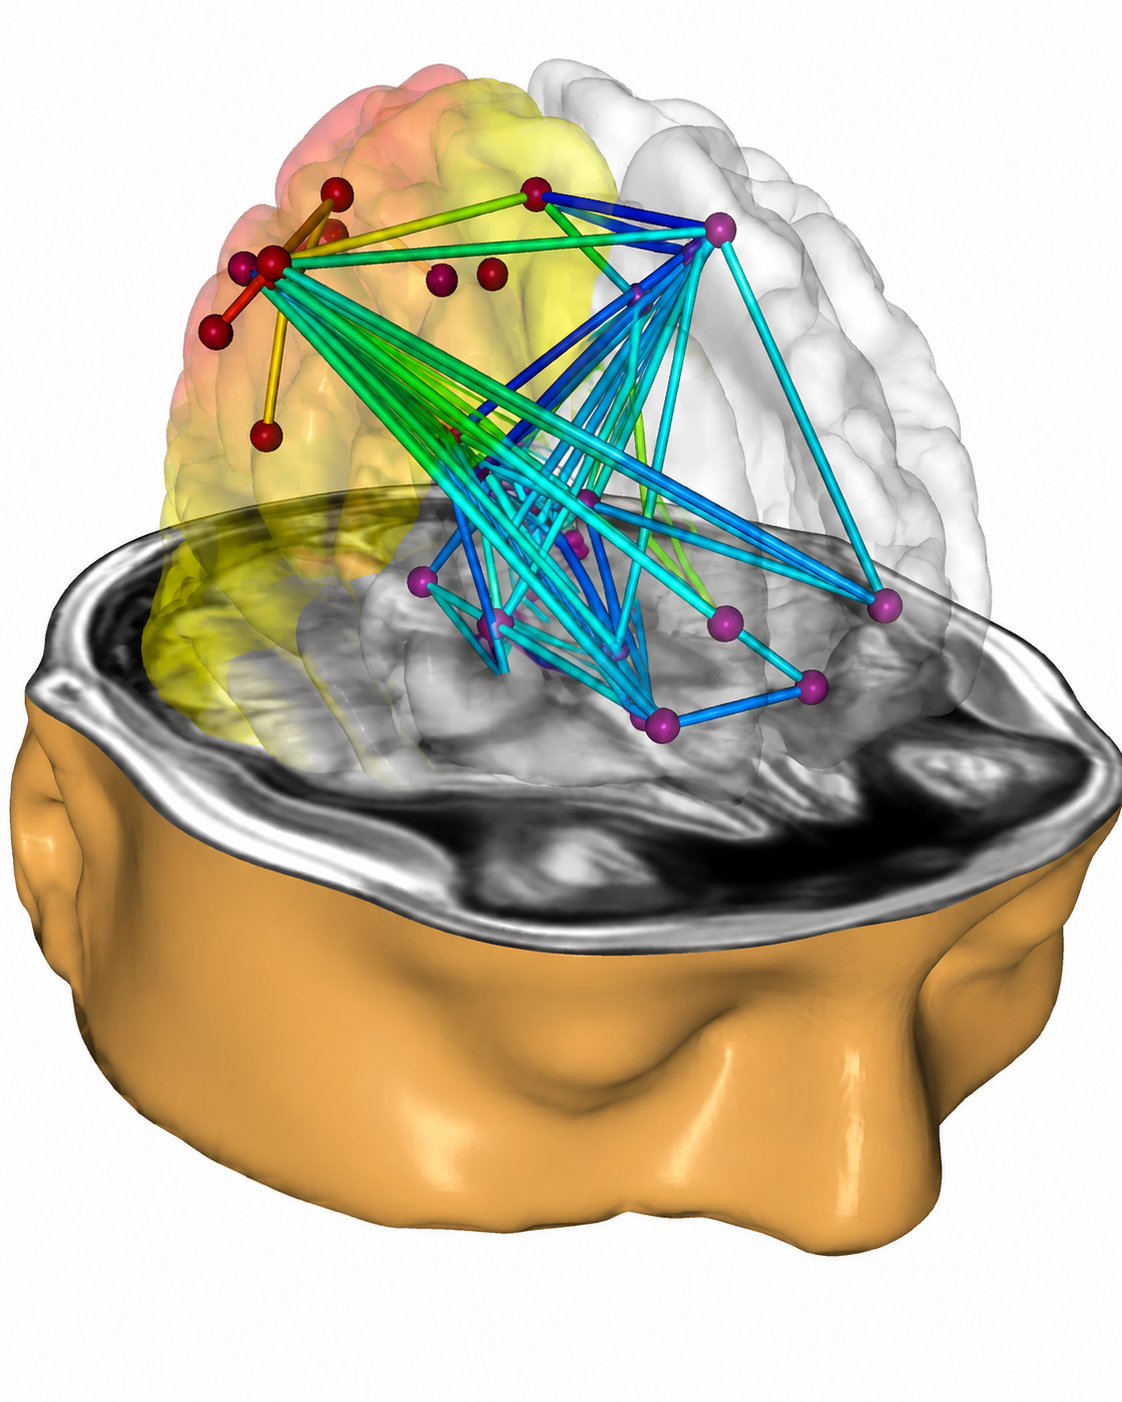
Collura and his colleagues initially used the NeuroGuide database, then shifted to E. Roy John's BrainDX database, and more recently adopted a database known as qEEGPro. The qEEGPro database was developed using client EEG recordings that were cleaned of clinical EEG patterns identified through a client questionnaire (qEEG.pro/database/). This approach is based on assumptions that many qEEG researchers have questioned, and several experts consulted about it expressed skepticism (personal communication, John Anderson, 2019-2021).
Clinical Database Development
This section contrasts the normative database approach with an alternative tradition: the clinical database. You will learn how experienced practitioners developed their own reference systems based on clinical observation, examine the strengths and limitations of each approach, and consider specific clinical databases that are in current use.
Alongside the normative database approach, a parallel tradition emerged from experienced practitioners who trained new clinicians. These skilled clinicians began developing what became known as clinical databases, reference systems built from their personal experience with often hundreds of clients, informed by their observations of similarities and differences in EEG findings across clinical populations. They also drew on published research in electroencephalography and neurofeedback to identify correlations with their own clinical experience.
Paul Swingle stated in NeuroConnections (Swingle, 2014) that "For Clinicians, the most accurate databases are clearly clinical." He raised several logical challenges to the normative database approach. For instance, he questioned the fundamental premise that symptom-free individuals selected for a normative database are truly free of underlying abnormalities. Heritable disorders such as migraine and schizophrenia may have verifiable neurophysiological components that remain unexpressed because triggering factors have not occurred. This means a database of individuals who pass all screening tests might still include notable EEG findings that become part of the "normal" standard.

Others have raised complementary concerns. Johnstone and Gunkelman (2003) pointed out that a symptom-free individual may still show abnormal findings on a clinical EEG assessment performed by a skilled electroencephalographer. They also noted that database comparisons identify differences from average, not from optimal. The term "normal" is inherently difficult to define, particularly for a highly variable measure like the EEG. Proponents of clinical databases, however, claim exceptional accuracy with clinical populations because these databases were developed from experience with individuals who share similar symptoms, causal factors, symptom progression, and treatment histories.
A practical difference between the two approaches lies in their output. A normative database analysis may produce 200-300 pages of tables, graphs, and topographic brain maps, an impressive but potentially overwhelming array of information that can be difficult to interpret. Questions arise about which components are important, which relate to the client's symptoms, and which are useful for planning training sessions.
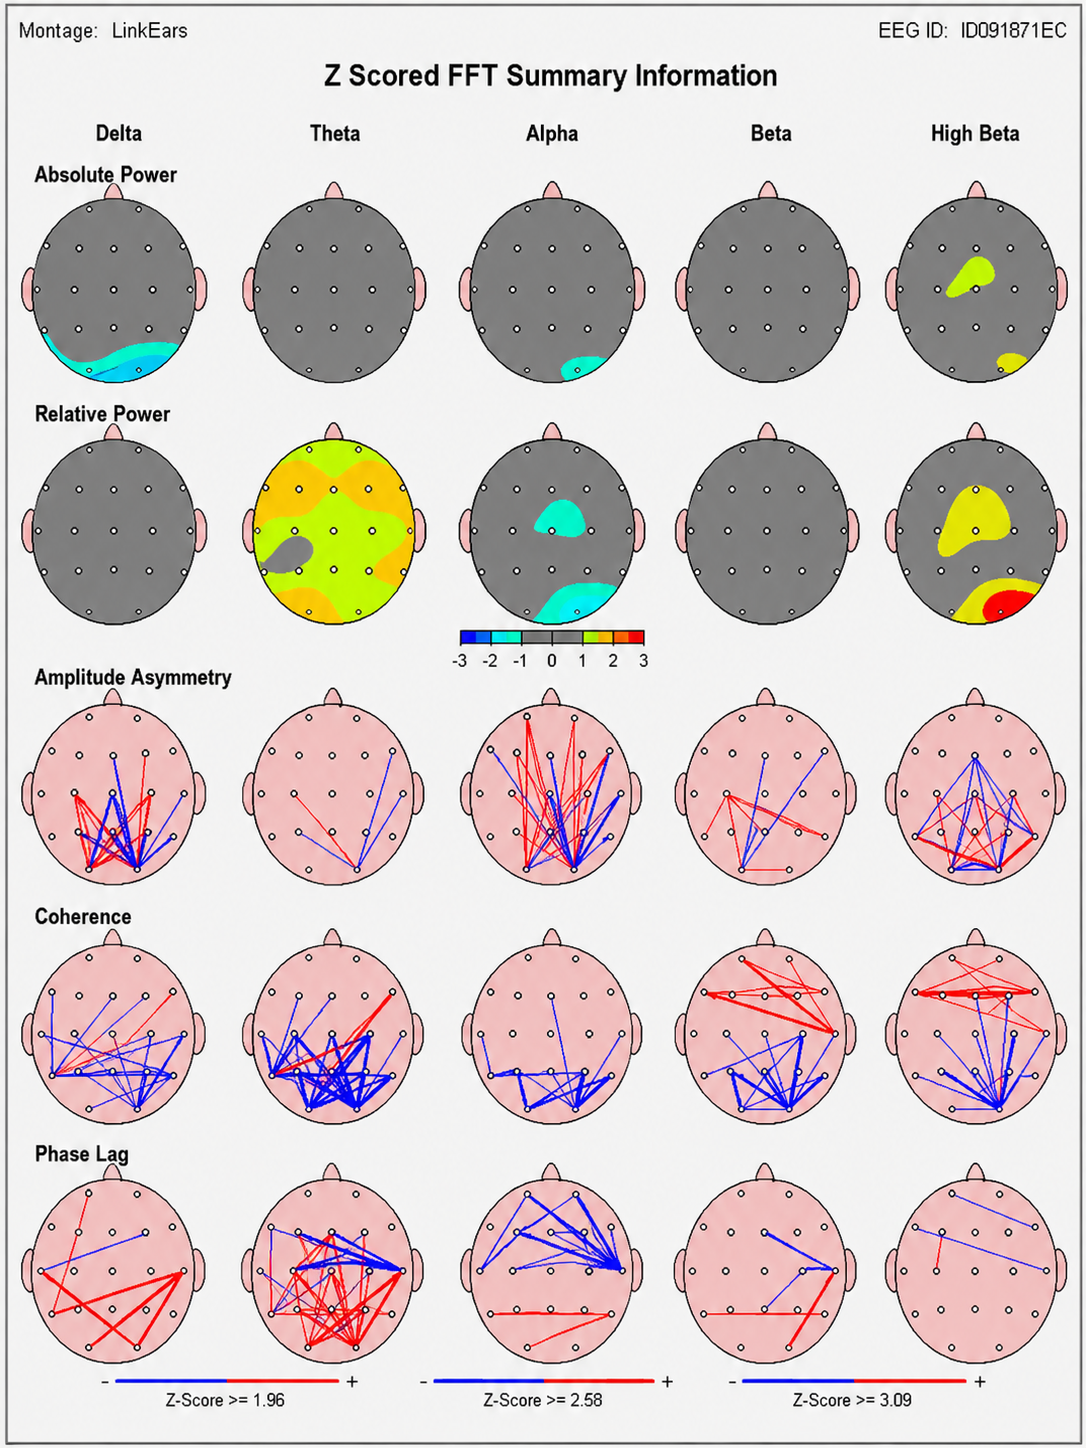
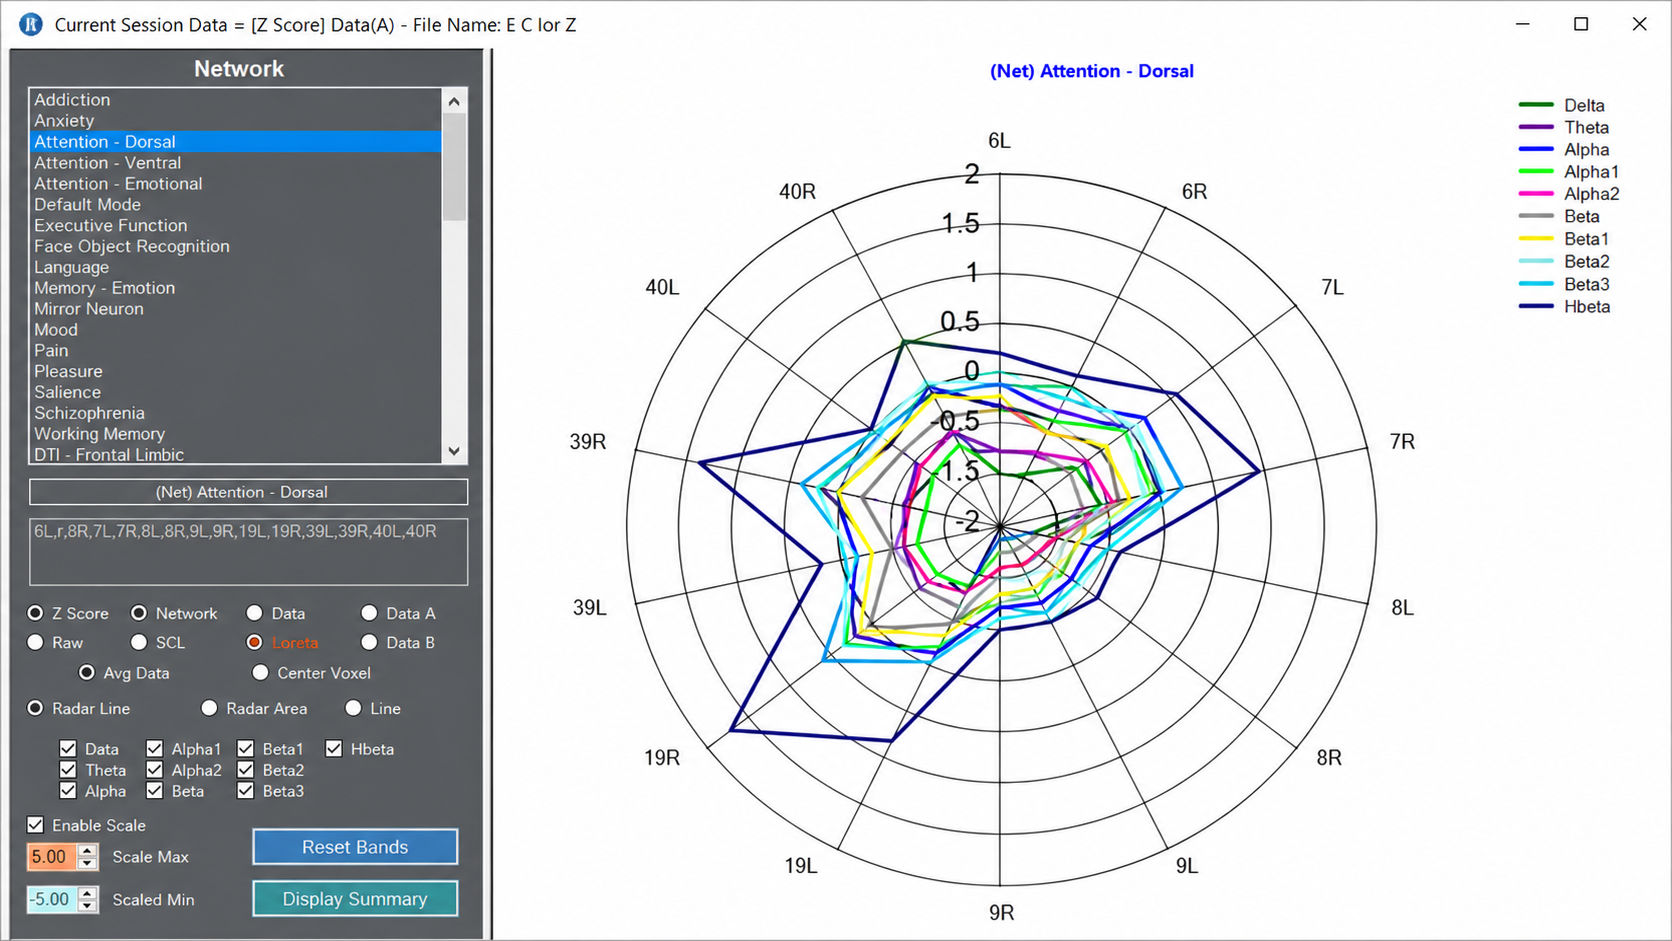
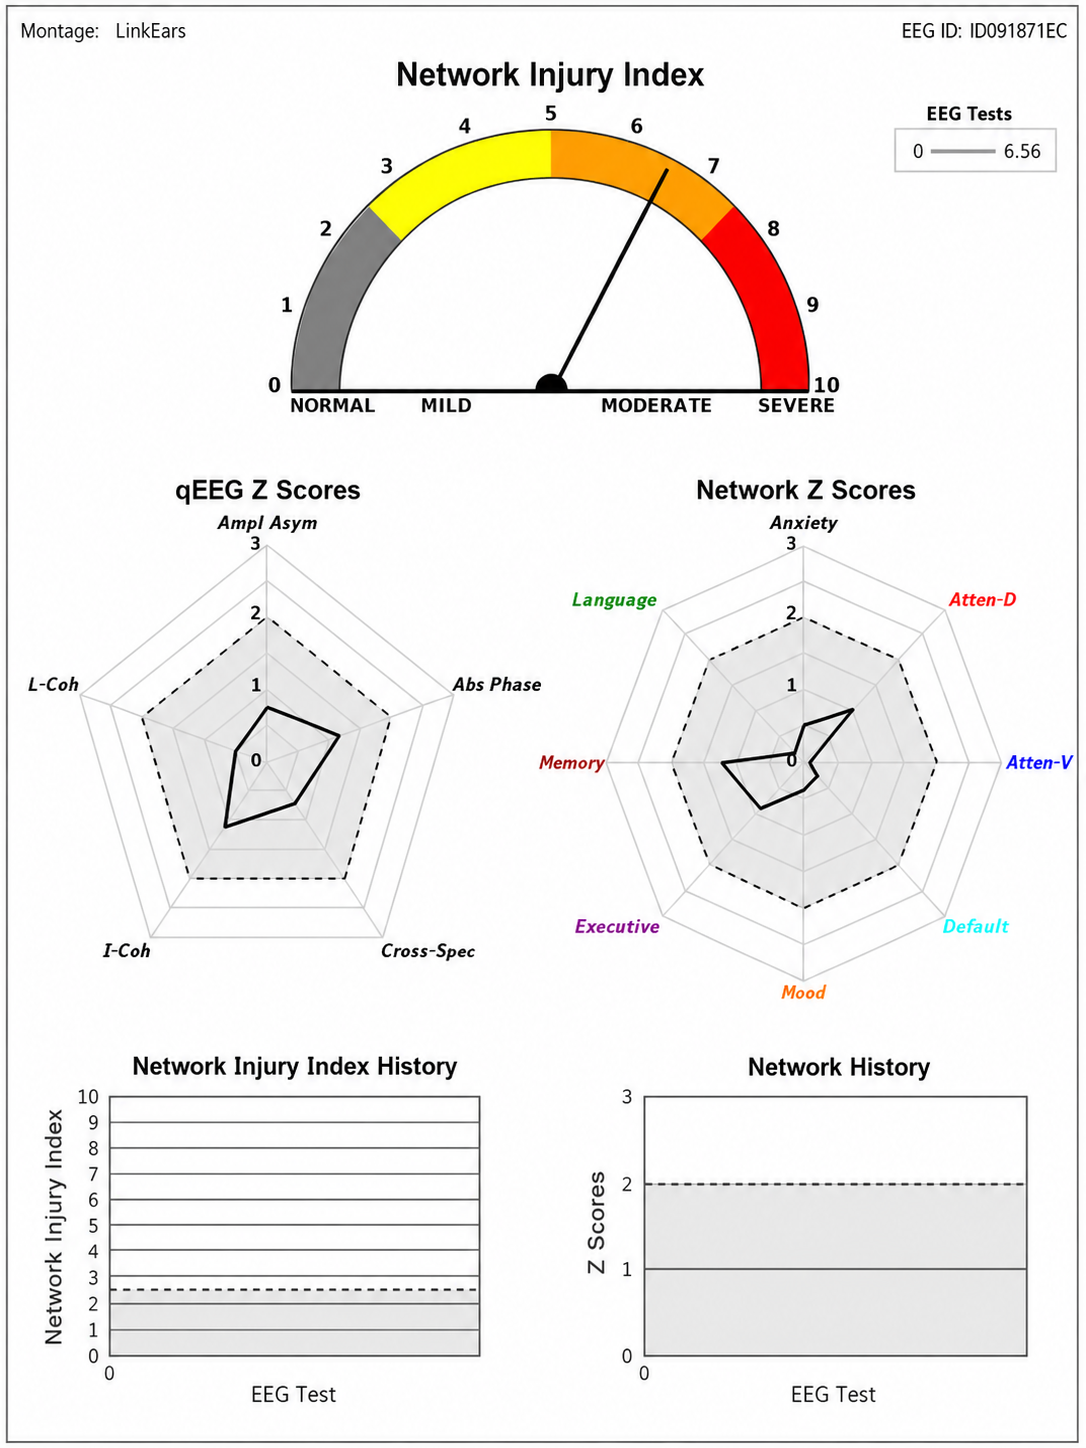
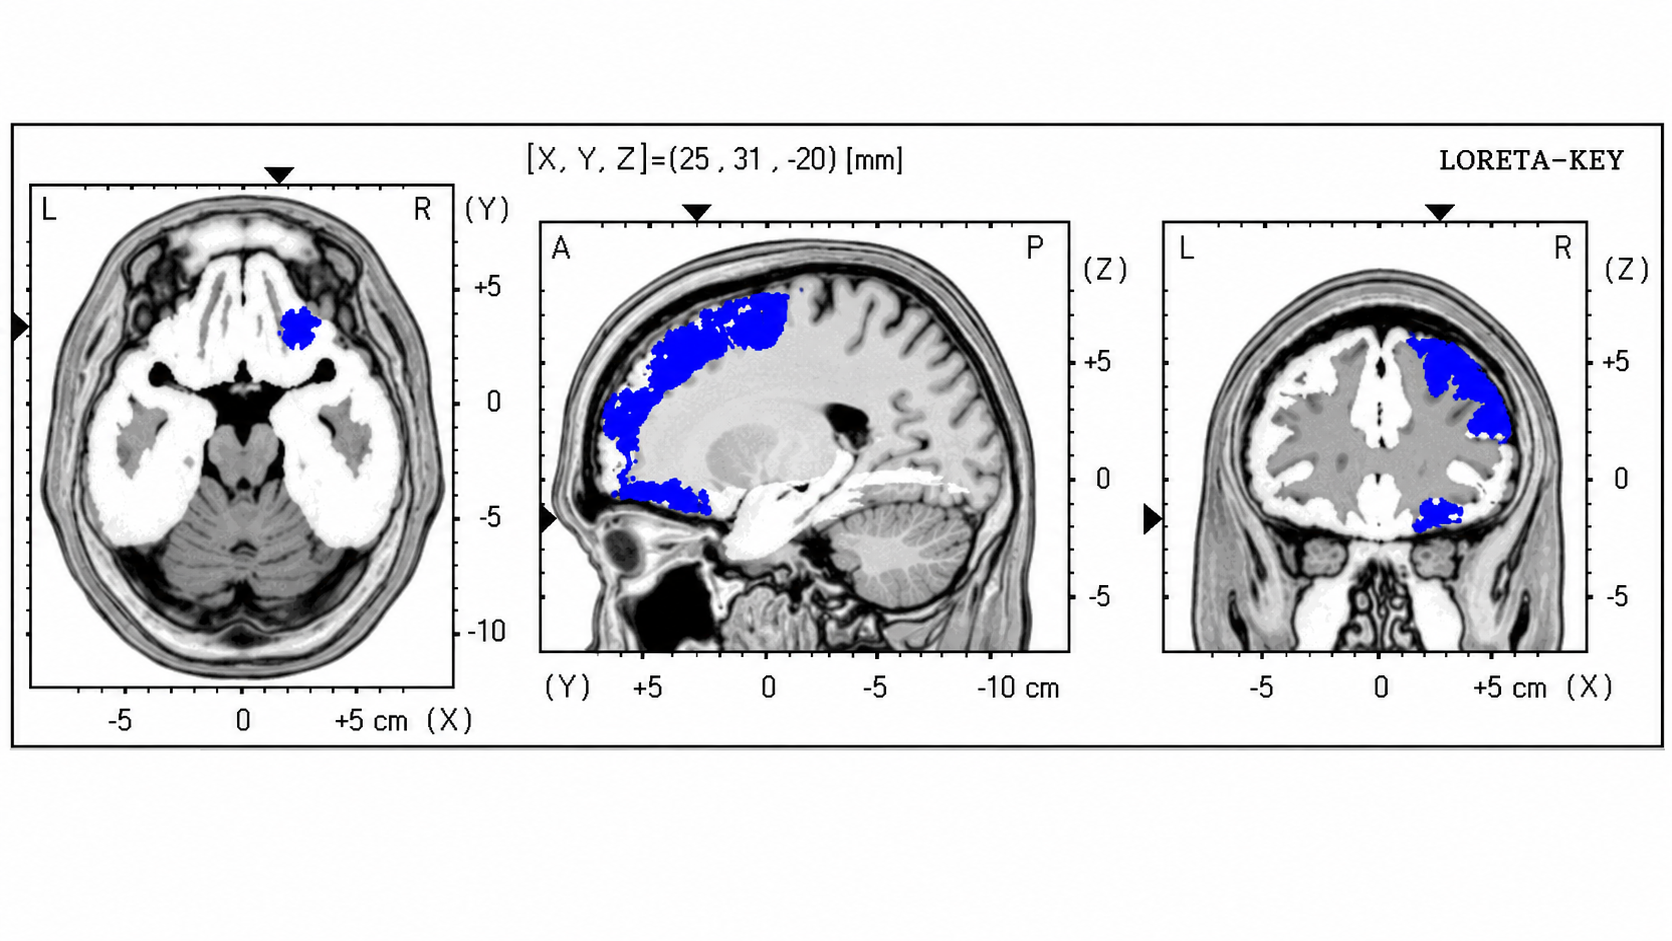
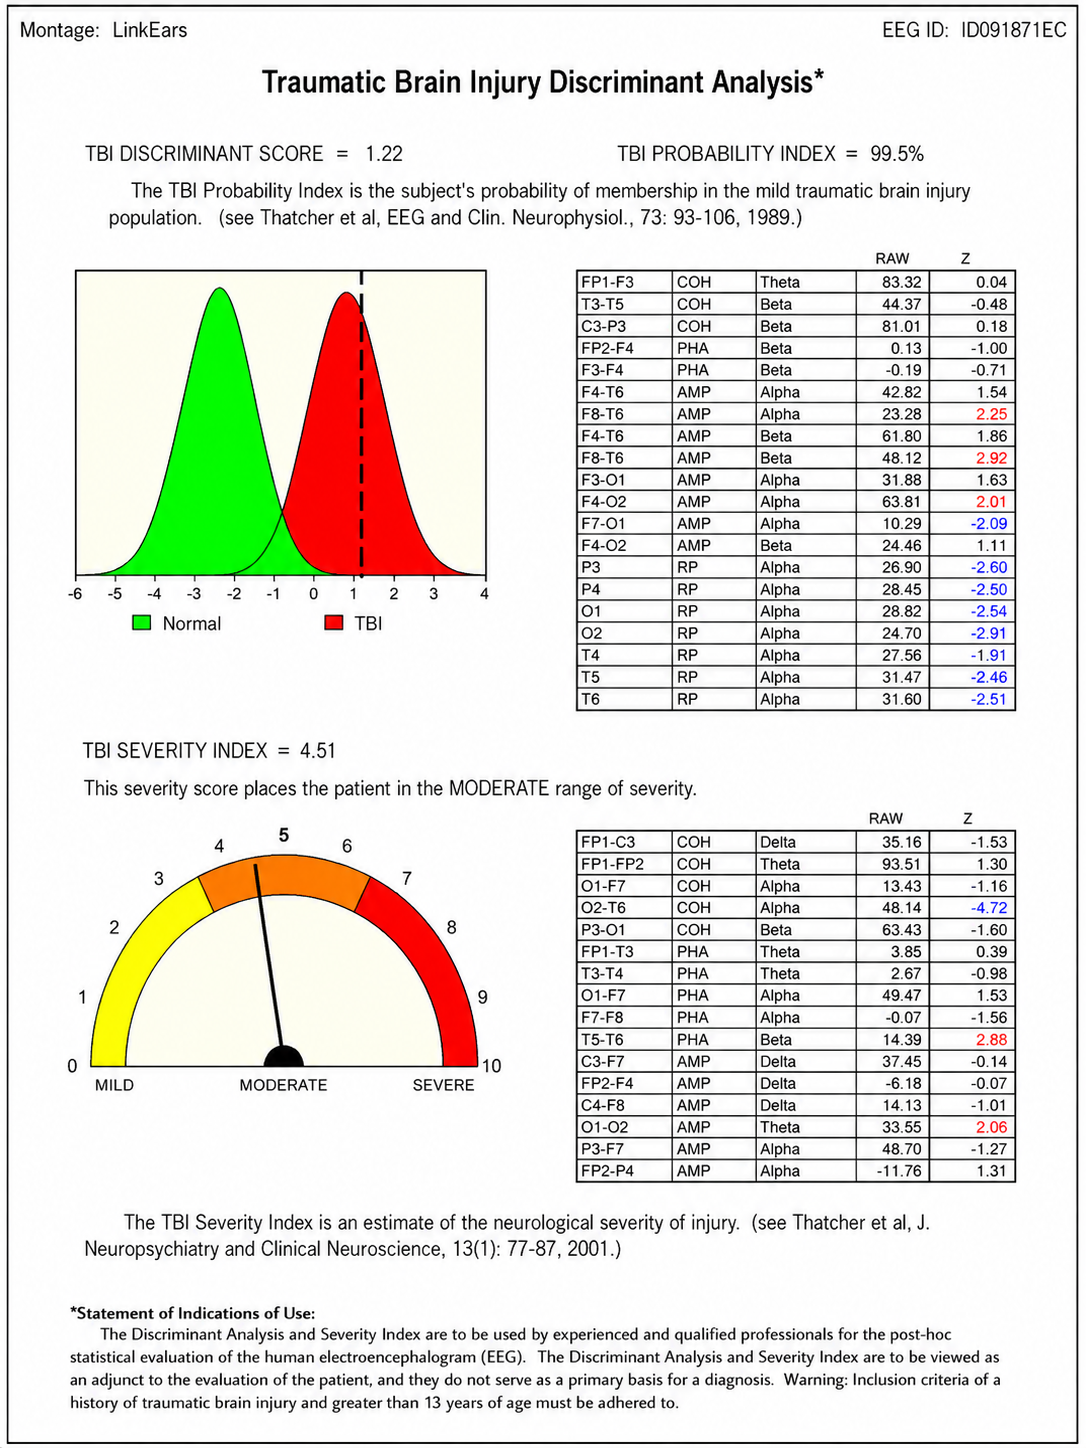
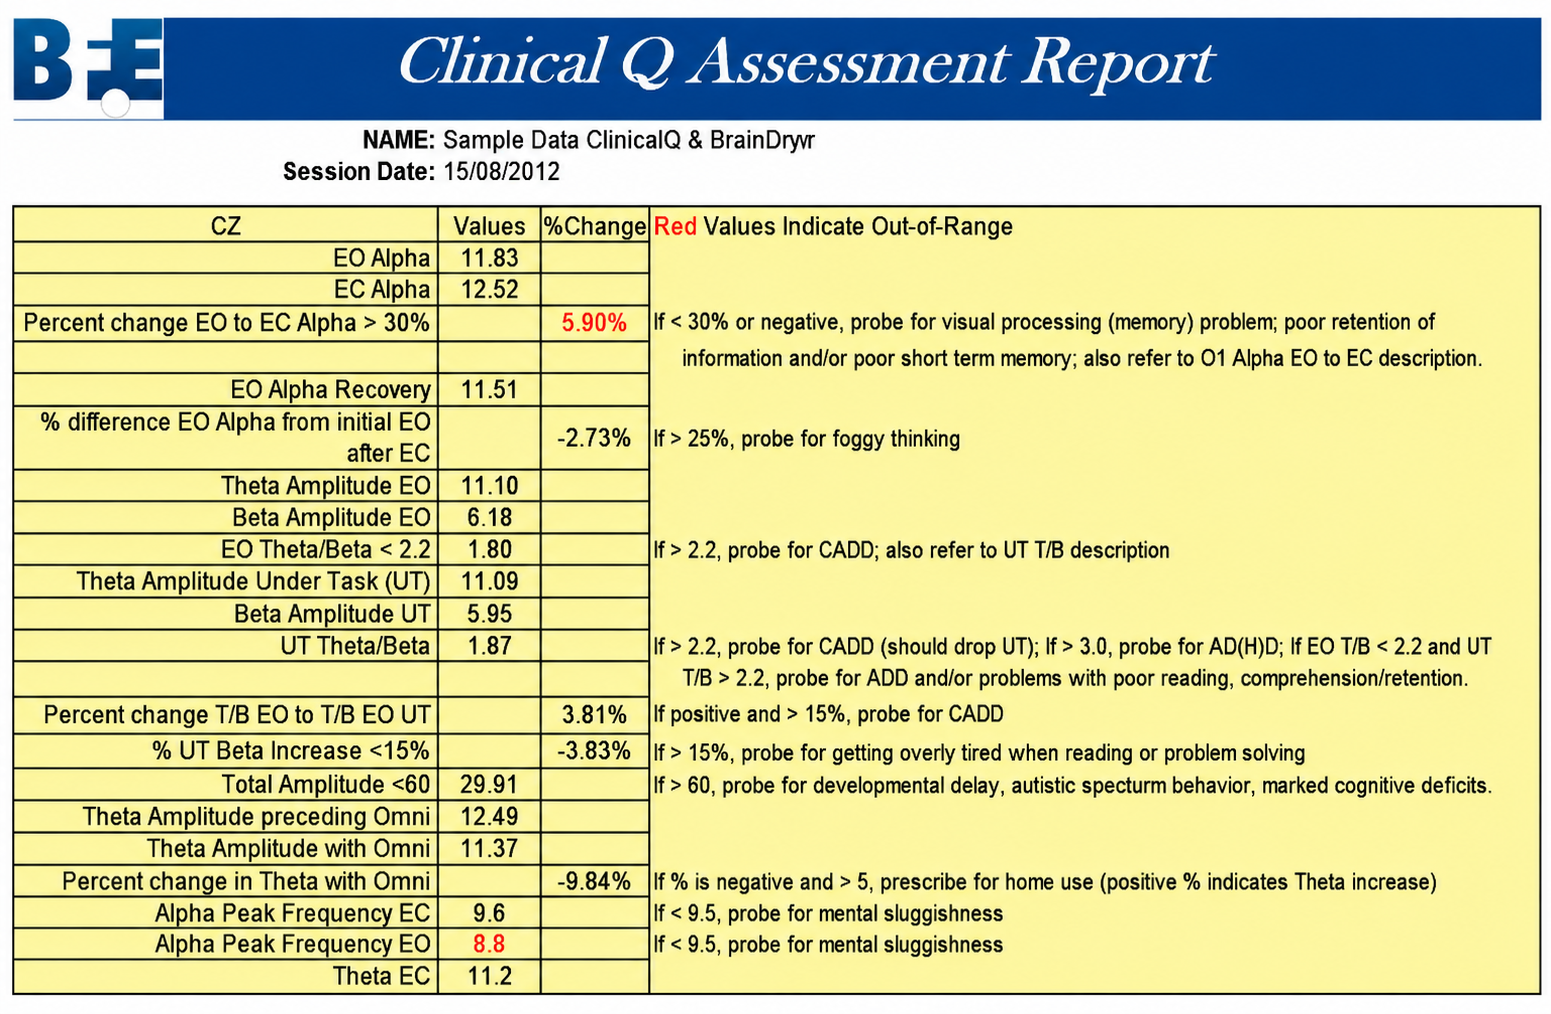
Clinical databases, by contrast, are often more descriptive and closely aligned with client symptomatology. Some provide only graphs and tables, but most also suggest relationships between findings and probable client symptoms. Swingle's Clinical Q, for example, displays differences from expected data and offers "probes," questions about client symptoms or behaviors that may be consistent with specific EEG findings.
Peter Van Deusen
One of the earliest clinical databases was created by Peter Van Deusen (Ribas et al., 2016), who initially studied with Joel Lubar. His goal was to identify client symptoms and behavioral issues without relying on diagnostic categories, so that neurofeedback could be applied regardless of the specific diagnosis. The culmination of his years of clinical work was an approach known as The Learning Curve (TLC), which organized client symptoms and findings into six broad categories and identified corresponding training approaches.
Richard Soutar
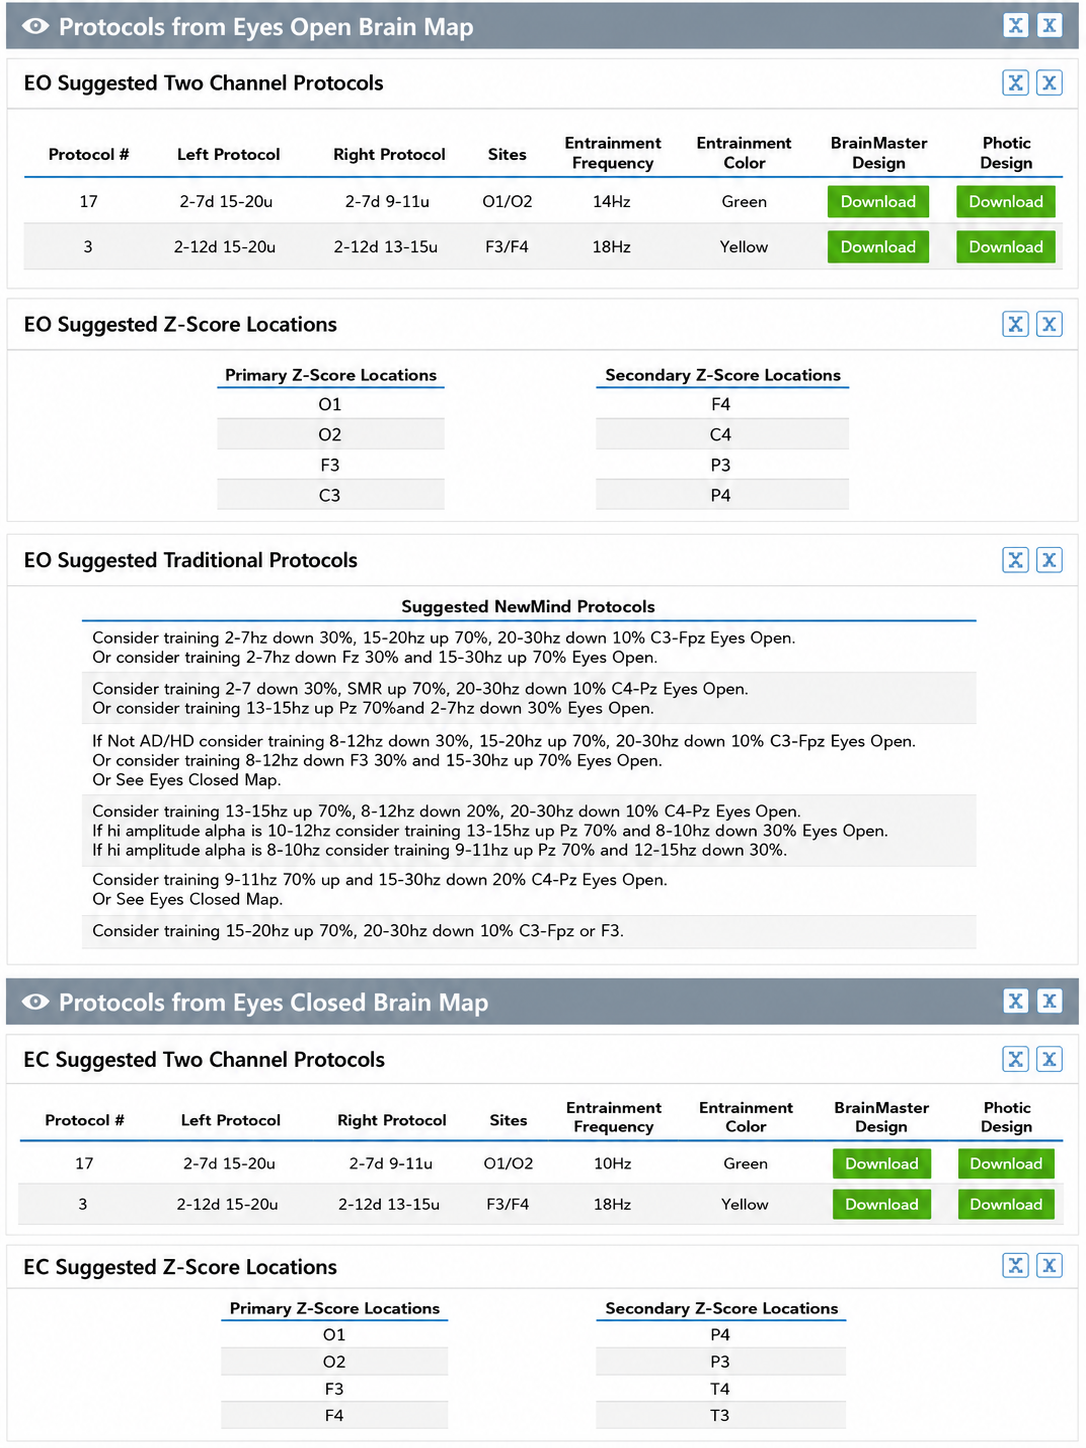
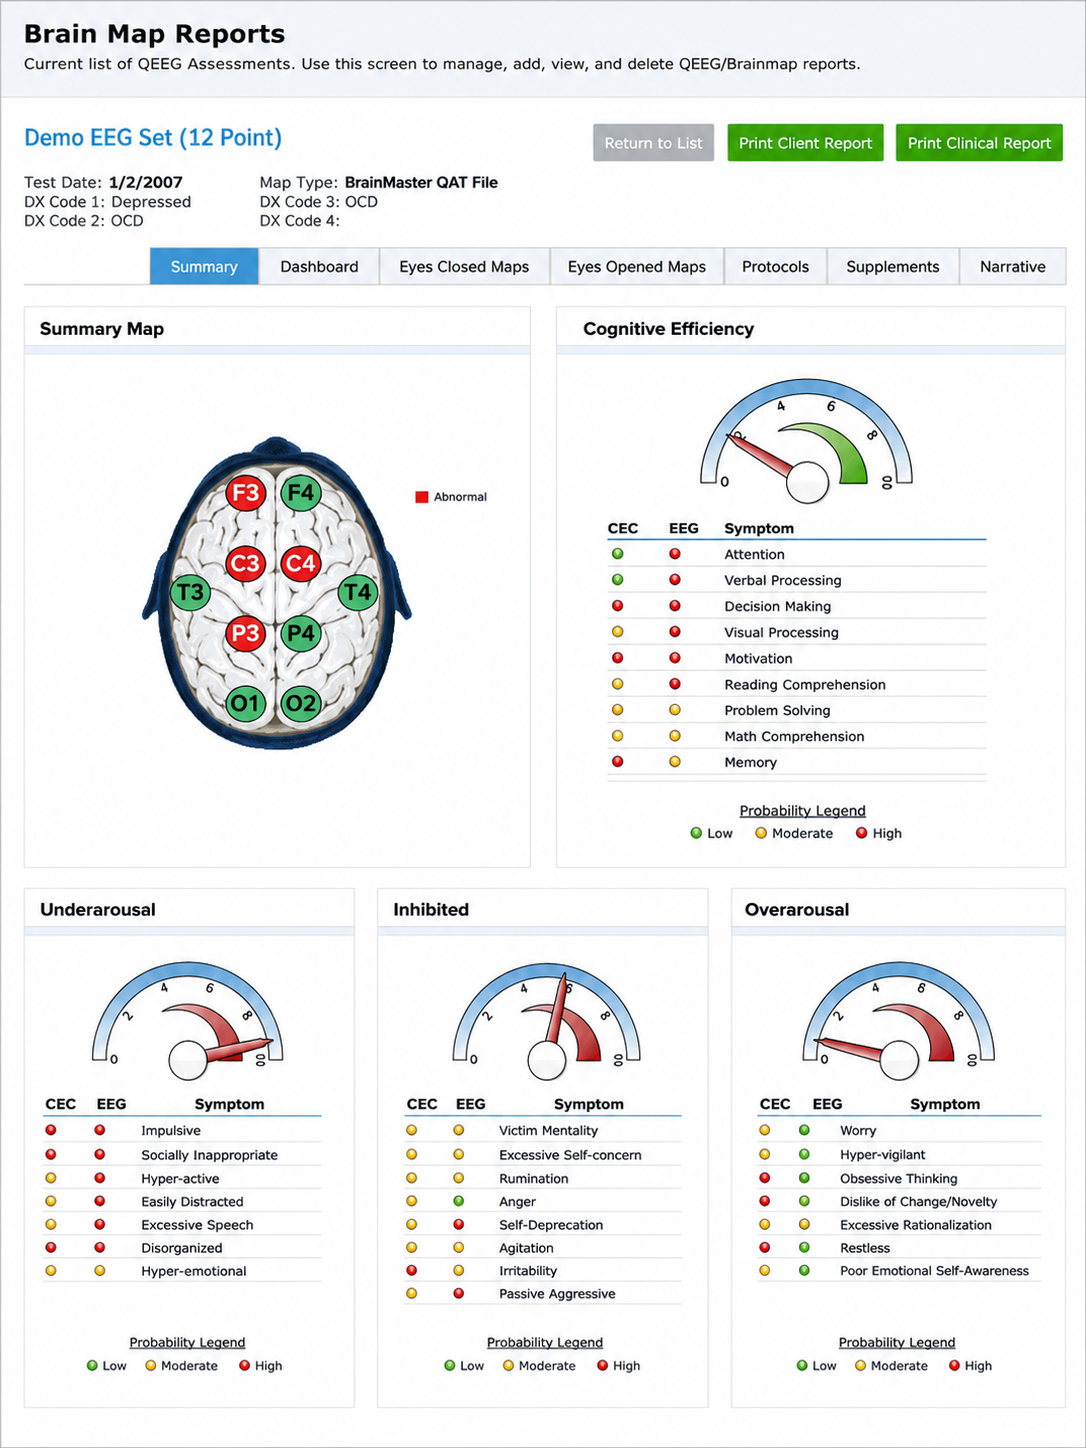
Arguably the most comprehensive clinical database system is the New Mind Maps developed by Richard Soutar. This system offers multiple levels of analysis up to 19 channels and produces a detailed report covering most standard metrics. It provides narrative content, protocol recommendations for both standard amplitude training and z-score training, and advice about additional interventions such as audio-visual entrainment (AVE).
John Demos
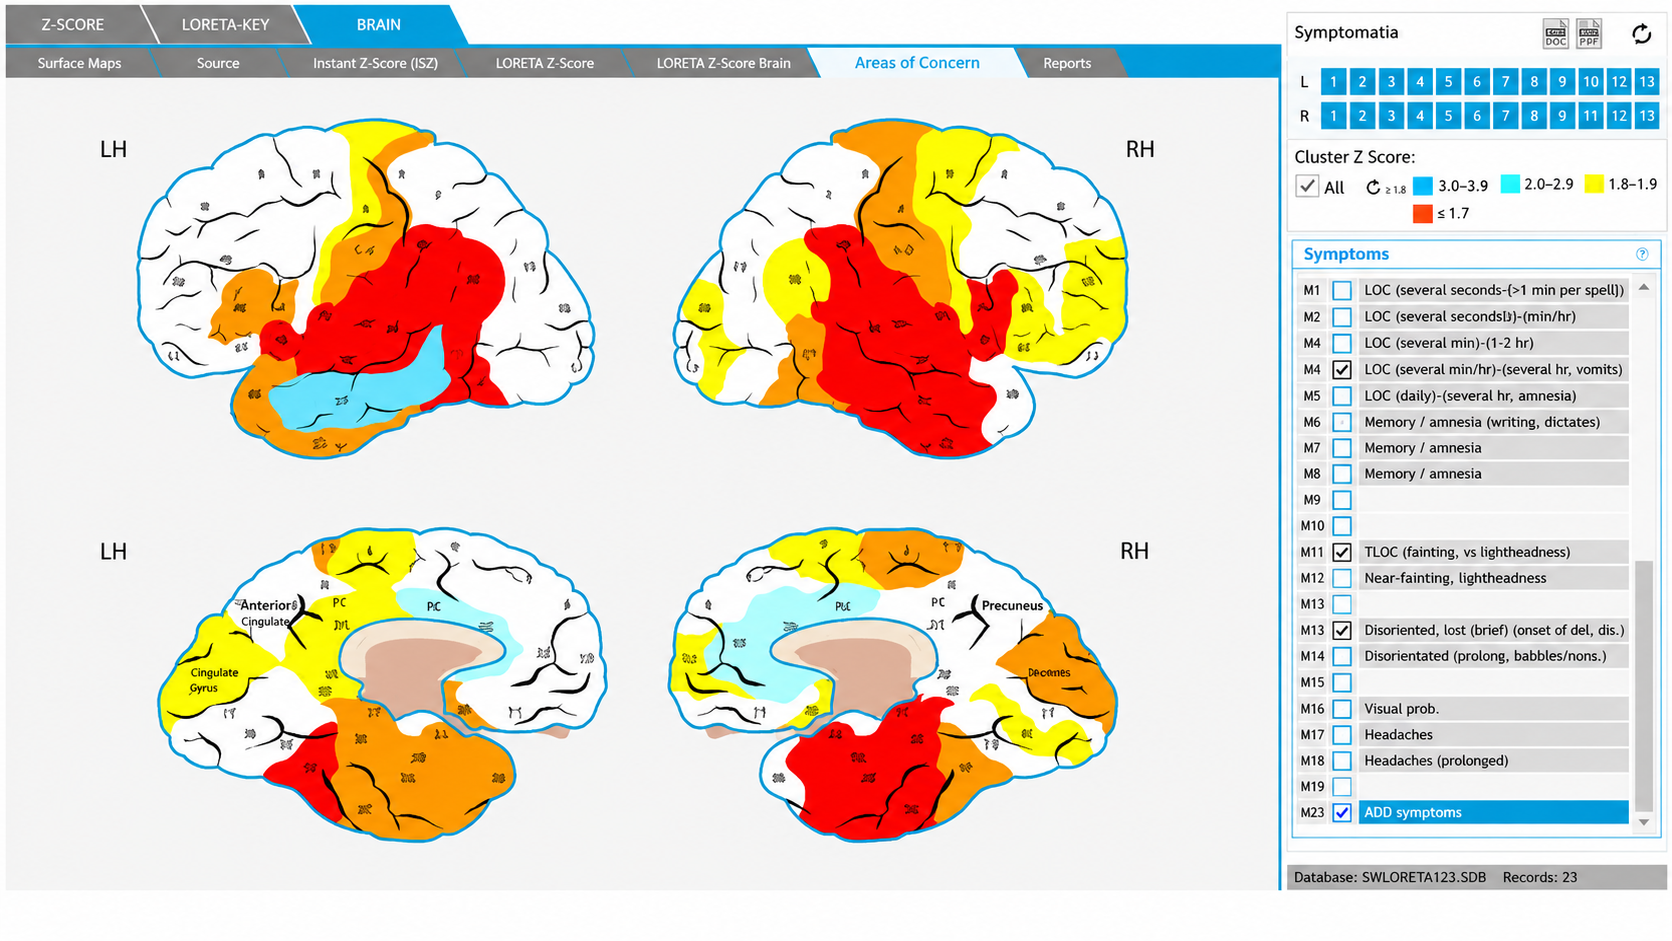
The Jewel Clinical Database, developed by John Demos, author of Getting Started with EEG Neurofeedback (2nd ed., 2019), provides another clinical database option for ages 7-19 and adults. It produces surface and sLORETA (standardized low resolution electromagnetic tomography) representations including maps, graphs, and training recommendations based on client checklists.
John Anderson
John Anderson developed an assessment specifically for the Nexus/BioTrace system known as the NewQ. Like Swingle's ClinicalQ, which records five sites (Cz, O1, F3, F4, and Fz), it samples a small set of locations sequentially, six locations, two at a time, with four age ranges: 6-11, 12-15, 16-20, and 21+ (adult).
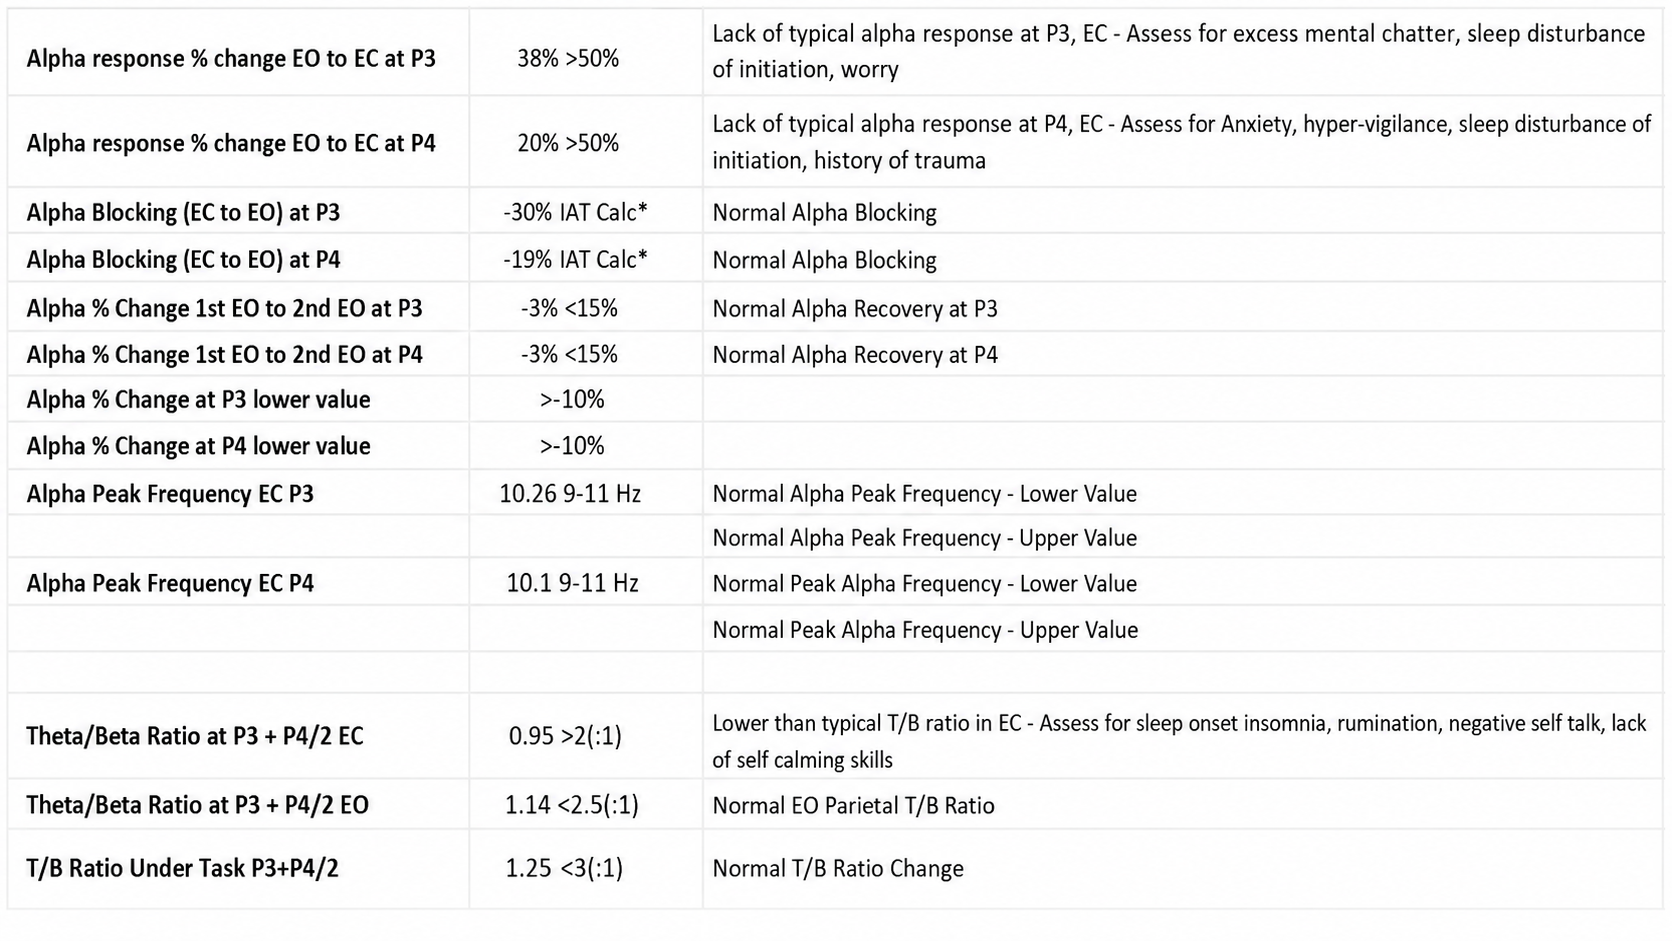
The following disclaimer from the NewQ assessment reflects important cautions applicable to all clinical databases:
Disclaimer: This assessment tool is based upon a general understanding of the EEG literature plus the author's clinical experience. It should not be viewed as a statistically validated or rigorously referenced instrument and constitutes a set of clinical observations. It is not a diagnostic instrument, and results must be evaluated based on the client's presenting concerns. The clinical judgment of the practitioner must remain primary in any assessment process.
The clinical database approach has genuine value: it provides practitioners with assessment perspectives grounded in the author's knowledge and clinical experience, offering a helpful shortcut for beginning and experienced clinicians alike. However, because sensor locations are often recorded sequentially (except for Soutar's 19-channel New Mind Maps), these assessments cannot calculate important metrics such as phase and coherence for locations not recorded simultaneously. Additionally, each database designer's perspective is inherently subjective and, while reflecting real knowledge and experience, may also carry unconscious biases and assumptions not rigorously grounded in published research.
Ideally, the field will eventually integrate the normative database approach with clinical assessment to create a truly accurate and effective expert system for developing evidence-based neurofeedback training protocols.
Z-score training provides real-time comparison of client EEG to normative databases, enabling targeted training toward typical values. Clinical databases offer a complementary approach based on practitioner experience with clinical populations and may be more descriptive and user-friendly. Both normative and clinical database approaches have strengths and limitations, and the field would benefit from an eventual integration of these methodologies into a comprehensive expert system.
Conclusion
As hardware and software tools continue to grow in sophistication, new protocols and refinements will inevitably emerge. Many clinicians and researchers who have made substantial contributions were not mentioned in this section; the goal has been to present a representative sample of the major protocols and their development. This overview should help you evaluate the different approaches you may encounter in your practice and make more informed decisions about which methods best serve your clients' needs.
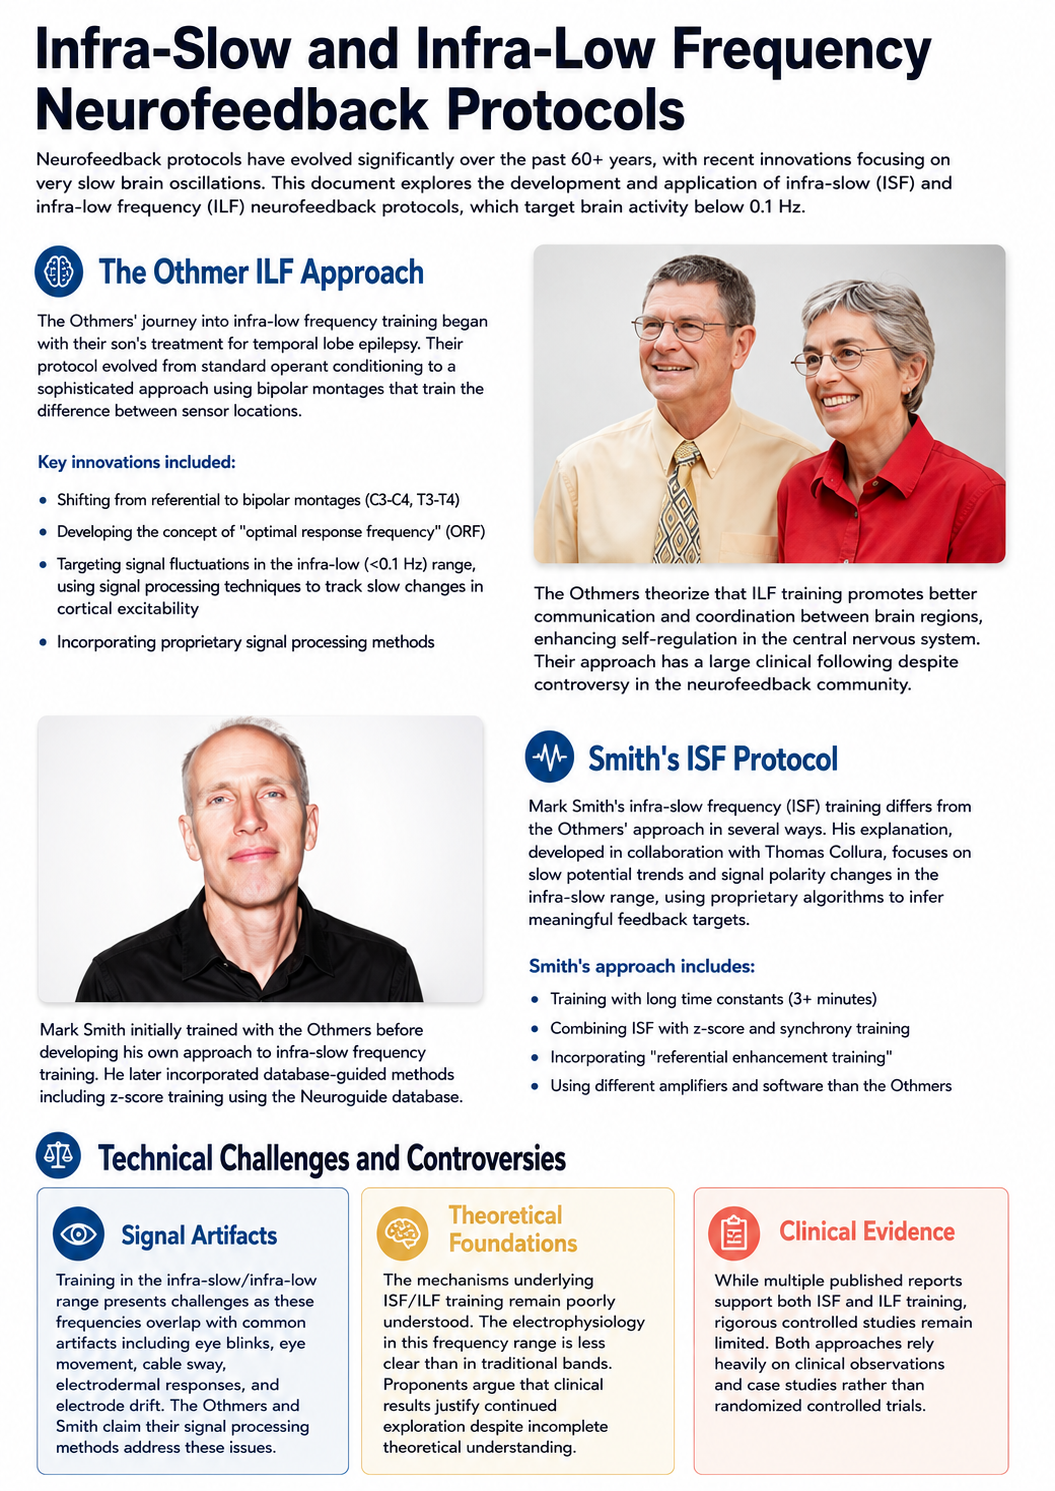
Personalized Protocol Selection Using Machine Learning
Recent advances in machine learning and artificial intelligence are being explored as tools for improving neurofeedback protocol selection. Researchers are developing algorithms that can analyze large datasets of qEEG recordings, client symptoms, and treatment outcomes to identify patterns that may predict which protocols will be most effective for individual clients. While still in early stages, this approach has the potential to move beyond the traditional apprenticeship model of protocol selection toward a more data-driven, personalized approach that accounts for the complexity of individual brain function.
Real-Time Network-Based Training
Emerging research is exploring the use of real-time functional connectivity measures to guide neurofeedback training. Rather than targeting individual frequency bands at specific locations, these approaches aim to train the dynamic interactions between brain networks. By monitoring how different brain regions communicate during a training session, clinicians may eventually be able to provide feedback that targets the functional networks most relevant to a client's symptoms, representing a significant evolution from the single-channel and even multi-channel approaches that have dominated the field.
Check Your Understanding
- How did Sterman's serendipitous finding with cats exposed to monomethylhydrazine contribute to the development of neurofeedback for epilepsy?
- What is the theta/beta ratio, and how did Monastra's work contribute to its use in ADHD assessment and training?
- Explain the role of common-mode rejection in understanding the Othmers' bipolar montage training approach.
- What are the key differences between normative database and clinical database approaches to protocol development, and what are the strengths and limitations of each?
- Why might training all abnormal findings on a qEEG assessment lead to negative outcomes for some clients?
Assignment
Now that you have completed this unit, explain the rationale for z-score training using a normative database.
Glossary
ABA reversal design: a single-case design comprising baseline, intervention, and withdrawal phases, used to test whether behavior changes systematically with introduction and removal of treatment.
alpha blocking: the attenuation or disappearance of posterior alpha activity with eye opening, sensory stimulation, movement, or active cognitive processing.
alpha rhythm: an 8 to <13 Hz EEG rhythm dominant posteriorly during relaxed wakefulness with eyes closed and attenuated by eye opening.
alpha spindles: waxing-and-waning bursts of alpha-frequency EEG activity.
amplitude: the magnitude of a signal's excursion from a specified reference level, reported using a stated convention such as peak, peak-to-peak, or RMS.
attention-deficit/hyperactivity disorder (ADHD): a neurodevelopmental disorder characterized by symptoms of inattention, hyperactivity, and impulsivity that interfere with functioning or development.
beta rhythm: a 13 to <30 Hz EEG rhythm, usually low amplitude, associated with alert wakefulness and active cognitive or motor processing.
beta spindles: trains of spindle-like waveforms, most often frontocentral, with a reported mean frequency of 20.6 Hz (SD = 4.1 Hz) spanning roughly 14-30 Hz. They may signal ADHD, especially with tantrums, anxiety, autism spectrum disorder (ASD), epilepsy, and insomnia.
bipolar montage: an EEG montage composed of bipolar derivations, often arranged in longitudinal or transverse chains to emphasize spatial voltage gradients.
common-mode rejection: a differential amplifier's suppression of voltage shared by both inputs while amplifying the voltage difference between them.
delta rhythm: a 0.5 to <4 Hz EEG rhythm in the tutorial convention, prominent during N3 sleep and potentially abnormal when focal or excessive in awake adults.
desynchrony: pools of neurons firing independently due to stimulation of specific sensory pathways up to the midbrain and high-frequency stimulation of the reticular formation and nonspecific thalamic projection nuclei.
EEG activity: electrical activity represented in an EEG recording, described by frequency, amplitude, morphology, distribution, timing, and reactivity.
EEG power: the squared amplitude of EEG activity quantified over time or frequency, expressed as µV² for band power or µV²/Hz for power spectral density.
epileptiform activity: abnormal, paroxysmal EEG patterns that resemble those seen in epilepsy, often indicating a predisposition to seizures.
fast Fourier transform (FFT): an efficient algorithm for computing the discrete Fourier transform and decomposing a sampled signal into frequency components.
frequency: the number of complete cycles of a periodic phenomenon per unit time, expressed in hertz for cycles per second.
hertz (Hz): the SI unit of frequency equal to one cycle per second.
homeostasis: dynamic regulation that maintains physiological variables within viable ranges despite internal and external change.
infra-low frequencies (ILF): frequencies at and below 0.1 Hz, extending in current Othmer practice into the millihertz range; the Smith and Collura tradition calls the same range infra-slow frequencies (ISF).
infra-slow frequencies (ISF): frequencies below 0.1 Hz, the term used by Smith and Collura for the same range the Othmer tradition calls infra-low frequencies (ILF); the labels name a shared range, not a shared method.
low-resolution electromagnetic tomography (LORETA): the inverse solution of Pascual-Marqui and colleagues (1994) that estimates three-dimensional cortical sources of scalp-recorded EEG at low spatial resolution.
posterior dominant rhythm (PDR): the dominant occipital rhythm during relaxed wakefulness with eyes closed, usually in the alpha range in healthy adults and attenuated by eye opening.
protocol: a rigorously organized plan for training.
quantitative EEG (qEEG): the numerical analysis of digitized EEG features, such as spectral power, asymmetry, and connectivity, sometimes compared with normative databases; no universal minimum channel count defines it.
raw EEG signal: the oscillating electrical potential differences detected from the scalp, displayed as a waveform before quantitative processing.
reference electrode: an electrode whose potential is used as the comparison for an active recording electrode; it is distinct from the ground electrode.
sampling rate: the number of discrete signal samples acquired per unit time, usually expressed in samples per second or hertz.
sensorimotor rhythm (SMR): a 12 to 15 Hz rhythm recorded over sensorimotor cortex, enhanced during physical stillness and attenuated by movement; it is defined topographically and behaviorally, so its range overlaps the mu and beta bands.
skill generalization: the transfer of a learned behavior or self-regulation skill from training conditions to new situations and everyday life.
sleep spindle: a waxing-waning 11 to 16 Hz burst lasting approximately 0.5 to 2 seconds, maximal over central regions and characteristic of N2 sleep.
standardized LORETA (sLORETA): a refinement of LORETA that produces images of standardized current density, partitioning the intracerebral volume into 6,239 voxels at 5-mm spatial resolution, with exact localization for test point sources and no localization bias under noise.
surface Laplacian (SL) analysis: a family of mathematical algorithms that provide two-dimensional images of radial current flow from cortical dipoles to the scalp.
swLORETA: a version of sLORETA that adds a singular-value-decomposition-based lead-field weighting, improving localization under realistic noise and for deep sources (Palmero-Soler et al., 2007).
thalamocortical relay (TCR): the circuitry through which thalamic nuclei transmit sensory information to the cortex, gated by the thalamic reticular nucleus; both the sensorimotor and alpha rhythms are expressions of this system.
theta rhythm: a 4 to <8 Hz EEG rhythm associated with drowsiness and sleep transitions and, depending on location and task, memory and cognitive processing.
theta/beta ratio (TBR): EEG theta-band power divided by beta-band power using explicitly stated bands, electrodes, reference, and processing methods; it is not a diagnostic test for ADHD.
z-score training: a neurofeedback approach using standardized deviations from a reference database to guide feedback; thresholds such as ±2 SD are protocol choices, not universal criteria.
References
Ayers, M. E. (1995). EEG neurofeedback to bring individuals out of level two coma [Abstract]. Biofeedback and Self-Regulation, 20(3), 304-305.
Berger, H. (1929). Über das Elektrenkephalogramm des Menschen. Archiv für Psychiatrie und Nervenkrankheiten, 87(1), 527-570.
Berry, R. B., Brooks, R., Gamaldo, C. E., Harding, S. M., Lloyd, R. M., Marcus, C. L., & Vaughn, B. V. (2016). The AASM manual for the scoring of sleep and associated events: Rules, terminology and technical specifications (Version 2.3). American Academy of Sleep Medicine.
Budzynski, T. H. (1977). Tuning in on the twilight zone. Psychology Today, 11, 38-44.
Budzynski, T. H. (1996). Brain brightening: Can neurofeedback improve cognitive process? Biofeedback, 24, 14-17.
Byers, A. P. (1998). The Byers neurotherapy reference library (2nd ed.). Association for Applied Psychophysiology and Biofeedback.
Clemente, C. D., Sterman, M. B., & Wyrwicka, W. (1964). Post-reinforcement EEG synchronization during alimentary behavior. Electroencephalography and Clinical Neurophysiology, 16(4), 355-365. https://doi.org/10.1016/0013-4694(64)90069-0
Cooley, J. W., & Tukey, J. W. (1965). An algorithm for the machine calculation of complex Fourier series. Mathematics of Computation, 19(90), 297-301. https://doi.org/10.1090/S0025-5718-1965-0178586-1
Demos, J. N. (2019). Getting started with EEG neurofeedback (2nd ed.). W. W. Norton.
Dumermuth, G., & Flühler, H. (1967). Some modern aspects in numerical spectrum analysis of multichannel electroencephalographic data. Medical and Biological Engineering, 5, 319-331.
Evans, J. R., Dellinger, M. B., & Russell, H. L. (Eds.). (2020). Neurofeedback: The first fifty years. Academic Press.
Fehmi, L. G., & Robbins, J. (2008). Sweet surrender: Discovering the benefits of synchronous alpha brainwaves. In D. Goleman (Ed.), Measuring the immeasurable: The scientific case for spirituality (pp. 231-242). Sounds True.
Fein, G., Galin, D., Johnstone, J., Yingling, C. D., Marcus, M., & Kiersch, M. E. (1983). EEG power spectra in normal and dyslexic children. I. Reliability during passive conditions. Electroencephalography and Clinical Neurophysiology, 55(4), 399-405. https://doi.org/10.1016/0013-4694(83)90127-x
Graap, K., & Freides, D. (1998). Regarding the database for the Peniston alpha-theta EEG biofeedback protocol. Applied Psychophysiology and Biofeedback, 23(4), 265-272. https://doi.org/10.1023/A:1022265716026
Hammond, D. C. (2005). Neurofeedback to improve physical balance, incontinence, and swallowing. Journal of Neurotherapy, 9(1), 27-36.
Hardt, J. V., & Kamiya, J. (1978). Anxiety change through electroencephalographic alpha feedback seen only in high anxiety subjects. Science, 201(4350), 79-81. https://doi.org/10.1126/science.663641
Howe, R. C., & Sterman, M. B. (1972). Cortical-subcortical EEG correlates of suppressed motor behavior during sleep and waking in the cat. Electroencephalography and Clinical Neurophysiology, 32(6), 681-695. https://doi.org/10.1016/0013-4694(72)90104-6
Howe, R. C., & Sterman, M. B. (1973). Somatosensory system evoked potentials during waking behaviour and sleep in the cat. Electroencephalography and Clinical Neurophysiology, 34(6), 605-618. https://doi.org/10.1016/0013-4694(73)90006-0
John, E. R., Ahn, H., Prichep, L., Trepetin, M., Brown, D., & Kaye, H. (1980). Developmental equations for the electroencephalogram. Science, 210(4475), 1255-1258. https://doi.org/10.1126/science.7434026
Johnstone, J., & Gunkelman, J. (2003). Use of databases in QEEG evaluation. Journal of Neurotherapy, 7(3-4), 31-52. https://doi.org/10.1300/J184v07n03_02
Kaiser, D. A., & Othmer, S. (2000). Effect of neurofeedback on variables of attention in a large multi-center trial. Journal of Neurotherapy, 4(1), 5-15. https://doi.org/10.1300/J184v04n01_02
Kamiya, J. (1968). Conscious control of brain waves. Psychology Today, 1, 56-60.
Kamiya, J. (2011). The first communications about operant conditioning of the EEG. Journal of Neurotherapy, 15(1), 65-73. https://doi.org/10.1080/10874208.2011.545764
Legarda, S. B., McMahon, D., Othmer, S., & Othmer, S. (2011). Clinical neurofeedback: Case studies, proposed mechanism, and implications for pediatric neurology practice. Journal of Child Neurology, 26(8), 1045-1051. https://doi.org/10.1177/0883073811405052
Leong, S. L., Vanneste, S., Lim, J., Smith, M., Manning, P., & De Ridder, D. (2018). A randomised, double-blind, placebo-controlled parallel trial of closed-loop infraslow brain training in food addiction. Scientific Reports, 8, Article 11659. https://doi.org/10.1038/s41598-018-30181-7
Linden, M., Habib, T., & Radojevic, V. (1996). A controlled study of the effects of EEG biofeedback on cognition and behavior of children with attention deficit disorder and learning disabilities. Biofeedback and Self-Regulation, 21(1), 35-49. https://doi.org/10.1007/BF02214148
Lubar, J. F., & Bahler, W. W. (1976). Behavioral management of epileptic seizures following EEG biofeedback training of the sensorimotor rhythm. Biofeedback and Self-Regulation, 1(1), 77-104. https://doi.org/10.1007/BF00998692
Lubar, J. F., & Shouse, M. N. (1976). EEG and behavioral changes in a hyperkinetic child concurrent with training of the sensorimotor rhythm (SMR): A preliminary report. Biofeedback and Self-Regulation, 1(3), 293-306. https://doi.org/10.1007/BF01001170
Lubar, J. F., Shabsin, H. S., Natelson, S. E., Holder, G. S., Whitsett, S. F., Pamplin, W. E., & Krulikowski, D. I. (1981). EEG operant conditioning in intractable epileptics. Archives of Neurology, 38(11), 700-704. https://doi.org/10.1001/archneur.1981.00510110060009
Marzbani, H., Marateb, H. R., & Mansourian, M. (2016). Neurofeedback: A comprehensive review on system design, methodology and clinical applications. Basic and Clinical Neuroscience, 7(2), 143-158.
Monastra, V. J., Lubar, J. F., & Linden, M. (2001). The development of a quantitative electroencephalographic scanning process for attention deficit-hyperactivity disorder: Reliability and validity studies. Neuropsychology, 15(1), 136-144. https://doi.org/10.1037/0894-4105.15.1.136
Monastra, V. J., Lubar, J. F., Linden, M., VanDeusen, P., Green, G., Wing, W., Phillips, A., & Fenger, T. N. (1999). Assessing attention deficit hyperactivity disorder via quantitative electroencephalography: An initial validation study. Neuropsychology, 13(3), 424-433. https://doi.org/10.1037/0894-4105.13.3.424
Monderer, R. S., Harrison, D. M., & Haut, S. R. (2002). Neurofeedback and epilepsy. Epilepsy & Behavior, 3(3), 214-218. https://doi.org/10.1016/S1525-5050(02)00001-X
National Cancer Institute. (n.d.). Protocol. In NCI dictionary of cancer terms. National Institutes of Health. Retrieved July 31, 2026, from https://www.cancer.gov/publications/dictionaries/cancer-terms/def/protocol
Nuwer, M. R., & Coutin-Churchman, P. (2014). Brain mapping and quantitative electroencephalogram. In Encyclopedia of the Neurological Sciences (2nd ed.). Elsevier.
Oken, B. S., & Chiappa, K. H. (1988). Short-term variability in EEG frequency analysis. Electroencephalography and Clinical Neurophysiology, 69, 191-198. https://doi.org/10.1016/0013-4694(88)90128-9
Othmer, S., Othmer, S. F., & Kaiser, D. A. (1999). EEG biofeedback: An emerging model for its global efficacy. In J. R. Evans & A. Abarbanel (Eds.), Introduction to quantitative EEG and neurofeedback. Academic Press.
Palmero-Soler, E., Dolan, K., Hadamschek, V., & Tass, P. A. (2007). swLORETA: A novel approach to robust source localization and synchronization tomography. Physics in Medicine and Biology, 52(7), 1783-1800. https://doi.org/10.1088/0031-9155/52/7/002
Pascual-Marqui, R. D. (2002). Standardized low-resolution brain electromagnetic tomography (sLORETA): Technical details. Methods and Findings in Experimental and Clinical Pharmacology, 24(Suppl. D), 5-12.
Pascual-Marqui, R. D., Michel, C. M., & Lehmann, D. (1994). Low resolution electromagnetic tomography: A new method for localizing electrical activity in the brain. International Journal of Psychophysiology, 18(1), 49-65. https://doi.org/10.1016/0167-8760(84)90014-X
Peniston, E. G. (1998). Comments by Peniston. Applied Psychophysiology and Biofeedback, 23(4), 273-275. https://doi.org/10.1023/A:1022217900096
Peniston, E. G., & Kulkosky, P. J. (1989). Alpha-theta brain wave training and beta-endorphin levels in alcoholics. Alcoholism, Clinical and Experimental Research, 13, 271-279. https://doi.org/10.1111/J.1530-0277.1989.TB00325.X
Peniston, E. G., & Kulkosky, P. J. (1990). Alcoholic personality and alpha-theta brain wave training. Medical Psychotherapy, 3, 37-55.
Putman, J. A., Othmer, S. F., Othmer, S., & Pollock, V. E. (2005). TOVA results following inter-hemispheric bipolar EEG training. Journal of Neurotherapy: Investigations in Neuromodulation, Neurofeedback and Applied Neuroscience, 9(1), 37-52. https://doi.org/10.1300/J184v09n01_04
Ribas, V. R., Ribas, R., & Martins, H. (2016). The learning curve in neurofeedback of Peter Van Deusen: A review article. Dementia & Neuropsychologia, 10(2), 98-103. https://doi.org/10.1590/S1980-5764-2016DN1002005
Rogala, J., Jurewicz, K., Paluch, K., Kublik, E., Cetnarski, R., & Wróbel, A. (2016). The do's and don'ts of neurofeedback training: A review of the controlled studies using healthy adults. Frontiers in Human Neuroscience, 10, Article 301. https://doi.org/10.3389/fnhum.2016.00301
Roth, S. R., Sterman, M. B., & Clemente, C. D. (1967). Comparison of EEG correlates of reinforcement, internal inhibition and sleep. Electroencephalography and Clinical Neurophysiology, 23(6), 509-520. https://doi.org/10.1016/0013-4694(67)90017-X
Sasu, R., & Othmer, S. (2020). Neurofeedback in application to the ADHD spectrum. In H. W. Kirk (Ed.), Restoring the brain: Neurofeedback as an integrative approach to health (2nd ed., pp. 196-222). Routledge.
Shouse, M. N., & Lubar, J. F. (1979). Operant conditioning of EEG rhythms and ritalin in the treatment of hyperkinesis. Biofeedback and Self-Regulation, 4(4), 299-312. https://doi.org/10.1007/BF00998960
Sittenfeld, P., Budzynski, T., & Stoyva, J. (1976). Differential shaping of EEG theta rhythms. Biofeedback and Self-Regulation, 1(1), 31-46. https://doi.org/10.1007/BF00998689
Smith, M. L., Collura, T. F., Ferrera, J., & de Vries, J. (2014). Infra-slow fluctuation training in clinical practice: A technical history. NeuroRegulation, 1(2), 187-207. https://doi.org/10.15540/nr.1.2.187
Smith, M. L., Leiderman, L., & de Vries, J. (2017). Infra-slow fluctuation (ISF) for autism spectrum disorders. In T. F. Collura & J. A. Frederick (Eds.), Handbook of clinical QEEG and neurotherapy. Routledge Taylor and Francis Group.
Snyder, S. M., Quintana, H., Sexson, S. B., Knott, P. J., Haque, A. F. M., & Reynolds, D. A. (2008). Blinded, multi-center validation of EEG and rating scales in identifying ADHD within a clinical sample. Psychiatry Research, 159(3), 346-358. https://doi.org/10.1016/j.psychres.2007.05.006
Sterman, M. B. (1976). Effects of brain surgery and EEG operant conditioning on seizure latency following monomethylhydrazine intoxication in the cat. Experimental Neurology, 50(3), 757-765. https://doi.org/10.1016/0014-4886(76)90041-8
Sterman, M. B. (1996). Physiological origins and functional correlates of EEG rhythmic activities: Implications for self-regulation. Biofeedback and Self-Regulation, 21(1), 3-33. https://doi.org/10.1007/BF02214147
Sterman, M. B., & Friar, L. (1972). Suppression of seizures in an epileptic following sensorimotor EEG feedback training. Electroencephalography and Clinical Neurophysiology, 33(1), 89-95. https://doi.org/10.1016/0013-4694(72)90028-4
Sterman, M. B., & Wyrwicka, W. (1967). EEG correlates of sleep: Evidence for separate forebrain substrates. Brain Research, 6(1), 143-163. https://doi.org/10.1016/0006-8993(67)90186-2
Sterman, M. B., LoPresti, R. W., & Fairchild, M. D. (1969). Electroencephalographic and behavioral studies of monomethylhydrazine toxicity in the cat. AMRL-TR-69-3, Aerospace Medical Research Laboratory, Air Force Systems Command, Wright-Patterson Air Force Base, Ohio.
Sterman, M. B., LoPresti, R. W., & Fairchild, M. D. (2010). Electroencephalographic and behavioral studies of monomethyl hydrazine toxicity in the cat. Journal of Neurotherapy, 14(4), 293-300. https://doi.org/10.1080/10874208.2010.523367
Sterman, M. B., Macdonald, L. R., & Stone, R. K. (1974). Biofeedback training of the sensorimotor electroencephalogram rhythm in man: Effects on epilepsy. Epilepsia, 15(3), 395-416. https://doi.org/10.1111/j.1528-1157.1974.tb04016.x
Sterman, M. B., Wyrwicka, W., & Roth, S. R. (1969). Electrophysiological correlates and neural substrates of alimentary behavior in the cat. Annals of the New York Academy of Sciences, 157(2), 723-739. https://doi.org/10.1111/j.1749-6632.1969.tb12916.x
Strehl, U. (2014). What learning theories can teach us in designing neurofeedback treatments. Frontiers in Human Neuroscience, 8, Article 894.
Swingle, P. G. (2014, Spring). Clinical versus normative databases: Case studies of Clinical Q assessments. NeuroConnections.
Thatcher, R. W. (1998). Normative EEG databases and EEG biofeedback. Journal of Neurotherapy, 2(4), 8-39. https://doi.org/10.1300/J184v02n04_02
Thatcher, R. W., Lubar, J. F., & Koberda, J. L. (2019). Z-Score EEG biofeedback: Past, present, and future. Biofeedback, 47(4), 89-103. https://doi.org/10.5298/1081-5937-47.4.04
Wyrwicka, W., & Sterman, M. B. (1968). Instrumental conditioning of sensorimotor cortex EEG spindles in the waking cat. Physiology & Behavior, 3(5), 703-707. https://doi.org/10.1016/0031-9384(68)90139-X
Return to Top