EEG Assessment
What You Will Learn in This Chapter
When you first look at a page of raw EEG, the display can seem like an impenetrable tangle of lines. This unit is designed to turn that tangle into information you can act on. You will learn how practitioners identify common EEG patterns, how normative databases turn raw microvolts into z-scores, and how each classic frequency band behaves at different locations and in different states.
We will work through standardized EEG assessment, an overview of qEEG, the naming of the EEG components, and then each frequency band in turn, including alpha, beta, delta, and theta. Along the way you will meet the patterns that live inside the beta range but are not beta, such as mu and the sensorimotor rhythm. This unit is an overview rather than a comprehensive treatment of electroencephalography, and guidance for further study is provided.
BCIA Blueprint Coverage: This unit addresses VI. Patient/Client Assessment, B. EEG Assessment, including Standardized EEG Assessments, Overview of qEEG, and Recognizing Common Normal and Abnormal Patterns in the EEG.
Learning Objectives
After completing this section, you will be able to:
Describe the purpose of a neurofeedback-focused EEG assessment and explain how it differs in emphasis from a neurological EEG reading.
Explain how a normative database is constructed and how a client's raw value becomes a z-score.
Identify the classic EEG frequency bands and describe the behavioral and physiological correlates associated with each.
Evaluate the alpha response, alpha blocking, and the peak alpha frequency against age-appropriate expectations.
Distinguish mu rhythm and the sensorimotor rhythm from ordinary beta activity, and recognize artifacts that mimic delta and slow cortical potentials.
This section covers the identification of common EEG patterns. When first looking at an EEG recording, many beginners find the visual display confusing and challenging to understand, much less to gather any useful information. This section will provide a general overview of EEG activity, identify the basic EEG rhythms, and discuss behavioral characteristics associated with each type of activity. We will also discuss some of the common abnormal patterns and how to identify them. This will not provide a comprehensive picture of the EEG, and for that, further study is warranted, and guidance for such study will be provided.
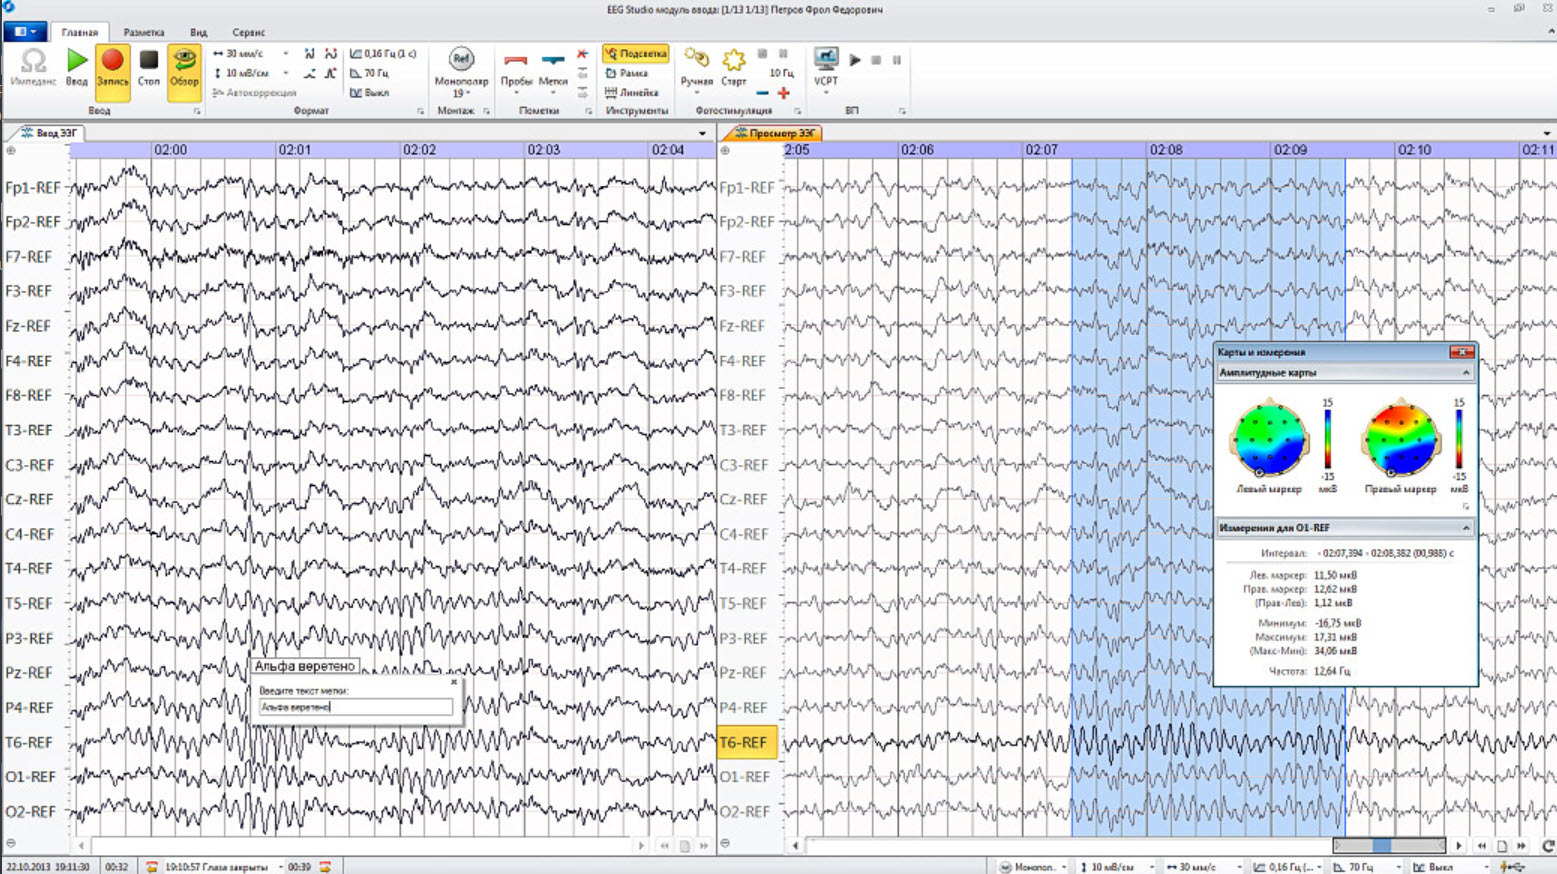
Neurofeedback Tutor describes and demonstrates an example of a 2-channel assessment that uses a series of three pairs of 10-20 sites, with specific tasks for each pair. This should not be confused with an EEG assessment that uses two channels at only two assessment sites, which likely would have limited usefulness. Any particular clinical complaint may be associated with deviation from the expected range at different locations depending on the individual.
Because the identification of common artifacts is covered in depth in the Artifacts section, this section will focus on true EEG activity. However, some of the similarities with certain artifacts will be addressed.

Standardized EEG Assessments
Neurofeedback is a process of identifying and training brain activity that produces the scalp electrical activity recorded by the EEG. The practitioner must therefore identify common EEG patterns, both normal and abnormal, to facilitate the assessment and training process.
This task has several components and begins with access to an EEG atlas. An EEG atlas is a compilation of raw tracings from EEG recordings, showing normal EEG patterns for various age groups and examples of typical abnormal patterns such as epileptiform activity. Examples of normal variants may appear abnormal but have certain characteristics that distinguish them from truly abnormal patterns.
There are several recommended EEG atlases, and they are listed at the end of this section. Many atlases are available, some focusing on childhood EEG, some on adult EEG, and some on the EEG characteristics of specific disorders. Those recommended in this section represent a general overview and include some components of all of the above categories.
The second step is to define normal or typical values for the EEG features so the clinician can use that information to identify training goals and help explain or elucidate causal factors related to client symptoms.
The third step is to proceed with training the client, using the same or similar assessment techniques to monitor progress and to guide any changes that may be necessary as the training progresses. Keep in mind that training decisions are often informed by identifying excesses or deficiencies at a particular scalp location within a specific EEG frequency band. This does not mean that the assessment and decision-making process ends with this determination. Ongoing recognition of EEG changes, client self-reports, reports from others, and the clinician's observations of the client will help determine any changes to the training approach.
It is important to note that training decisions must be flexible and fluid. Early in the history of qEEG guided training, some clinicians made the mistake of training to the qEEG, sometimes ignoring client reports of worsening of existing symptoms and the appearance of new symptoms. This is a limited and short-sighted approach to training, and the clinician must be willing to shift training if needed to obtain the best outcome. Neurofeedback is as much an art as it is a science.
How much weight should you give to the qEEG assessment, to other assessment tools, and to the client's self-report? How often is it appropriate to change training protocols? Must the clinician continue with a prescribed training even if the client reports distress? These are questions that are important to answer. This is one of the reasons that certification programs require new practitioners to participate in a mentoring relationship with an experienced practitioner, to help them provide the most effective, client-centered, dynamic training approach possible.
This brings us to a discussion of the purpose of the EEG assessment. We previously established that neurologists and electroencephalographers use the EEG to identify gross abnormalities, evidence of seizure activity, or the location of lesions in the brain. Those interested in neurofeedback-focused assessments are often interested in more subtle differences in the EEG, leading to useful guidance for training choices.
This is why there may be differences in emphasis between assessments done by a neurologist or research electroencephalographer compared to those done by neurofeedback clinicians. The focus of this section will be to help the neurofeedback clinician utilize the EEG for assessment that guides and informs the training process, including assessment of ongoing progress toward training goals.
Standardized EEG assessment begins with an atlas of normal and abnormal tracings, proceeds to defining typical values for the features you intend to train, and continues with reassessment throughout training. Neurologists read the EEG for gross pathology, while neurofeedback clinicians read it for subtler deviations that suggest training targets. Training decisions must stay flexible, because a client who reports worsening symptoms is telling you something the database cannot.
Overview of qEEG
Normative Databases
EEG normative databases quantify EEG variables such as amplitude, power, coherence, and phase using EEG samples obtained from healthy normal subjects. These variables are calculated for typical EEG bands or single-hertz bins and all electrode sites and their connections. Values for Brodmann areas, anatomical structures, regions of interest, and their various connections may also be included.
The EEG of an individual client can then be compared to the normative database to see if the client's EEG deviates to any significant degree from normal. Those EEG variables that deviate from normal may then become targets for neurofeedback training if there is reason to think they are related to the client's concerns or symptoms.
Normative EEG databases are constructed by selecting data from healthy normal subjects from several age ranges. Subjects are selected for age ranges across the life span because the normal value of EEG variables changes during maturation. For example, the amplitude of the eyes-closed delta range decreases as a child ages. Subjects are also selected to exclude conditions that might affect the EEG, such as a diagnosed mental health condition, addiction, or neurological disorder.
Databases usually include samples from eyes-open and eyes-closed conditions because the normal EEG differs under such conditions. Some databases may also include data acquired during cognitive tasks, for example, related to attention, memory, or problem-solving.
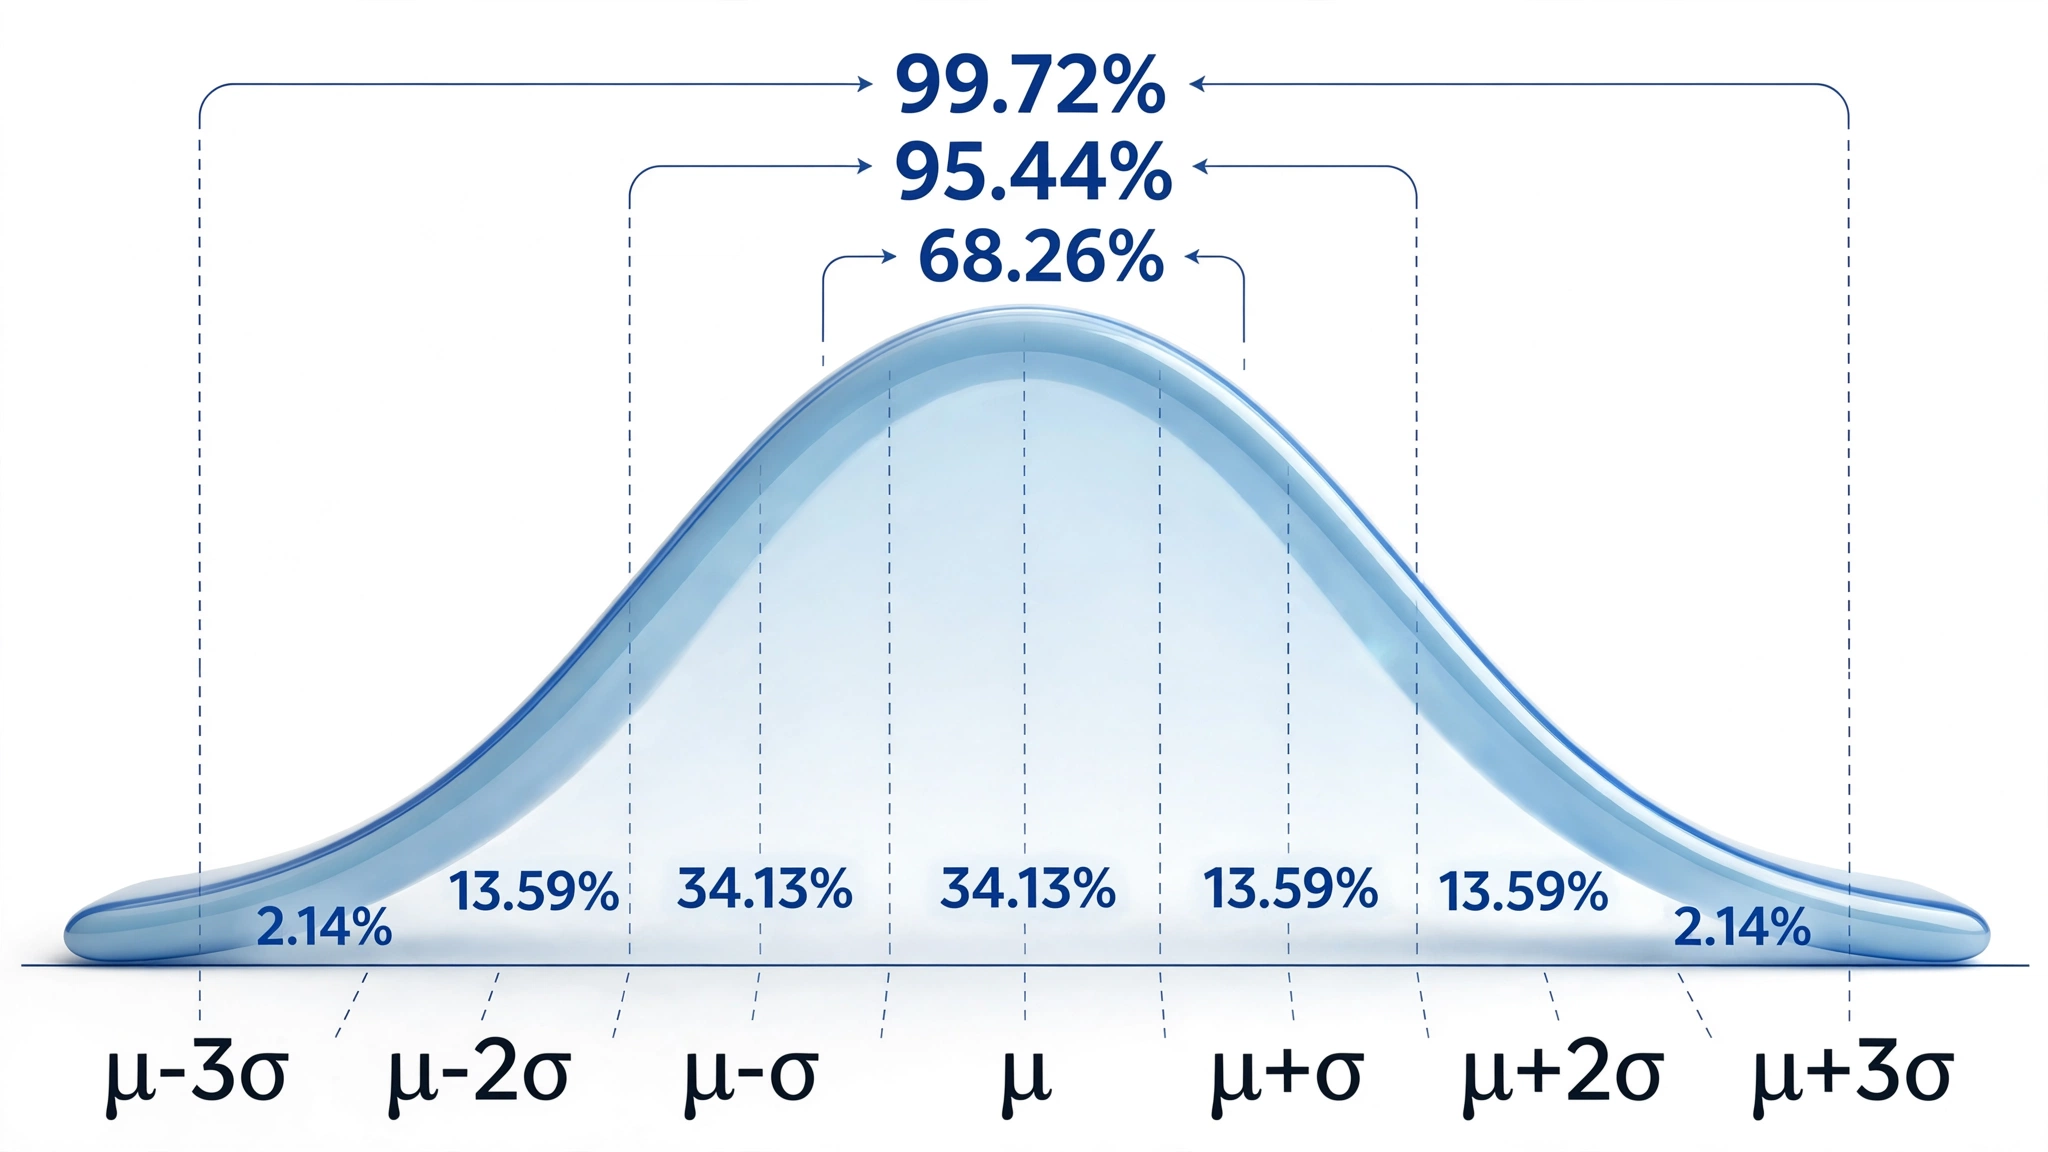
The values of the EEG variables for the database's subjects are usually transformed into z-scores. Where the underlying distribution is approximately normal, and database developers generally take steps to ensure that it is, those z-scores fall in a bell-like Gaussian curve. In this normal curve, most values cluster around the average. Values that are greater than or less than average occur less frequently the more they diverge from the average value. Z-scores are calculated by subtracting the average score of the healthy normal sample from an individual's raw score and then dividing that difference by the standard deviation of the sample.
The standard deviation is simply a measure of how variable the data are. A z-score is expressed in standard deviation units of how far a score deviates from the average. When the raw data are transformed into z-scores, a z-score of 0 is the average. Below-average raw scores have a negative z-score, while above-average raw scores have a positive z-score. Approximately 68% of a group's raw scores will have z-scores between +1 and -1 standard deviations from 0, and about 95% of the group will have z-scores between +2 and -2 standard deviations.
When a practitioner collects EEG data from an individual client and analyzes their data with a normative database, they calculate the client's average value of the variable of interest from artifact-free data. For example, after removing artifacts, the practitioner calculates the client's average number of microvolts in the alpha range with eyes closed.
The number for the client is then compared to the average number of microvolts that the database's healthy normal subjects of a similar age have with their eyes closed. That difference is divided by the standard deviation of eyes-closed microvolts of alpha for similar-aged normal subjects to produce a z-score.
If the resulting z-score for the client is between +2 and -2, the practitioner may consider the client's eyes-closed alpha activity to be within the normal range. If the client's z-score is less than -2, it is significantly deficient or lower than normal. If the client's z-score is more than +2, it is excessive or significantly greater than normal. The range of z-scores that encompasses normal is somewhat arbitrary. For instance, some practitioners use a plus or minus 1.5 SD range, and others use a plus or minus 2 SD range.
Several companies offer normative databases for clinical and research applications. These include Applied NeuroScience, Human Brain Institute, and qEEG Pro, among others.
A normative database converts a client's raw EEG values into z-scores by comparing them with age-matched healthy samples. A z-score of 0 is average, and roughly 95% of a normal distribution falls within plus or minus 2 SD. The cutoff that counts as abnormal is a convention rather than a fact of nature, so state which cutoff you are using when you report findings.
Naming the EEG Components
Historically, the naming of the EEG frequencies followed a somewhat chaotic path (Schomer & Lopes da Silva, 2017), beginning with Berger's (1929) designations of alpha as the first rhythm and beta as everything faster than alpha.
Jasper and Andrews (1938) used the term gamma rhythm for frequencies above 30 or 35 Hz. The term gamma has become somewhat fluid in its definition, depending on the person defining it. Crick (1994) defined gamma as a frequency of 40 Hz, generally given as 38-42 Hz or 36-44 Hz with a center frequency of 40 Hz, as did Sheer and colleagues (1992). Others, such as Davidson and colleagues (2004), used the frequency band 25-42 Hz to represent gamma, and Swingle also used the term to denote faster beta activity above 25 Hz.
Amzica and Lopes da Silva (2017) also used the term gamma to define a frequency of 30-50 Hz. St. Louis and Frey (2016) stated that frequencies from 25-70 Hz are called low gamma, while those above 70 Hz represent high gamma. These sometimes conflicting definitions can lead to confusion as to the precise meaning of this term.
Walter (1936) chose the term delta to represent all the frequencies below the alpha band, and Walter and Dovey (1944) later added the term theta for the portion in the 4-7.5 Hz range. Currently, these terms remain fairly well defined, with delta representing 1-4 Hz and theta representing 4-7 or 4-8 Hz.
Following the naming of these five frequency bands, many other electroencephalographers have sought to name EEG patterns, sometimes choosing names for patterns that already have descriptive designations. Examples include the pattern known as positive occipital sharp transients of sleep, with the acronym POSTS, also being called rho waves, and posterior slow rhythms of 3-4 Hz being called the pi rhythm. These two terms and several others have fallen out of favor. Schomer and Lopes da Silva (2017) suggest that the use of Greek words to identify EEG activity should be confined to the classic bands of alpha, beta, gamma, delta, and theta. As we will see in our alpha and beta frequency discussions, the mu rhythm is one exception to this restriction.
A lack of precision in terminology makes numerical designations a better choice for defining EEG observations. This ensures that your meaning is clear when speaking of an EEG frequency band. Adding the location and the client's state, whether eyes open, eyes closed, or asleep, provides the necessary detail for communicating your findings to others. Describing eyes-closed 8-12 Hz activity, with a dominant frequency of 10 Hz and amplitude between 20-30 uV, in specific occipital and parietal sensor locations, is therefore far more useful for assessment purposes than a general finding of posterior alpha.
Before proceeding further with the discussions of individual frequencies, it is important to note that brain activity in general, and more specifically the scalp EEG patterns that reflect that brain activity, are organized and regulated by multiple cortical, subcortical, and general network mechanisms. One of the most important mechanisms is cross-frequency synchronization (CFS), which describes waves of one type of frequency, such as beta or gamma, occurring synchronously with the wave patterns of slower frequencies such as delta, theta, or alpha. These are often described as nested rhythms. Siebenhühner and colleagues (2016) propose that cross-frequency synchronization integrates processing among synchronized neuronal networks from theta to gamma frequencies to link sensory and attentional functions.
When considering the activity of individual EEG frequencies, it is important to recognize how they interact, how they are interdependent, and how they reflect the activity of the broader neuronal networks in the brain, central nervous system, and the organism as a whole. The EEG does not cause behavior. Instead, it reflects behaviors that have already happened or are currently occurring and are the result of a highly complex dance of interactions.
The Greek letter names for EEG bands are historical accidents, and their boundaries still vary from author to author, especially for gamma. Numerical descriptions that name the frequency range, the location, and the client's state communicate far more reliably than band labels alone. Individual bands are also not independent, because cross-frequency synchronization nests faster rhythms inside slower ones.
8-12 Hz EEG: The Alpha Rhythm
Because alpha was the first EEG pattern to be identified historically, we will begin by defining the alpha rhythm. The International Federation of Societies for Electroencephalography and Clinical Neurophysiology (IFSECN) offered the following definition (Chatrian et al., 1974):
Rhythm at 8 to 13 Hz inclusive occurring during wakefulness over the posterior regions of the head, generally with higher voltage over the occipital areas. Amplitude is variable but is mostly below 50 μV in the adult. Best seen with eyes closed and under conditions of physical relaxation and relative mental inactivity. Blocked or attenuated by attention, especially visual and mental effort.
Such a rhythm must meet all the above criteria to qualify for the designation. This eliminates patterns such as mu rhythm in the Rolandic areas, which often has the same frequency but different morphology, meaning its characteristic wave shape and pattern, and different behavioral correlations.
Source of 8-12 Hz Alpha Activity
Activity in the 8-12 Hz frequency range appears associated with reduced sensory and cognitive activity. Why is this so? What mechanism is responsible for this rhythmic activity?
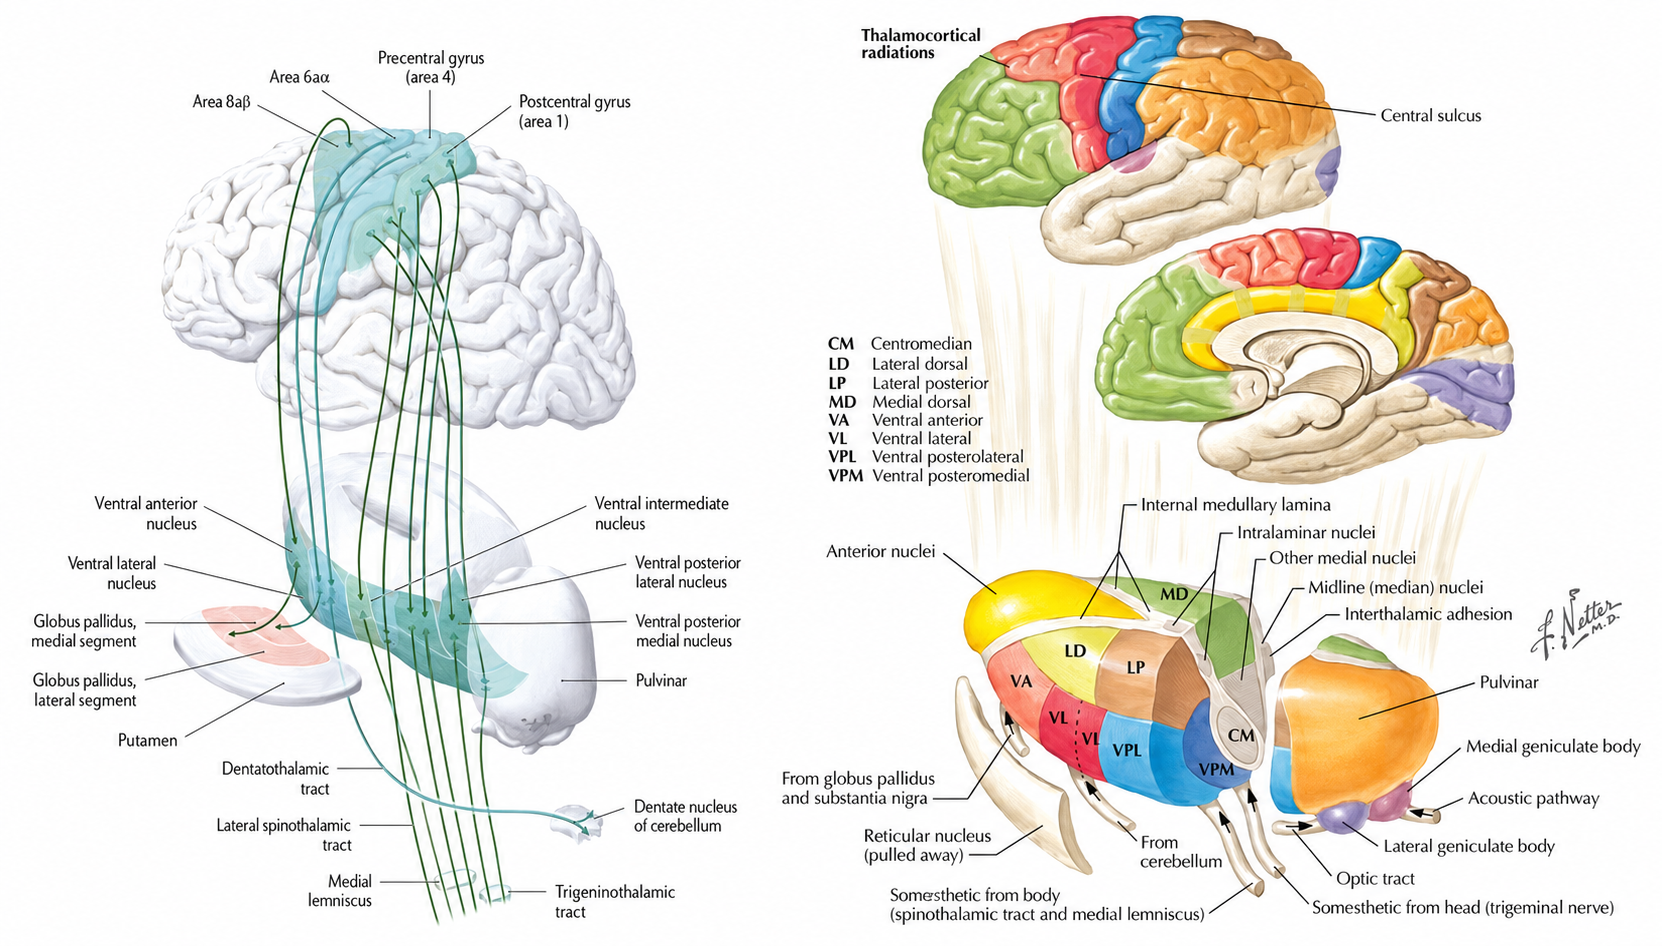
One of the main communication pathways between the external world, the senses that perceive and transmit this information, and the cortical neurons that receive it is the thalamic-cortical relay system, often designated the TCR system.
The thalamus receives incoming sensory input, and it is a paired structure in the brain's center, as shown in the image below. The individual nuclei of the thalamus transmit that sensory information to appropriate areas of the cortex. The occipital and parietal areas of the cortex are the primary visual processing areas, just as the temporal areas process most of the auditory information, while central Rolandic areas process tactile and other signals from the skin and muscles. Current findings indicate that brain activity is associated with coordination within and between cortical networks and influences from subcortical structures as well as local and TCR influences. Still, the TCR system is a primary pathway for determining which areas of the cortex receive each type of sensory input.
When the eyes close, the neurons responsible for processing incoming visual information no longer have work to do, and so they respond to another signal coming through the TCR system. This is a rhythmic signal mediated by a membrane of inhibitory GABAergic neurons that surround most of the thalamus and provide inhibitory regulation of the signals traveling to the cortex. This structure is called the reticular nucleus of the thalamus (TRN) or the nucleus reticularis of the thalamus (NRT). The function of this system is much too complex for this section, but a good treatment is available in Crabtree (2018), and an examination of the role of the TCR and TRN systems in consciousness is found in Min (2010).
The rhythmic signal from the TCR and NRT interaction produces a 10-Hz input, within the 8-12 Hz range, to the visual processing neurons when visual sensory input is withdrawn as the eyes close. Those neurons then fire synchronously at that frequency in response to this input. The voltage of a specific EEG frequency, measured at the scalp surface, rises with the number of cortical neurons generating postsynaptic potentials in synchrony at that frequency. It also depends on how similarly those neurons are oriented and on how far the source lies from the recording electrode (Nunez & Srinivasan, 2006). Therefore, when the eyes are closed and the signal from the TCR system changes from sensory input to a rhythmic 10-Hz input, visual neurons respond to that input and the voltage of alpha, most specifically 10-Hz activity in adults, increases.
The image below shows a spectral display of an eyes-closed EEG.
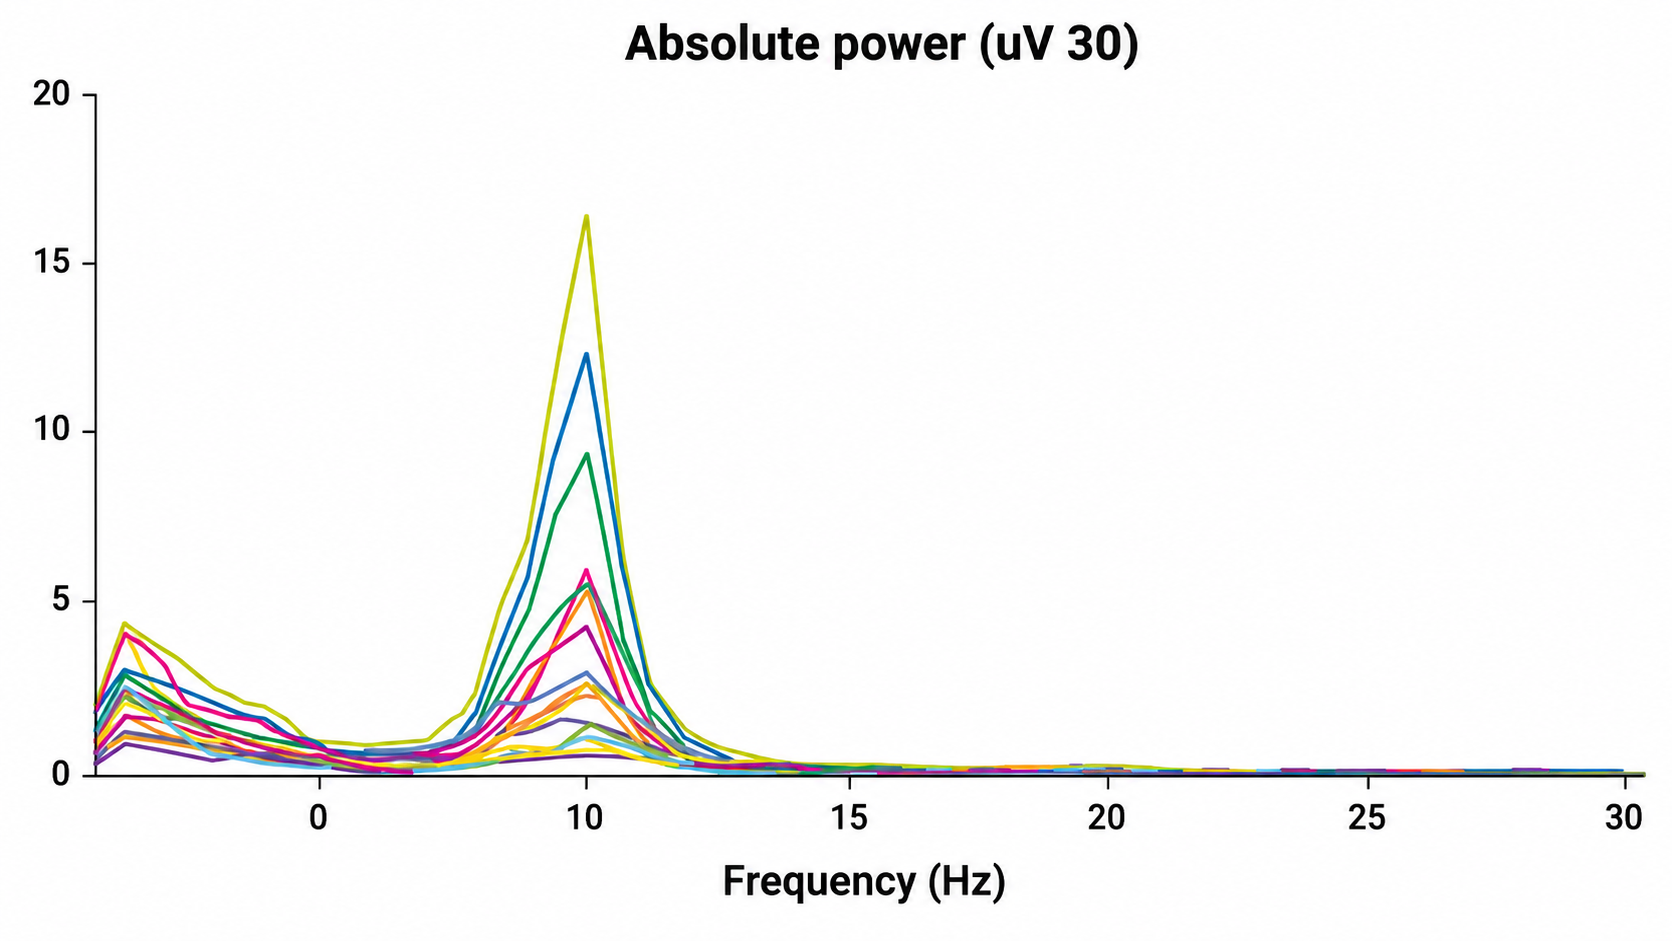
This display captures the brain's rhythmic activity sorted by speed rather than by time. Where a raw recording gives you wiggling lines marching left to right through seconds, this view rearranges that same activity along a frequency axis, asking how much power the brain devotes to each rate of oscillation. The horizontal axis counts cycles per second across the full sweep from the slowest rhythms out to thirty hertz, and the vertical axis measures absolute power in microvolts squared (µV²). Every colored trace is one electrode, so the whole scalp is plotted at once on a single set of axes.
The story leaps off the page as a single dominant peak. Nearly every channel climbs to a sharp summit right around ten hertz, and that summit is the alpha rhythm, the signature oscillation of a relaxed brain at rest. Beyond it the curves collapse toward the baseline and stay there, so the faster beta and gamma ranges contribute only a whisper of power. At the far left the traces lift again into a smaller shoulder, the slow delta and theta activity that always occupies the low end of the spectrum.
What a beginner most needs to internalize is that the height of a curve reports power, not importance, and that the shape of the whole spectrum is the finding. A single dominant alpha peak rising cleanly out of a low, flat background is precisely what a healthy resting spectrum looks like, and recognizing that silhouette is more valuable than reading any one number off the axis. Notice too that the peak is narrow. A rhythm concentrated into a tight band around ten hertz is well organized, oscillating at a consistent rate, and that narrowness is itself a mark of a coherent generator.
Reading the family of curves together is the second skill this plot teaches. Because each color is a separate electrode, the vertical spread at the alpha peak tells you how much the rhythm varies across the scalp, with the tallest traces marking sites where alpha is most powerful and the lowest traces marking sites where it barely registers. That fan of heights, all peaking at the same frequency but reaching different amplitudes, is a topographic story hidden inside a frequency plot: one shared rhythm expressed with different vigor at different places on the head.
Put those readings together and the display resolves into a spectral portrait of a resting brain, alpha dominant and tightly tuned near ten hertz, slow activity present but modest, fast activity quiet, and the same rhythm sounding across every electrode at its own local volume. This is the frequency-domain view that turns a page of squiggles into a single, interpretable shape.
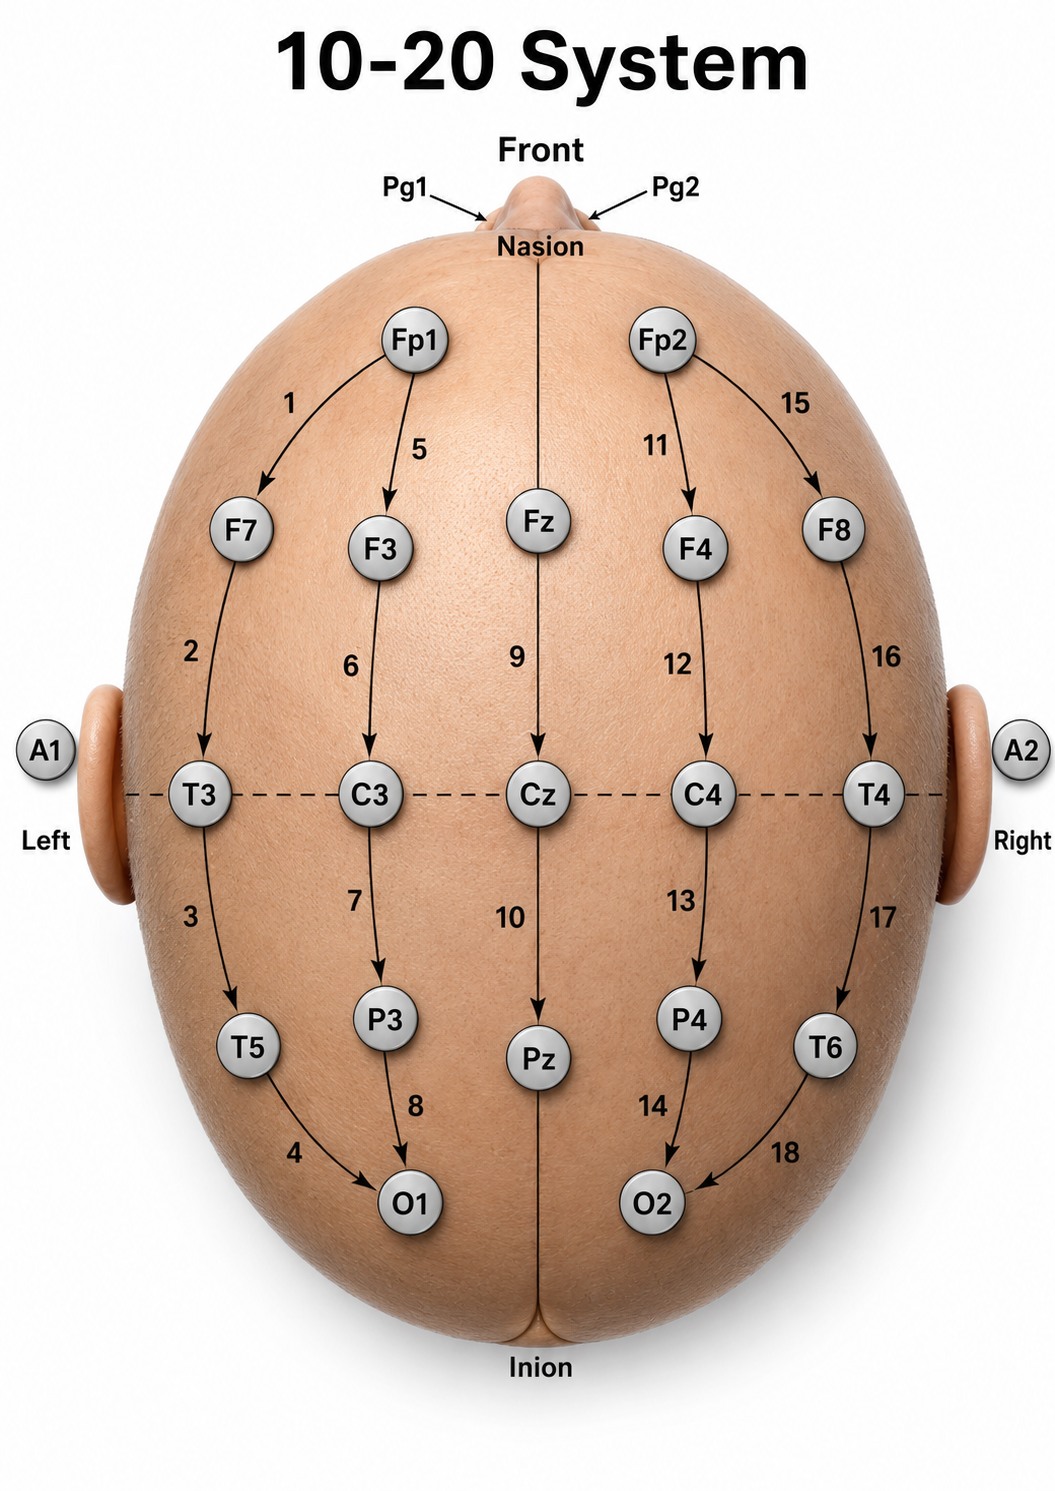
This longitudinal bipolar montage is displayed below.
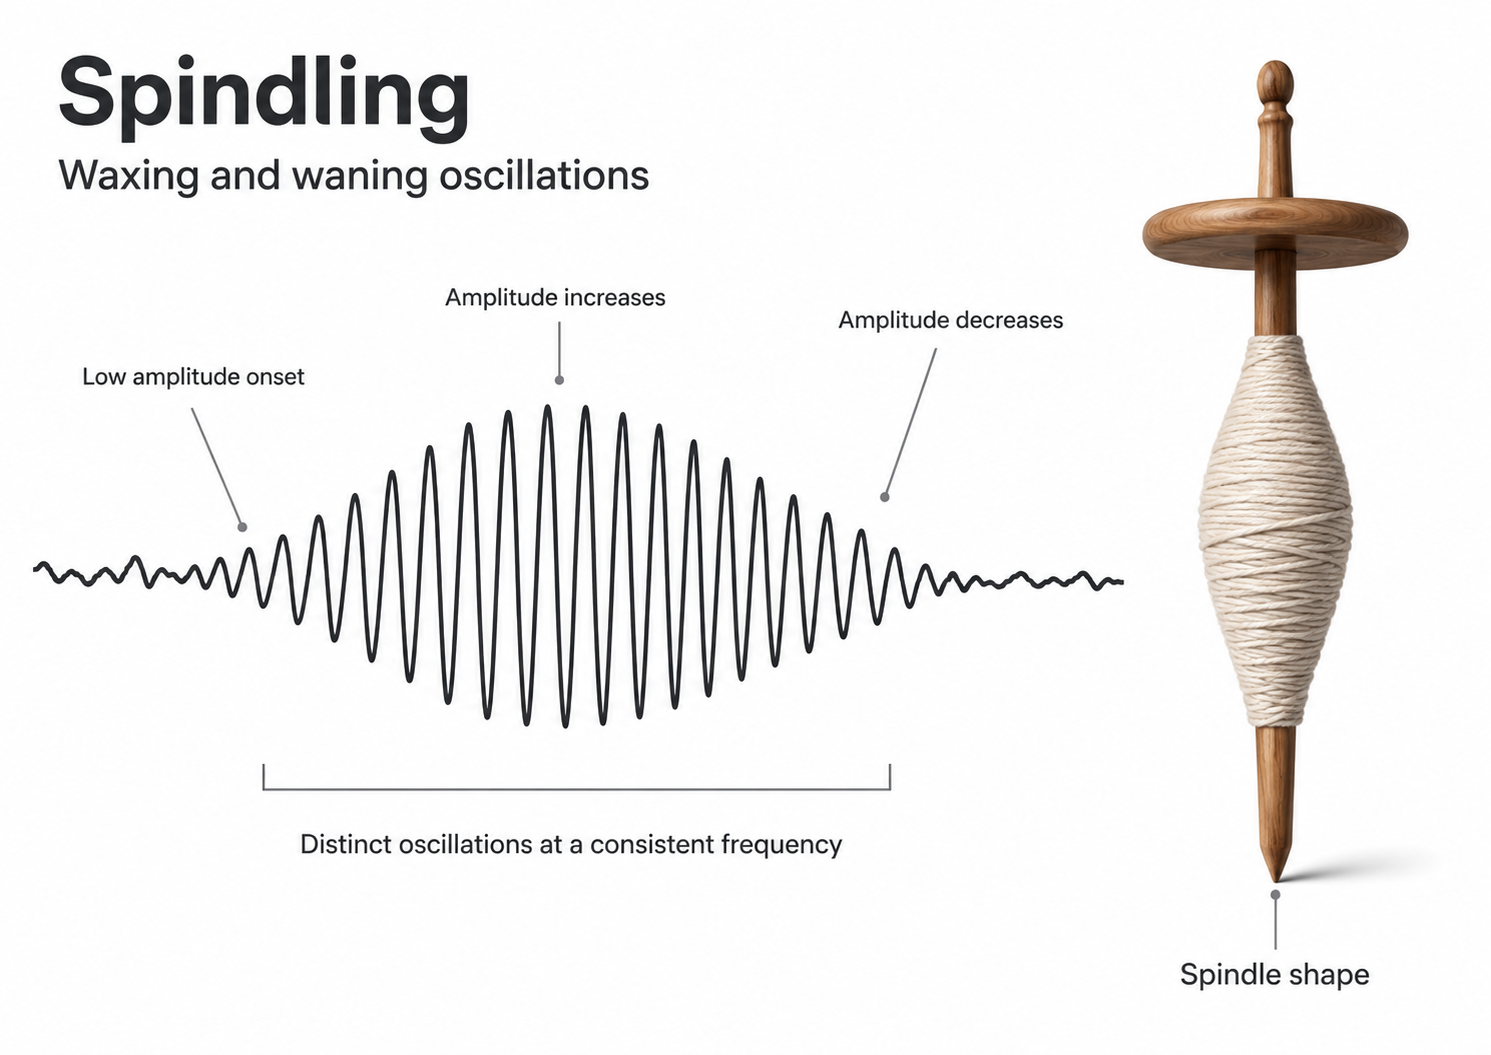
Observe that the rhythmic activity is well-defined and has the typical bursting or spindling pattern of the alpha rhythm, resulting from the input of the TCR and NRT systems. Spindling consists of a series of distinct oscillations of a particular frequency that begin with relatively low amplitude, increase in amplitude, and then decrease in amplitude. This gives the appearance of a spindle such as one used in spinning, with fiber wound around it.
The waves are quite sinusoidal, waving up and down in a smooth rhythm similar to a sine curve, and continue throughout the recording with minimal disruption. The voltage indicator shows that the maximum voltage at the moment of the line placement was from about 20 to 30 μV at the peak of the waveform in this montage.
You can determine a wave's frequency by either counting the number of peaks in a one-second segment or counting the number of times the wave crossed the zero line and dividing by 2. Either method gives an 8-9 Hz value when multiple one-second epochs are counted. This is somewhat slow for a 15-year-old, although the voltage appears to be within normal limits. When compared to a normative database, we can see that it is indeed a slow peak alpha compared to other 15-year-old males, as indicated by the chart below from the NeuroGuide database.
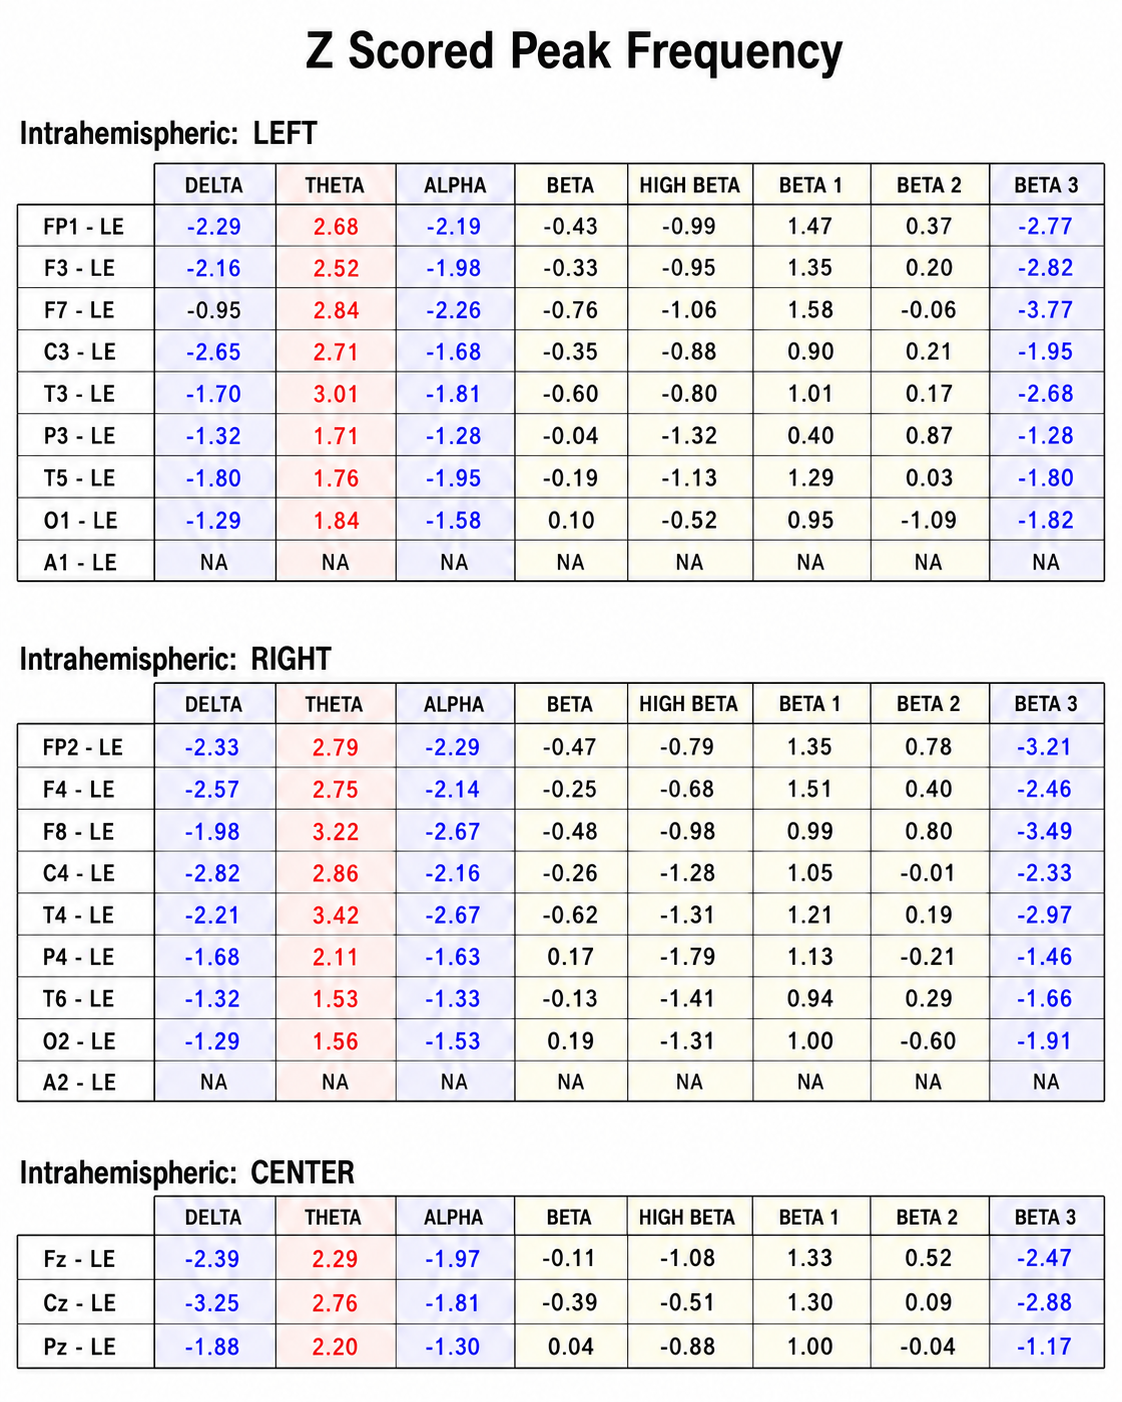
The same data processed by the iSynchBrain database show similar findings for O1 and O2 below.
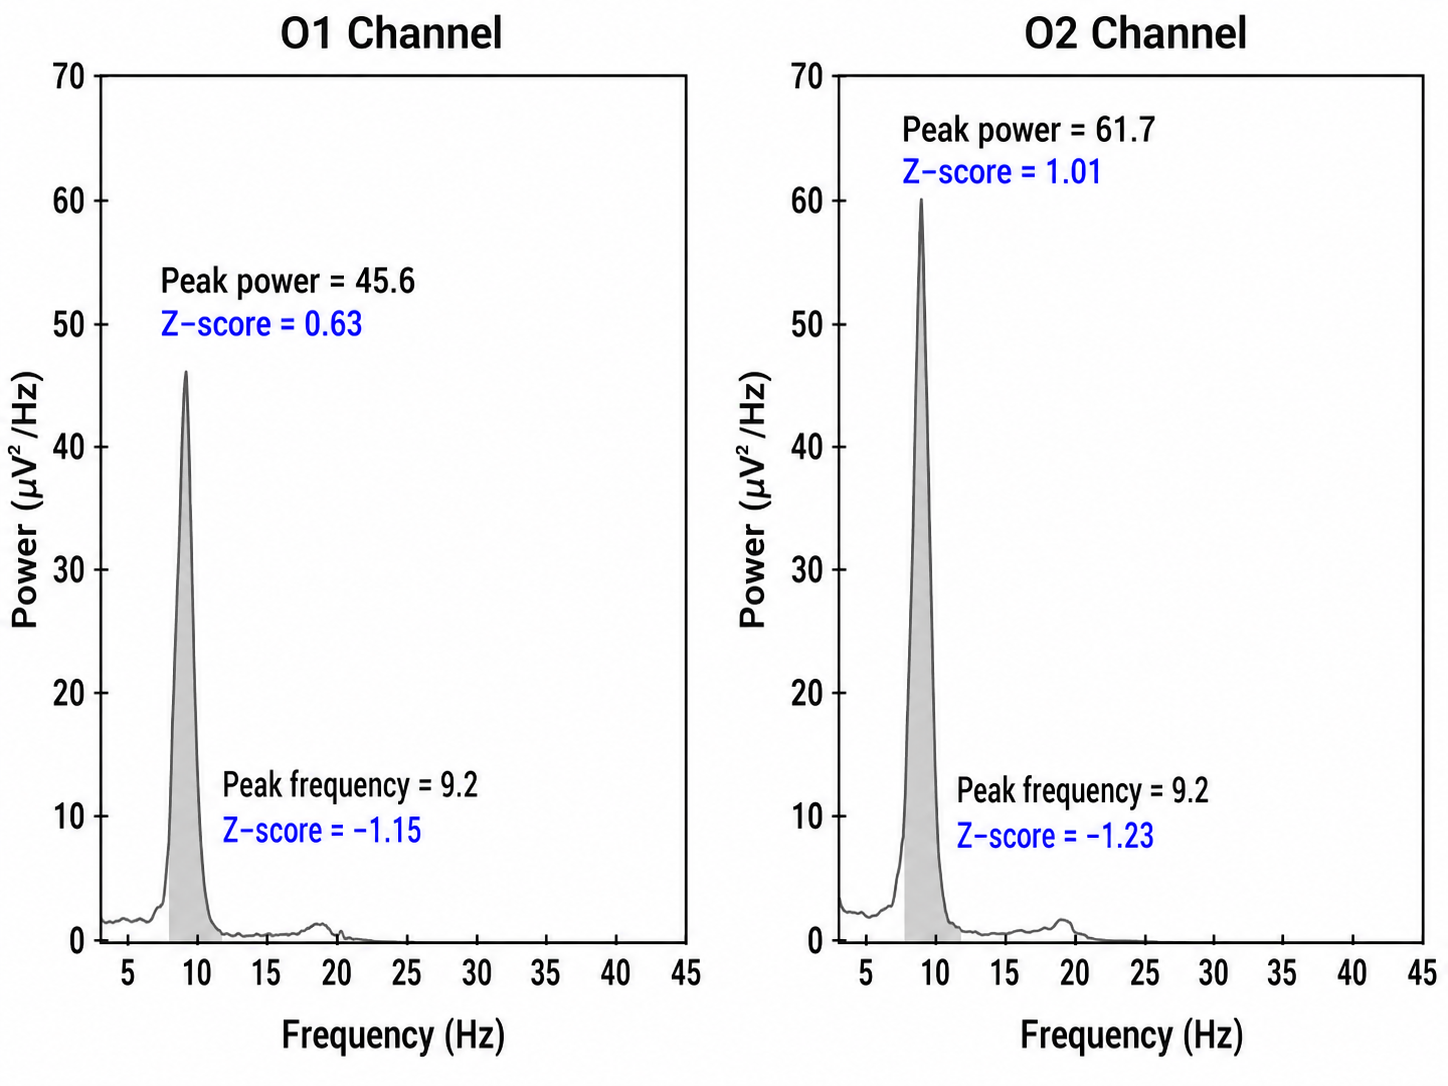
The alpha peak frequency is age-dependent, though the rhythm is not called alpha until the frequency reaches 8 Hz. In early infancy, it is designated as the posterior basic rhythm or posterior dominant rhythm (PDR). It appears around the age of 4 months with a frequency of about 4 cycles per second (c/s) or Hz (Schomer & Lopes da Silva, 2017). The PDR speeds up during maturation and is approximately 6 c/s at 1 year and up to 8 c/s at around 3 years of age, which is when it can be called the alpha rhythm.
The mean frequency reaches about 9 Hz by roughly 7 years and about 10 Hz by mid-adolescence (Petersén & Eeg-Olofsson, 1971, whose sample was children aged 1 through 15). The frequently quoted adult mean of 10.2 plus or minus 0.9/sec comes from a separate adult normative sample and should not be attributed to that pediatric study. From the previous example, we see why a peak frequency between 8-9 Hz is slow for a 15-year-old.
Alpha is a posterior, eyes-closed rhythm generated by the interaction of thalamocortical relay neurons with the inhibitory reticular nucleus of the thalamus. Its peak frequency matures with age, so any peak must be judged against age norms rather than a single adult standard. Calculating the peak across a broad range of roughly 6 to 16 Hz avoids the band-edge errors that can misplace a slow alpha into the theta bin.
Meaning and Importance of the Alpha Peak Frequency
The speed or frequency of the alpha peak is often mentioned, even in a neurologist's report. For the neurofeedback practitioner, it is helpful to understand the factors associated with different alpha frequencies. The alpha peak frequency is a measure of the frequency of the rhythmic pattern of the posterior rhythm, generally called alpha. This has traditionally been an important measure, and although it has recently been somewhat de-emphasized in some EEG circles, it remains an interesting one with a great deal of research supporting it as a useful metric for assessment.
A slow peak alpha frequency has been associated with some forms of cognitive decline and memory impairment (Stam, 2017) as well as mild traumatic brain injury (mTBI; Jabbari et al., 1985; Williams, 1941). A fast peak alpha frequency has been associated with improved scores on timed IQ tests. It has also been associated with enhanced memory and cognitive performance in various age groups (Grandy et al., 2013). A faster peak alpha frequency is associated with advanced reading skills in precocious children (Suldo et al., 2001).
The peak alpha frequency changes through the lifespan. Therefore, age-normed values for the peak alpha frequency are important for assessment purposes. The normal adult peak alpha frequency is 9.5-10.5 Hz (Jabbari et al., 1985).
Scholarly literature states that the peak alpha frequency is not abnormal until it is below 8 Hz (Schomer & Lopes da Silva, 2017). However, it is commonly thought to be potentially meaningful when the frequency is below 9 Hz for an adult.
Stam (2017) stated that slowing the alpha peak frequency by more than 1 Hz, meaning 9 Hz for an adult, is generally a sign of pathology. A slow alpha frequency can be associated with fatigue, cognitive decline, and memory impairment. Slowing of the background alpha rhythm is also a sign of generalized cerebral dysfunction (Nayak & Anilkumar, 2021). Rathee and colleagues (2020) related the speed of the peak alpha frequency to reading comprehension, and they found that a slower peak alpha frequency is associated with poor comprehension.
A peak alpha frequency faster than about 10.5 Hz has also been described clinically as a marker of an overly activated central nervous system, with reported correlates including sleep initiation problems, anxiety, intrusive thoughts, and difficulty with self-soothing and self-calming skills. This clinical account sits in tension with the cognitive-performance findings above and is offered here without a supporting citation.
Meaning and Importance of the Eyes-Closed Alpha Response Voltage
In addition to the peak frequency within the 8-12 or 8-13 Hz alpha band, the amplitude of the activity can also be meaningful. The alpha voltage will be partially affected by the montage that is used. Keeping in mind the discussion of differential amplifiers in the Instrumentation and Electronics section, the closer two electrodes are to each other, the more the rhythmic, synchronous patterns will be attenuated.
Because a differential amplifier displays only the difference between its two inputs, common-mode rejection (CMR) removes whatever the two inputs share. Waves that are the same frequency and also synchronous, such as 10 Hz waves waving up and down at the same time at the two sensor locations, will therefore be rejected. Note that in a bipolar montage both sensors are active, and the labels active and reference belong to a referential montage. Comparing the O1 and O2 occipital electrodes to each other will result in a lower apparent voltage of alpha if the two waveforms are synchronous, which is quite likely.
Conversely, comparing either O1 or O2 to an ear reference or possibly to a forehead reference would result in almost no rejection of alpha activity. The rhythmic patterns are unlikely to be similar at these distant locations and will therefore be retained. When viewing standard voltage information in an atlas, a research paper, or a textbook, try to identify the montage used when those standards were developed.
Simonova et al. (1967) found amplitudes between 20 and 60 μV in 66% of their subjects, while values below 20 μV were found in 28% and above 60 μV in only 6%. Schomer and Lopes da Silva (2017) suggest that values between 10 and 60 μV are typical. However, other sources such as the Johns Hopkins Atlas of Digital EEG (2011) and Libenson's Practical Approach to Electroencephalography (2009) cite 20 μV as the minimum voltage for adults. These differences may seem insignificant but can represent the difference between a low voltage fast EEG finding and a typical assessment.
Rhythmic alpha activity represents the synchronization of the EEG, and it represents part of the excitation and inhibition cycle. When either large or small groups of neurons perform tasks, this results in the desynchronization of the EEG during work, as each group of neurons performs its function somewhat locally and somewhat independently. This is followed by a resting or inhibitory phase that results in the synchronization of the EEG and hence an increase in alpha amplitude as many neurons generate postsynaptic potentials in synchrony. This is clearly seen in the shift from active visual processing when the eyes are open to a synchronous pattern of oscillatory activity when neurons do not have incoming visual input to process and can rest.
This measure of alpha voltage change from eyes open to eyes closed is known as the alpha response, and the decrease of alpha with eyes opening is called alpha blocking. Together they help identify whether the work and rest cycle is occurring correctly.
An eyes-closed posterior dominant rhythm voltage below 20 μV, a cut-point on which the sources just cited disagree, suggests to the neurofeedback assessor that the person does not easily shift to a state of decreased arousal and alertness necessary for alpha amplitude to increase. The disconnection from the outside world upon eyes closing should result in decreased sensory processing of vision and other senses and decreased cognitive activity, leading to an increase in 8-12 Hz amplitude or power.
Typically, alpha activity voltage should increase as more neurons generate postsynaptic potentials in synchrony at this frequency. When this increase is less than roughly 50% above the resting baseline eyes-open alpha voltage, a clinical rule of thumb rather than a validated cutoff, it often indicates some difficulty turning off the mind, meaning that neurons remain activated and working and thus prevented from entering a resting state.
The lack of a typical alpha increase may be associated with heightened states of alertness and vigilance. These clients maintain their external perceptive focus or cognitive activity even when the eyes are closed, which likely means that the ability to achieve global synchronous activity is being inhibited. Resulting behavioral consequences can include fatigue, as the neurons are constantly engaged and are not allowed to rest. This pattern may be associated with a history of trauma or a history of hypervigilance for various reasons.
The image below shows an eyes-closed alpha pattern from a 15-year-old male.
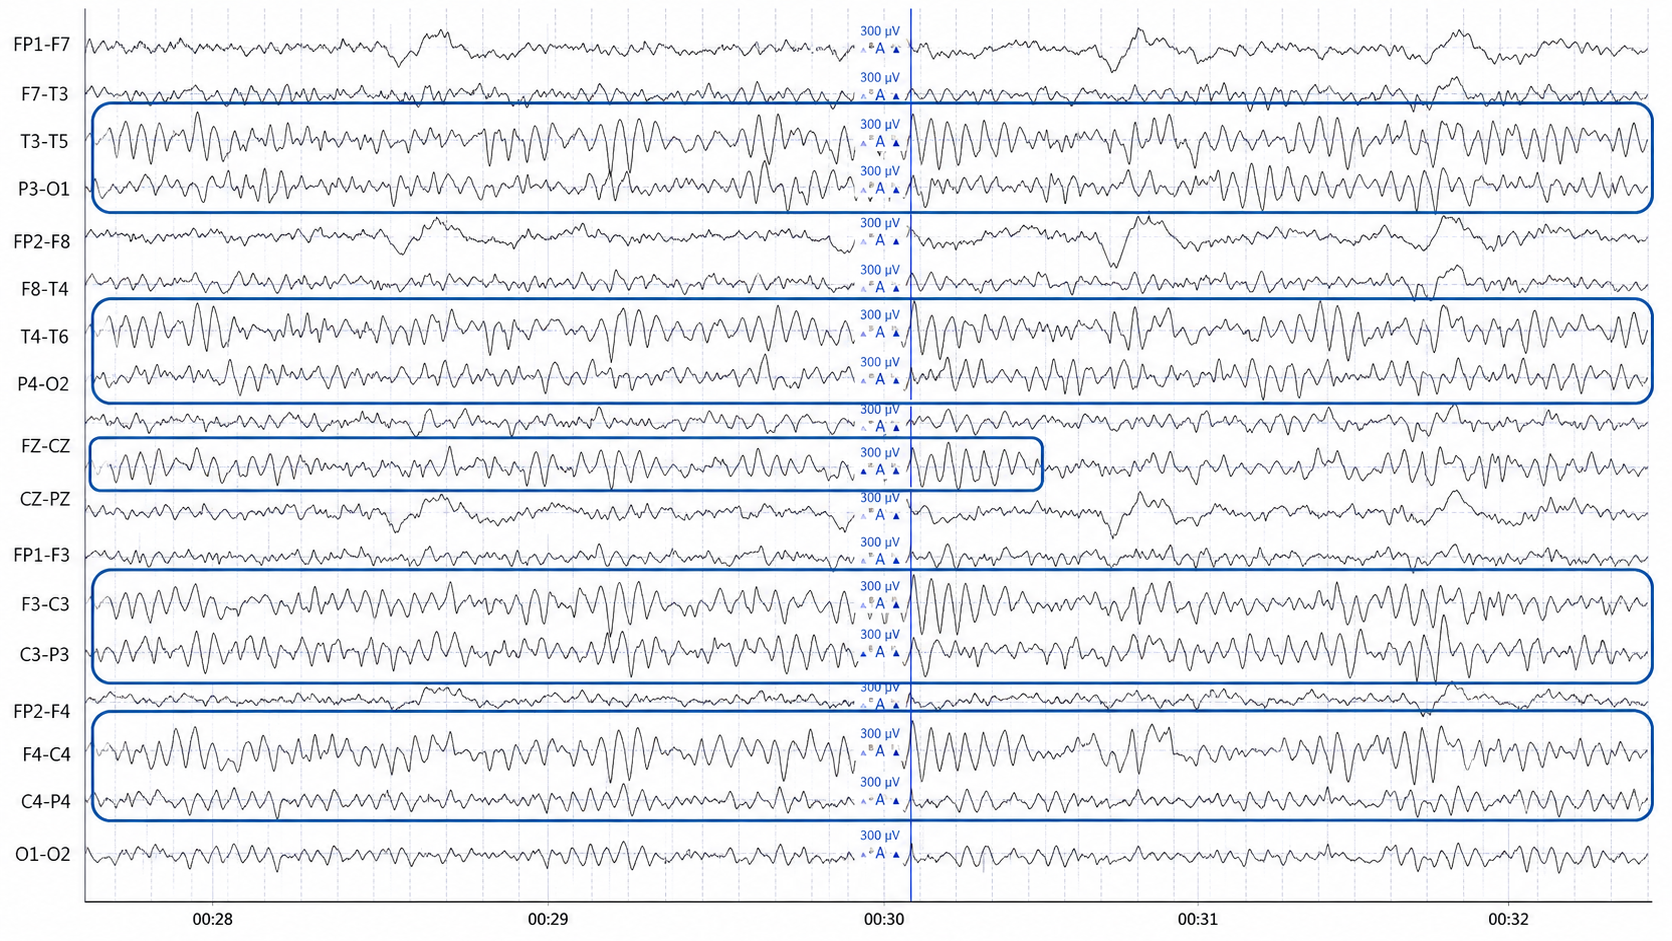
This is a full scalp EEG in the longitudinal montage, its timeline ticking in seconds across the bottom and its channels calibrated to a fairly generous 300-microvolt scale, which is itself a hint that the activity on this page runs large. The montage threads the temporal, parasagittal, and midline chains together, and several channel pairs have been ringed in blue: the posterior-temporal and parietal-occipital rows on the left, their mirror rows on the right, the midline Fz-Cz pair, and the central-parietal rows on both sides. Those blue rings are curating exactly what you should look at.
The beginner's instinct is to read one row across and grade it alone. The move that unlocks this page is to let the blue rings group the action for you and then compare the ringed regions against the rows left outside them, asking where the big rhythmic activity pools and whether the two sides of the head match.
Do that and the pattern emerges. Inside the rings, across the posterior-temporal, parietal, and central-parietal chains, a bold, high-amplitude rhythmic activity runs steadily, tall and repetitive, sustained across the several-second window. Step outside the rings to the frontal-pole rows (FP1-F7, FP2-F8, FP1-F3, FP2-F4) and the tracing is markedly quieter and lower, so the loud rhythm is concentrated toward the back and center of the head while the very front stays comparatively calm.
Now do the symmetry check the layout invites. Set the left-sided ringed rows against their right-sided partners and the rhythmic activity comes out broadly matched, arriving on both hemispheres at similar strength and shape, giving the burst a bilateral, symmetric character rather than favoring one side. The blue vertical line dropped through the page simply marks a reference instant to anchor your eye as you compare across the window.
Put it together and what this display shows is a bilateral, symmetric, high-amplitude rhythmic activity pooled over the posterior-temporal, parietal, and central-parietal regions, ringed for emphasis and sparing the frontal poles, sustained across the several-second window on a scale that confirms its considerable size. The insight comes from letting the blue rings gather the posterior-central rhythm, contrasting it with the quiet frontal rows, and confirming its side-to-side symmetry, so the back-and-center-dominant rhythmic burst declares itself rather than getting lost row by row.
Meaning and Importance of the Alpha-Blocking Response
Conversely, the continued presence of alpha once the eyes are open suggests a lack of appropriate alpha blocking. This appears to result from a lack of inhibition of synchronous generator mechanisms. Hartoyo and colleagues (2020) showed a simple mechanism, which is excitatory input to inhibitory cortical neurons. This differs from the excitatory cortical neurons that typically reduce synchronous cortical firing in favor of local responses to incoming stimuli when the eyes are opened.
Note that activation of inhibitory mechanisms results in increased inhibition, even though the function is initially excitatory. Conversely, activation of excitatory mechanisms results in greater activation. This can seem confusing, and it may help to focus on the result, whether excitatory or inhibitory, rather than the initial behavior.
There should be a dynamic balance between excitation and inhibition in the human neocortex (Dehghani et al., 2016). When this balance is disrupted, we see the behavioral effects noted here. Alpha blocking represents the re-activation of visual processing neurons when visual input returns. As these neurons are no longer in a common or general resting state but are involved in task-oriented behaviors that are more localized, synchronous activity should decrease. The overall voltage will therefore decrease because of less synchronization, and the drop does not mean that fewer neurons are active, only that their postsynaptic potentials are less synchronized and therefore sum to a lower voltage.
Imagine an auditorium full of people initially clapping synchronously, which is our eyes-closed alpha rhythm. The noise is loud because everyone is clapping at the same moment, giving higher amplitude, and completely quiet in between claps, and the frequency of the claps reflects that synchrony. Then imagine everyone clapping independently, possibly in synchrony with immediate neighbors but not with the audience as a whole. This is like the eyes-open condition, and though there will always be some noise because someone is always clapping, the result is a faster frequency of clapping. At no one moment will it be as loud as when the entire audience clapped synchronously, so the overall voltage is lower even though the frequency of clapping is faster.
Thus, alpha amplitude decreases when the eyes are opened, and this should occur quickly, in 1-2 seconds and certainly in less than 10-15 seconds. Any delay in alpha blocking suggests difficulty returning to the task. Desynchronization of the EEG occurs in posterior areas as visual processing begins when the eyes are opened.
The most common reasons for the lack of appropriate alpha blocking, meaning alpha activity persists after the eyes are opened, include fatigue and sleep deprivation, long-term meditation practice and particularly mantra meditation, marijuana use and abuse that is generally long-term and chronic, and cerebral dysfunction due to disease, injury, or possibly chemical exposure.
Below is an example of alpha-blocking following the eyes opening.
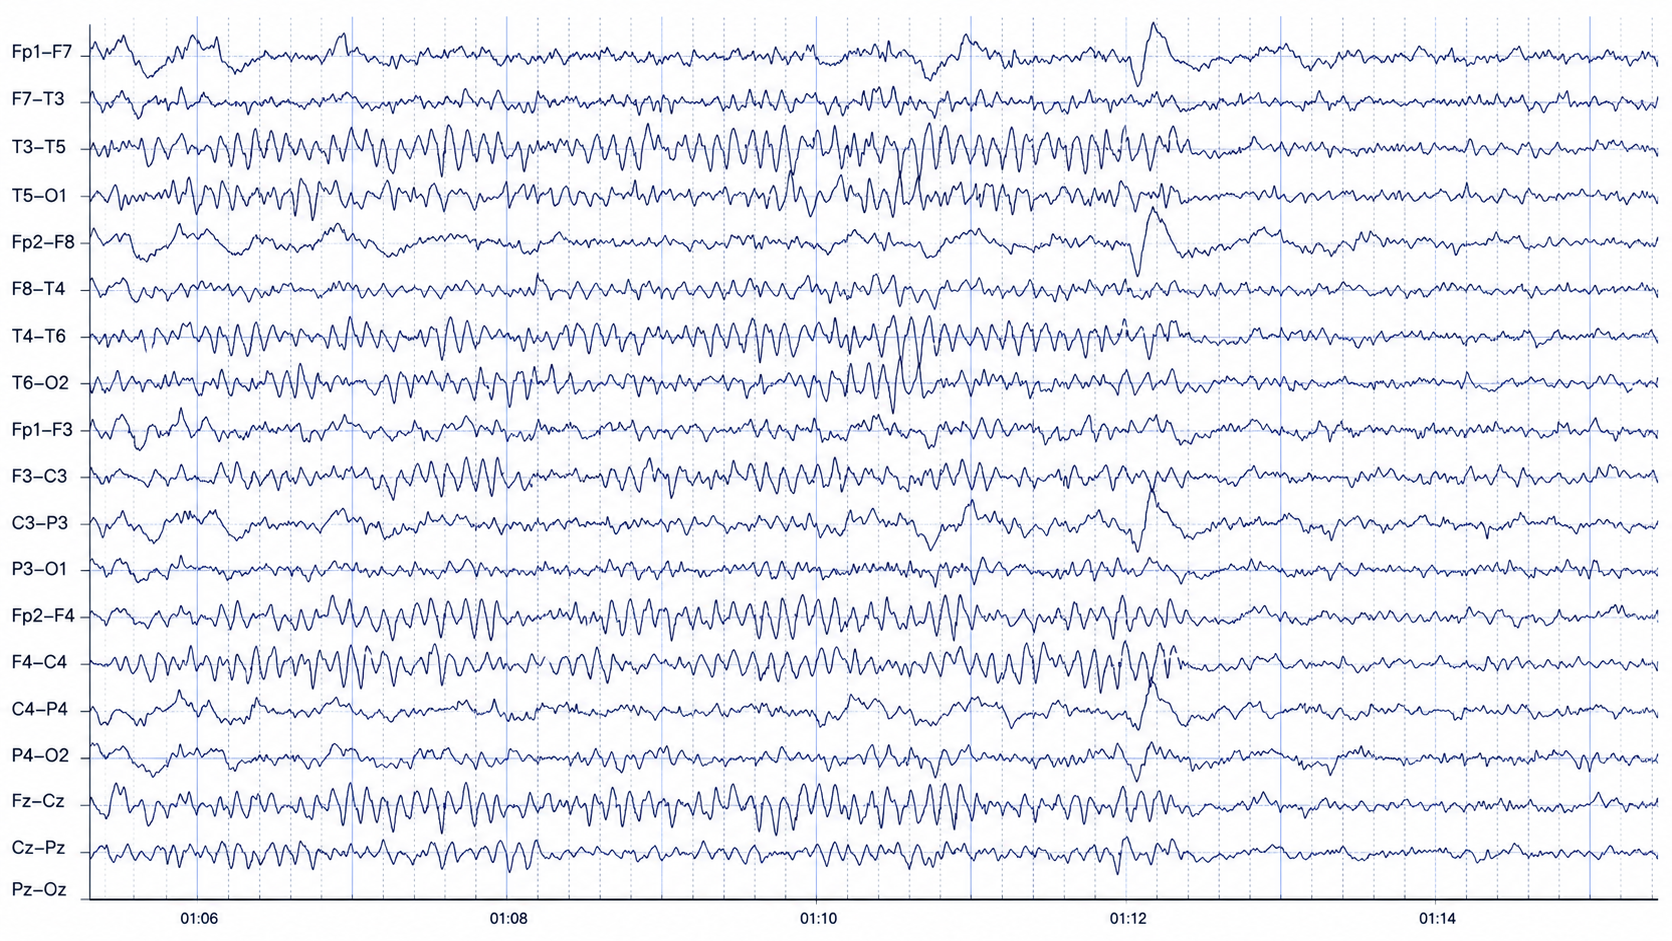
This is a full scalp EEG in the longitudinal montage, drawn in blue ink with the timeline ticking in seconds across the bottom, threading the left and right temporal chains, the left and right parasagittal chains, and the midline chain down the page. The first impression is of a page that is busy but orderly, filled edge to edge with rhythmic, repetitive waves rather than a flat background broken by the occasional event, and that pervasive rhythmicity is the thing to register first.
The beginner's mistake is to pick one row and try to grade its wiggles in isolation. The move that unlocks the page is to pull back, take in the whole field at once, and read it as a sequence across the several-second window, watching how the rhythm swells, organizes, and is punctuated as time moves left to right.
Do that and the dominant texture reveals itself: a continuous, fairly monotonous rhythmic activity in the theta range humming along across nearly every chain, present in the temporal, central, parasagittal, and midline rows and broadly matched between the two sides. Around the middle of the window it tightens into a more organized, spindle-like burst, a run of cleaner rhythmic waves that stands out most over the right temporal and central chains before easing back into the ongoing rhythm.
Then notice the punctuation. Toward the later part of the page a discrete, sharper, higher-amplitude transient appears, a crisp deflection that shows up across several frontal and central channels at once, standing apart from the smooth surrounding rhythm as a single pointed event. Together the sustained rhythmic theta, the spindle-like burst, and the lone sharp central transient give the page the character of a brain drifting into drowsy, light sleep rather than sitting in relaxed wakefulness.
Put it together and what this display shows is a widespread, monotonous rhythmic theta background, symmetric across the head, that organizes into a spindle-like burst mid-window and is punctuated by a discrete sharp central transient, the classic furniture of the drowsy transition toward sleep. The insight comes from reading the whole page as one evolving field, letting the pervasive rhythm, its spindle-like swell, and the punctuating sharp wave add up to a single state rather than studying any one row on its own.
Clearly, the response of 8-12 Hz EEG activity can be quite revealing and provides the clinician with helpful information about the client. However, it is important to note that other factors can affect the EEG recording. We have already noted the effects of artifacts on the EEG generally. Additionally, the client's state of mind, level of anxiety, comfort with the application of sensors to the scalp, level of trust of the practitioner conducting the recording, amount of sleep, and the use of caffeine, other stimulants, and common medications can all affect the results of the recording.
Once an assessment is made of excess or deficient alpha activity, lack of an alpha response, persistent alpha following the eyes opening, or a slow or fast peak alpha frequency, the clinician can proceed with training to address these findings. There are multiple approaches to training the 8-12 Hz frequency band, including training specific segments of that band to achieve training goals. For example, if a lack of an alpha response to eyes closing is associated with anxiety and possibly insomnia, training for an increase in the 8-10 Hz portion of the posterior alpha rhythm in the eyes-closed condition may be an effective intervention. If the peak alpha frequency is slow, training for increases in the 10-12 Hz portion may help speed up this frequency. If there is persistent alpha in the eyes-open condition, inhibiting or downtraining 8-12 Hz generally may be helpful.
Of course, with any intervention, other causal factors must be addressed as well. Persistent alpha or frontal alpha can signify fatigue secondary to a sleep disorder such as sleep apnea, so a referral to a physician for a sleep study may be helpful. Over-arousal patterns that correspond to a lack of alpha response can be associated with a history of emotional, psychological, physical, or sexual trauma. These issues may need to be addressed by the neurofeedback clinician or by referring the client to an appropriate therapist.
The alpha response is the rise in alpha voltage from eyes open to eyes closed, and alpha blocking is its rapid fall when the eyes reopen, normally within one to two seconds. A flat alpha response suggests a brain that will not stand down, while persistent eyes-open alpha suggests failure to re-engage, with fatigue, chronic cannabis use, long-term meditation practice, and cerebral dysfunction among the common explanations. Montage choice shapes the voltages you measure, so always ask which montage produced the norms you are comparing against.
13 or 14 to 25 or 30 Hz EEG: The Beta Rhythm
The following description is from Kane et al. (2017):
Beta band: Frequency band of 14-30 Hz inclusive. Greek letter: β.
Beta rhythm or activity: Any EEG rhythm between 14 and 30 Hz (wave duration 33-72 ms). Most characteristically recorded over the fronto-central regions of the head during wakefulness. The amplitude of the fronto-central beta rhythm varies but is mostly below 30 µV. Blocking or attenuation of the beta rhythm by contralateral movement or tactile stimulation is especially obvious in electrocorticograms. Other beta rhythms are most prominent in other locations or are diffuse and may be drug-induced, for example by alcohol, barbiturates, benzodiazepines, and intravenous anesthetic agents.
Kane and colleagues issued a 2019 corrigendum revising these two entries to a band of greater than 13 through 30 Hz and a wave duration of greater than 33 through 76 ms. The 2017 wording is quoted above because it is the version in general circulation, but the corrigendum figures are the current ones.
Beta activity appears to result from multiple factors associated with active patterns organized by slower rhythms. Bursts of beta occur in frontal-central, frontal-temporal, frontal-parietal, and central-parietal areas and are associated with different tasks based upon the structures underlying these areas. Because all functions are distributed to multiple sites, it is difficult to precisely define which part of the CNS is responsible for each function. The observations in this section are based on both animal and human studies, the latter primarily in lesion studies and during neurosurgery.
Beta is also associated with the negative shift of the DC gradient (Speckmann et al., 2017). The DC gradient, only measurable by a DC-coupled EEG amplifier, measures the overall electrical gradient of cortical areas under the recording sensors. This gradient shows a slow oscillation of less than 1 Hz, usually in the 0.1-0.2 Hz range, that is, one cycle every 5 to 10 seconds. A shift of the gradient from its current state, becoming more electrically positive or negative, occurs every 5-10 seconds and sometimes quite a bit less often.
Buzsáki (2006) states that there is a progression of frequencies whose bandwidths overlap and interact with each other, from frequencies that take 15-40 seconds to complete each cycle up to those that oscillate at 200-600 cycles per second. Gunkelman (2005) called beta and gamma activity emergent properties of bound networks. This means that, as slower frequencies of EEG synchronize across networks, beta and gamma emerge in bursts of activity in coordination with that synchrony.
Beta activity is associated with work and reflects the ongoing excitatory and inhibitory cycles occurring on multiple time scales. While the work and rest cycle mentioned in relation to the alpha response and alpha blocking is one type of excitatory and inhibitory cycle on a broader scale, beta activity reflects actions that occur millisecond by millisecond and appear to be more locally generated.
Beta frequencies have a relatively low voltage compared to slower frequencies. As noted in the above definition, amplitudes are generally less than 30 μV and frequently less than 20 μV. Remember our example of the audience clapping. In the example below, clapping occurs more often but with less power due to less synchronous activity.
Below is an example of eyes-open beta activity.
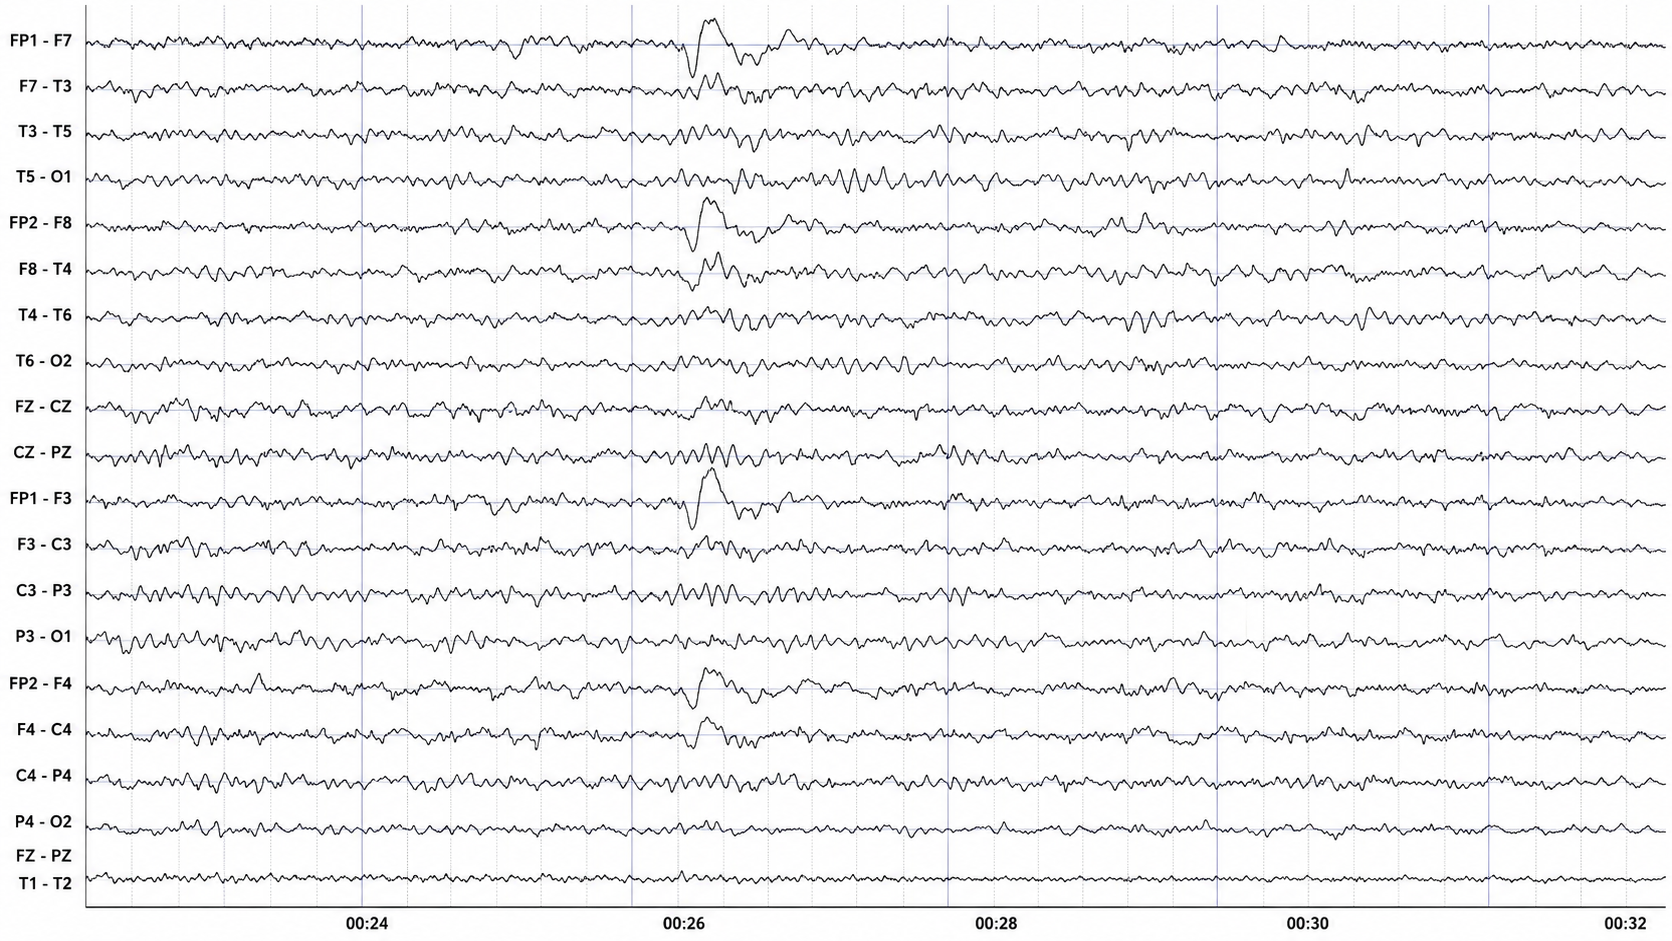
This is a full scalp EEG in the longitudinal montage, its timeline ticking in seconds across the bottom, threading the left and right temporal chains, the midline pair, the left and right parasagittal chains, and a couple of extra midline and transverse rows at the bottom. Most of the page runs along as a low-to-moderate, mixed, unremarkable background, and then, right around the twenty-six-second mark, one bold event interrupts the calm. Sorting out what that event actually is becomes the whole exercise.
The beginner's reflex is to see a tall, sharp deflection standing out from a quiet background and immediately suspect an epileptic spike. The move that unlocks the page is to resist that first impression and instead ask two disciplined questions about the transient: where on the head is it biggest, and how do the two sides compare at that instant.
Answer the first and the location is telling. Trace the deflection down the montage and it is largest at the very top of each chain, in the channels anchored to the frontal poles (Fp1-F7, Fp2-F8, Fp1-F3, Fp2-F4), then shrinks quickly as you move back toward the central, parietal, and occipital rows. It sits right at the front of the head, exactly where the eyes are. Answer the second and the symmetry seals it: the deflection appears on the left frontal and right frontal channels at the same moment and with the same shape, a tidy bilaterally-synchronous, frontally-maximal blip rather than something localized to one spot.
That combination, a brief, front-of-the-head-maximal, both-sides-together deflection, is the fingerprint of an eye blink, the eyeballs rolling and dragging their electrical field across the frontal electrodes, not the brain firing. Away from that single moment, the surrounding rows carry on with their ordinary low-voltage mixed rhythm, unremarkable and undisturbed.
Put it together and what this display shows is an otherwise calm, unremarkable background interrupted by a single discrete, frontally-maximal, bilaterally-synchronous transient that, by its position over the eyes and its side-to-side symmetry, reveals itself as an eye-blink artifact. The insight comes from meeting the eye-catching deflection with the where and the how-symmetric questions, letting its frontopolar maximum and mirror-image timing mark it as a movement of the eyes rather than a discharge of the brain.
Kropotov (2016) describes the existence of several beta rhythms with different frequencies, various locations, and distinct functions. From this information, he states that there is likely no single neuronal mechanism for generating localized beta activity. This fits with the understanding that beta activity is associated with local tasks and therefore is mediated more by local mechanisms, all with overall coordination from network systems and other rhythmic activity.
When beta activity is typical for the client based on age, state, and location, it suggests that those areas are functioning as expected. If beta activity is deficient, that may mean that the site is under-functioning or under-activated for some reason. Reasons may include damage of some sort, metabolic deficits, fatigue, or other factors. An area that is consistently over-functioning may, in time and because of overuse and fatigue, end up with a lower level of functioning and hence less beta activity.
Higher-than-typical beta amplitude at a given location may mean that the area is over-functioning or overly activated. Whether the beta amplitude is higher or lower than average, the clinician will want to understand the underlying functional neuroanatomy of the area to aid in the assessment process. Suppose the right posterior temporal and parietal junction that roughly underlies the area between T4 and T6, which is TP8 in the 10-10 system, shows excess beta amplitude. In that case, it may be associated with heightened sensitivity or attention to non-verbal communication such as tone of voice, facial expression, and body language associated with angry outbursts or signals of danger. If this area is under-activated, it may represent a self-protective disconnection from these same signals (Gunkelman, 2021).
Individuals who typically show excess beta activity at sleep onset and during sleep stages have a higher incidence of insomnia (Perlis et al., 2001). Meier and colleagues (2014) found a correlation between excess beta power in frontal, central, and temporal areas and delinquent behavior in adult men with concurrent ADHD symptomatology.
In Rowan's Primer of EEG (2nd ed.), Marcuse and colleagues (2016) treat a marked interhemispheric beta asymmetry as a useful sign, with the side of reduced relative beta power pointing to the pathological hemisphere. They identify brain abscesses, stroke, tumor, vascular malformations, and cortical dysplasia as associated with a focal decrease or enhancement of beta activity. Two cautions belong with this rule. Mild, widespread amplitude asymmetries occur in healthy people, so only relatively focal asymmetries carry weight, and a skull defect reverses the direction by producing a breach rhythm with increased focal beta over the abnormal side.
A reference to a normative database can be useful when assessing beta activity, particularly if a traumatic brain injury is suspected. Comparison with other EEG frequencies is also important, as an excess or lack of beta activity is often accompanied by differences from expected values for other frequencies.
Beta is a low-voltage, fronto-central rhythm of work, generated locally and coordinated by slower network rhythms rather than by any single generator. Deficient beta suggests an under-functioning site, and excess beta suggests over-activation, but the meaning depends entirely on the functional neuroanatomy under the electrode. Focal interhemispheric asymmetry carries more weight than diffuse asymmetry, and a skull defect reverses the usual direction by producing a breach rhythm.
Rhythms with Similar Frequencies but Different Characteristics: Not Beta
There are a few special cases where activity in the supposed beta frequency range may represent other EEG patterns. One important example is a rhythmic pattern seen over the sensory-motor cortex, generally at C3 and C4, known as the mu rhythm. This rhythm is usually given as 8-13 Hz, with a spectral peak near 9-11 Hz, and it can extend higher. Because it overlaps the alpha band and its harmonic reaches into the beta band, it may be mistaken for alpha or beta activity.
Kane and colleagues (2017) describe the mu rhythm as follows:
Mu rhythm: Rhythm at 7-11 Hz, composed of arch-shaped waves occurring over the central or centro-parietal regions of the scalp during wakefulness. Amplitude varies but is mostly below 50 μV. Blocked or attenuated most clearly by contralateral movement, the thought of movement, readiness to move or tactile stimulation. Greek letter: μ. Synonyms: rhythm rolandique en arceau, comb rhythm (use of terms discouraged).
The mu rhythm can occur with a frequency over 13 Hz and can have spectral peaks in the alpha (8-13 Hz) and beta (14-25 Hz) frequency bands (Jenson, 2020), and hence it can appear in either band in quantitative EEG analysis. Mu can also show an additional characteristic known as a harmonic effect in the EEG recording (Cheyne, 2013; Jones et al., 2009). It usually manifests as a peak in a spectrograph at twice the frequency of the mu rhythm. A 10-Hz mu rhythm would therefore often have a 20-Hz pattern associated with it, whereas a 13-Hz mu rhythm may show a 26-Hz harmonic.
Magnetoencephalography (MEG) studies by Jones and colleagues (2009) show that what they call mu-alpha, meaning mu rhythm in the alpha frequency range, and mu-beta, meaning mu rhythm in the beta frequency range, co-occur at a rate greater than chance. This suggests similar mechanisms associated with their presence in the recording. They also show that this activity is not an artifact of the recording process, but that it is more difficult to differentiate the faster beta component when using EEG instead of MEG. MEG studies have demonstrated that beta frequency activity originates in precentral locations and alpha frequency activity in post-central locations (Hari et al., 1997).
Below are two examples of mu rhythm activity, first as a tracing with a 19-channel recording and then as a topographic representation of the same data.
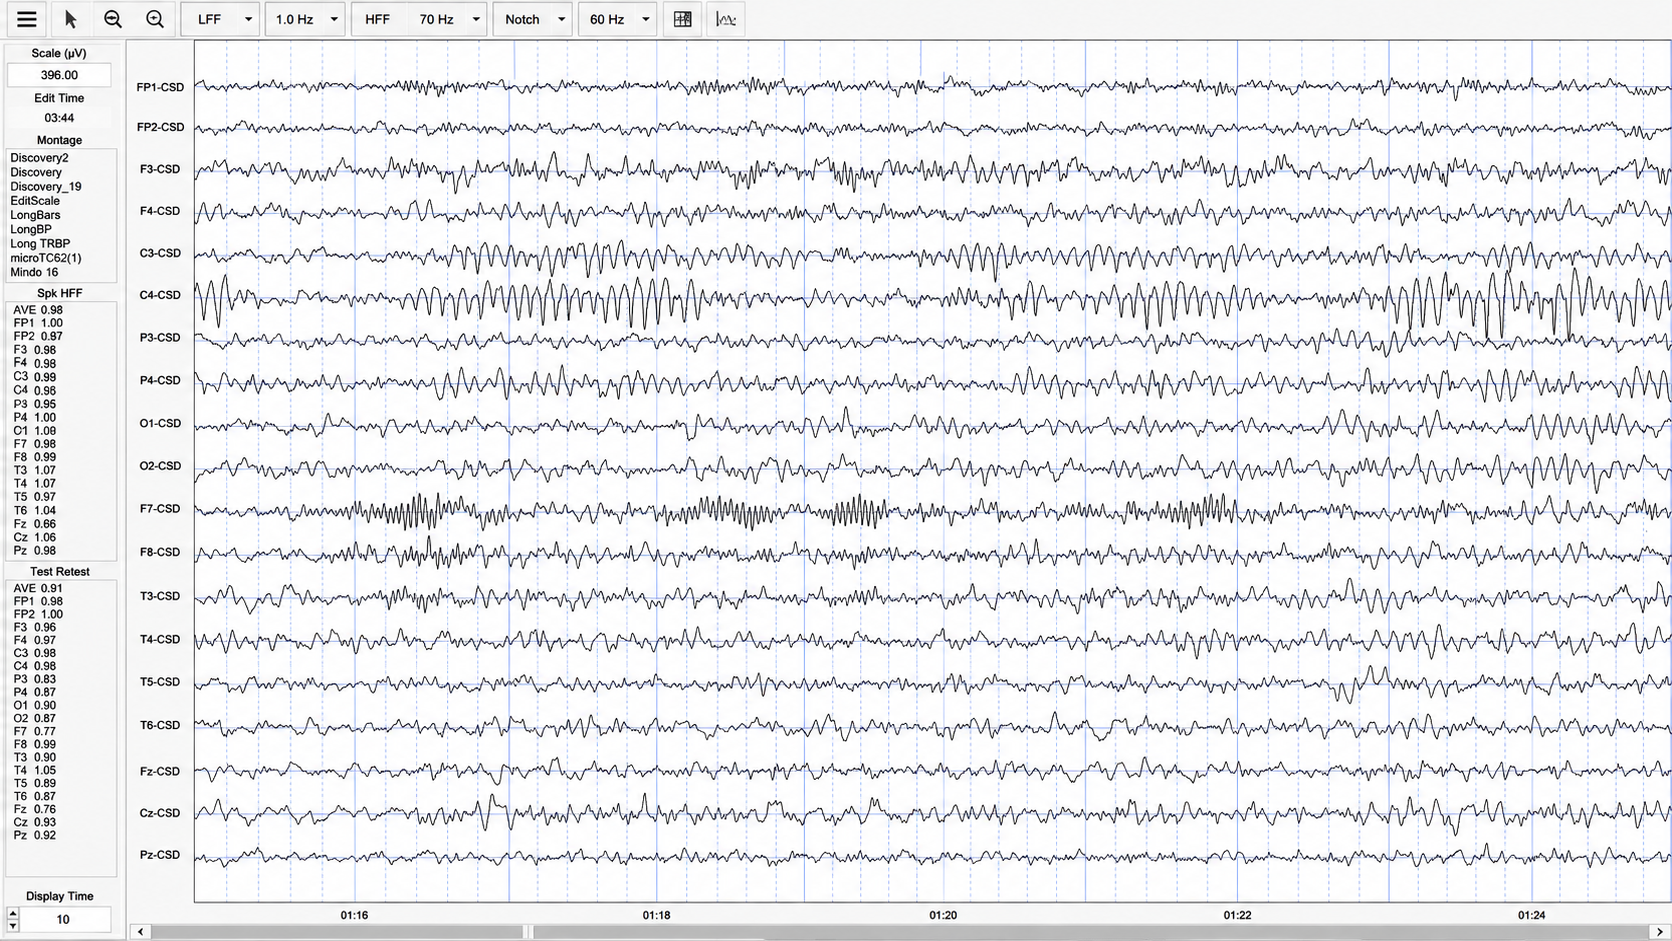
The panels down the left edge are the part beginners skip and shouldn't, because they are the display's built-in honesty check. Columns of per-channel numbers, most hovering right around one, are reliability coefficients, split-half and test-retest style, reporting how consistently each electrode reproduces its own signal. Values clustered near unity are the display quietly certifying that this is a clean, stable, trustworthy record rather than one riddled with drifting or noisy sensors. Learning to glance at those numbers before interpreting the waveforms is what separates a careful reader from a hopeful one.
The control strip across the top supplies the settings that let you trust the shapes. The low filter sits at one hertz and the high filter at seventy, with the notch engaged at sixty to strip out mains interference, and a sensitivity value scales how tall the waves are drawn.
Put the source-sharpened CSD traces together with the anatomical read of the electrode rows, the near-perfect reliability metrics, and the clean filter settings, and the display resolves into a clear, spatially focused, quality-verified window onto the brain's rhythmic activity as it unfolds second by second.
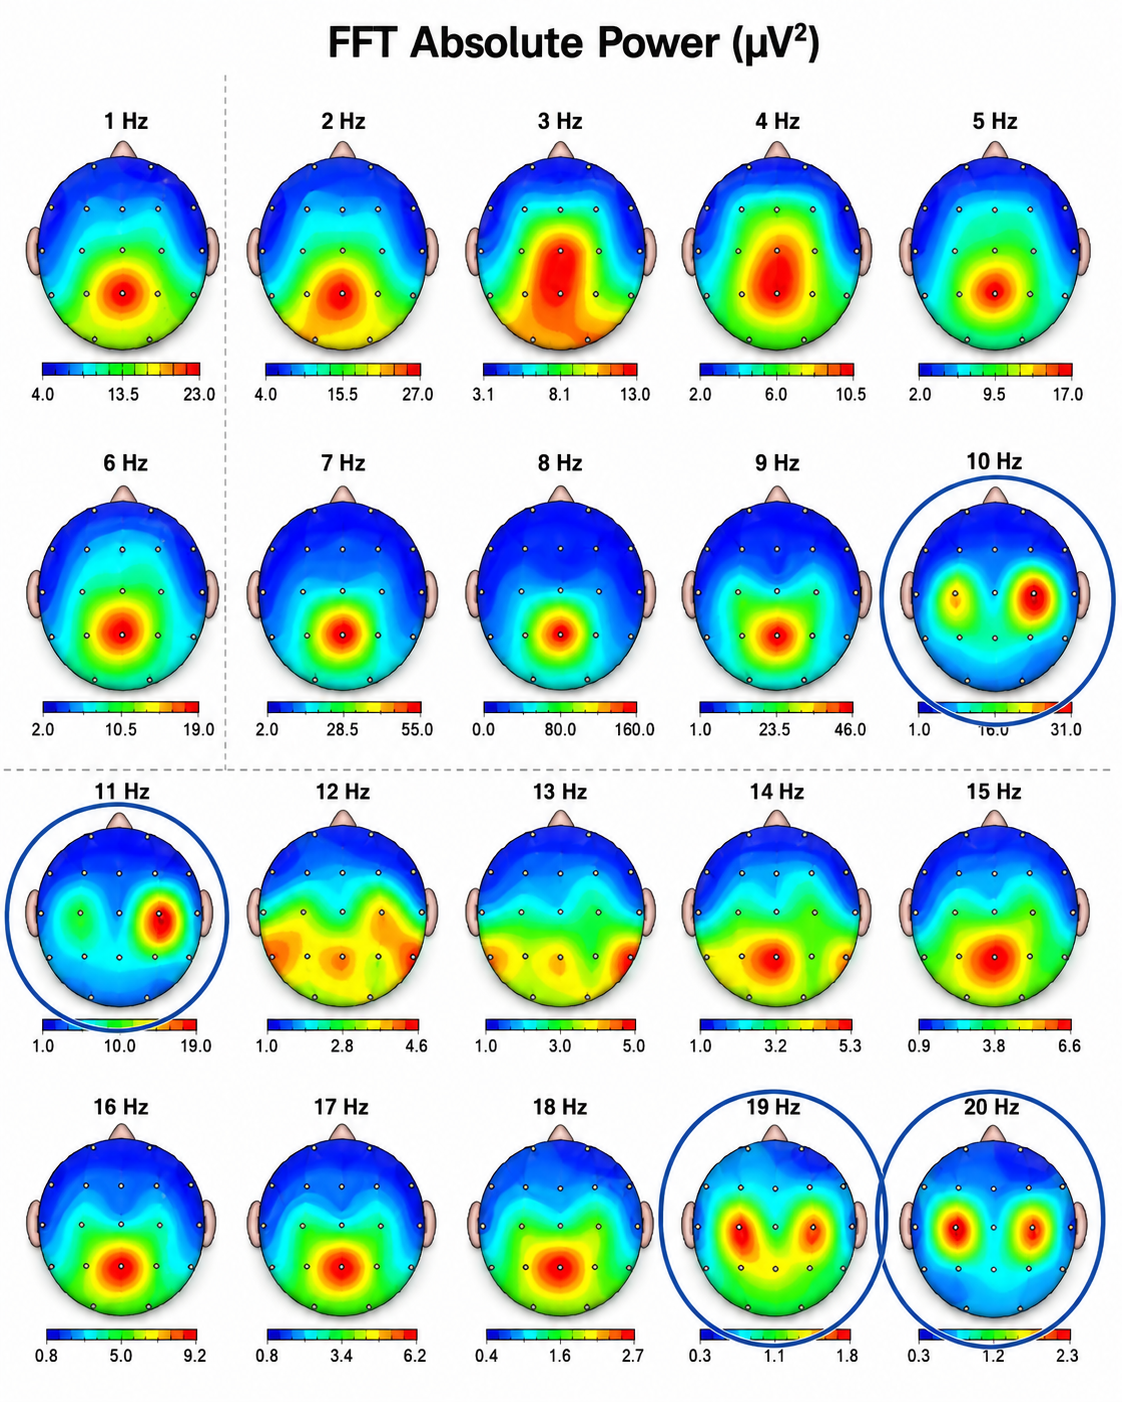
What you're looking at is a frequency-by-frequency tour of a single brain's electrical activity. An FFT (Fast Fourier Transform) has taken the raw EEG and split it into one-hertz slices, from 1 Hz up to 20 Hz, and each little head shows you where on the scalp that particular rhythm is strongest. You're viewing each head from above, nose at the top, ears to the sides, with the sensor sites marked as small dots. Warm colors (red, orange) mark where a frequency carries the most power; cool blues mark where it's quiet. So instead of one number, you get a map of where each rhythm lives.
Here's the thread that ties almost every panel together: rhythm after rhythm, the hot zone sits right down the center-back of the head, a single tidy blob straddling the midline. The slow delta and theta frequencies (1 through 7 Hz) pool there, the classic posterior alpha at 8 and 9 Hz glows there, and the faster beta rhythms from 13 through 18 Hz settle into the same central-posterior seat. The brain, across most of its spectrum, is organized around one balanced, midline home base, with left and right mirroring each other and the peak staying put.
That shared pattern is exactly what makes the circled panels worth a second look. At 10 and 11 Hz, the peak abandons the midline and jumps sideways, and at 11 Hz in particular it flares into a single intense focus over the right side rather than sitting symmetrically. At 19 and 20 Hz the same thing happens in a different costume: instead of one central spot you get two separate hotspots, one over each frontal-central region, sitting side by side. The circles are pointing at frequencies that break formation, meaning activity that has gone lateralized, paired, or lopsided where its neighbors stayed centered and even. In practice these are the bins a clinician would flag for closer attention, because they stand out against the orderly backdrop the rest of the spectrum establishes.
The trap for a newcomer is the color itself. It's tempting to read red as red and assume every fiery spot means the same amount of power, but each map carries its own scale, printed beneath it, and those scales are worlds apart. The 8 Hz map tops out around 160 µV², while the 19 Hz map maxes out below 2. A brilliant red at 19 Hz is a whisper compared to a red at 8 Hz, because the color only tells you where a frequency concentrates relative to itself, not how it stacks up against the others. Read the scale before you trust the color.
So the way to actually see this display is to first take in the whole family at once, noticing how consistently the power gathers at that central midline seat as you scan from 1 Hz to 20 Hz, and only then let your eye snap to the four circled outliers, where the rhythm has stepped off-center and drawn attention to itself. The individual maps are the trees, and the arrangement they almost all agree on, along with the handful that don't, is what you're really being shown.
The appearance of the mu rhythm over the sensory-motor cortex has been associated with pathology (Gastaut & Bert, 1954; Gastaut et al., 1959), such as psychosomatic symptoms in individuals identified as neurotic. Chatrian and colleagues (1959) demonstrated that suppression of mu activity is associated with one's own movements or with observing someone else moving.
Early visual-inspection studies made mu look rare. Schnell and Klass (1966) identified it in 2.9% of their participants, Gastaut and colleagues found it in 14% of 500 healthy adult males, and an early edition of Niedermeyer and Lopes da Silva's Electroencephalography gives roughly 17-19%. Later work using spectral analysis and coherence found much more of it. Kuhlman (1978) reported that mu was rarely identified visually but appeared in about half his sample on spectral analysis, and Schoppenhorst and colleagues (1980) identified mu in 60% of 54 participants using coherence estimates, with figures as summarized by Hobson and Bishop (2017). No single prevalence figure is defensible without naming both its source and its detection criterion.
Mu activity has been correlated with motor cortex functions, as noted above. It appears to be similar to the alpha activity described in posterior areas in response to eyes-open and eyes-closed conditions. Similarly, mu activity seems to be present when the motor cortex is idle and blocked or attenuated when the motor cortex becomes active. Interestingly, mu is blocked with the physical movement of the person being recorded, when that person observes movement, and when the person even visualizes movement. However, unlike alpha, mu activity does not block with eye-opening.
Mu activity has been associated with what has been called the mirror neuron system (MNS), which is a network of locations associated with what might be termed learning by observation, mimicry, or imitation. Bernier and colleagues (2007) identify mu as reflecting an underlying execution and observation matching system, and they studied the relationship of abnormalities in response patterns of the mu rhythm in individuals with autism spectrum disorder (ASD). They show decreased attenuation of mu rhythm when adult individuals with ASD observed physical movement in others compared to age- and IQ-matched typical adults. Montirosso and colleagues (2019) show different patterns of mu desynchronization between pre-term and full-term infants at 14 months of age during an action observation and execution task, with full-term infants showing more broadly distributed areas of mu rhythm desynchronization compared to the pre-term infants.
Okada and colleagues (1992) identified patients with mu rhythm activity that increased with drowsiness, photic stimulation, and hyperventilation. These patients were more likely to experience intractable epilepsy or to suffer from organic brain disorders compared to another group with more well-controlled epilepsy and psychiatric disorders, where the mu rhythm showed more typical behavior, meaning that it did not block with eye-opening but blocked appropriately with spontaneous movement or with sensorimotor stimulation.
Finally, Yin and colleagues (2016) have correlated mu with blood oxygen level-dependent (BOLD) signals. They have shown that higher power or amplitude of mu activity is negatively correlated with the BOLD signal over the sensorimotor network, the attention control network, and the mirror neuron system. This means the BOLD signal in those regions is lower when the mu rhythm is higher in amplitude, which is consistent with reduced activity there and supports mu's status as a resting-state indicator for these systems and networks.
Yin and colleagues also caution against interpreting mu modulation in terms of any single brain network. Additionally, higher mu amplitude was positively correlated with the BOLD signal in areas of the salience network such as the anterior cingulate and anterior insula. It appears that some systems are at rest when mu is active, and some are more active when this is true. This, again, speaks to the complexity of EEG activity and the global, system-wide relationships associated with all EEG frequencies.
Thus, mu rhythm has become an area of increased study and interest, and training mu activity over the sensory-motor cortex has become a fairly common neurofeedback intervention. For example, a psychiatric clinic in Nashville, TN has seen improvement in multiple symptoms when Rolandic mu is trained using z-score neurofeedback (Tim Caldwell, 2020).
The visual identification of mu rhythm activity can be helpful, and task-oriented assessments that show the response to movement or observations of movement should be included in the EEG assessment of potential clients.
The Sensorimotor Rhythm
There is a similar pattern of activity in the sensory-motor cortex in the 12-15 Hz range that some identify as mu rhythm but which is also labeled as the sensory-motor rhythm (SMR). This is a pattern noted by Sterman and Wyrwicka (1967) and reported in multiple publications regarding his work with cats (Sterman & Egner, 2006) and subsequently in his work with human participants (Sterman, 1996).
Sterman and Wyrwicka first conditioned cats to increase this EEG activity (Wyrwicka & Sterman, 1968), and cats trained in this way were later found to have a raised seizure threshold on exposure to the convulsant monomethylhydrazine. He then taught human participants with intractable epilepsy to produce increased amplitude of SMR, with reported reductions in seizure frequency, and this work was replicated in multiple publications. An excellent review of the history and development of this area of EEG research and training is available in Sterman and Egner (2006).
Neurofeedback training of SMR eventually progressed to working with ADHD clients (Lubar & Shouse, 1976) and others. This pattern is associated with decreased motor excitability and is similar to the sleep spindles seen in stage 2 sleep. Clients learning to increase the voltage of this 12-15 Hz pattern show a marked decrease in hyperactive behaviors. Training in this frequency band is commonly used for clients with ADHD hyperactive or combined subtypes. It is included within the broad, generic beta frequency band, yet it shows specific characteristics that suggest it does not have the same behavioral or local generation characteristics that more typical beta activity seems to have.
Below is an example of SMR activity in an eyes-open recording.
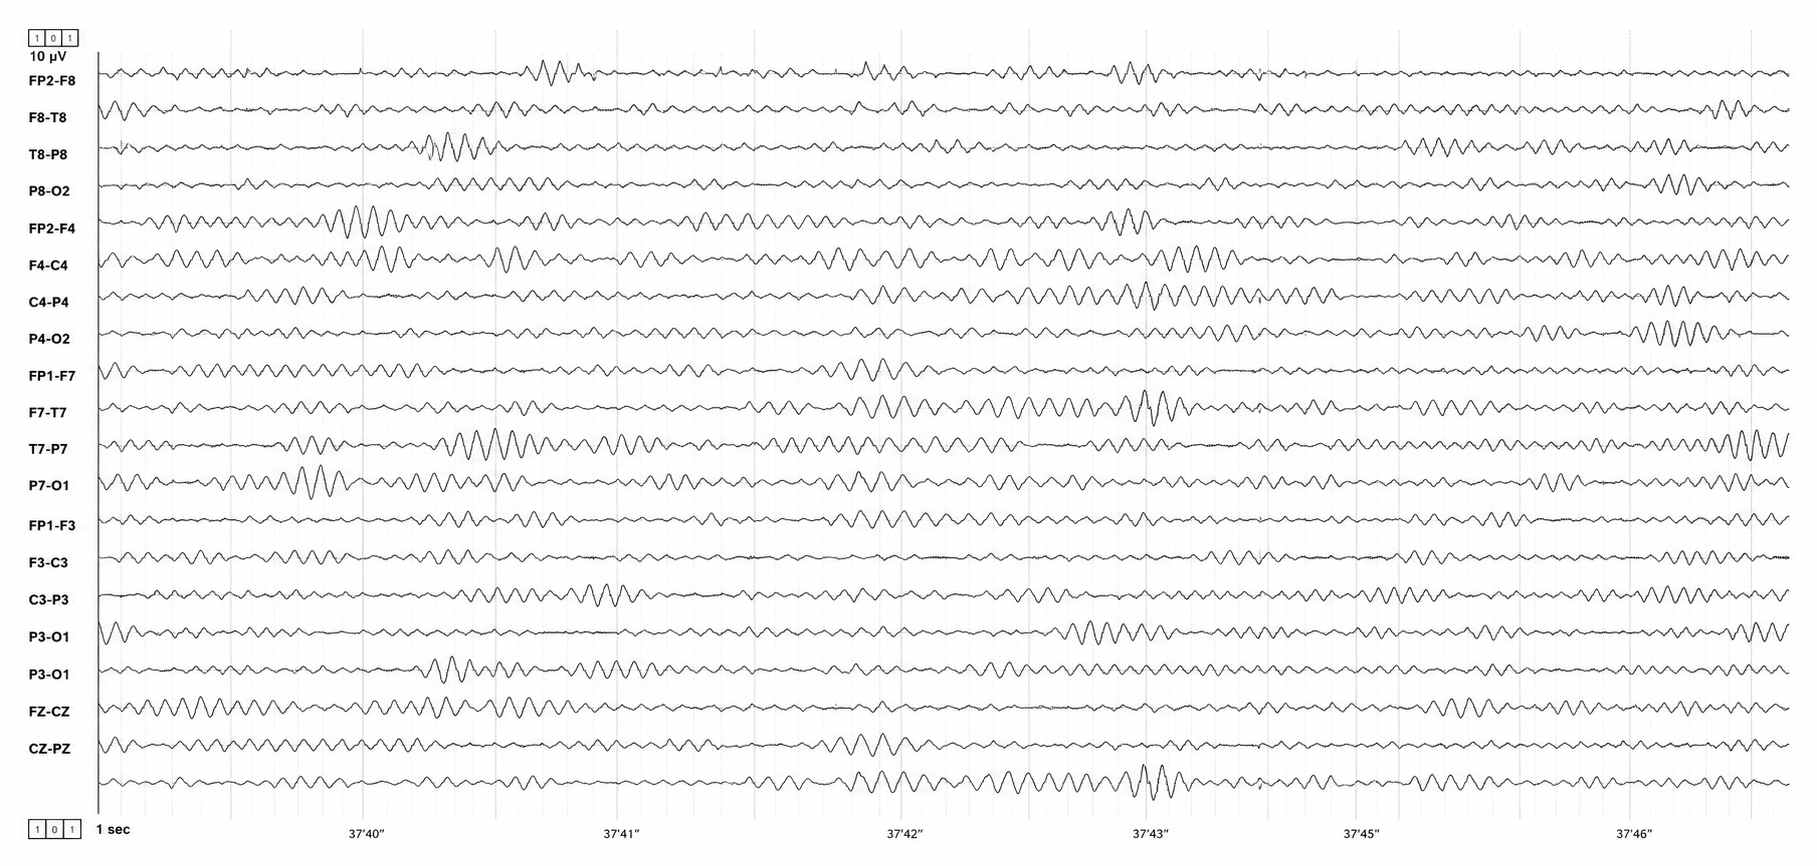
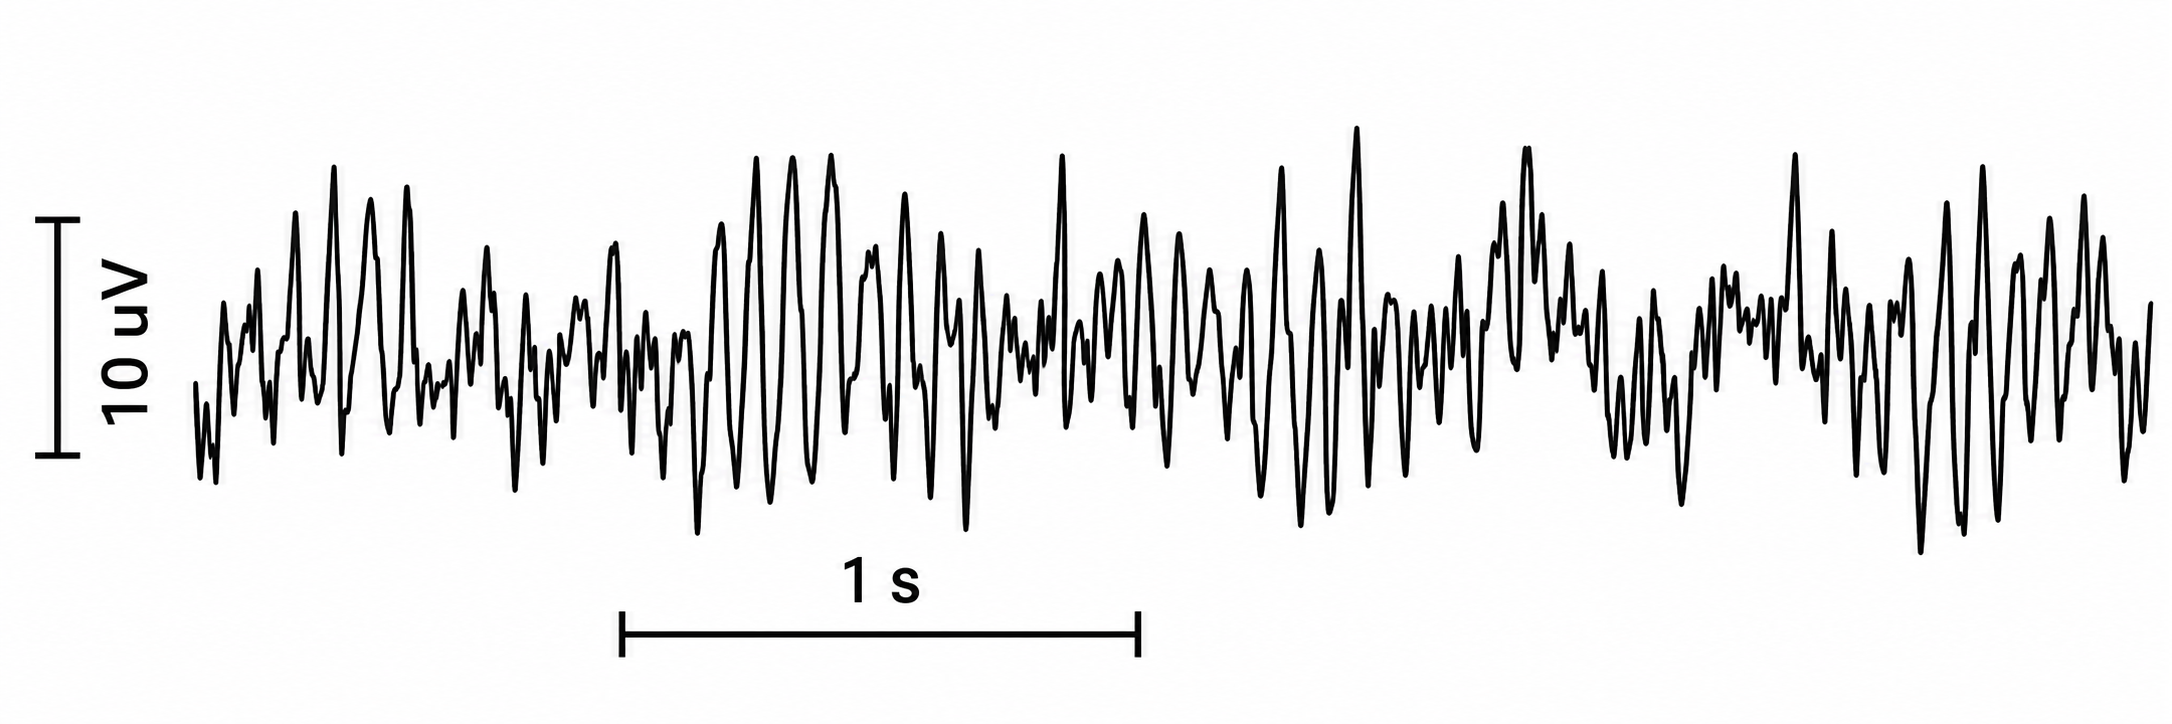
The 12-15 Hz activity, which is SMR as defined by Sterman, over the sensory-motor cortex was one of the first EEG patterns to become the focus of neurofeedback training. As noted, many published studies demonstrated the efficacy of training this frequency band in central electrodes for conditions as diverse as seizure disorders and attention deficit disorder. Training this frequency continues to be a commonly used intervention in the neurofeedback field.
The controversy regarding whether SMR activity is the same as Rolandic mu or a distinct pattern with unique characteristics is difficult to resolve. When viewing SMR activity in individuals with prominent mu rhythm, the bursting patterns do not appear synchronous, suggesting a separate mechanism of action. Still, these are simply the author's observations and have not been verified by rigorous studies.
The presence of more precisely identified frequency patterns in the EEG with more clearly defined behavioral correlates, such as mu and SMR within the beta range, is a good reason to be wary of broadly defined EEG frequency bands that lack specificity by location or behavior. We will also see this occur in the other frequencies that are covered in this discussion.
The assessment of beta activity includes location specificity and differences between locations, so training choices also target these findings. When training is focused on correcting atypical results, attention must be paid to compensatory behaviors reflected in the EEG. This will be discussed in more detail toward the end of this section.
Mu is an arch-shaped central rhythm that blocks with movement, imagined movement, and observed movement, but not with eye opening, which is the single most useful discriminator from posterior alpha. Its harmonic at twice the fundamental frequency places energy in the beta band and can masquerade as beta in a spectral analysis. SMR at 12-15 Hz over the sensorimotor strip has its own research history running from Sterman's cats to modern ADHD protocols, and whether it is distinct from Rolandic mu remains unsettled.
0.5-3.5 Hz or 1-4 Hz or 0.1-4 Hz: The Delta Frequency Band
Continuing with our somewhat historically defined EEG frequency discussion, we move on to the delta frequency band of 1-4 Hz, sometimes defined as 0.5-3.5 Hz and even as 0.1-4 Hz. Kane (2017) describes delta as follows:
A frequency band of 0.1 to less than 4 Hz. Greek letter: δ. Comment: for practical purposes, the lower frequency limit is 0.5 Hz, as DC potential differences are not monitored in conventional EEGs.
That last comment reflects the use of AC amplifiers rather than DC-coupled amplifiers for most EEG recordings. This somewhat limited description is partially due to the difficulty of defining cellular activities associated with the EEG from 0.1-4 Hz. Amzica and Lopes da Silva (2017) discuss the delta frequency band in some depth and conclude that the activity in this frequency range represents more than one phenomenon, and that frequency-band definitions do not reflect the underlying mechanisms of the various sub-components of this activity.
Amzica and Lopes da Silva state that activities associated with delta frequencies reflect two different EEG phenomena, waves and oscillations. They describe oscillation as a repeated variation of a parameter such as current or voltage between two values, with the possible additional characteristic of a regular pattern to that variation. They define a wave as a single variation of a parameter between two extreme values, and they state that oscillations appear to be made up of waves. Current thinking identifies at least two cellular sources of delta, the thalamus and the cortex.
Thalamic delta oscillations result from two inward currents of thalamocortical cells (Soltesz et al., 1991). These currents appear to be associated with low-frequency membrane potential oscillations in thalamocortical cells that continue even in vitro after removal from the organism. This was identified in studies in rat and cat subjects (Leresche et al., 1991) and verified in human studies during in vivo monitoring (Crunelli et al., 2018). There are intrinsic mechanisms within these cells that result in regular electrical discharges. Crunelli and colleagues show that these oscillations have a rhythm-regulation function as expected, along with a plasticity function that can shape ongoing oscillations during inattention and NREM sleep, reconfiguring thalamic-cortical networks to facilitate information processing during attentive wakefulness.
Cortical delta oscillations continue even when those neurons are disconnected from thalamic input. Again, this suggests an intrinsic mechanism within cortical neurons that allows these very slow rhythms to occur even without communication from other sources. Grey Walter (1936) identified delta activity in the scalp EEG overlying areas of cerebral tumors. More recently, localized delta activity has been associated with areas of traumatic brain injury (Buchanan et al., 2021).
This is one area where quantitative analysis of the EEG can be extremely helpful when evaluating individuals post-stroke or post-mTBI. Areas disconnected from local or global networks generally show increased delta rhythm activity and do not function as expected. Neurofeedback training can often help resolve these disconnections or facilitate a reorientation of function to a different set of neurons.
Activity in the delta frequency range appears to represent multiple brain functions. As noted earlier in the discussion of cross-frequency synchronization, delta appears to play a significant role as an underlying pacemaker for organizing and coordinating a wide range of processes. These run from local activation that results in beta frequencies, to global network functions that integrate local information processing results from multiple sensory areas, to interpretive, problem-solving, and decision-making activities, and finally to command-and-control outcomes.
These broadly distributed functions that must be coordinated in both time and space require an underlying physiological mechanism to facilitate such coordination. Crick (1994) suggested the 40 Hz gamma rhythm as the binding mechanism, and others have also recommended this. Gunkelman (2005) suggested the glial system as the physiological mechanism, and the slow cortical gradient and delta frequencies as the EEG components that reflect the activity of this system, with gamma as an emergent property that only appears when the slow cortical gradient and delta system is bound or synchronized.
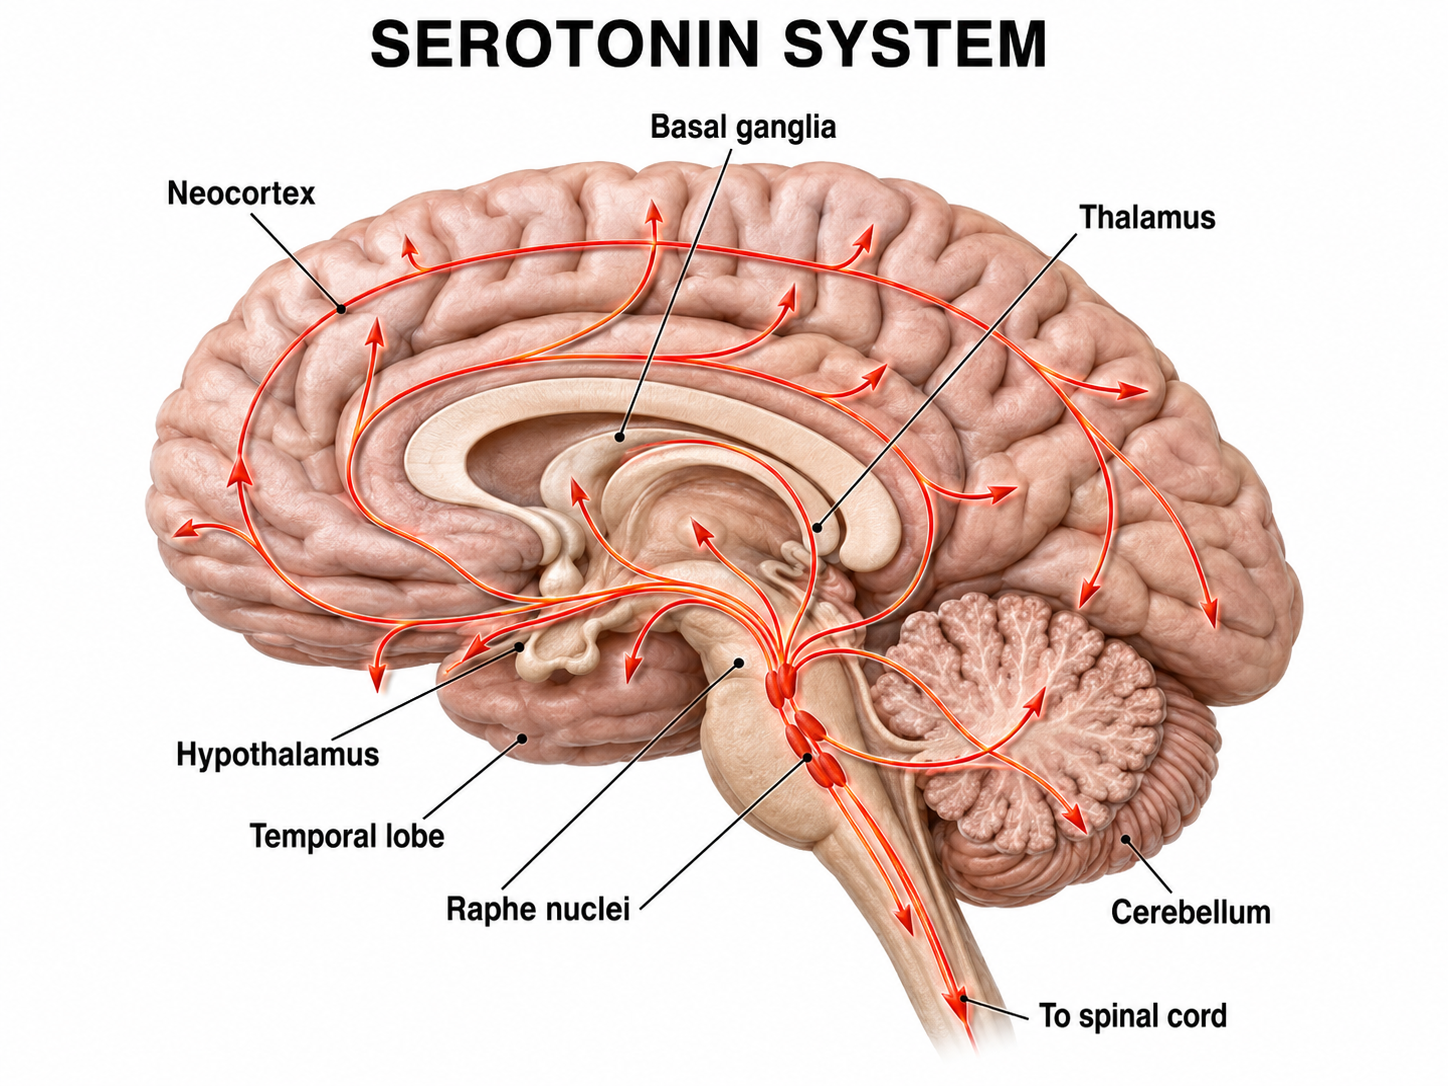
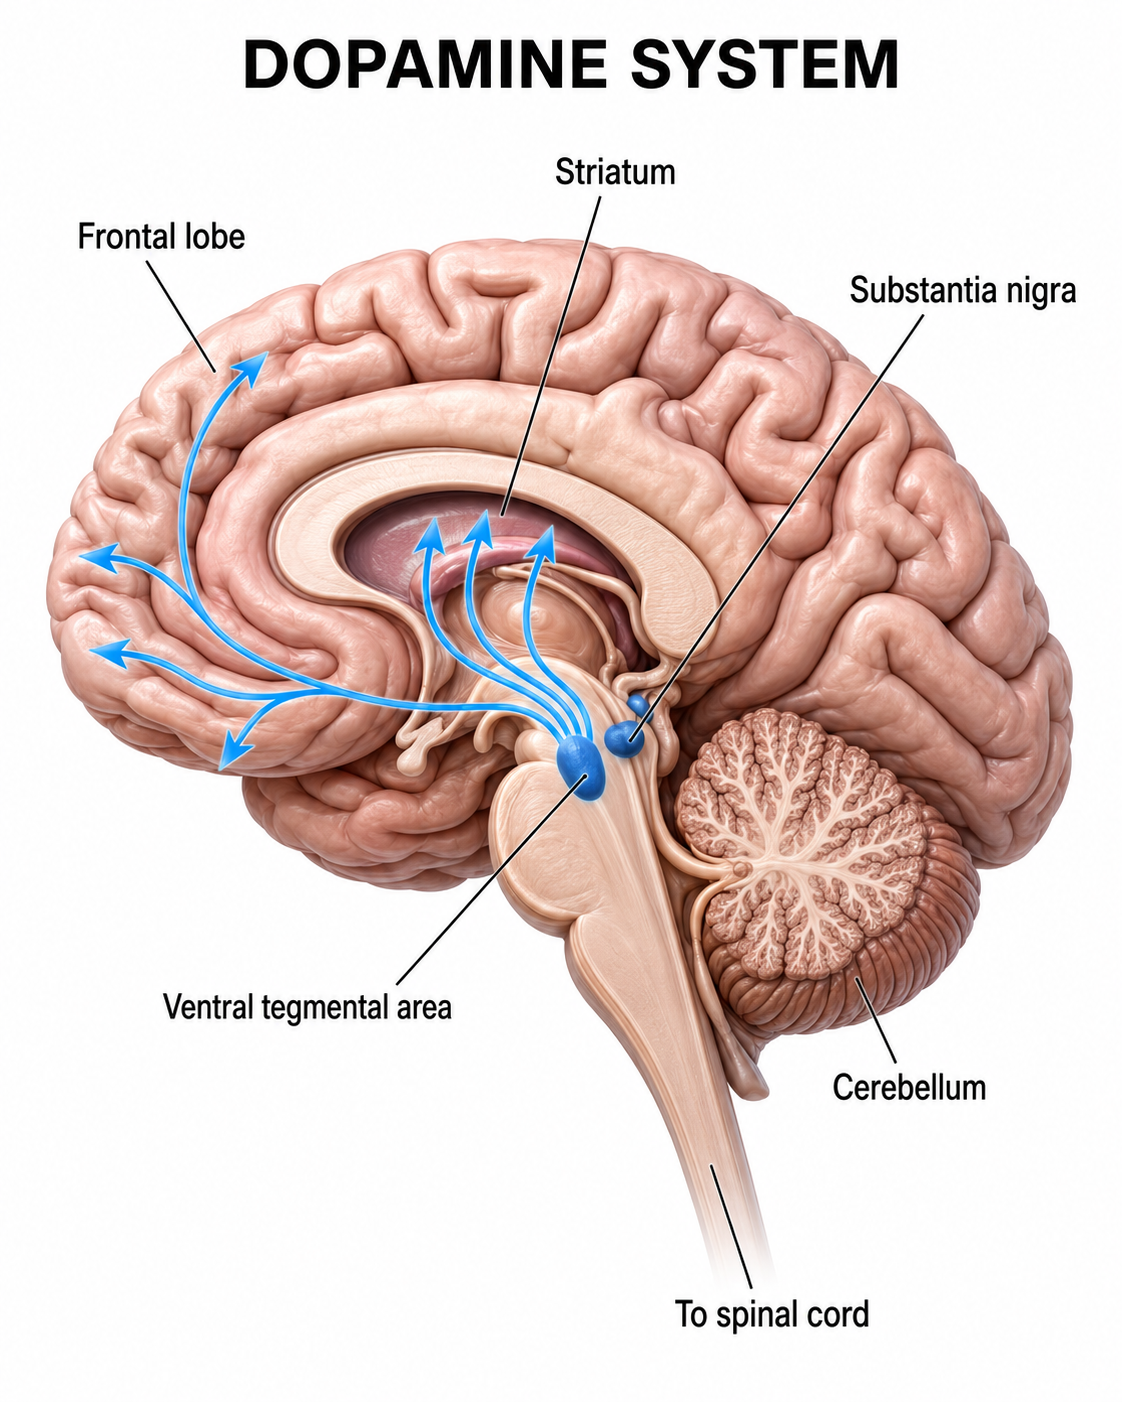
This latter concept is supported by more recent findings regarding glial cells. Recent neurophysiological understanding of brain function has been focused on chemical synapses, through which neurons communicate, and on other systems and subcortical mechanisms that influence cortical activity. This subcortical influence is seen in the ascending pathways from brainstem areas that project to the thalamus and cortex. Two examples, shown below, are serotonergic and dopaminergic pathways.
Serotonergic pathways
Dopaminergic pathways
The glia are linked in a gap junction-based network, with glial cells connecting through direct electrical coupling via hexameric assemblies of connexin proteins known as connexons, two of which pair to form a gap junction channel. Alvarez-Maubecin and colleagues (2000) have demonstrated the same type of connection between glia and neurons. Gap junctions are capable of nearly instantaneous communication instead of the relatively slow communication in the neurochemical synaptic transmission system.
Thus, large and broadly distributed networks of gap junction-linked glia can communicate and organize neuronal activity by generating slow oscillations mediated by calcium and potassium concentrations and by glia-to-neuron gap junction communication. This is in marked contrast to the notion that the slow oscillation results from neuronal activation and reflects the effect of postsynaptic potentials on the local field potential. Amzica and Lopes da Silva (2017) clearly show the neuronal activation that follows glial influences, and the synchronization between the two reflects this global coordination mechanism.
Delta activity appears to be a component of this slow oscillation, particularly at the slower delta frequencies below 2 Hz. The intrinsic cellular oscillations noted earlier occur at these frequencies below 2 Hz and likely should be viewed independently from the faster components of the delta band. These oscillations likely result from the glial involvement discussed above, which appears to continue even when neurons are not receiving sensory input. Again, we see that more precise and specific discrimination of EEG frequency activity, and of the physiological and behavioral correlations associated with those patterns, can be helpful when analyzing EEG recordings. This is also true of subsequent training approaches.
Slow Cortical Potentials
The slow cortical gradient or slow cortical potential (SCP) has been studied in connection with the incidence of cortical activation. There is a clear correlation between greater cortical negativity, meaning an electrically negative shift, and increased neuronal firing. When the cortex shifts to a more electro-negative state, this lowers the firing threshold for cortical neurons and increases cortical excitation. The opposite is also true, and cortical positivity is associated with reduced neuronal firing.
Kotchoubey and colleagues (2002), in collaboration with Neils Birbaumer of the University of Tubingen in Germany, showed reduced seizure frequency in participants with refractory epilepsy when trained to create an electro-positive SCP shift, with the goal of reducing cortical excitability and hence reducing the frequency and intensity of seizure activity. In a 10-year follow-up of study participants (Strehl et al., 2014), experimental group participants continued to show reduced seizure frequency compared to the initial pre-study baseline. Those participants were also able to demonstrate the same control of the SCP gradient in three follow-up training sessions. This sustained improvement occurred without any intervening booster training sessions. Other studies of the usefulness of SCP gradient training for migraines and ADHD have also been conducted.
Training the cortical gradient has also been a component of the various ultra-slow and infra-slow neurofeedback training approaches discussed in the Selecting Training Protocols section. Though those approaches do not generally reference the cortical gradient directly, the mechanism of action is likely associated with the glial system communication and organization properties.
Clients identified with excess localized delta activity and traumatic brain injury, stroke, or other focal abnormalities have improved from neurofeedback training as noted earlier. Local training to inhibit or downtrain the delta activity at the site or sites of abnormally high voltage is one approach. More recently, a global approach to neurofeedback training via sLORETA and swLORETA neurofeedback seeks to correct network-wide dysregulation, including errors of connectivity which, as mentioned earlier, may underlie the local finding of excess delta activity. This highlights the need for a comprehensive assessment, including an EEG assessment that shows connectivity metrics that can help recognize global disruptions.
Artifacts That Mimic Delta and the Slow Cortical Gradient
Regarding the delta frequency band assessment, some artifacts mimic both delta and slow cortical gradient patterns. These include slow lateral eye movements, which are a slow drift or slow phasic shift of the eyes when the eyes are open, or similar shifts when the eyes are closed. Where such drift is rhythmic and involuntary it is nystagmus, while ordinary slow drift is not. Saccades, or quick side-to-side eye movements, are faster and less likely to be mistaken for delta waves during visual inspection or artifact removal.
Another artifact that influences the slower component of the delta band, as well as the slow cortical gradient, is skin electrodermal activity, measured as the skin conductance response (SCR), the electrodermal response (EDR), or, in older writing, the galvanic skin response (GSR). This skin response activity shows a fairly slow oscillation at rest, reflecting tonic sympathetic nervous system (SNS) activity, and it also shows more phasic responses to stress or challenge. The slow, tonic change in the skin's conductive properties changes the electrical conductivity under the EEG recording electrode on the scalp. It can cause an apparent, although false, slow oscillation in the cortical gradient measure and the delta frequency band recording under certain conditions.
Another issue, particularly when recording the SCP and the ultra-low or infra-slow frequency ranges, is the presence of electrode drift. This is a function of metals used in EEG electrodes that can lead to unstable signals due to erratic ion exchange. It is most commonly seen in tin electrodes, which are unfortunately quite frequently used, particularly in EEG electrode caps, because they are solid electrodes rather than electrodes coated with a conductive substance that can wear off.
Other materials such as solid silver and gold-plated silver have varying degrees of drift as the electrode, conductive gel, and skin surface interfaces come into equilibrium. The best electrode material to reduce electrode artifact is the sintered silver and silver chloride (Ag/AgCl) electrode, a mixture of silver and silver chloride powder compressed into a solid pellet. The second best is an Ag/AgCl coated electrode, although the coating can wear over time. For a full analysis of electrode materials and drift, see the excellent study by Tallgren and colleagues (2005).
Finally, older EEG amplifiers, particularly those using long EEG leads from the scalp to the amplifier, show a phenomenon called cable sway when EEG leads move through the electromagnetic field of the recording environment. Leads can sway due to the movement of the client, movement by the EEG technician, or even from air currents. These cable sway movements can result in fairly high amplitude and slow oscillations that can be mistaken for SCP and delta activity.
Delta has at least two generators, thalamocortical cells and the cortex itself, and focal delta over a lesion has been a localizing sign since Walter identified it in 1936. The slow cortical potential tracks cortical excitability, with negative shifts lowering the firing threshold, and SCP training has produced durable seizure reductions at ten-year follow-up. Before you interpret any slow activity, rule out the impostors, which include slow eye drift, electrodermal shifts under the electrode, electrode drift from tin sensors, and cable sway.
4-8 Hz: The Theta Frequency Band
The last of our basic frequency bands is known as theta. The very brief description from Kane (2017) is below.
Theta band: Frequency band of 4 to less than 8 Hz. Greek letter: θ.
Theta rhythm or activity: Any EEG rhythm between 4 and 8 Hz (wave duration 125-250 ms).
Theta wave: Wave with duration of 1/8 to 1/4 s (125-250 ms).
Note that this curriculum's band table elsewhere gives theta as 4-7 Hz. The two conventions agree on the core of the band and differ only at its upper edge, and this unit follows the IFCN figures it quotes.
EEG activity in the theta frequency band is quite specific to the location where it is recorded. Activity at 4-8 Hz in temporal areas has different functional and behavioral correlates from the same frequency activity in frontal midline or posterior areas. This, again, reaffirms that location and behavior are essential components when analyzing scalp EEG.
Below is an example of filtered 4-8 Hz theta activity.
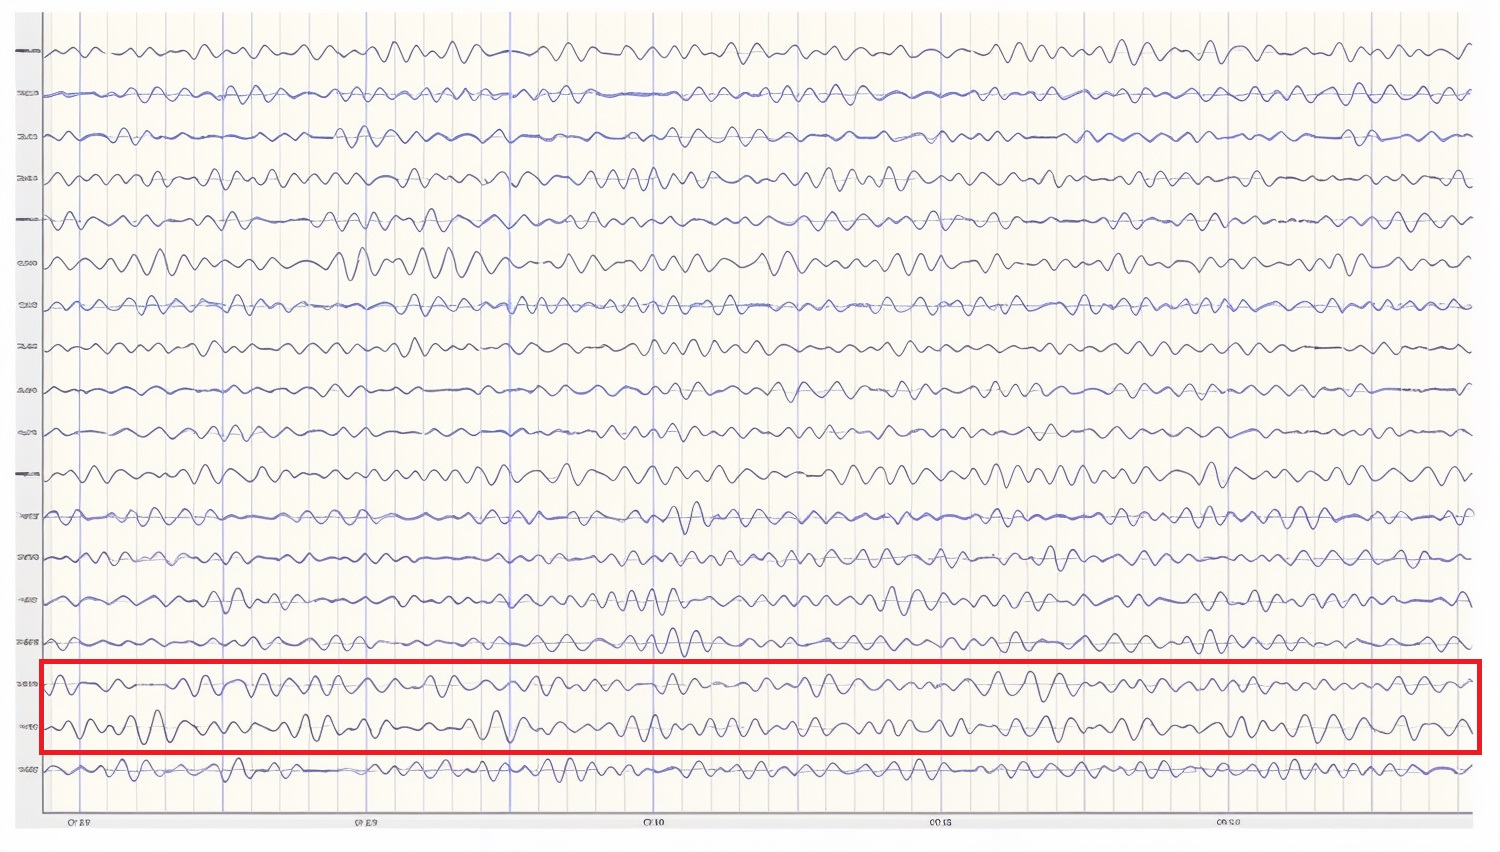
This is a full scalp EEG printed the old-fashioned way, dark blue-violet ink laid down on cream chart paper, with a long row of channels stacked top to bottom, vertical gridlines ruling the page for timing, and a red box drawn around two of the lower channels. The immediate impression is one of order rather than chaos: instead of a jumble of different-looking squiggles, nearly every line on the page is doing the same smooth, repetitive thing at once, which is itself the thing to notice first.
The beginner's temptation is to zero in on the single row inside the red box, decide that must be where the story lives, and study it in isolation. The move that unlocks the page is the opposite, to pull back and take in the whole stack at a glance, because the striking feature here is not one channel but the sameness across all of them. When you widen your gaze, the display reveals a continuous, remarkably regular rhythmic wave, rounded and almost sinusoidal, rolling along at a steady monotonous pace and filling essentially every channel from the top of the montage to the bottom.
Now use the red box for what it is good at, drawing your eye to where that rhythm is cleanest and boldest. In the boxed rows the waves stand tallest and most sharply drawn, a crisp, high-amplitude version of the same oscillation that everything else is carrying more faintly. Then read up and down the rest of the stack and confirm the pattern: the same rhythm appears across the front and back of the head and on both sides at once, arriving together rather than favoring any single region, giving the page a widespread, generalized, symmetric character.
The other thing to see is the metronomic monotony of it. The waves keep the same shape and the same steady cadence across the entire width of the page, marching on without the waxing, waning, or breaking-up you might expect, a rhythm that is more uniform and more persistent than a relaxed, varied background would ever be.
Put it together and what this display shows is a continuous, high-amplitude, rhythmic and nearly sinusoidal slow wave that dominates the whole head at once, symmetric between the sides and generalized front to back, standing out most crisply in the boxed channels and repeating with a steady, monotonous regularity across the full sweep of the recording. The insight comes from reading the page as a single field and letting that pervasive, uniform rhythm declare itself, then using the red box to appreciate its cleanest expression, rather than treating any one line as the whole story.
Below is a 1-45 Hz display of the same EEG recording at the same time location.
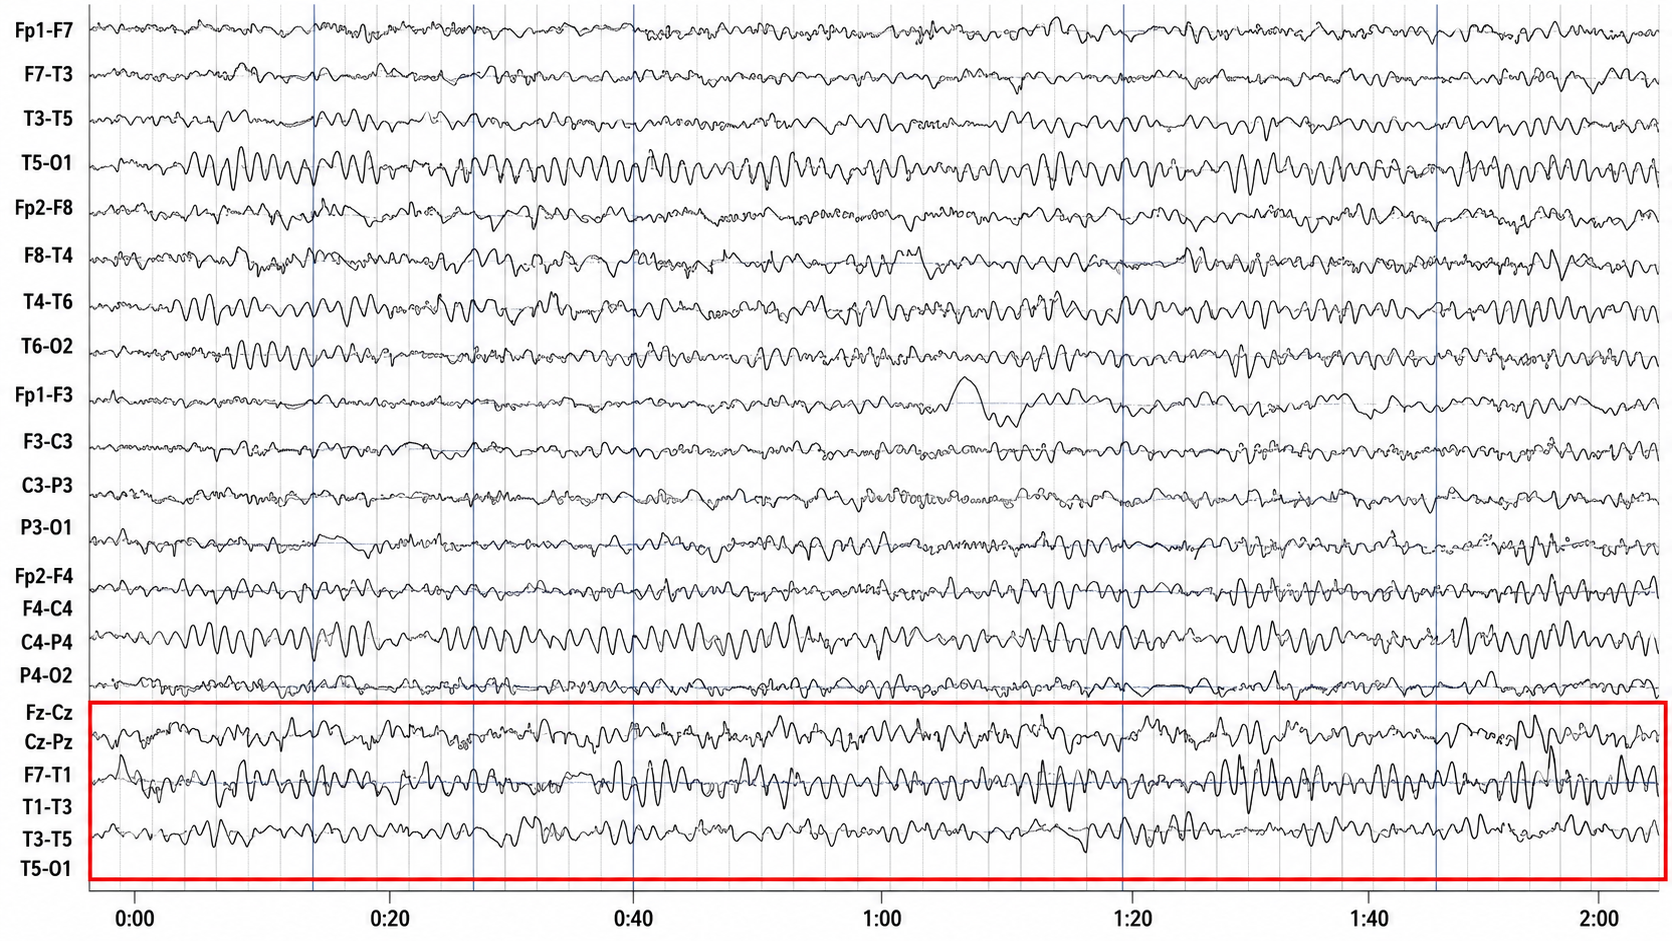
This is a full scalp EEG shown on a compressed time base, its timeline running across the bottom in minutes and seconds out to the two-minute mark, which tells you right away that this is a wide, long-duration view rather than the usual few-second snapshot. The montage stacks the left and right temporal chains, then the left and right parasagittal chains, and finally a red-boxed group at the bottom that pairs the midline channels with a special anterior-temporal chain, one that uses a true anterior-temporal electrode (the T1 derivation) to put the front of the temporal lobe under a magnifying glass. That red box is telling you exactly where the interest lies.
The beginner's mistake on a page like this is to read it as a normal short window and chase the wiggles across a single row, which on a compressed scale dissolves into busyness. The move that unlocks it is to pull back, use the long time axis, and ask a question suited to the wide view: is there a rhythm somewhere that persists and sustains itself across the minutes, rather than a blip that comes and goes?
Do that and the boxed chains answer. Down in the anterior and mid-temporal rows on the left (F7-T1 and T1-T3), a sustained, high-amplitude rhythmic discharge runs on and on, holding its pattern across large stretches of the two-minute window rather than flickering briefly and vanishing. It is bolder and more organized than the surrounding activity, a continuous rhythmic run parked over the left temporal region, and the anterior-temporal electrode captures it most sharply.
Now check the rest of the head to place it in context. The other chains carry their own rhythmic activity too, with posterior and central rows showing rhythmic runs, but the boxed left-temporal chain is where the discharge is most sustained and most sharply defined, the persistent center of the picture across the long window.
Put it together and what this display shows is a sustained, ongoing rhythmic discharge maximal over the left anterior-to-mid temporal region, boxed and captured by a dedicated anterior-temporal electrode, persisting across the compressed two-minute window rather than resolving into a brief transient. The insight comes from reading with the wide time lens the page is built for, letting the continuity and persistence of the boxed left-temporal rhythm declare itself over minutes, which is precisely what marks it as a sustained temporal event rather than a passing flurry.
Amzica and Lopes da Silva (2017) cite various studies regarding the theta rhythm they identify as 4-7 Hz. As discussed earlier, they note that normal theta activity should not be confused with pathologic theta, which represents a slowing of the alpha frequency band into the theta range. They suggest that this slowing of alpha may result from reduced cerebral blood flow or from metabolic encephalopathies. Metabolic encephalopathies can result from chemical imbalance due to various causal factors including kidney or liver dysfunction, diabetes, or a variety of other health issues (MyHealthAlberta, n.d.).
Arnolds et al. (1980) found significant differences between behavioral conditions when viewing hippocampal theta recorded with depth electrodes. Writing resulted in faster frequency and greater rhythmicity but lower amplitude than sitting or walking. In contrast, a word association task resulted in faster frequency, greater rhythmicity, and increased amplitude in the period of silence immediately following the question but before the answer was given.
Ekstrom and colleagues (2005) studied hippocampal and neocortical theta activity during a virtual driving task that involved location finding. They found that both areas increased theta during all tasks associated with the driving simulation. A significant correlation between all areas showed increased coordination between multiple areas while accomplishing the tasks. They concluded that both cortical and hippocampal theta oscillations, and the coordination between these areas, are associated with attention and sensorimotor integration.
The Theta/Beta Ratio
Historically, the study of attention disorders has focused on excess frontal theta activity in individuals with inattentive ADHD. The ratio of theta (4-8 Hz) activity to beta (13-21 Hz) activity, or the theta/beta ratio (T/B ratio), was developed to make the analysis of this metric easier. It was initially calculated using a single channel at the vertex location Cz (Monastra et al., 1999). Other studies compared multiple locations and found that the Cz location was accurate and represented the location of the largest deviation of the ratio between previously diagnosed ADHD clients and typical controls (Lubar, 1991). Identifying an elevated T/B ratio, meaning more than typical theta compared to the amount of beta, appeared to be an accurate way to assess attention disorders.
In a blinded, multi-center validation of the theta/beta ratio in comparison with rating scales for the assessment of ADHD, the researchers calculated the sensitivity and specificity of measures. They found that the T/B ratio achieved superior results to commonly used rating scales (Snyder et al., 2008). With a sample size of 159 individuals, the EEG assessment showed a sensitivity of 87% and a specificity of 94%, for an overall accuracy of 89%. The next closest measure, the Conners' Rating Scale, Teacher version, showed a sensitivity of 67% and specificity of 41%, for an overall accuracy of 58%.
The sensitivity of an assessment measure determines how accurate it is at identifying individuals known to have a particular condition. Specificity is a measure of how accurately the measure correctly eliminates individuals without the condition from identification as having the condition.
For example, the Conners' Rating Scale, Parent version, shows a sensitivity of 78%, meaning that it identifies 78% of clients known to have ADHD. However, it does this at the expense of identifying 86% of typical controls as also having ADHD, which is a specificity of 14%. This could mean that many typical children could be diagnosed with ADHD and possibly treated with medication if this scale were the only tool used for such an assessment, something that is quite often the case. Even if the teacher version of the rating scale were used, it would still result in 59% of typical children being misdiagnosed, reflecting a specificity of 41%.
When using the T/B ratio, only 6% of typical children were incorrectly identified. This suggests that, at a minimum, the use of a simple, single-channel EEG assessment should be included as a component of a comprehensive approach to identify ADHD children before prescribing medication.
Interestingly, van Son and colleagues (2019) examined the T/B ratio alongside mind wandering and network connectivity. In 26 participants, frontal T/B was higher during mind wandering than during controlled thought, and the participants whose executive control network connectivity fell most during mind wandering were those whose T/B rose most. Default mode network (DMN) connectivity was higher during mind wandering than during focused attention, although the study did not establish a direct relationship between T/B and the DMN.
The wider T/B literature they review also reports negative relationships with prefrontal cognitive control, specifically response inhibition and control of negative affect, suggesting that excess theta relative to beta could accompany greater impulsivity. That literature also reports a relationship with reward-motivated decision making that favors immediate gratification over long-term benefit. Those findings come from other studies and need their own citations.
As with all the previous EEG frequencies and assessment measures, the correct amount of a particular frequency activity is important. For example, someone who lacks appropriate default mode functioning may experience a lack of the type of resting-state activity that appears to have a therapeutic effect. The DMN has also been called the resting state network (RSN) due to its functions that differ from task-oriented behaviors, and it is thought to be important for a variety of reasons. Therefore, a person with a lower-than-typical T/B ratio may benefit from increased theta voltage and some training in activating the DMN. In contrast, an individual diagnosed with ADHD may benefit from training to reduce or inhibit excess theta voltage.
Temporal lobe theta likely reflects the hippocampal theta identified using depth electrodes. It appears to be associated with route finding and navigation, both hippocampal functions. Differential, interhemispheric training of temporal lobe areas in the theta frequency range using a bipolar montage has been a component of certain approaches to neurofeedback for some time (Othmer & Othmer, 2007). This approach is used for various conditions, including migraine, tinnitus, PMS, and many others. Frequencies are adjusted to facilitate the optimal response and may range from the alpha frequencies, through the theta frequencies, down to the infra-low frequencies below 1 Hz.
Again, the analysis of theta activity is often aided by using a normative database. Otherwise, determining whether an amount is too high or too low in amplitude is difficult to discern. Fortunately for T/B ratio assessment, Monastra and colleagues (2001) have provided a table of values with three age ranges, 6-11 years, 12-15 years, and 16-20 years. The table of mean T/B power ratios is below.
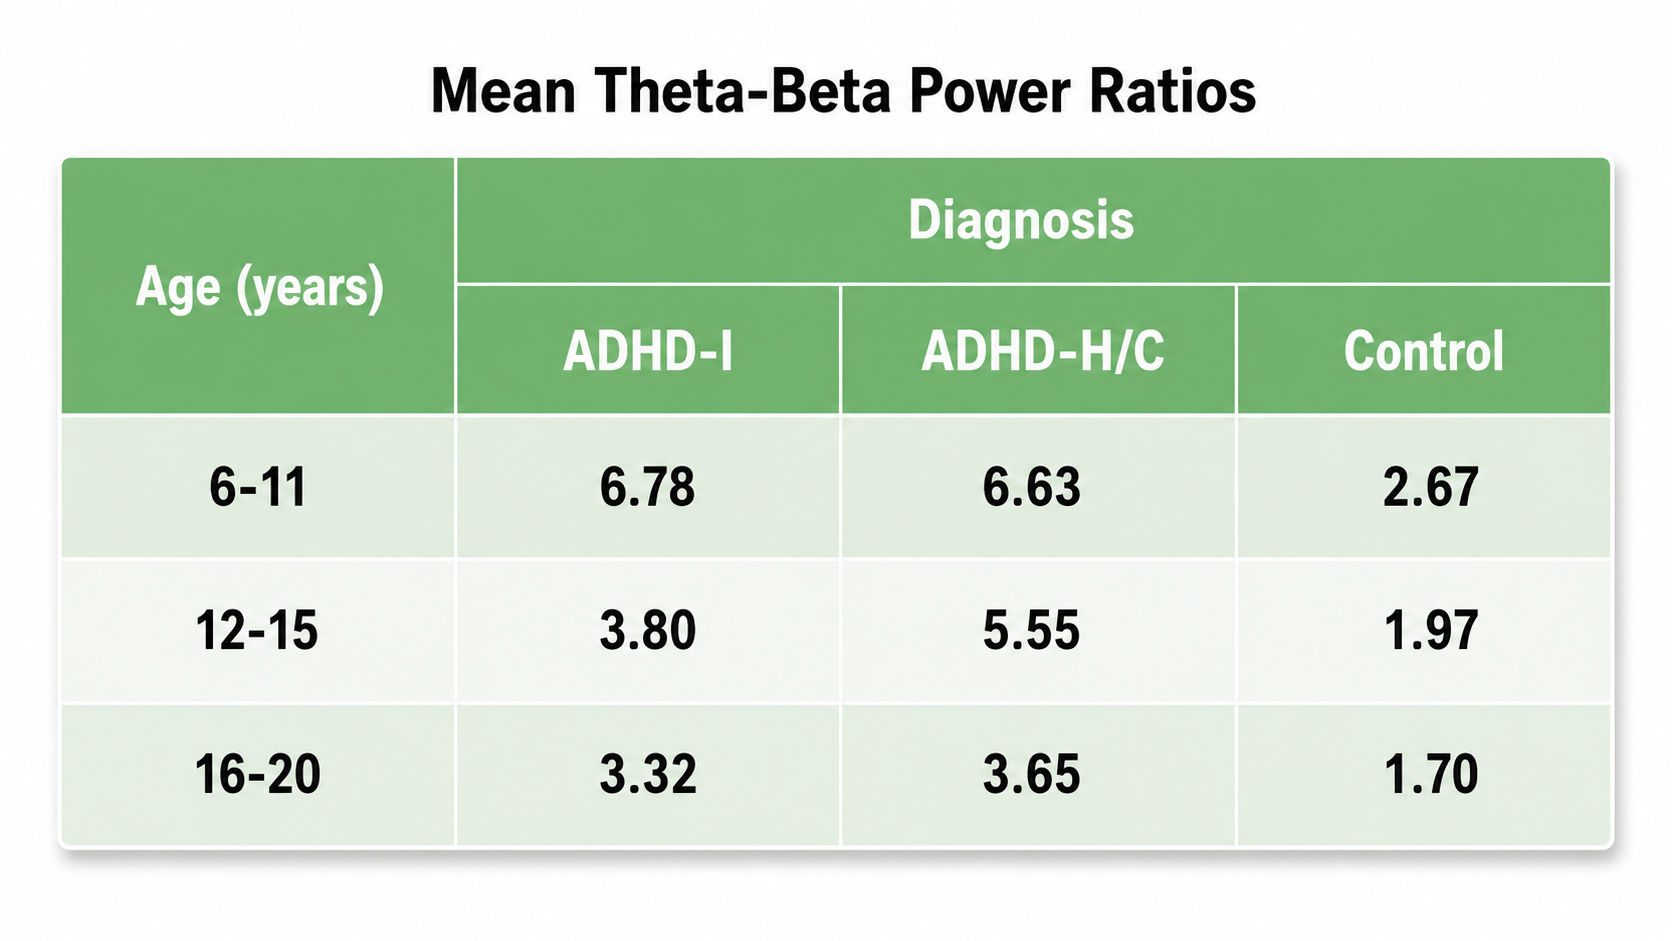
Assessment of theta activity more generally, beyond the T/B ratio in the central midline, is more challenging. As noted in van Son and colleagues (2019), assessment under task may be essential to determine these results more accurately.
Theta means different things at different sites, with temporal theta reflecting hippocampal navigation functions and frontal midline theta figuring in the attention literature. The validated theta/beta ratio is a single-channel measure recorded at Cz, and in the Snyder and colleagues validation it outperformed parent and teacher rating scales on both sensitivity and specificity. Pathologic theta is often alpha that has slowed into the theta range, so check the peak frequency before you conclude that theta is elevated.
Final Notes
The recognition of standard EEG frequencies, the analysis of such activity, and the use of this information for training and re-assessment purposes is an important part of neurofeedback practice. This section has attempted to provide an overview of this area to aid the new practitioner and the experienced clinician alike in furthering their understanding of this complex area of study.
One of the greatest benefits of neuroscience in general, and of electroencephalography and neurofeedback specifically, is that they encourage lifelong learning. If this section appeared overwhelming, with few hard and fast rules or concrete facts to hold on to, it is important to keep in mind that you can do useful and effective neurofeedback even without an in-depth understanding of this area. Understanding of EEG comes gradually through regular exposure to educational materials, lectures and workshops, work with an experienced mentor, and regular interaction with clients and their EEG recordings.
There is no substitute for viewing large numbers of EEG recordings. As mentioned in the beginning, this can start with an EEG atlas and then progress to examining your own recordings, whether a single channel, a couple of channels, or multiple channels.
Patience with your own process is an integral part of any learning experience. Think of the time it takes to learn any worthwhile skill, from swimming to learning a musical instrument to learning a new computer or phone operating system. Managing your expectations is crucial.
A Few Final Notes on the Evaluation of the EEG: Compensatory Behaviors
As mentioned earlier, when evaluating the EEG, keep in mind that when an area of the brain is not functioning optimally, other areas may increase their activity to compensate. This is also true of emotional and psychological factors, and the client may have developed coping strategies that result in unexpected EEG findings. These include excess right hemisphere activation in beta frequencies, excess alpha in left frontal areas, or lack of alpha response in posterior areas.
When training to resolve these differences in EEG activity, keep in mind that differences from typical do not necessarily mean pathological. Taking away a compensatory skill that serves the client well is not a desirable approach, and it risks causing additional disorder. It is one of the reasons for being careful when training to a quantitative EEG with database comparison. It is important to match symptoms with findings so that truly troublesome issues can be addressed.
One example of the effective application of this principle is Thatcher's surface and LORETA neurofeedback program within the NeuroGuide program. This system uses a symptom checklist matching function that correlates qEEG findings with the client's presenting symptoms and then targets only those areas with the greatest correlation to both symptoms and findings. Other systems will likely be developed to accomplish this same goal, and an experienced mentor can also provide similar guidance.
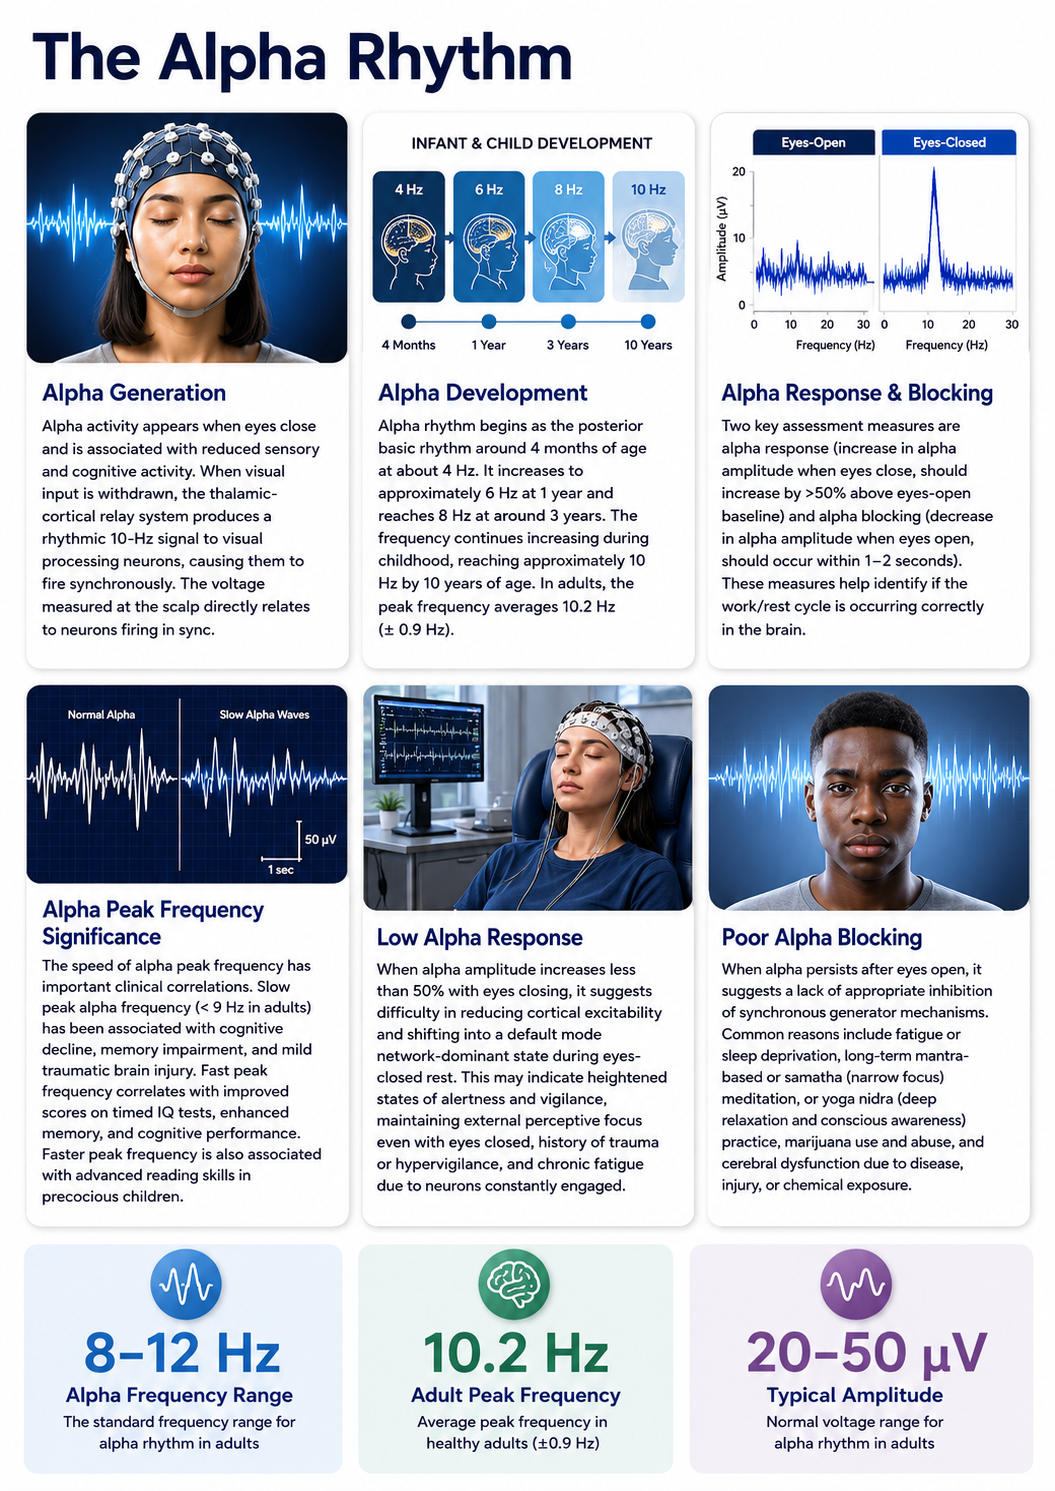
An atypical finding is not automatically a pathological one, because the brain compensates and clients develop coping strategies that show up in the record. Match findings to symptoms before you choose a target, and be cautious about training away a pattern that may be serving the client. Symptom-matching tools such as the checklist function in NeuroGuide, and the guidance of an experienced mentor, both help keep training tied to the person rather than to the database.
Single-Hertz Resolution Is Replacing Fixed Band Edges
The slow peak alpha example in this unit shows exactly why fixed band edges cause trouble. A peak sitting in the 8-Hz bin was plotted by one database as a fast theta peak rather than a slow alpha peak, purely because of where the band boundary fell. Databases such as iSynchBrain that calculate frequency and amplitude in single-hertz bins avoid that artifact, and calculating the peak across a broad range of roughly 6 to 16 Hz is becoming the more defensible practice.
Network-Level Training Instead of Site-Level Training
Local downtraining of excess delta at a lesion site is the classic approach for traumatic brain injury and stroke. Newer work with sLORETA and swLORETA neurofeedback targets network-wide dysregulation instead, including the connectivity errors that may produce the local finding in the first place. This shift raises the value of assessments that report connectivity metrics rather than amplitude alone.
Glial Networks and the Slow Oscillation
The account of the slow oscillation is moving away from a purely neuronal story. Gap junction-linked glial networks communicate almost instantaneously and can organize neuronal activity through calcium and potassium mediated slow oscillations (Alvarez-Maubecin et al., 2000). Gunkelman (2005) proposed the glial system as the coordinating mechanism, with gamma emerging only when the slow cortical gradient and delta system is bound, and Amzica and Lopes da Silva (2017) document the neuronal activation that follows glial influence.
Thalamic Delta as Plasticity Rather Than Idling
Crunelli and colleagues (2018) verified in human in vivo recordings what had been shown in rat and cat preparations, and they went further. Thalamic delta oscillations do more than regulate rhythm during inattention and NREM sleep, because they also reconfigure thalamic-cortical networks in ways that support information processing during subsequent attentive wakefulness. Slow activity during rest may therefore be doing preparatory work rather than simply idling.
The Theta/Beta Ratio Meets Network Neuroscience
Van Son and colleagues (2019) tied frontal theta/beta to mind wandering and to executive control network connectivity within the same participants. Those whose executive control connectivity dropped most during mind wandering were those whose T/B rose most, which begins to give a decades-old clinical ratio a network-level interpretation. Their work also argues that assessment under task, rather than at rest alone, may be necessary for accurate theta measurement.
Check Your Understanding
- A 15-year-old shows a posterior peak alpha frequency of 8.5 Hz. Why is this finding meaningful for an adolescent, and what would you need to know before calling it abnormal?
- Explain how a client's raw eyes-closed alpha amplitude becomes a z-score, and explain why the montage used to collect the norms matters.
- A central rhythm at 10 Hz does not block when the client opens the eyes, but it disappears when the client wiggles the fingers. What rhythm is this, and what harmonic would you expect to see in the spectral display?
- Name three artifacts that can imitate delta activity or the slow cortical gradient, and describe how you would tell each one from true cortical slowing.
- Why does an atypical qEEG finding not automatically constitute a training target, and what does symptom matching add to the decision?
Assignment
Now that you have completed this unit, identify the non-beta rhythms found within the beta range. For each one, describe its characteristic morphology, its scalp location, and the behavioral manipulation that blocks or attenuates it. Then explain how you would distinguish it from ordinary beta activity in a spectral analysis.
Glossary
alpha blocking: the attenuation or disappearance of posterior alpha activity with eye opening, sensory stimulation, movement, or active cognitive processing.
alpha response: the increase in alpha amplitude that normally accompanies eye closure, measured as the change in alpha voltage from the eyes-open to the eyes-closed condition.
alpha rhythm: an 8 to <13 Hz EEG rhythm dominant posteriorly during relaxed wakefulness with eyes closed and attenuated by eye opening.
alpha spindles: waxing-and-waning bursts of alpha-frequency EEG activity.
alpha-theta training: a neurofeedback procedure that provides feedback from alpha- and theta-band activity, commonly during relaxed eyes-closed states, to facilitate altered arousal or experiential processing.
amplitude: the magnitude of a signal's excursion from a specified reference level, reported using a stated convention such as peak, peak-to-peak, or RMS.
beta rhythm: a 13 to <30 Hz EEG rhythm, usually low amplitude, associated with alert wakefulness and active cognitive or motor processing.
beta spindles: trains of spindle-like waveforms, most often frontocentral, with a reported mean frequency of 20.6 Hz (SD = 4.1 Hz) spanning roughly 14-30 Hz. They may signal ADHD, especially with tantrums, anxiety, autism spectrum disorder (ASD), epilepsy, and insomnia.
bipolar montage: an EEG montage composed of bipolar derivations, often arranged in longitudinal or transverse chains to emphasize spatial voltage gradients.
cable sway: voltage fluctuations produced when EEG leads move through the electromagnetic field of the recording environment.
common-mode rejection: a differential amplifier's suppression of voltage shared by both inputs while amplifying the voltage difference between them.
cross-frequency synchronization (CFS): a mechanism in which waves of one frequency, such as beta or gamma, occur synchronously with the wave patterns of slower frequencies such as delta, theta, or alpha. These are often described as nested rhythms.
default mode network (DMN): a cortical network of sites located in frontal, temporal, and parietal regions that is most active during introspection and daydreaming and relatively inactive when pursuing external goals.
delta rhythm: a 0.5 to <4 Hz EEG rhythm in the tutorial convention, prominent during N3 sleep and potentially abnormal when focal or excessive in awake adults.
EEG activity: electrical activity represented in an EEG recording, described by frequency, amplitude, morphology, distribution, timing, and reactivity.
EEG power: the squared amplitude of EEG activity quantified over time or frequency, expressed as µV² for band power or µV²/Hz for power spectral density.
frequency: the number of complete cycles of a periodic phenomenon per unit time, expressed in hertz for cycles per second.
gamma rhythm: EEG activity from 30 to <80 Hz under the tutorial's working convention, associated with local cortical processing and vulnerable to muscle artifact.
gap junction: an intercellular channel formed by connexons that directly connects adjacent cell cytoplasms and permits ions and small molecules to pass.
hertz (Hz): the SI unit of frequency equal to one cycle per second.
mirror neuron system (MNS): a network of brain locations associated with learning by observation, mimicry, or imitation, whose activity is reflected in attenuation of the mu rhythm during both executed and observed movement.
mu rhythm: an 8 to <13 Hz arch-shaped or wicket-like EEG rhythm over central sensorimotor regions that attenuates with movement or somatosensory activation.
normative database: a reference set of EEG measures collected from healthy subjects across age ranges, against which an individual client's values are compared as z-scores.
nystagmus: an involuntary rhythmic side-to-side, up and down, or circular motion of the eyes that occurs with a variety of conditions.
peak alpha frequency (PAF): the frequency of greatest amplitude within the alpha band (8 to <13 Hz) during an epoch.
posterior dominant rhythm (PDR): the dominant occipital rhythm during relaxed wakefulness with eyes closed, usually in the alpha range in healthy adults and attenuated by eye opening.
quantitative EEG (qEEG): the numerical analysis of digitized EEG features, such as spectral power, asymmetry, and connectivity, sometimes compared with normative databases; no universal minimum channel count defines it.
sensorimotor rhythm (SMR): a 12 to 15 Hz rhythm recorded over sensorimotor cortex, enhanced during physical stillness and attenuated by movement; it is defined topographically and behaviorally, so its range overlaps the mu and beta bands.
skin electrodermal activity: changes in the electrical properties of the skin produced by eccrine sweat gland activity under sympathetic cholinergic control. These shifts can drift slowly enough to mimic slow cortical potential and low-delta activity.
slow cortical potential (SCP): a very slow EEG voltage shift lasting hundreds of milliseconds to seconds and reflecting changes in cortical excitability and preparation.
thalamic reticular nucleus (TRN): a thin sheet of GABAergic neurons surrounding the thalamus that gates thalamocortical transmission without projecting to the cortex, and that participates in generating the alpha rhythm and sleep spindles.
thalamocortical relay (TCR): the circuitry through which thalamic nuclei transmit sensory information to the cortex, gated by the thalamic reticular nucleus; both the sensorimotor and alpha rhythms are expressions of this system.
theta rhythm: a 4 to <8 Hz EEG rhythm associated with drowsiness and sleep transitions and, depending on location and task, memory and cognitive processing.
theta/beta ratio (TBR): EEG theta-band power divided by beta-band power using explicitly stated bands, electrodes, reference, and processing methods; it is not a diagnostic test for ADHD.
z score: a standardized value expressing how far a measurement falls from a reference mean in standard-deviation units; it is not the probability of a diagnosis or evidence that a feature requires treatment.
References
Ancoli, S., & Kamiya, J. (1978). Methodological issues in alpha biofeedback training. Biofeedback and Self-Regulation, 3(2), 159-183. https://doi.org/10.1007/BF00998900
Berger, H. (1929). Über das Elektrenkephalogramm des Menschen. Archiv für Psychiatrie und Nervenkrankheiten, 87, 527-570.
Bernier, R., Dawson, G., Webb, S., & Murias, M. (2007). EEG mu rhythm and imitation impairments in individuals with autism spectrum disorder. Brain and Cognition, 64(3), 228-237. https://doi.org/10.1016/j.bandc.2007.03.004
Boyce, R., Glasgow, S. D., Williams, S., & Adamantidis, A. (2016). Causal evidence for the role of REM sleep theta rhythm in contextual memory consolidation. Science, 352(6287), 812-816. https://doi.org/10.1126/science.aad5252
Brown, B. (1974). New mind, new body: Biofeedback: New directions for the mind. Harper & Row.
Budzynski, T. H. (1976). Biofeedback and the twilight states of consciousness. In G. E. Schwartz & D. Shapiro (Eds.), Consciousness and self-regulation. Springer.
Burkett, V. S., Cummins, J. M., Dickson, R. M., & Skolnick, M. (2005). An open clinical trial utilizing real-time EEG operant conditioning as an adjunctive therapy in the treatment of crack cocaine dependence. Journal of Neurotherapy, 9(2). https://doi.org/10.1300/J184v09n02_03
Buzsáki, G. (2006). Rhythms of the brain. Oxford University Press.
Chatrian, G. E., Bergamini, L., Dondey, M., Klass, D. W., Lennox-Buchthal, M., & Petersén, I. (1974). A glossary of terms most commonly used by clinical electroencephalographers. Electroencephalography and Clinical Neurophysiology, 37(5), 538-548. https://doi.org/10.1016/0013-4694(74)90099-6
Cox, C. L., Huguenard, J. R., & Prince, D. A. (1997). Nucleus reticularis neurons mediate diverse inhibitory effects in thalamus. Proceedings of the National Academy of Sciences, 94(16), 8854-8859. https://doi.org/10.1073/pnas.94.16.8854
Davey, C. G., & Harrison, B. J. (2018). The brain's center of gravity: How the default mode network helps us to understand the self. World Psychiatry, 17(3), 278-279. https://doi.org/10.1002/wps.20553
Green, E., & Green, A. (1977). Beyond biofeedback. Knoll Publishing Company.
Gruzelier, J. H., Holmes, P., Hirst, L., Bulpin, K., Rahman, S., van Run, C., & Leach, J. (2014). Replication of elite music performance enhancement following alpha/theta neurofeedback and application to novice performance and improvisation with SMR benefits. Biological Psychology, 95, 86-107. https://doi.org/10.1016/j.biopsycho.2013.11.001
Hardt, J., & Kamiya, J. (1976). Some comments on Plotkin's self-regulation of the electroencephalographic alpha. Journal of Experimental Psychology, 105(1), 100-108.
Hari, R., Salmelin, R., Mäkelä, J. P., Salenius, S., & Helle, M. (1997). Magnetoencephalographic cortical rhythms. International Journal of Psychophysiology, 26(1-3), 51-62. https://doi.org/10.1016/S0167-8760(97)00755-1
Hartoyo, A., Cadusch, P. J., Liley, D. T. J., & Hicks, D. G. (2020). Inferring a simple mechanism for alpha-blocking by fitting a neural population model to EEG spectra. PLOS Computational Biology, 16(4), e1007662. https://doi.org/10.1371/journal.pcbi.1007662
Hobson, H. M., & Bishop, D. V. M. (2017). The interpretation of mu suppression as an index of mirror neuron activity: Past, present and future. Royal Society Open Science, 4(3), 160662. https://doi.org/10.1098/rsos.160662
Jones, S. R., Pritchett, D. L., Sikora, M. A., Stufflebeam, S. M., Hämäläinen, M., & Moore, C. I. (2009). Quantitative analysis and biophysically realistic neural modeling of the MEG mu rhythm: Rhythmogenesis and modulation of sensory-evoked responses. Journal of Neurophysiology, 102(6), 3554-3572. https://doi.org/10.1152/jn.00535.2009
Kamiya, J. (1961). Behavioral, subjective, and physiological aspects of drowsiness and sleep. In D. W. Fiske & S. R. Maddi (Eds.), Functions of varied experience. Dorsey Press.
Kamiya, J. (1962). Conditioned discrimination of the EEG alpha rhythm in humans [Abstract]. Western Psychological Association meeting.
Kamiya, J. (1968). Conscious control of brain waves. Psychology Today, 1, 56-63.
Kamiya, J. (1969). Operant control of the EEG alpha rhythm and some of its reported effects on consciousness. In C. Tart (Ed.), Altered states of consciousness. John Wiley and Sons.
Kane, N., Acharya, J., Beniczky, S., Caboclo, L., Finnigan, S., Kaplan, P. W., Shibasaki, H., Pressler, R., & van Putten, M. J. A. M. (2017). A revised glossary of terms most commonly used by clinical electroencephalographers and updated proposal for the report format of the EEG findings. Revision 2017. Clinical Neurophysiology Practice, 2, 170-185. https://doi.org/10.1016/j.cnp.2017.07.002
Kane, N., Acharya, J., Beniczky, S., Caboclo, L., Finnigan, S., Kaplan, P. W., Shibasaki, H., Pressler, R., & van Putten, M. J. A. M. (2019). Corrigendum to "A revised glossary of terms most commonly used by clinical electroencephalographers and updated proposal for the report format of the EEG findings. Revision 2017." Clinical Neurophysiology Practice, 4, 133. https://doi.org/10.1016/j.cnp.2019.06.001
Kuhlman, W. N. (1978). Functional topography of the human mu rhythm. Electroencephalography and Clinical Neurophysiology, 44(1), 83-93. https://doi.org/10.1016/0013-4694(78)90107-4
Marcuse, L. V., Fields, M. C., & Yoo, J. J. (2016). Rowan's primer of EEG (2nd ed.). Elsevier.
Monastra, V. J., Lubar, J. F., & Linden, M. (2001). The development of a quantitative electroencephalographic scanning process for attention deficit-hyperactivity disorder: Reliability and validity studies. Neuropsychology, 15(1), 136-144. https://doi.org/10.1037/0894-4105.15.1.136
Monastra, V. J., Lubar, J. F., Linden, M., VanDeusen, P., Green, G., Wing, W., Phillips, A., & Fenger, T. N. (1999). Assessing attention deficit hyperactivity disorder via quantitative electroencephalography: An initial validation study. Neuropsychology, 13(3), 424-433. https://doi.org/10.1037/0894-4105.13.3.424
Montirosso, R., Piazza, C., Giusti, L., Provenzi, L., Ferrari, P. F., Reni, G., & Borgatti, R. (2019). Exploring the EEG mu rhythm associated with observation and execution of a goal-directed action in 14-month-old preterm infants. Scientific Reports, 9, 8975. https://doi.org/10.1038/s41598-019-45495-3
Nicholson, A. A., Densmore, M., McKinnon, M. C., Neufeld, R. W. J., Frewen, P. A., Théberge, J., Jetly, R., Richardson, J. D., & Lanius, R. A. (2019). Machine learning multivariate pattern analysis predicts classification of posttraumatic stress disorder and its dissociative subtype: A multimodal neuroimaging approach. Psychological Medicine, 49(12), 2049-2059. https://doi.org/10.1017/S0033291718002866
Nicholson, A. A., Ros, T., Densmore, M., Frewen, P. A., Neufeld, R. W. J., Théberge, J., Jetly, R., & Lanius, R. A. (2020). A randomized, controlled trial of alpha-rhythm EEG neurofeedback in posttraumatic stress disorder: A preliminary investigation showing evidence of decreased PTSD symptoms and restored default mode and salience network connectivity using fMRI. NeuroImage: Clinical, 28, 102490. https://doi.org/10.1016/j.nicl.2020.102490
Nicholson, A. A., Ros, T., Jetly, R., & Lanius, R. (2020). Regulating posttraumatic stress disorder symptoms with neurofeedback: Regaining control of the mind. Journal of Military, Veteran and Family Health, 6(S1), 3-15. https://doi.org/10.3138/jmvfh.2019-0032
Okada, S., Urakami, Y., Kato, T., Tsuji, M., & Inoue, R. (1992). The Rolandic mu rhythm: A clinical study of the atypical group. Clinical Electroencephalography, 23(1), 10-18. https://doi.org/10.1177/155005949202300105
Peniston, E. G., & Kulkosky, P. J. (1989). Alpha-theta brain wave training and beta-endorphin levels in alcoholics. Alcoholism: Clinical and Experimental Research, 13, 271-279. https://doi.org/10.1111/j.1530-0277.1989.tb00325.x
Peniston, E. G., & Kulkosky, P. J. (1990). Alcoholic personality and alpha-theta brainwave training. Medical Psychotherapy, 3, 37-55.
Petersén, I., & Eeg-Olofsson, O. (1971). The development of the electroencephalogram in normal children from the age of 1 through 15 years: Non-paroxysmal activity. Neuropädiatrie, 2(3), 247-304. https://doi.org/10.1055/s-0028-1091786
Schoppenhorst, M., Brauer, F., Freund, G., & Kubicki, S. (1980). The significance of coherence estimates in determining central alpha and mu activities. Electroencephalography and Clinical Neurophysiology, 48(1), 25-33. https://doi.org/10.1016/0013-4694(80)90040-1
Scott, W., & Kaiser, D. (2005). Effects of an EEG biofeedback protocol on a mixed substance abusing population. The American Journal of Drug and Alcohol Abuse, 31(3), 455-469. https://doi.org/10.1081/ada-200056807
Siebenhühner, F., Wang, S. H., Palva, J. M., & Palva, S. (2016). Cross-frequency synchronization connects networks of fast and slow oscillations during visual working memory maintenance. eLife, 5, e13451. https://doi.org/10.7554/eLife.13451
Snyder, S. M., Quintana, H., Sexson, S. B., Knott, P., Haque, A. F. M., & Reynolds, D. A. (2008). Blinded, multi-center validation of EEG and rating scales in identifying ADHD within a clinical sample. Psychiatry Research, 159(3), 346-358. https://doi.org/10.1016/j.psychres.2007.05.006
Sterman, M. B., & Egner, T. (2006). Foundation and practice of neurofeedback for the treatment of epilepsy. Applied Psychophysiology and Biofeedback, 31(1), 21-35. https://doi.org/10.1007/s10484-006-9002-x
Sterman, M. B., & Wyrwicka, W. (1967). EEG correlates of sleep: Evidence for separate forebrain substrates. Brain Research, 6(1), 143-163. https://doi.org/10.1016/0006-8993(67)90186-2
Tallgren, P., Vanhatalo, S., Kaila, K., & Voipio, J. (2005). Evaluation of commercially available electrodes and gels for recording of slow EEG potentials. Clinical Neurophysiology, 116(4), 799-806. https://doi.org/10.1016/j.clinph.2004.10.001
van Son, D., de Rover, M., De Blasio, F. M., van der Does, W., Barry, R. J., & Putman, P. (2019). Electroencephalography theta/beta ratio covaries with mind wandering and functional connectivity in the executive control network. Annals of the New York Academy of Sciences, 1452(1), 52-64. https://doi.org/10.1111/nyas.14180
Walter, W. G. (1936). The location of cerebral tumours by electro-encephalography. The Lancet, 228(5893), 305-308. https://doi.org/10.1016/S0140-6736(01)05173-X
Walter, W. G., & Dovey, V. J. (1944). Electro-encephalography in cases of sub-cortical tumour. Journal of Neurology, Neurosurgery, and Psychiatry, 7(3-4), 57-65. https://doi.org/10.1136/jnnp.7.3-4.57
Weise, R., von Mengden, I., Glos, M., Garcia, C., & Penzel, T. (2013). P 153. Influence of transcranial slow oscillation current stimulation (tSOS) on EEG, sleepiness and alertness. Clinical Neurophysiology, 124(10), e137. https://doi.org/10.1016/j.clinph.2013.04.230
Wyrwicka, W., & Sterman, M. B. (1968). Instrumental conditioning of sensorimotor cortex EEG spindles in the waking cat. Physiology & Behavior, 3(5), 703-707. https://doi.org/10.1016/0031-9384(68)90139-X
Yin, S., Liu, Y., & Ding, M. (2016). Amplitude of sensorimotor mu rhythm is correlated with BOLD from multiple brain regions: A simultaneous EEG-fMRI study. Frontiers in Human Neuroscience, 10, 364. https://doi.org/10.3389/fnhum.2016.00364