Demonstration and Case Example Exercises for Practice
What You Will Learn in This Chapter
In the Steps in Protocol Development and Treatment Planning unit, you learned a systematic decision tree for selecting protocols and treatment plans based on assessment data. This unit brings that process to life through three detailed case examples showing how clinicians translate assessment findings into individualized, evidence-based neurofeedback treatment plans.
You will also observe a brief demonstration of neurofeedback training and explore how neuroscience, normative databases, and peer-reviewed outcome research guide every step of clinical decision-making.
BCIA Blueprint Coverage: This unit addresses VII. Developing Treatment Protocols - C. Demonstration and Case Example Exercises (7C).
Learning Objectives
After completing this section, you will be able to:
Describe the steps/decision tree process for selecting neurofeedback protocols based on client assessment data.
Explain how qEEG findings, LORETA analyses, and normative databases inform protocol selection and training planning.
Interpret case example data to understand the rationale for specific neurofeedback interventions.
Discuss the roles of neuroscience and peer-reviewed outcome studies in developing evidence-based treatment protocols.
This unit presents a brief demonstration of neurofeedback training followed by three case examples that walk through the steps/decision tree for applying client assessment data to protocol selection and treatment planning. Each case illustrates how evidence-based reasoning, neuroscience, and individualized assessment converge in real clinical practice.

Please click on the button below to hear a full-length lecture.
Chapter Lecture: Treatment Demonstration
Brief Demonstration of Neurofeedback Training
Neurofeedback Training to Increase 12-15 Hz EEG Activity
This section covers a video demonstration of a standard neurofeedback session, including the training setup, feedback signals, threshold management, and the concept of passive volition. The video features Travis (the clinician's husband) seated in a typical training chair, with Cortney Amundson of Mindful Restoration in Edina, Minnesota, serving as the clinician. Before this session, Travis completed a brief abbreviated-Q assessment known as the NewQ, which identified an appropriate training protocol. The protocol targets an increase in 12-15 Hz EEG activity—known as the sensorimotor rhythm (SMR), a spindle-shaped oscillation detected from the sensorimotor strip when individuals reduce attention to sensory input and decrease motor activity—at the Cz electrode over the sensorimotor cortex. Alongside this SMR uptraining, two additional signals are set for inhibit training, a technique that establishes a threshold to limit activity in selected frequency bands: in this case, a 4-8 Hz theta inhibit and a 22-36 Hz high-beta inhibit. These two ranges are the filter settings used in this session rather than claims about where the bands end; this curriculum places theta at 4-7 Hz and high beta (beta 4) at 25-38 Hz.
This combination approach—reinforcing one frequency band while simultaneously inhibiting others—is among the most widely used neurofeedback protocols. Its evidence base is uneven: the largest double-blind, sham-controlled trial of a comparable frequency-band protocol found no advantage over sham on its primary outcome, although both groups improved substantially (Arnold et al., 2021). The clinician instructs Travis to observe the training screen, which displays a video in normal mode when all training goals are met and gradually shifts to a screened or masked mode when his EEG activity drifts from the target. Travis's task is to watch the video and keep it playing in normal mode by regulating his EEG activity. As he progresses, the clinician manually raises the threshold after first informing him of the change, encouraging him to adapt further to maintain unimpeded visual and auditory reward.
In this demonstration, threshold adjustments are made manually and only when the client's progress warrants them. Most software also offers automatic thresholding, which this clinician has chosen not to use, because an automatic adjustment delivers a set percentage of reward regardless of participation and so removes the requirement to demonstrate skill acquisition. Although the clinician instructs Travis simply to observe the screen, he is actively engaged in skill acquisition through a process called passive volition. Before the session, the requirements for success were described in detail so Travis would understand what EEG changes produce positive feedback. Clinical accounts of the method hold that effortful attempts to "make" the feedback occur impede learning; instead, the client attends to internal states, noticing which feelings correspond to full reward, and alters EEG activity in a non-cognitive, non-volitional manner.
The rationale offered for this approach is that the central nervous system regions responsible for these changes are not under conscious voluntary control. By simply attending to the feedback and remaining alert, the brain's own regulatory mechanisms gradually acquire the targeted skill. Once responses become more dependable, the clinician raises the threshold goals to encourage further change in the desired direction, as demonstrated in the video.
Video © J. S. Anderson.
Neurofeedback training provides real-time visual and auditory feedback of EEG activity to help clients learn self-regulation. The clinician sets training goals, selects inhibit bands, and manually adjusts thresholds based on the client's progress. The learning process relies on passive volition: the client attends to the feedback without consciously forcing change, allowing non-conscious brain mechanisms to achieve the desired EEG shifts. Automatic threshold adjustments are avoided because they would eliminate the requirement for genuine skill acquisition.
Simplified Flowchart
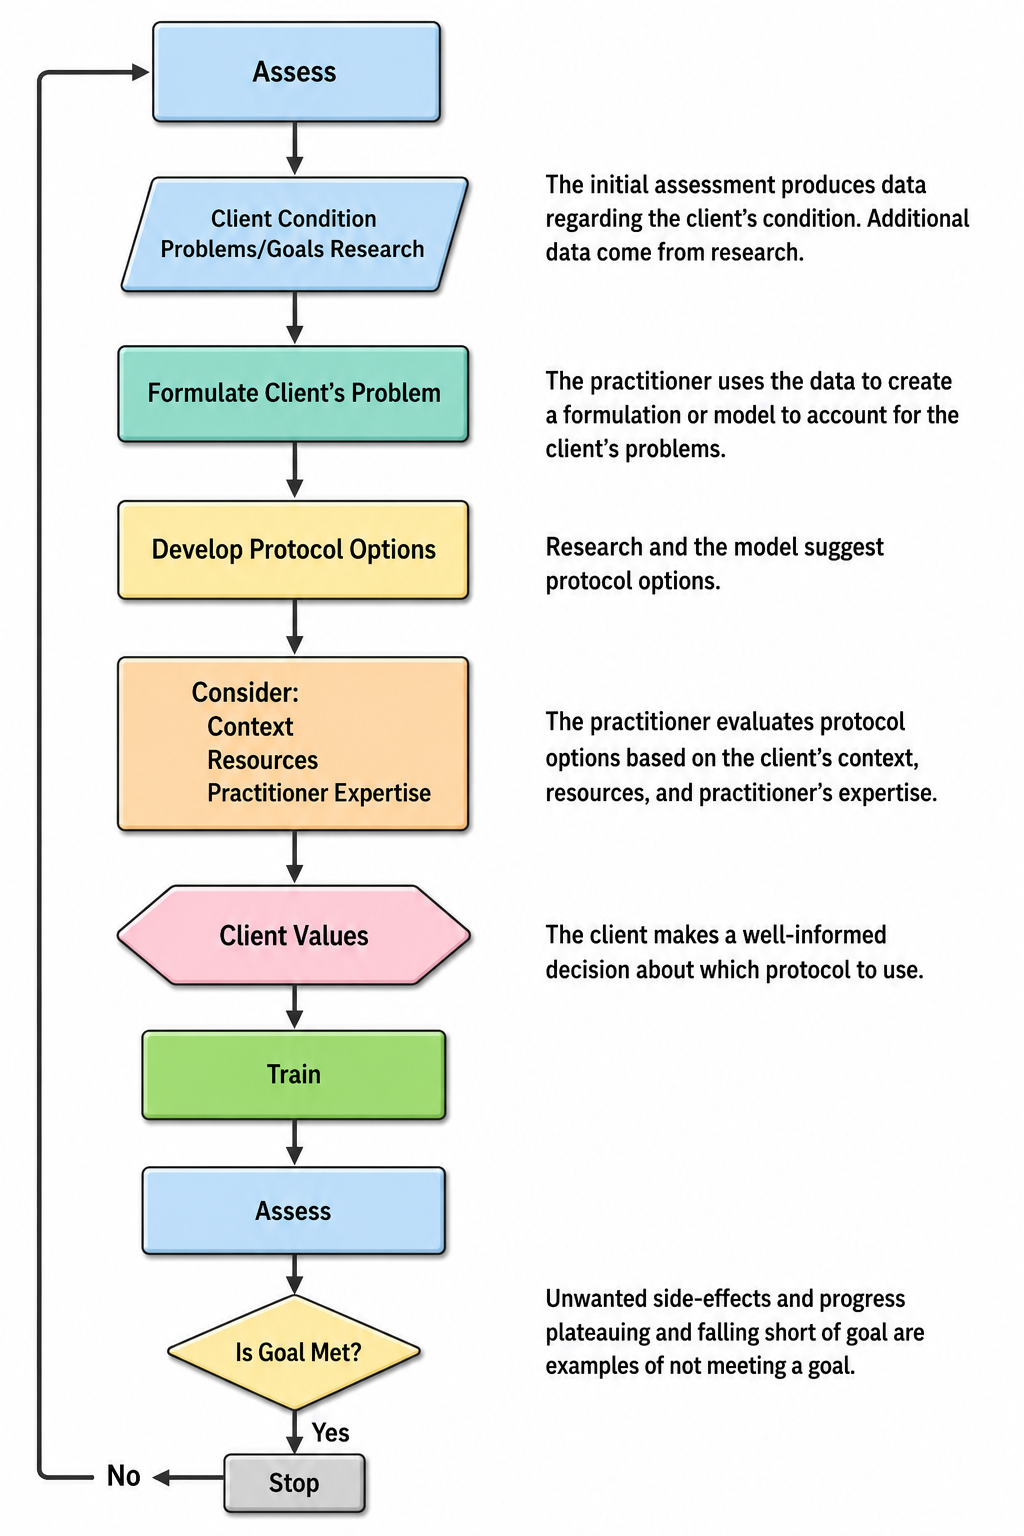
The flowchart below outlines the decision tree that guided all three case examples in this unit. It provides a visual roadmap for translating assessment data into protocol selection, giving you a reference point as you work through each case.
Patient Example A
Patient Information
| Name: Client B | Date: 02/20/2014 |
| Exam#: Client B 10001 | Ref. By: Self |
| Age: 57.51 | Test Site: MNI |
| Gender: Male | Handedness: Left |
Recording
| Analysis Length: 01:42 | Ave. LE Split-Half Reliability: 0.98 |
| Ave. LE Test-Retest Reliability: 0.94 | Eyes: Closed |
Medication
None noted.
History
This section covers Client B's clinical history, presenting symptoms, and the injury events that shaped his current condition. Client B, a 57-year-old left-handed male, presents with a diagnosis of traumatic brain injury (TBI) stemming from multiple head impacts during high school and college football. The most significant injury was a helmet-on-helmet collision to the left lateral frontal area during a college game, which caused approximately 10 minutes of loss of consciousness followed by confusion and dizziness. Despite these symptoms, he returned to play in the second half after sitting out the remainder of the first.
Lingering symptoms persisted through the summer after graduation, and although they faded over time, Client B reports never fully returning to his "normal self." He nonetheless built a successful business career. His current complaints include persistent depression with poor motivation, significant difficulty managing day-to-day activities, and a volatile temper that he identifies as the primary cause of three failed marriages.
His broader symptom profile includes headaches, feelings of loneliness, memory problems, occasional dizziness, mild-to-moderate generalized anxiety, intermittent panic, difficulties with sequential processing, emotional sensitivity, social discomfort, sleep-onset and maintenance problems, slow processing speed, poor reading comprehension, difficulty grasping abstract concepts, and an overall lack of well-being. This extensive constellation of symptoms is consistent with the long-term effects of repeated TBI, a pattern frequently reported in athletes with histories of contact sports. At the group level, however, pooled studies find little overall difference in cognitive outcome between athletes with multiple mild head injuries and those with a single one, with effects confined to delayed memory and executive functioning, so a symptom profile like this one is compatible with a repeated-injury history without being diagnostic of it.
Visual Inspection of 19-Channel EEG
Eyes-Closed Condition
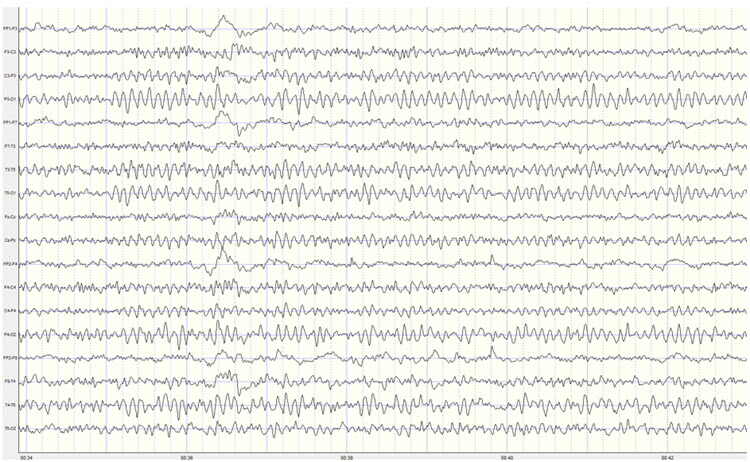
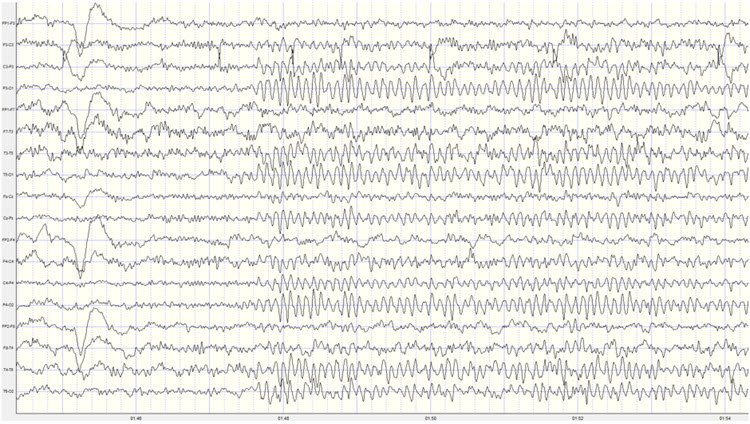
This section walks through the visual inspection findings from multiple montages in the eyes-closed condition, highlighting abnormal slow activity and artifacts that inform later quantitative analysis. The longitudinal bipolar montage reveals a good-quality recording with moderate eye movement artifact and only intermittent movement and EMG contamination. No mains or equipment artifacts are present. A clearly defined posterior rhythm appears in derivations including temporal, parietal, and occipital electrodes, with a somewhat inconsistent frequency ranging from 8-10 Hz. Amplitudes generally fall in the 10-15 µV range, with bursts reaching 40 µV and occasionally exceeding 55 µV.
A notable pattern of slow activity emerges in left lateral frontal derivations—specifically Fp1-F3, Fp1-F7, F7-T3, and T3-T5—along with corresponding slow activity in right temporal and temporal-parietal derivations. Frontal beta activity is present in the 15-20 Hz range. In the middle of the recording, a period of apparent light or stage-one sleep (N1 in current AASM terminology) appears, interspersed with brief awakenings. The sleep EEG shows occasional vertex sharp waves but no other sleep characteristics, and Client B returns to an awake eyes-closed state for the remainder of the recording.
The average reference montage confirms a well-developed posterior rhythm with maximum voltage at O1 and O2, accompanied by additional activity at T5, T6, P3, and P4. Notably, voltage at T6 approaches that of the occipital sensors. The frequency continues to fluctuate between 8-10 Hz, with voltage in the 10-20 µV range and bursts regularly exceeding 40 µV. Slow activity is visible in left and central frontal, left central, right frontal, and right parietal-occipital areas, with frequencies varying between 2-4 Hz. Some alpha activity appears in frontal sensors, particularly at F3 and Fz.
The Laplacian montage also reveals the posterior rhythm in occipital and parietal areas and shows a mixed pattern at T4 and T6 electrodes, with slower delta and theta frequencies interspersed with alpha and beta. Left-sided slow activity is again evident. The linked ears montage shows broadly distributed alpha activity, suggesting reference contamination. The highest posterior rhythm voltage appears in the occipital electrodes, and a pronounced ECG artifact is likely to produce excess 1 Hz statistical values in z-score analysis—this should be disregarded. The sequential eyes-open, eyes-closed recording demonstrates a typical alpha response upon eyes closing and appropriate alpha blocking upon eyes opening across 15-30 second segments.
Eyes-Open Condition
Visual inspection of the eyes-open longitudinal bipolar montage shows appropriate attenuation of the posterior rhythm upon eyes opening. Background activity includes mixed frequencies—delta, theta, and beta in the 20-30 Hz range. Alpha intrusions appear frequently in central-parietal, temporal-parietal, and parietal-occipital derivations, while the slow patterns noted earlier persist in frontal-central, central-parietal, and right-sided temporal-parietal and parietal-occipital derivations.
The average reference montage shows more widely distributed alpha activity, possibly reflecting the generalizing effect of averaging all electrodes for the reference. Otherwise, findings are consistent with the longitudinal bipolar montage. The Laplacian montage confines alpha activity mostly to occipital areas while revealing the mixed slow and fast activity in the T6 electrode noted during the eyes-closed recording. The linked ears montage shows a generalized pattern of 9-10 Hz activity mixed with beta and theta frequencies.
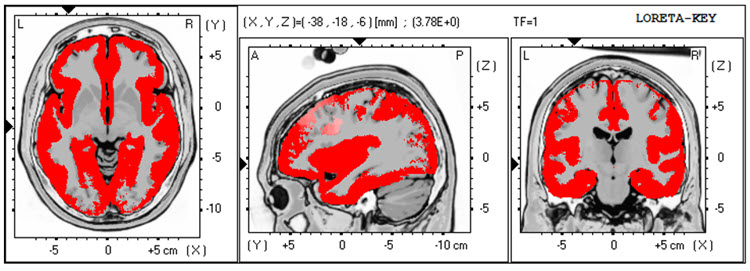
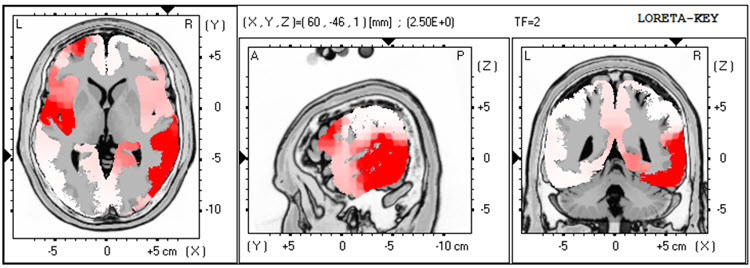
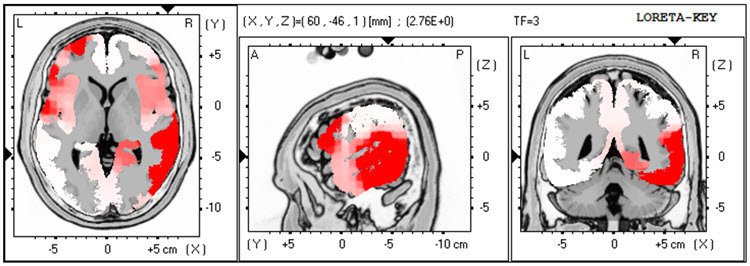
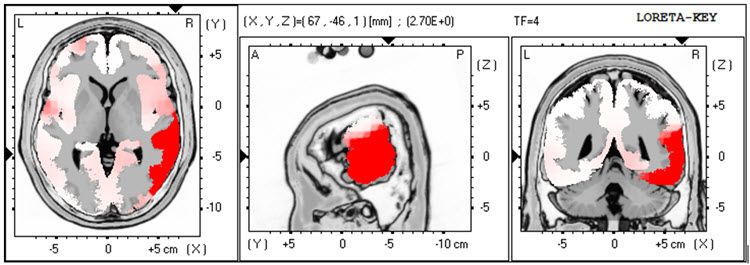
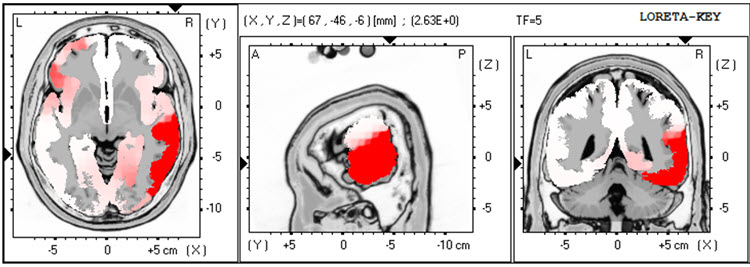
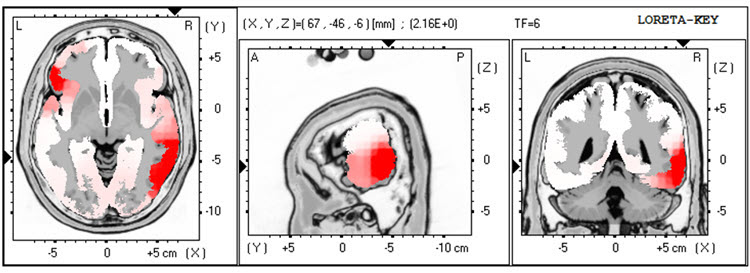
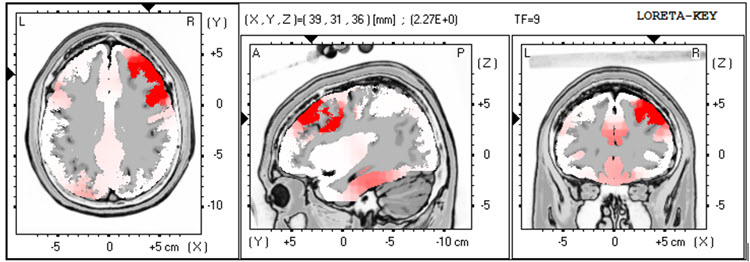
LORETA (low resolution electromagnetic tomography) is a mathematical inverse solution developed by Pascual-Marqui et al. (1994) that identifies the cortical sources of quantitative EEG data acquired from 19 or more scalp electrodes. In this case, the LORETA analysis shows broadly distributed 1 Hz activity (expected due to ECG artifact) and lateralized left frontal and right posterior temporal/parietal areas exceeding 2 standard deviations at 2-6 Hz, as well as right lateral frontal 9 Hz activity exceeding 2 standard deviations.
Quantitative Analysis
This section covers the quantitative EEG findings, including topographic maps, statistical analyses, and the TBI discriminant analysis. Analysis of the absolute power topographic maps from the average reference montage in the eyes-closed condition shows maximum voltage in the 8-12 Hz frequency band at 9 Hz in bilateral occipital electrodes, followed by 10 Hz at approximately half the power. A clear right posterior temporal/parietal activity distribution is visible from 2-15 Hz, consistent with the visual inspection findings.
The statistical topographic maps from the eyes-closed average reference montage reveal broad distribution of 2.5-3 SD activity at 1 Hz, attributable to the ECG artifact noted earlier and therefore disregarded. Excess activity appears in Fp1, F7, C3, Fz, F4, T4, T6, Pz, O1, and O2 electrodes from 2-3 Hz, with lesser right temporal and posterior excess from 4-5 Hz. The greatest deviations—exceeding 2.5-3 SD—occur at F4, T6, and O2. Additional excess bilateral frontal and left frontal/central and right parietal/occipital 9 Hz activity is present, with the greatest deviation between F3, Fz, C3, and Cz. Moderate excess occipital and right parietal 12-14 Hz activity and some 19-22 Hz excesses are also noted.
The peak alpha frequency is slightly slow but does not exceed -1 SD at any location. The Laplacian montage shows the 1 Hz ECG artifact and maximum deviation from 2-5 Hz at T6, with lesser deviations in left lateral frontal, frontal, central, parietal, and occipital areas. The linked ears montage displays more distribution and greater deviation across most frequencies, with a notably more lateralized presentation of excess slow activity—possibly due to reference contamination from the T4 and T6 electrodes near the right-sided reference. Coherence abnormalities appear pronounced but are likely unreliable due to this reference contamination.
Given Client B's history of multiple head impacts, a Traumatic Brain Injury Discriminant Analysis was performed. It yielded a TBI discriminant score of -0.43, a TBI probability index of 80.0%, and a TBI severity index of 5.44. On this 0-10 scale—where 0 represents mild severity and 10 is severe—Client B's score falls in the moderate range. These quantitative findings provide objective metrics that complement the clinical history and visual EEG inspection, strengthening the rationale for neurofeedback intervention.
Conclusions
Client B's presentation reveals multiple issues that likely relate to the EEG abnormalities observed in this recording. The slow activity in left frontal areas and the combination of slow activity with higher-than-typical alpha amplitude in the right posterior temporal/parietal areas are particularly noteworthy. Although the slowing of peak alpha frequency does not reach statistical significance, working to normalize this frequency may still improve his cognitive function—a rationale drawn from the literature relating alpha frequency to information processing speed (Nunez & Srinivasan, 2006). That literature is mixed: individual peak alpha frequency correlates with some measures of general cognitive ability and not with others, and the reports that pair a trained rise in peak alpha with cognitive gain are small, uncontrolled pilot studies rather than controlled demonstrations that the change causes the gain.
Recommendations
A course of neurofeedback training is recommended. Initial training will use 4-channel z-score training—a strategy that attempts to normalize brain function with respect to mean values in a normative database, downtraining or uptraining EEG amplitudes that deviate 2 or more standard deviations from database means (Thatcher et al., 2019). The clinician will rotate between electrode combinations: first Fz, Pz, T3, and T4; then F3, F4, T5, and T6; followed by C3, C4, P3, and P4. Additional protocols may be introduced as training progresses.
Summary of Client Responses to Training
Client B completed 25 sessions of neurofeedback over 15 months, scheduled weekly at first and less frequently during the second half of that period. He also used a home training device for heart rate variability (HRV) biofeedback and an audiovisual entrainment (AVE) device. Training locations included 6 sessions at Fz/Pz/T3/T4, 2 sessions at Fz/Pz/P3/P4, 11 sessions at T5/T6/O1/O2, and 1 session at F3/F4/P3/P4—all using 4-channel z-score training. He also received 2 sessions of 4-channel slow cortical gradient training and 3 sessions of C3/C4 2-channel difference and sum training with variable reward frequency.
Alpha-theta training was attempted on several occasions, but Client B found it uncomfortable, so the clinician transitioned within each of those sessions to one of the other protocols. This flexibility illustrates an important clinical principle: treatment plans must adapt to the individual client's responses and preferences while remaining grounded in assessment data.
Client B reports significant improvement in focus and mood regulation. He is in a new relationship and describes his temper as much more manageable, crediting the combination of neurofeedback and couples counseling for improved communication skills. He also notes increased energy, better sleep, and enhanced cognitive function. Although occasional headaches persist, their intensity and duration have decreased substantially. He feels his presenting concerns have been resolved and requests a follow-up EEG to determine whether objective brain data reflect the subjective improvements he is experiencing.
Second Recording
| Analysis Length: 01:32 | Ave. LE Split-Half Reliability: 0.97 |
| Ave. LE Test-Retest Reliability: 0.94 | Eyes: Closed |
Visual Inspection of Follow-Up 19-Channel EEG
Eyes-Closed Condition
This section reviews the follow-up EEG, comparing it with the initial recording to evaluate the effects of neurofeedback training. The longitudinal bipolar montage shows a good-quality recording with typical eye movement artifact and brief episodes of apparent drowsiness or light sleep. No EMG artifact, mains, or exogenous artifacts are present. Notably, this recording appears significantly lower in amplitude than the initial one—a change worth tracking because amplitude shifts can reflect meaningful changes in cortical regulation.
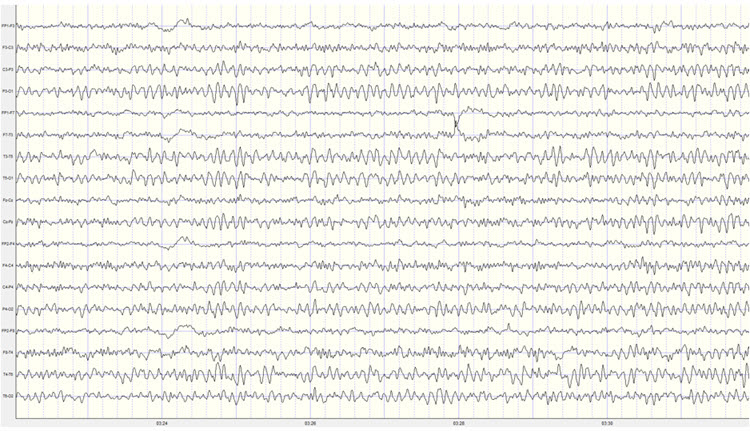
A well-developed posterior rhythm appears primarily in parietal and occipital derivations, with some temporal-parietal and central-parietal activity. Spindling beta in the 20-25 Hz range occasionally appears in frontal-central derivations. Some slow activity persists in left lateral frontal and right posterior temporal/parietal areas, though the posterior rhythm now shows a consistent frequency of 9 Hz with a well-developed sinusoidal shape and amplitudes generally in the 20-30 µV range. The posterior rhythm appears quite symmetrical between hemispheres, with maximum voltage in parietal-occipital derivations.
The average reference montage shows more generalized alpha activity—possibly reflecting the averaging method—with highest voltage at O1 and O2, closely followed by T6. The Laplacian montage confirms the posterior rhythm in occipital sensors and reveals beta activity in the 15-25 Hz range in frontal and central sensors, along with residual slow activity in left frontal and right parietal areas. The linked ears montage shows widespread alpha across all sensors, including bilateral reference channels, confirming reference contamination. The sequential eyes-open/eyes-closed recording demonstrates clear alpha response upon eyes closing and immediate alpha blocking upon eyes opening.
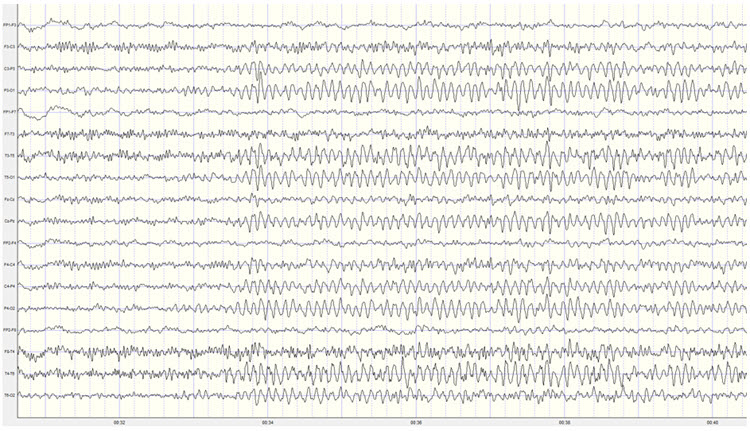
Eyes-Open Condition
Visual inspection of the eyes-open longitudinal bipolar montage shows appropriate posterior rhythm attenuation with typical eyeblink and eye movement artifact. Beta activity in the 15-25 Hz range appears in all electrode derivations, with occasional but infrequent alpha intrusions that do not persist. The average reference montage shows essentially the same findings, though some persistent mixed-frequency activity is visible at T4 and T6, with alpha and beta frequencies occurring simultaneously. The Laplacian montage reveals higher-amplitude mixed-frequency activity at F7, T4, and T6 at approximately 8-9 Hz, 13 Hz, and 23 Hz, while the linked ears montage again shows broadly distributed, highly synchronous activity likely representing reference contamination.
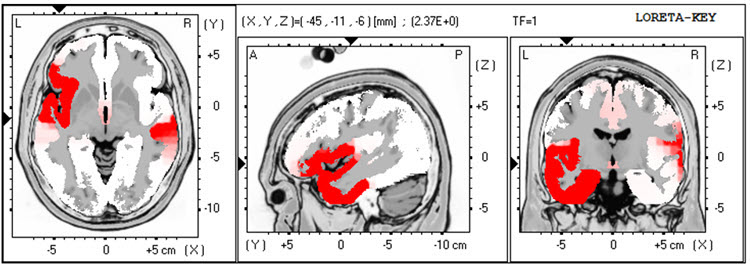
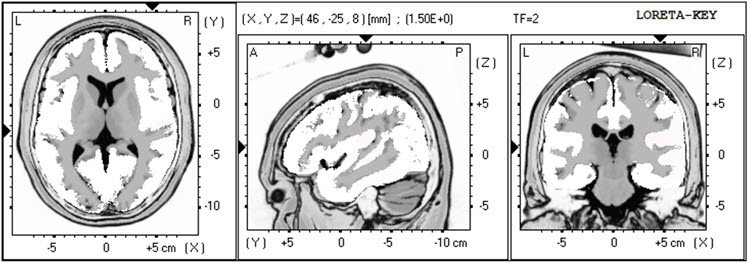
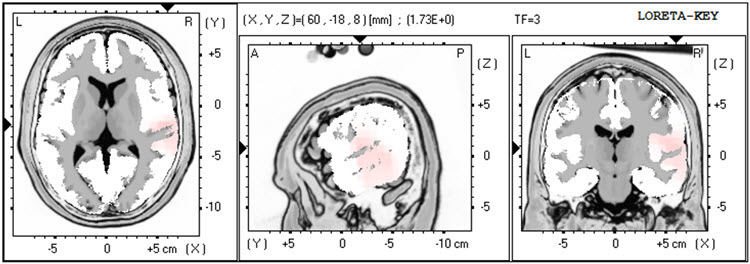
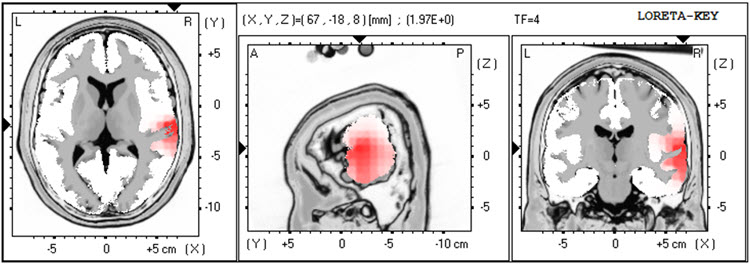
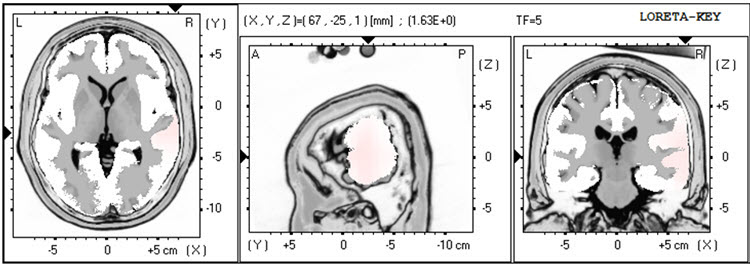
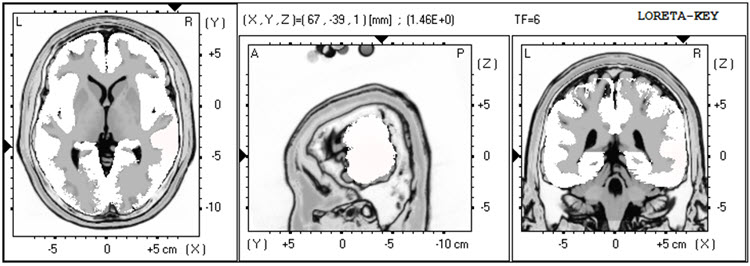
LORETA analysis of the follow-up EEG shows the same lateralization exceeding 2 standard deviations seen in the first recording, but now limited to 1 Hz in left lateral frontal and right temporal areas—a notable improvement. This activity is absent at 2-3 Hz, though excess activity appears in the right temporal area at 4 Hz (again exceeding 2 SD). Minimal excess activity at 9 Hz is present in the bilateral inferior temporal, fusiform, and parahippocampal gyri. Compared to the initial assessment, these findings represent a substantial reduction in abnormal activity across most frequency bands.
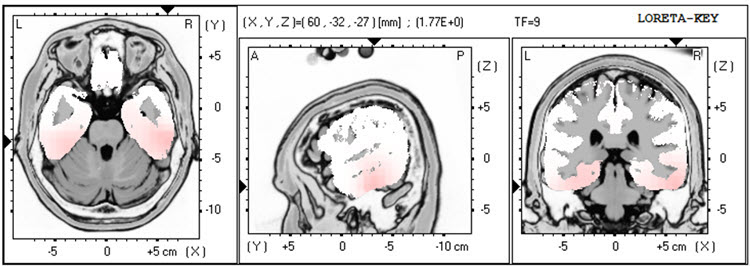
Analysis of the eyes-closed average reference montage absolute power topographic maps from the second recording shows maximum voltage in the 8-12 Hz band at 9 Hz, with power approximately two-thirds that of the first recording. Excess activity exceeding 2 standard deviations appears at F7 and T4, with lower deviations at Fp1, F8, Cz, C4, and T6, and additional excess at 2-3 Hz at T4 and T6. The 1-1.5 SD range shows persistence in left frontal, central, and bilateral posterior regions, along with a small area of excess at 13 Hz at T6 and O2. These findings are significantly diminished from the first recording and likely reflect the behavioral improvements Client B reports.
Some excess activity from 21-23 Hz appears associated with the Fz electrode, but the Laplacian montage localizes this to Cz, indicating the broader distribution in the average reference montage almost certainly results from reference contamination. The linked ears montage displays a broadly distributed excess activity pattern from 6-15 Hz across frontal areas, again reflecting contamination, and the peak alpha frequency remains within the normal range at most locations, exceeding -1 SD only at T4. The TBI discriminant analysis shows very similar results to the first recording: a TBI discriminant score of -0.03, a TBI probability index of 90%, and a TBI severity index of 5.42. While TBI discriminant values remain largely unchanged, the topographic improvements—particularly the reduction of excess slow activity—align well with Client B's subjective reports of clinical improvement.
Conclusions
The follow-up EEG results are substantially improved and support Client B's self-report of improvement in multiple areas of functioning. He was encouraged to return for additional sessions if problematic symptoms re-emerge. He was also encouraged to continue heart rate variability training at home and to keep using his audiovisual entrainment device. This case demonstrates how pre- and post-training EEG data can objectively document treatment response and guide decisions about whether to continue, modify, or conclude a neurofeedback course.
Client B, a 57-year-old male with TBI from contact sports, presented with depression, mood dysregulation, and cognitive complaints. Initial qEEG revealed lateralized slow activity in left frontal and right temporal/parietal areas, with a TBI severity index of 5.44 (moderate). After 25 sessions of 4-channel z-score training (supplemented by HRV biofeedback and AVE), he reported significant improvements in focus, mood regulation, energy, sleep, and cognition. Follow-up EEG demonstrated substantially diminished excess activity across most frequency bands, objectively supporting his reported clinical gains.
Patient Example B
History
This section covers TR's clinical history, presenting complaints, and the assessment process that guided his neurofeedback treatment. TR is a 41-year-old man who was injured in a motor vehicle collision two years before his referral. He sustained a mild concussion and soft tissue injuries that prevented him from returning to full-time work as an independent construction contractor, though he gradually resumed part-time duties.
TR was referred primarily for anger and aggressive behavior directed at his insurance provider, whom he believed had inadequately compensated him both immediately after the injury and on an ongoing basis. Beyond this specific grievance, TR had become much more reactive to everyday frustrations such as traffic. He described his experience of anger vividly, saying his "brain was on fire." He also reported that his head felt "heavy and full" most of the time and that he had difficulty falling asleep, though he denied any cognitive deficits.
These emotional, behavioral, and somatic symptoms developed gradually after the collision but appeared to worsen pre-existing tendencies toward anger and aggression. TR reluctantly acknowledged that his anger—however justified it felt regarding his insurer—was interfering with his ability to work effectively with his construction team. His only medication was low-dose amitriptyline for sleep, and he did not use alcohol.
TR's medical history was unremarkable apart from a construction-related dislocated shoulder. He had no history of psychiatric treatment, substance use problems, or legal difficulties. He had graduated from high school before entering construction full-time and had a paralegal assisting with his insurance claim. His family background included estrangement from his alcoholic father and regular visits with his mother, who had congestive heart failure. TR and his wife had no children.
Assessment
The assessment information was gathered through interviews with TR and his wife, who corroborated his history. During the assessment, TR's behavior was notable for loud and rapid speech, an intimidating posture, and a tense facial expression—behavioral observations that supported the self-reported anger difficulties and provided additional clinical data points beyond formal testing.
A review of health records confirmed the history above and showed no cerebral injury on a head CT performed the day of the collision. A neuropsychological screening six months post-injury revealed most cognitive domains within normal limits, except for mildly deficient attention and processing speed. The psychological assessment identified elevated anxiety and anger/aggression symptoms but did not meet full criteria for PTSD—TR did not believe he would die at the time of the collision and did not experience re-experiencing symptoms.
After reviewing the limits of confidentiality, TR agreed to a qEEG assessment. This step illustrates an important clinical principle: informed consent for assessment procedures is both an ethical requirement and an opportunity to build therapeutic rapport with a wary client.
Pre-Neurofeedback qEEG Assessment
Nineteen-channel EEG recordings were collected in both eyes-open and eyes-closed conditions, artifacted, and analyzed using NeuroGuide's software and normative database—a collection of means and standard deviations for EEG variables calculated from healthy subjects grouped by age, condition, and other variables, which enables z-score comparisons. EEG traces were examined in four montages: longitudinal bipolar, linked ears, Laplacian, and average reference. All artifacted data were sufficiently reliable for analysis. The topographic map significance range extends from ±1.5 to ±4.5 standard deviations to display the greatest area of localization for extremely high beta values, and all LORETA analyses used a significance threshold of 3 standard deviations.
Baseline Eyes-Closed EEG Traces
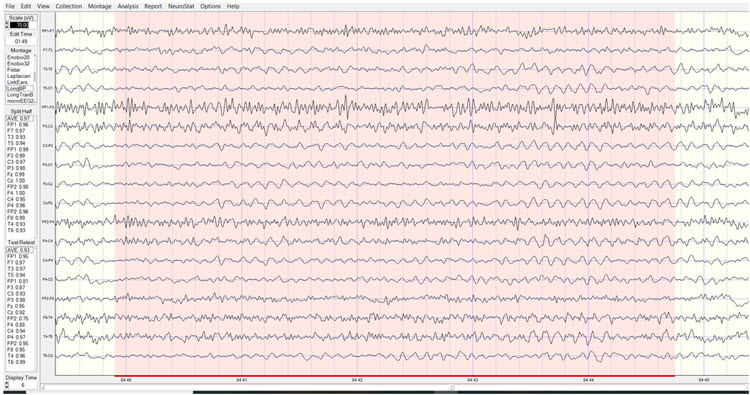
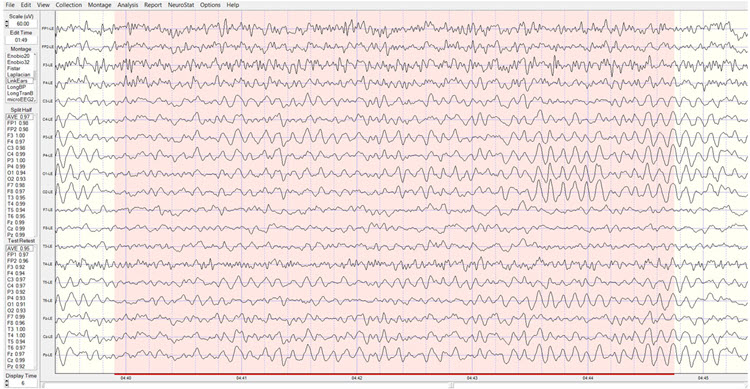
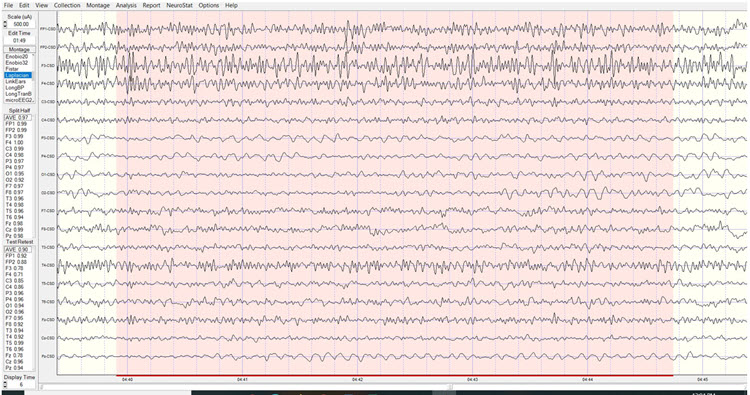
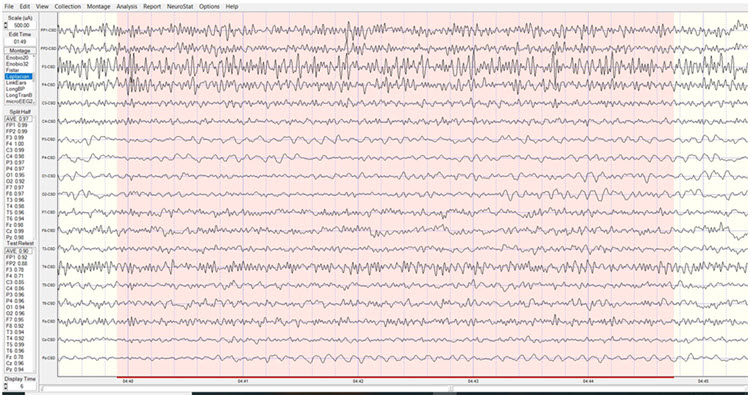
EEG traces showed good production of symmetric alpha activity, although with a peak frequency of only 9 Hz—slightly slower than the typical 10 Hz adult peak, which may relate to the post-concussion cognitive changes noted in his neuropsychological screening. Excess beta activity was prominent, most notably at F3, Fp1, Fp2, F4, and T4. Across all four montages, the excess high-beta wave morphology was consistent with genuine EEG activity rather than EMG (muscle) artifact, an important distinction because frontal muscle tension can mimic high-beta elevations and lead to misguided protocols.
Longitudinal Bipolar Montage, Eyes-Closed Pre-training Baseline:
Linked Ears Montage, Eyes-Closed Pre-training Baseline:
Laplacian Montage, Eyes-Closed Pre-training Baseline:
Average Reference Montage, Eyes-Closed Pre-training Baseline:
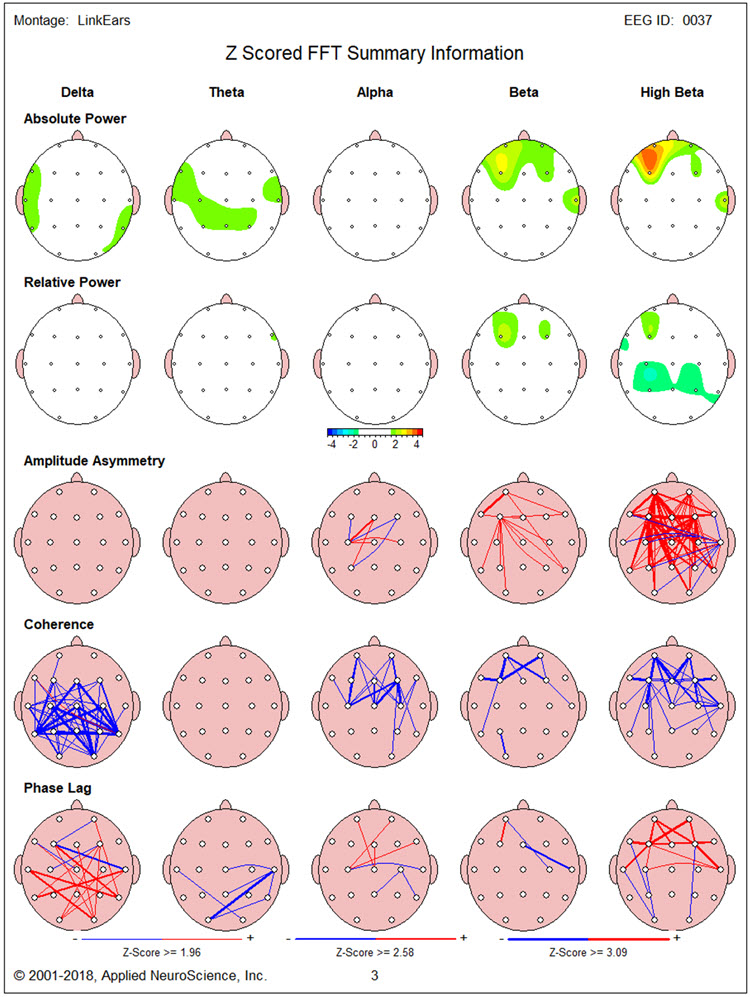
Baseline Eyes-Closed qEEG Findings
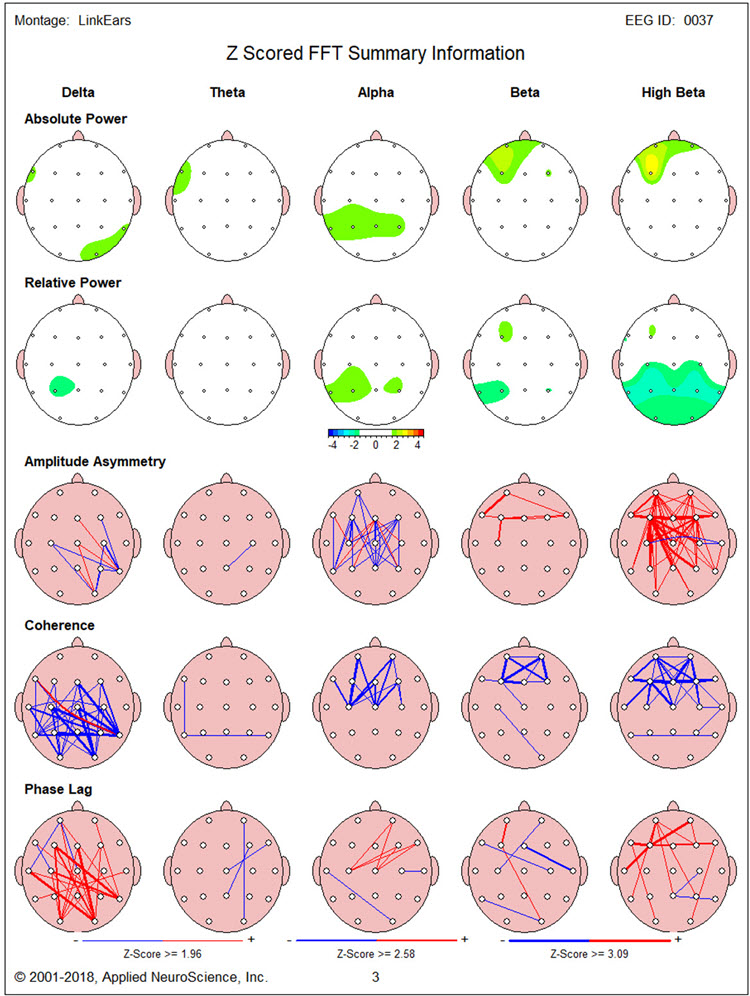
Figure 1 shows the NeuroGuide topographic map summary page for the z-score FFT analysis. The qEEG findings revealed significantly elevated high beta localized primarily between Fp1 and F3—the left prefrontal region associated with executive function and emotional regulation (Herbet & Duffau, 2020). Posterior hypocoherence (deficient communication between brain sites) and excessive phase lag appeared in the delta range, with significant anterior hypocoherence in the high-beta range. For a client presenting with anger and impulsivity, frontal beta excess is a particularly meaningful finding, as it may reflect the cortical hyperarousal underlying his subjective experience of his "brain being on fire."
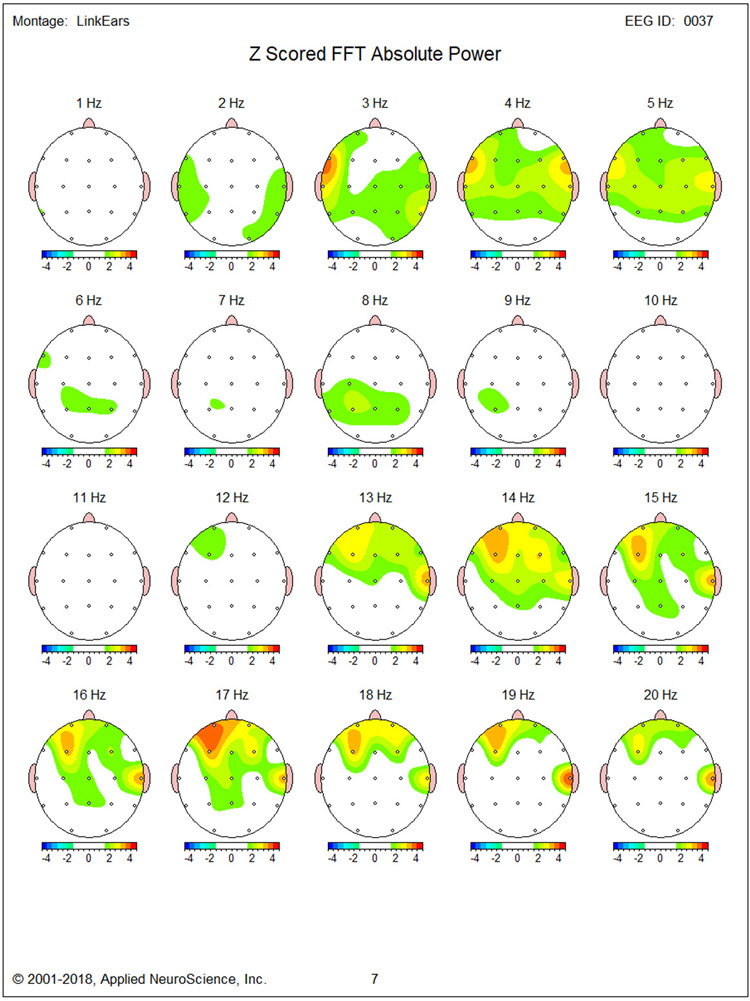
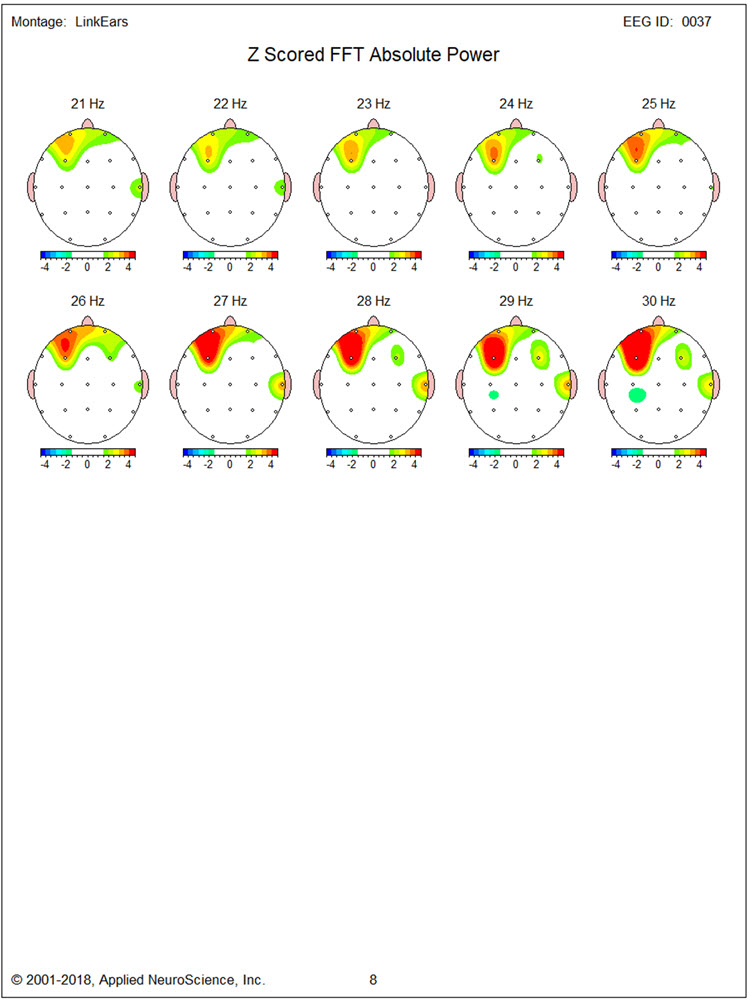
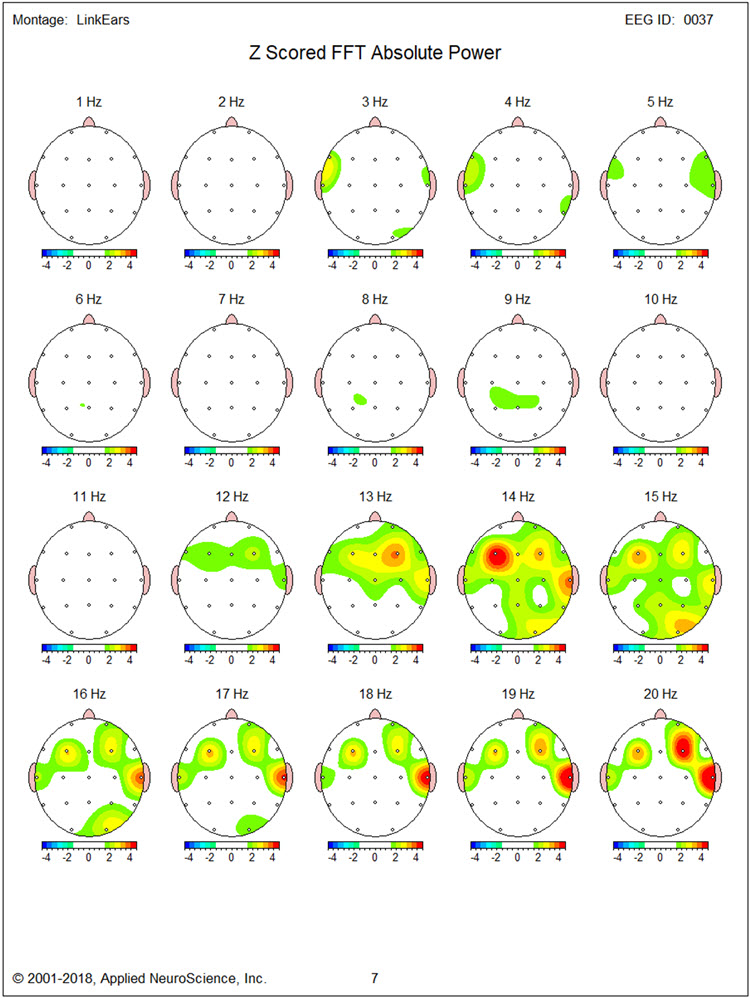
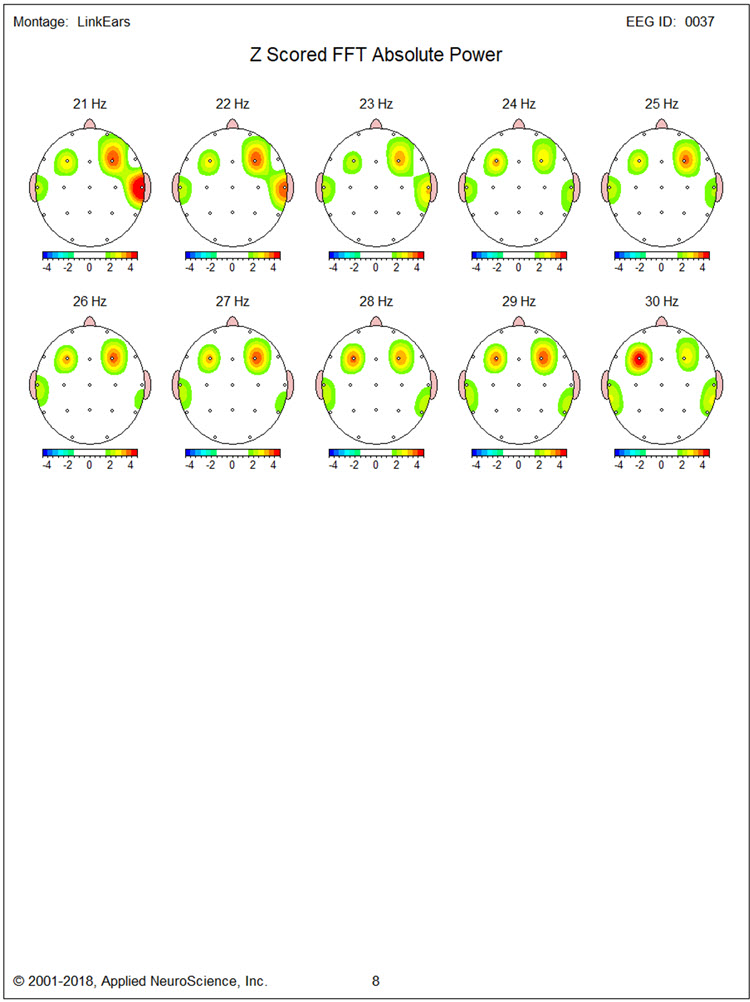
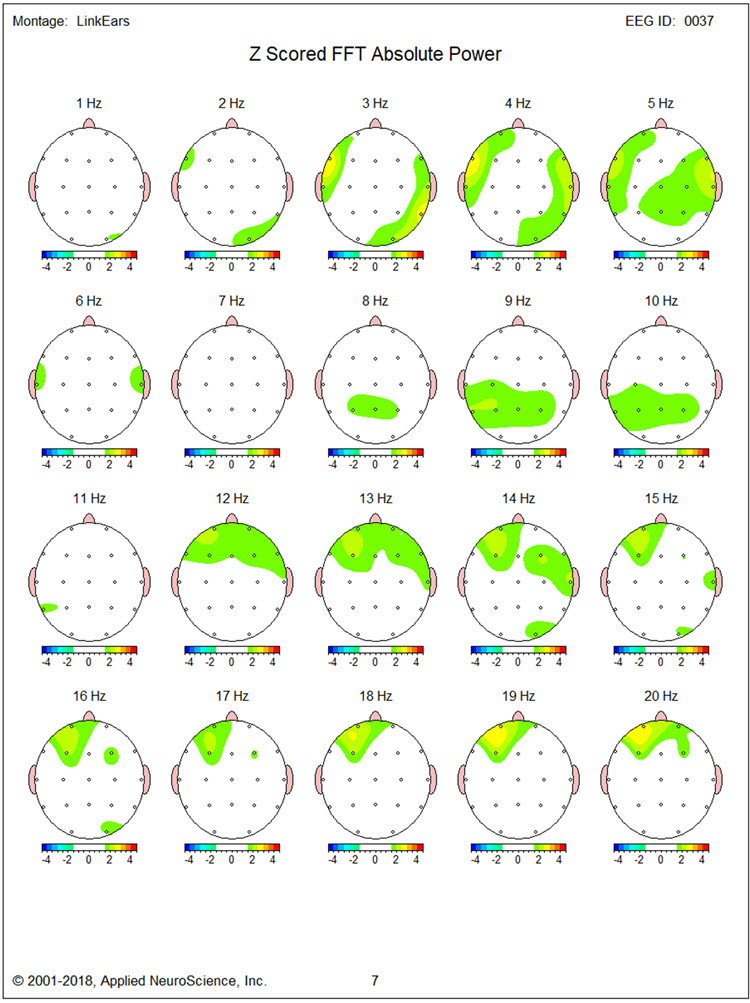
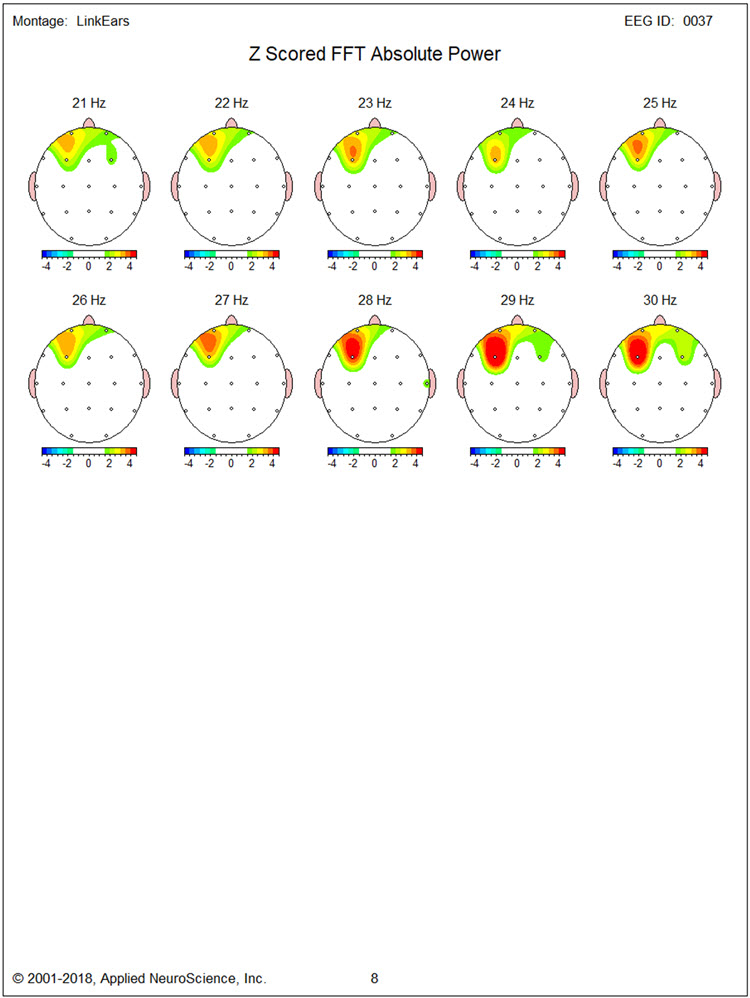
Figures 2 and 3 show single-Hz bins for the z-score FFT analysis, defining the exact elevated beta activity range. The excess appeared mainly between 14-19 Hz and above 25 Hz. Additional excess beta in the 15-20 Hz range was present at T4, and excess delta/theta between 3-4 Hz was found in the region of F7. These single-Hz bin analyses are clinically valuable because they pinpoint the precise frequency bands to target during training, rather than relying on broad-band averages that may obscure focal abnormalities.
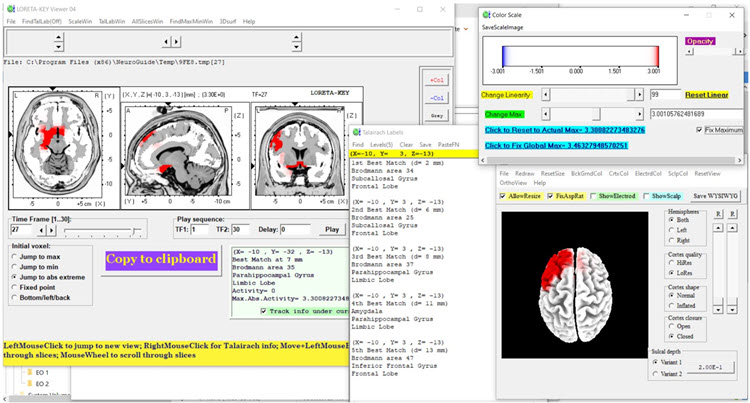
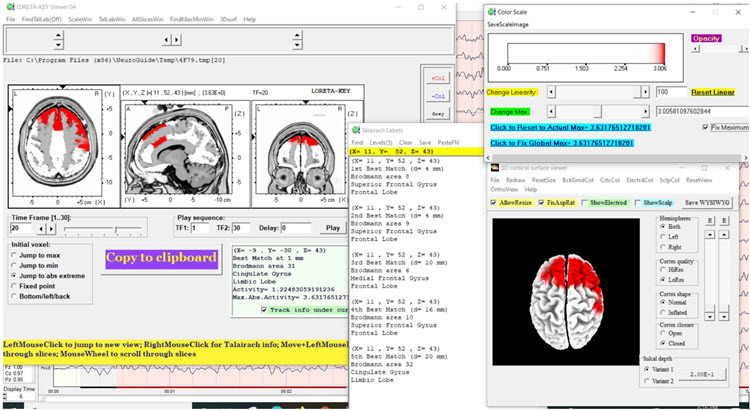
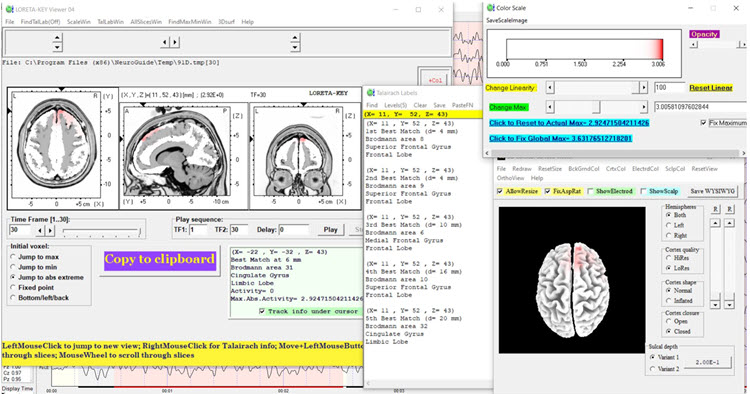
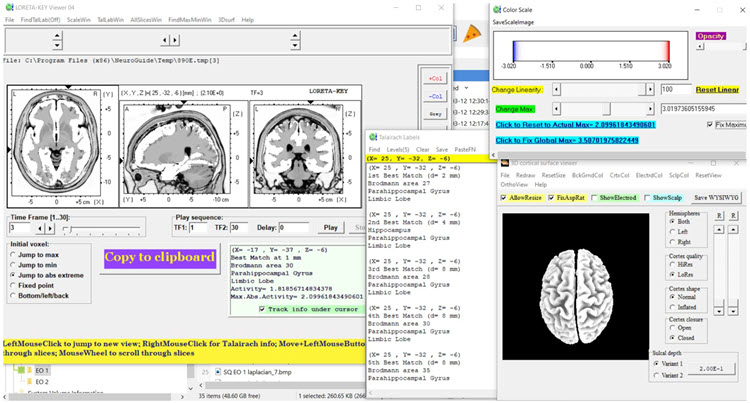
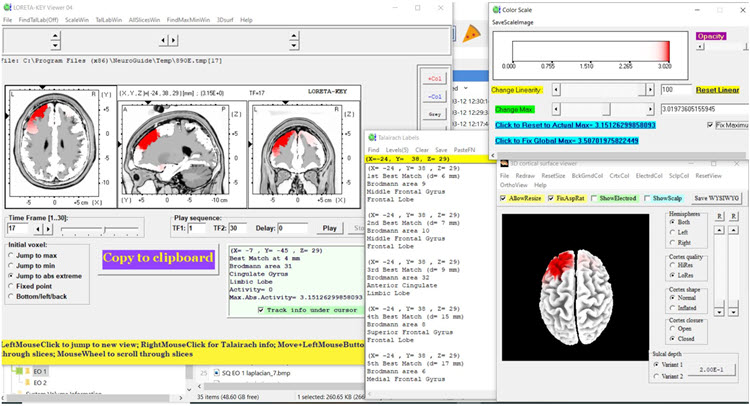
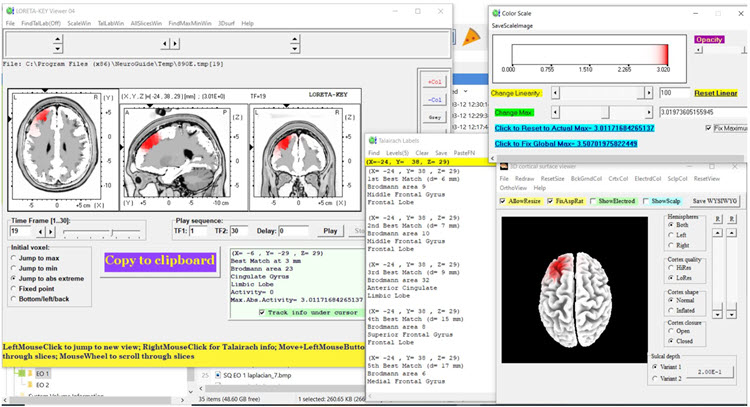
Figures 4 through 8 show LORETA source localization analyses for 3, 17, 19, 27, and 30 Hz, respectively. Figure 4 (3 Hz) does not show elevated regions corresponding to the topographic map findings. However, Figures 5 and 6 (17 Hz and 19 Hz) localize the source of excess beta to medial frontotemporal structures—specifically the subcallosal gyrus, parahippocampal gyrus, and inferior frontal gyrus. These structures are part of the limbic and prefrontal circuitry involved in emotional regulation, making the LORETA findings consistent with TR's anger and aggression symptoms.
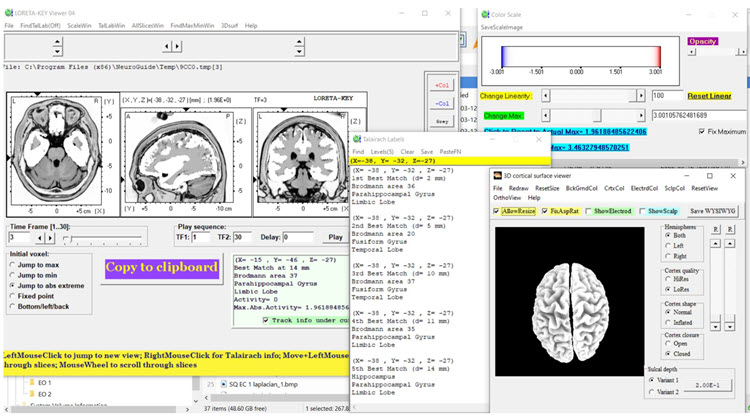
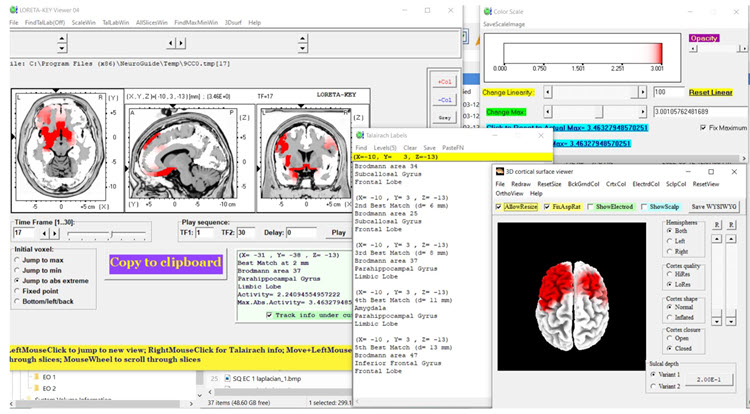
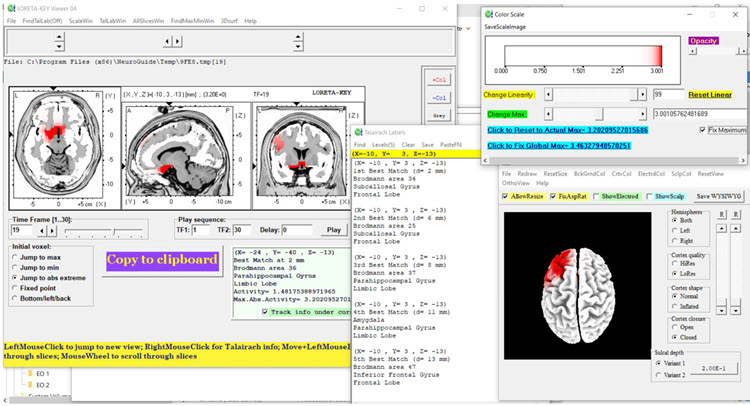
Figures 7 and 8 show that at 27 and 30 Hz, excess beta localizes to the same medial frontotemporal structures identified at 17 and 19 Hz. This convergence across multiple frequency bands strengthens the clinical hypothesis that TR's anger symptoms reflect cortical hyperactivation in brain regions involved in emotional processing and impulse control.
Baseline Eyes-Open EEG Traces
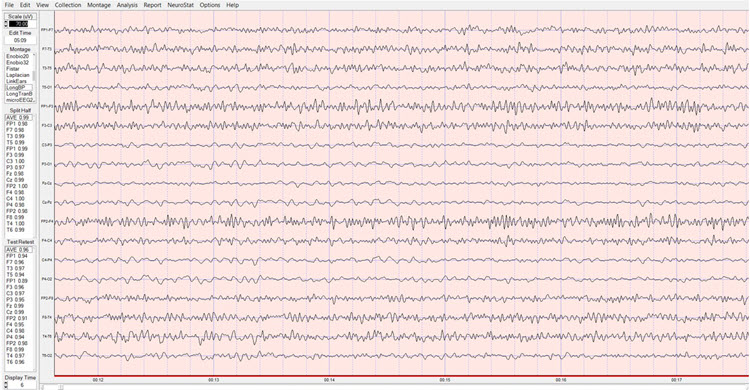
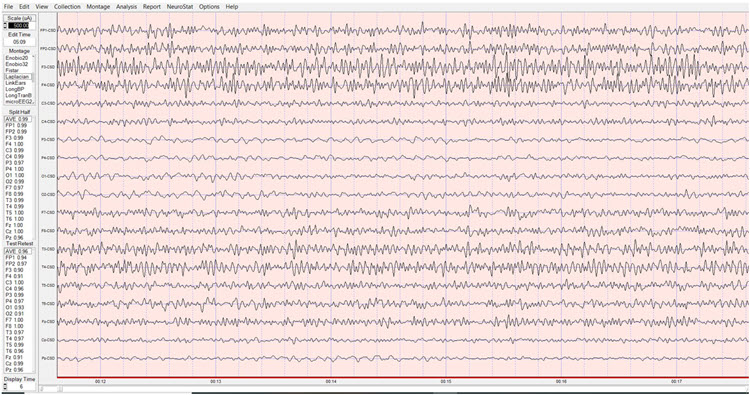
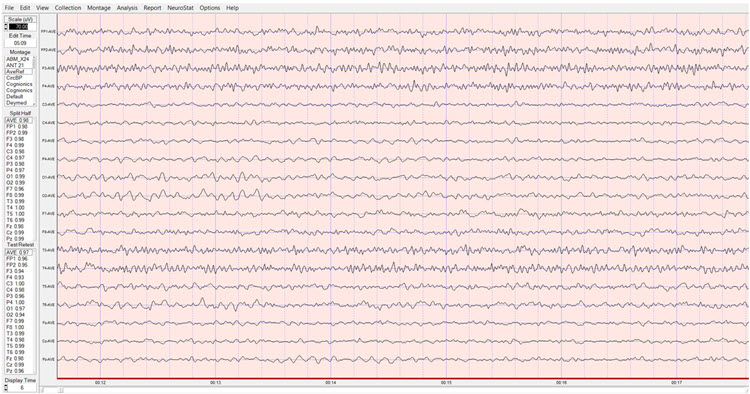
Eyes-open findings were similar to the eyes-closed condition, with good blocking of alpha activity upon eye opening. Segments of traces from each of the four montages are shown below.
Longitudinal Bipolar Montage, Eyes-Open Pre-training Baseline:
Linked Ears Montage, Eyes-Open Pre-training Baseline:

Laplacian Montage, Eyes-Open Pre-training Baseline:
Average Reference Montage, Eyes-Open Pre-training Baseline:
Baseline Eyes-Open qEEG Findings
Figure 9 shows the NeuroGuide summary page with findings similar to the eyes-closed condition, though the excess beta appears more lateralized to the right hemisphere during eyes-open recording. This lateralization shift between conditions is worth noting because it may reflect different patterns of cortical activation during resting versus alert states—information that can inform the choice of training condition (eyes open versus eyes closed).
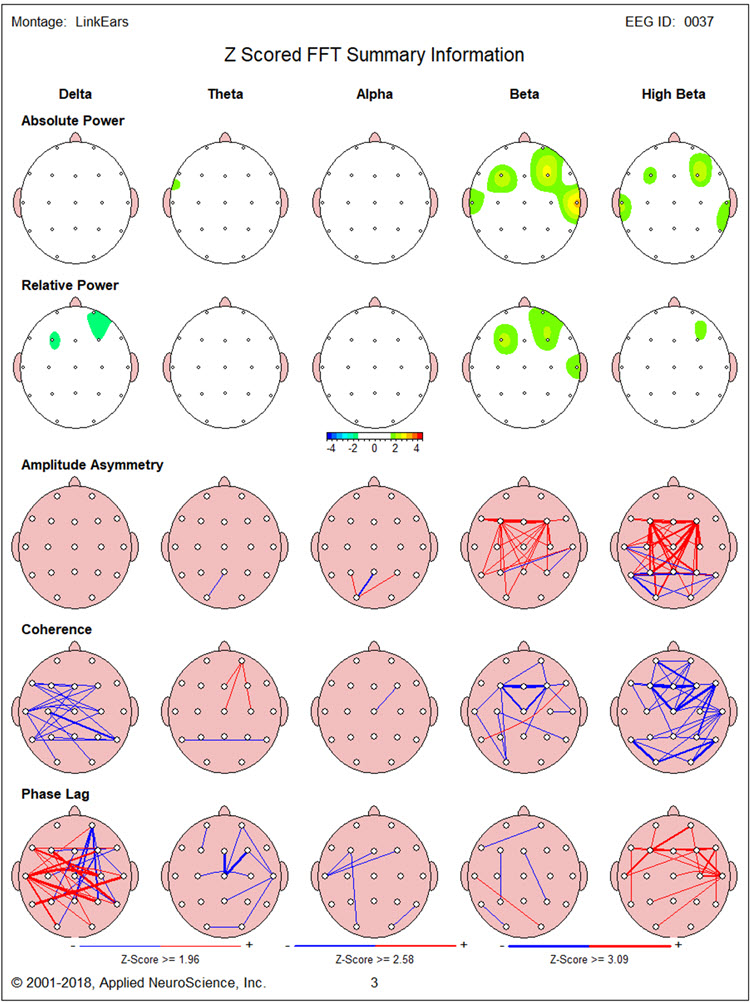
Figure 10 confirms elevated 3 Hz activity in the region of F7. Figures 10 and 11 reveal prominent excess 14 Hz activity at F3, with excess 16-22 Hz activity at T4. Particularly striking elevations appear at 24-30 Hz at F3 and 19-29 Hz at F4. These bilateral frontal high-beta elevations in the eyes-open condition reinforced the decision to conduct neurofeedback training with eyes open, targeting the condition in which the abnormality was most pronounced.
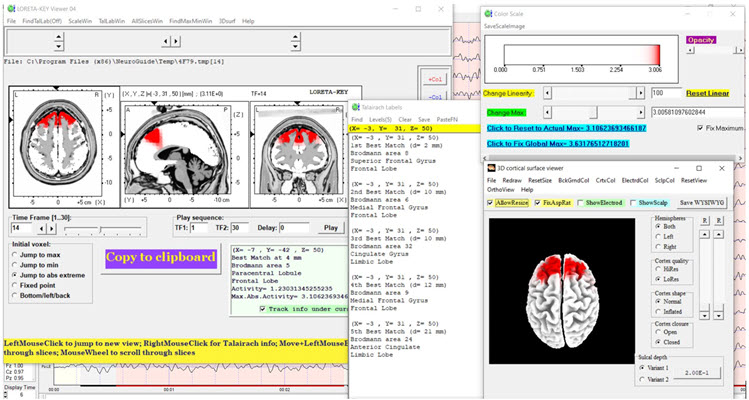
Figures 12, 13, and 14 present LORETA analyses for 14, 20, and 30 Hz in the eyes-open condition. Compared to the eyes-closed data, inferiorly located structures are less involved. Medial and superior frontal regions bilaterally show significantly elevated beta at 14 and 20 Hz, with less elevation at 30 Hz. This pattern suggests that during active alertness, the cortical hyperactivation shifts toward more superficial frontal cortex—regions more directly accessible to surface-level neurofeedback training at F3 and F4.
Neurofeedback Training
Neurofeedback training proceeded in two stages, reflecting a multimodal approach. First, TR completed 13 sessions of eyes-open 2-channel beta (20-38 Hz) downtraining at F3 and F4, targeting the bilateral frontal excess identified by the qEEG. Note that this band covers the 24-30 Hz frontal excess seen in the eyes-open baseline but sits above the 14-19 Hz excess, so it did not target the whole of the range the qEEG identified. Second, he received 6 sessions of alpha-theta training, which aims to promote relaxation and access deeper psychological processing. This neurofeedback was provided concurrently with psychotherapy based on cognitive-behavioral and Acceptance and Commitment Therapy (ACT) methods.
The psychotherapy included education about the nature of anger and aggression, acquisition and rehearsal of cognitive and behavioral skills during sessions, and application of those skills between sessions. Although no peripheral biofeedback was formally provided, TR was taught progressive muscle relaxation and slow diaphragmatic breathing—skills that complement the neurofeedback by addressing the somatic components of his arousal. This combined approach reflects a common clinical rationale that complex presentations are better addressed by more than one modality (Tan et al., 2016).
Anecdotal Outcome
Both TR and his wife reported significantly reduced anger expression at home and in the community. TR described experiencing less intense and shorter episodes of anger, with less frequent aggressive behavior at construction sites. During sessions, he appeared markedly less tense and voiced fewer angry complaints. Although TR remained angry at his insurer, the degree of that anger had diminished, and he showed greater willingness to let his paralegal representative manage the situation. These changes represent meaningful functional improvements in a client whose anger had been severely disrupting both his professional relationships and his daily life.
Post-Neurofeedback qEEG Assessment
Post-Training Eyes-Closed qEEG Findings
This section compares the post-training qEEG with baseline findings to evaluate objective changes. Figure 15 shows the post-training eyes-closed z-score FFT NeuroGuide summary report. Compared to baseline, excess high beta is reduced at F3. However, significant delta and high-beta hypocoherence persist, as does elevated delta phase lag—suggesting that while cortical amplitude has normalized in some regions, connectivity patterns may require additional training or longer follow-up to resolve.
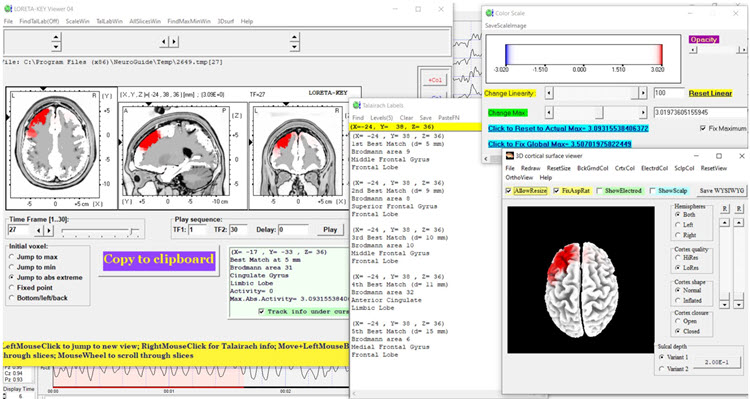
Figures 16 and 17 display single-Hz bins showing a clear reduction in excess beta and high-beta activity. The improvement occurs mainly in the beta range (14-19 Hz), with less change at higher frequencies. This differential response is clinically instructive, and it is not the pattern the protocol predicts: the largest reduction fell in the 14-19 Hz range, which lay below the 20-38 Hz training band, while frequencies that were actually inhibited changed least. Whether that reflects generalization beyond the trained band, regression toward the mean, or ordinary session-to-session variability cannot be settled from a single case, and the persistent high-beta excess above 25 Hz would warrant a different strategy.
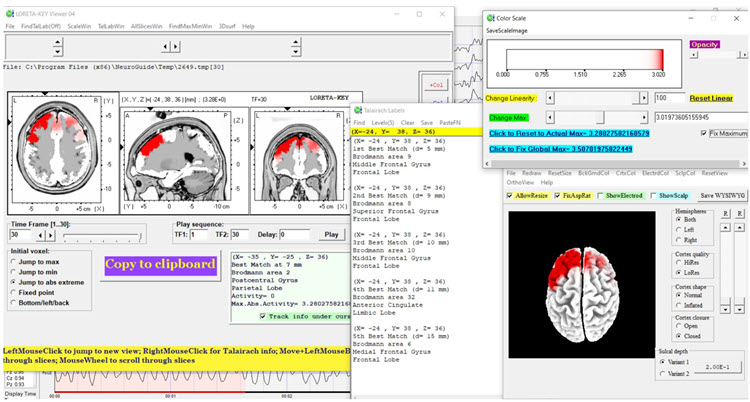
LORETA findings in Figure 18 again show no elevated 3 Hz activity. Figures 19 and 20 (17 Hz and 19 Hz) reveal a reduction of cortical territory with excess activity, indicating that the source-level hyperactivation has partially resolved. However, Figures 21 and 22 show little discernable change at 27 and 30 Hz, consistent with the single-Hz bin findings and suggesting that deeper medial frontotemporal generators may be less responsive to surface-level 2-channel training.
Post-Training Eyes-Open qEEG Findings
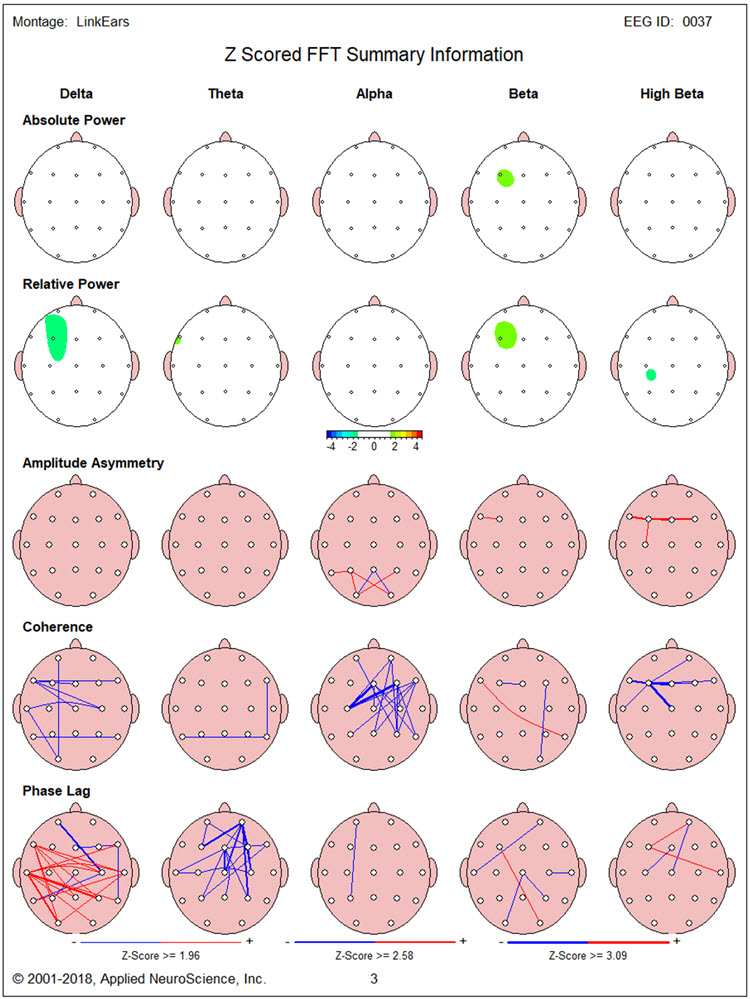
Figure 23 shows the post-training eyes-open z-score FFT summary report. The excess beta and high-beta activity seen during the baseline assessment is largely absent—a striking improvement, particularly given that most of the neurofeedback training was conducted in the eyes-open condition. There is also less delta and high-beta hypocoherence than baseline, although delta phase lag remains significantly elevated.
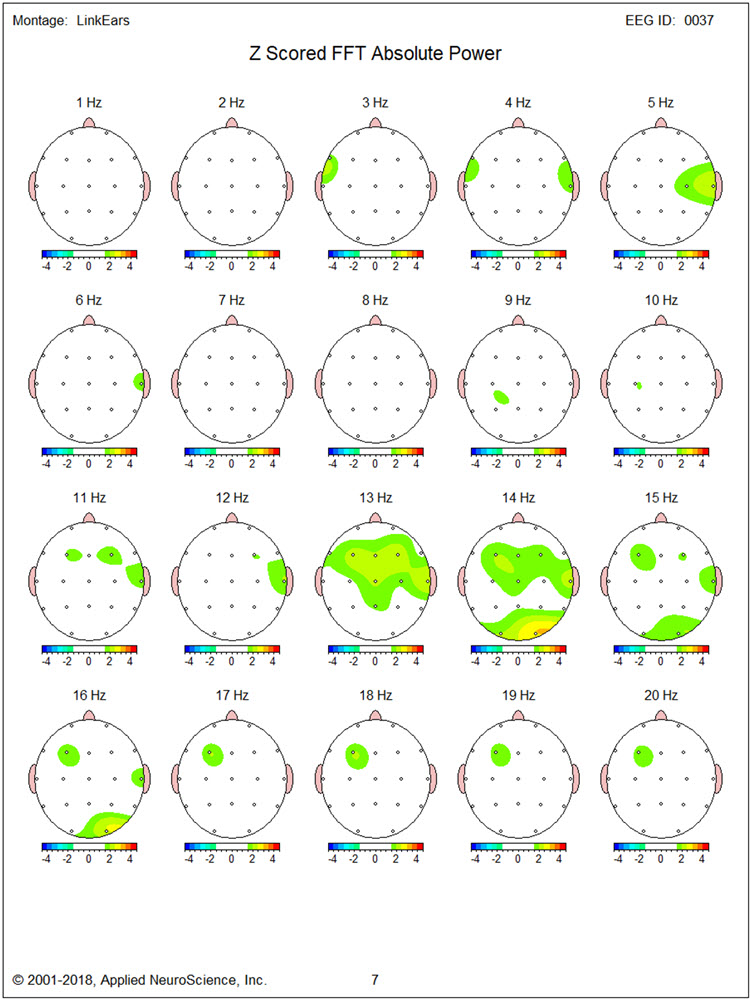
This change is seen in more detail in Figures 24 and 25, which show the single-Hz bin analyses.
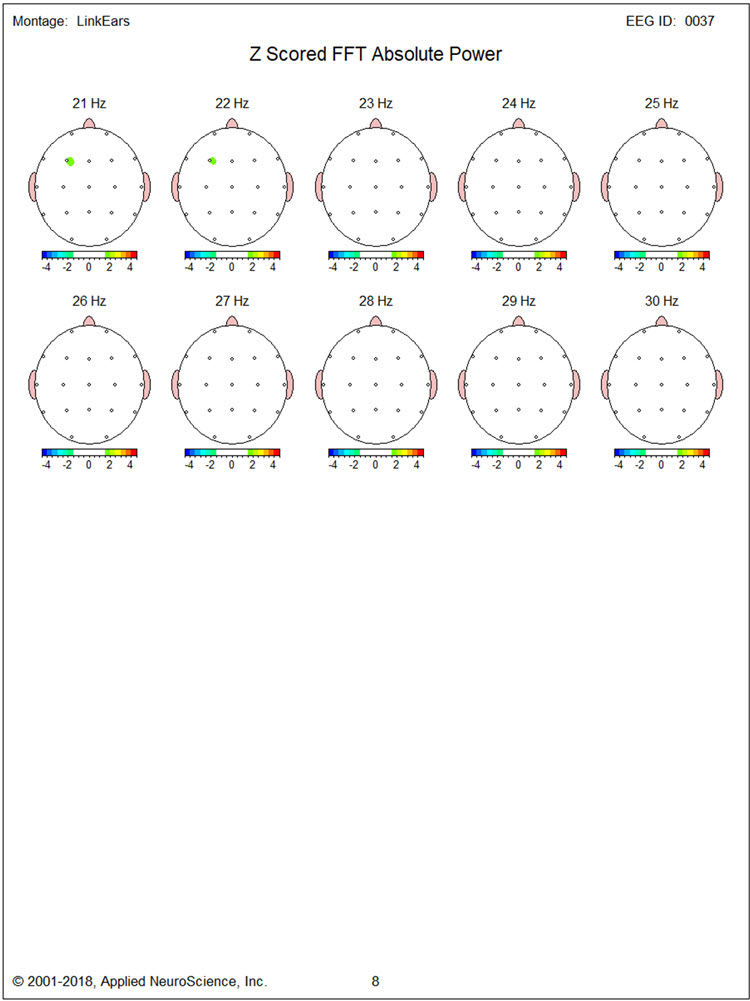
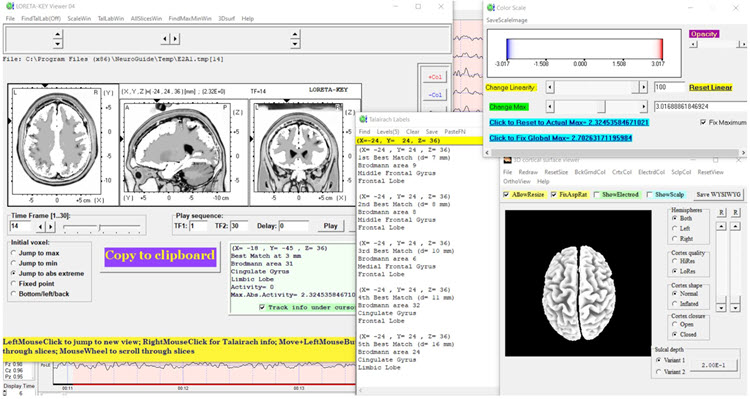
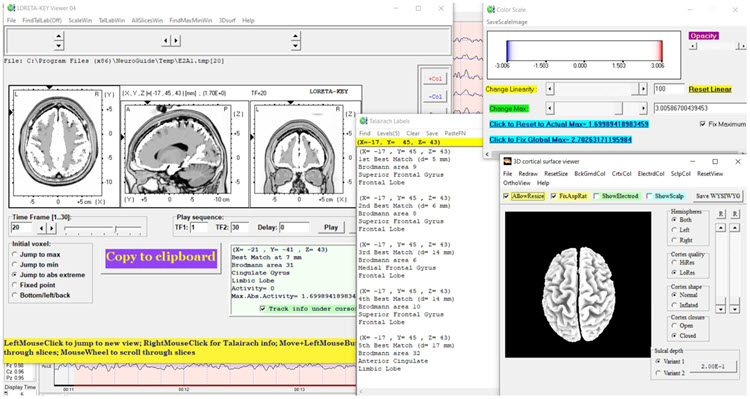
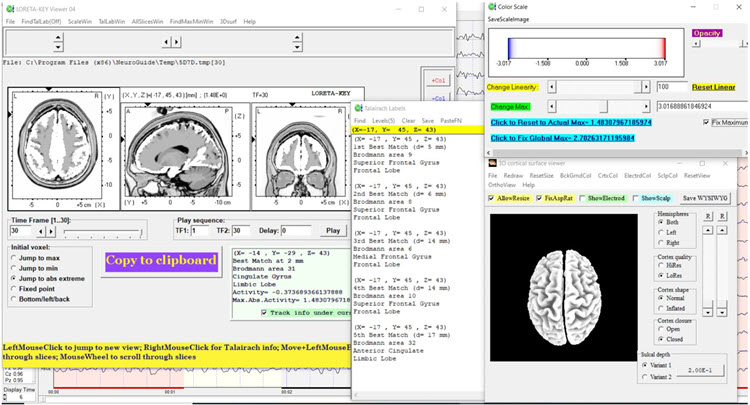
LORETA images in Figures 26, 27, and 28 show very little of the excess activity found at baseline for 14, 20, and 30 Hz. The near-complete resolution of source-level beta excess in the eyes-open condition—the condition in which TR conducted most of his training—underscores the importance of matching the training condition to the pattern of abnormality identified during assessment.
Summary
TR is a 41-year-old man injured in a traffic collision two years before neurofeedback training. He sustained a mild concussion and soft tissue injuries that limited his return to full-time construction work. He was referred primarily for excessive anger and aggressive behavior that was disrupting his professional relationships and daily functioning.
Baseline qEEG revealed predominantly bilateral frontal excess beta and high-beta activity. LORETA source localization traced these elevations to medial and inferior frontal regions—structures integral to emotional regulation and impulse control. Neurofeedback training consisted of 13 sessions of eyes-open 2-channel beta (20-38 Hz) downtraining at F3 and F4, followed by 6 sessions of alpha-theta training, delivered alongside cognitive-behavioral and ACT-based psychotherapy.
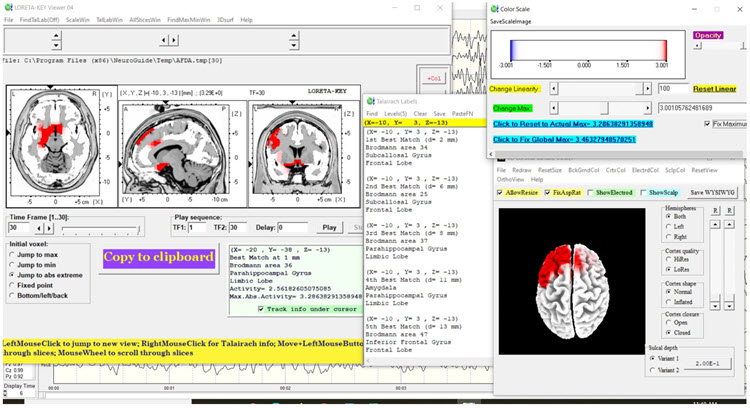
Both TR and his wife reported significantly reduced anger experience and expression. Post-training qEEG confirmed reduced beta activity in the eyes-closed condition, and in the eyes-open condition—where most training occurred—excess beta was significantly reduced along with delta and high-beta hypocoherence. Dynamic FFT z-score analysis also revealed an improvement in alpha peak frequency from approximately 9 Hz at baseline to about 10 Hz post-training, as shown in the figures below. A shift in peak alpha frequency of this size is of interest because faster peak alpha has been associated with better processing speed in some samples. A change of roughly 1 Hz in a single client also falls within the range of ordinary variability in spectral EEG measures, so it is best read as suggestive rather than as a demonstrated treatment effect.
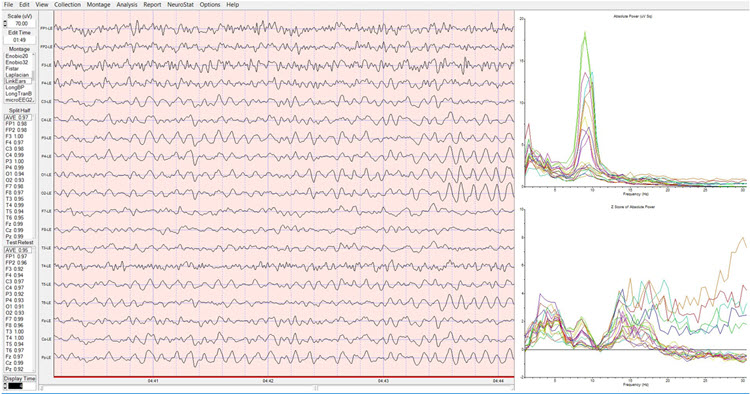
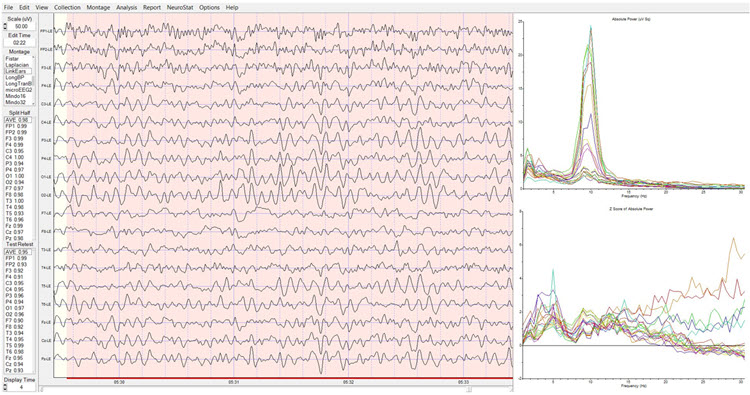
In sum, neurofeedback was associated with significant changes in qEEG findings along with meaningful clinical changes in TR's emotional condition and behavior. This case demonstrates how LORETA can pinpoint the cortical sources of surface-level EEG abnormalities, guiding targeted interventions that produce both subjective and objective improvements.
TR, a 41-year-old man with post-concussion anger and aggression, showed bilateral frontal excess beta and high-beta activity on baseline qEEG, localized by LORETA to medial and inferior frontal regions involved in emotional regulation. After 13 sessions of eyes-open beta downtraining at F3 and F4 combined with 6 sessions of alpha-theta training and concurrent psychotherapy, TR demonstrated significantly reduced anger expression. Post-training qEEG confirmed reduced excess beta (particularly in the eyes-open condition) and improved alpha peak frequency from 9 Hz to 10 Hz, illustrating how targeted protocols guided by LORETA can produce convergent clinical and electrophysiological outcomes.
Patient Example C
This section presents a case that illustrates how clinicians integrate multiple data sources—intake interview, standardized questionnaires, EEG assessment, and psychophysiological stress testing—to develop a comprehensive, multimodal treatment plan. Jill is a 30-year-old married lawyer who scheduled an appointment with Sharon, a psychotherapist who provides neurofeedback and biofeedback, following her family physician's recommendation to seek help with stress management.
Before the first appointment, Sharon sent clinic information, a background questionnaire, and a standardized assessment instrument, asking Jill to complete them before attending. At the initial visit, Sharon collected the questionnaires, documented her review of confidentiality issues, conducted an intake interview, and obtained consent to request relevant reports from Jill's family physician. Sharon provided Jill with a stress model explaining the mechanisms behind her symptoms and described available treatment options, including neurofeedback and biofeedback as adjuncts to psychotherapy.
Jill expressed interest, so Sharon recommended additional appointments to complete an EEG assessment for neurofeedback planning and a psychophysiological stress assessment for biofeedback planning. After these assessments, Sharon scored the questionnaires; spoke with Jill's husband and family physician by phone; and examined the EEG data, peripheral psychophysiological recordings, and intake interview information together. This comprehensive, multi-source approach exemplifies the evidence-based assessment process recommended for biofeedback and neurofeedback practice.
Assessment Highlights
Jill is a 30-year-old married lawyer with no children. She was self-referred for stress management and wants to understand both the causes of her stress and her options for managing it.
Presenting Problem from the Interview
Jill experiences stress daily, varying from none to severe intensity. Intense stress episodes occur about three times per week and last several hours on average. The primary triggers are large work assignments and obstacles encountered during those assignments—for example, the inability to access information quickly. Low-intensity stress occurs primarily at home during meals with her husband and outdoor exercise.
During severe stress episodes, Jill has difficulty concentrating and recalling work-related information. Her physical stress responses include holding her breath and tightening muscles from the shoulders up. She also experiences what she believes are tension headaches approximately twice per week. These somatic symptoms are the kind of sympathetic arousal response that biofeedback is commonly used to address.
Presenting Problem History
Jill reports that she always performed well academically, but as she advanced through her education and began legal practice, her experience of stress gradually intensified. During her first year as an associate at her current firm, she began avoiding some work assignments—a behavioral pattern that drew informal criticism from colleagues. As stress worsened, Jill noticed that self-criticism related to her academic and professional performance also increased. This escalating cycle of avoidance, criticism, and self-doubt is a common pattern that cognitive-behavioral approaches are designed to interrupt.
Functional Status
Jill works full-time and has no significant deficits in self-care, domestic activity, mobility, or independent activities of daily living. However, her engagement in self-care and pleasurable activities has declined, and fatigue limits her ability to enjoy travel and entertainment with her husband and socialize with friends. This contraction of rewarding activities is clinically significant because it can maintain and deepen stress through a reinforcement trap—the less she does, the fewer opportunities she has to experience positive emotions that buffer against stress.
Medication and Social Drugs
Jill uses over-the-counter remedies such as Tylenol for headaches.
Past History
Physical: Jill has had no major surgeries, illnesses, injuries, or diagnosed diseases and received standard childhood vaccinations plus COVID-19 boosters. Mental Health: She has never received a mental health diagnosis but saw a counselor during high school and again during law school to address high stress levels. Substance Use: She has a couple of drinks at a time with her husband two to three times per week and does not use recreational drugs.
Academic: Jill completed law school 2 years ago. Work: She works in a moderately sized corporate legal firm. Legal: She has never been arrested or charged with any legal offense.
Social: Jill married after completing her undergraduate degree. She and her husband have no children, though earlier in their marriage they traveled frequently and socialized more often. She maintains a small circle of friends with whom she communicates by phone and text, occasionally going out for dinner and entertainment. She has good relationships with her parents, younger sister, and her husband's family.
Notably, Jill reports that her parents emphasized academic achievement and excellence in extracurricular activities throughout her childhood and appeared to take it personally when her performance fell short of the highest standards. This detail is clinically significant because it may represent a developmental origin of the perfectionistic self-evaluation that now drives her stress response.
Family History
Jill's parents do not have significant problems in any areas of medical, psychiatric, substance use, academic, or work history.
Collateral Report
A phone interview with Jill's husband, conducted with her consent, essentially corroborated her self-report. He added that she worries about minor issues and sometimes has difficulty falling asleep—details that reinforce the picture of generalized stress and anxiety extending beyond the workplace.
Medical Records
A phone interview with Jill's family physician provided information consistent with what Jill and her husband reported. There were no significant medical test results or reports to forward.
Behavioral Observation
During the interview, Jill fidgeted frequently and appeared visibly tense. She expressed misgivings about her abilities and performance several times. These in-session observations provide real-time behavioral data that complement the self-report measures and help the clinician gauge the severity and pervasiveness of Jill's stress response.
Psychological Assessment
Results from the 21-item version of the Depression Anxiety Stress Scales (DASS-21; Lovibond & Lovibond, 1995) showed significant elevation of stress and anxiety but not depression. This pattern is consistent with a primary anxiety/stress presentation and helps differentiate Jill's condition from major depression—a distinction that influences both the neurofeedback protocol and the psychotherapeutic approach.
EEG Assessment
The EEG revealed excessive posterior beta amplitude and deficient alpha production in the eyes-closed condition. In the context of Jill's presenting symptoms, this pattern is commonly read as cortical hyperarousal: more fast-wave activity of the kind associated with vigilance and worry, and less of the alpha activity associated with relaxed wakefulness (Demos, 2019). Read on its own the pattern is nonspecific, because excess beta and reduced alpha also accompany medication effects, muscle artifact, and simple task engagement; it is the convergence with her reported symptoms that makes it usable. This EEG signature provides a clear target for neurofeedback training.
Psychophysiological Stress Test
The stress test revealed that shoulder-neck EMG increased significantly in response to stressors and failed to return to baseline levels—a pattern of incomplete recovery that, when repeated daily, can contribute to chronic muscle tension and headaches. Heart rate variability (HRV) was deficient, a finding consistent with reduced autonomic flexibility. Finger temperature and skin conductance were unremarkable. Taken together, these findings point to EMG and HRV biofeedback as priority interventions for the peripheral components of Jill's stress response.
Formulation
Jill is a young professional seeking help for high stress levels that compromise her enjoyment of both work and personal life. As a child, she may have internalized her parents' emphasis on exceptional performance, developing self-critical beliefs and anxious appraisals in challenging situations that intensified upon entering the demanding legal profession. She brings considerable strengths—intellectual capacity, strong social relationships, academic and professional success, and a supportive network—but her maladaptive beliefs about performance, anxious cognitive patterns, and withdrawal from pleasurable activities may perpetuate the stress cycle. The convergence of questionnaire, EEG, and psychophysiological test results paints a consistent picture of anxiety-driven stress affecting both central and peripheral nervous system functioning.
Available treatment options include medication, cognitive-behavior therapy (CBT), neurofeedback, and biofeedback. Jill defers medication but expresses interest in the latter three modalities, all of which Sharon can provide. CBT for stress management is recommended as the psychotherapeutic foundation. The psychophysiological stress test results suggest a combination of respiration, HRV, and EMG biofeedback, which will also familiarize Jill with the biofeedback process before introducing neurofeedback. The EEG assessment points to a posterior site using a referential montage at Pz—or a sequential montage at P3-P4—in which the alpha band is reinforced and EEG in the higher beta band is inhibited.
A review of AAPB's Evidence-based Practice in Biofeedback and Neurofeedback (Tan et al., 2016; now in its fourth edition, Khazan et al., 2023) supports this approach. The published literature reports that elevated posterior beta amplitude and deficient eyes-closed alpha production are associated with elevated anxiety, and that training to increase alpha while inhibiting excess beta has been followed by reductions in anxiety symptoms. This formulation was reviewed with Jill, who provided informed consent. Sharon began with several biofeedback sessions combined with CBT, then introduced neurofeedback training using a referential montage at Pz to reinforce alpha and inhibit beta with eyes closed.
Jill practiced CBT skills and HRV biofeedback techniques between sessions. To track progress, Sharon graphed data from the DASS-21 and session-by-session stress ratings, along with HRV and neurofeedback metrics—particularly pre-training baseline values of average alpha and high-beta amplitudes. She also collected stress ratings at the beginning and end of each session, and clinician and client briefly reviewed these graphs together during each visit. This ongoing data collection and review exemplifies the data-driven approach that is central to evidence-based biofeedback and neurofeedback practice.
Jill, a 30-year-old lawyer with stress and anxiety, presented with excessive posterior beta, deficient alpha on EEG, elevated shoulder-neck EMG, and deficient HRV. Her multimodal treatment plan combined CBT, respiration/HRV/EMG biofeedback, and neurofeedback at Pz to reinforce alpha and inhibit beta. This case illustrates how clinicians integrate intake interview data, standardized questionnaires (DASS-21), EEG findings, and psychophysiological stress test results to build a comprehensive, individualized plan. Ongoing session-by-session data collection ensures that treatment remains responsive to the client's progress.
Summary and Conclusion
This section draws together the key principles demonstrated across all three case examples. The decision-making model presented in this unit highlights the central role of a data-based approach to neurofeedback training. Initial protocols are selected based on the best available assessment data—including qEEG topographic maps, LORETA source localization, normative database comparisons, and clinical history—and their effects on each individual are evaluated through systematic data collection following the implementation of training.
As all three cases illustrate, no single data source is sufficient on its own. Client B's TBI history informed the choice of multi-site z-score training; TR's LORETA-localized frontal beta excess guided targeted downtraining at F3 and F4; and Jill's combination of EEG and psychophysiological data led to an integrated biofeedback and neurofeedback plan. In each case, the close involvement of the client from the outset and throughout training integrates ethical considerations of autonomy and informed consent into the treatment protocol decision-making process.
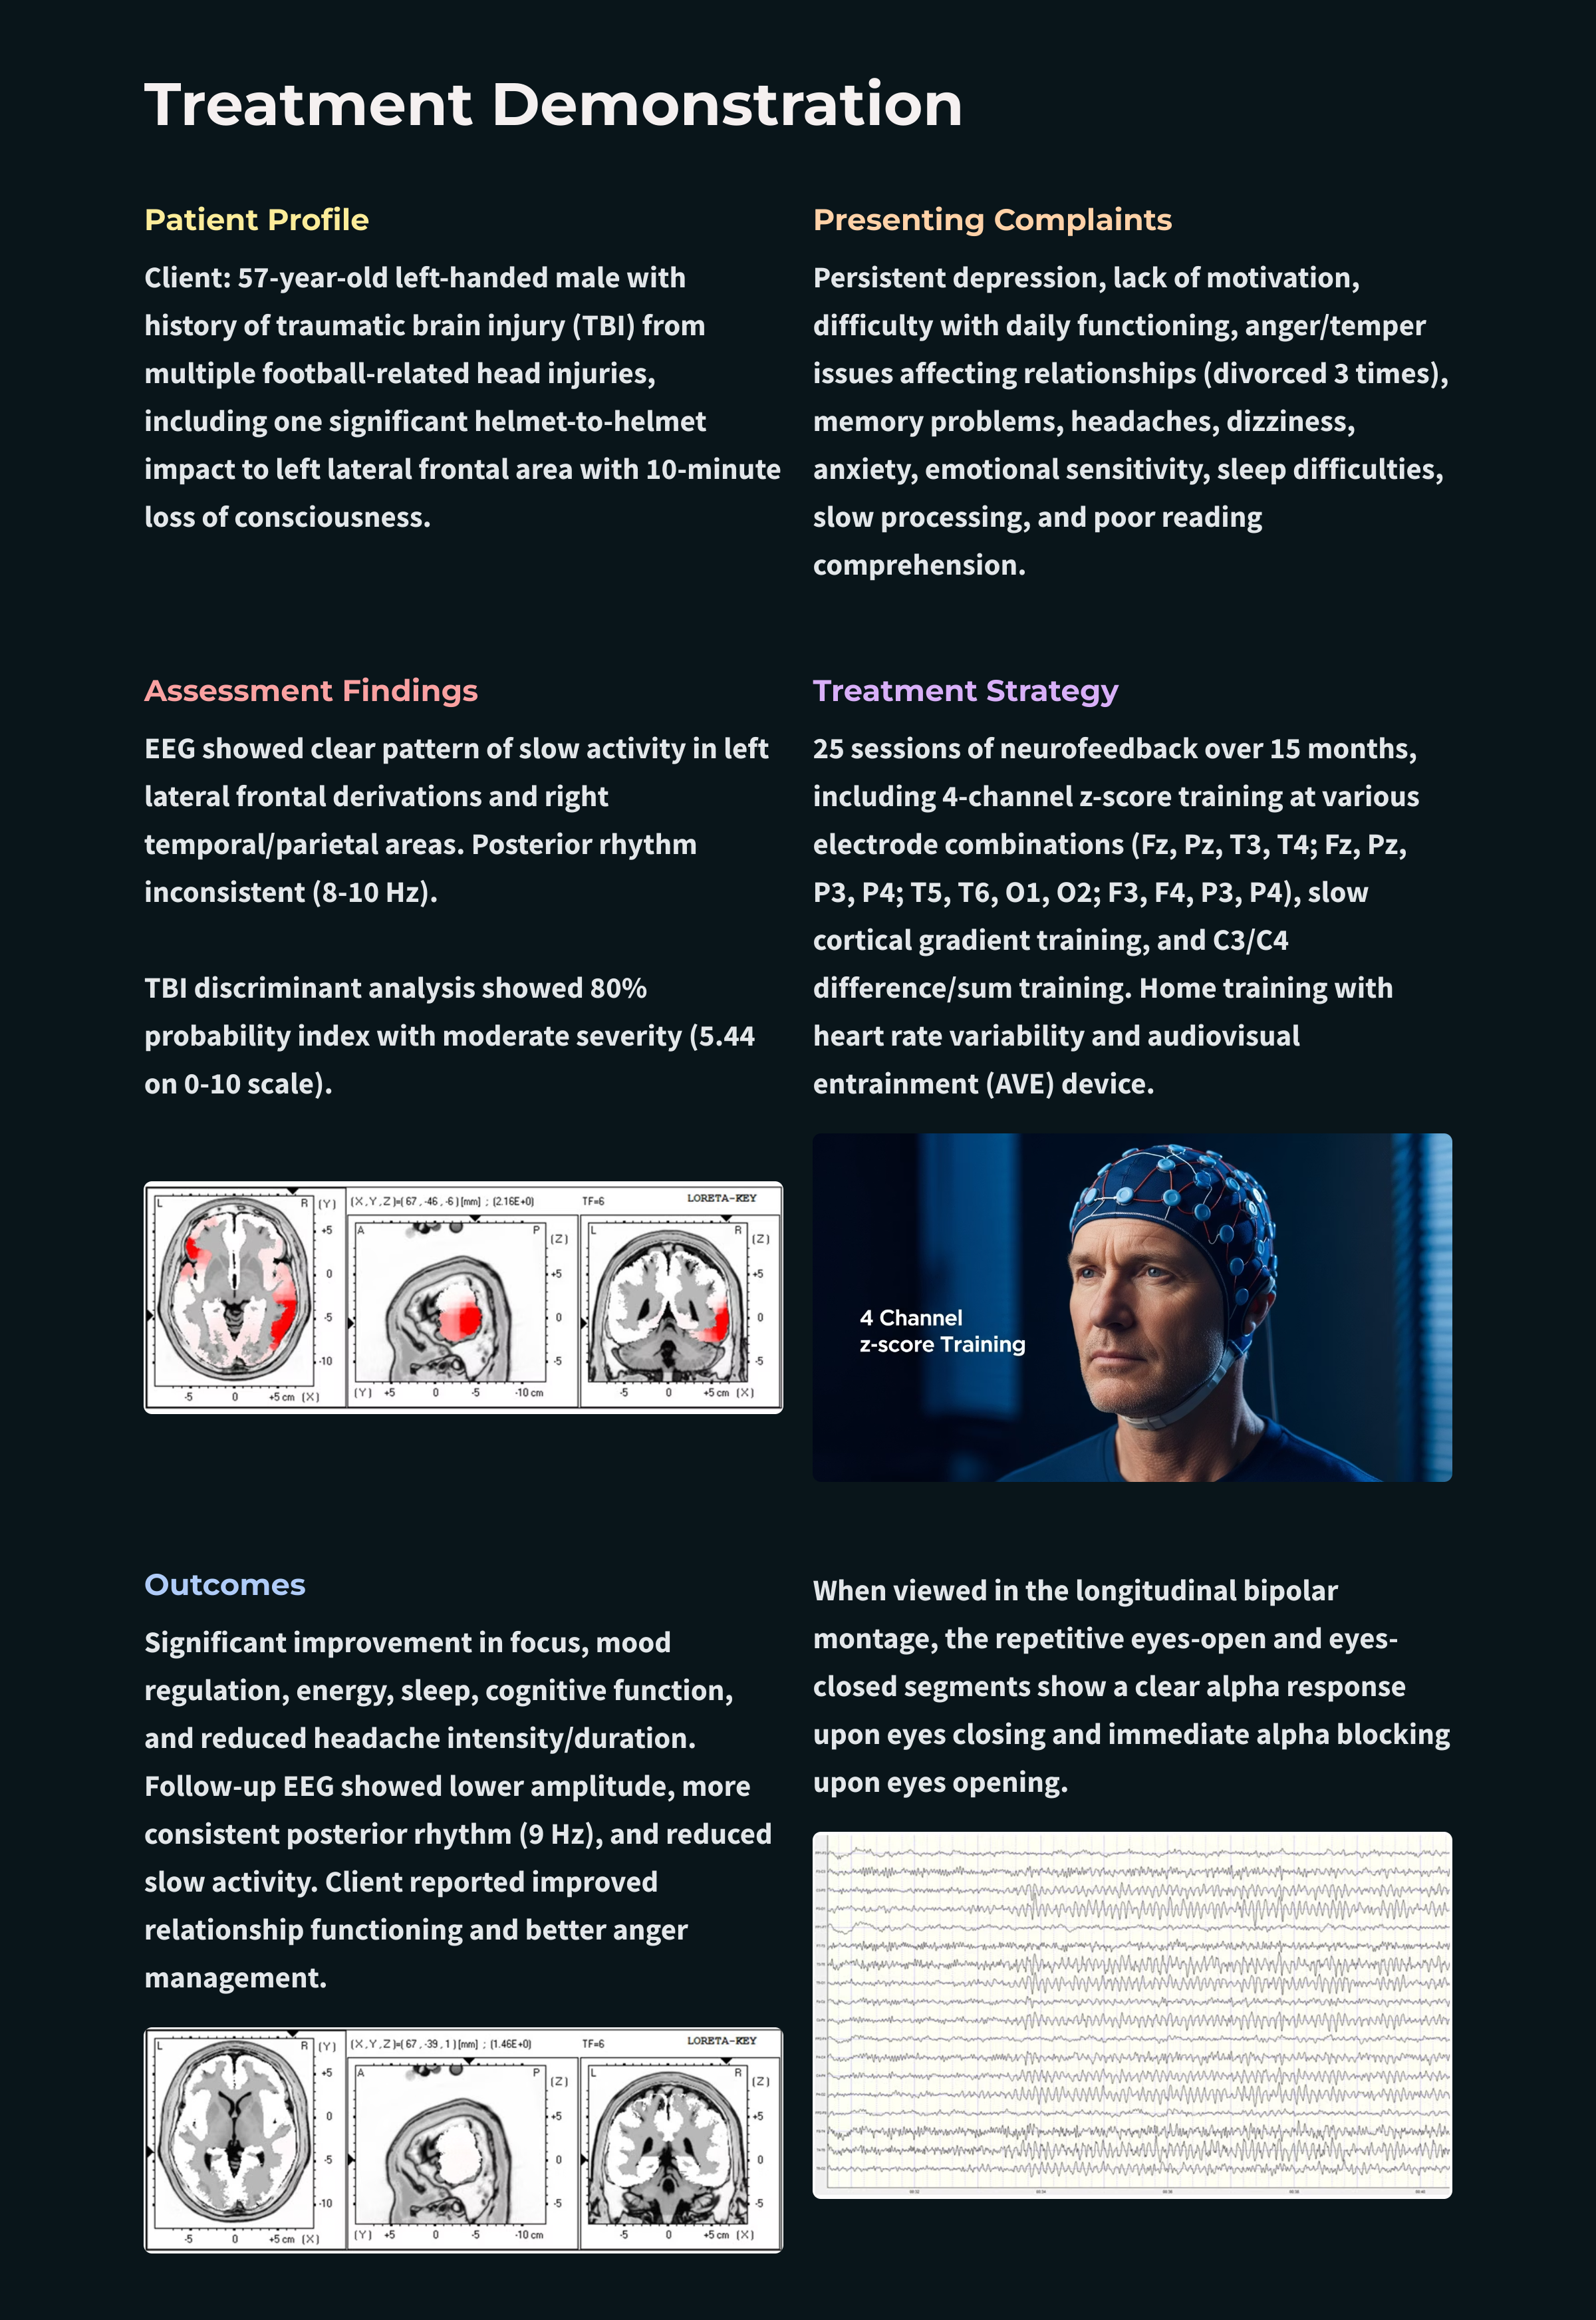
Evidence-based neurofeedback treatment planning relies on a systematic, data-driven approach. Clinicians use assessment data to select initial protocols, monitor progress through ongoing data collection, and adjust training based on client responses. The three case examples in this unit demonstrate how qEEG findings, LORETA analyses, normative databases, and clinical history converge to guide every step of the decision-making process, while maintaining ethical standards of autonomy and informed consent throughout treatment.
Advances in Data-Driven Neurofeedback Protocol Selection
Recent developments in neurofeedback protocol selection increasingly emphasize the integration of multiple data sources. Clinicians now combine qEEG topographic maps, LORETA source localization, normative database comparisons, and functional connectivity analyses to create more precise and individualized treatment plans. Machine learning algorithms are also being explored to assist with pattern recognition in complex EEG datasets, potentially improving the accuracy and efficiency of protocol selection in clinical practice.
Multimodal Treatment Integration
The trend toward combining neurofeedback with other evidence-based interventions, such as cognitive-behavioral therapy, HRV biofeedback, and acceptance and commitment therapy, reflects a growing recognition that complex clinical presentations often benefit from multimodal approaches. Research continues to explore how these combined interventions may produce synergistic effects that exceed the outcomes of any single modality.
Check Your Understanding
- What role do neuroscience and peer-reviewed outcome studies play in the development of neurofeedback treatment protocols?
- In Patient Example A (Client B), what were the key qEEG findings that guided the initial protocol selection, and how did follow-up EEG results support the clinical improvements reported?
- In Patient Example B (TR), how did LORETA analysis help localize the source of excess beta activity, and how did the neurofeedback training protocol address these findings?
- In Patient Example C (Jill), how did the clinician integrate information from the intake interview, standardized questionnaires, EEG assessment, and psychophysiological stress test to develop a comprehensive treatment plan?
- Why is a data-based approach important in neurofeedback treatment planning, and how does ongoing assessment inform protocol adjustments?
Assignment
Now that you have completed this unit, explain the roles of neuroscience and peer-reviewed outcome studies in developing protocols.
Glossary
alpha 1 (low alpha): a protocol-dependent subdivision of the alpha band, commonly 8 to <10 Hz; proposed functional interpretations are not universal.
alpha 2 (high alpha): a protocol-dependent subdivision of the alpha band, commonly 10 to <13 Hz; proposed functional interpretations are not universal.
alpha asymmetry neurofeedback for mood disorders: a neurofeedback protocol intended to modify the left-right frontal alpha-power relationship, usually toward relatively greater left frontal activation; efficacy and optimal parameters remain unsettled.
alpha rhythm: an 8 to <13 Hz EEG rhythm dominant posteriorly during relaxed wakefulness with eyes closed and attenuated by eye opening.
alpha spindles: waxing-and-waning bursts of alpha-frequency EEG activity.
amplitude: the magnitude of a signal's excursion from a specified reference level, reported using a stated convention such as peak, peak-to-peak, or RMS.
beta rhythm: a 13 to <30 Hz EEG rhythm, usually low amplitude, associated with alert wakefulness and active cognitive or motor processing.
beta spindles: trains of spindle-like waveforms, most often frontocentral, with a reported mean frequency of 20.6 Hz (SD = 4.1 Hz) spanning roughly 14-30 Hz. They may signal ADHD, especially with tantrums, anxiety, autism spectrum disorder (ASD), epilepsy, and insomnia.
Broca's area: the area located in the inferior frontal gyrus (BA 44 and 45) of the dominant hemisphere (F7-T3 in the left hemisphere) concerned with speech production, grammar, language comprehension, and sequencing.
Brodmann area (BA): a numbered cytoarchitectural zone of the cerebral cortex mapped by Brodmann from Nissl staining; the numbering runs to 52, but areas 12-16 and 48-51 were defined in non-human species.
connectivity training: neurofeedback in which feedback depends on a specified relation between signals at two or more sites, such as coherence, phase, or amplitude covariation.
default mode network (DMN): a cortical network of sites located in frontal, temporal, and parietal regions that is most active during introspection and daydreaming and relatively inactive when pursuing external goals.
delta rhythm: a 0.5 to <4 Hz EEG rhythm in the tutorial convention, prominent during N3 sleep and potentially abnormal when focal or excessive in awake adults.
dominant frequency: the frequency with the greatest specified amplitude or power within a signal or spectrum.
evidence-based assessment: an evaluation of the client using instruments that are reliable, valid, and possess clinical utility.
gamma rhythm: EEG activity from 30 to <80 Hz under the tutorial's working convention, associated with local cortical processing and vulnerable to muscle artifact.
hertz (Hz): the SI unit of frequency equal to one cycle per second.
high beta: the upper portion of the beta band, most often defined as roughly 20-30 Hz, with some normative databases using a narrower 25-30 Hz band. Elevations are associated with hyperarousal, anxiety, rumination, and worry, and may also reflect EMG artifact.
hypocoherence: lower-than-expected coherence between two recording sites relative to a normative database. Coherence indexes the stability of the phase relationship between two signals and is interpreted as a measure of coupling; it is not a direct measure of communication.
inhibit training: setting a threshold or goal to train a client to limit the activity in selected EEG frequency bands.
local loops: neighboring cortical macrocolumns that share input and fire synchronously to generate frequencies above 30 Hz in the high-beta and gamma ranges.
local synchrony: synchrony that occurs when the coordinated firing of cortical neurons produces high-amplitude EEG signals.
low-resolution electromagnetic tomography (LORETA): the inverse solution of Pascual-Marqui and colleagues (1994) that estimates three-dimensional cortical sources of scalp-recorded EEG at low spatial resolution.
module: a cluster of nodes in a neural network that are more densely interconnected with each other than with nodes outside the cluster.
negative slow cortical potential: a slow negative cortical voltage shift commonly associated with increased cortical excitability and preparation for processing or action.
network node: an entity represented as a vertex in a graph and connected to other vertices by edges.
neural network: a system of interconnected ensembles of neurons that collaborate to achieve a goal.
normative database: a reference set of EEG measures collected from healthy subjects across age ranges, against which an individual client's values are compared as z-scores.
passive volition: an attitude of allowing a desired physiological change to occur without effortful control, often supported by permissive imagery or self-suggestions.
positive slow cortical potential: a slow positive cortical voltage shift commonly associated with reduced cortical excitability.
quantitative EEG (qEEG): the numerical analysis of digitized EEG features, such as spectral power, asymmetry, and connectivity, sometimes compared with normative databases; no universal minimum channel count defines it.
sensorimotor rhythm (SMR): a 12 to 15 Hz rhythm recorded over sensorimotor cortex, enhanced during physical stillness and attenuated by movement; it is defined topographically and behaviorally, so its range overlaps the mu and beta bands.
slow cortical potential (SCP): a very slow EEG voltage shift lasting hundreds of milliseconds to seconds and reflecting changes in cortical excitability and preparation.
slow cortical potential training: neurofeedback that trains voluntary production of negative and positive slow cortical shifts associated with changes in cortical excitability.
swLORETA: a version of sLORETA that adds a singular-value-decomposition-based lead-field weighting, improving localization under realistic noise and for deep sources (Palmero-Soler et al., 2007).
theta/beta neurofeedback: a neurofeedback protocol that typically inhibits selected theta activity while reinforcing beta or sensorimotor-rhythm activity; parameters and evidence vary.
theta/beta ratio (TBR): EEG theta-band power divided by beta-band power using explicitly stated bands, electrodes, reference, and processing methods; it is not a diagnostic test for ADHD.
Wernicke's area: the area of the temporoparietal cortex (BA 22) of the dominant hemisphere specialized for speech comprehension. Damage can result in an inability to understand the meaning of speech and construct intelligible sentences.
z-score training: a neurofeedback approach using standardized deviations from a reference database to guide feedback; thresholds such as ±2 SD are protocol choices, not universal criteria.
References
Amzica, F., & Lopes da Silva, F. H. (2018). Cellular substrates of brain rhythms. In D. L. Schomer & F. H. Lopes da Silva (Eds.), Niedermeyer's electroencephalography: Basic principles, clinical applications, and related fields (7th ed.). Oxford University Press.
Arnold, L. E., Arns, M., Barterian, J., Bergman, R., Black, S., Conners, C. K., Connor, S., Dasgupta, S., deBeus, R., Higgins, T., Hirshberg, L., Hollway, J. A., Kerson, C., Lightstone, H., Lofthouse, N., Lubar, J., McBurnett, K., Monastra, V., Buchan-Page, K., . . . Williams, C. E. (2021). Double-blind placebo-controlled randomized clinical trial of neurofeedback for attention-deficit/hyperactivity disorder with 13-month follow-up. Journal of the American Academy of Child & Adolescent Psychiatry, 60(7), 841-855. https://doi.org/10.1016/j.jaac.2020.07.906
Breedlove, S. M., & Watson, N. V. (2020). Behavioral neuroscience (9th ed.). Sinauer Associates, Inc.
Collura, T. F. (2014). Technical foundations of neurofeedback. Taylor & Francis.
Demos, J. N. (2019). Getting started with neurofeedback (2nd ed.). W. W. Norton & Company.
Gollan, J. K., Hoxha, D., Chihade, D., Pflieger, M. E., Rosebrock, L., & Cacioppo, J. (2014). Frontal alpha EEG asymmetry before and after behavioral activation treatment for depression. Biological Psychology, 99, 198-208. https://doi.org/10.1016/j.biopsycho.2014.03.003
Herbet, G., & Duffau, H. (2020). Revisiting the functional anatomy of the human brain: Toward a meta-networking theory of cerebral functions. Physiological Reviews, 100, 1181-1228. https://doi.org/10.1152/physrev.00033.2019
Kaiser, D. A. (2008). Functional connectivity and aging: Comodulation and coherence differences. Journal of Neurotherapy, 12, 123-139. https://doi.org/10.1080/10874200802398790
Khazan, I., Shaffer, F., Moss, D., Lyle, R., & Rosenthal, S. (Eds.). (2023). Evidence-based practice in biofeedback and neurofeedback (4th ed.). Association for Applied Psychophysiology and Biofeedback.
La Vaque, T. J., Hammond, D. C., Trudeau, D., Monastra, V., Perry, J., Lehrer, P., Matheson, D., & Sherman, R. (2002). Template for developing guidelines for the evaluation of the clinical efficacy of psychophysiological interventions. Applied Psychophysiology and Biofeedback, 27(4), 273-281.
Lovibond, S. H., & Lovibond, P. F. (1995). Manual for the Depression Anxiety Stress Scales (2nd ed.). Psychology Foundation of Australia.
Monastra, V. J., Lubar, J. F., & Linden, M. (2001). The development of a quantitative electroencephalographic scanning process for attention deficit-hyperactivity disorder: Reliability and validity studies. Neuropsychology, 15(1), 136-144. https://doi.org/10.1037/0894-4105.15.1.136
Monastra, V. J., Lubar, J. F., Linden, M., VanDeusen, P., Green, G., Wing, W., Phillips, A., & Fenger, T. N. (1999). Assessing attention deficit hyperactivity disorder via quantitative electroencephalography: An initial validation study. Neuropsychology, 13(3), 424-433. https://doi.org/10.1037/0894-4105.13.3.424
Nunez, P. L., & Srinivasan, R. (2006). Electric fields of the brain: The neurophysics of EEG (2nd ed.). Oxford University Press.
Palmero-Soler, E., Dolan, K., Hadamschek, V., & Tass, P. A. (2007). swLORETA: A novel approach to robust source localization and synchronization tomography. Physics in Medicine and Biology, 52(7), 1783-1800.
Pascual-Marqui, R. D., Michel, C. M., & Lehmann, D. (1994). Low resolution electromagnetic tomography: A new method for localizing electrical activity in the brain. International Journal of Psychophysiology, 18(1), 49-65. https://doi.org/10.1016/0167-8760(84)90014-X
Swingle, P. G. (2015). Adding neurofeedback to your practice: Clinician's guide to ClinicalQ, neurofeedback, and braindriving. Springer.
Tan, G., Shaffer, F., Lyle, R. R., & Teo, I. (Eds.). (2016). Evidence-based practice in biofeedback and neurofeedback (3rd ed.). Association for Applied Psychophysiology and Biofeedback.
Thatcher, R. W. (1998). Normative EEG databases and EEG biofeedback. Journal of Neurotherapy, 2(4), 8-39. https://doi.org/10.1300/J184v02n04_02
Thatcher, R. W., Lubar, J. F., & Koberda, J. L. (2019). Z-Score EEG biofeedback: Past, present, and future. Biofeedback, 47(4), 89-103. https://doi.org/10.5298/1081-5937-47.4.04
Thompson, M., & Thompson, L. (2015). The neurofeedback book: An introduction to basic concepts in applied psychophysiology (2nd ed.). Association for Applied Psychophysiology and Biofeedback.
Return to Top