Without a basic understanding of electricity and the circuits
used in biofeedback instruments, we might mistakenly accept readings
produced by equipment misuse or breakdown. "Garbage in, garbage out."
BCIA Blueprint Coverage
This unit addresses III. Instrumentation and Electronics - A. Essential Terms and Concepts.
This unit covers Basic Terms and Metrics, EEG Recording, and Safety Precautions.
Please click on the podcast icon below to hear a full-length lecture.
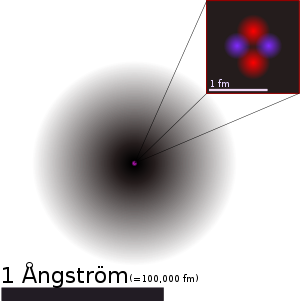
How does a carbon atom differ from a sodium atom? The difference lies in
the number of protons located in the nucleus. A carbon atom has 6 protons,
while a sodium atom has 11. The total number of protons determines the
atomic number. The number of protons and neutrons approximates the
atomic
weight.
Ions are atoms or molecules charged by the gain or loss of electrons. The
biological
potentials produced by cortical neurons (EEG), eccrine sweat glands
(EDA), and skeletal muscles (SEMG) are currents of ions. The ions
most responsible for these signals are chloride (Cl-), potassium (K+),
and sodium (Na+).
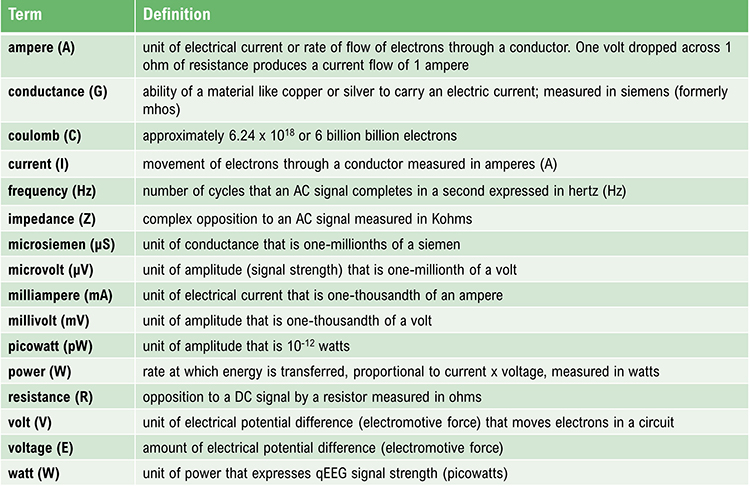
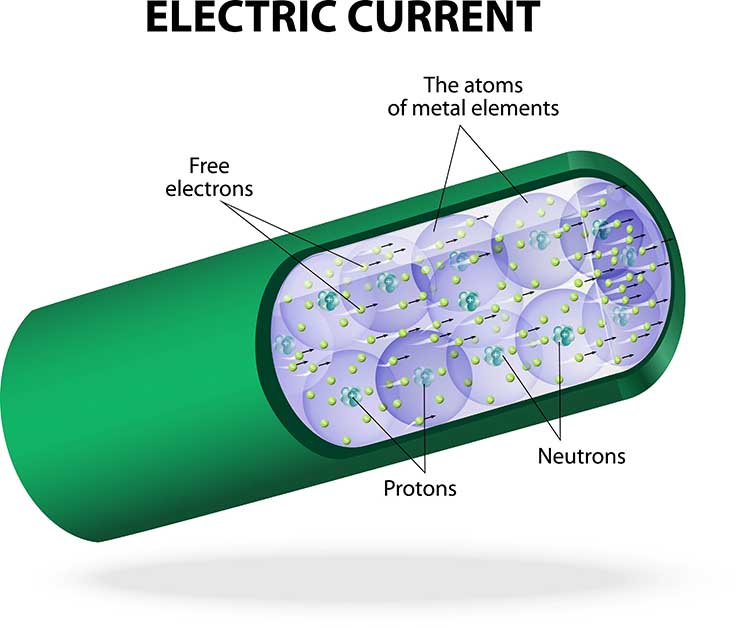
Current (I) is the movement of electrons through a conductor. Current flows because
atoms and molecules contain two types of electrical charge: positive and negative. Opposite charges attract while
identical charges repel each other. When there is a difference in the overall charge of atoms between two points—for
example, between two ends of a wire—negatively charged electrons will flow toward the positively charged
end of the wire, creating an electric current.
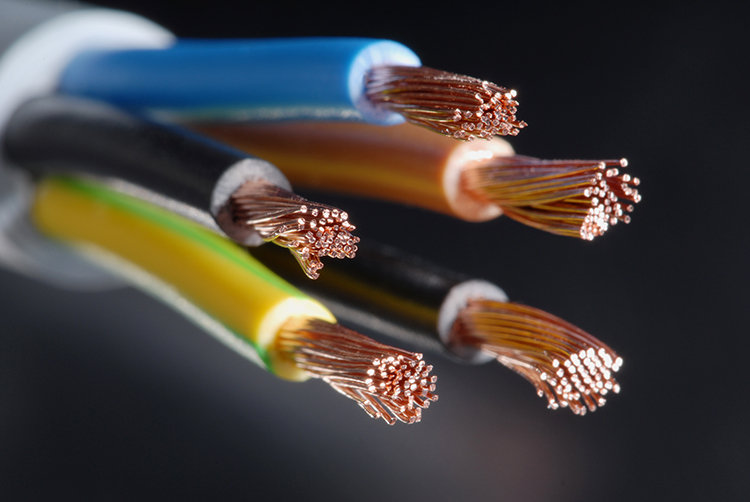
Electrons are also affected by the materials in their path. Conductors like copper allow electron movement, while the insulators
enclosing the wires oppose their movement.
Biological signals like the EEG travel through interstitial fluid,
which is the fluid between the cells in our bodies. Signals like the EEG bump their way
through body fluids as a current of colliding ions (not electrons) until they reach the skin. This process, called volume conduction, allows us to eavesdrop on the scalp's cortical potentials instead of inserting electrodes inside the brain.
Insulation from body fat, connective tissue, and the epidermis (outer skin layer) interferes with ion current
flow and can significantly reduce surface EMG readings. Like the rubber covering the wiring of a muscle electrode, insulators block the flow of electric currents. In natural and
fabricated insulators, a large number of electrons in their final energy level produces a cohesiveness that
resists electron loss due to collision. The best insulators, like rubber, possess the maximum number of outer-level electrons (Nilsson & Riedel, 2008).
Measuring Current
When we measure current, we learn how much "x" has passed by a point over a fixed period. The
"amount" of electric current is measured in amperes (A). You have used 1
ampere of current when 1 coulomb (6.24 x 10¹⁸ or 6 billion billion electrons) has
passed a point in 1 second (Kubala, 2009).
Electricity travels as either a direct current (DC) or alternating current (AC). Direct current (DC)
is the flow of electricity in one direction—from negative to positive. A difference in electrical potential
pressures electrons to move. The negative end of a wire repels electrons (e-) while the positive end attracts
them. Biological signals representing peripheral blood flow (blood volume pulse and skin temperature),
respiration, and skin electrical activity are all DC signals.
When we plot DC signals against time, they never completely reverse direction over a second. The
electroencephalogram (EEG) contains both DC (slow cortical potentials) and AC (slow cortical potentials and delta
through 40-Hz) waveforms. BioGraph ®
Infiniti blood volume pulse (BVP)
display.
In the space of a second, an alternating current (AC) regularly reverses direction 50
or 60 times. The frequency of an alternating
current is the number of cycles completed per second or hertz (Hz). Electrical potentials detected from the
cerebral cortex (EEG), heart (ECG), and skeletal muscles (SEMG) all contain AC waveforms (Kubala, 2009). Check out the YouTube video AC and DC Differences.
BioGraph ®
Infiniti 60-Hz artifact display. The software uses an auto-scale feature to keep the fluctuating signal on the
screen.
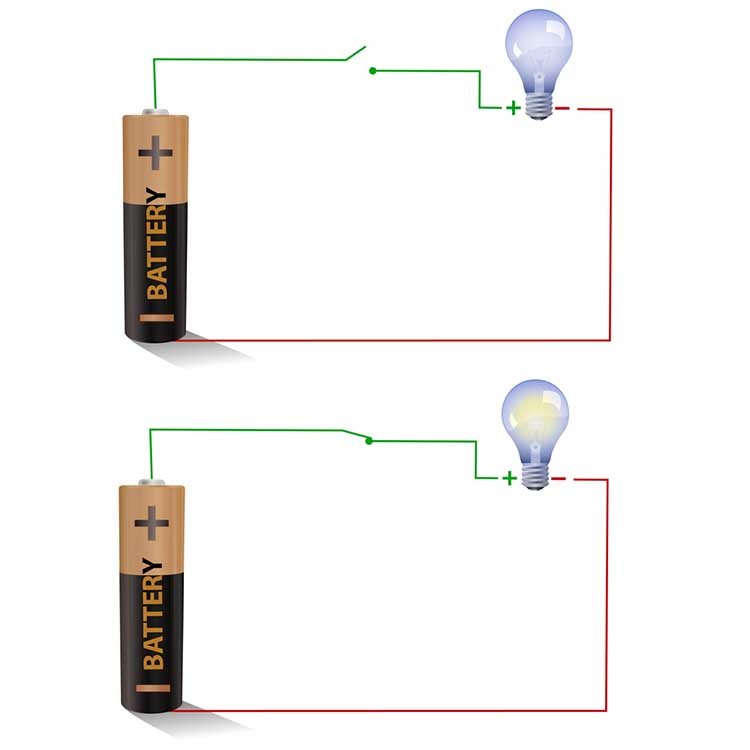
What forces electrons to move through a circuit? Electrons flow when there is a difference in electrical
potential or charge.
A flashlight works because its battery contains negative and positive poles. These two
regions of opposite charge produce an electrical potential difference called the electromotive force (EMF) that
drives the current ahead. The electrical potential difference can be considered the "strength" of the
current. A battery's negative pole repels electrons (e-) while its positive pole attracts them, resulting in
current flow. If the battery's two poles had identical charges, instead, electrons would stay put. No potential
difference, no current, and no light (Nilsson & Riedel, 2008).
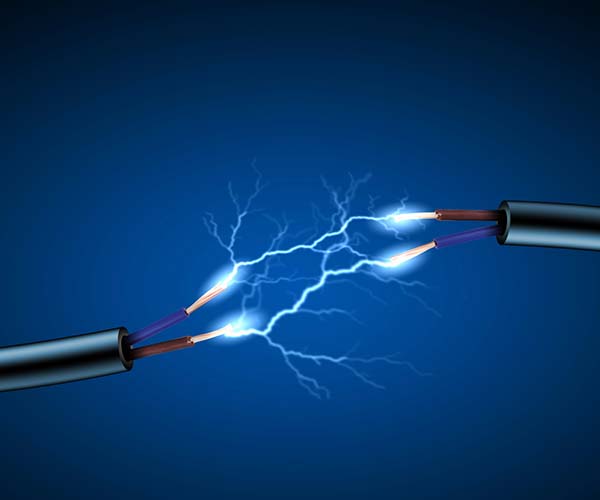
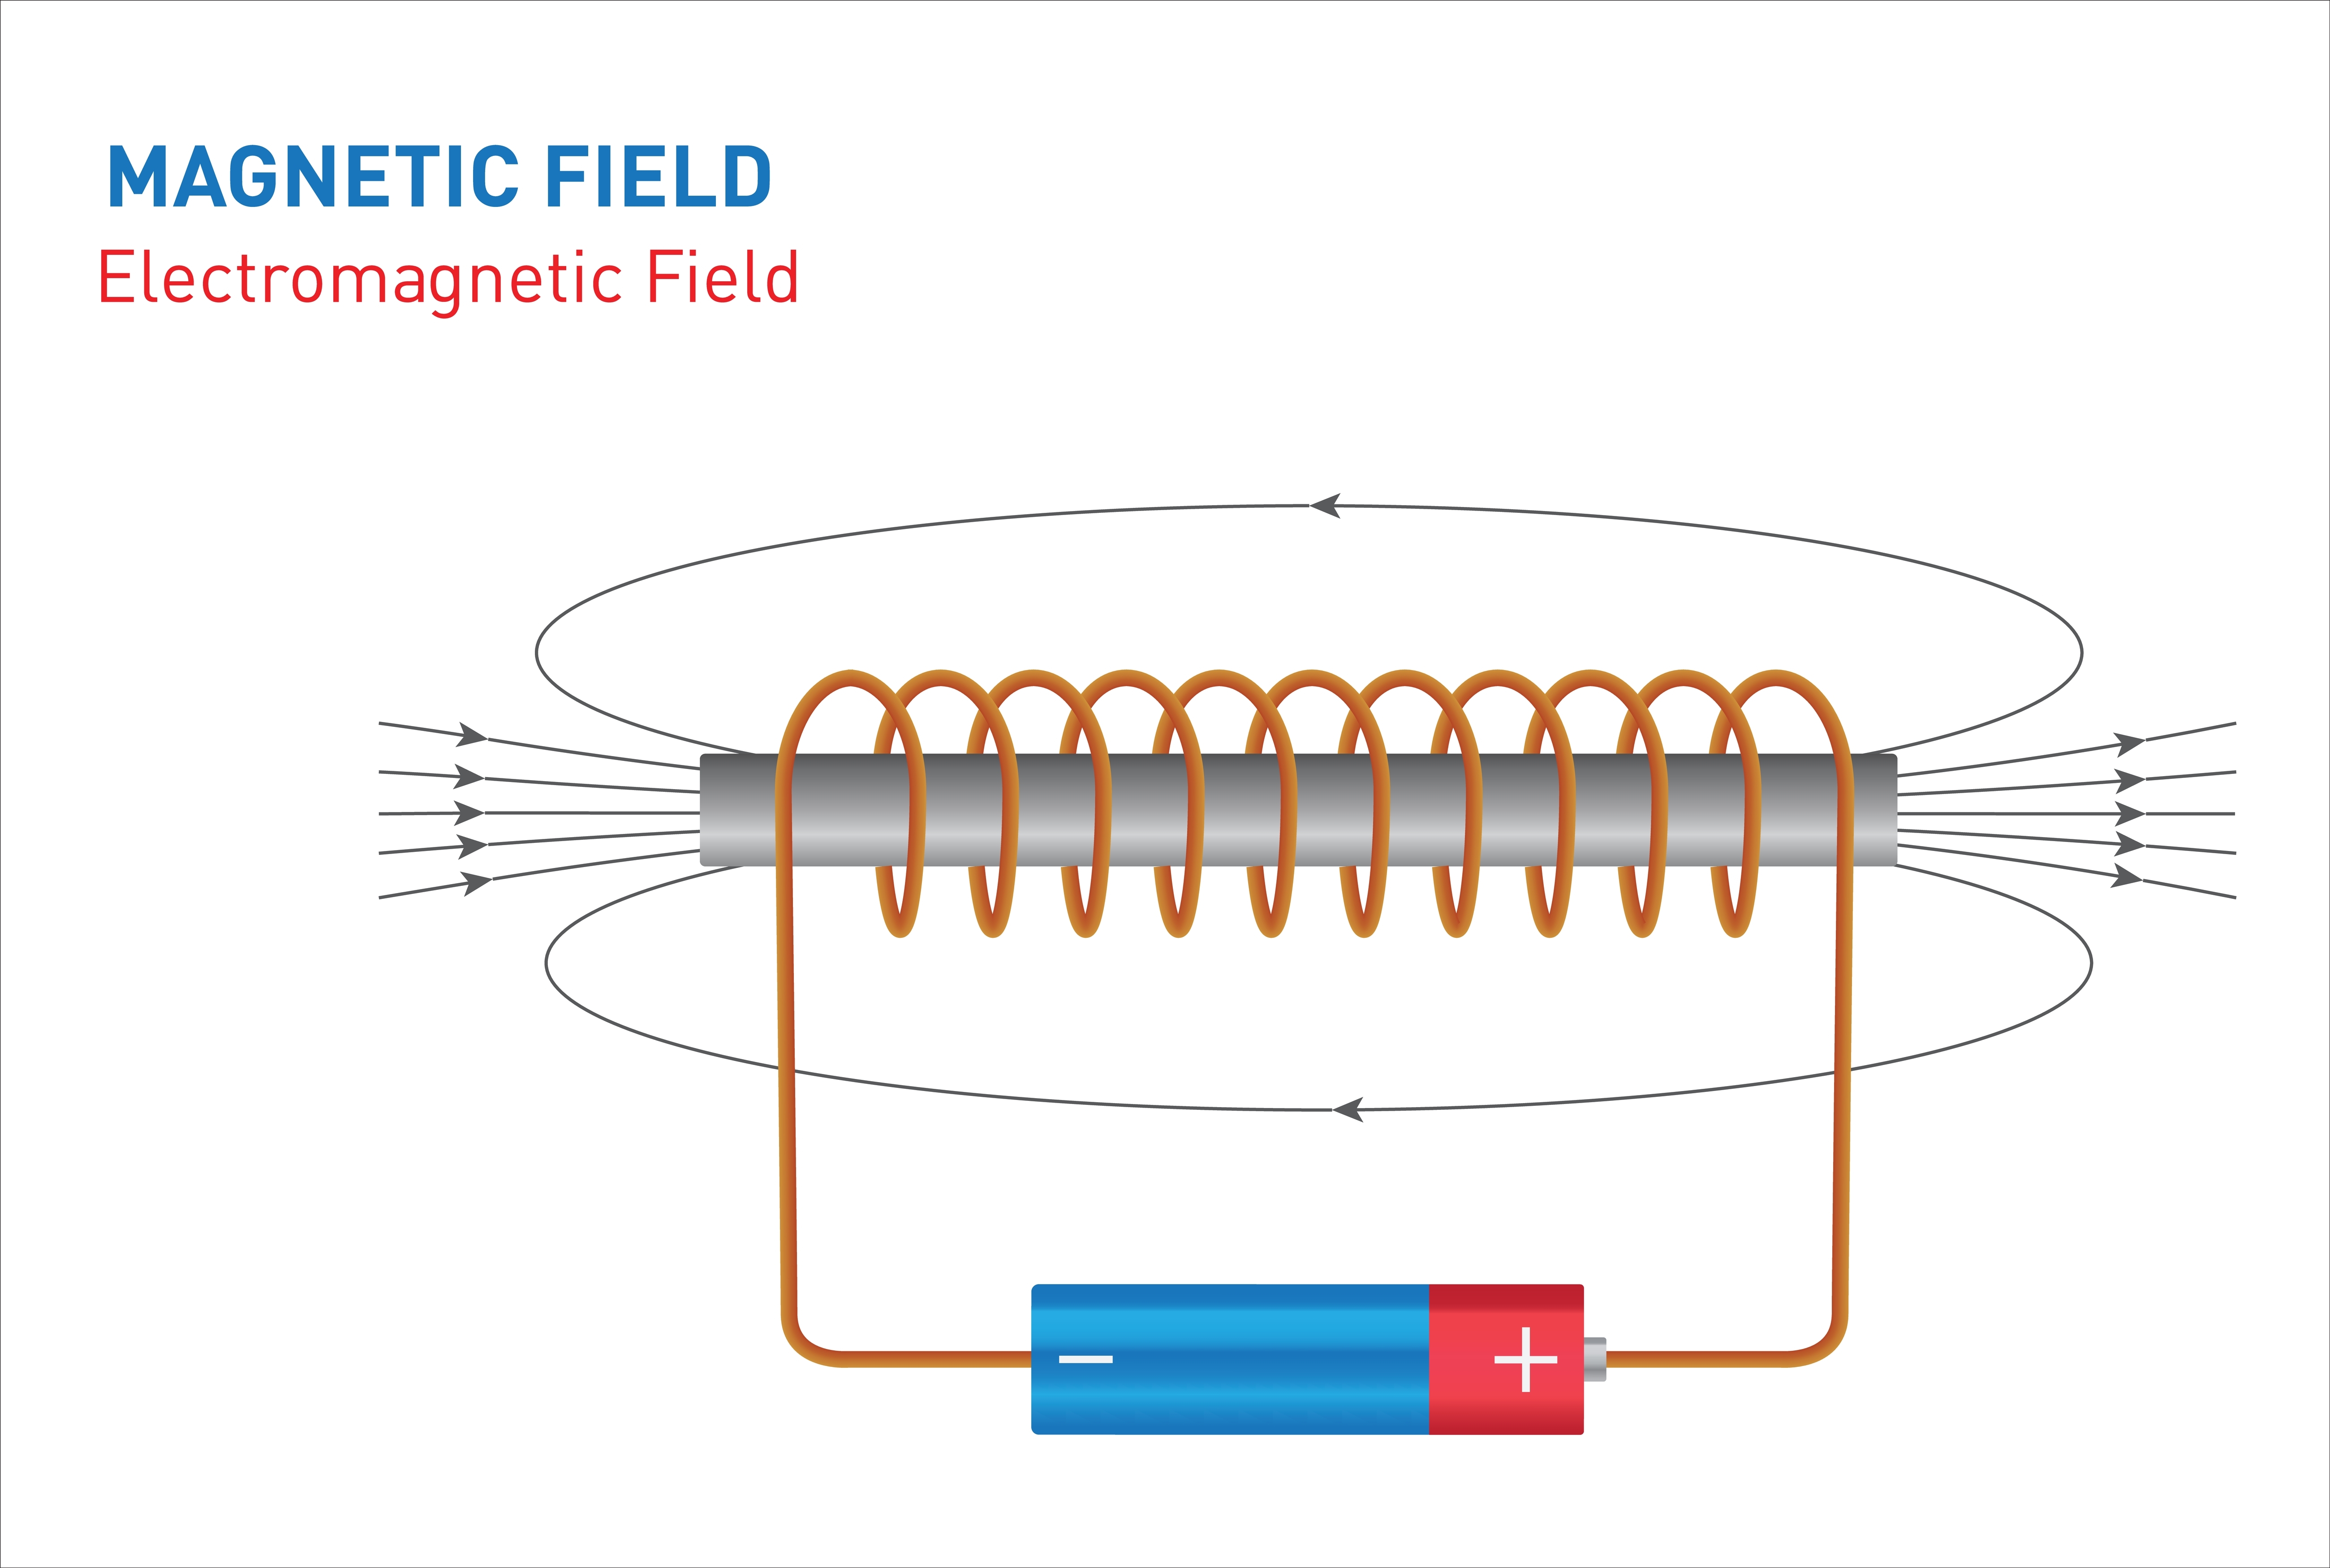
Electromagnetic Fields Carry Energy Instead of Electrons
The classic model of electrons traveling through conductors in two directions is an explanatory fiction. Electrons don't actually travel from battery to light bulb or power plant to your microwave. As the Veritasium video shows, it is electromagnetic fields (shown above) that travel and carry energy in one direction. This is true for sunlight, powerlines, and neurons. Watch the YouTube video, The Big Misconception About Electricity.
Voltage
The pressure a battery exerts on electrons flowing through a flashlight is measured in volts (E).
A typical flashlight battery is rated at 1.5 volts. One volt is the potential difference required to make 1 coulomb (6.24 x 10¹⁸ electrons) perform 1 joule of work. Voltage indexes signal power (Nilsson & Riedel, 2008).
When monitoring biological signals, you will record signals ranging from microvolts or
μV (millionths of a volt) to millivolts or mV (thousandths of a volt). EEG and SEMG amplitudes are measured in microvolts (μV) and
are usually less than 100 μV.
In neurofeedback, clinicians and researchers increasingly express the quantitative EEG (qEEG) signal strength, digitized statistical brain mapping using at least a 19-channel montage to measure EEG amplitude within specific frequency bins, in picowatts (trillionths of a watt).
Watts
An electric current’s overall power depends on the amount of current flowing through a circuit (measured in
amperes) and the electric potential driving it (measured in volts). Electric power is measured in watts (W). One watt is equal to one ampere moving at one volt. Multiplying amperes by volts
produces the number of watts. For example, an appliance that uses 10 amperes and runs on 115 volts consumes 1150
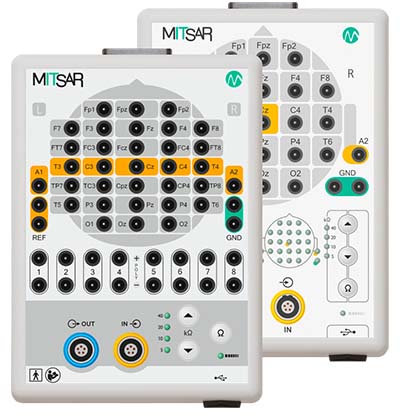
watts of power (Kubala, 2009). Below are 21- and 32-channel Mitsar amplifier systems featured on the NovaTech EEG website.
Resistance
The electrons moving through a conductor encounter opposition which reduces current flow. This phenomenon is
called resistance (R) in DC circuits and impedance (Z) in AC circuits and is measured in ohms
(Ω). Resistance depends on the number of electrons found in an atom's
outermost energy level.
Increasing the numbers of electrons in this level binds these electrons more tightly
together. This cohesiveness reduces the loss of electrons due to collisions with free electrons.
Resistance is a practical concern in biofeedback. Biological signals compete with stronger false signals
for a biofeedback instrument's attention. Clinicians clean, abrade and apply conductive gel to their clients'
skin when monitoring the brain (EEG) and skeletal muscles (SEMG). Since dead skin, oil, and dirt block biological
potentials from reaching electrodes, these precautions improve signal reception.
Dry electrodes like BrainMaster's Freedom 20R do not require time-consuming skin preparation and the application of conductive paste.
Skin resistance is also a biological signal, in its own right, that
reflects emotional and cognitive processes. Clinicians measure skin
resistance level (SRL) by running an AC or DC across the inner
surface of the fingers or palm. SRL is expressed in Kohms of resistance
per cm2. Typical values range from 0-500
Kohms/cm2. Lower values reflect
more intense sweat gland activity since moisture reduces resistance.
Resistance is
expressed in ohms (Ω). Conductance is now measured in Siemens and was
previously measured in mhos (mho is ohm spelled backwards). Skin conductance is one index of
eccrine sweat gland activity.
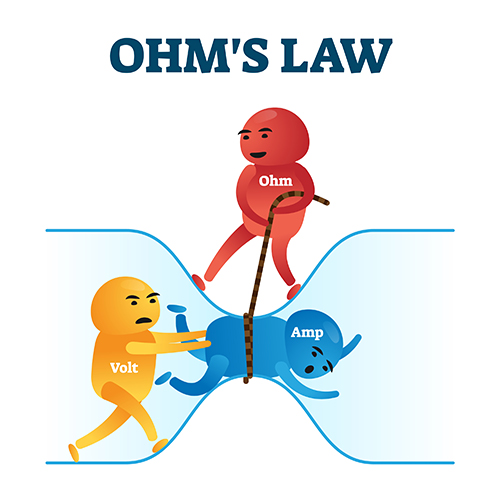
Ohm's Law
Ohm’s law states that the “amount” of current (I) flowing through a
conductor is equal to the voltage (E) (the “push”) divided by the resistance (R). These values are
measured in amperes, volts, and ohms, respectively (Nilsson & Riedel, 2008).
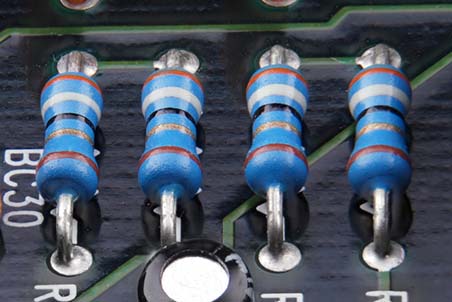
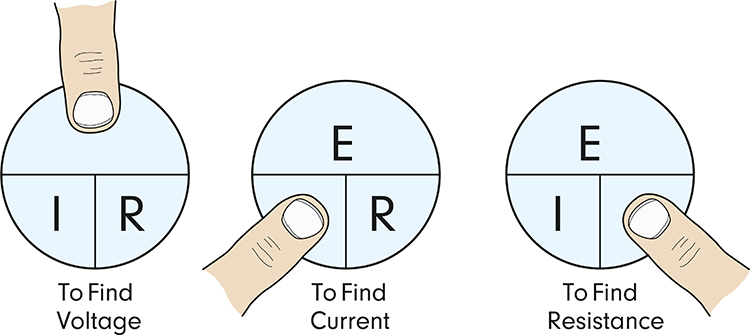
First, if voltage (E) = current (I) x resistance (R), then we can
increase the voltage by increasing current or resistance. Hardware designers
use this relationship to increase the voltage reaching an
electroencephalograph. When EEG voltages (current) enter an
electroencephalograph's amplifier, they are dropped across a network of
resistors (resistance). This large differential input impedance increases
the EEG voltage seen by an electroencephalograph, which helps separate
EEG voltages from artifacts.
Second, we can restate Ohm's law from the standpoint of current. If
current (I) = voltage (E) / resistance (R), then we can increase current
by increasing voltage or reducing resistance. This relationship is the
reason clinicians prepare the skin when monitoring the EEG. Skin abrasion and application of conductive gel/paste minimize resistance. This increases the current reaching EEG electrodes, which helps an electroencephalograph distinguish EEG activity from artifacts.
Impedance
In AC circuits, current periodically reverses direction. This
introduces frequency, the number of cycles completed each
second. Frequency is measured in hertz (Hz). When an AC travels
through a circuit at a given frequency, it encounters a complex form of opposition called impedance (Z),
measured in ohms (Ω). Impedance reduces current flow between electrodes and the brain surface.
Clinicians perform an impedance test to determine whether they have correctly cleaned and abraded
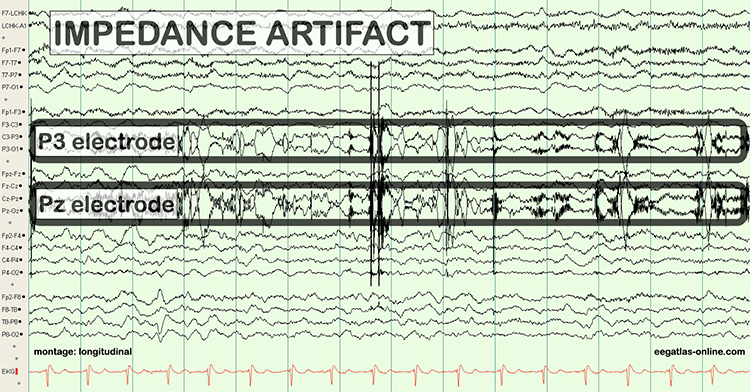
the skin and applied electrodes with sufficient gel or paste (Andreassi, 2007). Excessive impedance means that a weak biological signal must
compete at a disadvantage with false electrical signals like power line artifacts. This could contaminate the EEG
signal so severely that the electroencephalograph displays power line fluctuations instead of cortical activity.
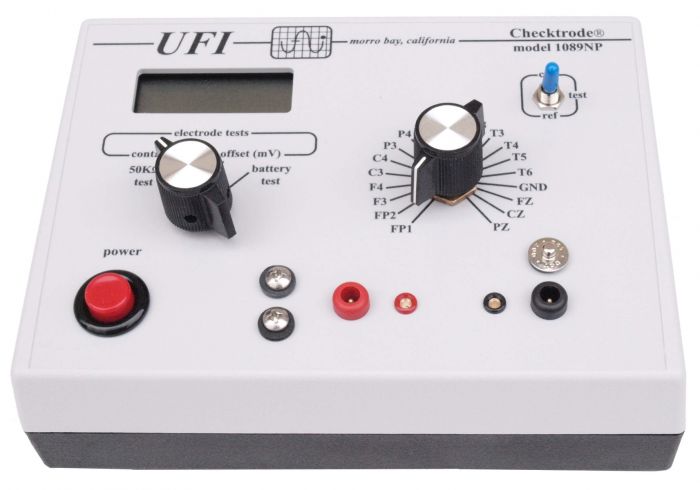
We measure skin-electrode impedance by passing an AC through pairs of electrodes. An impedance test can be manually performed with a separate impedance
meter (AC). Graphic from the bio-medical.com website.
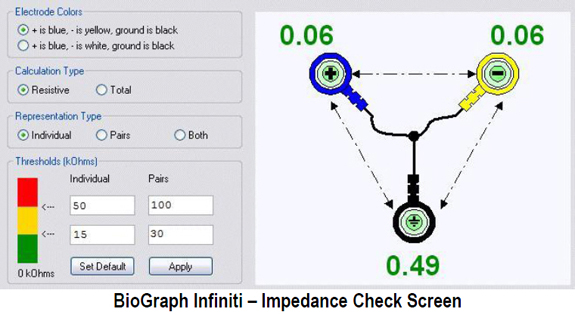
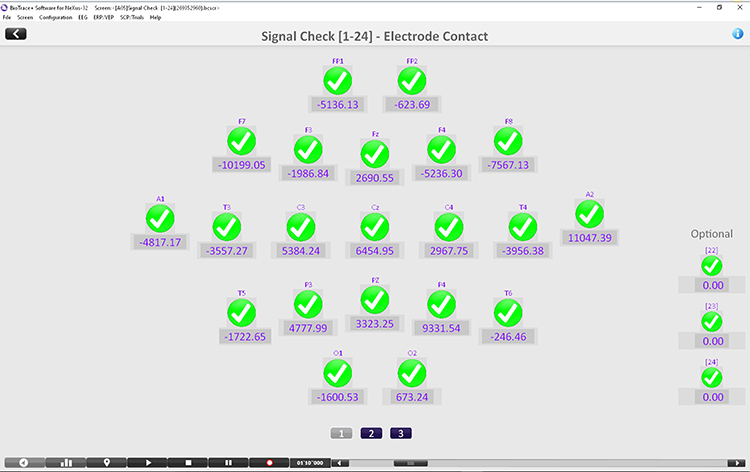
An impedance test may also be performed by software integrated with a
data acquisition system and sensors.
After the practitioner has positioned all electrodes, they should check their impedances or offsets using methods appropriate for their equipment. Electrodes that show excessive values can be reapplied after removing them to prepare the electrode site again, if necessary.
When the skin-electrode impedance at two sites is unequal, the resulting signals will appear to have different amplitudes when they reach the amplifier, regardless of the actual values. Unbalanced impedance will also increase DC offset values due to the battery effect. The amplifier will boost the resulting inaccurate input, which will be displayed to your client.
When a clinician fails to ensure low and balanced impedances at the start or during a training session, feedback regarding signal amplitude within specific frequency bands will be inaccurate. The wrong thresholds may be selected.
Michael and Lynda Thompson provided an example of an impedance problem that developed during a session because a hyperactive child scratched his ears, resulting in high and imbalanced impedances. Following corrective action that restored acceptable impedance values, high-beta activity (24-32 Hz) declined from 10-15 to 4 μV, gamma activity (45-58 Hz) declined below 2 μV, and SMR and beta activity returned to previous session values (Thompson & Thompson, 2015, p. 66).
We can extend Ohm's law to AC circuits by substituting impedance (z) for resistance and using lower case letters
for voltage and current. The revised expression is voltage = current x impedance (e = i x z). This means that
voltage is the product of a current flowing across an impedance. In actual units, 50 volts = 10 amperes x 5
ohms.
Open and Closed Circuits
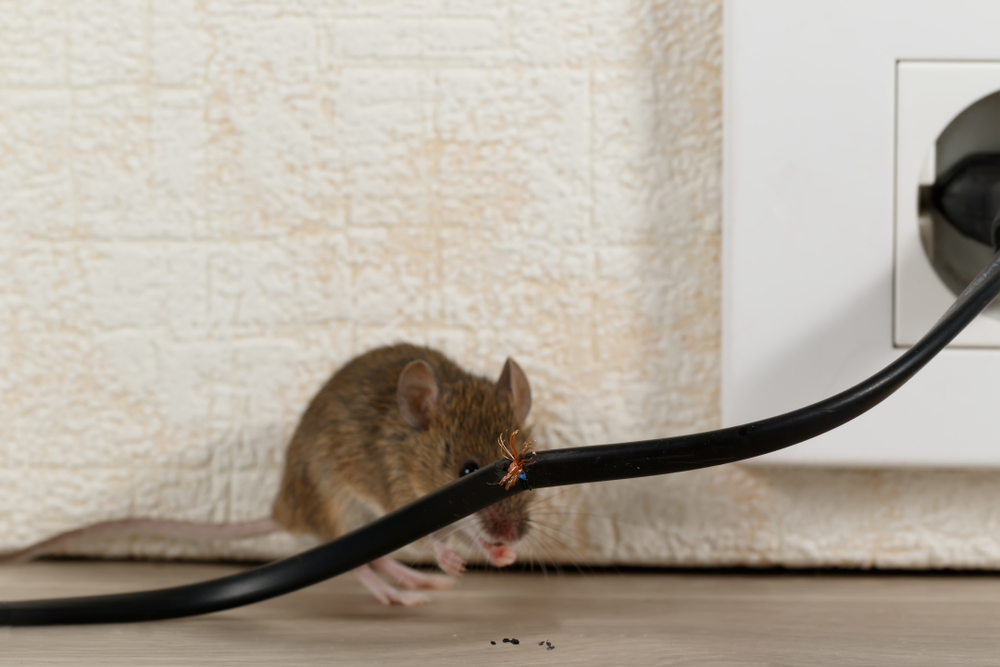
Broken electrode cables are a significant cause of equipment malfunction since they prevent electron movement.
Clinicians perform a continuity test to check if a cable is damaged. An impedance
meter sends an AC signal down the cable to measure opposition to current flow. If there is a break, there is no
continuity, and the circuit is described as open. Impedance will be infinite since
current cannot flow across space.
Behavioral tests, also called tracking
tests, check whether the circuit is closed and evaluate the performance of the entire data acquisition system.
For example, when monitoring EEG activity, a
clinician can test the performance of the entire signal chain
(EEG sensor, differential amplifier, gain amplifier, cable, encoder, and computer) by asking a
client to close and then open the eyes. If the computer display mirrors these actions, the behavioral test has been passed, confirming no breaks in the cable.
Visualize a bare wire inside an electroencephalograph touching its metal case.
The AC powering this equipment could leak through the metal case
and injure anyone touching this surface.
Preventing Signal Contamination
Physiological signals are pretty small compared to surrounding
electromagnetic “noise.” They need to be amplified to be distinguishable
from background noise.
Physiological monitoring requires high-quality connections between the
subject and the electronic device. The quality of that connection
determines the quality of the signal (information) gathered from that
connection. Connections that are of poor quality, for whatever reason,
produce poor quality (contaminated) information.
Many factors affect connection quality. These connection points include
the skin surface, conductive gel or paste, sensors, and connecting wires.
EEG Recording
Electrodes
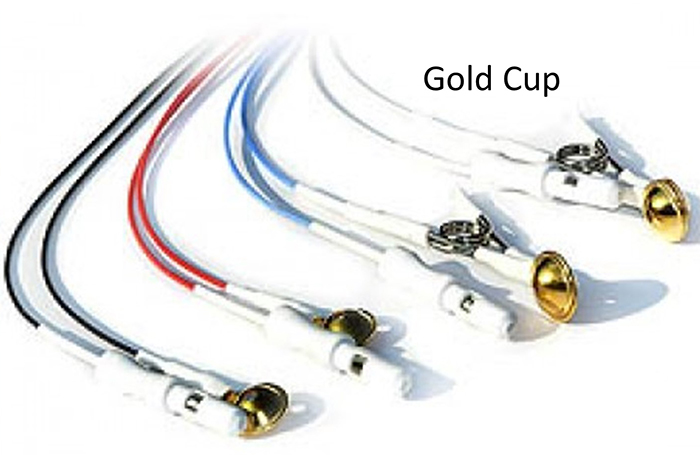
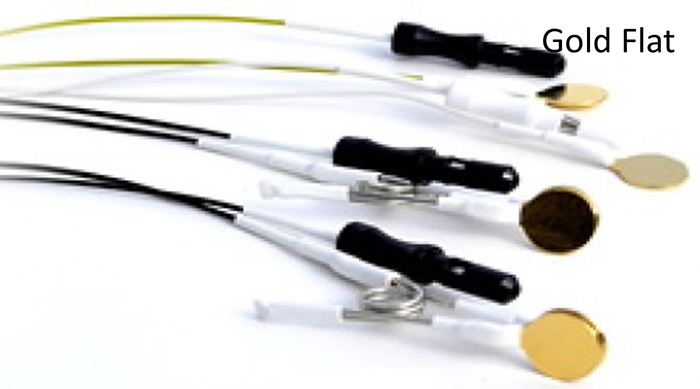
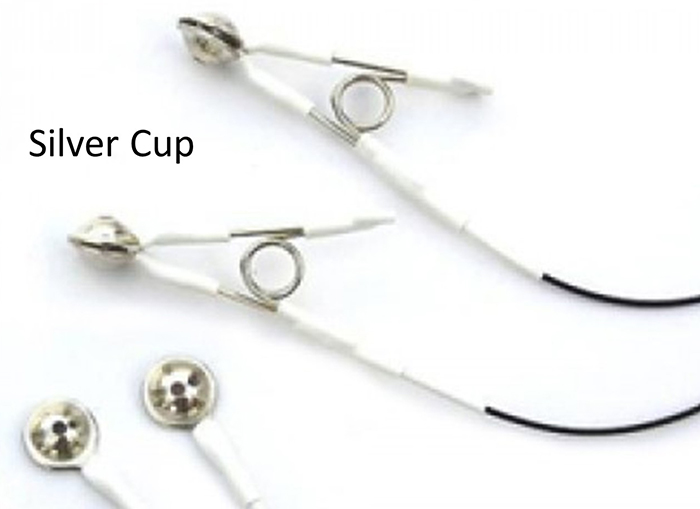
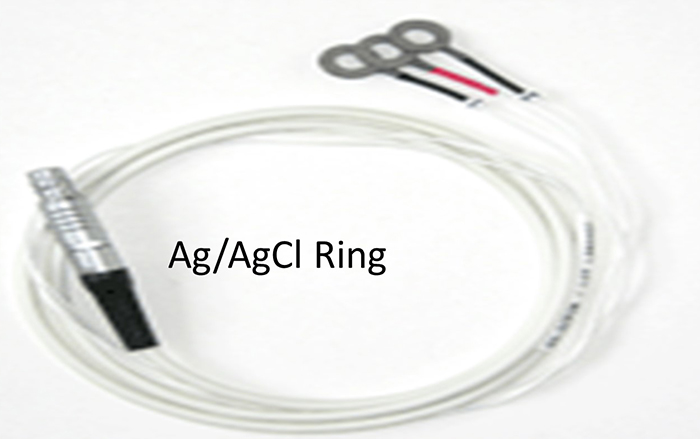
Electrodes detect biological signals. They are also
transducers since
they convert energy from one form to another. Four types of EEG electrodes are shown below: gold cup, gold flat, silver cup, and silver/silver-chloride ring.
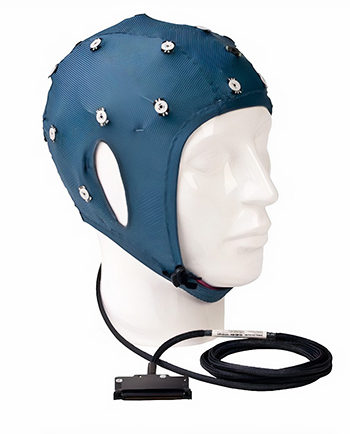
Cap systems like the NeXus EEG cap share a connector containing a pin or other type of connector for each electrode. These connectors plug all electrodes into the amplifier at the same time.
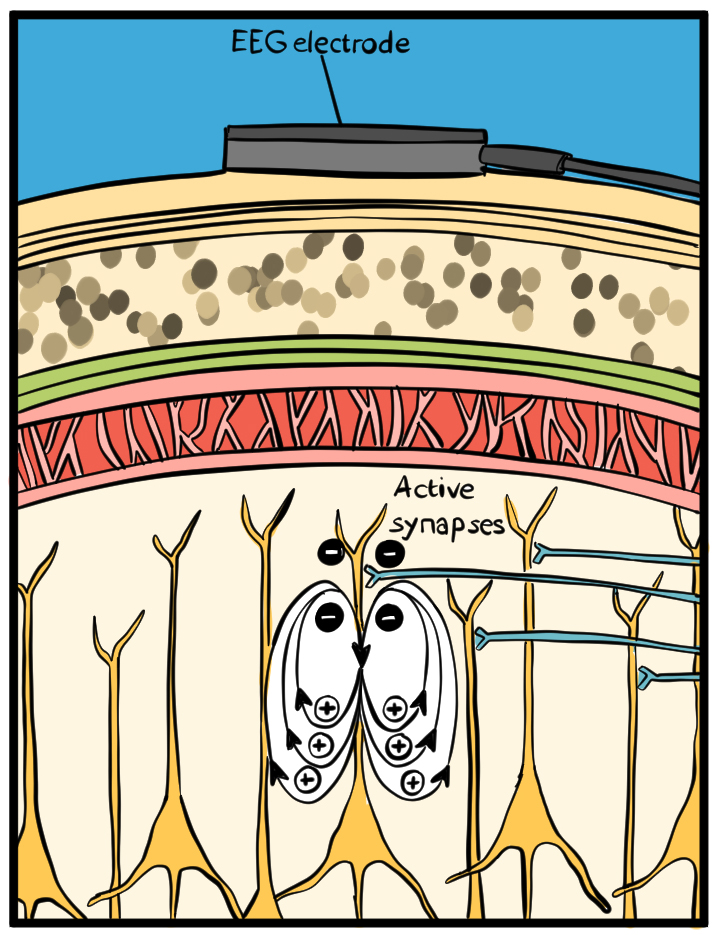
Consider how EEG electrodes work. In response to chemical and electrical synaptic messages, the dendrites of cortical pyramidal neurons develop excitatory postsynaptic potential (EPSPs) and inhibitory postsynaptic potentials (IPSPs) that travel about 10-12 centimeters as a current of ions through the cortex, blood vessels, glial cells, interstitial fluid, meninges, and skull to electrodes located on the scalp. This
process is called volume conduction.
Electrodes transform this current of
ions into a current of electrons that flows through the cable into an
electroencephalograph’s input jack.
The EEG signal is attenuated during volume conduction. The volume-conducted signal that
reaches EEG electrodes is measured in
microvolts or millionths of a volt.
How do EEG electrodes work? When an EEG electrode is filled with a conductive gel or paste, the electrode metal donates ions to the electrolyte. In
turn, the electrolyte contributes ions to the metal surface. Electrodes create a DC voltage between the electrode metal and the electroconductive gel or paste. Signal
conduction succeeds as long as electrode and electrolyte ions are freely
exchanged.
Recording Problems
Conduction breaks down during polarization when chemical reactions produce separate
regions of positive and negative charge where the electrode and gel make
contact. DC flows across the connection between an electrode and the scalp. The current carries positive ions to the more negative region of this junction and negative ions to the more positive region. This build-up of ions polarizes the electrode to favor current flow in one direction and resists flow in the other.
When an electrode is polarized, ion exchange is reduced, and
impedance increases, weakening the signal reaching the electroencephalograph.
This problem can result from routine clinical use. Electrode
manufacturers control this problem by using silver/silver-chloride or
gold electrodes that resist polarization.
Bias potentials are a second potential recording problem. They result from the exchange of metal ions donated by the electrodes and electrolytes in the absence of a biological current. Bias potentials can be prevented by using electrodes with intact surfaces and identical materials (e.g., all gold or silver).
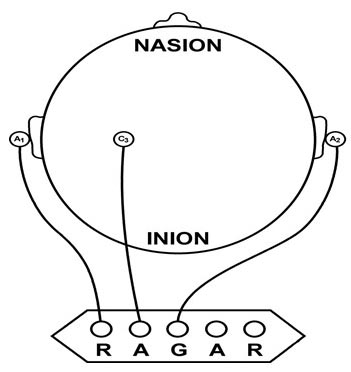
Recording the EEG with Three Leads
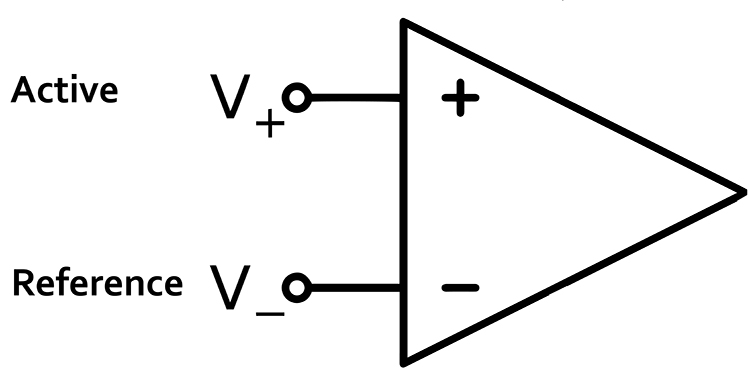
We record scalp electrical activity using three recording electrodes: active, reference, and ground. We place the active electrode over a scalp site that is an EEG voltage source. We can locate the reference electrode over the scalp or neutral, but not electrically inactive, sites like an earlobe or the mastoid bone. Finally, we can place the ground electrode on an earlobe, mastoid bone, or the scalp (Demos, 2019). The ground electrode is grounded to the amplifier.
Active and reference sensors are identical in construction and are each balanced inputs. They are interchangeable! However, some technologies require that you designate a sensor as a reference. For example, linked ears reference.
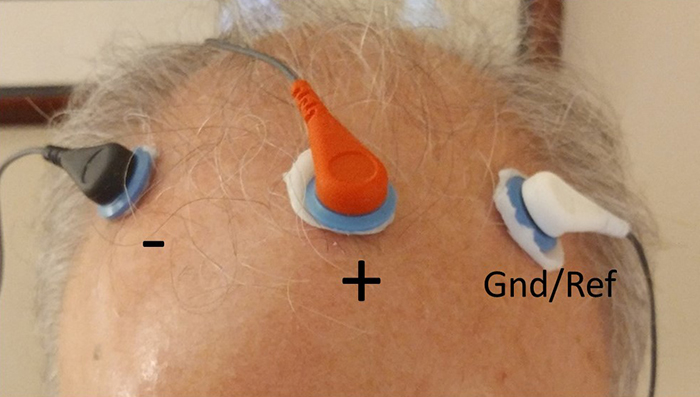
In the graphic below, the active (+) is red, the reference (-) is black, and the ground electrode (Gnd/Ref) is white.
The voltages of the active and reference inputs are based on the ground.
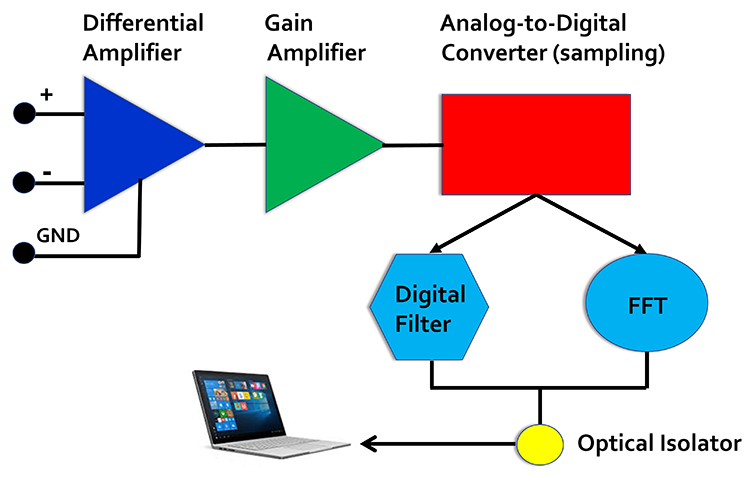
EEG Apparatus
An electroencephalograph consists of the following stages: differential amplifier, gain amplifier, analog-to-digital converter, digital and FFT filters, and optical isolator.
Signal Amplification
The biological signals monitored in biofeedback are very weak. The EEG
signal, for example, is measured in microvolts (millionths of a volt).
These signals must first be amplified over several stages to isolate the
signal we are interested in and then drive displays. Stereo amplifiers perform
the same tasks when they boost audio signals above the noise floor to levels that
can power loudspeakers.
Amplifiers share the properties of input sensitivity and gain. Input sensitivity is the maximum voltage level an amplifier can accept without producing clipping and distortion. The graphic below shows the same EEG signal with different sensitivity. The top tracing shows greater sensitivity than the bottom tracing, as evidenced by its substantially greater voltage swings.
Gain
is an amplifier's ability to increase the magnitude of an input signal to create a higher output voltage. Gain is the ratio of output/input and is different for AC and DC systems. An amplifier that produces a 1-mV output from a 1-μV input has a gain of 1,000.
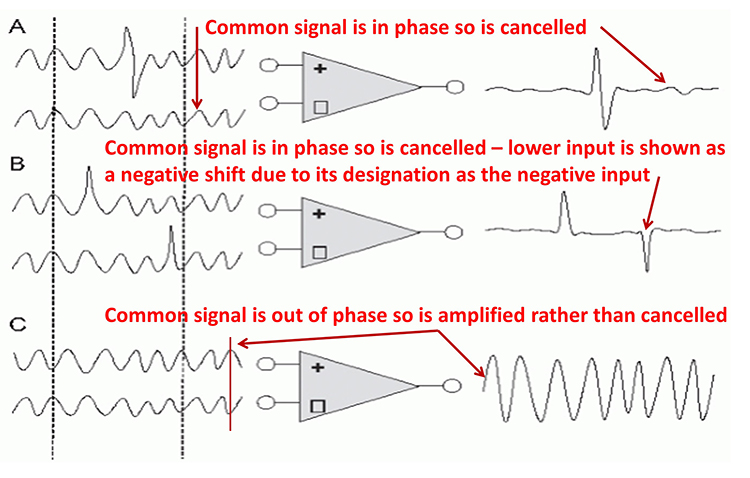
A differential amplifier combines two (or more) identical single-ended amplifiers with balanced inputs. The inputs are referenced to a common ground so that the resulting signals can be compared. The amplifiers are
180o out of phase so that signals that differ in frequency, amplitude, and phase are amplified. Only signal components that differ between two inputs are retained and amplified as output. Signals that are out of phase or possess different amplitudes are "seen" by the common-mode rejection process as different and are retained.
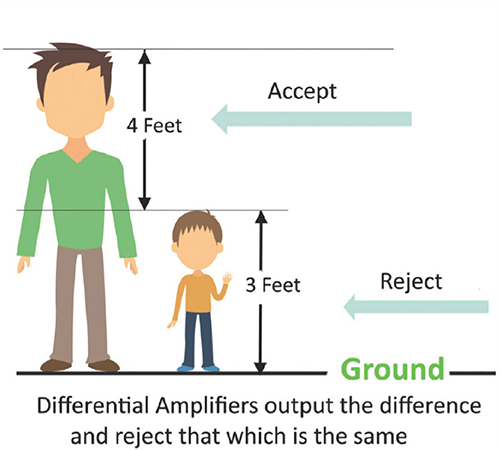
The graphic below was redrawn from John Demos' BCIA-recommended Getting Started with EEG Neurofeedback (2nd ed.). A differential amplifier rejects the common voltage (e.g., 3 feet) and outputs the voltage difference (e.g., 4 feet). A single-ended amplifier outputs the entire voltage (e.g., 7 feet, EEG artifact and signal value).
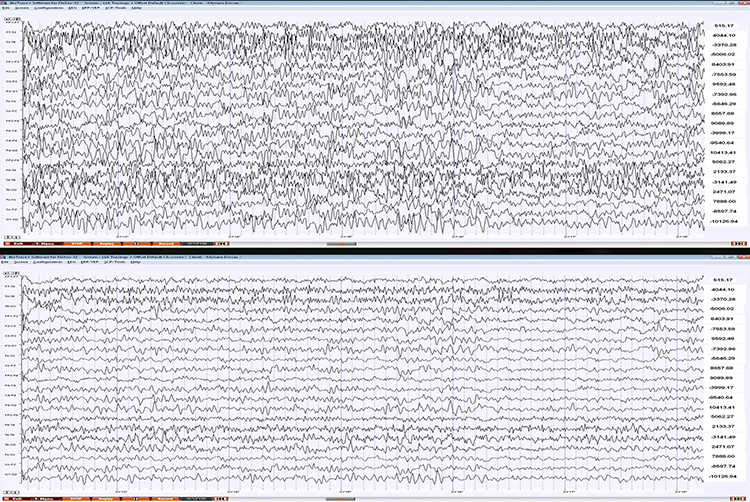
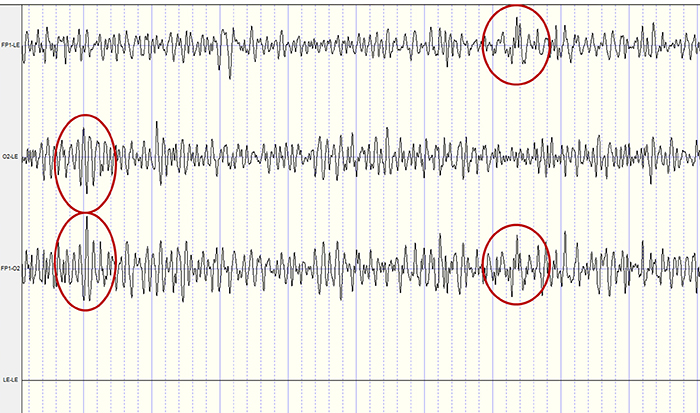
The recording below shows four tracings. The first one shows the Fp1 electrode referenced to linked ears and has an event circled in red. The second tracing shows the O2 electrode also referenced to linked ears and also has a distinct EEG event circled in red. When the two electrodes, Fp1 and O2 are referenced (compared) to each other (the third tracing), the differences are retained showing an example of common mode rejection (CMR). The fourth tracing shows the linked ears compared to each other resulting in complete rejection of the identical signals. Typically, CMR occurs within the amplifier although the resulting signals may be displayed in differing comparisons (montages) within the software resulting in a similar function.
How does this reduce artifact? When there is no EEG activity,
identical noise signals reach each amplifier. The differential amplifier
subtracts these signals, canceling out the artifact. The output of a
perfect differential amplifier would be 0.
The Challenges of Recording Infra-Slow EEG Activity
An AC amplifier has severe limitations when recording infra-slow (0-1 Hz) EEG activity.
AC amplifiers exacerbate artifact effects. Client movement, eye movement, sweat, and transient field artifacts produce significant voltage changes. Long time constants over 80 s are recommended to integrate artifact-induced voltages over 2-4-min periods. However, persistent artifacts like eye movement will consistently degrade the signal-to-noise ratio of client feedback.
Infra-slow recording requires DC-coupled amplifiers with a large dynamic range produced by 24-bit A/D converters to prevent saturation by slow drifts in baseline voltage. Standard EEG electrodes made of gold, steel, or tin are unacceptable because they suffer capacitance or energy storage, blocking lower frequencies. Silver/silver-chloride electrodes are ideal because they are reversible and do not polarize.
The clinician must distinguish slow artifacts from infra-slow signals. Eccrine sweat glands produce standing millivolt-range potentials. While these can be eliminated by partial skin puncturing, this practice risks infection transmission. Clinicians can identify eye blink and eye movement artifacts by their characteristic location. Body tilt, cough and strain, hyperventilation, and tongue movements produce high amplitude diffuse very slow potentials (Miller et al., 2007).
Common-Mode Rejection
A differential amplifier’s separation of signal from artifacts is measured
by the common-mode rejection ratio (CMRR). Since these amplifiers cancel
out noise imperfectly, signal and noise will be boosted. The CMRR
specification compares the degree by which a differential amplifier
boosts signal (differential gain) and artifact (common-mode gain). CMRR =
differential gain/common-mode gain.
CMRR should be measured at 50/60Hz where the strongest artifacts, like
power line (50/60Hz) noise, are found. The smallest acceptable ratio is
100
dB (100,000:1), which means that signal is boosted 100,000 times more
than competing noise. State-of-the-art equipment exceeds a 180-dB ratio.
Lower ratios could result in unacceptable contamination of biological
signals.
The graphic shows common-mode rejection when the common signal is in phase and out of phase.
You can take nine steps to maximize common-mode rejection:
(1) ensure that
skin-electrode impedances are balanced within 1-3 Kohm. If both
actives receive identical noise signals, the imbalance will make the signals
look different and prevent complete subtraction of noise.
(2) active electrodes should be equidistant from the artifact source.
(3) active, reference, and ground sensors should be the same distance from each other.
(4) when using two or more channels, the ground and each active should be the same distance apart.
(5) ensure that there is a good ground connection. A deficient ground connection can make different voltages appear identical, defeating common-mode rejection.
(6)
identify artifact sources. You can use a portable electroencephalograph or electromyograph like a
Geiger counter. Move the unit around the room with EEG sensors connected
but held in your hand. Artifact sources should produce the largest
display values.
(7) remove the artifact sources you find. For example, fluorescent
lights can be replaced with fixtures that produce less 50/60Hz noise.
(8) remove unused sensor cables from the encoder to not function as an antenna for 50/60Hz artifact.
(9) position the electroencephalograph and electrode cable to reduce
artifact reception. Use the location and angle that yield the lowest
readings when not attached to a patient (Thompson & Thompson, 2015).
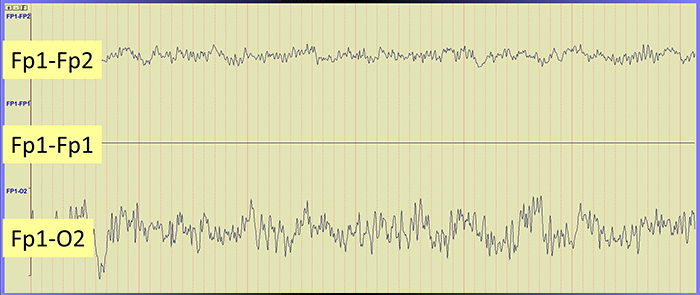
The Effect of Electrode Location on Common Mode Rejection
Brain activity is more similar when electrodes are close together and less similar when they are farther apart. This means that a differential amplifier may reject actual EEG voltages detected by adjacent electrodes. The sensors were placed at the same anatomical location (Fp1-Fp1) for maximum cancellation, as shown by the flat line in the recording below.
Differential Input Impedance
An amplifier’s differential input impedance further reduces the effect of
unequal impedances. As EEG signals enter the amplifier, they are dropped
across a network of resistors, presenting a differential input impedance
in the Gohm (billion ohms) range. State-of-the-art instruments now exceed
10 Gohms. The differential input impedance must be at least
100 times
skin-electrode impedance so that 99% or more of the signal can reach the
electroencephalograph.
Why is this important? Stronger signals help an amplifier differentiate
EEG activity from noise, producing more accurate feedback.
Sampling the EEG Signal
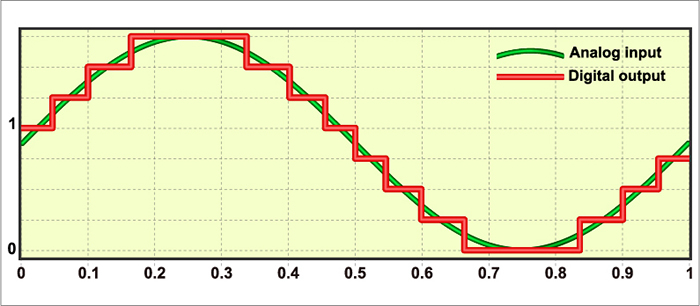
An analog-to-digital (A/D) converter
samples the EEG signal at a fixed sampling interval. The sampling rate is the number of measurements taken within a given period. The sampling rate must be high enough to represent the signal being measured accurately.
According to the Nyquist-Shannon sampling theorem, an A/D
converter's sampling rate should be at least twice the highest frequency
component you intend to sample.
The American Clinical Neurophysiology Society (ACNS) guidelines recommend a minimum sampling rate of at least three times the high-frequency filter setting for digitization. This means at least 100 samples per second (sps) for a 35-Hz high-pass filter and at least 200 sps for a 70-Hz high-pass filter (Halford et al., 2016).
A sampling rate of 128 sps is acceptable for visual inspection of the EEG. A rate of 256 sps is typical, and rates from
500-1000 sps are preferred. The graphic below shows the same EEG signal sampled at 32 and 256 sps. The vertical scale (signal amplitude) is identical for both rates.
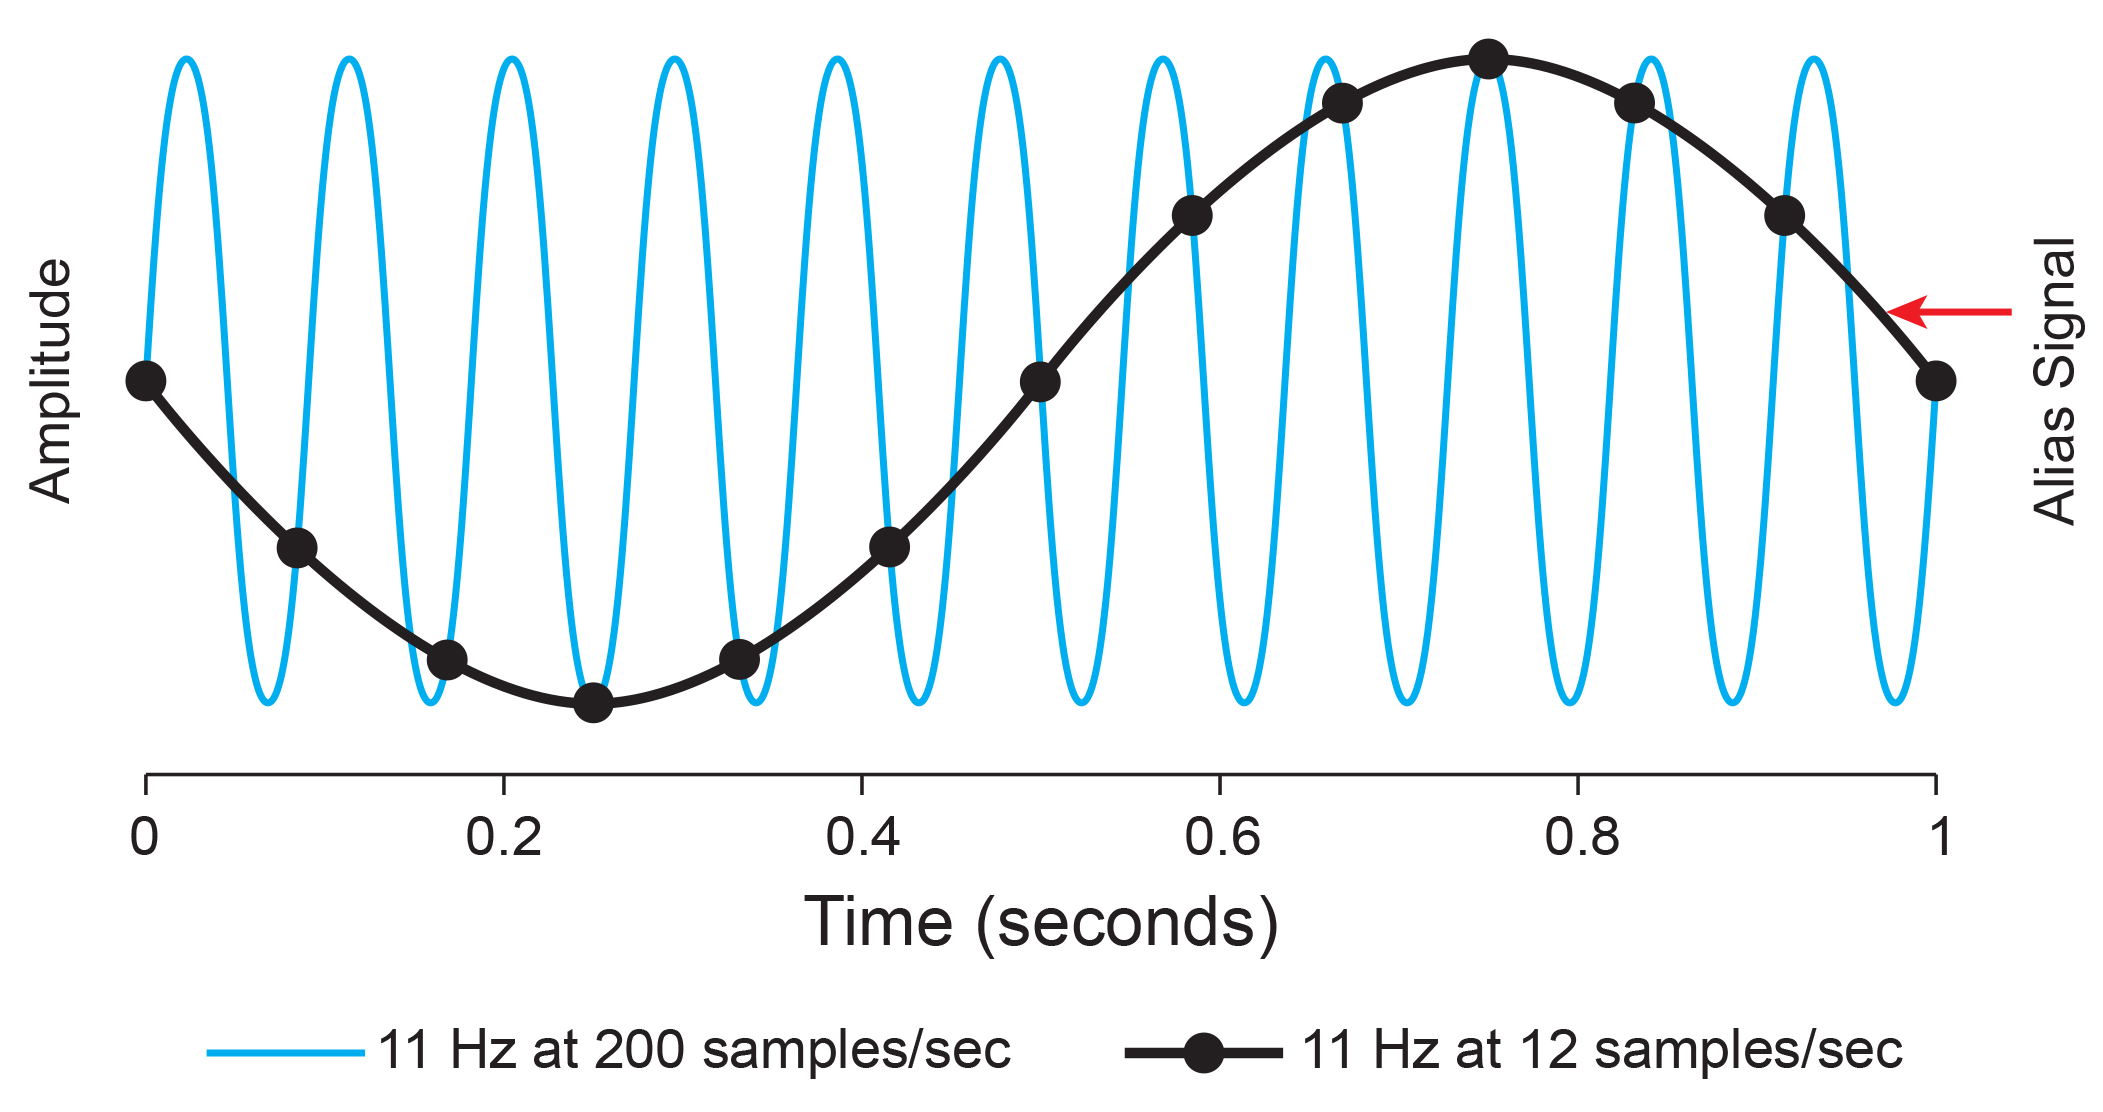
Sampling at rates that are too slow results in aliasing where an analog signal seems to have a lower frequency than it does. "Phantom" slow activity results from too few samples per second. An 11-Hz signal is sampled at 12 and 200 sps. The 12-sps rate produces an aliasing signal shown in black. Graphic redrawn by minaanandag on Fiverr.com.
Resolution Depends on Bit Depth
An A/D converter's resolution is limited by the smallest
signal amplitude it can sample. A bit number is the number of voltage
levels that an A/D converter can discern. ACNS (Halford et al., 2016) recommends a 16-bit resolution, which can discriminate
among 65,536 voltage levels and achieve 0.05-μV resolution. Lower A/D converter resolutions overemphasize small
voltage increases.
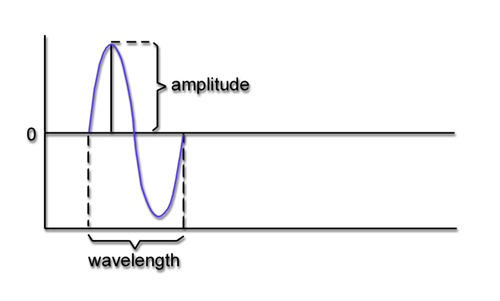
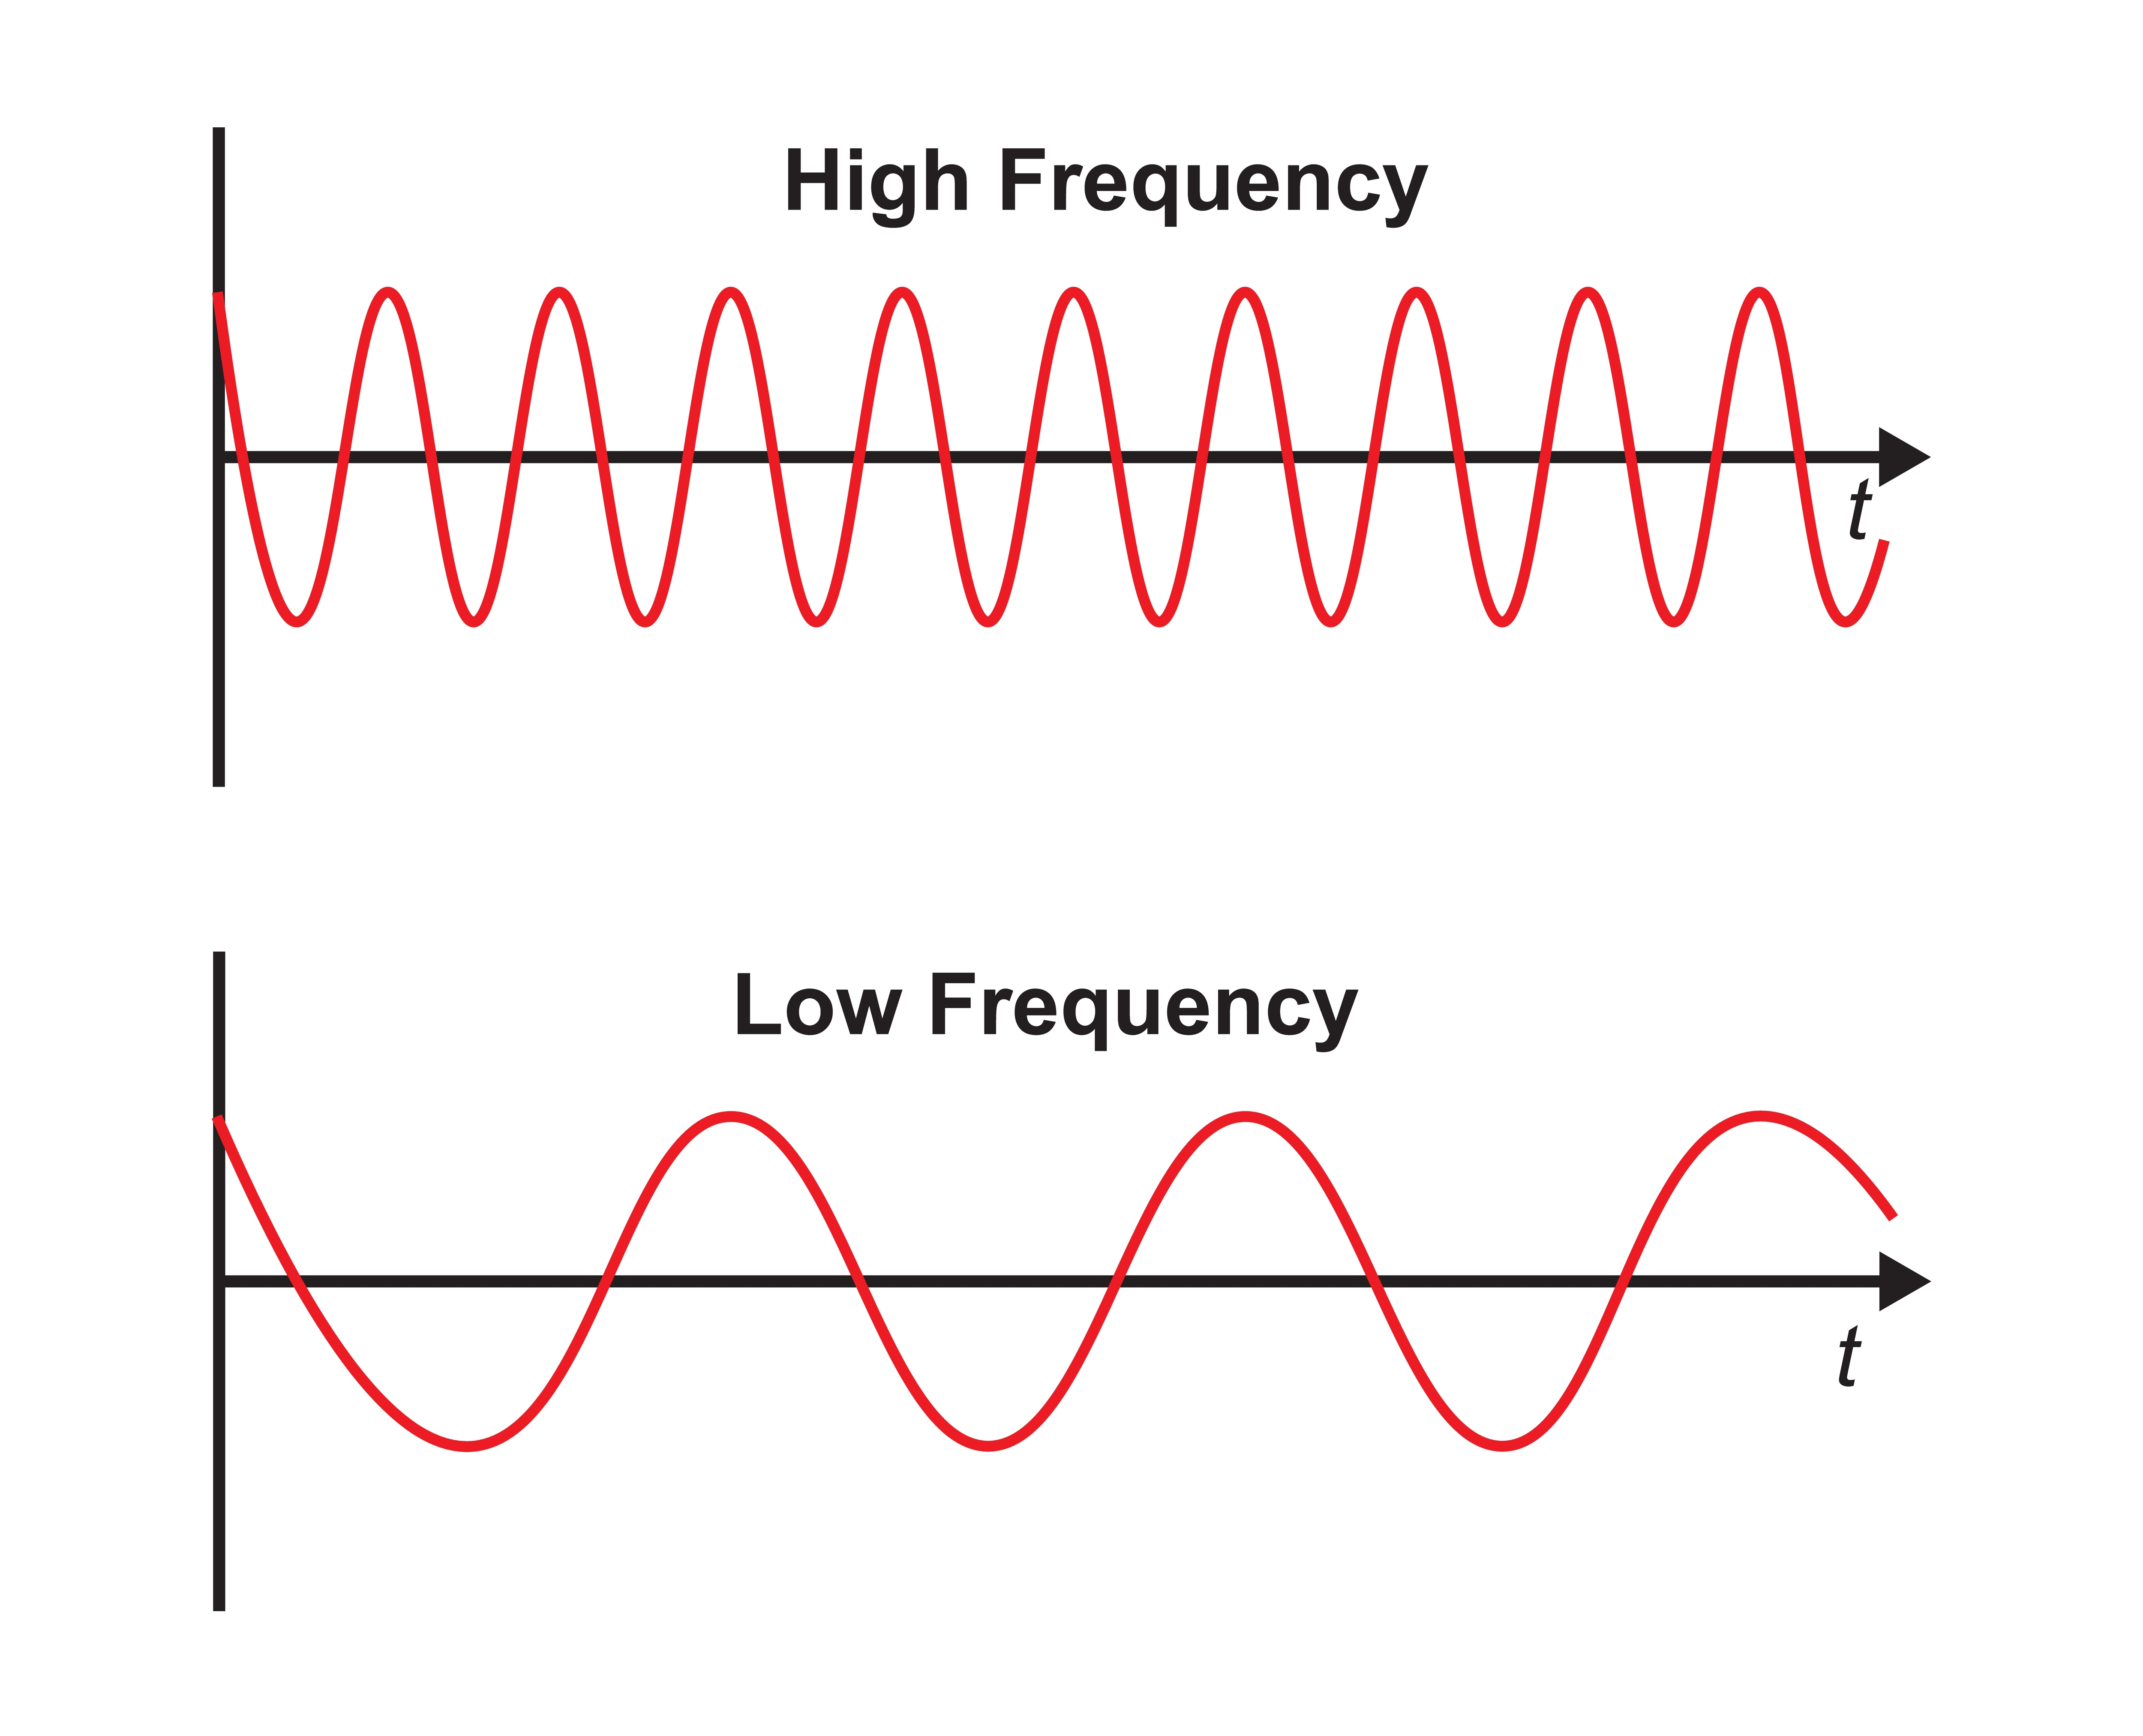
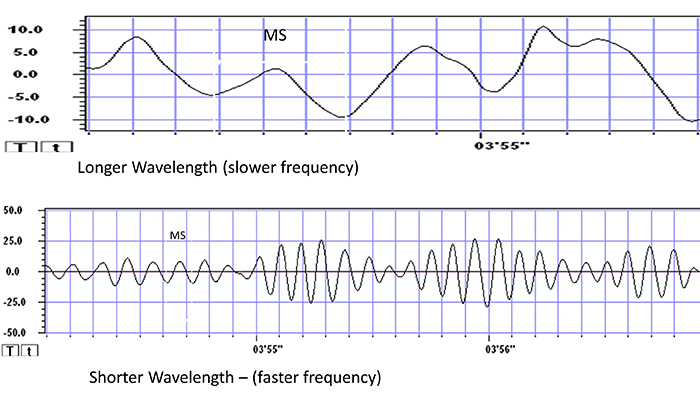
The next graphic illustrates the inverse relationship between wavelength and frequency. The time scale on the horizontal axis is in milliseconds. The amplitude scales are different for the upper (-10 to 10 μV) and lower (-50 to +50 μV) tracings.
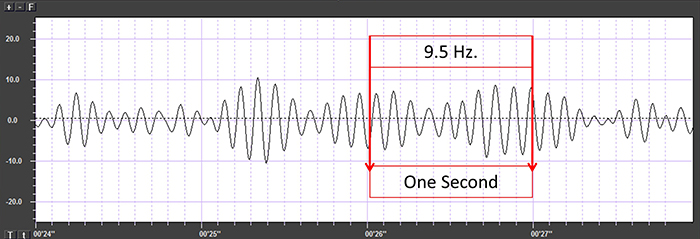
The graphic below shows a 9.5-Hz alpha wave. There are 9.5 peaks during a second.
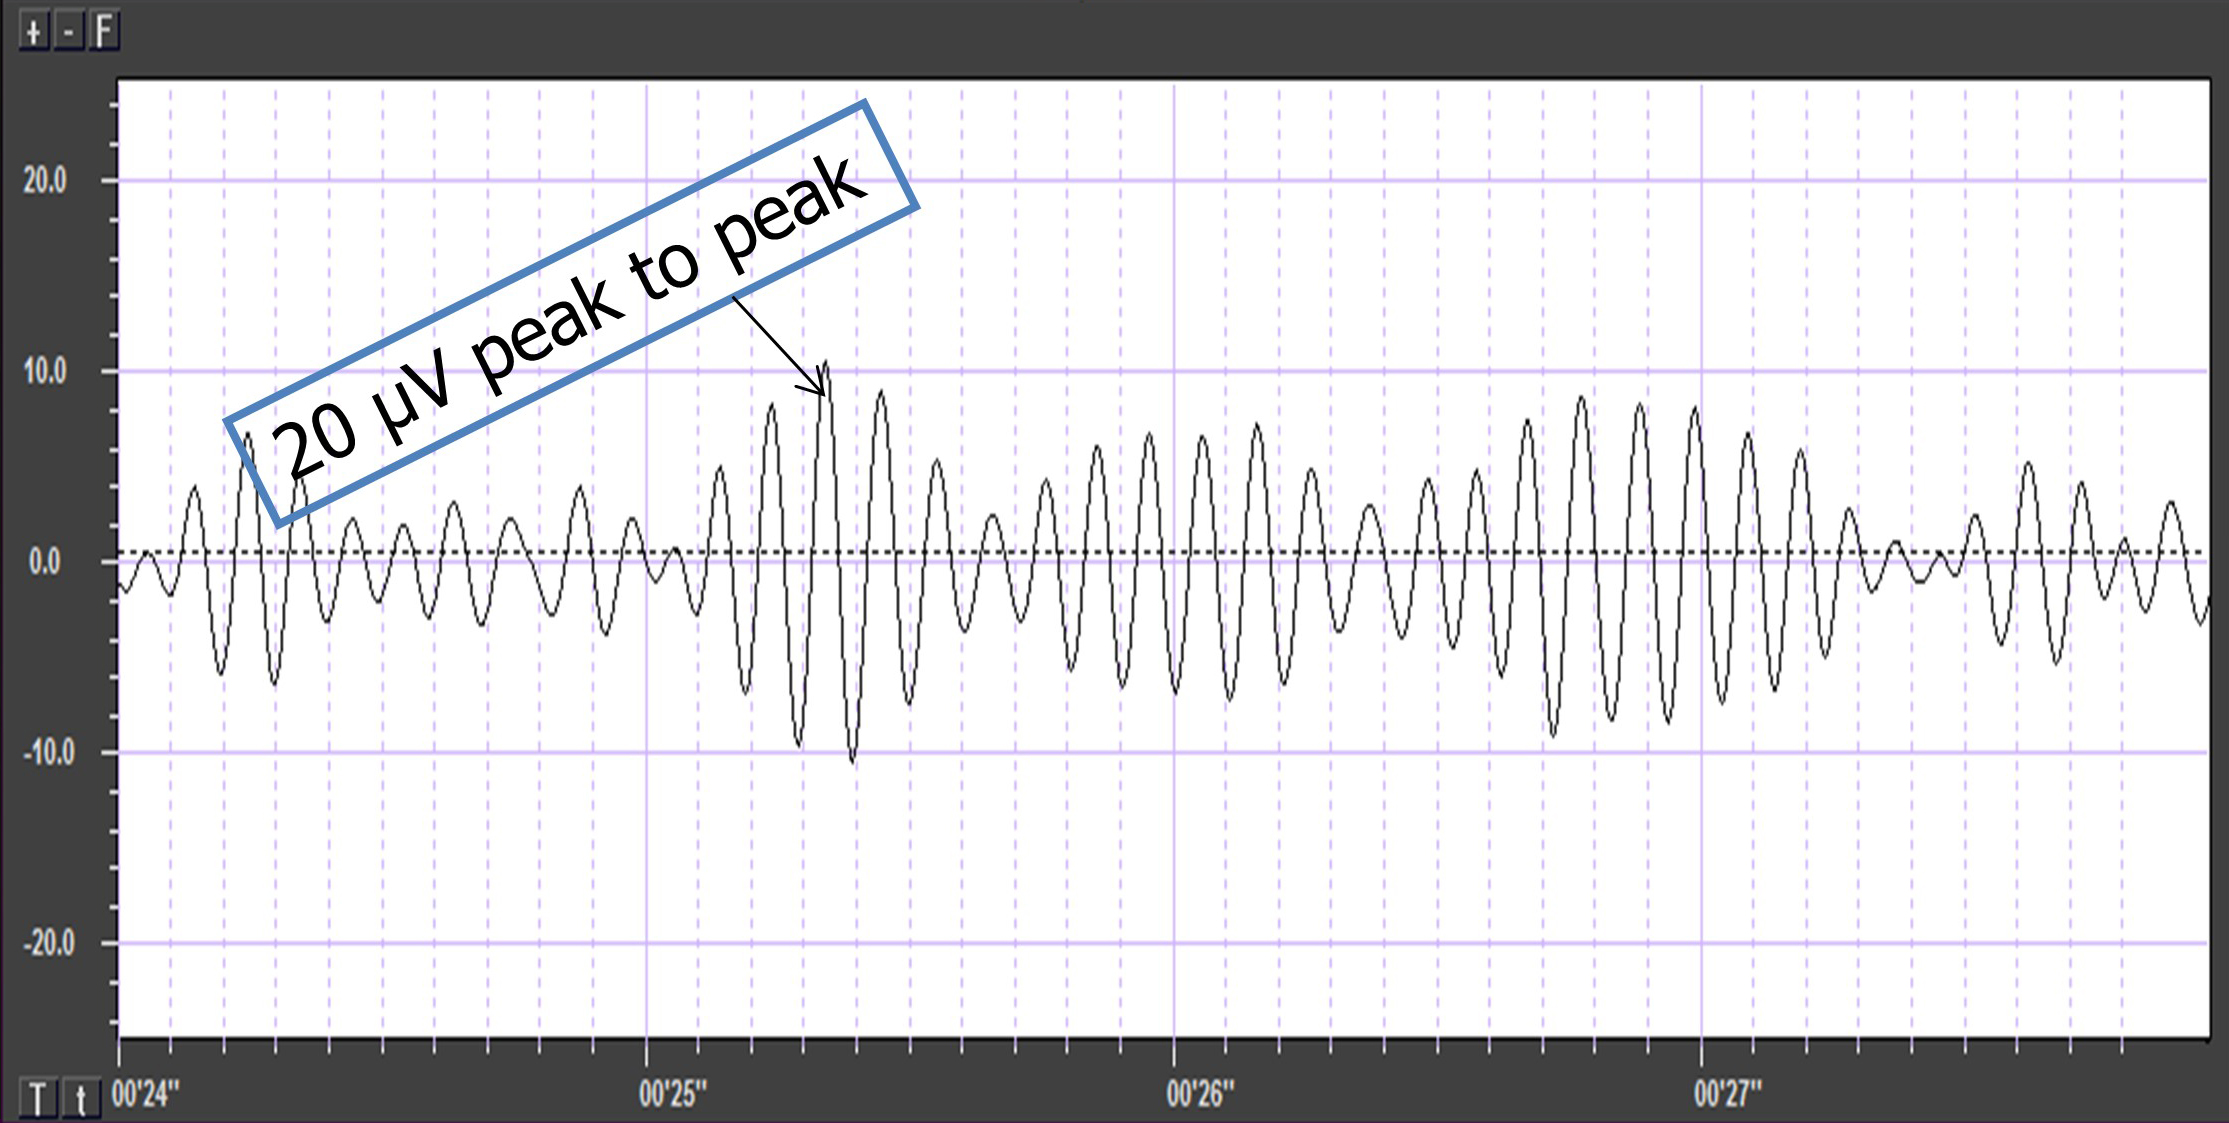
Also, recall that amplitude is signal voltage or power and is measured in microvolts or picowatts. The alpha wave below has a 20-μV amplitude.
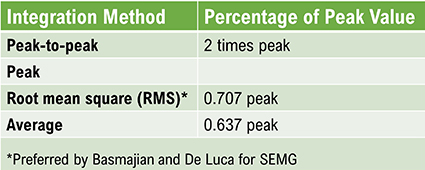
Conversion among these methods is straightforward. If the peak-to-peak voltage is 20
μV,
peak voltage is 10 μV, root mean square voltage is
7.07
μV, and average
voltage is 6.37 μV.
EEG Filters Define the Signal
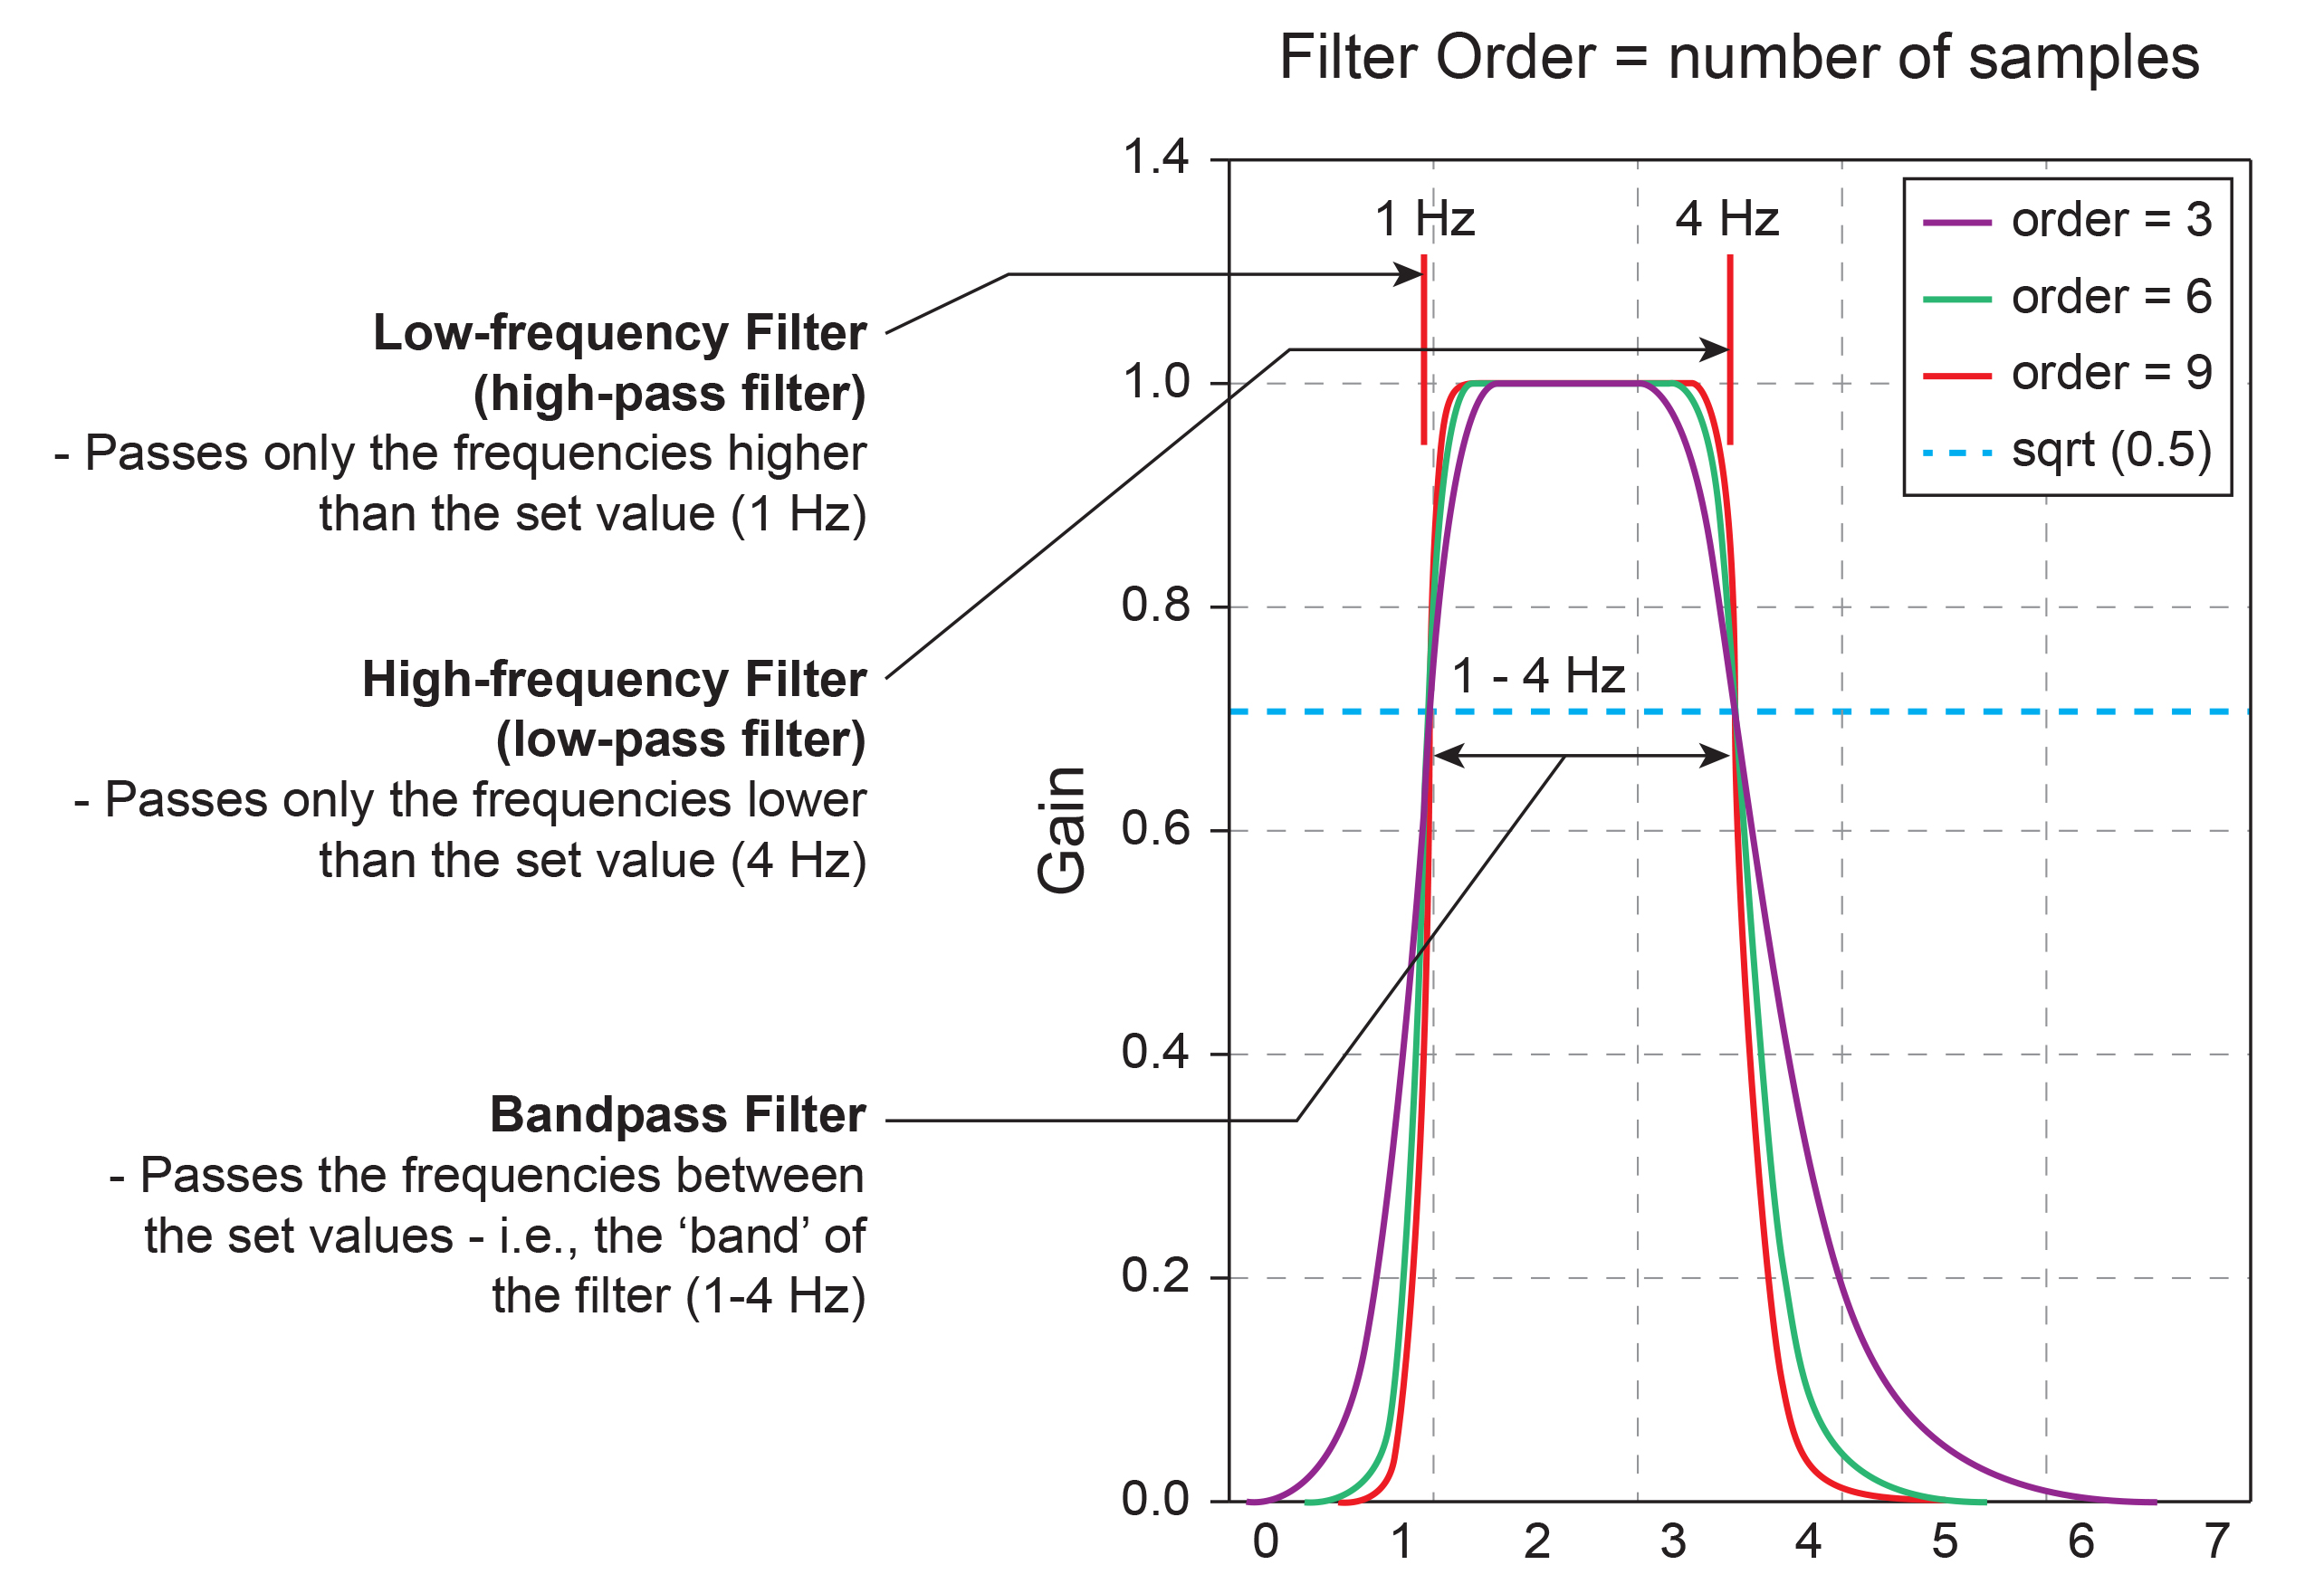
EEG filters select signals of interest and minimize artifacts. In this section, we will review high-pass, low-pass, bandpass, and notch filters. In the graphic below, the range of frequencies passed through a filter is called the passband, and the range that is sharply attenuated is called the stopband. Filter graphic redrawn by minaanandag at Fiverr.com.
A high-pass filter only passes frequencies higher than a set value (e.g., 1 Hz). A low-pass filter only passes frequencies lower than a specified value (e.g., 40 Hz). A bandpass filter passes frequencies between the set values, the "band" of the filter (e.g., 1-40 Hz). Graphic redrawn by minaanandag at Fiverr.com.
Click on the Read More button to view movies of 10- to 40-Hz low-pass and 10- to 30-Hz high-pass filters.
The movie below generously provided by
John S. Anderson shows a "raw" or "wave" display of oscillating electrical information using a positive/negative scale with 0.0 in the middle with the voltage displayed as peak-to-peak
μV.
Digital filters use digital processors, like a digital signal processing
(DSP) chip, to exclude unwanted frequencies. First, an analog-to-digital
converter (ADC) samples and digitizes the analog signal, representing
signal voltages as binary numbers. Second, a DSP chip performs
calculations on the binary numbers. Third, a digital-to-analog converter
(DAC) may transform the sampled, digitally-filtered signal back to analog
form.
Three main methods of digital filtering are Fast Fourier Transformation
(FFT), finite impulse response (FIR), and infinite impulse response (IIR).
FFT filters convert the EEG signal into a set of sine waves that vary in frequency, amplitude, and phase.
FIR filters have a finite-duration impulse response and
calculate a moving weighted average of digitally-sampled voltages.
IIR filters
have an infinite impulse response and employ feedback to calculate a moving weighted average of digitally-sampled voltages.
Since these three digital filtering methods can yield different statistical values, they cannot be used interchangeably. Only compare FFT statistics with themselves and not FIR or IIR statistics (Thompson & Thompson, 2016).
Below is a BioGraph ®
Infiniti EEG three-dimensional FFT display. Frequency is
displayed on the X-axis, amplitude on the Y-axis, and time on the Z-axis.
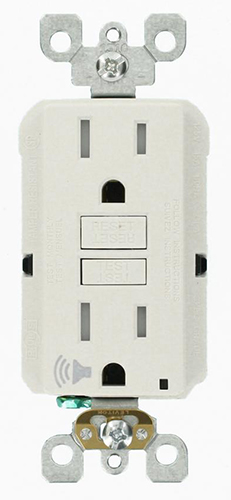
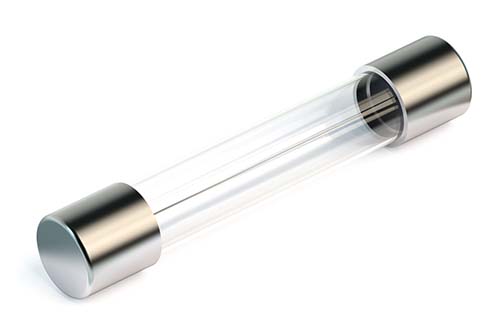
A ground fault interrupt circuitis designed into some power
outlets to shut down power when a short circuit occurs. This protective circuit monitors current leakage. When
harmful leakage is detected (> 5 mA), it triggers a circuit breaker that shuts off power to the equipment,
protecting the client, therapist, and hardware.
Montgomery (2004)
recommended plugging the entire biofeedback system into the same power outlet to create a common ground so that
current leakage in any of your equipment will trigger the ground fault interrupt circuit.
Optical Isolation
Optical isolation protects a client from hardware receiving AC
power. An optical isolator (opto-isolator) converts a biological signal into a beam of light using an LED source, the light crosses a dialectic barrier (insulation) located in the center (open
circuit), and a phototransistor reconverts the light into an electrical signal.
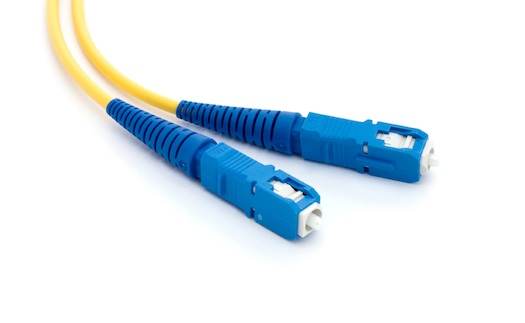
Fiber Optic Connections
Fiber optic connections, thin, flexible cables that transmit digital signals
as pulses of light, transmit photons between the electrodes and data acquisition system. This prevents current
from leaking from a computer to a client since electrons cannot travel through fiber optic cables. This approach
also reduces contamination by electrical artifacts like power line noise.
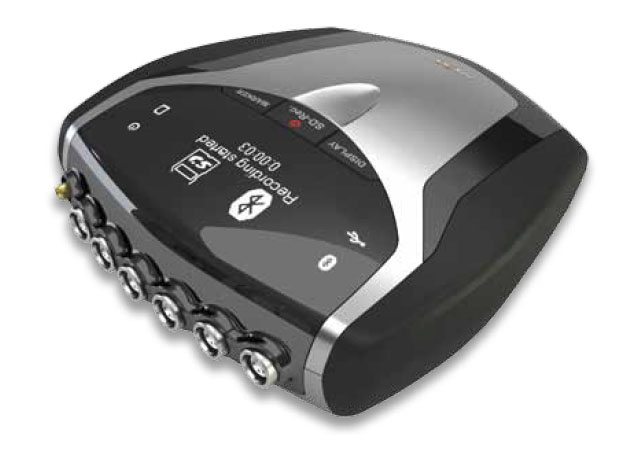
Telemetry
Telemetry can wirelessly transmit physiological data from a battery-powered encoder
unit to a computer many meters away. This technology protects clients from shock since current surges cannot
travel across a Bluetooth connection (Montgomery, 2004). MindMedia's NeXus-10 featured below communicates wirelessly with a computer for data acquisition.
Glossary
active electrode: the electrode that is placed
over a site that is a known EEG generator like Cz.
alpha blocking: the replacement of the alpha rhythm by low-amplitude
desynchronized beta activity during movement, attention, mental effort
like complex
problem-solving, and visual processing.
alternating current (AC): an electric current that periodically
reverses its direction.
ampere (A): the unit of electrical current or the flow rate of
electrons through a conductor. One volt dropped across one ohm of
resistance produces a current flow of one ampere.
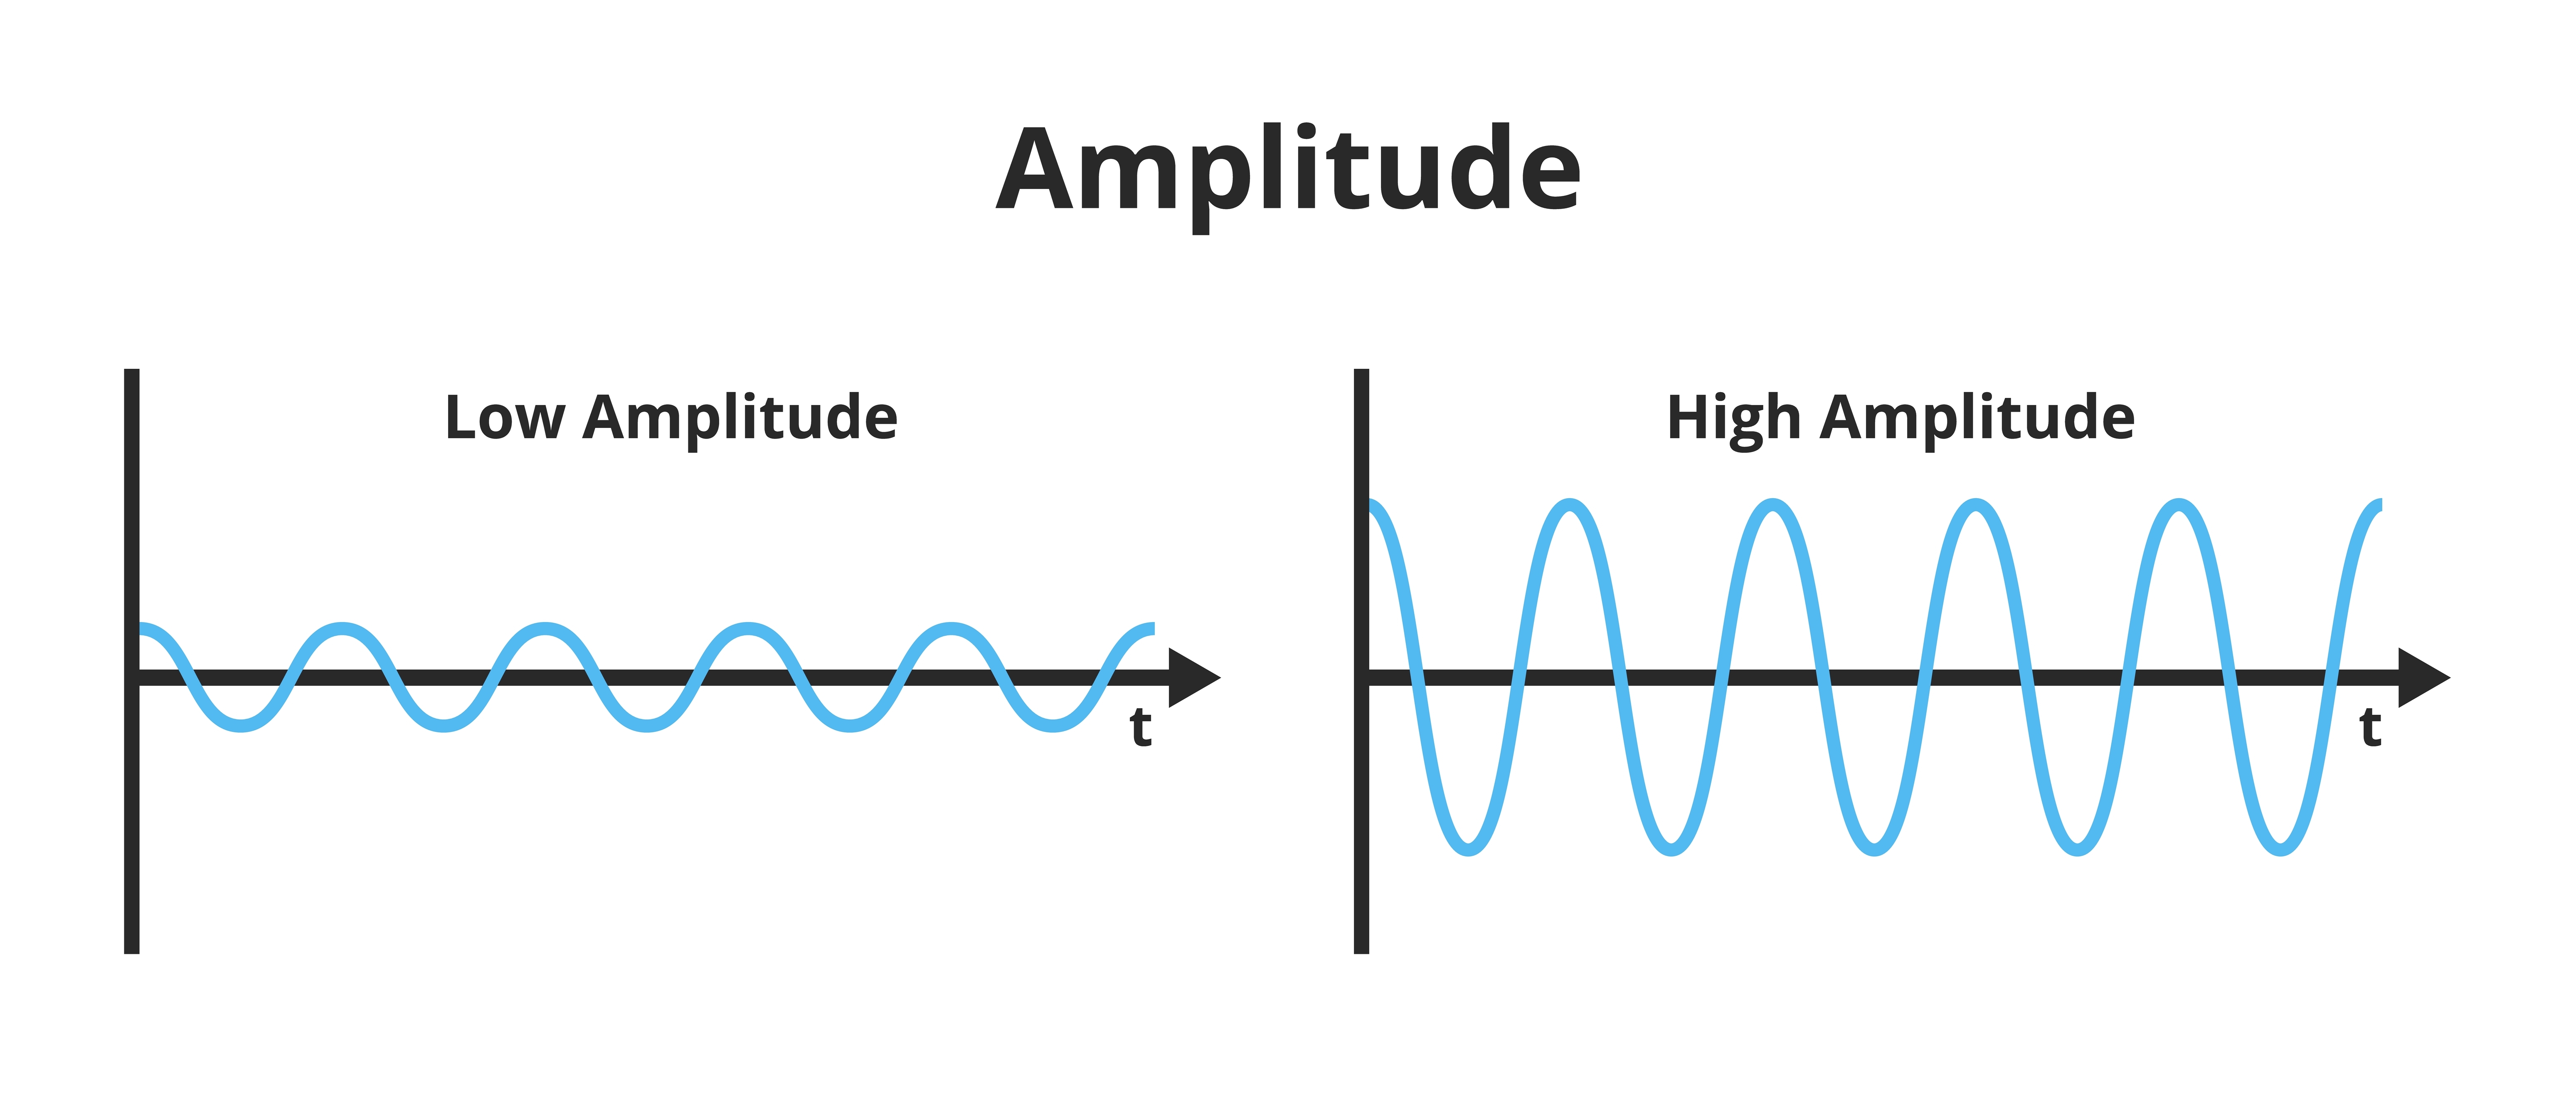
amplitude: signal strength measured in microvolts or picowatts.
analog-to-digital converter (ADC): an electronic device that converts continuous signals to discrete
digital values.
artifact: false signals like 50/60Hz noise produced by line current.
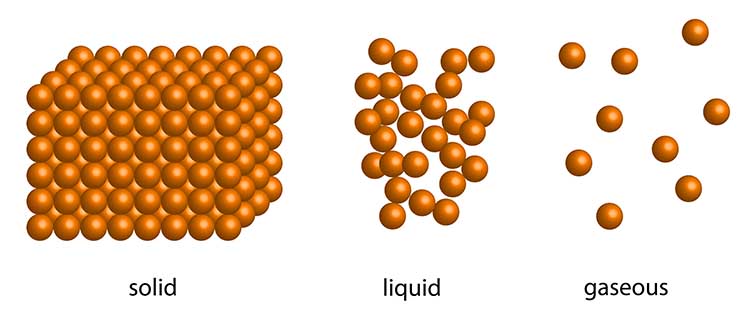
atom: the basic unit of matter consisting of a central
nucleus that contains protons and neutrons and orbiting electrons.
atomic number: the number of protons in the nucleus of an atom that
defines an element.
atomic weight: the approximate number of protons and neutrons in
the nucleus of an atom.
average voltage: 0.637 of the peak voltage.
bandpass filter: the filter that passes frequencies between the set values, the "band" of the filter (e.g., 1-40 Hz).
behavioral test (tracking test): a test of the entire signal chain (EEG sensor, differential amplifier, gain amplifier, cable, encoder, and computer) performance by asking a client to act and then observing the effects on the EEG.
bias potential: spurious voltage produced by the exchange of metal ions donated by the electrodes and electrolytes in the absence of a biological current.
bipolar recording: a recording method that uses two active electrodes
and a common reference.
bit number: the number of voltage levels that an A/D converter can discern. A resolution of 16 bits
means that the converter can discriminate among 65,536 voltage levels.
charge (Q): the imbalance between the number of positively and negatively charged particles in a given place or between two locations.
closed circuit: a complete path that allows electrons to
travel from the power source, through the conductor and resistance, and
back to the source.
common-mode rejection ratio (CMRR): the degree by which a differential amplifier boosts signal
(differential gain) and artifact (common-mode gain).
conductance (G): the ability of a material like copper or silver
to carry an electric current. Conductance is measured in siemens (formerly mhos).
conductor: a material that readily allows electron movement like
a copper wire.
continuity test: a procedure to ensure that a circuit is closed. For example, a
cable is not broken.
coulomb: approximately6.24 x 1018
or 6 billion billion electrons.
current (I): the movement of electrons through a conductor
measured in amperes (A).
DC offset:
the voltage that results from combinations of factors including electrode and gel/paste materials, interactions with skin, environment (humidity and temperature), and sweat gland activity due to stress level.
differential amplifier (balanced amplifier): a device that boosts the difference between two inputs: the active (input 1) and reference (input 2).
differential input impedance: the opposition to an AC signal
entering a differential amplifier as it is dropped across a resistor network.
digital filter: device that mathematically removes unwanted or extracts valuable aspects of a sampled, discrete-time signal.
direct current (DC): an electric current that flows in only one
direction, as in a flashlight.
electrode: a specialized conductor that converts biological signals
like the EEG into currents of electrons.
electromotive force (EMF): a difference in electrical potential
that "pushes" electrons to move in a circuit.
electron: a negatively-charged particle that rotates around the nucleus at varying
distances and participates in chemical reactions.
elements: substances that contain identical atoms and cannot be reduced by common chemical reactions.
energy level: one of an electron's possible orbits around a
nucleus at a constant distance.
epidermis: the outermost skin layer.
fiber optic cable: a thin, flexible cable that transmits digital signals
as pulses of light with the advantages of high-speed data transmission,
electrical isolation, and resistance to electromagnetic interference.
finite impulse response (FIR) filter: filter with a finite-duration impulse response.
frequency (Hz): the number of complete cycles that an AC signal
completes in a second, usually expressed in hertz.
gain: an amplifier's ability to increase the magnitude of an input signal to create a higher output voltage; the ratio of output/input voltages.
ground electrode: a sensor placed on an earlobe, mastoid bone, or the scalp that is grounded to the amplifier.
ground fault interrupt circuit: a protective device that opens a
circuit—shutting down power—when current leakage exceeds 5 mA.
hertz (Hz): the unit of frequency measured in cycles per second.
high-pass filter: a filter that only passes frequencies higher than a set value (e.g., 1 Hz).
impedance (Z): complex opposition to an AC signal measured in
Kohms.
impedance meter: device that uses an AC signal to measure
impedance in an electric circuit, such as between active and reference
electrodes.
impedance test: the automated or manual measurement of skin-electrode impedance.
infinite impulse response (IIR) filter: a filter with an infinite impulse response and employ feedback as they calculate a moving weighted average of digitally-sampled voltages.
input sensitivity: the maximum voltage level an amplifier can accept without producing clipping and distortion.
insulator: material that resists the flow of electricity like
glass and rubber.
interstitial fluid: fluid between cells through which biological
signals travel via volume conduction.
ion: an atom or molecule with a positive or negative electrical
charge.
low-pass filter: a filter that only passes frequencies lower than a set value (e.g., 40 Hz).
mastoid bone (or process): bony prominence behind the ear.
mho: the unit of conductance replaced by the siemen.
microsiemen (μS): the unit of conductance
that is one-millionth of a siemen.
microvolt (μV): the unit of amplitude
(signal strength) that is one-millionth of a volt.
milliampere (mA): unit of electrical current that is
one-thousandth of an ampere.
millivolt (mV): unit of amplitude (signal strength) that is
one-thousandth of a volt.
monopolar recording: a recording method that uses one active and
one reference electrode.
motor unit: an alpha motor neuron and the skeletal muscle fibers
it innervates.
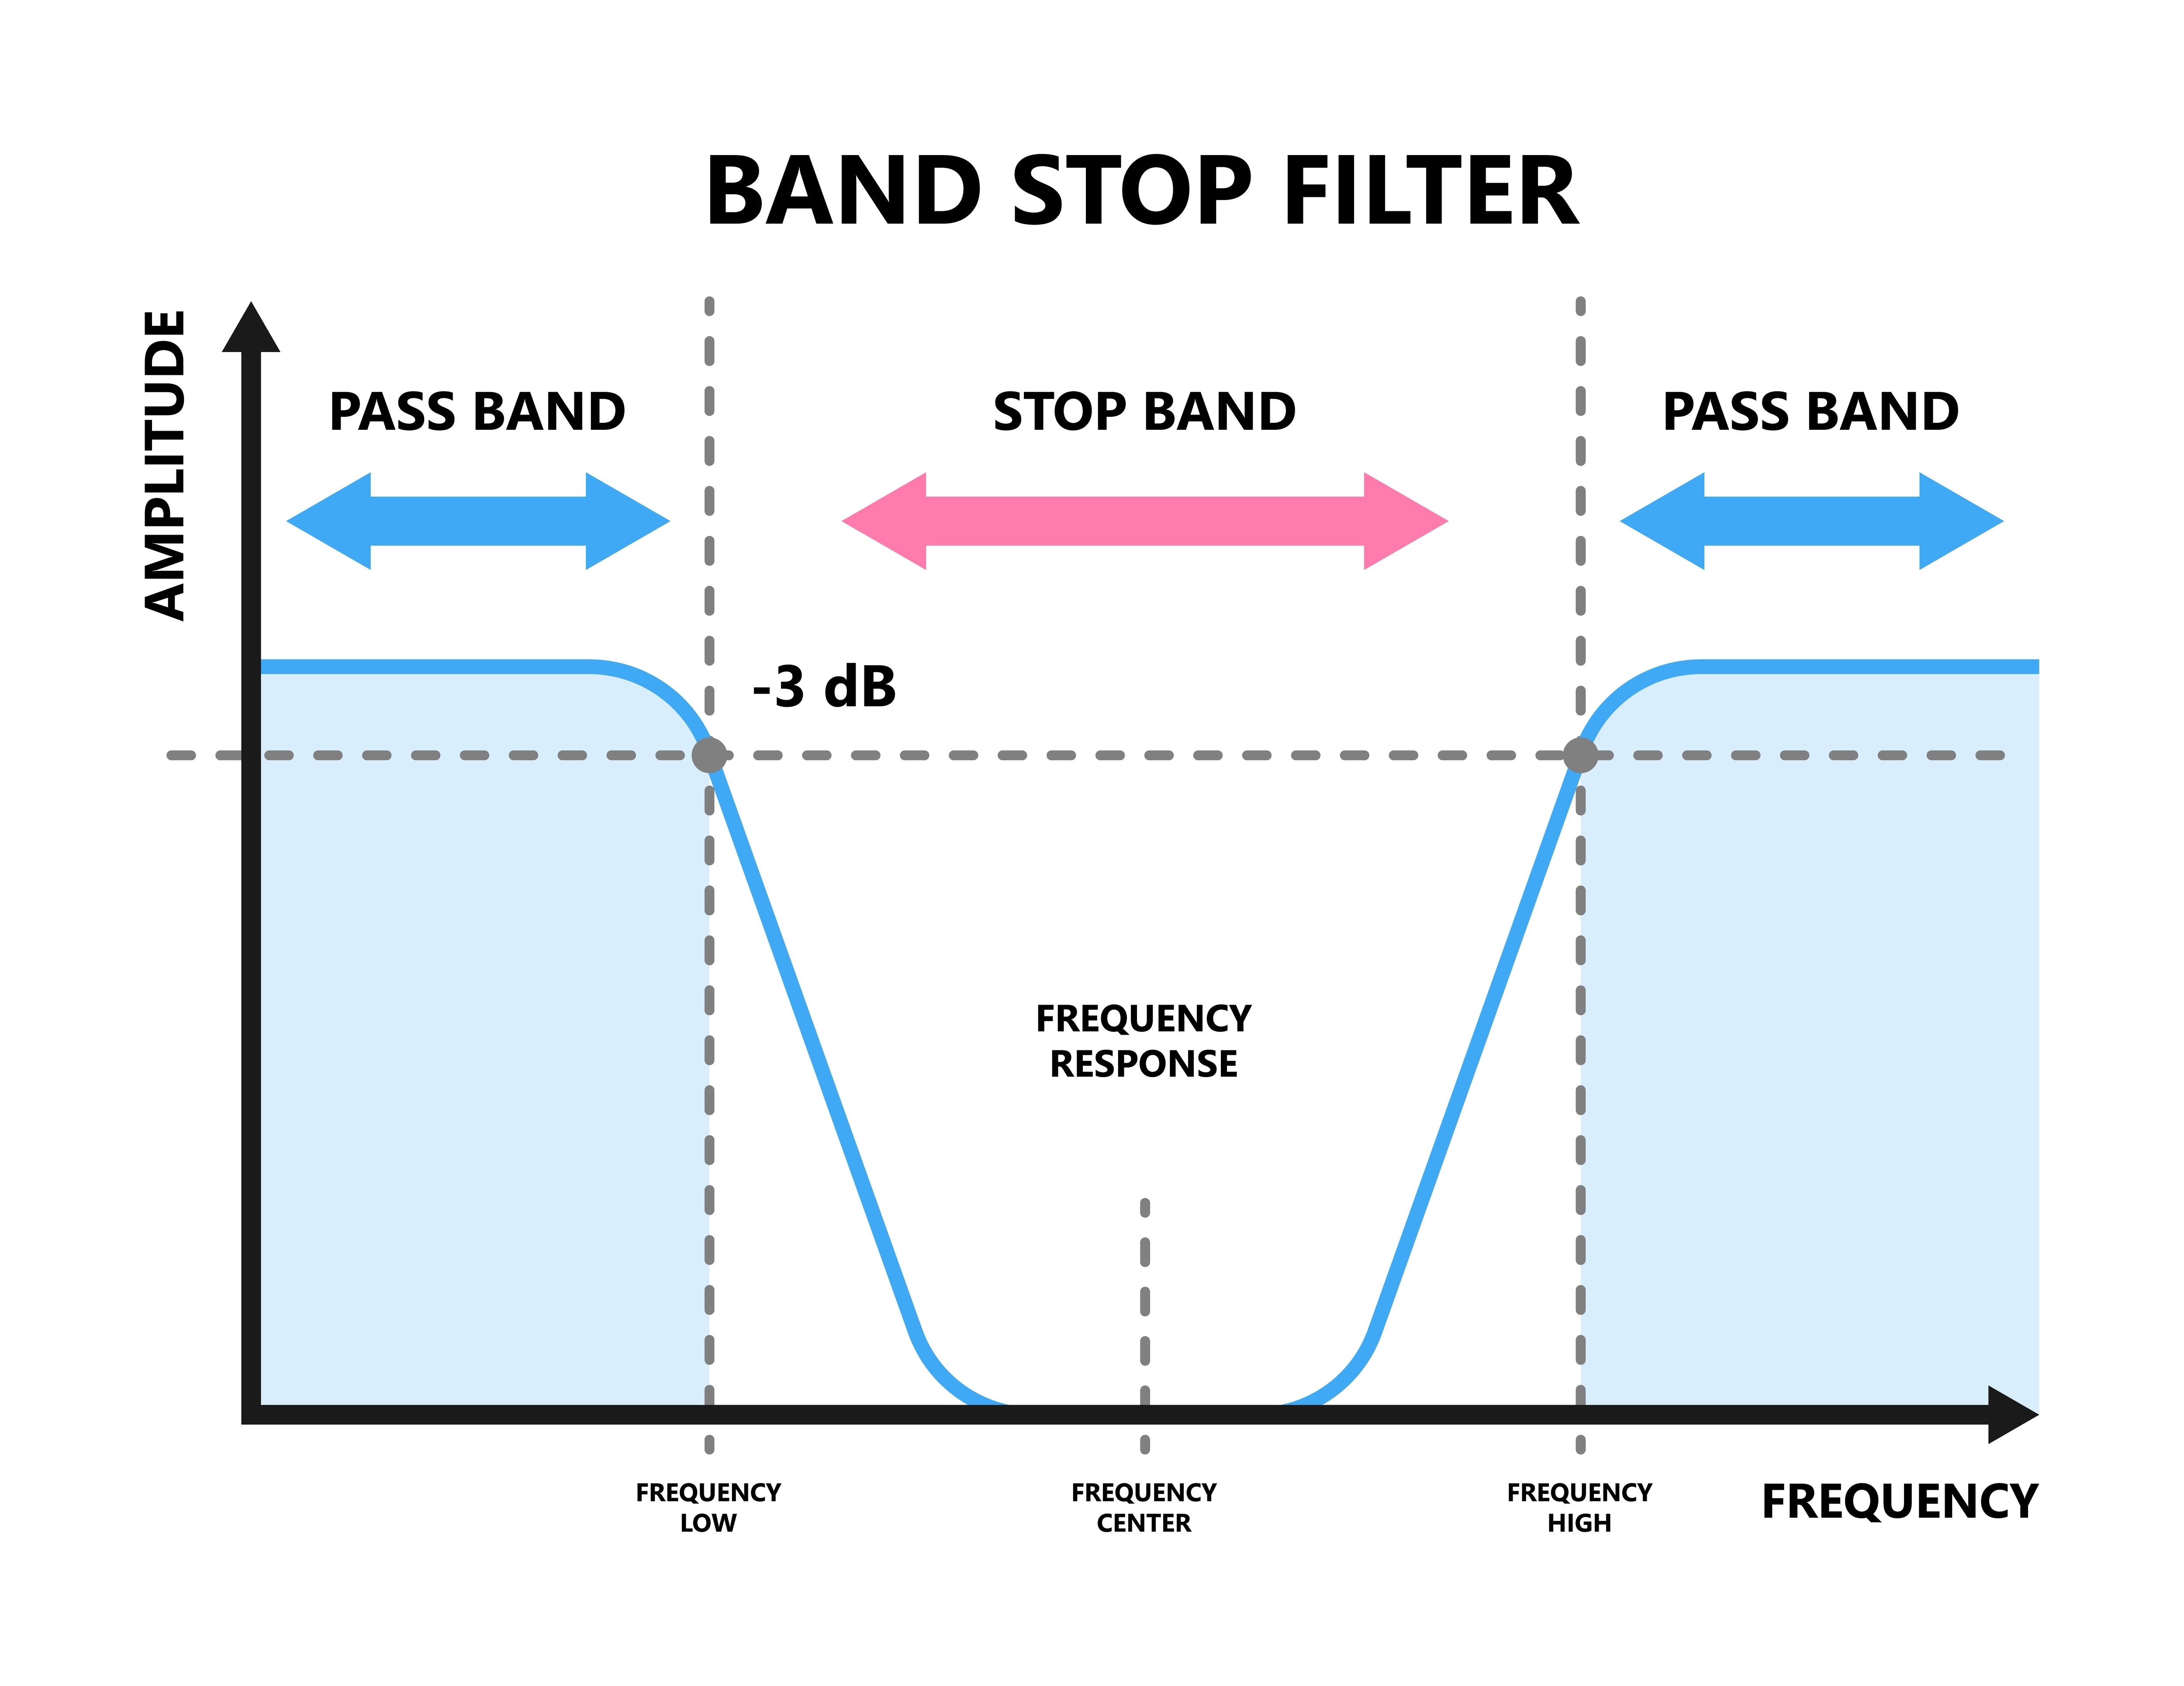
notch filter: a filter that suppresses a narrow band of frequencies, such as those produced by line current at 50/60Hz.
nucleus: central mass of an atom that contains protons and
neutrons.
Nyquist-Shannon sampling theorem: the perfect reconstruction of the analog signal requires sampling at two
times its highest frequency. A signal whose highest frequency is 1000 Hz should be sampled 2000 times per
second.
ohm (Ω): the unit of impedance or resistance.
Ohm's law: voltage (E) = current (I) X resistance (R). The
“amount” of current (I) flowing through a conductor is equal to the
voltage (E) or “push” divided by the resistance (R).
open circuit: an incomplete path that prevents electron movement
from the power source, through the conductor, and back to
the source. For example, a broken sensor cable.
optical isolation: a device that converts a biological signal into
a beam of light, the light crosses a gap (open circuit), and a
photoreceptor reconverts the light into an electrical signal.
passband: the range of frequencies that is passed through a filter.
peak voltage: 0.5 of the peak-to-peak voltage.
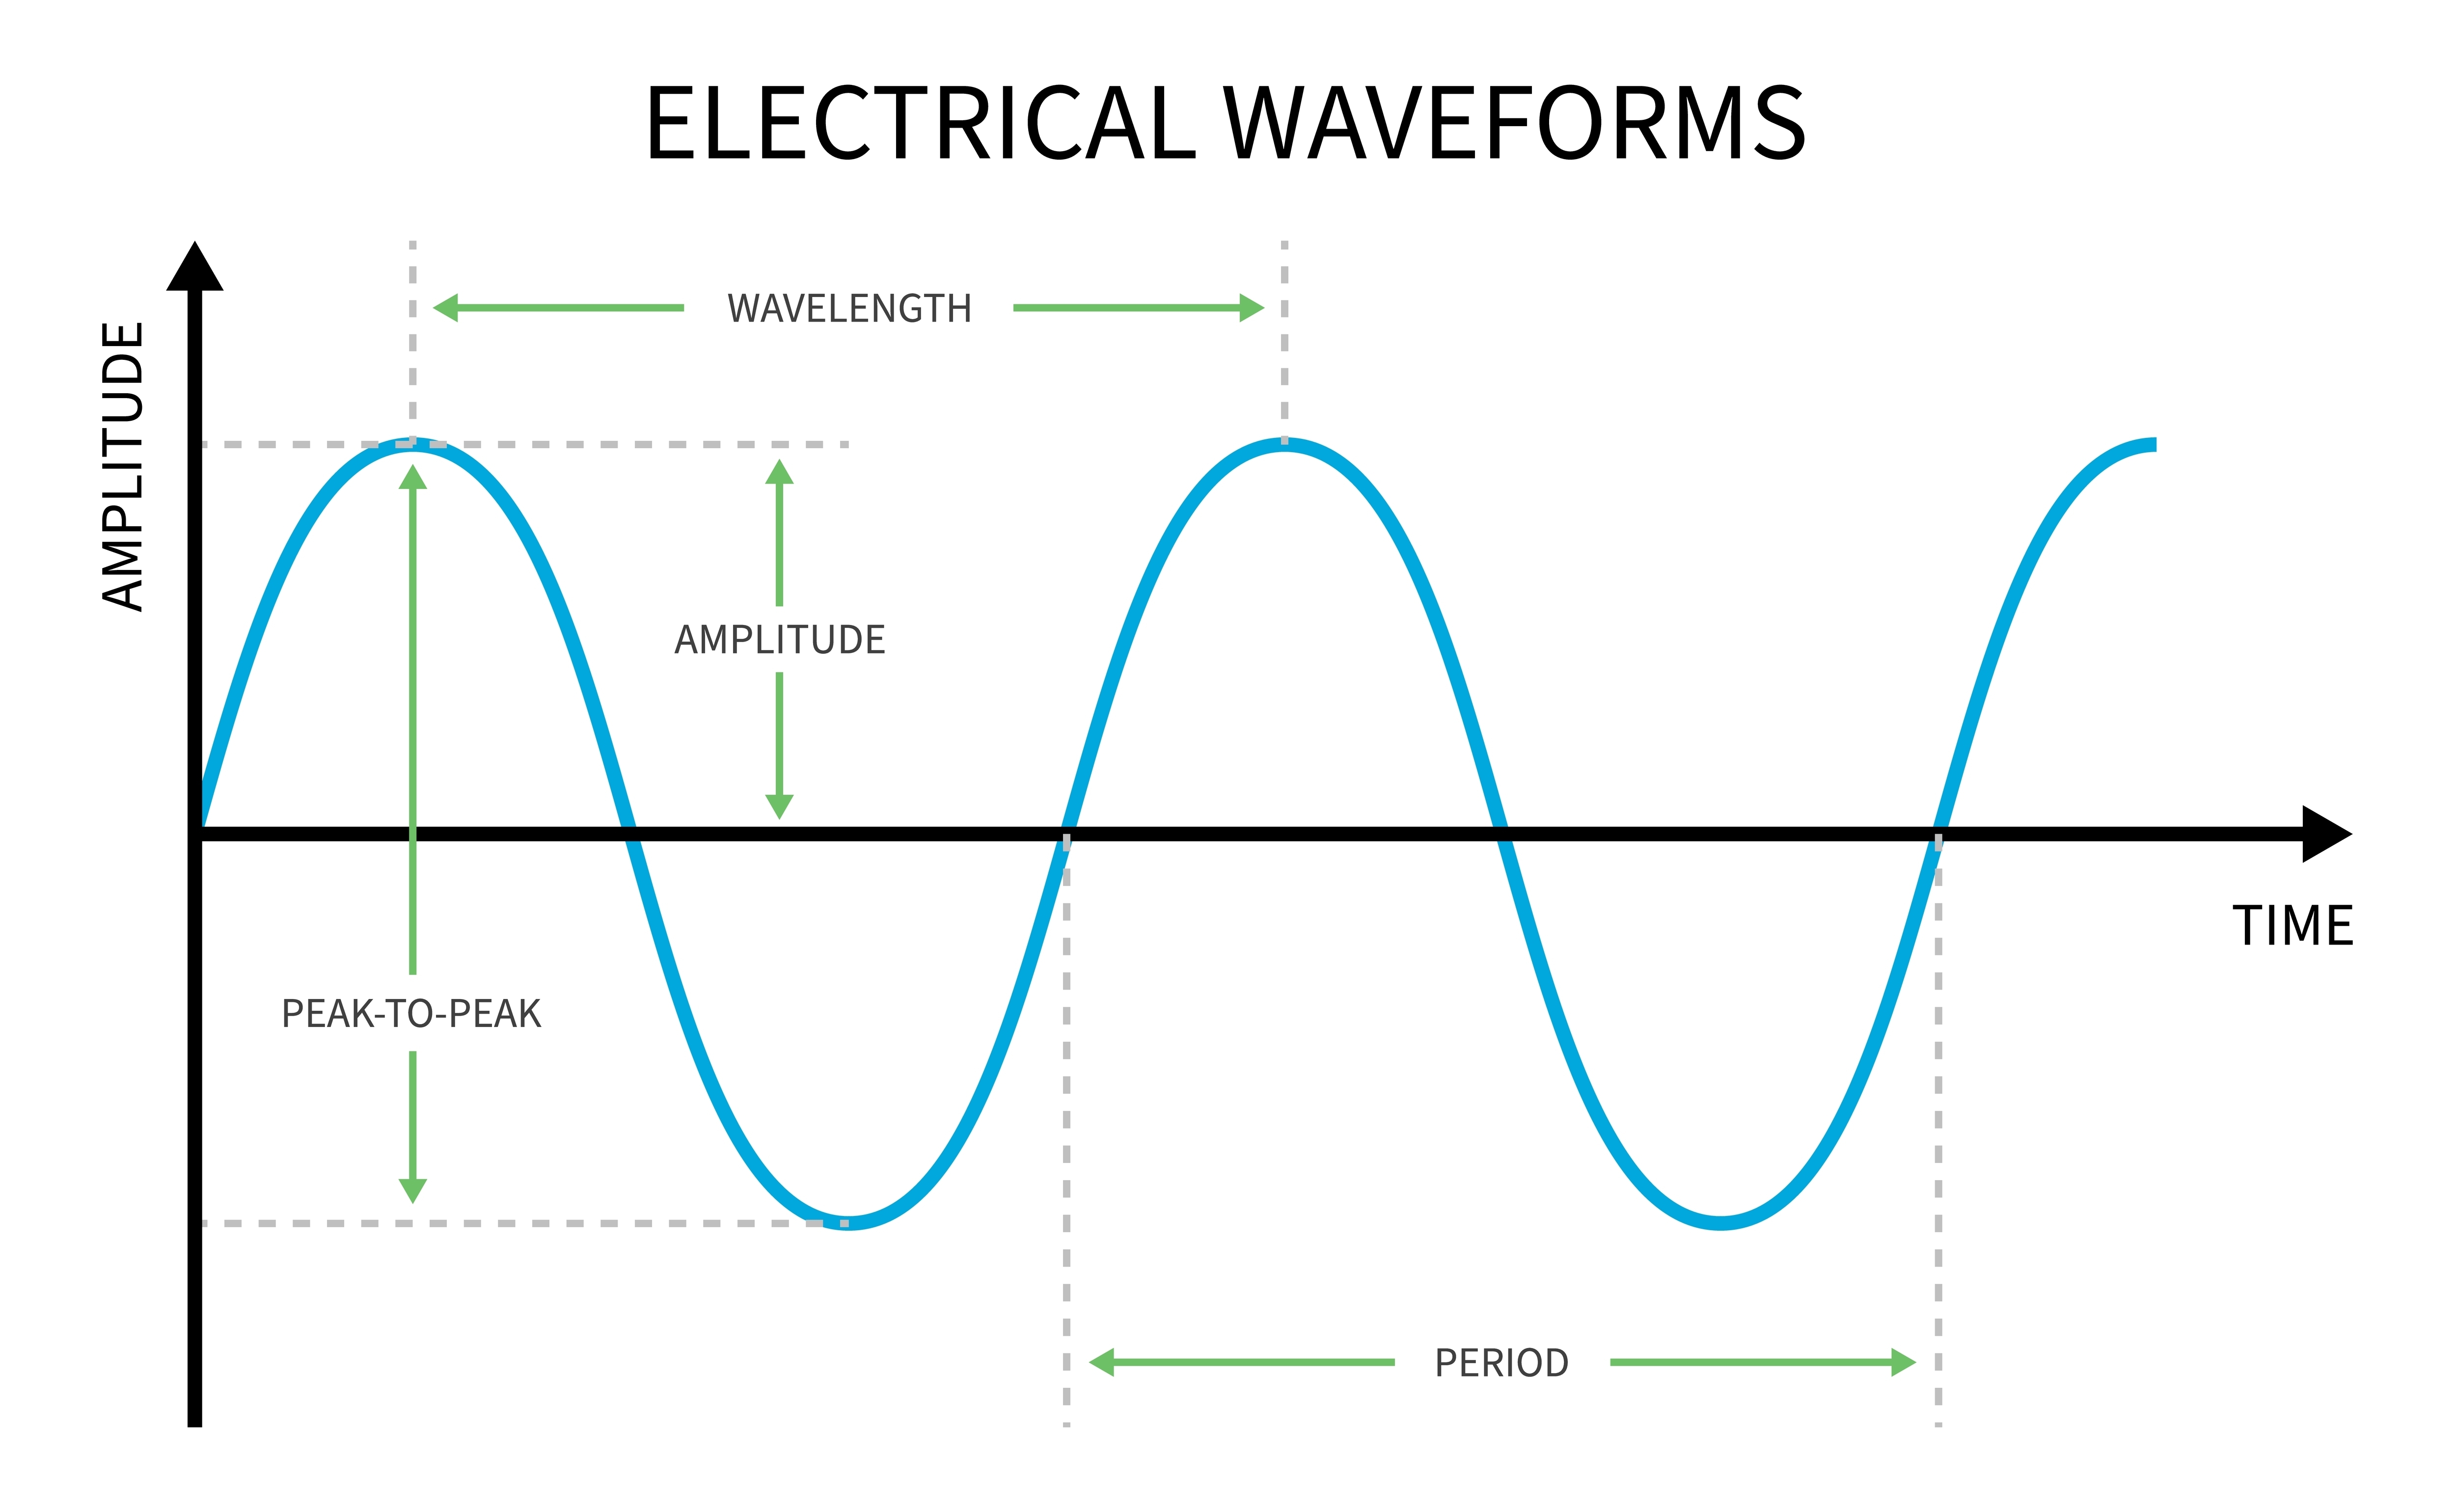
peak-to-peak voltage: the voltage contained between the positive and negative maximum values of the original AC waveform.
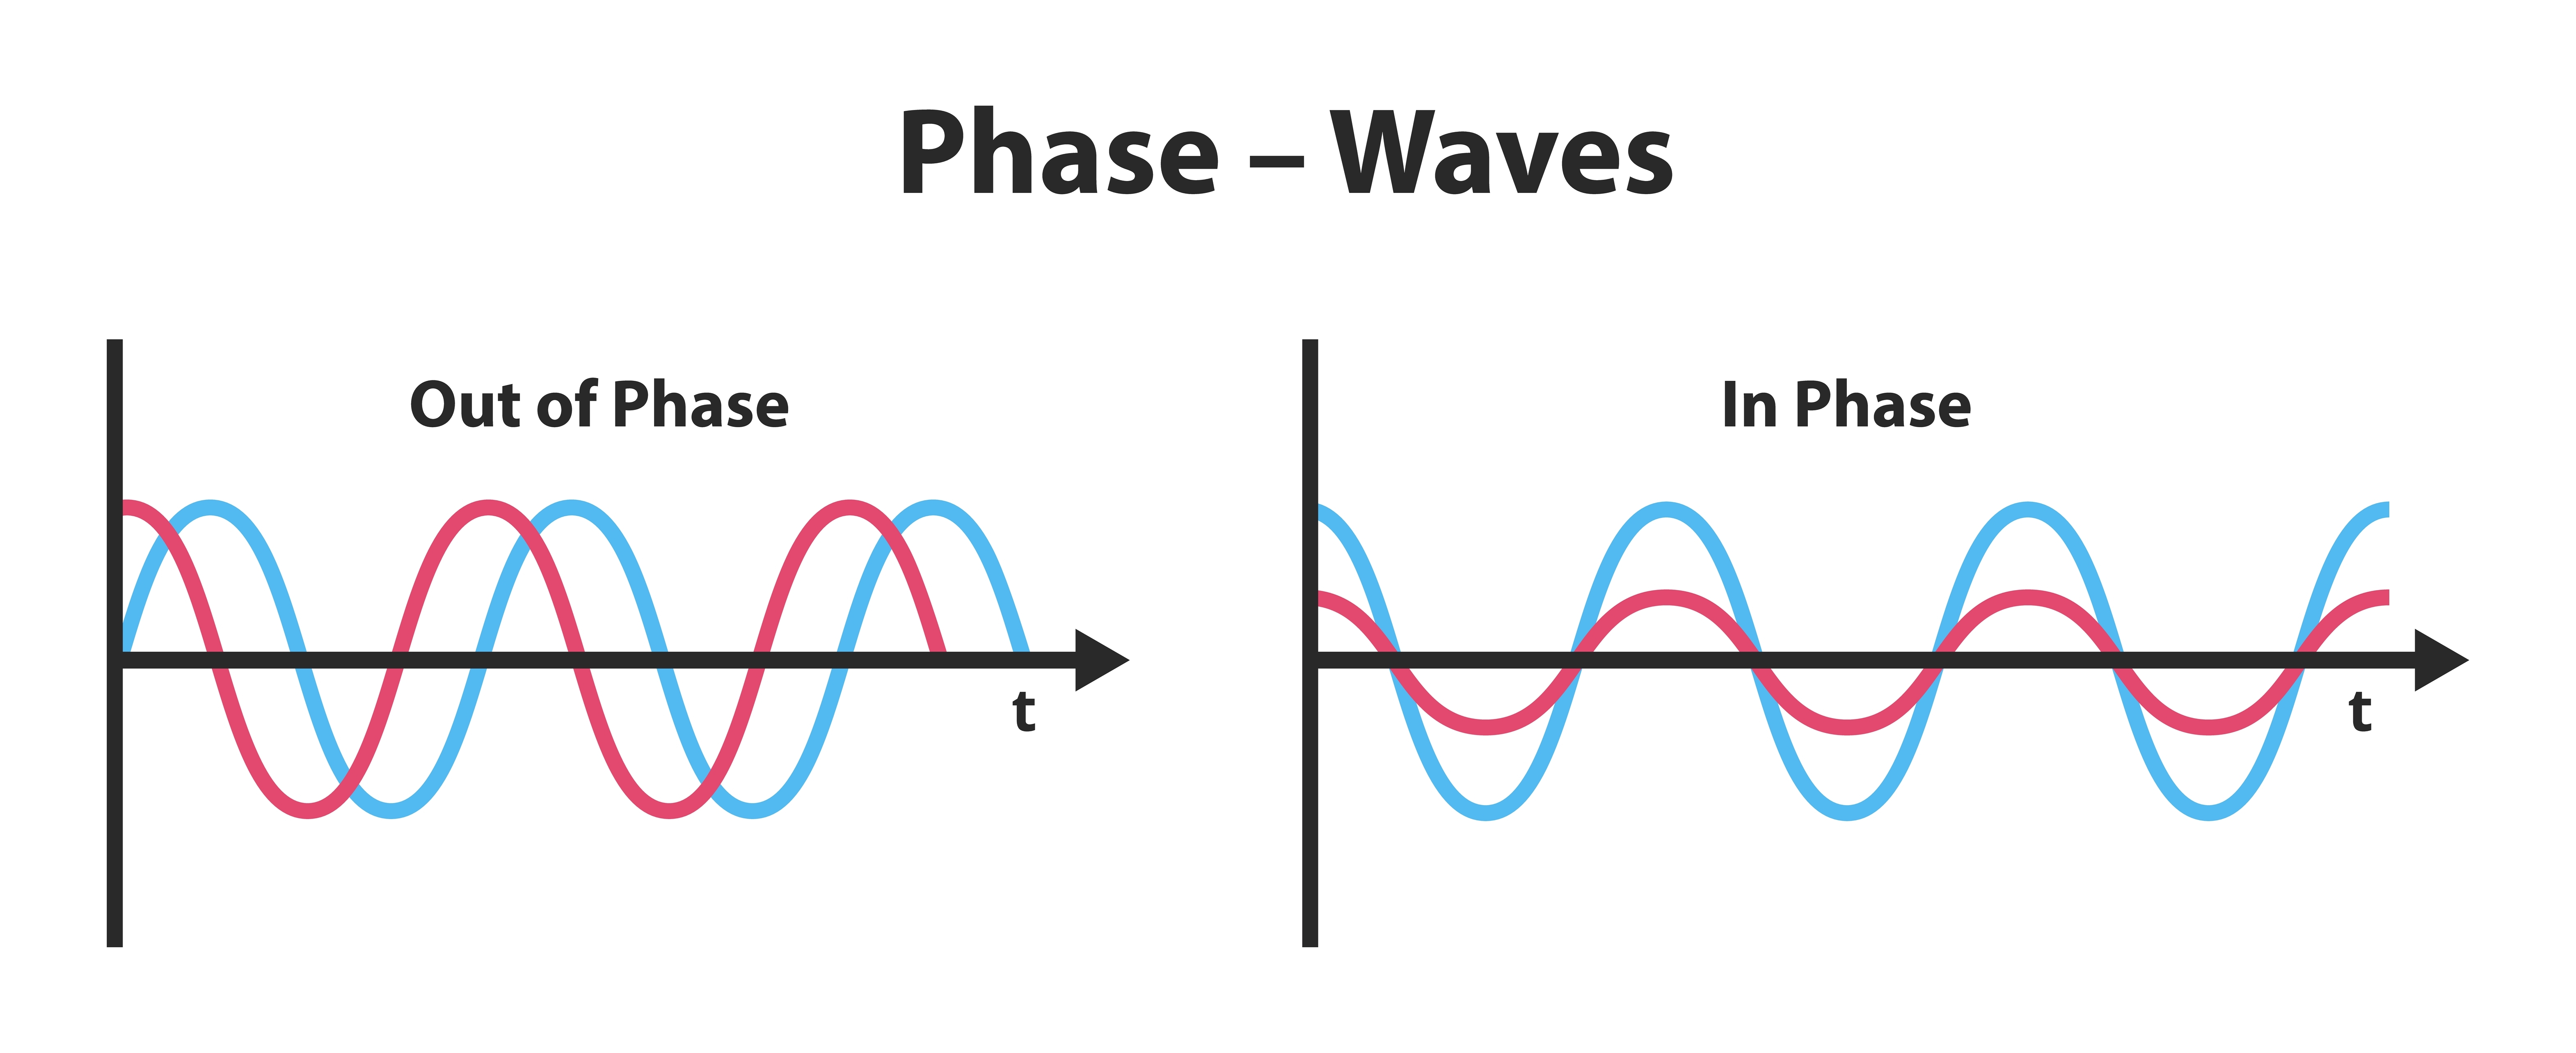
phase: the degree to which the peaks and valleys of two waveforms coincide.
phase distortion: the displacement of the EEG waveform in time.
picowatt: billionths of a watt.
polarization: chemical reactions produce separate regions of positive and
negative charge where an electrode and electrolyte make contact, reducing ion exchange.
power (W): the rate at which energy is transferred, which is
proportional to the product of current and voltage. Power is measured in watts.
proton: positively charged subatomic particle found in the
nucleus of an atom.
Quantitative EEG (qEEG): digitized statistical brain mapping
using at least a 19-channel montage to measure EEG amplitude within
specific frequency bins.
reference electrode: the electrode placed over a less-electrically active site like the mastoid bone behind the ear.
resistance (R): the opposition to a DC signal by a resistor measured
in ohms.
resistor: a component in electric circuits that resists current
flow.
resolution: degree of detail in a biofeedback display (0.1 μV) or the number of voltage levels
that an A/D converter can discriminate (16 bits or discrimination among 65,536 voltage levels).
root mean square (RMS) voltage: 0.707 of the peak voltage.
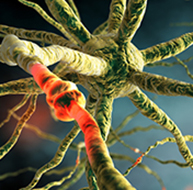
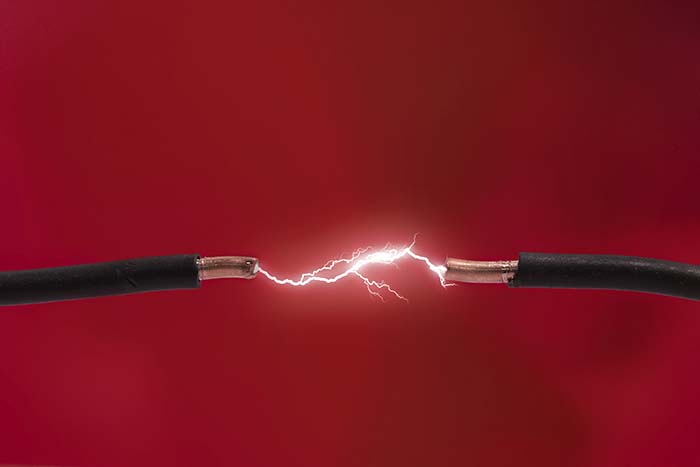
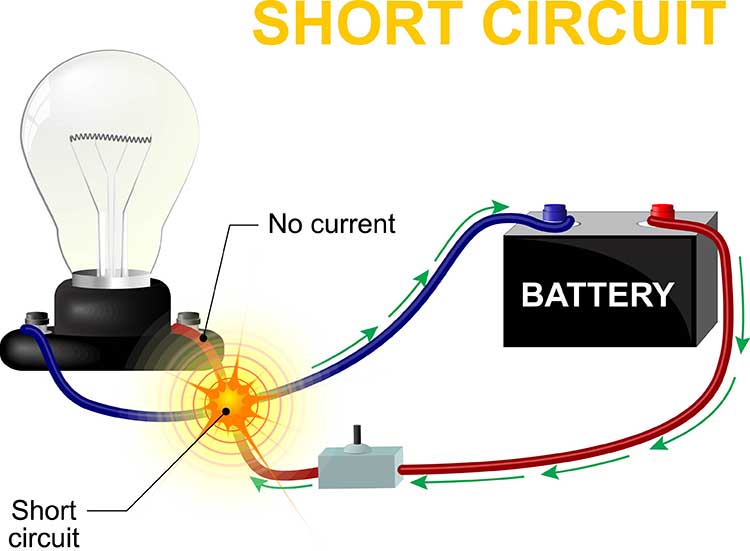
short circuit: a lower-resistance electrical circuit created by the unintended contact between components that accidentally diverts the current.
skin conductance level (SCL): a tonic measurement of how easily
an AC or DC passes through the skin, expressed in microsiemens.
skin resistance level (SRL): a tonic (resting) measurement of the
opposition to an AC or DC as it passes through the skin,
expressed in Kohms.
stopband: the range of frequencies that is sharply attenuated by a filter.
superconductor: a material that conducts electricity without
resistance.
telemetry: remote monitoring and transmission of information. An encoder measures
physiological activity and transmits these data to a computer for analysis.
tracking test (behavioral test): a test of the entire signal chain (EEG sensor, differential amplifier, gain amplifier, cable, encoder, and computer) performance by asking a client to act and then observing the effects on the EEG.
transducer: device that transforms energy from one form to another.
Electrodes convert ionic potentials into electrical potentials.
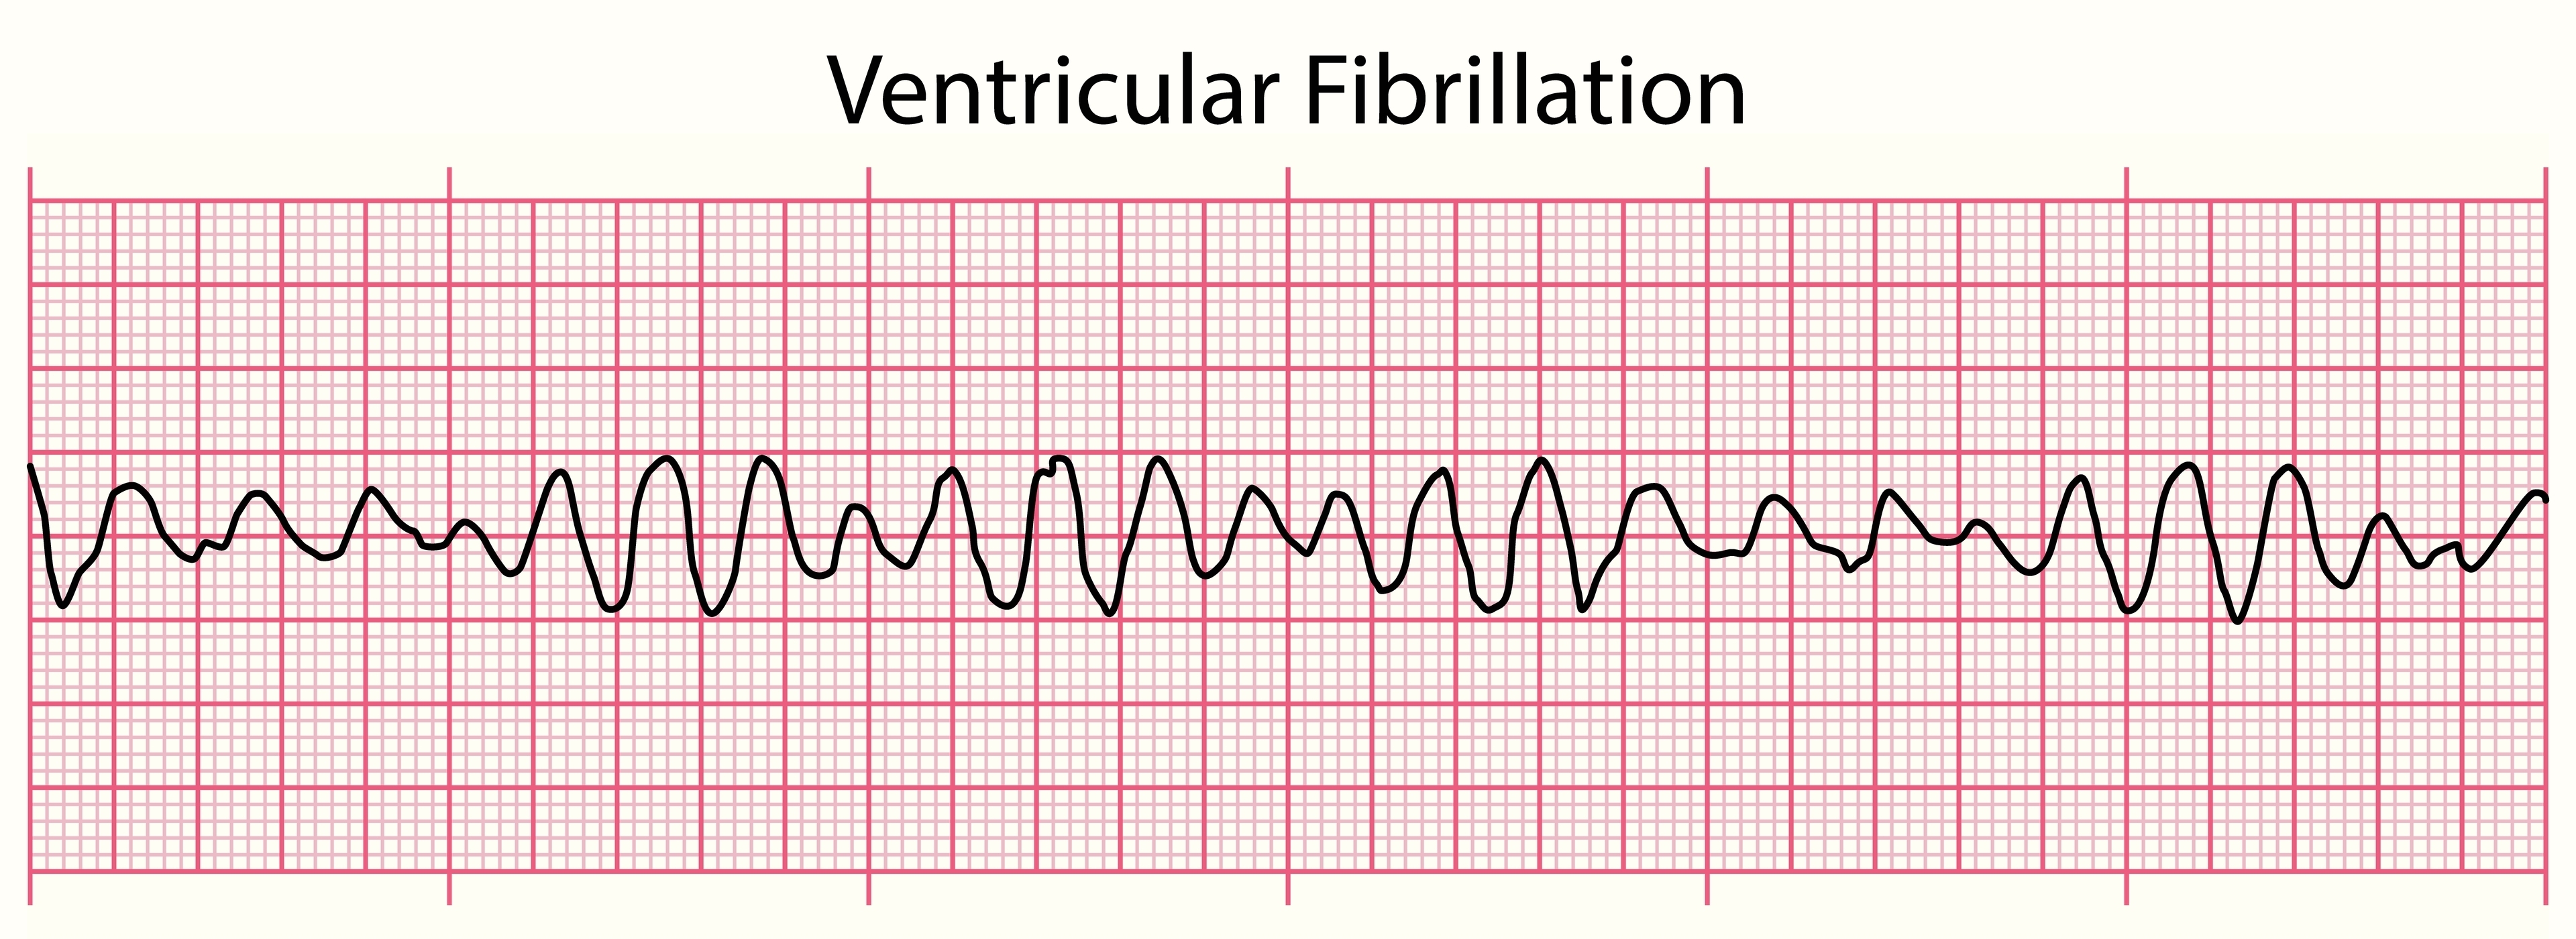
ventricular fibrillation: a medical emergency in which the lower
heart chambers contract in a rapid and unsynchronized fashion and cannot
pump blood.
volume conduction: the movement of biological signals through
interstitial fluid.
volt (V): unit of electrical potential difference (electromotive
force) that moves electrons in a circuit.
voltage (E): the amount of electrical potential difference
(electromotive force).
voltohmmeter: a device that uses a DC signal to measure resistance
in an electric circuit, such as between active and reference electrodes.
watt (W): a unit of power used to express signal strength in the
qEEG.
TEST YOURSELF ON CLASSMARKER
Click on the ClassMarker logo below to take a 10-question exam over this entire unit.
REVIEW FLASHCARDS ON QUIZLET
Click on the Quizlet logo to review our chapter flashcards.
Visit the BioSource Software Website
BioSource Software offers Physiological Psychology, which satisfies BCIA's Physiological Psychology requirement, and Neurofeedback100, which provides extensive multiple-choice testing over the Biofeedback Blueprint.
Assignment
Now that you have completed this module, explain why low-and-balanced skin-electrode impedances are important in neurofeedback training. Describe the precautions you take to achieve acceptable impedance values. How do you measure impedance with your neurofeedback system?
References
Andreassi, J. L. (2000). Psychophysiology: Human behavior and physiological
response. Lawrence Erlbaum and Associates, Inc.
Basmajian, J. V. (Ed.). (1989). Biofeedback: Principles and practice for
clinicians. Williams & Wilkins.
Cacioppo, J. T., & Tassinary, L. G. (Eds.). (1990). Principles of
psychophysiology. Cambridge University Press.
Collura, T. F. (2014). Technical foundations of neurofeedback. Taylor & Francis.
Demos, J. N. (2005). Getting started with neurofeedback. W. W. Norton & Company.
Fisch, B. J. (1999). Fisch and Spehlmann's EEG primer (3rd ed.). Elsevier.
Floyd, T. L. (1987). Electronics fundamentals: Circuits, devices, and
applications. Merrill Publishing Company.
Grant, A. (2015). Four elements earn permanent seats on the periodic table. Science News.
Hughes, J. R. (1994). EEG in clinical practice (2nd ed.). Butterworth-Heinemann.
Kubala, T. (2009). Electricity 1: Devices, circuits, and materials (9th ed.).
Cengage Learning.
Libenson, M. H. (2010). Practical approach to electroencephalography. Saunders Elsevier.
Miller, J. W., Kim, W. S., Homes, M. D., & Vanhatalo, S. (2007). Ictal localization by source analysis of infraslow activity in DC-coupled scalp EEG recordings. NeuroImage, 35(2), 583-597. https://doi.org/10.1016/j.neuroimage.2006.12.018
Montgomery, D. (2004). Introduction to biofeedback. Module 3:
Psychophysiological recording. Association for Applied Psychophysiology and Biofeedback.
Nilsson, J. W., & Riedel, S. A. (2008). Electric circuits (8th ed.). Pearson Prentice-Hall.
Peek, C. J. (2016). A primer of traditional biofeedback instrumentation.
In M. S.
Schwartz, & F. Andrasik (Eds.). (2016). Biofeedback: A practitioner's guide (4th ed.).
The Guilford Press.
Stern, R. M., Ray, W. J., & Quigley, K. S. (2001). Psychophysiological
recording (2nd ed.). Oxford University Press.
Thompson, M., & Thompson, L. (2015). The biofeedback book: An
introduction to basic concepts in applied psychophysiology (2nd ed.). Association for Applied Psychophysiology and Biofeedback.
Wadman, W. J., & Lopes da Silva, F. H. (2011). In D. L. Schomer & F. H. Lopes da Silva (Eds.). Niedermeyer's electroencephalography: Basic principles, clinical applications, and related fields (6th ed.). Lippincott Williams & Wilkins.


.jpg)
.jpg)