Efficacy Criteria
Research allows us to assess the efficacy of clinical and performance interventions. Peer-reviewed randomized controlled trials (RCTs) and meta-analyses that summarize their results are critical to the credibility of biofeedback and neurofeedback. Practitioners who claim success but refuse to submit their findings to peer review have continually endangered the field's reputation. Our stakeholders demand that we "show our receipts" or not be taken seriously. The field's reputation is critical since it impacts respect for providers, professional referrals, third-party reimbursement, and public demand for our services.
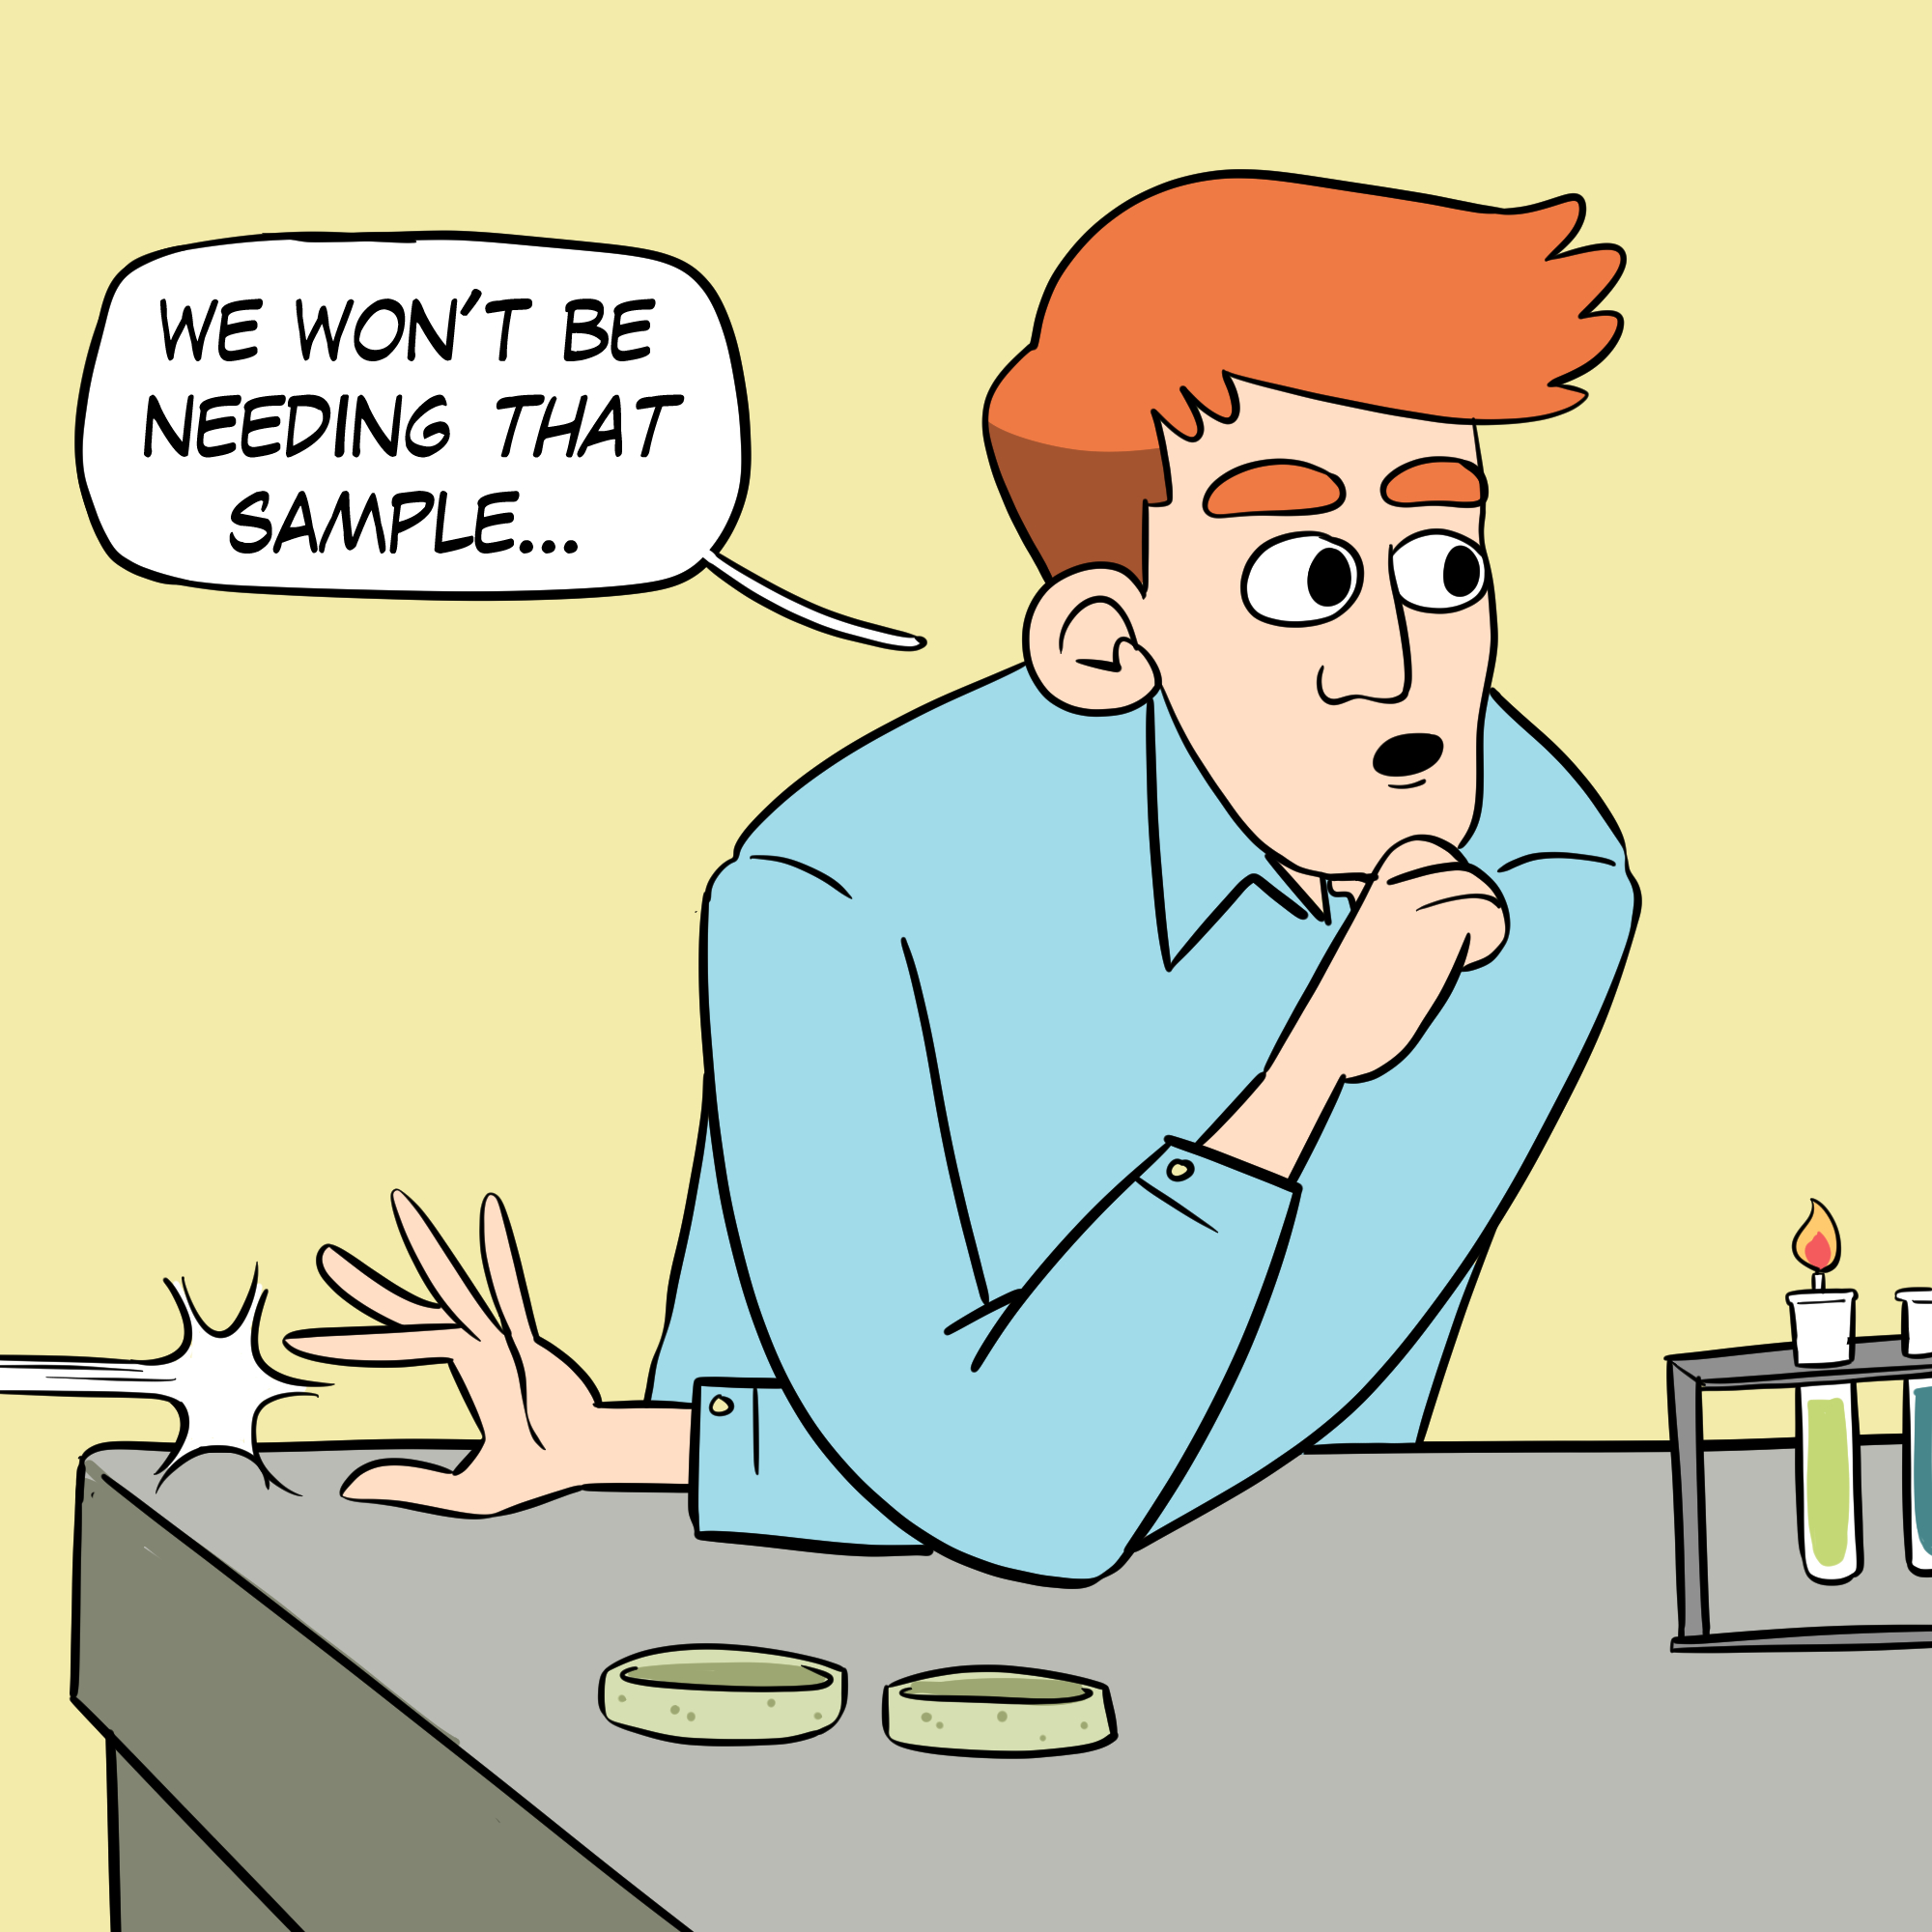
Large-scale randomized controlled trials represent the "gold standard" in research because experiments [alone] allow us to draw causal conclusions. Due to their expense and time demands, experimental studies exceed the resources of most practitioners. However, clinicians can still integrate the scientific method into their practice. They can utilize nonexperimental techniques like case studies and publish their results in journals like
Applied Psychophysiology and Biofeedback. Case studies and case series can generate valuable hypotheses and provide the rationale for RCTs. Graphic © ZyabichTyler Olson/shutterstock.com.
 Evidence-Based Practice in Biofeedback and Neurofeedback
, an Association for Applied Psychophysiology and Biofeedback publication, summarizes the peer-reviewed literature and conservatively assigns efficacy ratings for specific applications.
Drs. Inna Khazan, Donald Moss, Randy Lyle, and Fred Shaffer are the editors of the fourth edition of this industry reference.

BCIA Blueprint Coverage
This unit addresses
IV. Research Evidence Base for Neurofeedback - A. Efficacy Criteria.

This unit covers
Nonexperimental and Experimental Designs, Randomized Controlled Trials, Questionable Research Practices, Case Study Designs, Descriptive and Inferential Statistics, Meta-Analysis, The Clinical Efficacy of Established Medical Practices, and Criteria for Clinical Efficacy.
Please click on the podcast icon below to hear a full-length lecture.
Nonexperimental and Experimental Designs
Nonexperimental designs do not manipulate independent variables or randomly assign participants to treatment conditions. These methods, including correlational and quasi-experimental designs, lack internal validity (Myers & Hansen, 2012).
Independent, Dependent, and Extraneous Variables
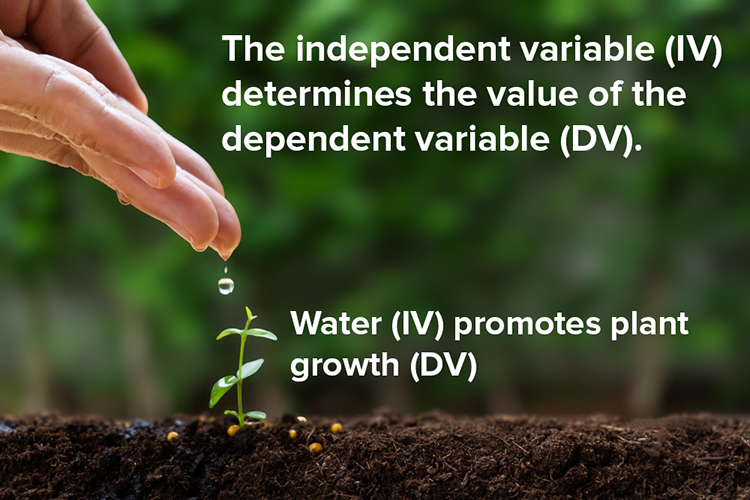
An
independent variable (IV) is the variable (antecedent condition) an experimenter
intentionally manipulates. Independent variable graphic © Olena07/Shutterstock.com.

An experiment requires at least two
levels (values) of an
independent variable like slow cortical potential (SCP) neurofeedback and listening to relaxing music. The levels can consist of active and inactive treatments (experimental-control) or two active treatments (experimental-experimental).
A
dependent variable (DV) is the outcome measure the experimenter uses to assess
the change in behavior produced by the independent variable. The value of a dependent variable depends on the
level of the IV. In a study of the efficacy of SCP neurofeedback in
treating migraine, the number of emergency room visits per month could serve as one of the DVs. Dependent variable graphic © Chonlatee42/ Shutterstock.com.
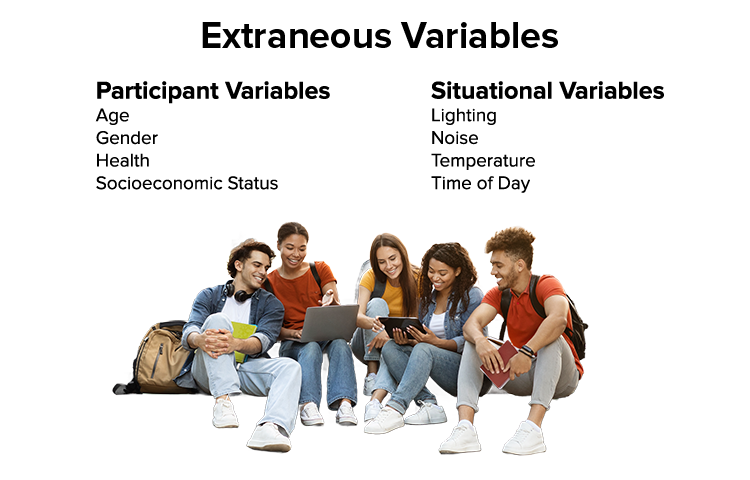
An
extraneous variable (EV) is a variable not controlled by the experimenter that could
affect the DV. Failure to control EVs can result in confounding. Extraneouus variable graphic © Prostock-studio/Shutterstock.com.
 Confounding
 occurs when an EV changes systematically across conditions, making it a potential cause of changes in the DV.
For example, in a study comparing the effects of two breathing rates (e.g., 6 bpm or 12 bpm) on lowering blood pressure, if the 6-bpm group also exercised more than the 12-bpm group, this
would confound the experiment.
When confounding occurs, a researcher has competing explanations for the experimental findings, which cannot be
ruled out. In this case, an investigator cannot draw cause-effect conclusions.
Internal and External Validity
Experiments can achieve high
internal validity, which is the degree to which we can attribute changes in the dependent variable to the independent variable.
External validity is the degree to which the results of the experiment generalize to other individuals, settings, and variations of the treatment. When an experiment has high external validity, then its results can be said to apply to the population of individuals who are similar to those who were sampled for the experiment.
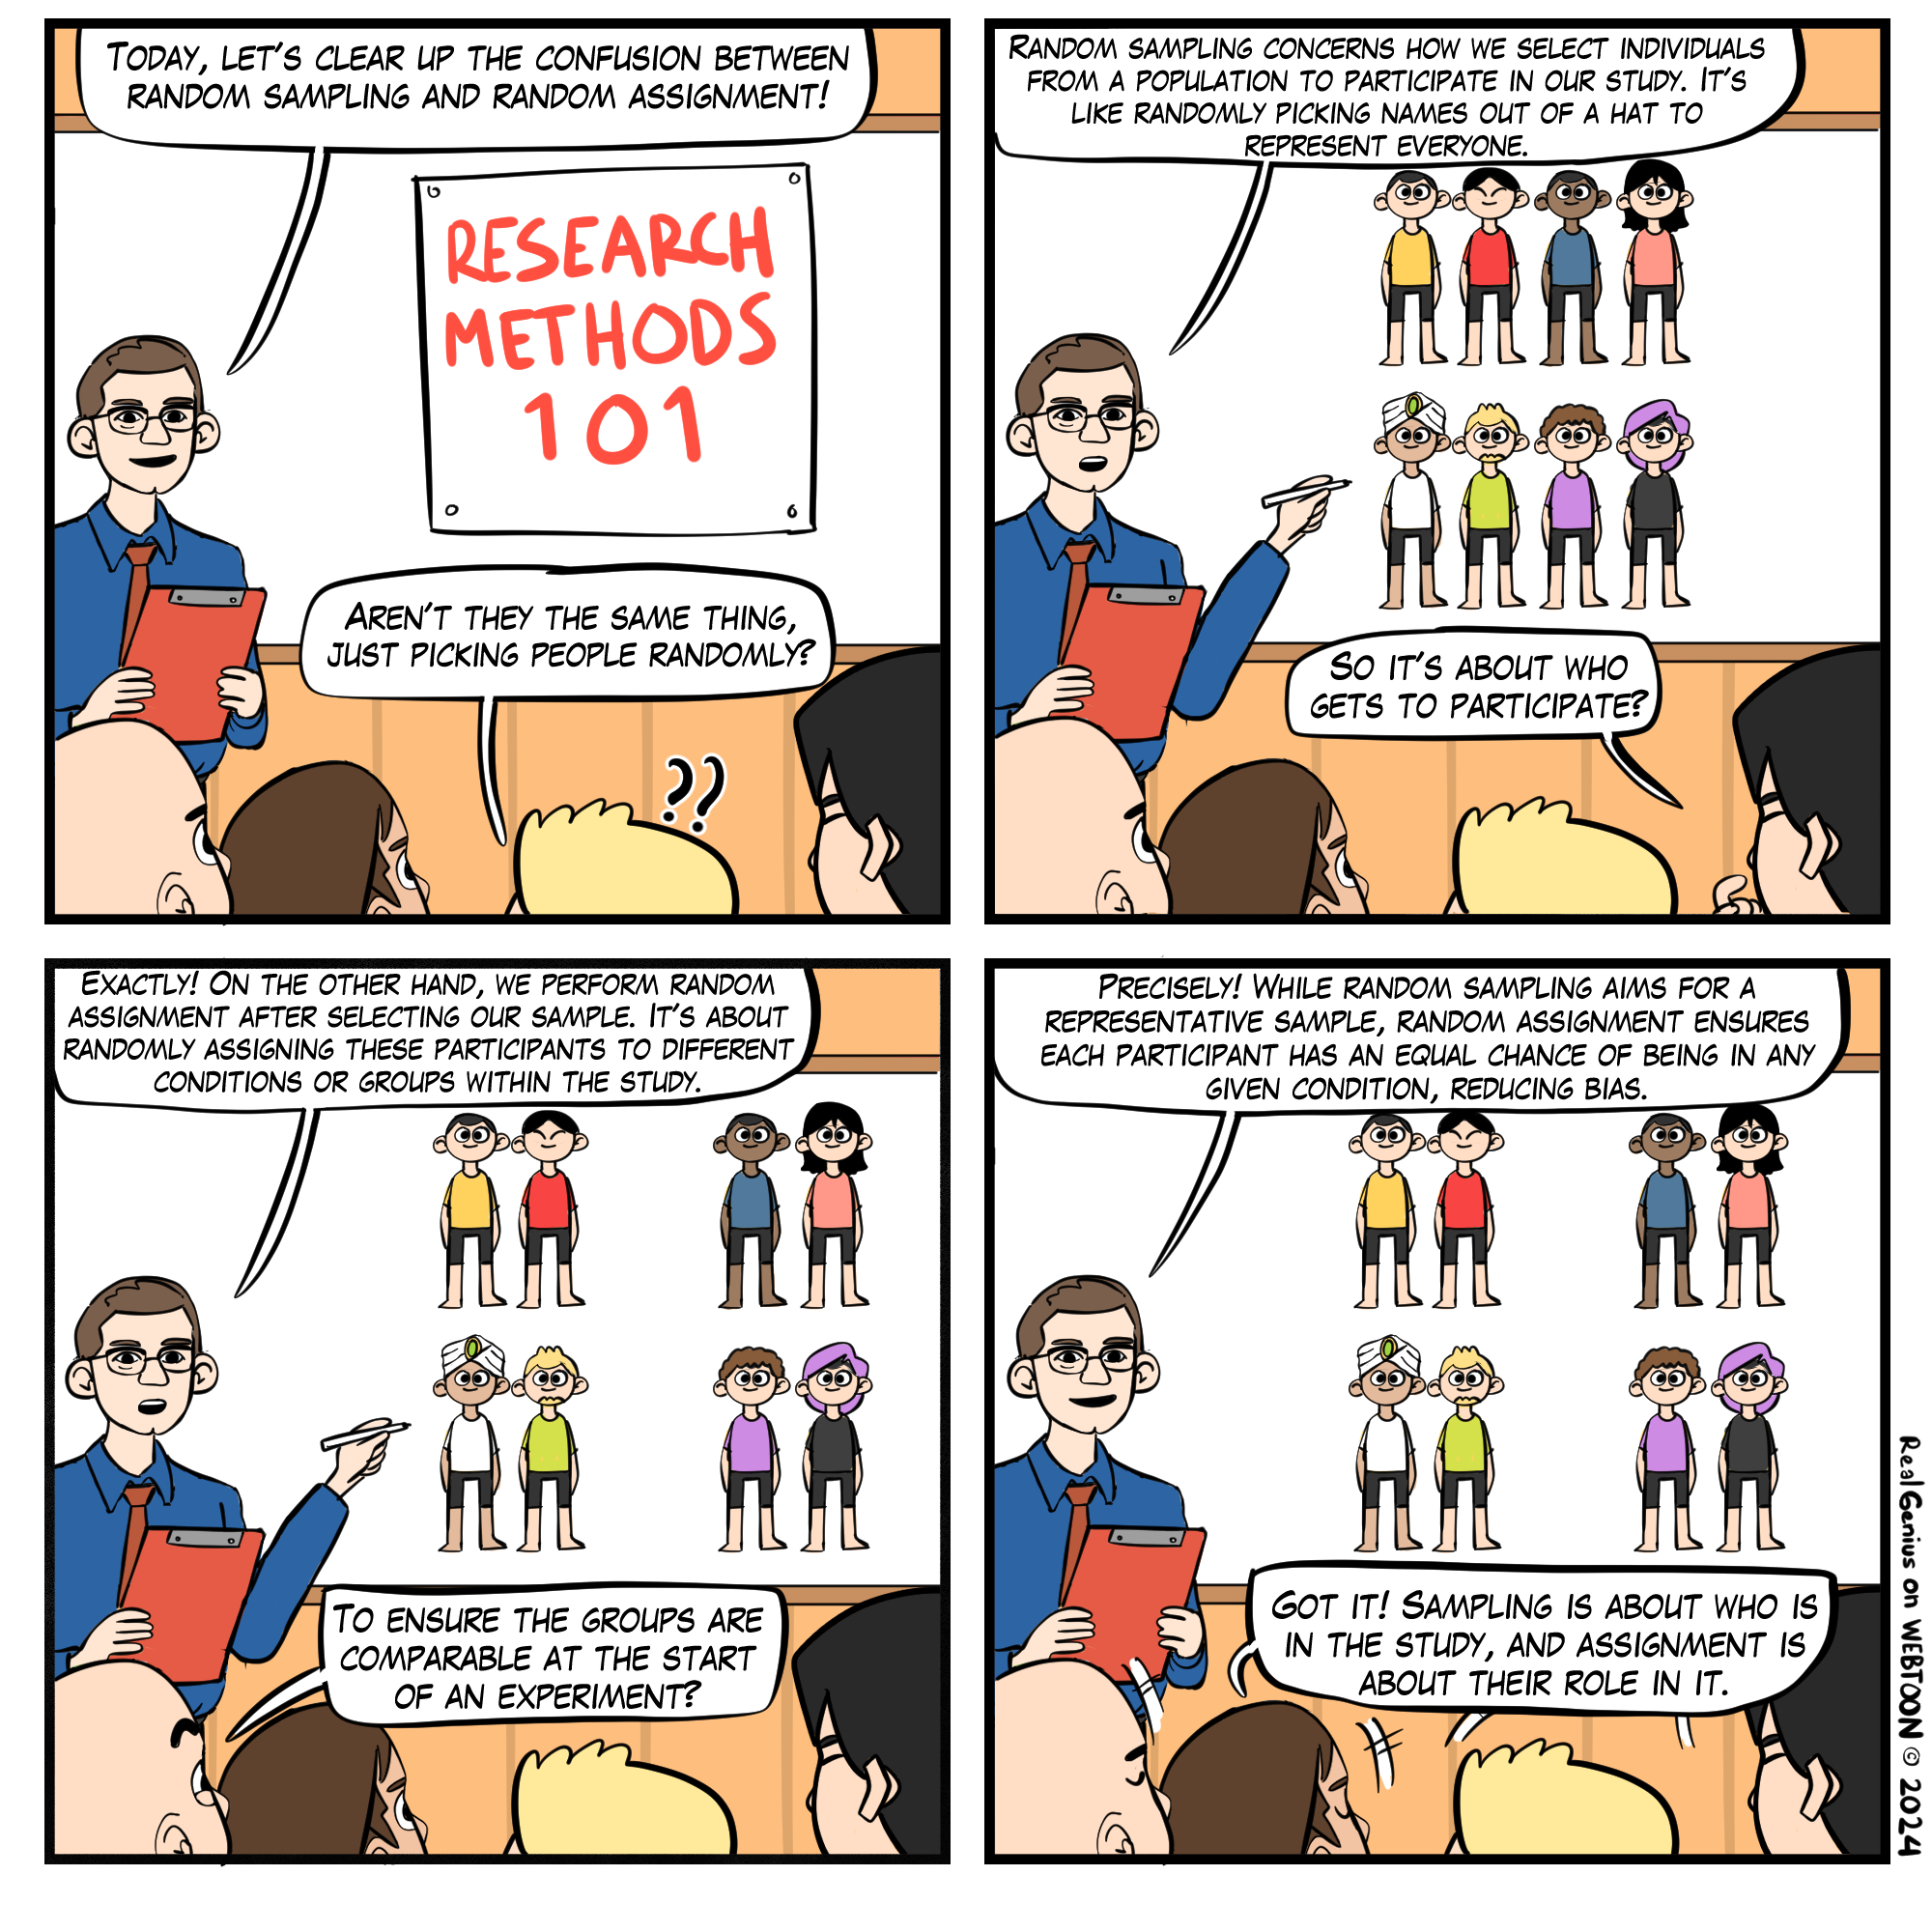
Experiments attain internal validity by creating at least two levels of an independent variable and then randomly assigning participants to one or more conditions. Graphic by Dani S on Fiverr.com.
Internal
validity is important because it establishes a causal relationship between the independent and dependent
variables.
Nonexperimental designs cannot achieve internal validity because they don't control EVs. They may not create levels of the IV, randomly assign participants to conditions, or both.
A
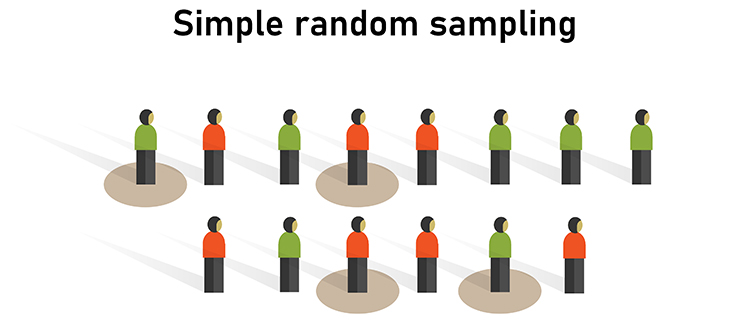
sample is a subset of the target population. Graphic © Bakhtiar Zein/Shutterstock.com.
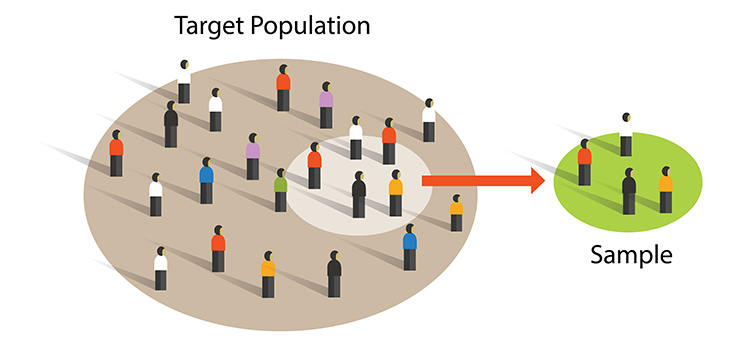
Researchers achieve external validity by using probability sampling to select participants from a population.
External validity is the degree to which we can generalize sample findings to the population from which it was drawn.
Both experimental and nonexperimental designs can achieve external validity since this depends on the sampling method and not the control of EVs.
Random sampling, where each member of a population has an equal chance to be selected, is a prerequisite for external validity. Graphic © Bakhtiar Zein/Shutterstock.com.
Threats to Internal Validity
Classic threats to internal validity include history, maturation, testing, instrumentation, statistical
regression, assignment, mortality, and assignment-interaction (Campbell, 1957; Campbell & Stanley,
1966).
History threat occurs when an event outside the experiment
threatens internal validity by changing the DV. For example, in a neurofeedback (NF) study to increase continuous attention, participants in group A were
run in the morning while those in group B were run in the afternoon.
Maturation threat is produced when physical or psychological changes in the participant
threaten internal validity by changing the DV. For example, boredom may increase participant errors on a test of
continuous attention.
Testing threat occurs when prior exposure to a measurement procedure affects
performance on this measure during the experiment. For example, suppose experimental participants regularly use a self-inflating blood pressure cuff during HRV biofeedback training, and control participants only use one during pre- and post-testing. In that case, the experimental participants could have lower pressures due to their greater experience.
Instrumentation threat is when changes in the measurement instrument or measurement
procedure threaten internal validity. For example, EEG sensor placement could be less accurate in one treatment
group than in another.
Statistical regression threat occurs when participants are assigned to
conditions based on extreme scores. The measurement procedure is not wholly reliable and participants are
retested using the same method to show change on the DV. The scores of both extreme groups tend to regress to
the mean on the second measurement: high scorers are lower and low scorers are higher on the second testing. This
effect is caused by random variability of measurement error.
For example, all participants are pre-tested on anxiety, and only those who scored high or low are used as participants.
If assignment to two different relaxation training conditions did not produce groups that started with equal levels of anxiety, apparent group differences at post-test might be due to regression threat.
Assignment threat occurs when the assignment procedure does not balance participant variables across treatment conditions. For example, despite random assignment, participants in the experimental group
may have higher systolic blood pressures than those in the control group.
Mortality threat occurs when participants drop out of experimental conditions
at different rates. For example, even if random assignment distributed participant characteristics equally across the
conditions at the start of the experiment, dropout could render the conditions unequal on an extraneous variable
like hypnotic susceptibility.
Assignment-interaction threat occurs when an assignment threat combines with at least one other
threat (history, maturation, testing, instrumentation, statistical regression, or mortality).
When one of these classic threats confounds an experiment, the study lacks internal validity, and we cannot
establish a cause-effect relationship between the independent and dependent variables.
Control of Physical Variables
Physical variables are aspects of the physical environment like time of day, room size, or noise. Researchers can control these EVs, in order of preference, through elimination, constancy of conditions, and balancing. Elimination removes the variable (soundproofing a room). Constancy of conditions keeps the variable about the same for all treatment conditions (running all participants in the morning). Balancing distributes the variable's effects across all treatment conditions (running half of each condition's participants in the morning and half in the afternoon).
Control of Social Variables
Experiments are social situations, and their results can be confounded if the demand characteristics or experimenter behaviors differ systematically across treatment conditions.
Social variables are aspects of the relationships between researchers and
participants.
Two significant social variables are demand characteristics and experimenter bias.
Demand characteristics
are situational cues (like students packing up their belongings at the end of class) that signal expected behavior
(dismissal of class).
An experimenter can control demand characteristics by performing a
single-blind experiment in
which participants are not told their treatment condition. Graphic by Dani S on Fiverr.com.

For example, in a single-blind biofeedback study of heart failure patients, the experimental
and control groups receive the same training using identical screens and practice assignments. The only difference between the groups is their target breathing rate (6 bpm for the experimental and 12 bpm for the control group).
Experimenter bias occurs when
a researcher knows the participants' treatment condition and acts to confirm the experimental
hypothesis. Graphic redrawn by Dani S from @BogusandBias.
In the previous heart failure example, an experimenter might provide more encouragement to 6-bpm than 12-bpm participants.
A
double-blind experiment,
which conceals the participants' treatment condition from both participants and the experimenter, can control demand
characteristics and experimenter bias. For example, in a double-blind drug study, the experimental and control
groups receive capsules that look and taste identical. The experimenter does not know whether a participant has
received a drug or placebo.
There have been few double-blind biofeedback studies because participants can often detect and experience frustration when receiving false feedback (e.g., the display shows heart rate increasing when it is decreasing). Also, unless biofeedback training is automated, training will be ineffective if the experimenter doesn't know the training goal (e.g., heart rate down).
An alternative to a double-blind experiment is to blind participants and research technicians to the experimental hypothesis. Where a technician does not know which group is expected to perform better, this can reduce–but not eliminate–experimenter bias.
Control of Participant Characteristics
Participant characteristics are attributes like
HRV or resting breathing rates. These variables can confound an experiment when associated with the DV, and failure to control these subject variables results in groups that are not equivalent. Researchers can control participant personality variables through random assignment to
treatment conditions, matching participants on this variable and randomly assigning them to different conditions. They can also
randomly assign participants to all treatment conditions using a within-participants design.
Correlational Studies
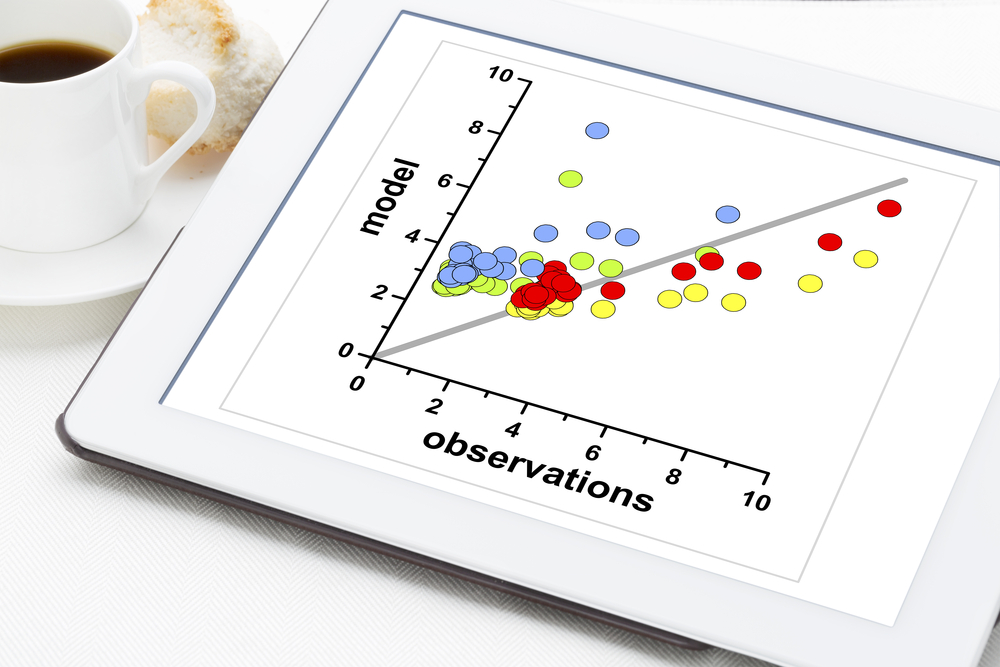
A
correlational study is a nonexperimental design because it does
not
manipulate an IV. These designs only
obtain data regarding participant characteristics and performance (no IVs, only DVs). Scatterplots graphically display the magnitude (-1 to +1) and direction (negative or positive) of a correlation. Scatterplot © marekuuliasz/Shutterstock.com.
For example, the test-retest reliability of
resonance frequency (RF) measurements is an unresolved question in HRV biofeedback. The RF is stimulation rate using techniques like paced breathing or rhythmic skeletal muscle contraction that produces the greatest HRV. Studies that address this question measure participants' RF at two different points in time, often two weeks apart, and calculate a
Pearson r statistic.
Investigators use correlational studies when they cannot or should not
manipulate an independent variable. Since the RF is characteristic brings into an experiment, the test-retest reliability question falls into the "cannot manipulate" category.
Although valuable, correlation does not imply causation. Correlational
studies lack internal validity for three reasons.
First,
correlations are not
directional (depression could cause insomnia, or
impaired sleep could cause depression). Second, the problem of
bidirectional causation means that each variable could influence the
other (depression could cause insomnia, and insomnia could worsen
depression). Finally, the
third variable problem occurs when a hidden
variable affects both correlated variables (financial worries could disrupt sleep and worsen depression). Check out the YouTube video
Correlation vs. Causality: Freakonomics Movie.
Common Quasi-Experimental Designs
Although
quasi-experimental designs have the superficial appearance of experiments, they do not create two or more IV levels and randomly assign participants to conditions. Two
examples are pre-test/post-test designs and ex post facto studies.
Pre-test/Post-test Designs
In a pre-test/post-test design, researchers measure participants on the DV at least before and after administering training. For example, a practitioner could measure children's continuous attention (the DV) before and after neurofeedback training (the IV). Graphic © unoL/Shutterstock.com.

Since pre-test/post-test designs lack a control group, we cannot rule out the possibility that history or maturation threats or a placebo effect accounted for changes.
Confounding is a pervasive problem when the DV is a symptom (e.g., depression) that waxes and wanes. A client may enter NF training when depression is most severe and concludes training when it would naturally remit.
For these reasons, practitioners should not make claims regarding training effectiveness until their protocols have been evaluated by experimental studies that can rule out possible sources of confounding. The requirement of impartial experimental validation is particularly acute when a practitioner has a financial or reputational stake in a protocol and its related hardware and software.
Ex Post Facto Designs
"Ex post facto" means after the fact. Examples of
ex post facto studies are comparisons of participants based on existing characteristics (e.g., the HRV of 30-year-olds versus 60-year-olds) or self-selected treatments (e.g., the HRV of individuals who chose to study biofeedback versus mindfulness meditation). In the first example, participants may vary on characteristics other than age (e.g., the 30-year-olds may be healthier). In the second example, participants may differ in more ways than their self-regulation technique (e.g., individuals who chose biofeedback training may have higher socioeconomic status). Since ex post facto studies do not create IV levels and randomly assign participants to conditions, they do not permit us to draw cause-and-effect conclusions.
Randomized Controlled Trials
In a
randomized controlled trial (RCT), researchers manipulate an independent
variable and randomly assign participants to conditions, with or without,
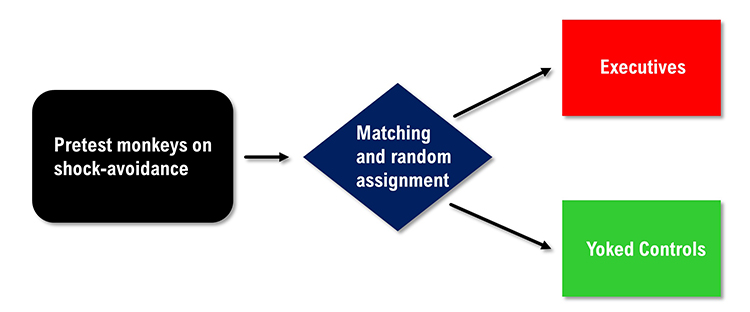
prior matching on participant variables (Bordens & Abbott, 2022). A RCT can
achieve strong internal validity because matching and random assignment increase
the likelihood that the groups will be identical on relevant participant characteristics at the start of an experiment. Check out the YouTube video
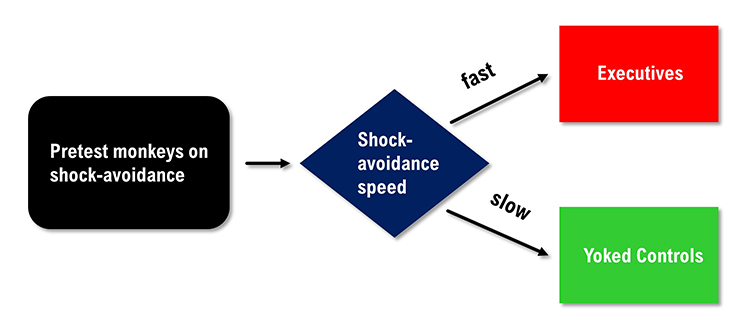
Randomized Controlled Trials vs. Observational Studies. The Brady (1958) "Executive Monkey" study is a textbook example of how to confound an experiment.
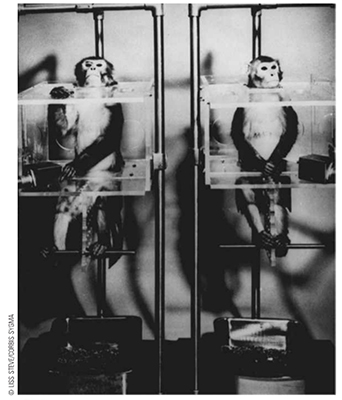
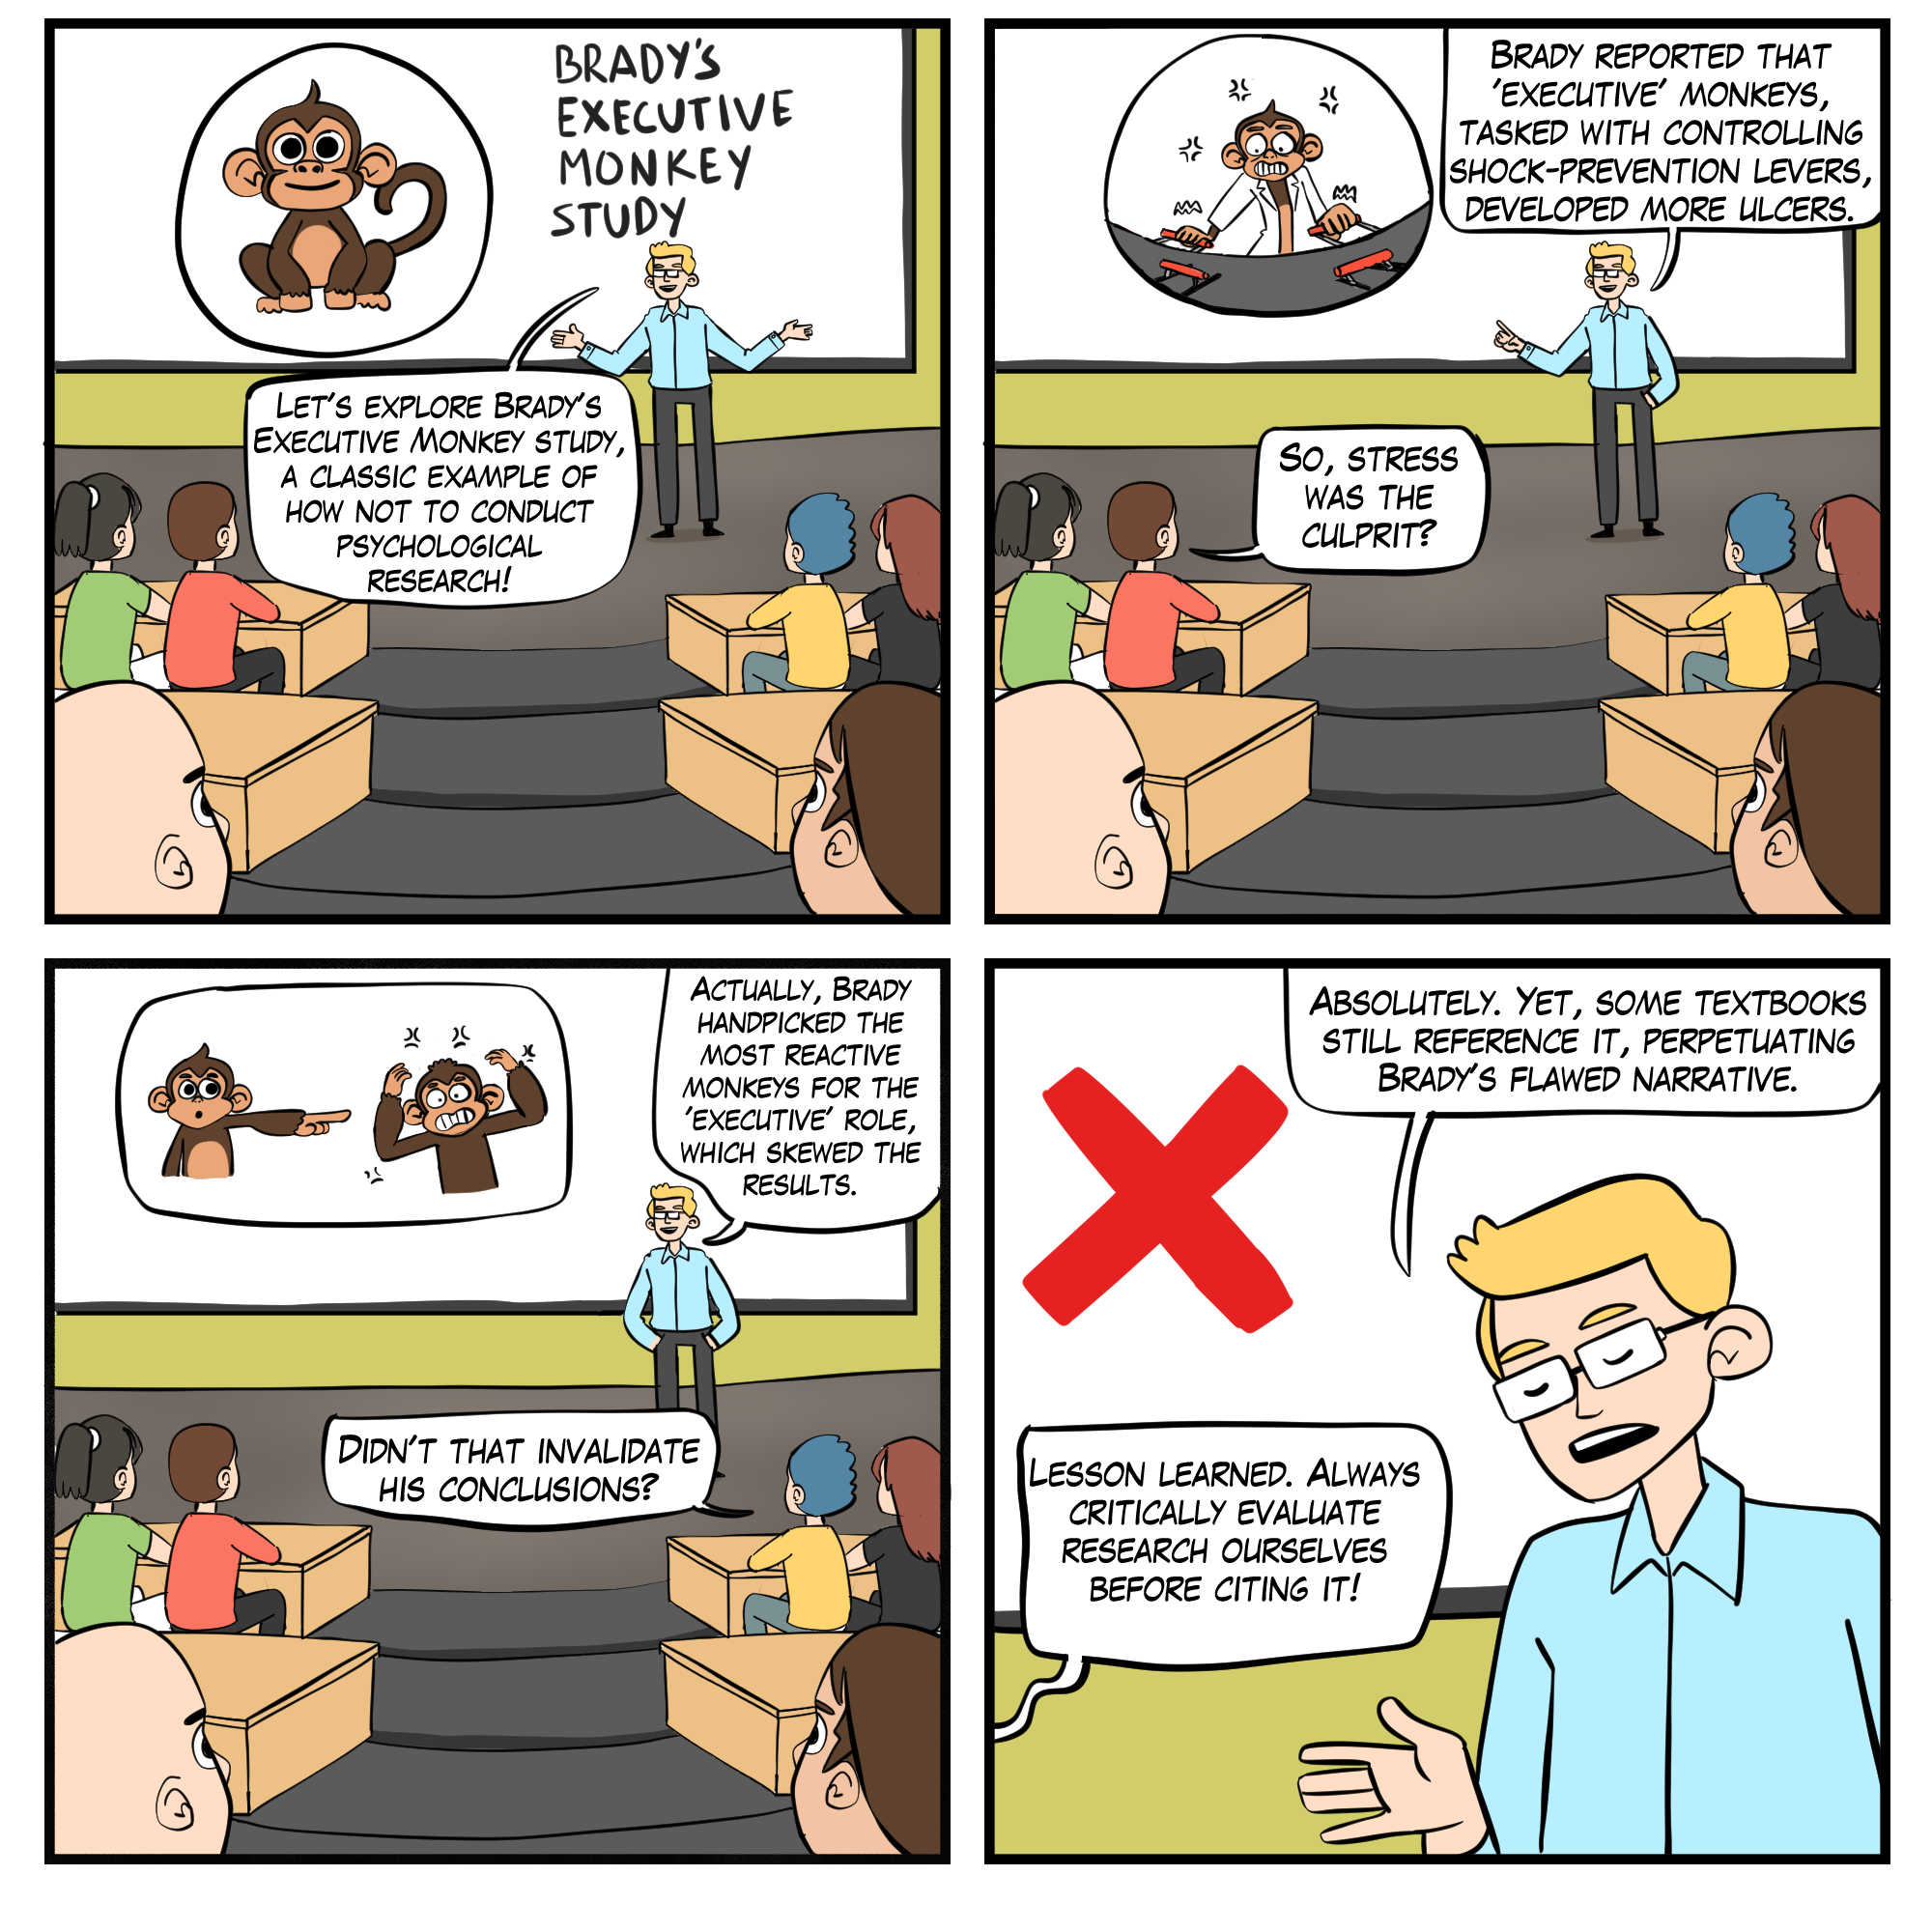
The Brady Study
Brady pre-tested primates on their speed when performing a shock
avoidance task and then assigned the faster learners to the executive
condition and the slower learners to the yoked control condition. The
executives could prevent a painful shock by pressing the control button at
least once every 20 seconds. Failure to do this caused both the executive
and yoked control participants to receive a shock. The controls had no control over
the delivery of the painful shock.
Brady reported that executives had many ulcers while the controls did
not. Was this due to the executive's greater responsibility for avoiding painful shocks? We can't answer this question based on Brady's data because he confounded this study through a biased assignment. We have no
reason to believe that the two groups had an equal risk of developing ulcers at the start of this study. Alternative explanations
are that the executives were more sensitive to shock than the controls or
were more ulcer prone. An internally valid redesign of the Brady study would pre-test the primates, match them on their speed of shock avoidance, and randomly assign them to the executive or yoked control conditions.
Weiss (1972) replicated the Brady
study using rats and randomly assigned them to executive and control
conditions. In contrast to Brady, he found that lack of control over
shock was more stressful than the responsibility for pushing a control button
to prevent shock. These findings are supported by organizational research that shows that executives experience lower rates of health problems like heart attacks and ulcers than their subordinates. The subordinates have less perceived control than management, which may contribute to less resilience.
There are three essential takeaways from Weiss' replication of the Brady study. First, lack of control–and not responsibility–can contribute to illness. Second, educators and textbook authors often do not evaluate the internal validity of studies they quote. Third, poorly designed research has a long half-life. While the Brady study was reported in 1958, textbooks in disciplines as diverse as Business and Health Psychology still recycle Brady's flawed conclusions.
Specific and Nonspecific Treatment Effects
Treatment effects can be specific and nonspecific. A
specific treatment effect is a
measurable symptom change associated with a measurable
psychophysiological change produced by biofeedback. For example, there
would be a specific treatment effect on airway resistance in a patient
diagnosed with asthma if decreased resistance were correlated with
increased heart rate variability (HRV).
A
nonspecific treatment effect is a
measurable symptom change not correlated with a specific
psychophysiological change. For example, researchers might report that HRV biofeedback training produced larger reductions in
state anxiety (situational anxiety) than Progressive Relaxation with the caveat that the HRV and state anxiety changes were not correlated. In this case, demand characteristics may have contributed to state anxiety reduction. Since effective biofeedback and accepted medical treatments produce specific
and nonspecific treatment effects, it is vital to control demand
characteristics in clinical outcome studies to ensure internal validity and understand the mechanisms of
action.
The Search for an Appropriate Control Condition
A
control group receives a zero level of the independent variable. While
placebos are easy to administer in pharmaceutical
research, researchers find that selecting an appropriate control group is challenging in
biofeedback research. Weak control conditions can stack the deck in favor of the experimental condition, defeating the purpose of an experiment. Graphic © Sashkin/ Shutterstock.com.
 No-biofeedback control groups
 include baseline only, waiting list, and relaxation conditions. Participants in a
baseline-only condition are only measured on the DVs and receive no treatment. Individuals assigned to a
waiting list are measured on the DVs with the expectation of later biofeedback training. participants in a
relaxation condition receive instructions like Autogenic phrases.
These three control strategies are not equivalent to the experimental condition because their demand characteristics are often weaker (e.g., none of these controls provide physiological feedback). Their activities are less engaging than biofeedback training.
Biofeedback control groups include noncontingent feedback, reverse contingent feedback, and contingent feedback of an unrelated response.
In
noncontingent feedback, participants receive false pre-programmed feedback that may be easy (e.g., heart rate) or hard (e.g., slow cortical potentials) to detect. Noncontingent feedback can be frustrating when participants perceive that feedback is inconsistent with internal cues and that they cannot learn to control the signal. Since noncontingent feedback is inherently deceptive, the researchers mustexplain this deception during debriefing.
Reverse contingent feedback reinforces physiological changes in the opposite direction as the experimental group (e.g., HRV down instead of HRV up).
Finally,
contingent feedback of an unrelated response reinforces physiological changes in a system that should not powerfully affect the DVs (e.g., skin conductance down versus HRV up).
Reverse contingent feedback and contingent feedback of an unrelated response can serve as effective control conditions as long as participants experience comparable engagement and training success. Reverse contingent feedback should not be used when the physiological changes could harm participants (e.g., HRV down).
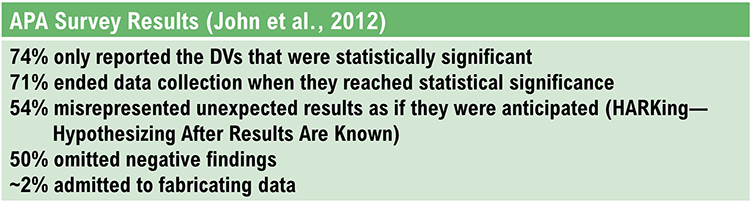
Questionable Research Practices
The frequent failure to replicate (reproduce) results from a flawed incentive system that reinforces questionable research practices (QRP; Larson, 2019).

Caption: Michael J. Larson, PhD
An anonymous survey (John et al., 2012) of 6000 American Psychological Association (APA) members is summarized below.
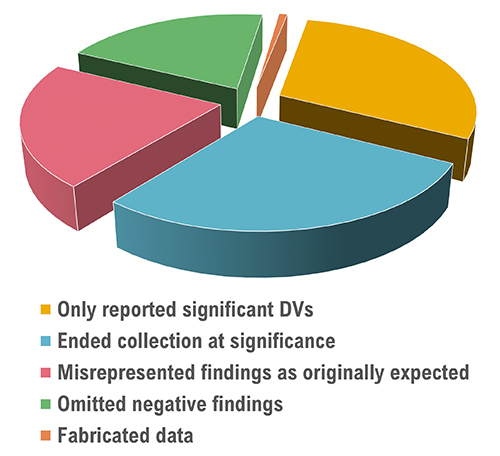
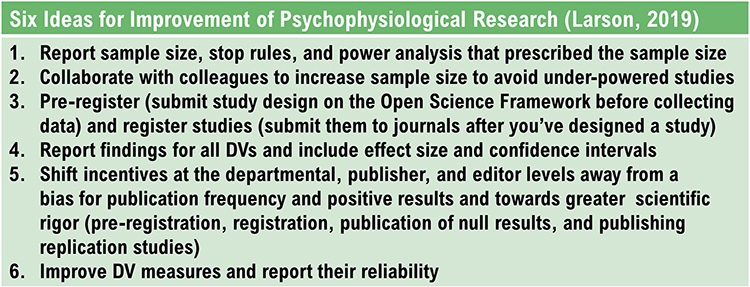
Larson (2019) proposed six steps to increase the integrity of psychophysiological research.
Case Study Designs
In
case studies, a researcher
compiles a descriptive study of a participant's experiences, observable
behaviors, and archival records kept by an outside observer (Myers & Hansen, 2012).
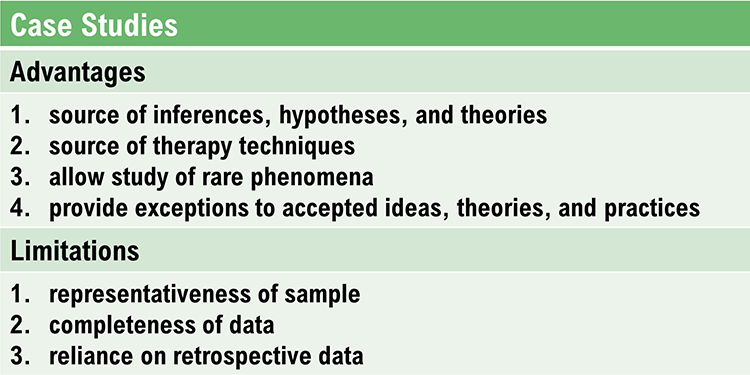
Case studies have several advantages and limitations.
In biofeedback research, a case study
is a record of patient experiences and behaviors compiled by a therapist and is nonexperimental. A therapist
documents change
in patient symptoms across the phases of treatment but cannot prove that
the change was due to biofeedback training.
A descriptive case study might use an
AB design,
where A is the baseline phase and B is the treatment phase.
Small N Designs
N represents the number of participants required for an experiment. Classic experiments
like Peniston and Kulkosky's (1990) alcoholism study utilized
large N designs
that compared the performance of groups of participants (those who received alpha-theta neurofeedback and those who
received conventional medical treatment).
A
small N design examines one or two participants.
A clinical psychologist could use a small
N design to test a treatment when there are insufficient
participants to conduct a large
N study and when they want to avoid the ethical problem of an
untreated control group. Animal researchers prefer small
N designs to minimize the acquisition and
maintenance cost, training time, and possible sacrifice of their animal participants.
Small
N designs have been most extensively used in operant conditioning research. B. F. Skinner
examined the continuous behavior of individual participants in preference to analyzing discrete measurements from
separate groups of participants.
Small
N researchers often use variations of the
ABA reversal design to participate in all treatment conditions. A participant is observed in a control condition (A), treatment condition (B), and then returns to the control condition. The requirement for this design
is that the treatment is reversible.
In both large and small
N designs,
baselines are control conditions that
allow us to measure behavior without the influence of the independent variable.
Removing the independent variable and returning to baseline are crucial in ruling out confounding.
The return to baseline, which may
be repeated several times, is needed to rule out the effects of extraneous variables like history and maturation
threats.
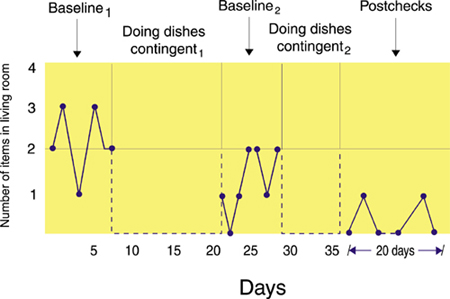
An ABABA design is illustrated below.
Baseline1 measured the number
of items of clothing the husband leaves in the living room.
Doing dishes
contingent1 penalized the husband with dishwashing when he left
more clothes in the
living room than his wife.
Baseline2
measured the number of clothes the husband left in the living
room without penalty.
Doing dishes
contingent2 penalized the husband with
dishwashing when he left more clothes in the
living room than his wife.
Post-checks measured the dependent
variable after completion of training to assess the maintenance of behavior change, which was picking up
clothing. John Balven adapted the illustration below from Myers and Hansen (2012).
Many clinical reversal studies do not return to a final baseline because it would be unethical to risk patient
relapse after treatment appeared to improve behavior.
When a reversal study does not end with a baseline condition, we can't rule out the possibility that an extraneous variable caused the patient's clinical improvement.
A
multiple baseline design overcomes the ethical problem of withdrawing an effective treatment by never
withdrawing a treatment. Instead, this approach uses baselines of different lengths to measure the same behavior at different times or locations, or other behaviors.
Descriptive and Inferential Statistics
Descriptive statistics report the attributes of a sample of scores. Measures of central tendency and variability are two important families of descriptive
statistics (Myers & Hansen, 2012).
Measures of Central Tendency
Measures of central tendency are descriptive statistics that describe the typical score within a sample. Three measures of central tendency are the mean, median, and mode.
Their relative position depends on a distribution's symmetry. The mean is lower than the median and mode when a distribution is skewed to the left. The mean is higher than its counterparts when a distribution is skewed to the right. Graphic © Iamnee/iStockphoto.com.
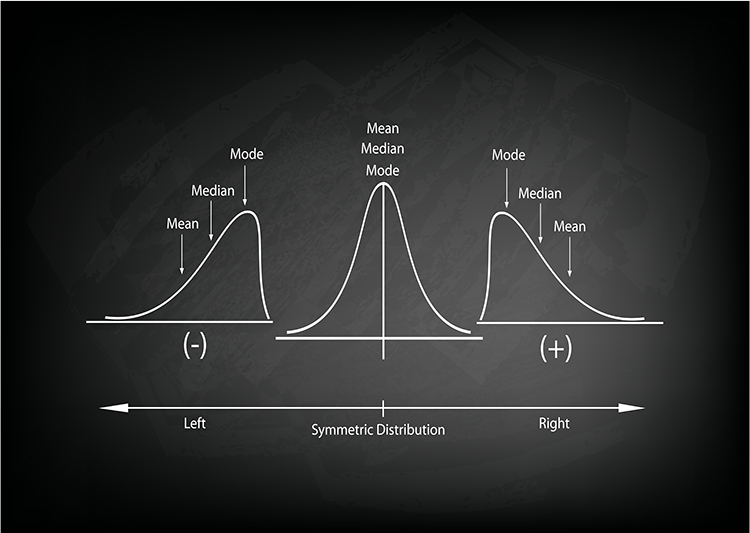
The
mean is the arithmetic average and the most commonly reported measure of central tendency.
The mean's principal limitation is its vulnerability to outliers (extreme scores).
The
median divides the sample distribution in half. The median is the middle score or the average of two middle scores. Since the median is unaffected by outliers, statisticians prefer it to the mean when extreme scores are present.
The
mode is the most frequent score calculated when there are at least two different sample values. There may be no mode or multiple modes.
Measures of Variability
Statistical measures of variability like the range, standard deviation, and the variance index the dispersion in our data. There is no variability [all of these measures are 0] when all sample scores are identical.
The
range is the
difference between the lowest and highest values (or this difference minus 1). For example, for 5, 10, 20, and 25, the range is 20. Since the range is calculated using only two scores in a series, it can be influenced by outliers and cannot show whether data are evenly distributed or clumped together.
The
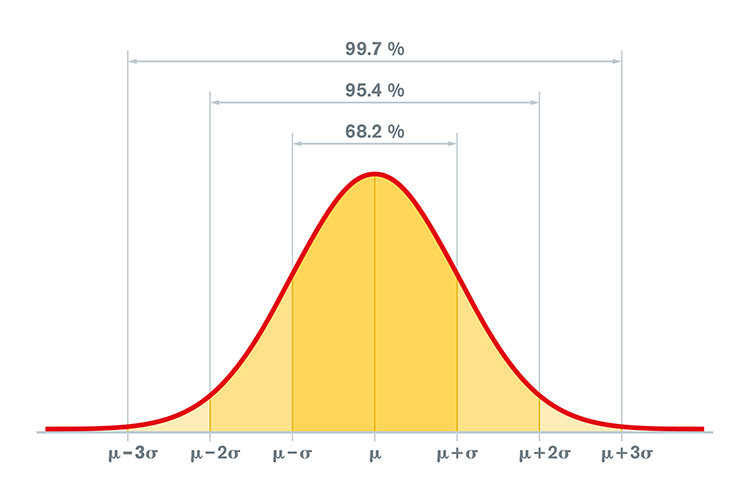
standard deviation is the square root of the average squared deviations from the mean. For example, for 2, 4, 4, 4, 5, 5, 7, and 9, the standard deviation is the square root of 4, which is 2. When the standard deviation is low, the data points cluster more closely about the mean. When it is high, scores are distributed farther from the mean. The standard deviation better characterizes the dispersion of scores than the range since it uses all of the data points and is not distorted by outliers.
When values are normally distributed, the percentage of scores within 1, 2, and 3 standard deviations from the mean are 68%, 95%, and 99.7%, respectively.
Graphic © Peter Hermes Furian/iStockphoto.com.
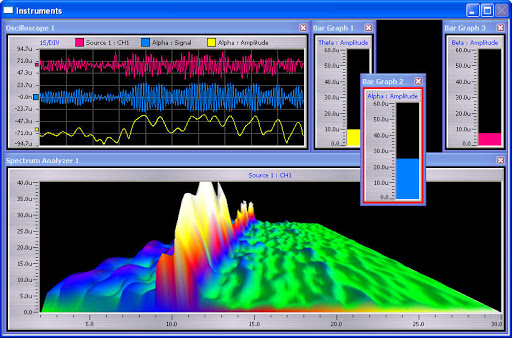
Clinicians use the standard deviation to determine whether physiological measurements or psychological test scores differ significantly from the standardization sample mean. In neurofeedback,
z-score training protocols attempt to reduce the discrepancy in real-time between instantaneous EEG values and values within a normative database. Graphic retrieved from breakthroughpsychologyprogram.com.
Check out the YouTube video
What Is The Standard Deviation?
The
variance is the
average squared deviation of scores from their mean and is the square of the standard deviation. For example, for 2, 4, 4, 4, 5, 5, 7, and 9, the variance is 4. A disadvantage of the variance compared with the standard deviation is that it is reported in squared units.
Inferential Statistics Allow Researchers to Test Hypotheses
Hypotheses are predictions of the relationship between the IV and DV.
Inferential statistics like the
F-test and
t-test allow researchers to test the
null hypothesis, the prediction that IV did not affect the DV.
When the difference between the experimental and control conditions scores is greater than what we should expect from normal variability in the population, we reject the null hypothesis because our findings are
statistically significant (probably not due to chance).
Statistical significance is the lowest bar in inferential statistics because it only means a rare event has occurred. Christopher Zerr (2021) likens a significant outcome to a sighting of a Black Swan since these are uncommon. Graphic © Andreas Prott/Shutterstock.com.

Statistical significance does not reveal the magnitude of the treatment effect, called its effect size. Following Christopher's analogy, statistical significance doesn't convey whether the Black Swan is lilliputian or mammoth. Effect size is a higher bar because large effect sizes are more likely to be replicated and produce important clinical or performance outcomes. Graphic redrawn by minaanandag onn Fiverr.com.

Meta-Analysis
A
meta-analysis is a statistical analysis of
related studies. A meta-analysis utilizes statistical procedures to combine and quantify data from many
experiments that employ the same operational definitions for their independent and dependent variables to calculate a
typical effect size (Bordens & Abbott, 2022).
Check out the YouTube video
Introduction to Meta-analysis.
Effect size indexes the magnitude of an IV's effect on the DV. Researchers measure effect size using percentage and standard deviation approaches. The percentage method calculates the percentage of variability in the DV that the IV can predict. Statistics like r
2 and eta
2 estimate the strength of association between the IV and DV. Possible values range from 0-1.0. A small r
2 = 0.01, medium = 0.09, and large ≥ 0.5. An r
2 of 0.5 means that the IV accounted for 50% of the variability in the DV.
Graphic © Jacek Fulawka/Shutterstock.com.

The standard deviation approach estimates the degree of change in the DV in standard deviation units. For example, Cohen's
d calculates the effect size for both
t- and
F-tests. A small effect = 0.2, medium = 0.5, and large = 0.8.
A meta-analysis may overstate or understate treatment efficacy depending on the representativeness of the studies
they select. Treatments may appear more effective than in real-world practice when a meta-analysis
excludes unpublished studies that did not achieve statistically significant results. This is called the
file drawer effect. Conversely, treatments may
appear less effective than when a meta-analysis includes studies by inexperienced clinicians and those
who utilized inadequate training protocols (e.g., did not train until a criterion was reached).
The Clinical Efficacy of Established Medical Practices
Prasad et al. (2013) examined 363 studies of an accepted drug or medical procedure published in
The New England Journal of Medicine from 2001 to 2010. More than 40% were ineffective or harmful, 38% were beneficial, and 22% had uncertain value.
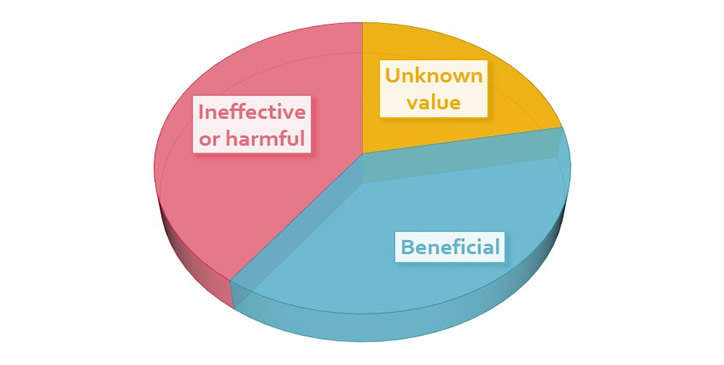
Examples of ineffective or harmful practices included hormone replacement therapy in postmenopausal women and aggressive blood sugar reduction in Type 2 diabetics treated in intensive care, which increased mortality rates.
The authors observed: “Nevertheless, the reversals we have identified at the very least call these practices into question. Some practices ought to be abandoned, whereas others warrant retesting in more powerful investigations. One of the greatest virtues of medical research is our continual quest to reassess it.” (p. 796)
Criteria for Clinical Efficacy
The following guidelines for evaluating the clinical efficacy of biofeedback and neurofeedback interventions were
recommended by a joint Task Force and adopted by the Boards of Directors of the Association for Applied
Psychophysiology (AAPB) and the International Society for Neuronal Regulation (ISNR) (LaVaque et al., 2002). These criteria served as the basis for efficacy
ratings in
Evidence-Based Practice in Biofeedback and Neurofeedback 4th ed.).
 Level 1: Not empirically supported
Supported only by anecdotal reports and/or case studies in non-peer-reviewed venues.
Level 2: Possibly efficacious
At least one study of sufficient statistical power with well-identified outcome measures but lacking
randomized assignment to a control condition internal to the study.
Level 3: Probably efficacious
Multiple observational studies, clinical studies, wait-list controlled studies, and within-participant and
intraparticipant replication studies that demonstrate efficacy.
Level 4: Efficacious
a. In comparison with a no-treatment control group, alternative treatment
group, or sham (placebo) control utilizing randomized assignment, the
investigational treatment is shown to be statistically significantly superior
to the control condition or the investigational treatment is equivalent to a
treatment of established efficacy in a study with sufficient power to
detect moderate differences, and
b. The studies have been conducted with a population treated for a specific
problem, for whom inclusion criteria are delineated in a reliable,
operationally defined manner, and
c. The study used valid and clearly specified outcome measures related to
the problem being treated, and
d. The data are participanted to appropriate data analysis, and
e. The diagnostic and treatment variables and procedures are clearly
defined in a manner that permits replication of the study by independent
researchers, and
f. The superiority or equivalence of the investigational treatment has been
shown in at least two independent research settings.
Level 5: Efficacious and specific
The investigational treatment is statistically superior to credible sham therapy, pill, or
alternative bona fide treatment in at least two independent research settings.

Glossary
ABA reversal design: a small
N design where a baseline is followed by treatment and then a return to baseline.
assignment threat: a classic threat to internal validity in which individual
differences are not balanced across treatment conditions by the assignment procedure.
assignment-interaction threat: the combination of a selection threat with at least
one other threat (history, maturation, testing, instrumentation, statistical regression, or mortality).
balancing: a method of controlling a physical variable by distributing its
effects across all treatment conditions (running half of each condition's participants in the morning and half in the
evening).
baseline: a control condition in which participants receive a zero level of the
independent variable (sitting quietly without receiving feedback about physiological performance).
baseline-only control condition: participants sit quietly without receiving feedback about their physiological performance.
bidirectional causation: a reason that correlation does not imply causation.
Each of two variables could influence the other.
case study: a nonexperimental descriptive study of a participant’s
experiences, observable behaviors, and archival records kept by an outside observer.
confounding: the loss of internal validity when an extraneous variable
systematically changes across the experimental conditions.
constancy of conditions: controlling a physical variable by keeping
it constant across all treatment conditions (running all participants in the evening).
contingent feedback: feedback of a participant's actual physiological
performance.
control group: in an experiment, a group that receives a receives a zero-level
of the independent variable (placebo or wait-list).
correlational study: a nonexperimental procedure in which the researcher does
not manipulate an independent variable and only records data concerning traits or behaviors (investigating the
relationship between body mass index and severity of low back pain).
demand characteristics: situational cues (like placing EEG sensors on a client's forehead) that signal expected behavior (increased attention).
dependent variable (DV): the outcome measure the experimenter uses to assess
the change in behavior produced by the independent variable (airway resistance could be used to measure the
effectiveness of HRV training for asthma).
detectable noncontingent feedback: noncontingent feedback that a participant
can detect as false when the display fails to mirror voluntary behavior like muscle bracing.
double-blind crossover experiment: an experimental approach using a double-blind
design where participants start with one treatment and conclude with an alternative treatment (controls demand
characteristics, experimenter bias, and individual differences).
double-blind experiment: the experimenter and participant do not know the
condition to which the participant has been assigned to control both demand characteristics and experimenter bias.
effect size: the magnitude of an IV's effect on the DV.
elimination: a method of controlling a physical variable by removing it
(soundproofing a room).
ex post facto study: quasi-experimental design in which a researcher compares participants on pre-existing characteristics.
experimenter bias: confounding that occurs when the researcher knows the
participants' treatment condition and acts in a manner that confirms the experimental hypothesis.
extraneous variable (EV): variable not controlled by the experimenter (room
temperature).
file drawer effect: excluding unpublished studies that did not obtain significant treatment effects from a meta-analysis or systematic review.
history threat: a classic threat to internal validity that occurs when an event
outside the experiment threatens internal validity by changing the DV.
independent variable (IV): the variable (antecedent condition) an experimenter
intentionally manipulates (HRV or SEMG biofeedback).
instrumentation threat: a classic threat to internal validity in which changes
in the measurement instrument or measurement procedure threaten internal validity.
internal validity: the degree to which the experiment can demonstrate that
changes in the dependent variable across treatment conditions are due to the independent variable.
large N designs: studies that examine the performance of groups of
participants.
level 1: not empirically supported.
level 2: possibly efficacious.
level 3: probably efficacious.
level 4: efficacious.
level 5: efficacious and specific.
maturation threat: a classic threat to internal validity that occurs when
physical or psychological changes in participants threaten internal validity by changing the dependent variable.
mean: the arithmetic average and the most commonly reported measure of central tendency.
measures of central tendency: descriptive statistics (mean, median, and mode) that describe the typical score within a sample.
measures of variability: descriptive statistics (range, standard deviation, and variance) that describe the dispersion of scores within a sample and allow us to compare different samples.
median: the score that divides a sample distribution in half. It is the middle score or the average of two middle scores.
meta-analysis: a statistical analysis that combines and quantifies data from
many experiments that use the same operational definitions for their independent and dependent variables to
calculate an average effect size.
mode: the most frequent score calculated when there are at least two different sample values.
mortality threat: a classic threat to internal validity that occurs when
participants drop out of experimental conditions at different rates.
N: the number of participants.
No-biofeedback control group: a control condition in which participants do not receive physiological feedback.
nonspecific treatment effect: a measurable symptom change that is not correlated with a specific psychophysiological change.
observational studies: nonexperimental procedures like naturalistic
observation and correlational studies.
Pearson r: a statistical procedure that calculates the strength of the
relationship (from -1.0 to +1.0) between pairs of variables measured using interval or ratio scales.
personality variables: personal aspects of participants or experimenters like
anxiety or warmth.
physical variables: the properties of the physical environment like time of day,
room size, or noise.
placebo response: an associatively-conditioned homeostatic response.
pre-test/post-test design: researchers measure participants on the DV at least twice, before and after administering training.
pre-registration: submitting a study on the Open Science Framework before data collection.
random sample: a subset of a target population selected using an unbiased method so that every member of the population has an equal chance to be chosen.
randomized controlled trial (RCT): researchers manipulate an independent variable
and randomly assign participants to conditions, with or without prior matching on participant variables.
range: the
difference between the lowest and highest values.
registration: submitting a study design to a journal before data collection for Stage 1 and Stage 2 peer review.
relaxation control condition: participants receive a non-biofeedback relaxation procedure.
reverse contingent feedback: feedback that trains participants to produce
changes that are the reverse of those shaped by a clinical protocol (beta decrease and theta increase in children diagnosed with ADHD).
sample: a selected subset of a target population.
selection interactions: the combination of a selection threat with at least
one other threat (history, maturation, testing, instrumentation, statistical regression, or participant
mortality).
single-blind experiment: participants are not told their treatment condition.
small N designs: studies involving one or two participants.
social variables: aspects of the relationships between researchers and
participants like demand characteristics and experimental bias.
specific treatment effect: a measurable symptom change associated with a
measurable psychophysiological change produced by biofeedback.
standard deviation: the square root of the average squared deviations from the mean.
statistical regression threat: a classic threat to internal validity that occurs
when participants are assigned to conditions on using extreme scores, the measurement procedure is not
wholly reliable, and participants are retested using the same method to show change on the DV. The scores of
both extreme groups tend to regress to the mean on the second measurement so that high scorers are lower and low
scorers are higher on the second testing.
testing threat: a classic threat to internal validity that occurs when prior
exposure to a measurement procedure affects performance on this measure during the experiment.
third variable problem: a reason that correlation does not mean causation. A
hidden variable may affect both correlated variables. For example, alcohol abuse could both disrupt sleep and
increase depression.
variance: the
average squared deviation of scores from their mean.
wait-list control group: participants are measured like the experimental group(s) but are placed on a waiting list for an experimental treatment.
z-score training: a neurofeedback protocol that reinforces in real-time closer approximations of client EEG values to those in a normative database.
Test Yourself
Customers enrolled on the
ClassMarker platform should click on its logo to take 10-question tests over this unit (no exam password).

REVIEW FLASHCARDS ON QUIZLET
Click on the Quizlet logo to review our chapter flashcards.

Visit the BioSource Software Website
BioSource Software offers
Physiological Psychology, which satisfies BCIA's Physiological Psychology requirement, and
Neurofeedback100, which provides extensive multiple-choice testing over the Biofeedback Blueprint.

Assignment
Now that you have completed this unit, consider how you could use the case study approach in your clinical
practice to assess treatment efficacy?
References
Brady, J. V. (1958).
Ulcers in "executive" monkeys.
Scientific American, 199(4), 95-100. https://psycnet.apa.org/doi/10.1038/scientificamerican1058-95
Campbell, D. T. (1957).
Factors relevant to the validity of experiments in social settings.
Psychological
Bulletin, 54, 297-312. https://psycnet.apa.org/doi/10.1037/h0040950
Campbell, D. T., & Stanley, J. T. (1966).
Experimental and quasi-experimental designs for research.
Rand McNally.
Hersen, M., & Barlow, D. H. (1976).
Single case experimental designs. Pergamon Press.
Ivry, R. B., & Lebby, P. C. (1993). Hemispheric differences in auditory perception are similar to those
found in visual perception.
Psychological Sciences, 4(1), 41-45.
LaVaque, T. J., Hammond, D. C., Trudeau, D., Monastra, V., Perry, J., Lehrer, P., Matheson, D., & Sherman, R.
(2002).
Template for developing guidelines for the evaluation of the clinical efficacy of psychophysiological evaluations.
Applied Psychophysiology and Biofeedback, 27(4), 273-281. https://dx.doi.org/10.1023/A:1021061318355
Myers, A., & Hansen, C. (2012).
Experimental psychology (7th ed.). Wadsworth.
Peniston, E. G., & Kulkosky, P. J. (1990). Alcoholic personality and alpha-theta brainwave training.
Medical
Psychotherapy, 3, 37-55.
Prasad, V., Vandross, A., Toomey, C., Cheung, M., Rho, J., Quinn, S., . . . Vifu, A. (2013).
A decade of reversal: An analysis of 146 contradicted medical practices.
Mayo Clinic Proceedings, 88(8), 790-798. https://dx.doi.org/10.1023/A:1021061318355
G. Tan, F. Shaffer, R. R. Lyle, & I. Teo (Eds.).
Evidence-based practice in biofeedback and neurofeedback (3rd ed.). Association for Applied Psychophysiology and Biofeedback.
Weiss, J. M. (1972).
Psychological factors in stress and disease.
Scientific American, 226(6),
104-113. https://doi.org/10.1038/scientificamerican0672-104
Wickramasekera, I. A. (1988).
Clinical behavioral medicine: Some concepts
and procedures. Plenum Press.
Wickramasekera, I. A. (1999).
How does biofeedback reduce clinical symptoms and do memories and beliefs have biological consequences? Toward
a model of mind-body healing.
Applied Psychophysiology and Biofeedback,
24(2), 91-105. https://doi.org/10.1023/a:1022201710323
Yaremko, R. M., Harari, H., Harrison, R. C., & Lynn, E. (1982).
Reference handbook of research and statistical methods in psychology: For
students and professionals. Harper & Row, Publishers, Inc.
Yucha, C. B., Clark, L., Smith, M., Uris, P., Lafleur, B., & Duval, S. (2001).
The effect of biofeedback in hypertension.
Applied Nursing Research, 14(1), 29-35. https://doi.org/10.1053/apnr.2001.21078
Yucha, C. B., & Montgomery, D. (2008).
Evidence-based practice in biofeedback and neurofeedback (2nd
ed.). Association for Applied Psychophysiology and Biofeedback.