Psychopharmacology
What You Will Learn in This Chapter
This chapter explores how psychoactive drugs interact with neurotransmitter systems and why this knowledge is essential for neurofeedback practitioners. You will learn how drugs modulate receptor activity through agonist and antagonist mechanisms, how drug half-lives shape your interpretation of EEG and qEEG data, and how major drug classes—from antidepressants and antipsychotics to recreational substances—alter EEG measurements and clinical presentation.
You will also discover recommended medication management approaches and learn why you should never train against a drug's principal effects on the EEG. By the end of this chapter, you will be better prepared to account for pharmacological influences when assessing and training your clients.
BCIA Blueprint Coverage: This unit addresses V. Psychopharmacological Considerations.
Psychopharmacology is the study of how drugs affect the brain and behavior (Julien et al., 2023). This field is directly relevant to biofeedback and neurofeedback because every psychoactive substance a client takes can alter their clinical presentation, EEG patterns, assessment results, and training outcomes. Whether you work in a VA hospital, a sports performance center, or a community clinic, understanding drug–brain interactions will sharpen your clinical decision-making.
A single dose of a prescription psychotropic drug can noticeably change the EEG within 1–3 hours. Families of psychotropic drugs that are therapeutically equivalent in the sense used here—that is, they produce comparable clinical effects despite different chemical structures—tend to generate similar EEG changes (Knott, 2000). Note that in regulatory usage therapeutic equivalence has a narrower meaning: two products containing the same active ingredient that can be substituted for one another. A drug's plasma level, which depends on dose, distribution volume, and metabolism, governs how large these EEG alterations become. The resulting changes should be symmetrical across both hemispheres and are often widespread.
Common EEG changes include slowing of background activity, increased beta activity, epileptiform activity, triphasic waves, and widespread delta and increased theta activity (Blume, 2006). Recognizing these patterns is a prerequisite for accurate assessment, because they can mimic or mask the very brain signatures you are trying to train.
BCIA Blueprint Coverage
This unit addresses V. Psychopharmacological Considerations.

This unit covers Relationships of Drugs and Neurotransmitter Modulation, Potential Effects of Prescribed and Non-Prescribed Drugs on Clinical Presentation, Potential Effects of Prescribed and Non-Prescribed Drugs on EEG Measures, Potential Effects of Different Drugs on Neurofeedback Assessment and Training, Recommended Medication Management Approaches, and Drug Implications for Assessment and Neurofeedback.
Relationships of Drugs and Neurotransmitter Modulation
This section introduces how neurons communicate through neurotransmitters, how drugs exploit these same pathways, and the core principles of drug–receptor interaction that govern both therapeutic and side effects. Understanding these mechanisms will help you anticipate how a client's medication regimen may influence their EEG and clinical presentation.
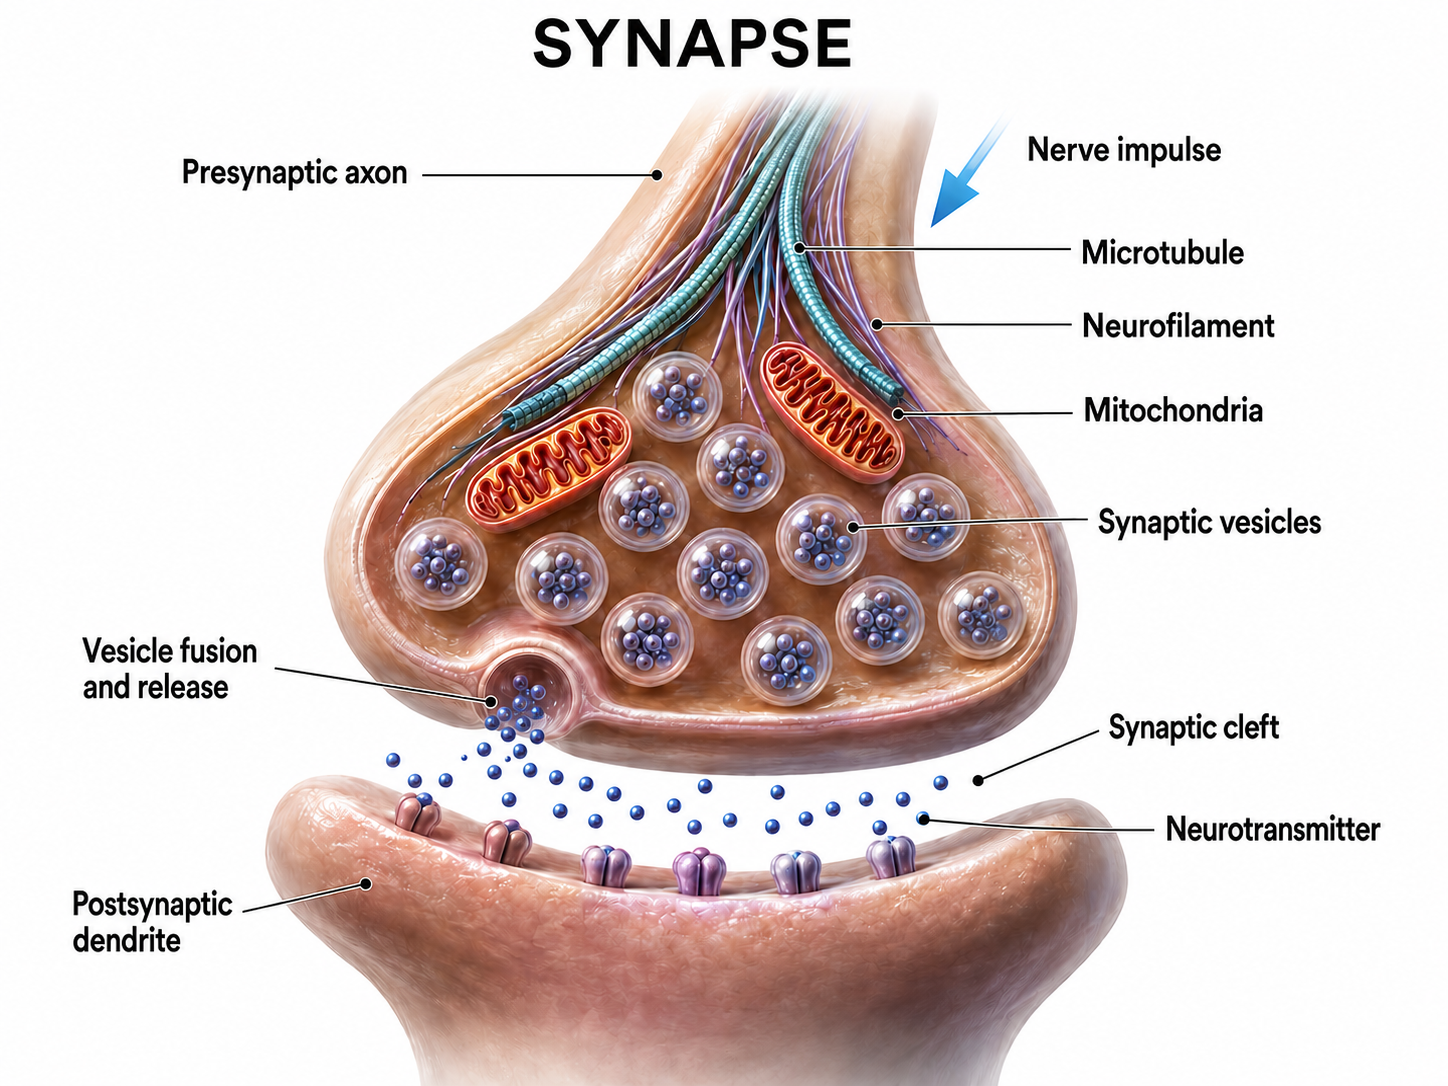
Neurons synthesize chemicals called neurotransmitters (NTs)—molecular messengers that cross the synaptic cleft and bind to receptors on neighboring neurons to alter their activity. This signaling process underlies everything from mood regulation to motor control.
Drugs are molecules that modify physiological processes. Psychoactive drugs are a subset of drugs that alter brain functions to influence mood (e.g., anxiety) and behavior (e.g., attention). Psychopharmacology studies these drug effects on our nervous system, psychological states, and behavior (Julien et al., 2023).
Both NTs and drugs are examples of ligands—molecules that form chemical bonds with receptors. The study of how these drug–receptor interactions affect the body is called pharmacodynamics. Thinking of a receptor as a lock and a ligand as a key can help clarify this relationship: the key's shape (the drug's molecular structure) determines which locks (receptors) it can open and how effectively.
Drug-Receptor Interactions: A Basic Principle
A foundational principle of pharmacology holds that the physiological and behavioral effects of any drug result from its interactions with receptors (Julien et al., 2023, p. 59). In practical terms, this means that if you know which receptors a drug targets, you can predict its likely effects on EEG and behavior. Two key properties govern this interaction.
Specificity refers to the degree to which a drug binds exclusively to a given receptor type, while affinity describes the strength of the bond between a drug and its receptor. Together, these properties determine a drug's selectivity and potency. High-affinity drugs produce stronger effects at lower doses, which has direct implications for how prominently they appear in your client's EEG.
NTs and psychoactive drugs exert both acute effects and chronic effects when they bind to receptors. Acute effects are the immediate changes produced by receptor binding, lasting from several milliseconds to hundreds of milliseconds (Julien et al., 2023). For example, selective serotonin reuptake inhibitors (SSRIs) immediately prolong serotonin availability within the synaptic cleft.
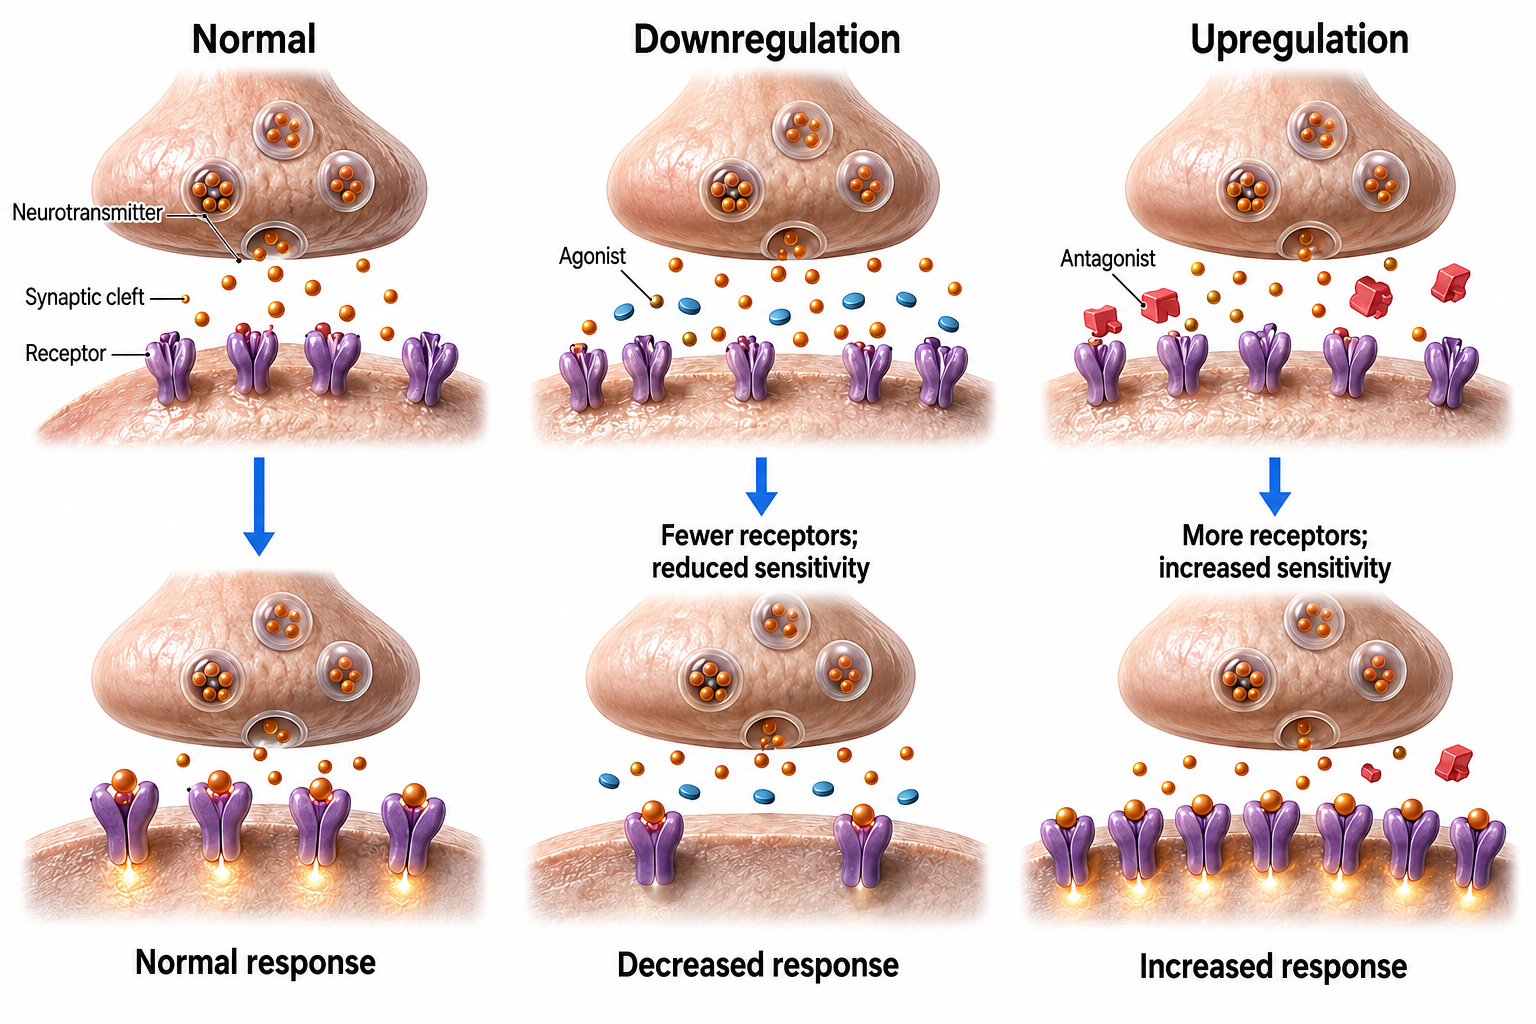
In contrast, chronic effects are long-term alterations in receptor populations and the functioning of neural networks. Months of SSRI treatment can reduce the number of serotonin receptors—a phenomenon called downregulation—which paradoxically helps improve mood and social engagement over time (Julien et al., 2023). This distinction between acute and chronic effects explains why antidepressants take weeks to produce full therapeutic benefit, even though they begin changing synaptic chemistry immediately.
Drugs Modulate NT Actions at Their Receptors
This section explains the two fundamental ways drugs interact with neurotransmitter systems—promotion and inhibition—and the diverse receptor types they target. These concepts are the building blocks for understanding every drug class discussed later in this chapter.
Psychoactive drugs cannot confer "superpowers" on receptors like Peter Parker's dramatic transformation after being bitten by a radioactive spider. Instead, drugs can only modulate—that is, promote or inhibit—a receptor's normal response to a NT. An agonist is any drug that promotes a NT's actions, while an antagonist is any drug that interferes with a NT's actions. We caution against limiting agonism to NT imitation and antagonism to receptor blockade, because drugs can promote or interfere with NT action in diverse ways.
Agonism and antagonism are best understood as a spectrum rather than an on-or-off switch, and this spectrum reappears throughout the chapter (Julien et al., 2023). A full agonist produces the maximum response a receptor can generate, as morphine does at the mu opioid receptor. A partial agonist binds the same receptor but produces a submaximal response no matter how high the dose, which is why the third-generation antipsychotic aripiprazole (Abilify) can either raise or lower dopamine signaling depending on how much dopamine is already present. A pure antagonist occupies the receptor without activating it, blocking the NT or any agonist that would otherwise bind. An inverse agonist goes a step further, binding the receptor and reducing its activity below the resting baseline. Keeping this spectrum in mind will help you interpret the pure agonists, partial agonists, and mixed agonist-antagonists you will meet in the opioid, antipsychotic, and antidepressant sections, because a drug's position on it shapes both its clinical effect and its EEG signature.
Drugs and NTs Target Extracellular Receptors
Extracellular binding sites, which are exposed to ligands (e.g., drug and NT molecules) in the synaptic cleft and extracellular fluid, are among the best-recognized drug targets. They include two major receptor families—ionotropic and metabotropic—each of which translates chemical signals into cellular responses through different mechanisms.
An ionotropic receptor is a receptor whose structure includes a central ion channel. When a NT binds, it alters the receptor's shape, opening the channel and allowing ions to flow across the membrane. This direct mechanism produces rapid effects—on the order of milliseconds—making ionotropic receptors central to fast synaptic transmission.
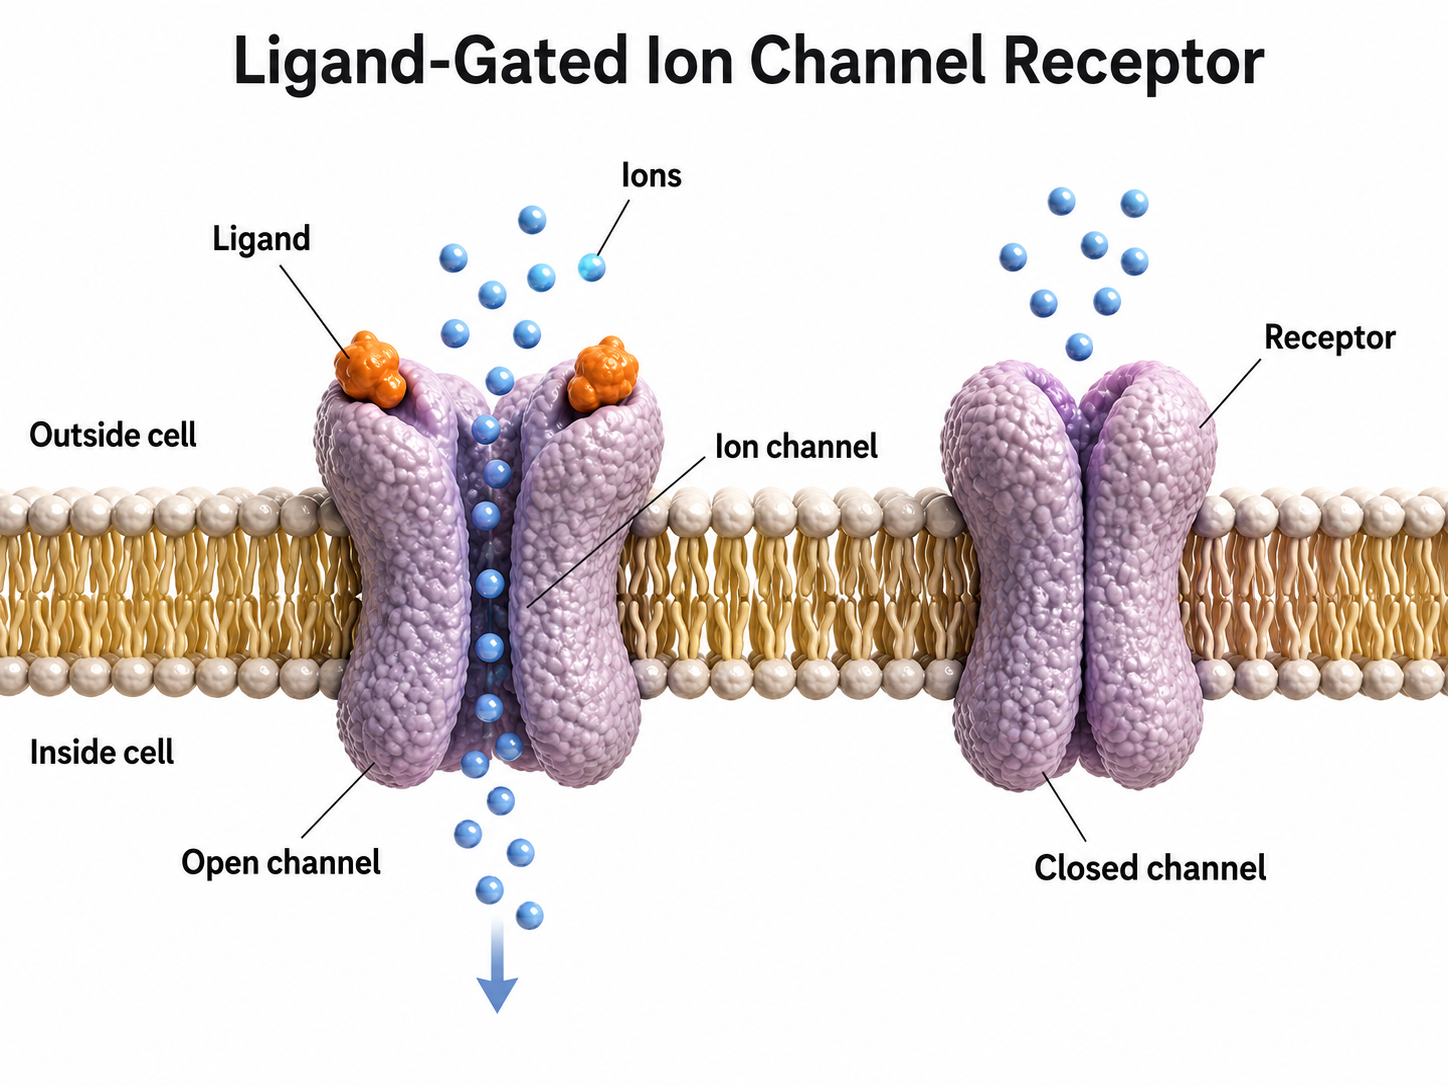
Consider the GABA-A receptor as a clinically important example. The site where the amino acid GABA binds is called its orthosteric site—the receptor's primary binding location. When GABA binds here, it triggers the inward movement of negative chloride ions, increasing neuronal inhibition.
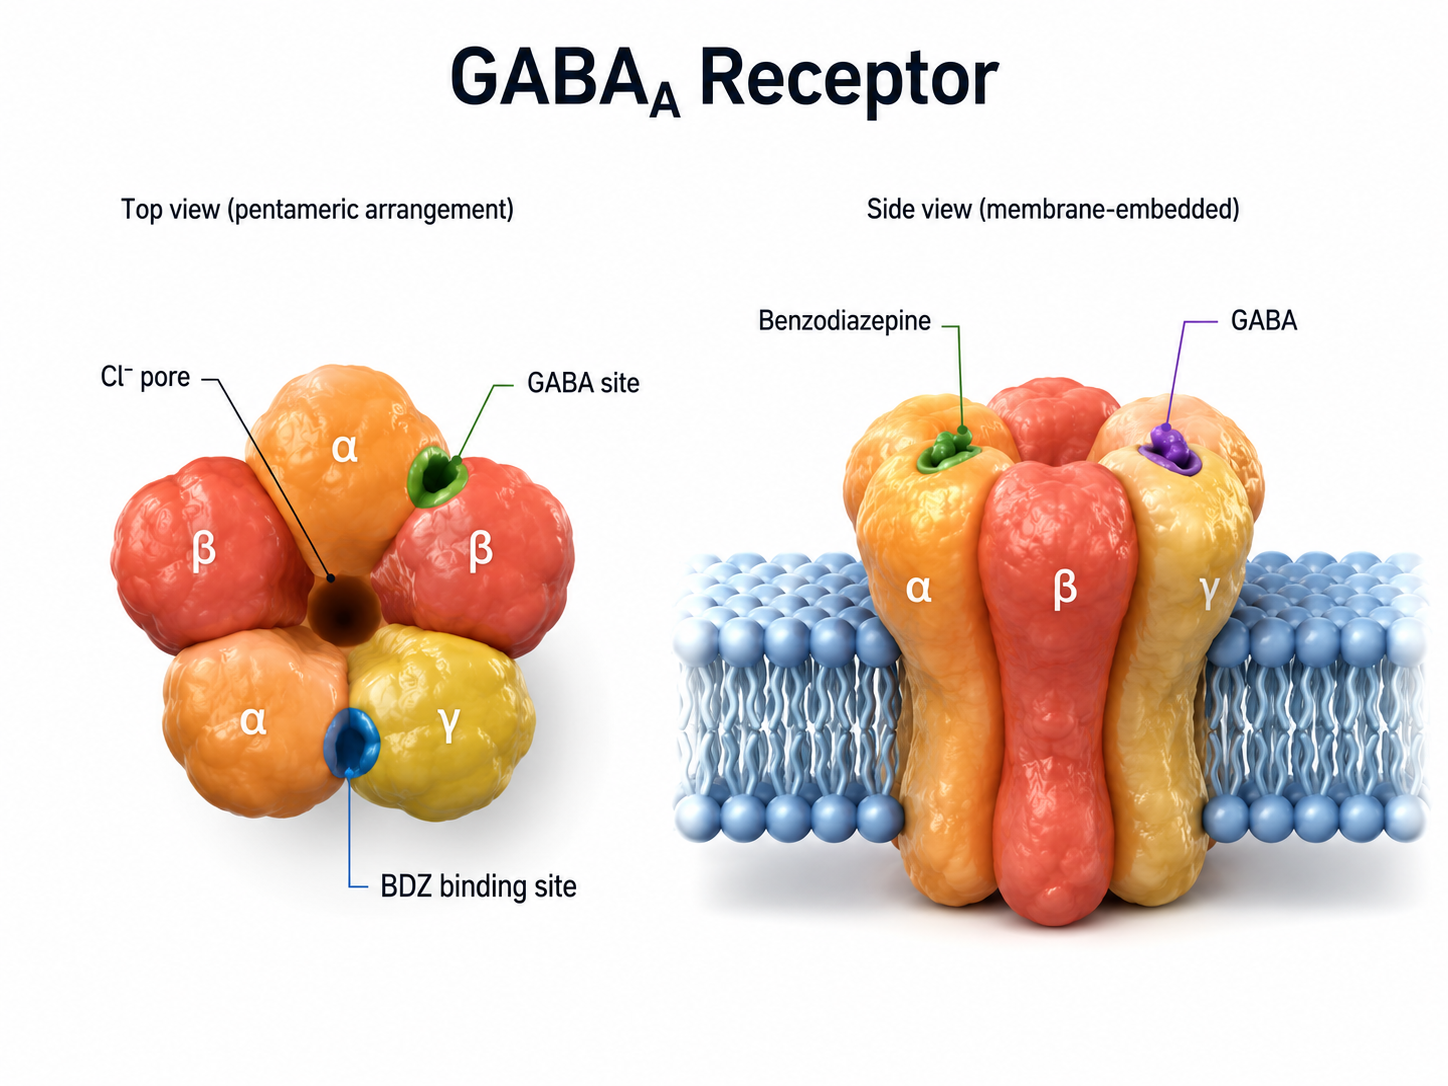
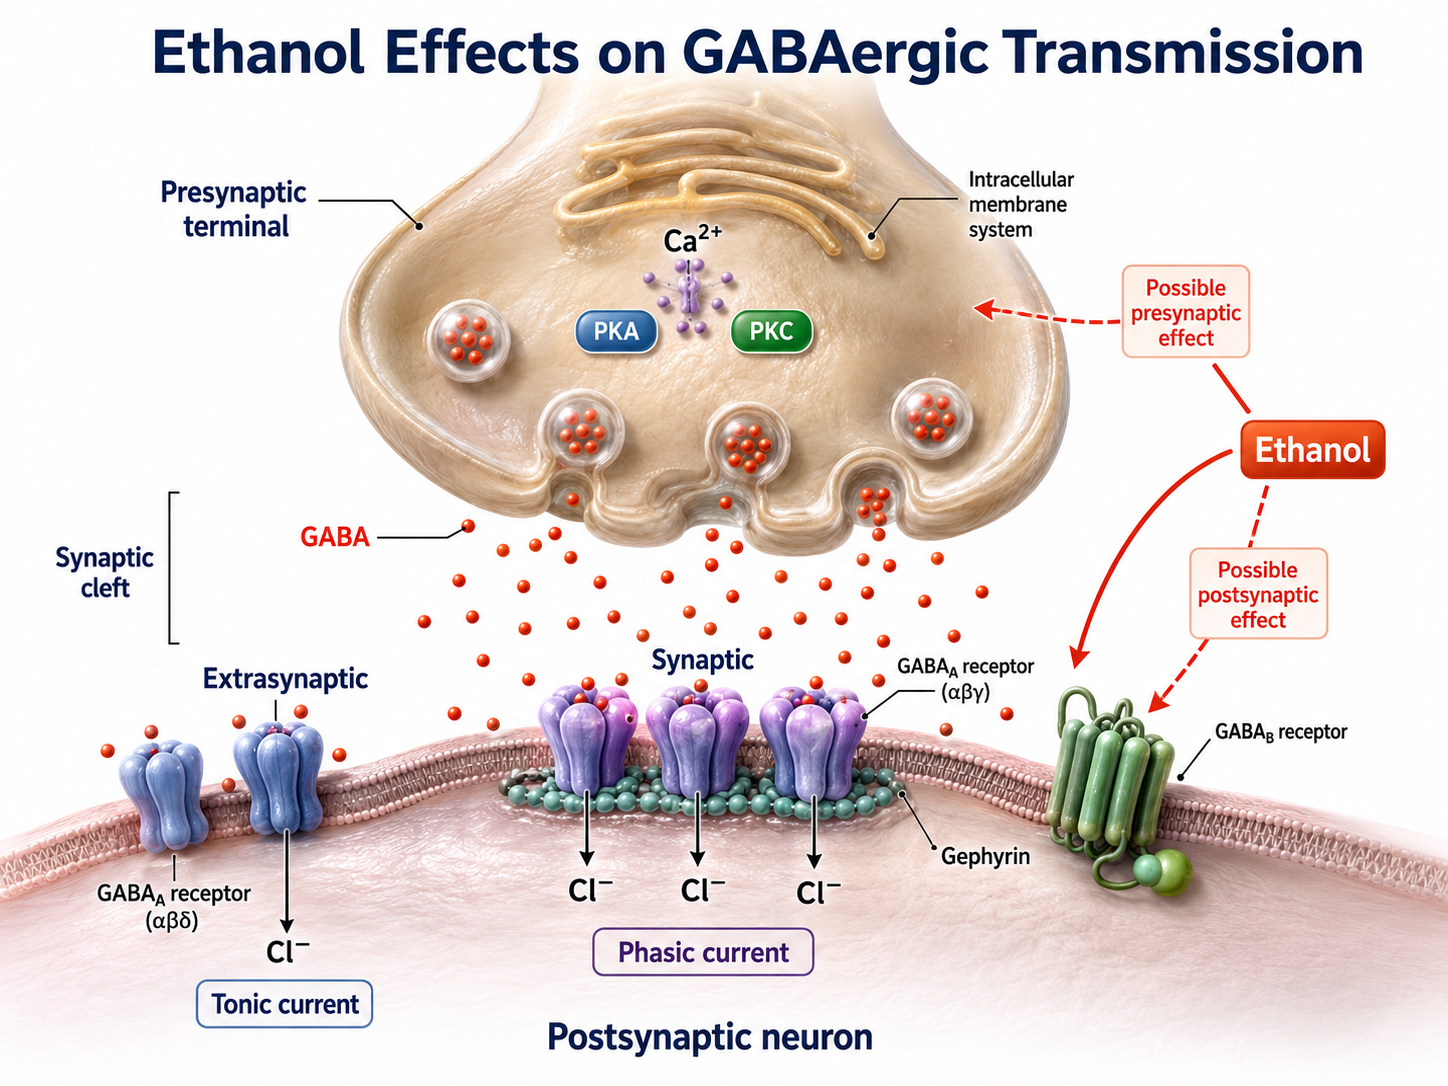
Drugs like ethanol do not bind at the orthosteric site. Instead, they occupy separate locations called allosteric sites—secondary binding locations on the receptor that modulate the primary response. Ethanol potentiates GABA's inhibitory action, increasing chloride ion entry and neuronal inhibition, although whether it does so by binding a discrete allosteric site or by an indirect route remains unsettled (Förstera et al., 2016). In the broad sense used above, ethanol acts as a GABA agonist; the precise term for this kind of action is a positive allosteric modulator, which helps explain the sedation and motor impairment associated with alcohol use. However, chronic alcohol consumption can alter dopamine release (Melchior & Jones, 2017).
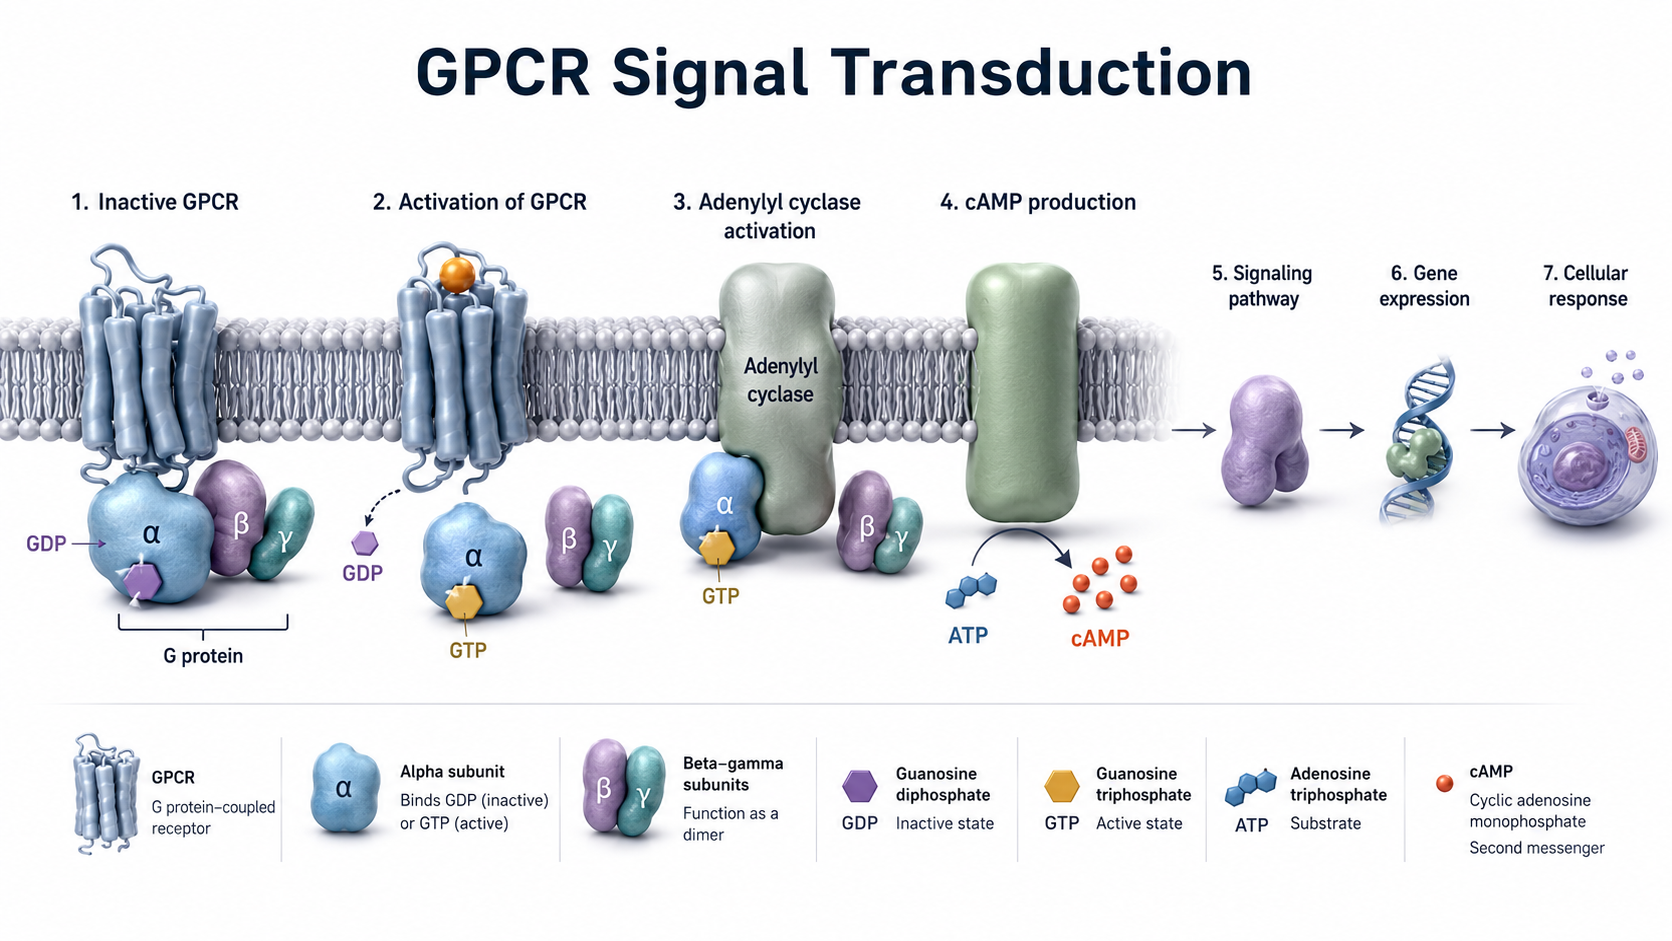
G-protein-coupled receptors (also called metabotropic receptors) work differently. Rather than forming ion channels, these receptors are proteins that convert signals from NTs and drugs into intracellular messages by activating G-proteins within the neuron's interior. G-protein activation can trigger the synthesis of second messengers—intracellular signaling molecules that amplify the original signal—capable of altering cell division, energy conversion, membrane potential, and ion channel activity. Because this process involves multiple biochemical steps, metabotropic receptor effects develop more slowly but tend to last longer than ionotropic responses.
Drugs Modulate NT Systems Through Actions at Diverse Targets
Beyond receptor binding, drugs can modulate NT systems by altering their production, release, and clearance. These three stages represent the complete life cycle of a neurotransmitter, and each stage offers potential drug targets. Understanding where in this cycle a drug acts will help you predict its effects on your client's EEG.
NT Production
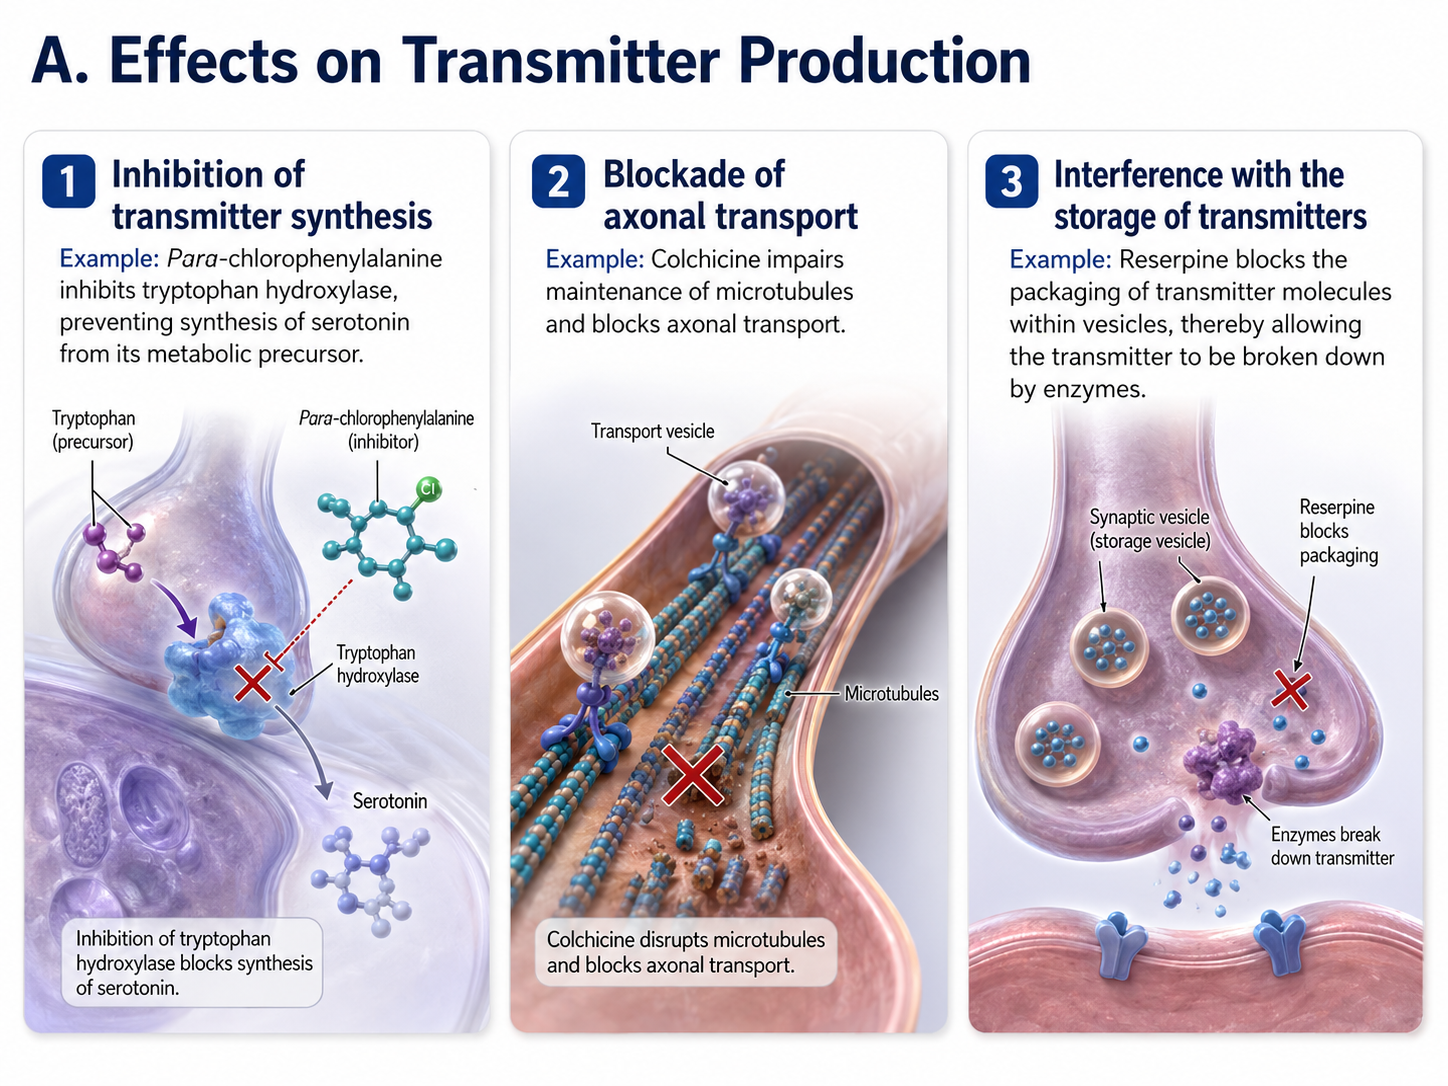
Drugs can interfere with NT production at three points: (1) targeting enzymes to prevent NT synthesis (e.g., para-chlorophenylalanine blocks serotonin synthesis), (2) disrupting axonal transport that carries materials from the cell body to the terminal (e.g., colchicine), and (3) interfering with NT storage in synaptic vesicles (e.g., reserpine, which depletes monoamine stores). Each of these mechanisms reduces the amount of NT available for release.
NT Release
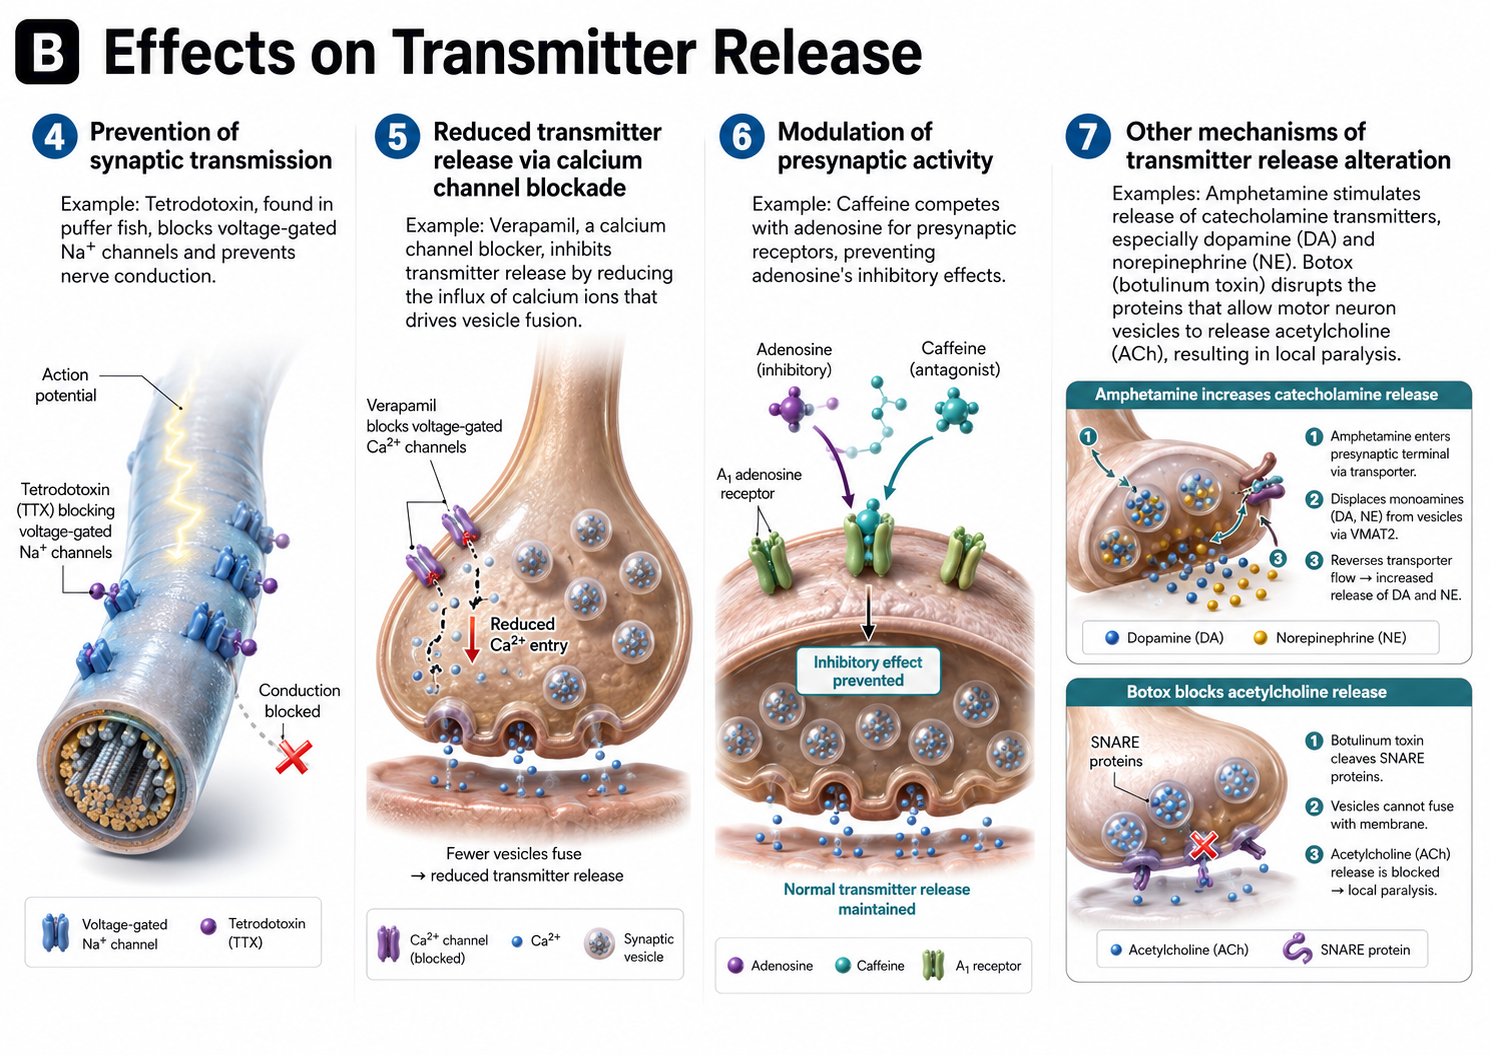
Drugs can also target the release process itself. They may prevent NT release by blocking (4) sodium channels (e.g., tetrodotoxin) or (5) calcium channels (e.g., verapamil), since both ion types are essential for triggering vesicle fusion. Additionally, drugs can (6) compete for occupancy on presynaptic receptors that regulate release (e.g., caffeine at adenosine receptors), or (7) directly alter NT release—amphetamines force NT out of vesicles, while Botox prevents vesicle fusion entirely.
NT Clearance
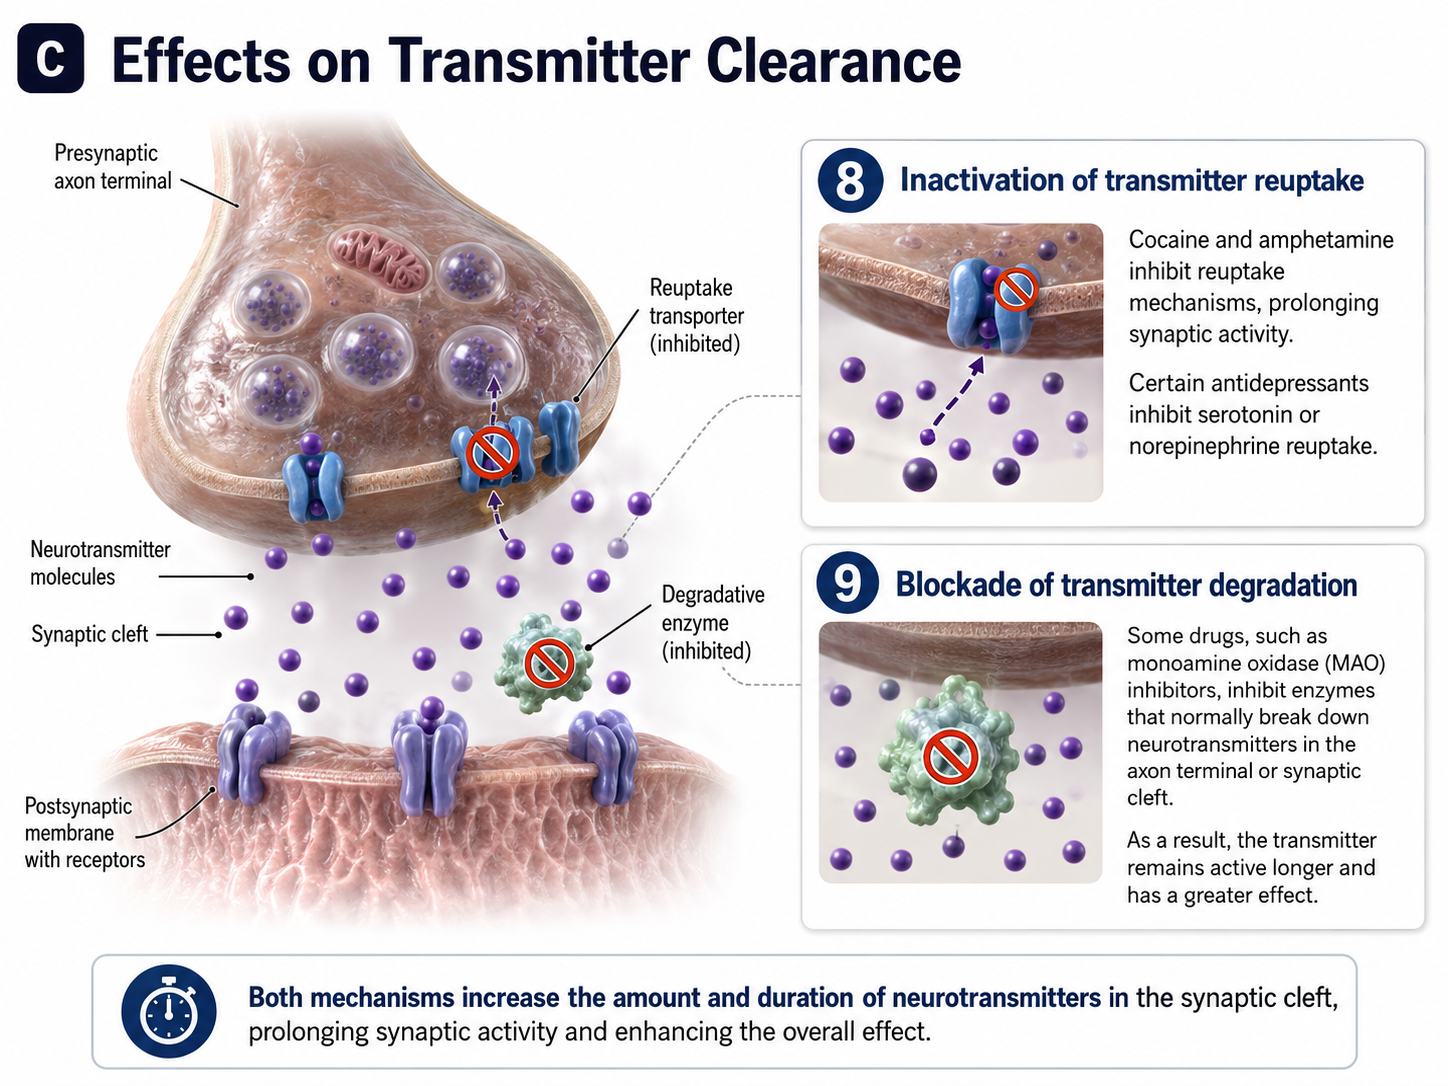
Finally, drugs can extend a NT's action by interfering with its removal from the synapse. This occurs through two main mechanisms: (8) blocking NT reuptake transporters (e.g., cocaine blocks dopamine reuptake, prolonging its effects) and (9) inhibiting enzymes that degrade NTs (e.g., MAO inhibitors prevent the breakdown of serotonin, norepinephrine, and dopamine). Both mechanisms increase the concentration and duration of NT activity in the synaptic cleft, which amplifies downstream effects on the EEG.
How Drug Half-Lives Influence Our Interpretation of EEG/qEEG and Behavior
This section covers a pharmacokinetic concept that directly affects your clinical workflow: the drug half-life. Understanding half-lives allows you to estimate how long a drug will remain active in your client's body, influencing their EEG patterns, behavior, and training responses.
A drug's half-life is the time required to eliminate 50% of the drug from the body. After a drug redistributes from the blood plasma to body tissues, its plasma concentration usually declines by first-order kinetics: a constant fraction is eliminated per unit of time, which is an exponential decline. Plotted on a logarithmic concentration axis, as in the figure below, that exponential decline appears as a straight line, which is why it is often described as linear. Ethanol is the notable exception, following zero-order kinetics in which a constant amount is eliminated per unit of time (Julien et al., 2023). This predictable decline allows you to estimate when a drug's EEG effects will peak and when they will begin to fade.
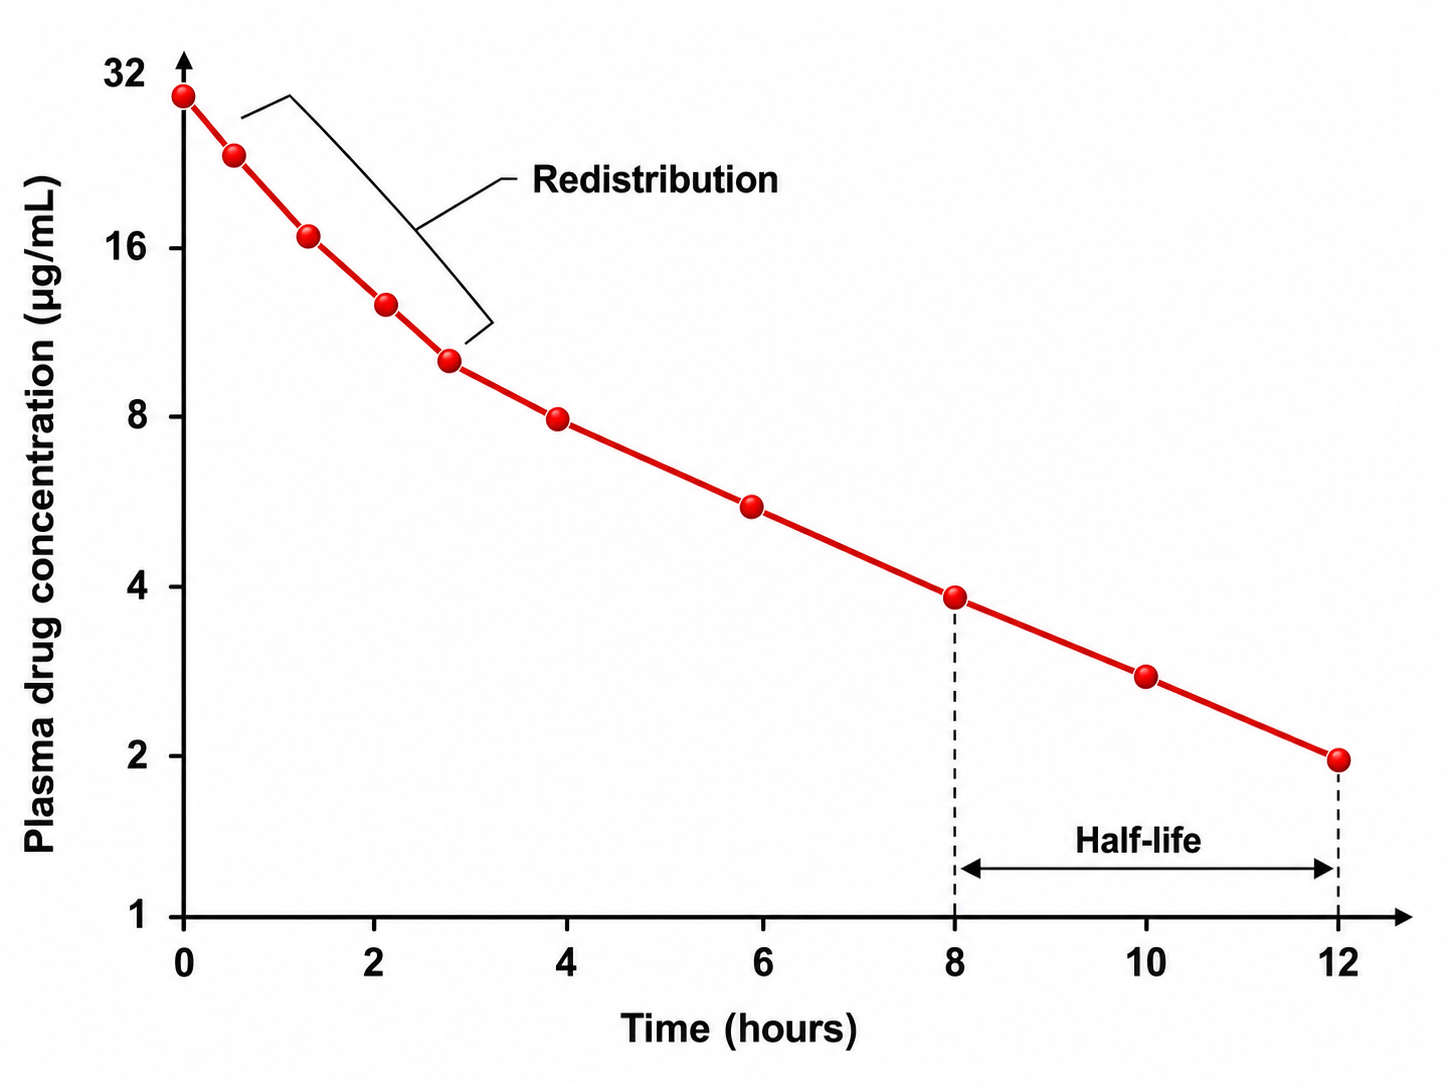
For EEG and qEEG professionals, the clinical rule of thumb is straightforward: a client is not effectively drug-free (approximately 98% eliminated) until six half-lives have passed. For example, a drug with a 4-hour half-life requires about 24 hours for near-complete elimination, while a drug with a 24-hour half-life requires roughly six days. This timeline dictates how you schedule assessments and interpret results.
The same arithmetic works in reverse during regular dosing. A client who takes a medication on a fixed schedule reaches a steady state, in which the amount absorbed with each dose balances the amount eliminated, after roughly five half-lives (Julien et al., 2023). At steady state the drug's plasma concentration, and therefore its EEG signature, is stable and reproducible from day to day. This is why a client on a settled maintenance regimen yields a consistent baseline, and why you should hold medication conditions constant between your initial assessment and any reassessment.
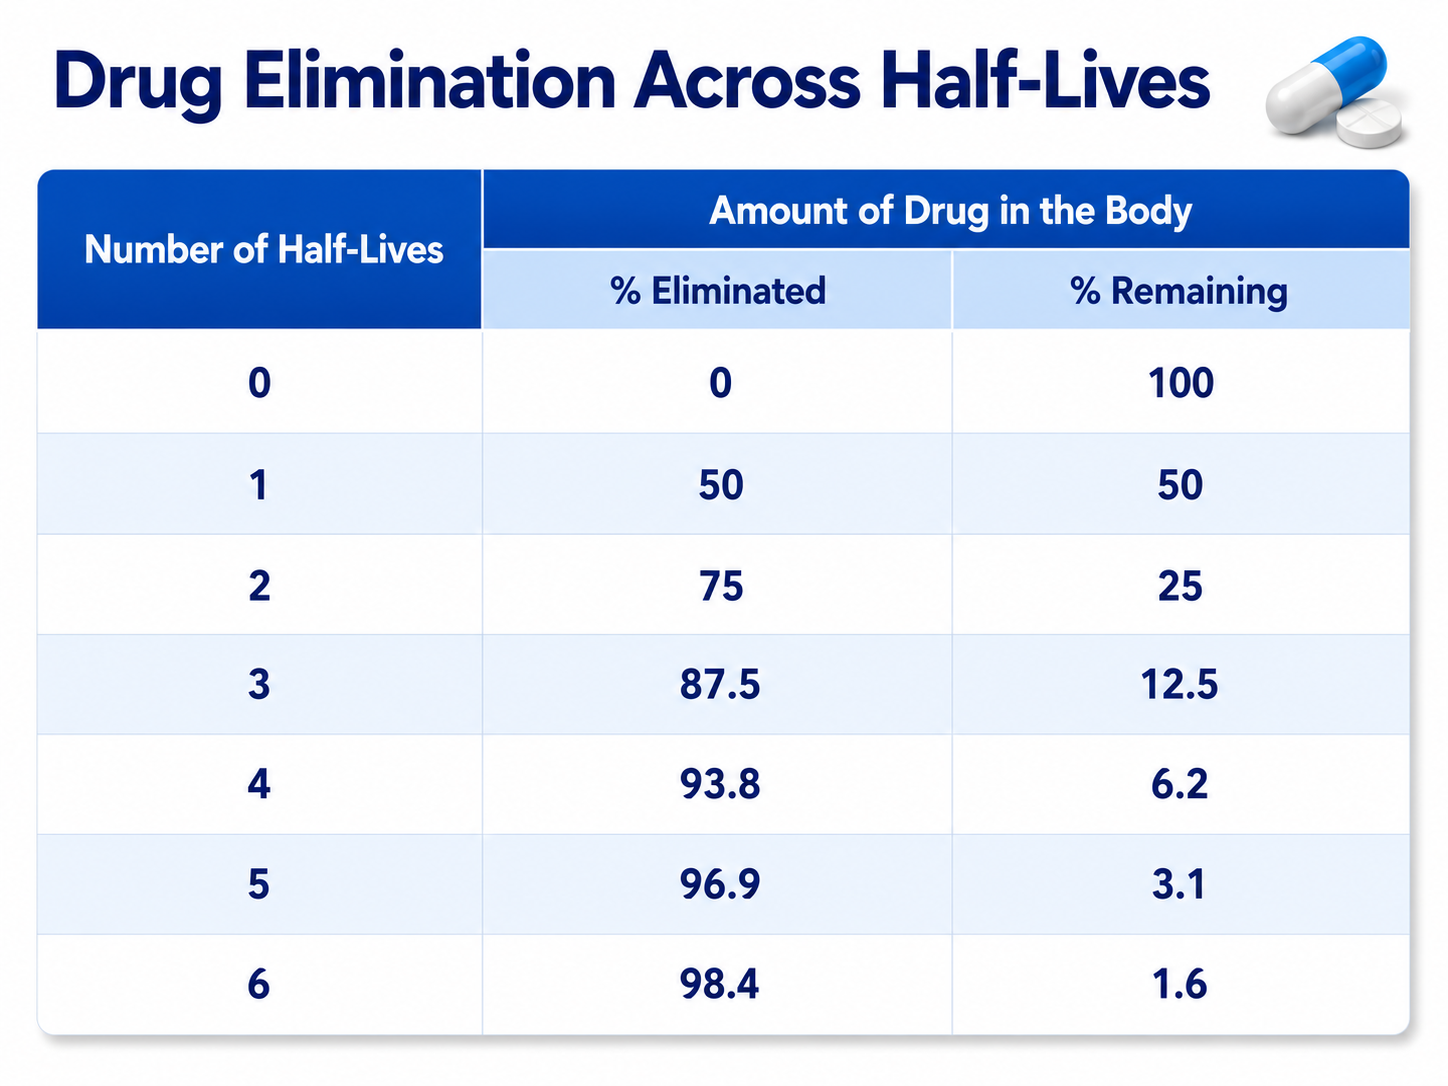
Knowing your client's medication half-lives is not optional—it is essential for accurate EEG interpretation. If you record a qEEG while a long-acting benzodiazepine is still active, the elevated beta activity you observe may reflect the drug rather than your client's underlying brain function. This distinction can mean the difference between an appropriate training protocol and one that works against the medication's effects.
A Psychopharmacology Paradigm Shift
This section explores a growing argument for incorporating EEG into psychiatric practice—an approach that aligns directly with the biofeedback field's emphasis on physiological assessment. Understanding this paradigm shift will help you articulate the value of EEG-informed care to prescribing physicians and interdisciplinary teams.
Dr. Ron Swatzyna and colleagues (2024) have made a compelling case for using routine EEGs when psychiatric medications fail to provide relief. They argue that psychiatry's traditional symptom-based approach, guided by the Diagnostic and Statistical Manual (DSM), is insufficient because it often leads to multiple medication trials that never address the underlying neurophysiological causes. For practitioners who already use qEEG in their assessments, this argument reinforces what you observe daily: behavioral symptoms alone cannot reveal what is happening at the level of brain electrical activity.

The authors identified four key EEG biomarkers associated with medication failure in treatment-resistant patients: focal slowing (FS), which indicates localized cerebral pathology; spindling excessive beta (SEB), which suggests cortical irritability; diffuse cortical slowing, which reflects encephalopathy (EN); and isolated epileptiform discharges (IEDs), which signal subclinical seizure-like activity. These biomarkers identify specific types of brain dysregulation that standard psychiatric interviews cannot detect.
The use of EEG biomarker identification represents a positive step toward personalized medicine. By directly testing the organ being treated, practitioners can gain a deeper understanding of the underlying brain activity and create treatment plans tailored to the specific needs of each patient. (Swatzyna et al., 2024, p. 9)
Incorporating routine EEGs into psychiatric practice could significantly enhance treatment precision, moving the field toward the goals of the National Institute of Mental Health's Research Domain Criteria (RDoC) project (Insel et al., 2010). The RDoC framework advocates shifting from symptom-based diagnosis toward a biologically grounded understanding of mental disorders—an approach that dovetails with the neurofeedback practitioner's commitment to training the brain based on objective physiological data rather than diagnostic labels alone.
The Four EEG Biomarkers in Depth
Knowing that four biomarkers exist is one thing. Recognizing them on a tracing, understanding what they reveal about a client's brain, and translating that knowledge into a safe training plan is another. This section examines each biomarker in turn so that you can collaborate intelligently with the neurologist who reads the clinical EEG and the physician who manages the medications.
Before we begin, a word about your role. Dr. Ronald Swatzyna, who inspired much of this work, describes the ideal arrangement as a team of detectives who each stay in their lane (Swatzyna et al., 2024). The neurologist rules out seizures and gross pathology, and the physician investigates metabolic, toxic, and infectious causes.
You, as the neurofeedback provider, recognize when a biomarker should redirect the investigation before you ever design a protocol. None of these professionals works alone, and none oversteps another's expertise.
One principle ties the four biomarkers together. As Swatzyna and colleagues (2024) remind us, an EEG biomarker is never a diagnosis. It is a sign of underlying brain dysregulation that helps explain why prior medications failed. Lead poisoning, sleep apnea, a failing thyroid, or a quiet inflammatory process can each produce the same waveform, and only a medical workup can tell them apart.
Encephalopathy: When the Whole Brain Slows Down
Encephalopathy (EN) appears on the EEG as generalized slowing of cortical electrical activity. Instead of the healthy posterior dominant rhythm (PDR) of 8 to 12 Hz that you expect over the occipital region during relaxed wakefulness, the recording is dominated by slower delta (0.5 to 4 Hz) and theta (4 to 7 Hz) rhythms. This pattern reflects a systemic disturbance in the conversation between the cortex and deeper structures, especially the thalamus (Faigle et al., 2013).
Think of the healthy alpha rhythm as a steady idle in a well-tuned engine. Encephalopathy is what you see when the fuel is contaminated. Metabolic problems such as liver or kidney failure, toxic exposures such as heavy metals or medications, and oxygen deprivation all impair neuronal metabolism across broad networks rather than damaging one spot (Swatzyna et al., 2014). The thalamocortical system loses its alpha-frequency resonance, and slower oscillations take over (Sutter & Kaplan, 2013).
The most telling clinical sign is the posterior dominant rhythm. In encephalopathy, the PDR often drops below 8 Hz and stops reacting to stimuli such as eye opening or mental arithmetic (Sutter & Kaplan, 2013). A healthy brain shows a brisk change when the eyes open. An encephalopathic brain barely responds. This loss of reactivity, more than the slowing itself, signals that something systemic deserves attention.
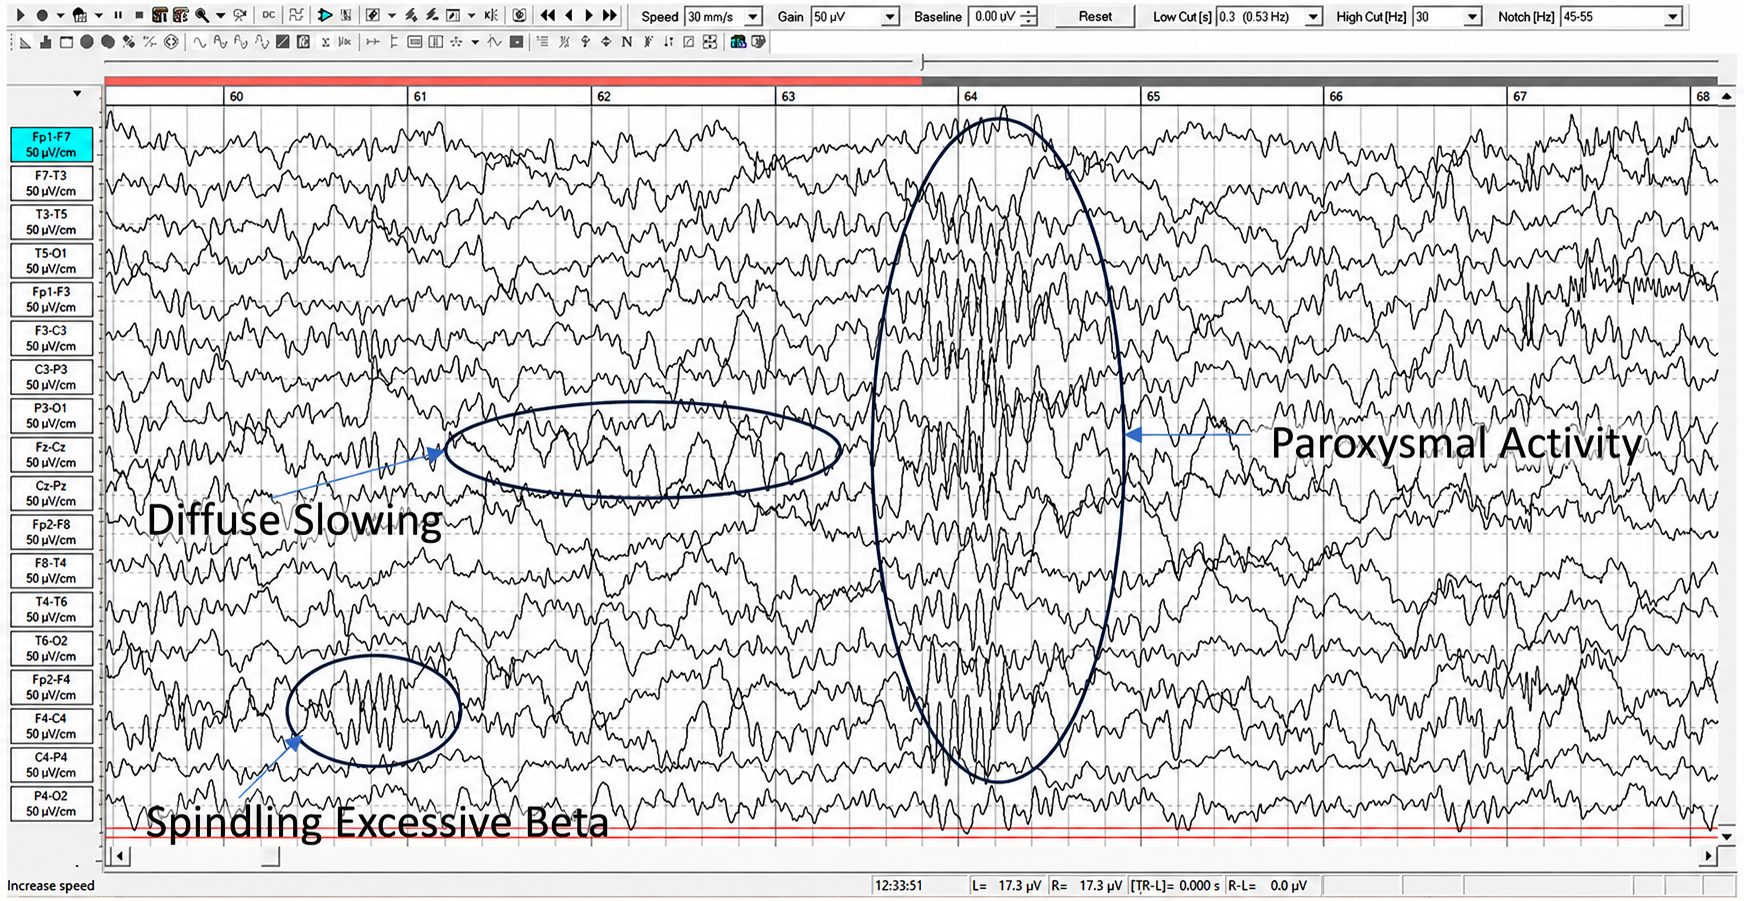
Morphology adds further clues, though it can mislead the untrained eye. Hepatic encephalopathy often produces frontal intermittent rhythmic delta activity (FIRDA), a waxing-and-waning delta pattern over the frontal regions that can resemble a mood disorder or a post-concussive state. Diffuse axonal injury, by contrast, tends to produce a theta-delta fusion pattern with poor phase synchrony that an inexperienced reader may dismiss as drowsiness (Sutter & Kaplan, 2013).
Acquisition settings matter more than most clinicians realize. A high-pass filter set too aggressively can attenuate the very slow waves that define encephalopathy, hiding it from view. For this reason, the joint minimum recording standards of the International Federation of Clinical Neurophysiology and the International League Against Epilepsy set the low-frequency (high-pass) filter no higher than 0.5 Hz, so that slow activity is preserved rather than filtered away (Peltola et al., 2023). Reviewing the same recording in more than one montage helps as well. A Laplacian montage references each electrode to the average of its immediate neighbors, sharpening local detail and improving the detection of subtle slow-wave abnormalities, while a conventional bipolar montage shows how the slowing is distributed.
This case carries a direct lesson for your practice. Misreading encephalopathy as a primary psychiatric condition can lead to real harm. Adding a dopamine-blocking antipsychotic to a patient with metabolic encephalopathy can precipitate catatonia or neuroleptic malignant syndrome. Designing a neurofeedback protocol that suppresses fast activity or rewards slow activity, without first confirming the brain is metabolically sound, can entrench dysfunction rather than relieve it.
Age complicates interpretation. Adults over 70 show a natural, gradual slowing of alpha that is not pathological. Quantitative EEG systems that apply age-adjusted z-scores, such as NeuroGuide and BrainDx, help you distinguish normal aging from genuine encephalopathy and avoid sending an otherwise healthy older client for an unnecessary metabolic workup.
Focal Slowing: A Localized Red Flag
Focal slowing (FS) is slow-wave activity confined to one region of the brain rather than spread across the whole cortex. Where encephalopathy points to a systemic problem, focal slowing points to a discrete one. It is the single most common biomarker in refractory cases, and it reliably indicates localized cerebral dysfunction (Swatzyna et al., 2024).
The causes read like a neurologist's differential. Focal slowing can arise from traumatic brain injury, ischemic or hemorrhagic stroke, congenital abnormalities, bacterial or viral infections such as encephalitis, tumors, or neurodegenerative processes (Swatzyna et al., 2024). In each case the slowing marks a zone of neural inefficiency where the local tissue can no longer generate its normal rhythms.
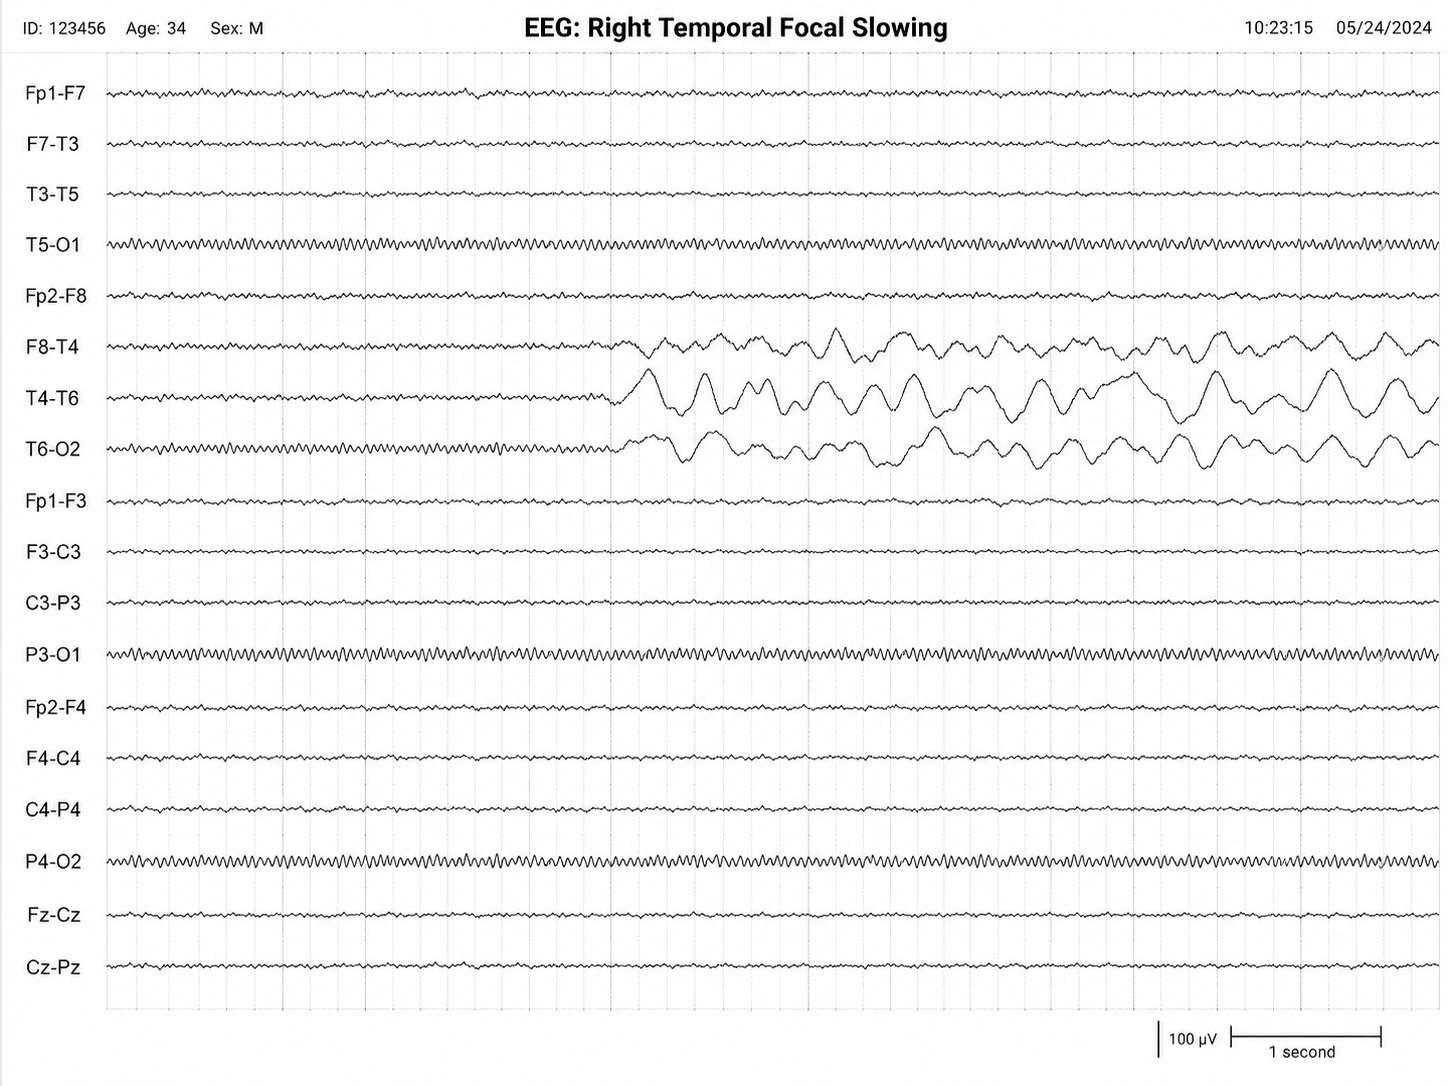
Location shapes symptoms. Because each cortical region serves particular functions, the position of the slow activity often predicts the clinical picture. Frontal slowing can impair attention, planning, and impulse control, while temporal slowing may disturb memory and emotion. This is why a thoughtful EEG report describes where the slowing sits, not merely that it exists. A client whose attention problems trace to focal slowing over a prior injury site is not the same as one with developmental inattention, even when their questionnaires look identical.
For you, focal slowing is a signal to pause and consult. A neurologist should evaluate the finding to determine whether it reflects an old, stable injury or an active process such as a tumor or vascular event that demands urgent imaging. Training over a region of focal slowing without understanding its cause risks both ineffective sessions and missed pathology. When the cause is known and stable, that same localization can later inform a rational protocol, but the medical evaluation comes first.
Isolated Epileptiform Discharges: Storms Without Seizures
Isolated epileptiform discharges (IEDs) are brief, paroxysmal events that appear as spikes, sharp waves, or spike-and-wave complexes standing out sharply from the background rhythm. Spikes last less than 70 milliseconds with a steep rise and fall, while sharp waves are slightly broader, up to about 200 milliseconds. These waveforms reflect transient cortical hyperexcitability, and they are traditionally associated with epilepsy.
Here is the surprising part. IEDs frequently appear in people who have never had a seizure, particularly children and adolescents with neurodevelopmental or psychiatric symptoms (Swatzyna et al., 2022). When discharges occur between seizures, or in the complete absence of any seizure, neurologists call this interictal activity. The discharges may never cause a convulsion, yet they can still disrupt cognition, mood, and behavior for the brief moments they fire.
This challenges a deeply held assumption. For decades, the rule was that an EEG abnormality only mattered if it produced a visible seizure. Boutros and Swatzyna have argued that this view causes neurologists to underreport discharges in psychiatric patients, dismissing them as benign variants (Swatzyna et al., 2022). They propose instead that the reader act as a clinical detective, asking not only whether a discharge is epileptiform but whether it explains otherwise puzzling symptoms.
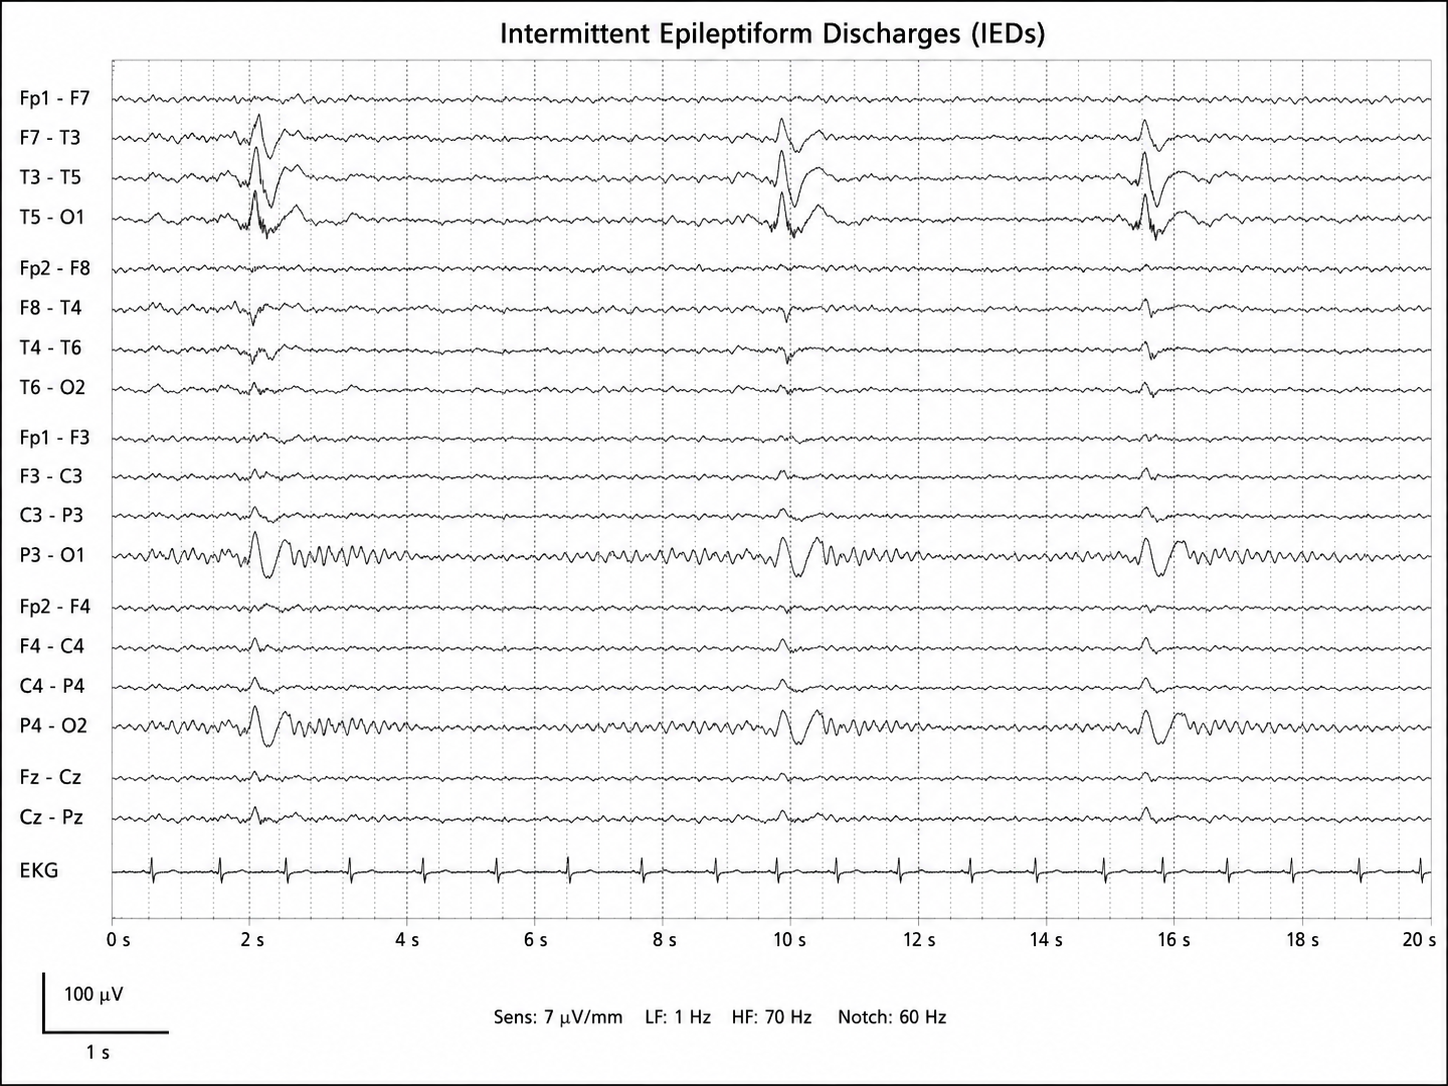
Location again drives meaning. Frontal discharges often produce disinhibition, irritability, and executive dysfunction, symptoms that invite a diagnosis of ADHD, conduct disorder, or even borderline personality disorder. Temporal discharges may generate emotional instability, memory disturbance, dissociation, or hallucinations, which can be mistaken for bipolar disorder or PTSD. A left temporal discharge in a client with language difficulty and emotional lability tells a very different story than a less dramatic parietal one.
The prevalence figures are striking. In neurologically healthy children, routine EEG detects IEDs in roughly 2% to 6.5% of cases, with about 0.5% reported in healthy young adults. Among children and adolescents with neuropsychiatric disorders, the rates climb far higher, with Swatzyna and colleagues (2022) reporting that most studies they reviewed found discharges in more than a quarter of children with ADHD and in more than half of those with autism spectrum disorder. These are summary bands drawn from clinically referred samples, not community prevalence estimates. Sleep-deprived and extended protocols push the detection rates higher still.
That last point reflects a crucial property: IEDs are state-dependent. They surface most readily during drowsiness, early non-REM sleep, or after sleep deprivation, when cortical inhibition relaxes and latent excitability emerges. A routine 20-minute waking EEG can easily miss them. When a client's symptoms are episodic and treatment-resistant, an extended or sleep-deprived study often reveals what a brief recording could not.
The discharges themselves shape medication decisions. SSRIs, stimulants, and benzodiazepines all alter cortical excitability and can worsen or unmask IEDs in susceptible people, which helps explain why some clients react paradoxically to standard psychiatric drugs (Swatzyna et al., 2022). When discharges are confirmed, the physician may turn to low-dose anticonvulsants such as valproate or lamotrigine, and may correct nutritional deficits such as magnesium, zinc, or vitamin D.
For the neurofeedback provider, IEDs demand caution and collaboration. Some neuromodulation approaches can, in theory, influence cortical excitability in either direction, so any work with a client who has confirmed discharges belongs in close coordination with the managing physician and, ideally, with EEG monitoring. The goal is to stabilize rhythms, never to provoke them.
Spindling Excessive Beta: A Marker of Cortical Irritability
Spindling excessive beta (SEB) is a rhythmic, spindle-shaped burst of beta-frequency activity (13 to 30 Hz) that waxes and wanes like a sleep spindle but occurs during wakefulness. The morphology is the key. Ordinary beta is part of healthy alert cognition, but beta that organizes into diffuse, spindle-like bursts while a person is awake is pathological, typically with a frontocentral emphasis (Krepel et al., 2021).
The pattern has a long history. Frederic and Erna Gibbs documented rhythmic high-frequency beta bursts in patients with toxic encephalopathies, epilepsy, and diffuse cortical dysfunction in their 1950 and 1952 atlases, well before the phenomenon had a name (Gibbs & Gibbs, 1950, 1952). The modern term arrived with Johnstone, Gunkelman, and Lunt (2005), who defined SEB within a clinical EEG database as high-frequency beta with a spindle morphology and an anterior emphasis.
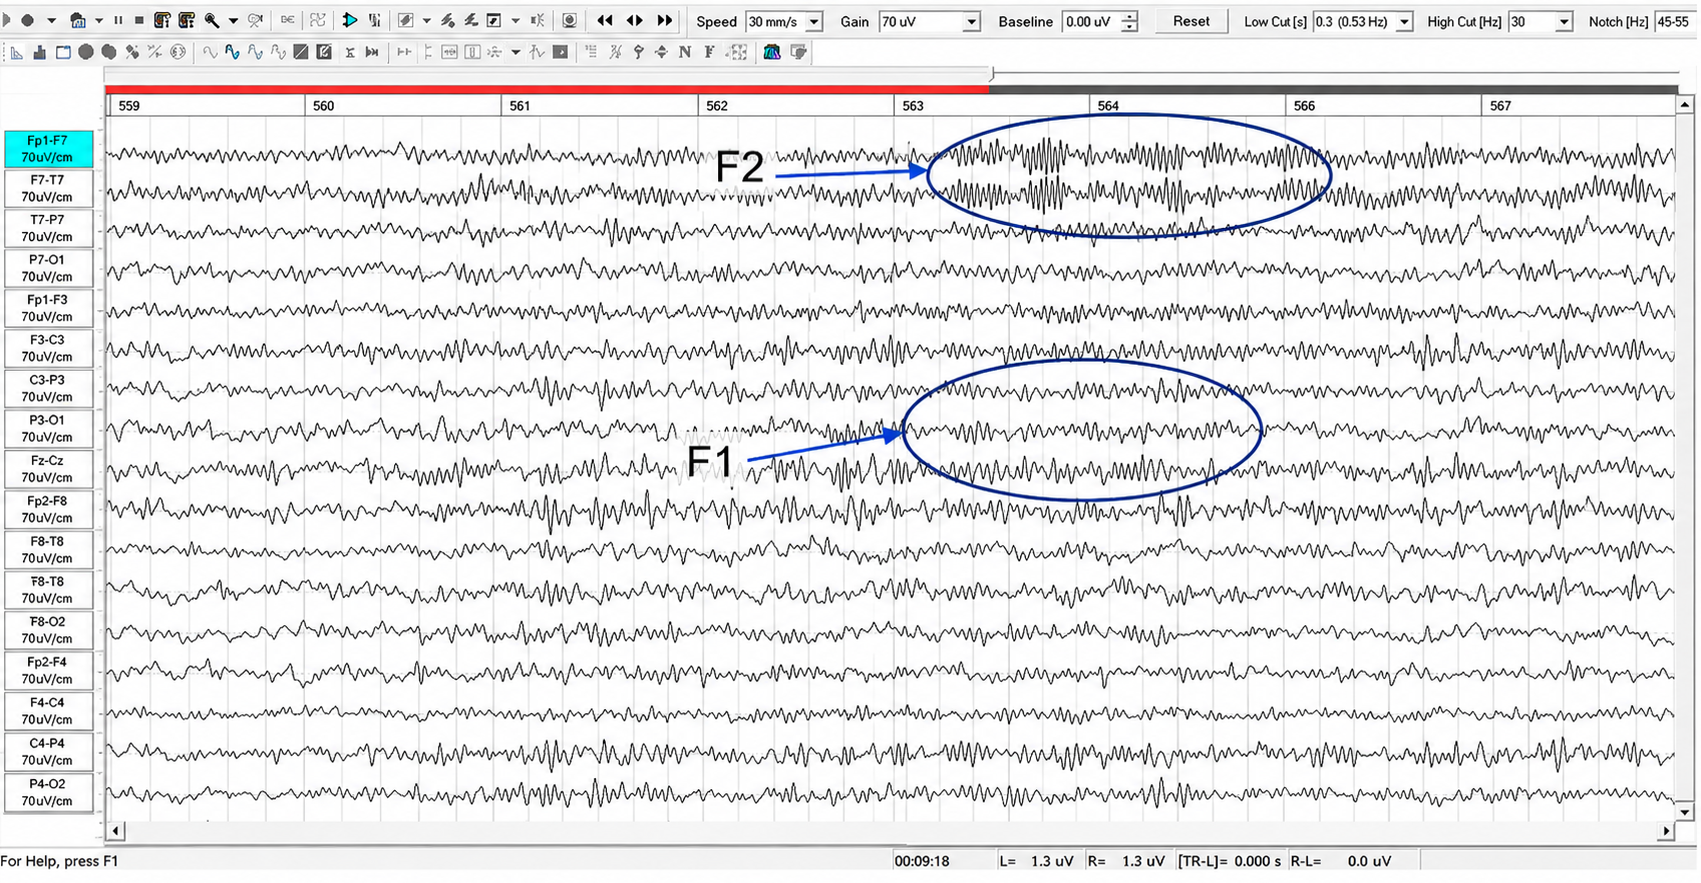
Frequency offers a clue to cause. SEB in the 14 to 20 Hz range is classically associated with benzodiazepines and barbiturates, while SEB in the 20 to 30 Hz range may reflect cortical irritability and has been linked to viral or toxic encephalopathies (Gibbs & Gibbs, 1952; Krepel et al., 2021). Heavy metal exposure, traumatic brain injury, and metabolic insults can all disturb the balance between excitation and inhibition that gives rise to the pattern.
SEB is best understood as transdiagnostic. In a replication study, Krepel and colleagues (2021) found that adults with frontocentral SEB reported more impulse-control problems and made more false-positive errors on a behavioral inhibition task, and these effects held regardless of diagnosis. SEB appears across ADHD, autism, anxiety, mood disorders, and PTSD, which suggests it reflects a shared neurobiological disruption rather than any single condition (Krepel et al., 2021; Swatzyna et al., 2024).
As Dr. Swatzyna puts it, SEB is not a diagnosis but a marker of underlying pathology. Its presence should prompt a search for reversible causes, a shift from symptom-focused labeling toward an organic brain-dysfunction model. The recommended workup includes a comprehensive metabolic panel, heavy metal screening, thyroid testing, and, when structural injury is suspected, neuroimaging.
Medication caution is essential. Benzodiazepines paradoxically increase beta synchrony, especially with chronic use, and stimulants and SSRIs can raise cortical beta power in susceptible clients. When you see prominent SEB, you have good reason to be wary of central-nervous-system activating agents, since they may worsen symptoms or contribute to the very treatment resistance that brought the client to you (Swatzyna et al., 2024).
For the neurofeedback provider, SEB illustrates the central rule of this chapter with unusual clarity. If a client's frontocentral beta reflects lead poisoning, a protocol that simply suppresses beta will chase a symptom while the poison continues its work. Treating the cause, in collaboration with a physician, often eliminates the need for chronic psychiatric medication and resolves the very rhythm you might otherwise have spent months training.
From Biomarker to Protocol: The Practitioner's Discipline
The four biomarkers share a common message. Each one tells you that a client's symptoms may have a physical cause that no diagnostic interview could reveal, and that the cause may be reversible. Across the 1,233 refractory cases that Swatzyna and colleagues (2024) studied, these markers did not align neatly with DSM categories. They cut across diagnostic boundaries, which is exactly why behavioral symptoms alone so often fail to predict who will respond to a given medication.
This is where your discipline as a provider becomes decisive. When you encounter any of these biomarkers, whether in a client's prior EEG report or in your own qEEG screen, the correct first move is not to design a protocol. It is to ensure that a neurologist and a managing physician have investigated the underlying cause. Consider a client with diffuse slowing whose true problem is untreated sleep apnea and a failing thyroid. Training to boost posterior rhythm power would waste everyone's time until the apnea and thyroid are corrected.
The deeper principle, in Dr. Swatzyna's phrase, is to test the organ you are treating. The EEG lets you look directly at brain electrical activity rather than inferring it from behavior. When that look reveals a biomarker, it is inviting you to investigate, not to react. Hold that discipline, collaborate with your medical colleagues, and you will spare your clients years of ineffective symptom management while honoring the boundaries of your own expertise.
Drug and Toxic-Metabolic Confounds
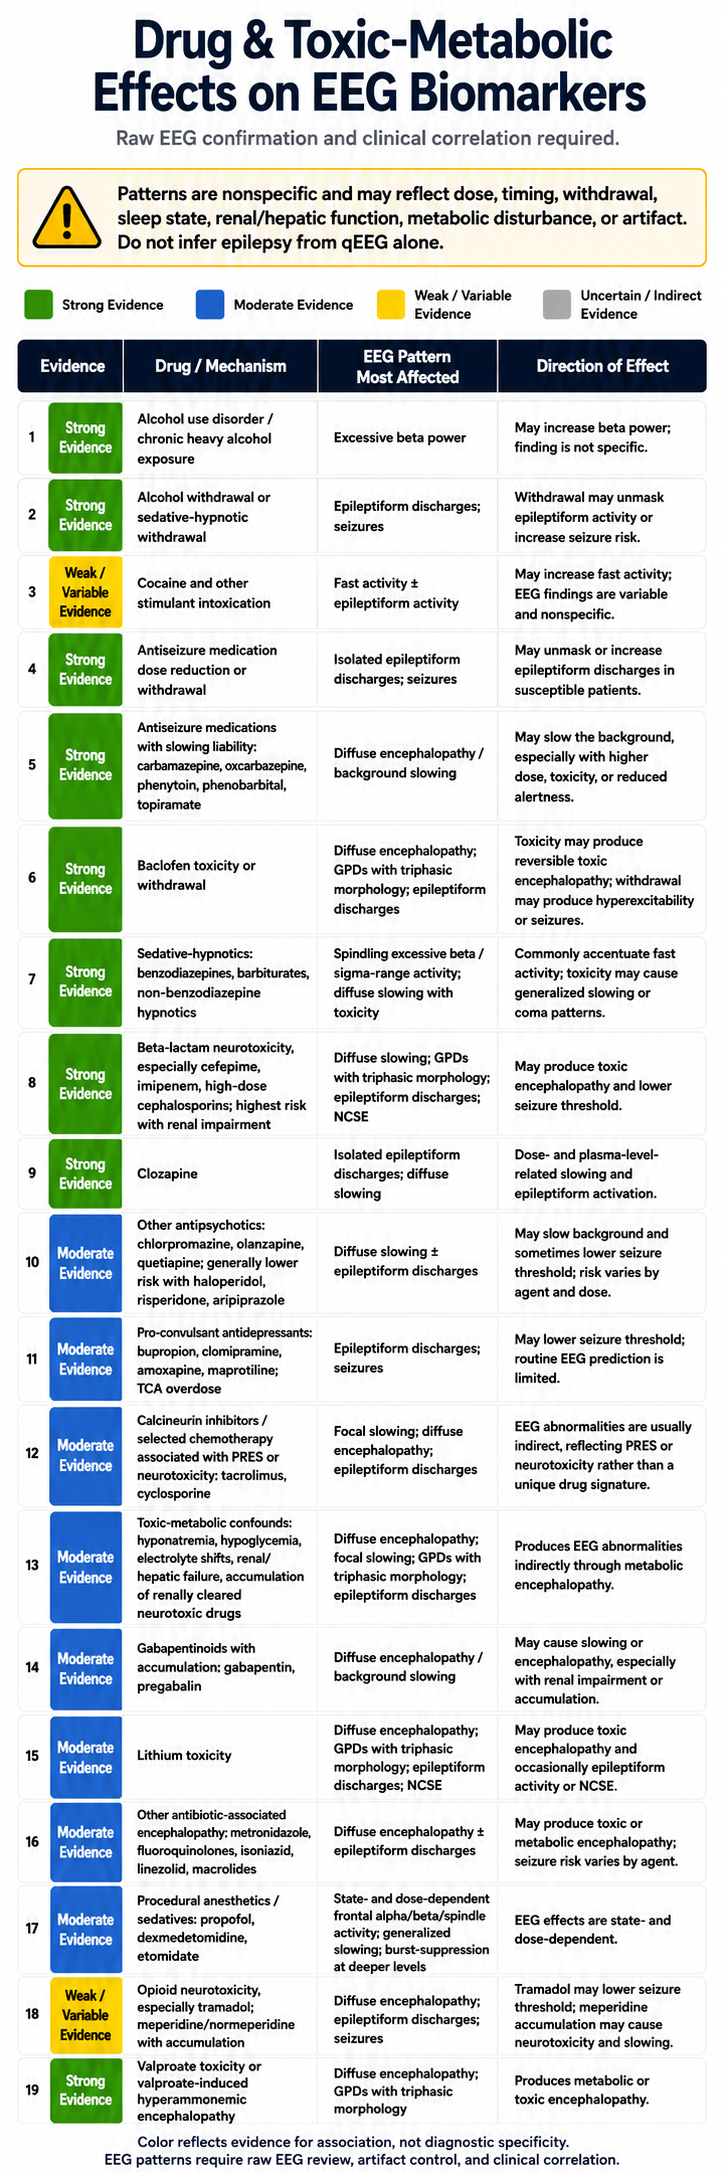
Drug effects and toxic-metabolic states are among the most important interpretive confounds in EEG assessment. Many medications, intoxication states, withdrawal states, and systemic metabolic disturbances can alter background rhythms, fast activity, slowing, periodic discharges, and seizure susceptibility. These changes may resemble clinically meaningful biomarkers, yet they are rarely specific enough to support a diagnosis without raw EEG confirmation and clinical correlation.
The table below summarizes common drug and toxic-metabolic associations with four clinically relevant EEG patterns: excessive beta or sigma-range activity (12–16 Hz synchronized activity, including sleep spindles), focal or diffuse slowing, epileptiform discharges or seizures, and generalized periodic discharges with triphasic morphology. The color coding reflects the strength of the association rather than its diagnostic specificity. Green entries indicate well-established associations, blue entries indicate moderate evidence, yellow entries indicate weak or variable findings, and gray would indicate uncertain or indirect relationships. This table contains no gray entries.
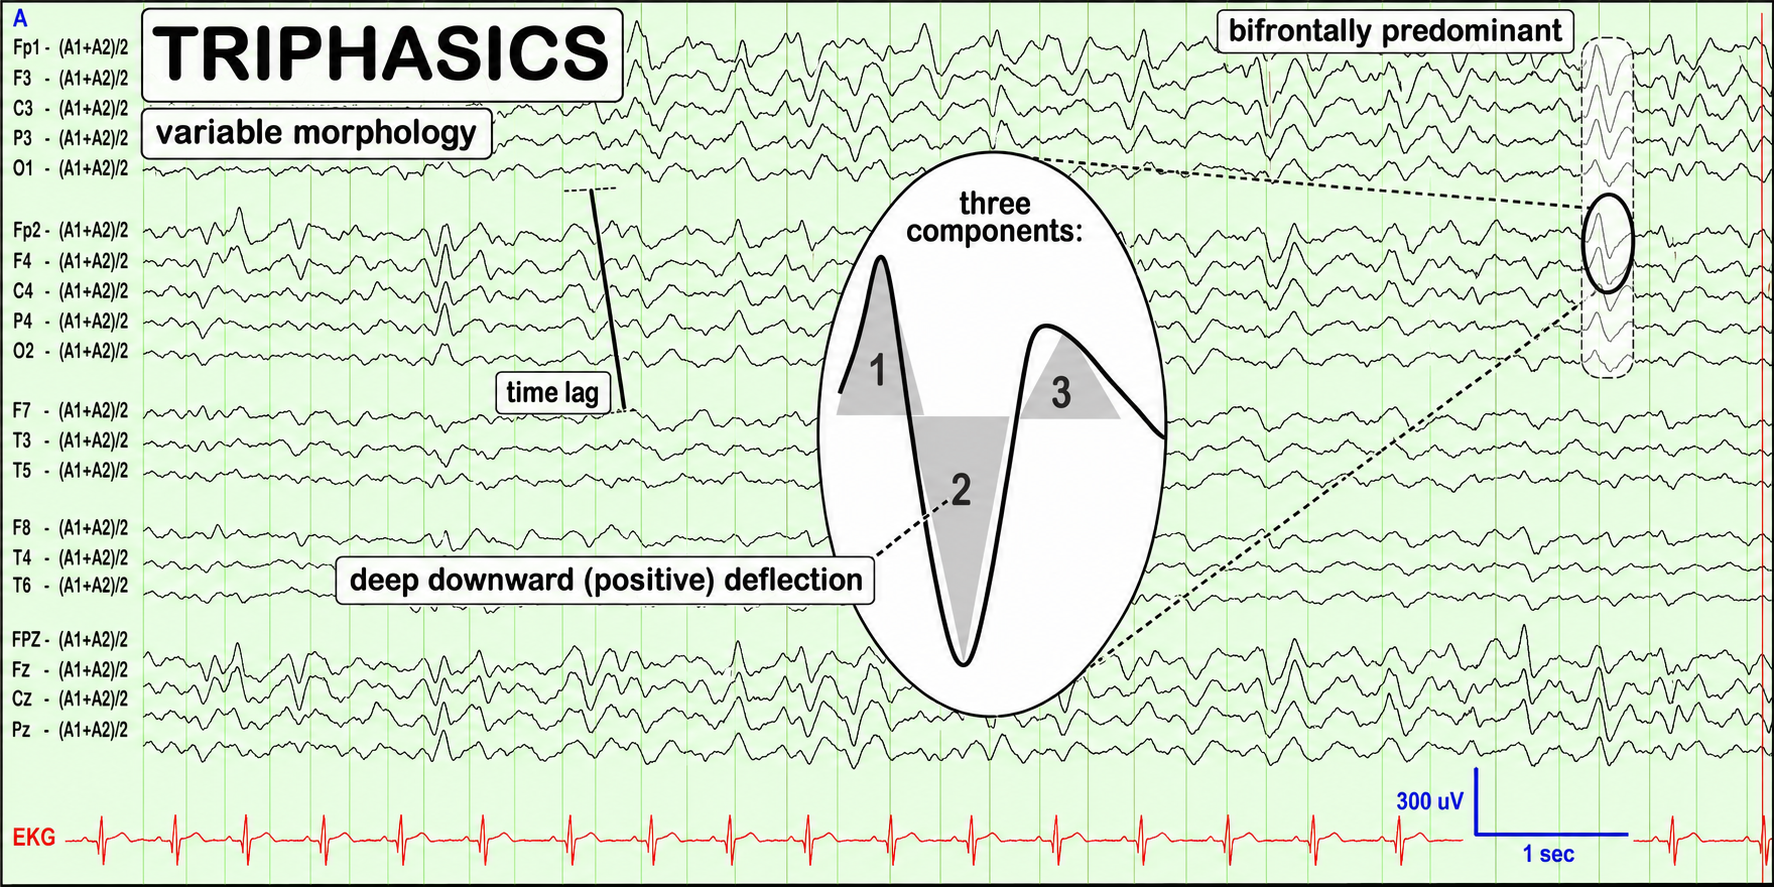
Several patterns deserve particular caution. Sedative-hypnotics commonly accentuate beta or sigma-range activity, whereas toxicity may produce generalized slowing or coma patterns. Beta-lactam neurotoxicity, lithium toxicity, baclofen toxicity, valproate-associated hyperammonemic encephalopathy, and other toxic-metabolic derangements can produce diffuse encephalopathy, generalized periodic discharges with triphasic morphology, epileptiform activity, or nonconvulsive status epilepticus. Withdrawal from alcohol, sedative-hypnotics, or antiseizure medications can unmask epileptiform activity or raise seizure risk in susceptible clients.
For this reason, treat the table as a medication and physiology reconciliation aid rather than as a diagnostic algorithm. Interpret EEG findings in relation to dose, timing of exposure, withdrawal state, sleep and arousal level, renal and hepatic function, electrolyte and glucose status, artifact control, and the client's neurological history. The safest reading is that these agents and conditions can modify EEG expression, while the final meaning of any biomarker depends on raw EEG review, clinical context, and longitudinal correlation.
Check Your Understanding
- How does encephalopathy differ from focal slowing on the EEG, and what does each pattern tell you about the likely cause?
- Why is the reactivity of the posterior dominant rhythm such an important sign when encephalopathy is suspected?
- A client's routine 20-minute waking EEG is read as normal, yet their symptoms are episodic and treatment-resistant. Why might a sleep-deprived EEG change the picture, and which biomarker is most likely to emerge?
- Spindling excessive beta is described as transdiagnostic. What does that mean, and why does it argue against treating SEB as a diagnosis?
- You discover spindling excessive beta in a new client who is taking a benzodiazepine and a stimulant. What is your responsible next step, and why would you not immediately design a beta-suppression protocol?
Drug Effects on the EEG
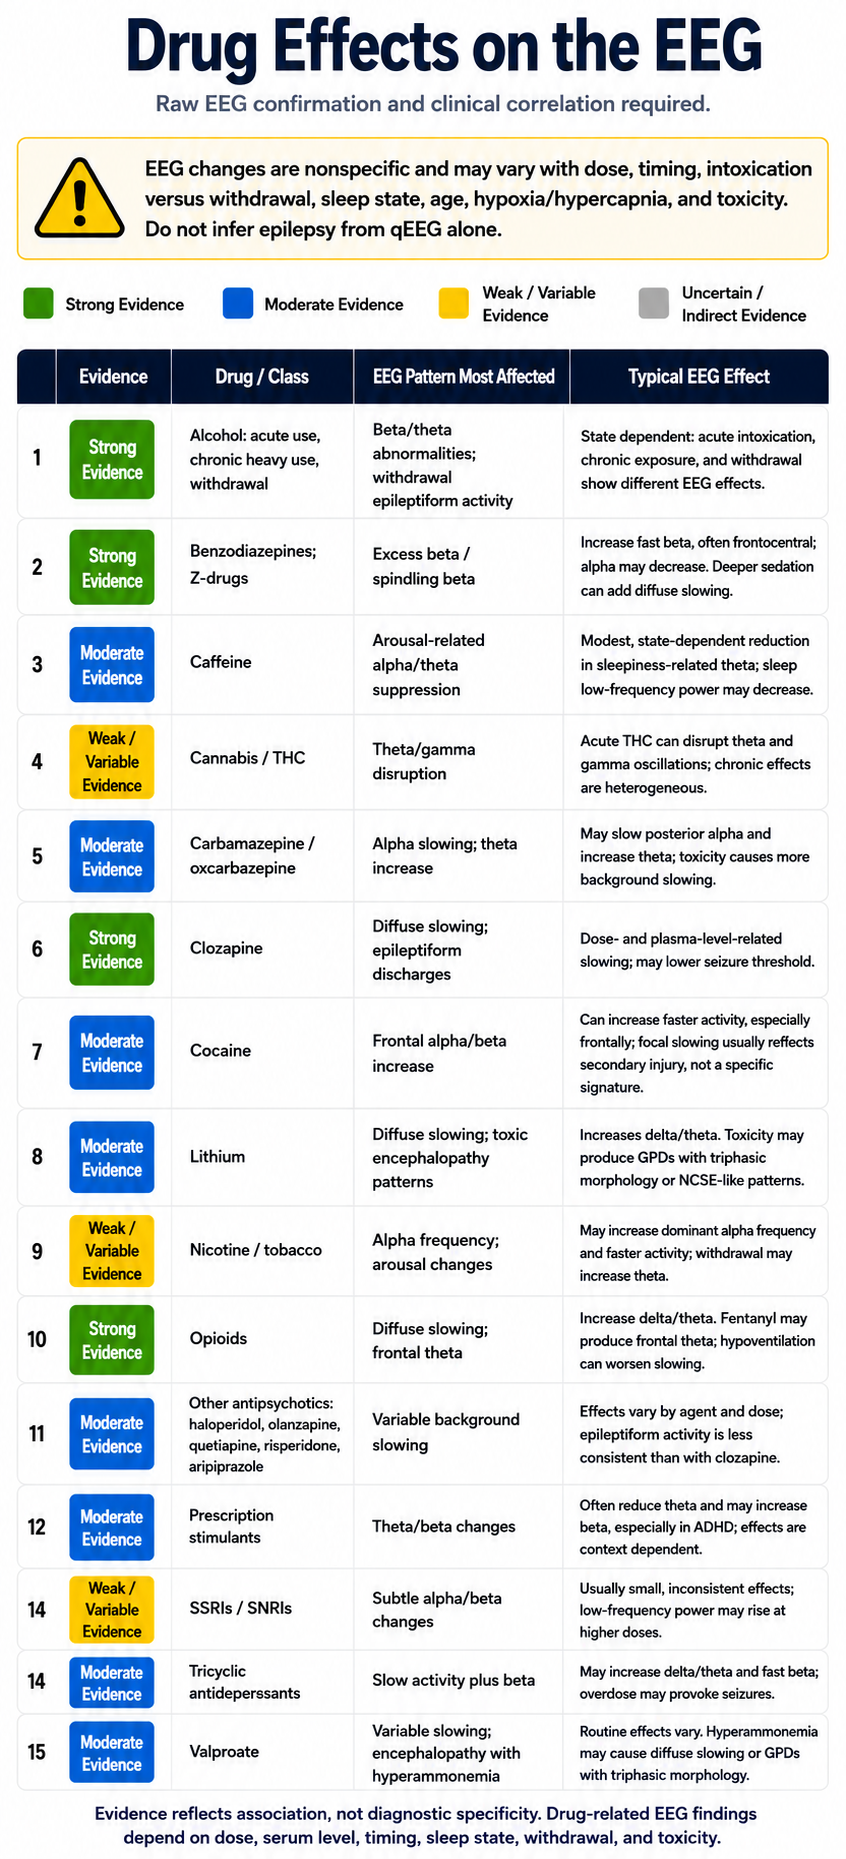
Nearly every psychoactive drug leaves a fingerprint on the EEG, and so do the metabolic and toxic states that accompany drug use and withdrawal. Decades of pharmaco-EEG research show that medications shift band power in characteristic, dose-dependent ways that usually appear symmetrically and diffusely across the scalp (Knott, 2000). The clinical difficulty is that these shifts are nonspecific, so a drug effect can be mistaken for the brain signature you are trying to assess or train. Before you read meaning into any recording, you need to know what your client has taken, how much, and when. One further caution about reading the sections that follow: band edges are not standardized across the pharmaco-EEG literature, so where a frequency range appears in parentheses beside a citation, it is that study's own definition rather than this unit's. The unit's own boundaries are delta 1-4 Hz, theta 4-7 Hz, alpha 8-12 Hz, and beta 12-38 Hz.
The table that follows distills that literature into a single reference. Each row pairs a drug or drug class with the EEG pattern it most affects and the effect you can typically expect, from the excess fast beta of benzodiazepines to the diffuse slowing of opioids and lithium. The colored evidence badge in the first column signals how well established each association is rather than how diagnostic it is. Green marks strong evidence, blue marks moderate evidence, yellow marks weak or variable findings, and gray marks uncertain or indirect relationships.
A few principles run through every row. Many effects are state dependent, so acute intoxication, chronic exposure, and withdrawal can each produce a different picture, as alcohol, nicotine, and the benzodiazepines all show. Sedating agents generally push activity toward slower frequencies while activating agents promote faster rhythms, and the size of any shift tracks dose and serum level. At toxic levels, agents such as lithium, valproate, clozapine, and the opioids can generate diffuse slowing, epileptiform discharges, or generalized periodic discharges with triphasic morphology, while withdrawal from alcohol or sedatives can unmask epileptiform activity and lower the seizure threshold.
Use this table to reconcile a client's medications and physiology with what you observe, not as a shortcut to a diagnosis. Weigh dose, timing of exposure, intoxication versus withdrawal, sleep and arousal level, age, renal and hepatic function, electrolyte and glucose status, hypoxia or hypercapnia, and artifact control before you attribute a finding to any single cause. Above all, do not infer epilepsy from the qEEG alone, since medication and metabolic states can produce epileptiform-appearing changes that resolve once the underlying problem is corrected (Van Cott & Brenner, 2003). The meaning of any pattern ultimately rests on raw EEG review, clinical context, and longitudinal correlation.
Antidepressants
This section covers the major antidepressant classes, their clinical side-effect profiles, and—most importantly for your practice—their specific effects on EEG frequency bands. Because antidepressants are among the most commonly prescribed psychotropic medications, you will encounter these drugs frequently in clinical settings.

Clinical Presentation
The major antidepressant classes include tricyclic antidepressants (TCAs), second-generation atypical antidepressants, selective serotonin reuptake inhibitors (SSRIs), dual-action antidepressants, irreversible MAO inhibitors, and selective norepinephrine reuptake inhibitors (NRIs). Note that the abbreviation SNRI is conventionally reserved for the serotonin-norepinephrine reuptake inhibitors such as venlafaxine and duloxetine, so the selective norepinephrine agents are abbreviated NRI here to avoid confusion. Each class has a distinct side-effect profile that can influence your client's clinical presentation during training sessions.
Tricyclic antidepressants (TCAs) like imipramine (Tofranil) can produce anxiety, blurred vision, dizziness, fatigue and weakness, psychotic symptoms (rare), sedation, seizures (rare), sexual dysfunction, and suicidality (rare) (Stahl, 2021). Selective serotonin reuptake inhibitors (SSRIs) like fluoxetine (Prozac) can produce agitation, anxiety, headache, insomnia, mania (rare), sedation, seizures (rare), sexual dysfunction, suicidality (rare), and tremors (Stahl, 2021).
Dual-action antidepressants like duloxetine (Cymbalta) can produce hypomania (rare), hypertension, insomnia, sedation, sexual dysfunction, and suicidality (rare) (Stahl, 2021). Irreversible MAO inhibitors like selegiline (Emsam transdermal patch, Eldepryl oral capsules) can produce confusion, dizziness, dyskinesia, hallucinations, headache, hypertensive crisis, mania (rare), seizures (rare), and suicidality (rare) (Stahl, 2021).
Selective norepinephrine reuptake inhibitors (NRIs) like atomoxetine (Strattera), which is approved for ADHD rather than depression, can produce abdominal pain, anxiety, agitation, aggression, dizziness, dysmenorrhea, dyspepsia, elevated heart rate, fatigue (especially in children), hypertension, hypomania and mania (rare), orthostatic hypotension, priapism, sedation, sexual dysfunction, and suicidality (rare) (Stahl, 2021).
EEG Measures
A critical distinction among antidepressants is whether they are sedating or nonsedating, as this property drives their EEG signature. Understanding this divide will help you correctly interpret what you see in a client's recording.
TCAs
Sedating TCAs like amitriptyline (Elavil) and imipramine (Tofranil) increase theta and fast-beta power while decreasing alpha and total power (Knott, 2000; Saletu et al., 2010; Thompson & Thompson, 2015). Nonsedating TCAs that resemble desipramine (Norpramin), by contrast, increase alpha and fast beta (Knott, 2000). This pattern illustrates a general principle: sedating drugs push EEG activity toward slower frequencies, while activating drugs promote faster rhythms.
At higher doses, sedating TCAs can increase delta and widespread theta power (Bauer & Bauer, 2005; Van Cott & Brenner, 2003). TCAs can also cause asynchronous slow waves and increase sleep spindles (Thompson & Thompson, 2015). Both TCAs and SSRIs can provoke spikes or polyspikes, and excessive TCA doses can increase delta and theta power, with theta appearing diffusely across the scalp (Blume, 2006).
MAOIs
The nonselective, irreversible MAO inhibitor iproniazid (Marsilid) increases theta to a smaller degree than amitriptyline (Elavil), while it increases fast-beta power to a greater degree. MAO inhibitors like isocarboxazid (Marplan) increase 20–30 Hz power while decreasing power in slower and high frequencies, a profile that resembles CNS stimulants (Thompson & Thompson, 2015). This stimulant-like EEG pattern makes sense pharmacologically, since MAO inhibitors increase the availability of activating catecholamines like norepinephrine and dopamine.
SSRIs
The SSRIs fluoxetine (Prozac), paroxetine HCl (Paxil), and sertraline HCl (Zoloft) modestly increase 18–25 Hz frontocentral beta and decrease anterior alpha power (Thompson & Thompson, 2015). The nonsedating SSRI citalopram (Celexa) decreases total, delta, theta, and alpha power while increasing beta and gamma power (Bauer & Bauer, 2005; Nissen et al., 2020; Saletu et al., 2010; Van Cott & Brenner, 2003).
Vortioxetine (Trintellix) decreases theta band (4–8 Hz) power and increases beta (12–32 Hz) and gamma (32–45 Hz) band power (Nissen et al., 2020). At high SSRI doses, clinicians should watch for bisynchronous spikes or polyspikes. Serotonin syndrome—a potentially life-threatening condition caused by excessive serotonergic activity—is associated with triphasic waves that signal toxic encephalopathy (Blume, 2006).
Atypical Antidepressants
The second-generation atypical antidepressants named in the class list above deserve separate mention because their EEG and safety profiles differ from the serotonergic agents. Bupropion (Wellbutrin), which inhibits the reuptake of norepinephrine and dopamine, alters task-related EEG alpha activity, and the size and direction of that change vary widely from person to person in ways that track each individual's response to the drug (Zhu et al., 2017). Bupropion also reshapes the EEG architecture of sleep in a pattern that correlates with antidepressant response (Ott et al., 2004), and it has shown benefit in attention-deficit and conduct presentations (Simeon et al., 1986). The point of greatest clinical consequence is that bupropion lowers the seizure threshold, most clearly in the immediate-release formulation and at doses above the labeled maximum, where the reported incidence rises from roughly 0.1% at sustained-release doses up to 300 mg per day to about 0.4% for immediate release at 300 to 450 mg per day. Prominent epileptiform features in a client taking it warrant prompt consultation with the prescribing physician rather than a training response (Stahl, 2021).
Antipsychotics
This section reviews the three generations of antipsychotic medications, their clinical side effects, and how each alters EEG patterns. Because antipsychotics profoundly affect brain electrical activity, recognizing their EEG signatures is essential for any practitioner working with clients who have psychotic disorders, severe mood disorders, or behavioral disturbances.

Clinical Presentation
The major antipsychotic classes include first-generation (FGA), second-generation or atypical (SGA), and third-generation (TGA) agents. Each generation reflects advances in receptor targeting designed to improve efficacy while reducing side effects.
First-generation agents (FGAs) like haloperidol (Haldol) exert their effects primarily through dopamine D2 receptor blockade. They can produce akathisia (a restless movement disorder), extrapyramidal symptoms (pseudo-Parkinsonism, tardive dyskinesia, and tardive dystonia), blurred vision, death and stroke in elderly with dementia-related psychosis, dizziness, hypertension, hypotension, neuroleptic malignant syndrome (rare), neuroleptic-induced deficit syndrome (analogous to the negative symptoms of schizophrenia), seizures (rare), and tachycardia.
Second-generation (atypical) agents (SGAs) like clozapine (Clozaril) have a broader receptor profile and can produce death and stroke in the elderly with dementia-related psychosis, neuroleptic malignant syndrome (when used with another agent), sedation, seizures, tachycardia, and tardive dyskinesia (rare). Third-generation agents (TGAs) like aripiprazole (Abilify) act as partial agonists at D2 receptors rather than full antagonists, which can produce activation, akathisia, death and stroke in the elderly with dementia-related psychosis, dizziness, headache, impaired impulse control (rare), insomnia, loss of energy, neuroleptic malignant syndrome, sedation, seizures (rare), and tardive dyskinesia (theoretical risk).
EEG Measures
Not all FGAs produce identical EEG changes, and the sedating-versus-nonsedating distinction is again crucial. Chlorpromazine (Thorazine), a sedating FGA, increases slow wave activity (delta and theta) and decreases alpha (8–14 Hz) and faster (beta) wave activity (Hughes et al., 1999; McClelland et al., 1990). FGAs may slow the peak alpha frequency and produce synchronous slow-wave activity. Chlorpromazine can also increase sharp theta transients at frontal and temporal sites and significantly slow the posterior dominant rhythm (PDR) (Demos, 2019).
Chlorpromazine reduces the amplitude and increases the variability of evoked responses (Laurian et al., 1981). The attenuation of alpha-blocking in response to sensory stimuli may be associated with memory deficits produced by this drug (Saletu et al., 2010; Thompson & Thompson, 2015). For your clinical work, this means that clients on chlorpromazine may show blunted EEG reactivity that could be mistaken for cortical underarousal. High phenothiazine doses may produce bisynchronous spikes or polyspikes (Blume, 2006).
Haloperidol (Haldol), a nonsedating FGA, presents a different EEG profile: it increases alpha 1 and beta 1 power and tends to shift the beta 1 centroid posteriorly (Merlotti et al., 2007; Yoshimura et al., 2007). Clozapine (Clozaril), an SGA, decreases alpha (Hyun et al., 2011; MacCrimmon et al., 2012) while increasing delta and theta power (Knott et al., 2001); reports on beta are inconsistent, with slow beta decreasing and fast beta sometimes increasing. Clozapine is also the antipsychotic most likely to produce EEG abnormalities and epileptiform discharges, and its seizure risk rises with dose and plasma level, which is why the accompanying table grades that association as strong. Excessive clozapine doses can further increase delta and theta power, with theta appearing diffusely (Blume, 2006). Clozapine produces specific topographic changes—marked slowing in frontal, central, and parietal areas—that are distinct from other neuroleptics (Joutsiniemi et al., 2001).
Where dopamine receptor hypersensitivity produces extrapyramidal side effects like tardive dyskinesia, FGAs may cause extended trains of mixed fast/sharp transients, EEG slowing, and potentiation of latent epileptiform activity (J. Gunkelman cited by Thompson & Thompson, 2015). This is particularly relevant for VA and hospital-based clinicians who may encounter clients on long-term antipsychotic regimens.
Benzodiazepines
This section covers the benzodiazepine class—among the most commonly prescribed anxiolytics and sedatives—and their characteristic EEG signatures. Because benzodiazepines produce some of the most recognizable EEG changes of any drug class, this knowledge is directly applicable to your daily clinical practice.

Clinical Presentation
The major benzodiazepine classes include long-acting, intermediate-acting, and short-acting agents, as well as benzodiazepine receptor agonist (BZRA) hypnotics. All benzodiazepines enhance GABA-A receptor activity—the same mechanism described in the ionotropic receptor section above—by binding to an allosteric site that increases the receptor's sensitivity to GABA.
Long-acting agents like diazepam (Valium) can produce ataxia, confusion, depression, dizziness, fatigue, forgetfulness, hallucinations (rare), hyperexcitability, hypotension (rare), mania (rare), nervousness, respiratory depression (overdose with respiratory depressants), sedation, slurred speech, and weakness (Stahl, 2017). Intermediate-acting agents like lorazepam (Ativan) and short-acting agents like alprazolam (Xanax) can produce the same side effects as their long-acting counterparts (Stahl, 2017).
Benzodiazepine receptor agonist (BZRA) hypnotics like zolpidem (Ambien) are nonbenzodiazepine drugs that act at the same receptor site. They can produce amnesia (dose-dependent), ataxia, dizziness, hallucinations (rare), headache, hyperexcitability, nervousness, respiratory depression (overdose with respiratory depressants), and sedation.
EEG Measures
The hallmark EEG signature of benzodiazepines is a reduction in alpha power coupled with an increase in beta power, especially above 20 Hz (high-beta). Benzodiazepines can also reduce the posterior dominant rhythm (PDR) (Demos, 2019). This beta increase is one of the most reliable drug-induced EEG findings and should immediately prompt you to ask about benzodiazepine use when reviewing a client's recording. Benzodiazepines may also increase spindling beta and inhibit epileptiform activity (Bauer & Bauer, 2005; Blume, 2006; Julien et al., 2023; Knott, 2000; Thompson & Thompson, 2015; Van Cott & Brenner, 2003).
Specific agents show consistent patterns. Benzodiazepines like haloxazolam (Somelin), flunitrazepam (Rohypnol), and triazolam (Halcion) increase higher frequency activity in the sigma and beta bands and reduce lower frequency activity in sleep EEG spectra (Tan et al., 2003). Diazepam (Valium) decreases EEG power in the 1–6 Hz, 8–12 Hz, and 19–35 Hz bands and disrupts right intrahemispheric temporal coupling in the 8–12 Hz range (Muñoz-Torres et al., 2011).
Midazolam (Versed) and its active metabolite, alpha-hydroxy-midazolam, increase EEG beta activity and decrease alpha activity in healthy participants, with these changes persisting for hours even at low plasma levels (Hotz et al., 2000). Alprazolam (Xanax) shows a similar pattern, with increased higher frequency activity in the sigma and beta bands and reduced lower frequency activity in sleep EEG spectra (Tan et al., 2003). The persistence of these effects underscores why half-life knowledge matters: even after a client reports feeling "normal," benzodiazepine-related EEG changes may still be present.
CNS Stimulants
This section covers central nervous system stimulants, including amphetamines and nonamphetamine agents like methylphenidate. These drugs are especially relevant for practitioners who work with ADHD populations, athletes in performance optimization programs, or military personnel undergoing cognitive enhancement protocols.

Clinical Presentation
The two main classes of CNS stimulants are amphetamines and nonamphetamine behavioral stimulants. Amphetamines like amphetamine D, L (Adderall) can produce adverse cardiovascular effects, cardiac arrhythmia, dizziness, headache, hypertension, hypomania, insomnia, irritability, mania, nervousness, overstimulation, psychotic episodes, sexual dysfunction (long-term), suicidality, and worsened tics (Stahl, 2017). Nonamphetamine behavioral stimulants like methylphenidate (Ritalin) can produce a largely similar profile, including adverse cardiovascular effects, cardiac arrhythmia, dizziness, headache, hypertension, hypomania, insomnia, irritability, mania, nervousness, overstimulation, priapism (rare), psychotic episodes, suicidality, and worsened tics (Stahl, 2017).
EEG Measures
Amphetamine (Adderall) reduces total power and absolute delta, theta, alpha, and beta power (Saletu et al., 2010). Dexamphetamine (Dexedrine) and methylphenidate (Ritalin) produce a more specific pattern: reduced theta and increased beta power (Clarke et al., 2002). Clarke and colleagues tested dexamphetamine and methylphenidate; lisdexamfetamine (Vyvanse) is a later prodrug of dexamfetamine that was not approved until 2007 and was not studied here. Methylphenidate also reduces delta and theta power while increasing posterior alpha and low beta power for up to 6 hours following administration (Blume, 2006; Thompson & Thompson, 2015).
Additional methylphenidate effects include decreased EEG mu power in the right primary motor cortex during motor imagery and execution tasks, compared to risperidone (Aprigio et al., 2021). Methylphenidate also effectively increases the P3 ERP response in ADHD subjects, potentially reducing mental fatigue-related decreases in response time (Rubinson et al., 2019). These ERP findings are particularly relevant for clinicians conducting P300-based assessments in ADHD populations.
A crucial insight for clinical practice: a client's baseline level of arousal modulates their EEG response to stimulants. Stimulants increase alpha power in under-aroused clients, decrease alpha power in typically aroused clients, and do not alter alpha in anxious (fast-EEG) clients (J. Gunkelman, cited by Thompson & Thompson, 2015). This means the same drug can produce opposite EEG effects depending on the client's neurophysiological starting point—a finding with direct implications for interpreting qEEG data in stimulant-medicated individuals.
Mood Stabilizers
This section covers mood stabilizers—a diverse group of medications used to treat bipolar disorder, seizure disorders, and aggression. Because this class includes everything from lithium to anticonvulsants to omega-3 fatty acids, their EEG effects vary considerably, and you should expect to encounter many of these agents across clinical settings.

Clinical Presentation
The major mood stabilizer classes include lithium, first-generation anticonvulsants, second-generation anticonvulsants, atypical antipsychotics, and omega-3 fatty acids. Lithium can produce arrhythmia, ataxia, bradycardia, cardiovascular changes, delirium, forgetfulness, hypotension, and lithium toxicity (Stahl, 2017).
First-generation anticonvulsants like phenobarbital (Luminal) can produce aggression, confusion, depression, dizziness, drowsiness, excitement, forgetfulness, hallucinations (rare), headache, insomnia, nightmares, and respiratory depression (in overdose or with other CNS depressants) (Stahl, 2017). Second-generation anticonvulsants like valproate (Depakene) can produce ataxia, bradycardia, dizziness, headache, sedation, suicidality, tachycardia, and weakness (Stahl, 2017).
Atypical antipsychotics used as mood stabilizers, like olanzapine (Zyprexa), can produce death and stroke in elderly with dementia-related psychosis, diabetes, dizziness, neuroleptic malignant syndrome (rare), orthostatic hypotension, pain (back, chest, extremity, joint), sedation, seizures (rare), and tardive dyskinesia (rare) (Stahl, 2017). Omega-3 fatty acids do not produce significant side effects that would affect clinical presentation.
EEG Measures
Carbamazepine (Tegretol) decreases alpha (Marciani et al., 1992) and increases delta, theta (Wu & Xiao, 1996), and beta power (Marciani et al., 1992). Carbamazepine and lamotrigine, both sodium-channel blockers, alter gamma power in the 50–60 Hz range, while valproate affects gamma power in the 30–40 Hz range (Arzy et al., 2010). Read the 50–60 Hz finding cautiously, since that window straddles mains frequency in both Europe and North America and is therefore vulnerable to line-noise contamination. Gabapentin (Neurontin) increases delta and theta power and decreases alpha power, with inconclusive effects on beta (Saletu et al., 1986). Lamotrigine (Lamictal) decreases delta and theta power (Clemens et al., 2008; Wu & Xiao, 1996). Neufeld and colleagues (1999) report a different direction, finding a diffuse increase in relative alpha and beta with decreases in relative theta and delta, that is, an overall shift toward faster frequencies.
Lithium can cause generalized asynchronous slowing that reduces the peak alpha frequency. It may increase delta, theta, alpha, and beta power (Heninger, 1978) and greatly potentiate latent epileptiform activity. High lithium doses may produce bisynchronous spikes or polyspikes and increase delta and theta power, with theta appearing diffusely (Blume, 2006). Lithium toxicity dramatically slows the EEG and causes triphasic discharges (Thompson & Thompson, 2015)—a critical warning sign that should prompt immediate medical referral.
Oxcarbazepine (Trileptal) decreases alpha power (Clemens et al., 2006), though data on its effects on other bands remain limited. Phenobarbital (Luminal) can induce rhythmic 18–26 Hz activity starting frontally and progressively extending across the cortex. Higher doses promote EEG slowing and reduced beta activity until slow-wave activity eclipses beta, and voltage can decrease until the brain enters an iso-electric state resembling a medically induced coma (Blume, 2006; Thompson & Thompson, 2015). Barbiturate withdrawal may increase beta activity, and pentobarbital (Nembutal) intoxication can result in triphasic waves.
Topiramate (Topamax) increases delta and theta and decreases alpha power (Mecarelli et al., 2001), while also increasing absolute beta and theta activity diffusely and decreasing relative alpha over the left hemisphere (Neufeld et al., 1999). Valproate (Depakote) decreases alpha (Clemens et al., 2014; Guo et al., 2014) and increases beta power (Clemens et al., 2014). Vigabatrin (Sabril) decreases absolute alpha and beta activity and decreases absolute theta in the frontal and parieto-occipital regions (Neufeld et al., 1999). Neurotoxicity from high antiepileptic drug levels may cause diffuse delta and increased theta power, and valproic acid (Depakene) intoxication can produce triphasic waves (Blume, 2006). Antiepileptic drug reduction may increase the frequency of focal spikes or spike waves (Blume, 2006).
Omega-3 fatty acids behave very differently from the other agents in this section. Unlike lithium and the anticonvulsants, they do not impose a characteristic resting pharmaco-EEG signature on the recording, so they are unlikely to confound qEEG band interpretation the way prescription psychotropics do. Their measurable effects appear instead in event-related potentials and cognition. In healthy adults, 35 days of supplementation increased the amplitude of the contingent negative variation and the P300 and shortened reaction times during attention tasks (Fontani et al., 2005). Lower blood levels of long-chain omega-3 fatty acids are associated with poorer cognitive performance and behavior in children (Montgomery et al., 2013), and supplementation can reduce inattention symptoms in boys with and without ADHD (Bos et al., 2015). One proposed mechanism is that omega-3 fatty acids, together with vitamin D, help regulate the synthesis and action of serotonin (Patrick & Ames, 2015).
Opioid Analgesics
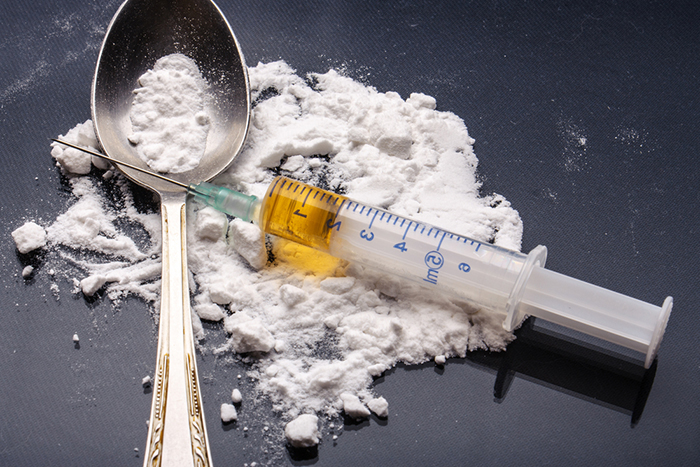
This section covers opioid analgesics—drugs prescribed for pain management that are frequently encountered in VA, hospital, and rehabilitation settings. Their EEG effects are dose-dependent and can range from subtle alpha changes to profound slowing that resembles a barbiturate-induced coma.
Clinical Presentation
The major opioid analgesic classes include pure agonists, partial agonists, and mixed agonist-antagonists. Pure agonists like morphine (MS-IR) produce maximal analgesia and can cause agitation, confusion, dizziness, drowsiness, hallucinations, respiratory depression, and weakness (Advokat et al., 2019).
Partial agonists like buprenorphine (Subutex) produce less-than-maximal analgesia and can cause headache, insomnia, mood swings, orthostatic hypotension, respiratory depression, and sedation (Advokat et al., 2019; Stahl, 2017). Mixed agonist-antagonists like pentazocine (Talwin) combine agonist activity at one receptor type with antagonist activity at another and can produce confusion (rare), depression, double vision (rare), drowsiness, excitement, insomnia, irregular heartbeat, irritability, sleepiness, very slow or very rapid breathing, and weakness (Advokat et al., 2019).
EEG Measures
Immediately after morphine administration, during the euphoric high, alpha power increases and the peak alpha frequency slows. Delta and theta power may also increase, along with time spent in REM sleep (Malver et al., 2014). As the dose increases, EEG slowing progresses and may ultimately reach an iso-electric state resembling a barbiturate-induced coma (Thompson & Thompson, 2015). This dose-dependent progression illustrates why monitoring opioid-medicated clients requires awareness of both the specific drug and its current dose.
Opioids such as remifentanil (Ultiva) and fentanyl (Duragesic) increase delta band power (0.5–4 Hz) during wakefulness and analgesia (Garcia et al., 2021; Graversen et al., 2015). Remifentanil also decreases theta (4–8 Hz) and alpha (8–13 Hz) band power, and these changes correlate with its analgesic effects (Garcia et al., 2021; Graversen et al., 2015). For clinicians working in pain management, these frequency-specific changes may serve as objective markers of opioid efficacy alongside subjective pain ratings.
Recreational Drugs
The sections that follow cover substances your clients are likely to use outside of a prescription, whether for stimulation, relaxation, or recreation. Caffeine and nicotine are legal and ubiquitous, alcohol is woven into daily life, and cannabis is now available in many jurisdictions, while cocaine remains a common drug of misuse. Each leaves a measurable trace on the EEG, and because clients rarely volunteer this information, knowing the typical signatures helps you ask the right questions and avoid attributing a substance effect to underlying brain function.
Caffeine
This section covers caffeine—the world's most widely consumed psychoactive substance and a drug that virtually every client uses to some degree. Because caffeine produces measurable EEG changes that can complicate your assessments, it is important to know its effects and to establish standardized intake protocols before recording sessions.

Clinical Presentation
Caffeine is an adenosine receptor antagonist that increases alertness and reduces fatigue. In vulnerable individuals, caffeine can promote anxiety and nervousness, cardiac arrhythmia, hypertension, and insomnia (Advokat et al., 2019). Because caffeine is so ubiquitous, its effects on the EEG are often overlooked—yet even a single cup of coffee can alter the recording you are about to make.
EEG Measures
Caffeine reduces delta power under resting conditions (Dimpfel et al., 1993; Pollock et al., 1981) and acutely reduces theta and alpha power, with rebound increases in these bands as the drug wears off (Thompson & Thompson, 2015). Decreased theta activity (5–8 Hz) occurs during both wakefulness and sleep deprivation, under relaxed conditions and during mental tasks (Landolt et al., 2004; Pollock et al., 1981).
Caffeine leads to a global reduction in alpha power (8–14 Hz) and an increase in alpha frequency, indicating heightened arousal (Barry et al., 2005; Foxe et al., 2012). This effect is more pronounced with eyes open compared to eyes closed (Siepmann & Kirch, 2002). Caffeine also diminishes the absolute power of slow and fast alpha and slow beta activities across various brain regions (Siepmann & Kirch, 2002).
Caffeine increases beta power (12–40 Hz) in frontal and central brain areas, particularly in sleep-deprived individuals (Drapeau et al., 2006; Patat et al., 2000). In summary, caffeine pushes the EEG toward a faster, lower-amplitude profile—which means that an uncontrolled morning coffee could make an under-aroused client appear normally aroused on a qEEG assessment.
Cannabis
This section covers the EEG effects of cannabis, a substance your clients may use medicinally or recreationally. With expanding legalization across many jurisdictions, cannabis use is increasingly common and increasingly relevant to your clinical practice.

Clinical Presentation
Cannabis can produce increased blood pressure and heart rate; cerebral artery constriction; impaired attention, coordination, memory, perception, and reaction time; mild euphoria; reduced anxiety; and relaxation. At very high doses, it can produce acute depressive reactions, panic attacks, and mild paranoia. At massive doses, it can cause altered sensory perception, confusion, delusions, depersonalization, disorientation, hallucinations, and paranoia (Advokat et al., 2019).
EEG Measures
Cannabis users exhibit decreased delta power during resting states, which indicates increased cortical activation and potential disinhibition of inhibitory function (Prashad et al., 2018). Cannabis intake also disrupts theta oscillations, with decreased theta power reported alongside impaired working memory and attentional performance (Böcker et al., 2010; Ilan et al., 2004). Morrison and colleagues (2011) report a related but distinct finding: intravenous THC reduced inter-frontal theta coherence rather than theta power, and the reduction correlated with positive psychotic symptoms. These theta changes are clinically meaningful because working memory impairment is one of the most consistent cognitive complaints among cannabis users.
Cannabis acutely increases frontal alpha and chronically promotes frontal interhemispheric connectivity, manifesting as hypercoherence—abnormally high functional connectivity between two sites—and phase synchrony (Thompson & Thompson, 2015). THC has dose-dependent effects on beta power, with higher doses leading to increased beta activity that may reflect muscle artifact or heightened arousal (Böcker et al., 2010; Volavka et al., 1971). Chronic cannabis users also exhibit elevated beta power during resting states (Prashad et al., 2018).
Cannabis disrupts gamma oscillations, particularly during tasks requiring complex perceptual processing such as coherent motion perception. Reduced gamma power is associated with perceptual alterations and may contribute to the cognitive impairments observed in heavy cannabis users (Skosnik et al., 2014). For neurofeedback practitioners, the combination of theta disruption, frontal hypercoherence, and gamma impairment in cannabis users presents a complex assessment picture that requires careful interpretation.
Cocaine
This section covers cocaine's effects on clinical presentation and EEG, including withdrawal-related changes that may persist long after active use has stopped.

Clinical Presentation
Cocaine blocks the reuptake of dopamine, norepinephrine, and serotonin, producing increased blood pressure, heart rate, and temperature; increased alertness and energy; reduced fatigue; mood elevation; and insomnia. Mild depression can occur during withdrawal. Higher plasma levels can be associated with agitation, anxiety, impulsivity, suspiciousness, paranoia, and paranoid psychosis; repetitive behavior; and cardiac arrhythmias, cardiorespiratory arrest, and strokes (Advokat et al., 2019).
EEG Measures
Cocaine decreases delta and theta power while increasing alpha and beta power (Bauer & Bauer, 2005; Herning et al., 1985). It specifically enhances alpha power in the frontal and temporal regions (Herning et al., 1994) and significantly increases beta power in the frontal and central areas (Herning et al., 1994, 1985; Noldy et al., 1994). This shift toward faster frequencies is consistent with cocaine's stimulant properties.
During cocaine withdrawal, there is a significant decrease in beta-2 power, indicating long-term neuroadaptive changes that are especially pronounced in intravenous users (Noldy et al., 1994). For clinicians in substance use treatment settings, this withdrawal-related beta decrease may help distinguish acute intoxication from early recovery in your EEG assessments.
Ethanol
This section covers ethanol—a drug with unique pharmacokinetic properties (recall that it is the principal common substance eliminated by zero-order rather than first-order kinetics) and EEG effects that are relevant to both acute intoxication and chronic alcohol use disorder.

Clinical Presentation
Ethanol can produce short-term psychological effects including aggressiveness and violence; behavioral disinhibition; impaired attention, memory, motor coordination, and problem-solving; reduced anxiety and fear; respiratory depression; seizure following abrupt withdrawal; shortsightedness and tunnel vision; and slowed perceptual speed (Advokat et al., 2019). As discussed earlier, ethanol acts as a positive allosteric modulator at GABA-A receptors, enhancing inhibitory neurotransmission.
EEG Measures
Ethanol significantly affects EEG activity at anterior sites, causing increased activity in the slow alpha frequency band (Cohen et al., 1993). Individuals diagnosed with alcohol use disorder or who are vulnerable to developing this disorder frequently present with elevated beta (greater than 20 Hz, particularly between 24–26 Hz) and decreased 6–10 Hz and alpha power (Thompson & Thompson, 2015). This elevated beta pattern in chronic alcohol users is thought to reflect a neuroadaptive response to prolonged GABA enhancement and is one of the most well-established EEG biomarkers in the addictions literature.
An alternate perspective holds that a decrease in 6–10 Hz activity and overall alpha power precedes, and may predispose individuals to, alcohol use disorder. In this view, alcohol acts as self-medication because it increases slower-frequency activity while reducing faster-frequency activity.
Alcohol withdrawal may increase beta activity, spikes, and polyspikes (Blume, 2006). These withdrawal-related EEG changes can persist for weeks and have direct implications for neurofeedback protocols: training to reduce beta in a recently detoxified client may be working with, rather than against, the brain's natural recovery process.
Nicotine
This section covers nicotine, a stimulant drug whose EEG effects share features with caffeine. Understanding these effects is important because many clients use nicotine products, and its impact on EEG recordings may be underappreciated.

Clinical Presentation
Nicotine is an acetylcholine receptor agonist that increases alertness and may improve cognitive performance in smokers (and possibly nonsmokers). Side effects include dizziness and headache. Nicotine withdrawal may result in anxiety, depression, and insomnia. Tobacco tars, rather than nicotine itself, carry most of the carcinogens responsible for smoking-related cancers (Advokat et al., 2019). Cardiovascular risk is a separate matter: it arises from oxidizing chemicals, carbon monoxide, and particulates together with nicotine's own sympathomimetic effects on heart rate, blood pressure, and myocardial oxygen demand, so nicotine is not exonerated cardiovascularly.
EEG Measures
Like caffeine, nicotine acutely reduces theta and alpha power with rebound increases in these bands as the drug clears the system (Pickworth et al., 1986; Thompson & Thompson, 2015). Nicotine increases beta band power, which is associated with increased alertness and cognitive processing (Lindgren et al., 1999; Pickworth et al., 1986). This parallel with caffeine is not coincidental—both drugs enhance arousal through different receptor mechanisms but produce overlapping EEG signatures.
More specifically, nicotine reduces power in the 12.5–18.4 Hz band in the left middle frontal gyrus during eyes-open conditions. During eyes-closed conditions, nicotine reduces power across 8.5–18.4 Hz in areas spanning the superior frontal gyri to the supplementary motor areas (Ranzi et al., 2016). These regional differences suggest that nicotine's EEG effects are not uniform across the scalp, which is relevant for practitioners who use site-specific protocols.
Clinical Issues
This section addresses scope-of-practice considerations that apply to all biofeedback and neurofeedback practitioners, regardless of clinical setting. Whether you work in a VA hospital, a sports performance center, or a private clinic, understanding the boundaries of your role in medication discussions is essential for ethical practice.
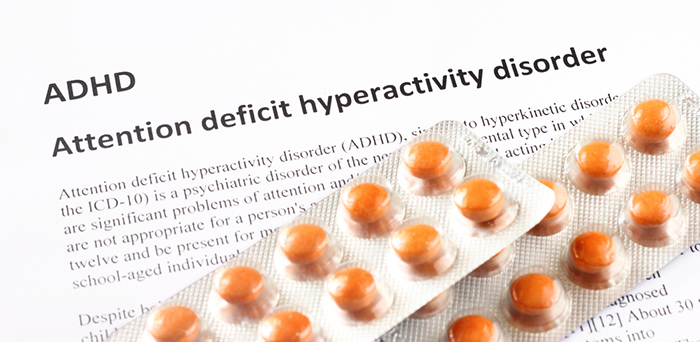
Clinicians must understand their scope-of-practice restrictions when discussing medication issues with clients. Clients often seek alternative treatments, including neurofeedback, when medication management is ineffective or produces undesirable side effects. In many cases, medications are prescribed for presenting symptoms related to atypical causal factors that a standard psychiatric evaluation may not have identified.
A careful and comprehensive assessment—including qEEG and other physiological measures—may reveal a more appropriate treatment approach. In the best-case scenario, neurofeedback may address underlying causal factors, resulting in general improvement and a reduced need for further medication. However, this potential should be communicated cautiously and always within the limits of your professional license.
Recommended Medication Management Approaches
This section provides practical guidance for navigating medication-related conversations with clients and prescribing physicians. These approaches will help you maintain ethical boundaries while supporting your client's overall treatment plan.
Begin by discussing the scope and limitations of your professional license and your ability to address medication issues. Then review your client's plans regarding their current medications: Do they plan to continue current prescriptions? If not, have they consulted with their prescribing physician? These initial conversations set the foundation for a collaborative treatment relationship.
If a client wishes to decrease or eliminate medications, their best course of action is to discuss adjustments with their prescribing physician. If they wish to proceed without physician consultation, clearly explain your limitations and ethical concerns about proceeding with neurofeedback training under these circumstances. Medications may need adjustment as neurofeedback changes brain function, and the clinician or client must interact with the prescribing physician regarding these changes. Standardized instruments like the Beck Depression Inventory and Computerized Continuous Performance Test can provide objective data to help inform the physician's decision.
Wherever possible, involve your client in the communication process with their prescriber, since physicians may not always welcome your direct involvement in medication decisions. Clients often find it easier to discuss changes with their prescribing physician when equipped with accurate, objective information from their neurofeedback assessments.
Drug Implications for Assessment and Neurofeedback
This section synthesizes the chapter's core practical message: how to integrate pharmacological knowledge into your assessment and training workflow. These principles apply to every drug class covered in this chapter.
When interpreting your initial assessment battery and subsequent reassessment testing, always take drug effects into account. Develop training goals based on initial testing with the client on their current medication. When retesting, maintain the same medication conditions unless a drug has been withdrawn, to ensure a valid comparison across time points.
The single most important clinical rule from this chapter is this: develop a personalized neurofeedback training strategy that does not train against a drug's principal effects on the EEG. If a benzodiazepine is elevating your client's beta activity, training to suppress beta would work directly against the drug's mechanism, a strategy unlikely to succeed and one that may produce adverse effects. Instead, design your protocol around EEG features that the drug's pharmacological signature does not dominate.
Equally important, maintain regular communication with the client and prescribing physician to determine whether neurofeedback training has altered the client's medication response and whether a change in medication may be warranted. Dosage based on initial findings or manufacturer's recommendations may no longer apply once the client's system begins to modulate in response to training.
Glossary
activation: Duffy's historical construct for organismic arousal or mobilization, inferred from behavior and physiological activity rather than equated with a single neural system.
acute effects: immediate or short-term physiological or psychological effects of a drug following administration.
affinity: the strength of binding between a drug and its receptor, determining how well the drug will bind to its target.
agonist: a muscle that provides the principal force for a specified movement at a joint.
allosteric site: a secondary binding location on a receptor, separate from the orthosteric site, where a ligand attaches to enhance or reduce the receptor's response to its neurotransmitter.
alpha blocking: the attenuation or disappearance of posterior alpha activity with eye opening, sensory stimulation, movement, or active cognitive processing.
alpha rhythm: an 8 to <13 Hz EEG rhythm dominant posteriorly during relaxed wakefulness with eyes closed and attenuated by eye opening.
alpha spindles: waxing-and-waning bursts of alpha-frequency EEG activity.
amphetamines: a class of CNS stimulants, such as amphetamine D, L (Adderall), that increase the release and block the reuptake of dopamine and norepinephrine to heighten arousal and attention.
amplitude: the magnitude of a signal's excursion from a specified reference level, reported using a stated convention such as peak, peak-to-peak, or RMS.
antagonist: a muscle that opposes or controls the action of an agonist at a joint.
anterior: toward the front of the body or, in the head, toward the face.
anterior cingulate cortex (ACC): medial frontal cortex involved in cognitive control, motivation, affect, pain processing, and autonomic regulation, with functionally heterogeneous subdivisions.
arousal: a multidimensional state of wakefulness, alertness, and physiological activation supported by distributed brainstem, hypothalamic, and forebrain systems.
asynchronous EEG activity: EEG activity produced when neuronal populations fluctuate with relatively little temporal alignment, usually yielding lower-amplitude, faster-appearing signals.
benzodiazepine receptor agonist (BZRA) hypnotics: a class of sedative-hypnotic drugs acting at the benzodiazepine site of the GABA-A receptor, comprising benzodiazepines and the nonbenzodiazepine Z-drugs such as zolpidem (Ambien), prescribed for insomnia.
beta rhythm: a 13 to <30 Hz EEG rhythm, usually low amplitude, associated with alert wakefulness and active cognitive or motor processing.
bilateral synchronous slow waves: high-amplitude slow waves appearing simultaneously over both hemispheres, normal in drowsy children (hypnagogic hypersynchrony) but, in alert adults, a nonspecific, nonlocalizing sign of diffuse encephalopathy.
caffeine: the world's most widely consumed psychoactive substance, an adenosine receptor antagonist that increases alertness, reduces fatigue, and shifts the EEG toward faster, lower-amplitude activity.
cannabis: a psychoactive plant whose principal compound, THC, acts at cannabinoid receptors to alter perception, memory, and mood. On the EEG it decreases delta and theta power, increases frontal alpha and interhemispheric hypercoherence, and disrupts gamma activity.
cerebral cortex: the layered gray matter covering the cerebral hemispheres and supporting perception, action, cognition, language, memory, and conscious experience.
chronic effects: long-term physiological or psychological effects that occur with prolonged use of a drug.
cocaine: a stimulant that blocks the reuptake of dopamine, norepinephrine, and serotonin, increasing alpha and beta power while decreasing delta and theta power.
continuous irregular delta activity: persistent, irregular delta-frequency EEG activity; interpretation depends on distribution, reactivity, state, and clinical context.
delta rhythm: a 0.5 to <4 Hz EEG rhythm in the tutorial convention, prominent during N3 sleep and potentially abnormal when focal or excessive in awake adults.
diphasic wave: a waveform containing two phases of opposite polarity relative to baseline.
dominant frequency: the frequency with the greatest specified amplitude or power within a signal or spectrum.
downregulation: the decrease in receptor number or sensitivity due to prolonged exposure to an agonist, leading to reduced response.
drug: a chemical substance used to diagnose, treat, or prevent disease, or to relieve symptoms.
dual-action antidepressant: an older, nonspecific term for an antidepressant affecting two principal monoamine systems or mechanisms; the exact pharmacology must be stated for each drug.
EEG activity: electrical activity represented in an EEG recording, described by frequency, amplitude, morphology, distribution, timing, and reactivity.
EEG coherence: the consistency of the phase relationship between two sites within a frequency band, expressed as a squared correlation coefficient ranging from 0 to 1. Coherence measures constancy of phase, not shared amplitude change, which is co-modulation.
EEG complex: a sequence of two or more distinguishable EEG waves with a characteristic morphology.
EEG power: the squared amplitude of EEG activity quantified over time or frequency, expressed as µV² for band power or µV²/Hz for power spectral density.
electroencephalogram (EEG): a recording of voltage differences at scalp electrodes produced mainly by summed postsynaptic currents in aligned cortical pyramidal neurons.
elimination half-life: the time required for the concentration of a drug in the bloodstream to decrease by half.
encephalopathy (EEG pattern): generalized slowing of cortical electrical activity reflecting a systemic disturbance in cortico-subcortical communication, with the posterior dominant rhythm typically falling below 8 Hz and losing reactivity to stimuli. It is an EEG biomarker rather than a diagnosis.
ethanol: the alcohol in beverages, a positive allosteric modulator at GABA-A receptors that depresses central nervous system activity and is eliminated by zero-order rather than first-order kinetics.
evoked potential: an event-related potential elicited by a controlled sensory stimulus and extracted from EEG by time-locked averaging across repeated trials.
fast cortical potentials: conventional oscillatory EEG activity above the slow-cortical-potential range, encompassing frequency components commonly analyzed from approximately 1 Hz upward.
first-generation anticonvulsants: older antiseizure medications introduced before 1990, such as phenobarbital, phenytoin, carbamazepine, and valproate, several of which also serve as mood stabilizers.
first-generation antipsychotics (FGAs): older dopamine D2 receptor antagonists, such as chlorpromazine and haloperidol, that reduce the positive symptoms of schizophrenia and carry high extrapyramidal side-effect risk.
focal EEG activity: EEG activity restricted to a limited scalp region, suggesting a localized field but not by itself identifying a lesion.
focal EEG slowing: excess theta or delta activity localized to one region, indicating focal cerebral dysfunction but not a specific cause.
focal slowing (FS): slow-wave activity, typically delta (1-4 Hz) or theta (4-7 Hz), confined to one brain region and indicating localized cerebral dysfunction.
frequency: the number of complete cycles of a periodic phenomenon per unit time, expressed in hertz for cycles per second.
frequency synchrony: simultaneous occurrence of oscillatory activity at the same frequency at two or more recording sites, without necessarily implying phase locking.
frontal intermittent rhythmic delta activity (FIRDA): a waxing-and-waning pattern of rhythmic delta waves appearing intermittently over the frontal regions, termed frontally predominant generalized rhythmic delta activity under current ACNS terminology; it most often signals metabolic encephalopathy.
frontal lobe: either cerebral lobe anterior to the central sulcus, involved in motor control, executive functions, language, motivation, and social behavior.
full agonist: a drug that binds a receptor and produces the maximum response that receptor can generate, as morphine does at the mu opioid receptor.
G-protein-coupled receptor (GPCR): a seven-transmembrane cell-surface receptor that, when a ligand binds, activates an associated G protein to trigger intracellular second-messenger cascades.
gamma rhythm: EEG activity from 30 to <80 Hz under the tutorial's working convention, associated with local cortical processing and vulnerable to muscle artifact.
generalized EEG slowing: diffuse excess slow activity across the scalp that may occur with drowsiness or reflect widespread cerebral dysfunction, depending on age and state.
generalized periodic discharges (GPDs): repetitive, broadly distributed epileptiform-appearing waveforms that recur at regular intervals, often with a triphasic morphology. They are common in toxic and metabolic encephalopathies and require clinical correlation rather than a presumption of epilepsy.
hertz (Hz): the SI unit of frequency equal to one cycle per second.
hyperammonemic encephalopathy: a metabolic encephalopathy caused by elevated blood ammonia, classically from liver failure or as an adverse effect of valproate, that slows the EEG and can produce triphasic waves.
hypercoherence: excessive coupling between cortical regions, reflecting a failure to activate them selectively, which may interfere with multitasking and rapid decision making.
intermediate-acting benzodiazepines: benzodiazepines like lorazepam (Ativan) with mean elimination half-lives of roughly 6-24 hours, prescribed to manage anxiety. Cutoffs vary by source.
inverse agonist: a drug that binds a receptor and reduces its activity below the resting baseline, producing the opposite effect of an agonist.
ionotropic receptor: a ligand-gated ion channel that changes membrane conductance when an extracellular transmitter binds.
irregular EEG activity: successive EEG waves that vary substantially in frequency, amplitude, or morphology.
irreversible MAO inhibitors (MAOIs): MAOIs like selegiline (Emsam) that form permanent bonds with the MAO enzyme and are prescribed for major depressive disorder (MDD).
isolated epileptiform discharges (IEDs): brief, abnormal, paroxysmal spikes or sharp waves that stand out from the background EEG, typically last less than a second, and occur singly in people without clinical seizures.
kappa rhythm: a rare alpha-range EEG rhythm maximal over the temporal regions, often most evident in contralateral temporal derivations during cognitive activity.
lambda wave: a positive occipital transient occurring during visual scanning and time-locked to saccadic eye movements.
Laplacian montage: a spatially filtered EEG montage comparing each electrode with a weighted average of nearby electrodes to emphasize local radial activity.
lateralized EEG activity: EEG activity occurring predominantly over one hemisphere or side of the scalp; significance depends on state, pattern, and clinical context.
ligands: molecules that bind to specific sites on a target protein, such as receptors, to exert their biological effect.
local synchrony: synchrony that occurs when the coordinated firing of cortical neurons produces high-amplitude EEG signals.
long-acting benzodiazepines: benzodiazepines like diazepam (Valium) with mean elimination half-lives longer than about 24 hours, often 20-100 hours once active metabolites are counted, prescribed to manage anxiety.
metabotropic receptor: a receptor that influences intracellular signaling indirectly, commonly through G proteins or enzymes, rather than forming an ion channel.
mixed opioid agonist-antagonists: drugs like pentazocine (Talwin) that are kappa agonists and weak mu antagonists that are prescribed for the management of pain.
monoamine oxidase (MAO): a mitochondrial enzyme family that oxidatively deaminates monoamines; MAO-A and MAO-B differ in substrates and tissue distribution.
monoamine oxidase inhibitor (MAOI): a medication that inhibits MAO-A, MAO-B, or both, thereby increasing availability of selected monoamines.
monomorphic EEG activity: successive EEG waves with relatively uniform morphology and frequency.
monophasic wave: a waveform containing a single deflection of one polarity relative to baseline.
mu rhythm: an 8 to <13 Hz arch-shaped or wicket-like EEG rhythm over central sensorimotor regions that attenuates with movement or somatosensory activation.
multiple-spike-and-slow-wave complex: an EEG complex containing two or more spikes associated with one or more slow waves.
neuromodulation: alteration of nervous-system activity through chemical, electrical, magnetic, optical, or other targeted influences.
neurotransmitter reuptake: removal of released neurotransmitter from extracellular space by transporters in presynaptic terminals or surrounding cells.
nicotine: a nicotinic acetylcholine-receptor agonist that produces dependence and acutely alters autonomic, cardiovascular, and attentional function.
nonamphetamine behavioral stimulants: CNS stimulants, such as methylphenidate (Ritalin), that increase catecholamine signaling without the amphetamine structure and are prescribed to treat ADHD.
nonconvulsive status epilepticus (NCSE): a prolonged seizure state that disturbs consciousness or behavior without overt convulsions and can be identified only on EEG. It may be precipitated by toxic and metabolic states or by withdrawal from sedatives or antiseizure medications.
omega-3 fatty acids: essential polyunsaturated fatty acids used as adjunctive mood stabilizers that support neuronal membrane function and serotonergic signaling. They leave no strong resting-EEG signature but can increase event-related potential amplitudes.
orthosteric site: a receptor's primary binding location, where its native neurotransmitter attaches.
partial agonist: a drug that binds a receptor but produces a submaximal response regardless of dose, so it can either raise or lower signaling depending on the surrounding level of neurotransmitter.
partial opioid agonists: opioid drugs that bind mu receptors but produce a submaximal effect, such as buprenorphine (Subutex), used to treat pain and opioid use disorder.
peak alpha frequency (PAF): the frequency of greatest amplitude within the alpha band (8 to <13 Hz) during an epoch.
pharmaco-EEG: the study of how drugs change quantitative EEG measures, used to characterize a drug's central nervous system effects and to classify psychotropic agents by their electrophysiological signatures.
pharmacodynamics: the study of the biochemical and physiological effects of drugs and their mechanisms of action in the body.
phase: the position of a periodic signal within its cycle, usually expressed in degrees or radians relative to a reference.
phase synchrony: a stable phase relationship between two oscillatory signals over time, which need not involve zero phase lag or coincident peaks and valleys.
polyphasic wave: a waveform containing multiple deflections that cross baseline and alternate polarity.
polyspikes: two or more spikes occurring in a row with no interdischarge interval, lasting less than 0.5 seconds under ACNS terminology.
posterior: toward the back of the body or an anatomical structure.
posterior dominant rhythm (PDR): the dominant occipital rhythm during relaxed wakefulness with eyes closed, usually in the alpha range in healthy adults and attenuated by eye opening.
psychoactive drugs: substances that affect the central nervous system, altering brain function and resulting in changes in perception, mood, consciousness, cognition, or behavior.
psychopharmacology: the study of the use of medications in treating mental disorders, focusing on the effects of psychoactive drugs on mood, sensation, thinking, and behavior.
pure opioid agonists: opioids such as morphine that fully activate mu-opioid receptors, producing dose-dependent analgesia with no ceiling effect, unlike partial or mixed agonist-antagonists.
second messenger: an intracellular signaling molecule produced within the cell in response to receptor activation, which amplifies and propagates the signal inside the cell.
second-generation anticonvulsants: newer antiseizure medications introduced since the 1990s, such as lamotrigine, levetiracetam, and topiramate, some used as mood stabilizers, with EEG effects that vary by mechanism of action.
second-generation antipsychotics: antipsychotic drugs such as clozapine (Clozaril) with a high 5-HT2A-to-D2 affinity ratio and faster D2 dissociation than first-generation agents, which lowers extrapyramidal side-effect risk.
selective norepinephrine reuptake inhibitors (NRIs): drugs such as atomoxetine (Strattera) that selectively block norepinephrine reuptake and are approved for ADHD. The abbreviation SNRI conventionally denotes serotonin-norepinephrine reuptake inhibitors and should not be used for this class.
selective serotonin reuptake inhibitor (SSRI): a medication that preferentially inhibits the serotonin transporter and increases extracellular serotonin signaling.
sharp transient: a sharply contoured EEG waveform distinguishable from background activity but not necessarily epileptiform.
sharp wave: an epileptiform transient with a pointed peak and duration of approximately 70 to 200 ms under standard EEG display conditions.
short-acting benzodiazepines: benzodiazepines like triazolam (Halcion) with mean elimination half-lives shorter than about 6 hours, prescribed to manage anxiety and insomnia.
sleep spindle: a waxing-waning 11 to 16 Hz burst lasting approximately 0.5 to 2 seconds, maximal over central regions and characteristic of N2 sleep.
specificity (diagnostic testing): the probability that a test result will be negative when the condition is actually absent; a highly specific test produces few false positives.
spike: a transient with a pointed peak and a 20 to under 70 ms duration.
spike-and-slow-wave complex: an epileptiform EEG complex consisting of a spike followed by an associated slow wave; repetition frequency varies by syndrome and state.
spindling excessive beta (SEB): an EEG pattern of fast beta activity with a spindle-like appearance and an anterior emphasis, with a reported mean frequency of 20.6 Hz (SD = 4.1 Hz) spanning roughly 14-30 Hz.
steady state: the condition reached after roughly five half-lives of regular dosing, in which the drug absorbed with each dose balances the amount eliminated, producing a stable plasma concentration and a reproducible EEG signature.
synchronous: occurring at the same time or with a consistent temporal relationship.
synchrony (EEG): coordinated timing of neuronal or EEG activity, which may refer to amplitude covariation, frequency alignment, or phase relationships and therefore requires a stated metric.
therapeutic equivalence: the property of drugs that produce comparable clinical effects despite differing chemical structures, and that tend to produce similar EEG changes. In regulatory usage the term denotes interchangeable products containing the same active ingredient.
theta rhythm: a 4 to <8 Hz EEG rhythm associated with drowsiness and sleep transitions and, depending on location and task, memory and cognitive processing.
theta-delta fusion pattern: an EEG background in which a slowed posterior dominant rhythm in the theta range blends continuously with lower-frequency delta activity across widespread regions. It typically follows diffuse axonal injury and can be mistaken for drowsiness or medication effects.
third-generation antipsychotics (TGAs): drugs like aripiprazole (Abilify) that are partial agonists at D2 and 5-HT1A receptors and antagonists at 5-HT2A receptors prescribed for the management of the positive and negative symptoms of schizophrenia.
total HRV power: the integral of HRV power spectral density across an explicitly stated frequency range and recording duration.
toxic-metabolic: describing states, such as drug intoxication, withdrawal, organ failure, or electrolyte disturbance, that alter brain function and EEG activity through systemic rather than structural mechanisms.
transient (EEG): an isolated waveform or brief sequence that is distinguishable from the ongoing EEG background.
tricyclic antidepressants (TCAs): first-generation antidepressants, such as imipramine (Tofranil), that block the reuptake of serotonin and norepinephrine and are prescribed for major depressive disorder. Sedating TCAs increase theta and fast-beta power while decreasing alpha and total power.
triphasic wave (TW): a medium-to-high-amplitude sharp transient with a negative-positive-negative sequence, distributed diffusely and symmetrically with frontal predominance.
upregulation: increase in receptor number or sensitivity due to prolonged exposure to an antagonist or low levels of agonist, leading to an enhanced response.
waveform: the shape of a signal as its amplitude changes over time.
Test Yourself on ClassMarker
Click the button below to take a 10-question exam over this entire unit. There is no password.
Review Flash Cards on Quizlet
Click the button below to review our chapter flash cards.
Visit the BioSource Software Website
BioSource Software offers Physiological Psychology, which satisfies BCIA's Neuroanatomy requirement, and the Neurofeedback100 Testing Service, which provides extensive multiple-choice testing over the Neurofeedback Blueprint.

Assignment
Now that you have completed this unit, explain how an SSRI like fluoxetine (Prozac) could affect the EEG. How would you adjust neurofeedback training for depression in clients who take Prozac? Why should you avoid training against a drug's principal effects on the EEG?
References
Advokat, C. D., Comaty, J. E., & Julien, R. M. (2019). Julien's primer of drug action: A comprehensive guide to the actions, uses, and side effects of psychoactive drugs (14th ed.). Worth Publishers.
Aiyer, R., Novakovic, V., & Barkin, R. L. (2016). A systematic review on the impact of psychotropic drugs on electroencephalogram waveforms in psychiatry. Postgraduate Medicine, 128(7), 656-664. https://doi.org/10.1080/00325481.2016.1218261
Aprigio, D., Bittencourt, J., Gongora, M., Marinho, V., Teixeira, S., Bastos, V., Cagy, M., Budde, H., Ribeiro, P., Basile, L., & Velasques, B. (2021). Methylphenidate decreases the EEG mu power in the right primary motor cortex in healthy adults during motor imagery and execution. Brain Structure and Function, 226(4), 1185-1193. https://doi.org/10.1007/s00429-021-02233-8
Arzy, S., Allali, G., Brunet, D., Michel, C. M., Kaplan, P. W., & Seeck, M. (2010). Antiepileptic drugs modify power of high EEG frequencies and their neural generators. European Journal of Neurology, 17(10), 1308-1312. https://doi.org/10.1111/j.1468-1331.2010.03018.x
Banoczi, W. R. (2005). How some drugs affect the electroencephalogram (EEG). American Journal of Electroneurodiagnostic Technology, 45, 118-129.
Barry, R. J., Clarke, A. R., Hajos, M., McCarthy, R., Selikowitz, M., & Bruggemann, J. M. (2009). Acute atomoxetine effects on the EEG of children with attention-deficit/hyperactivity disorder. Neuropharmacology, 57(7-8), 702-707. https://doi.org/10.1016/j.neuropharm.2009.08.003
Barry, R. J., Rushby, J. A., Wallace, M. J., Clarke, A. R., Johnstone, S. J., & Zlojutro, I. (2005). Caffeine effects on resting-state arousal. Clinical Neurophysiology, 116(11), 2693-2700. https://doi.org/10.1016/j.clinph.2005.08.008
Bauer, G., & Bauer, R. (2005). EEG drug effects and central nervous system poisoning. In E. Niedermeyer & F. Lopes da Silva (Eds.), Electroencephalography: Basic principles, clinical applications, and related fields (5th ed.). Lippincott Williams & Wilkins.
Blume, W. T. (2006). Drug effects on EEG. Journal of Clinical Neurophysiology, 23(4), 306-311. https://doi.org/10.1097/01.wnp.0000229137.94384.fa
Böcker, K. B. E., Hunault, C. C., Gerritsen, J., Kruidenier, M., Mensinga, T. T., & Kenemans, J. L. (2010). Cannabinoid modulations of resting state EEG theta power and working memory are correlated in humans. Journal of Cognitive Neuroscience, 22(9), 1906-1916. https://doi.org/10.1162/jocn.2009.21355
Bos, D. J., Oranje, B., Veerhoek, E. S., Van Diepen, R. M., Weusten, J. M., Demmelmair, H., Koletzko, B., de Sain-van der Velden, M. G., Eilander, A., Hoeksma, M., & Durston, S. (2015). Reduced symptoms of inattention after dietary omega-3 fatty acid supplementation in boys with and without Attention Deficit/Hyperactivity Disorder. Neuropsychopharmacology, 40(10), 2298-2306. https://doi.org/10.1038/npp.2015.73
Bromm, B., Ganzel, R., Herrmann, W. M., Meier, W., & Scharein, E. (1986). Pentazocine and flupirtine effects on spontaneous and evoked EEG activity. Neuropsychobiology, 16(2-3), 152-156. https://doi.org/10.1159/000118317
Brunner, D. P., Dijk, D. J., Munch, M., & Borbely, A. A. (1991). Effect of zolpidem on sleep and sleep EEG spectra in healthy young men. Psychopharmacology, 104(1), 1-5. https://doi.org/10.1007/BF02244546
Cajochen, C., Krauchi, K., von Arx, M. A., Mori, D., Graw, P., & Wirz-Justice, A. (1996). Daytime melatonin administration enhances sleepiness and theta/alpha activity in the waking EEG. Neuroscience Letters, 207(3), 209-213. https://doi.org/10.1016/0304-3940(96)12517-9
Carley, D. W., & Farabi, S. S. (2016). Physiology of sleep. Diabetes Spectrum, 29(1), 5-9. https://doi.org/10.2337/diaspect.29.1.5
Clarke, A. R., Barry, R. J., Bond, D., McCarthy, R., & Selikowitz, M. (2002). Effects of stimulant medications on the EEG of children with attention-deficit/hyperactivity disorder. Psychopharmacology, 164(3), 277-284. https://doi.org/10.1007/s00213-002-1205-0
Clemens, B., Menes, A., Piros, P., Bessenyei, M., Altmann, A., Jerney, J., Kollar, K., Rosdy, B., Rozsavolgyi, M., Steinecker, K., & Hollody, K. (2006). Quantitative EEG effects of carbamazepine, oxcarbazepine, valproate, lamotrigine, and possible clinical relevance of the findings. Epilepsy Research, 70(2-3), 190-199. https://doi.org/10.1016/j.eplepsyres.2006.05.003
Clemens, B., Piros, P., Bessenyei, M., Toth, M., Hollody, K., & Kondakor, I. (2008). Imaging the cortical effect of lamotrigine in patients with idiopathic generalized epilepsy: A low-resolution electromagnetic tomography (LORETA) study. Epilepsy Research, 81(2-3), 204-210. https://doi.org/10.1016/j.eplepsyres.2008.06.002
Clemens, B., Puskas, S., Besenyei, M., Kovacs, N. Z., Spisak, T., Kis, S. A., Emri, M., Hollody, K., Fogarasi, A., Kondakor, I., & Fekete, I. (2014). Valproate treatment normalizes EEG functional connectivity in successfully treated idiopathic generalized epilepsy patients. Epilepsy Research, 108(10), 1896-1903. https://doi.org/10.1016/j.eplepsyres.2014.09.032
Cohen, H., Porjesz, B., & Begleiter, H. (1993). Ethanol-induced alterations in electroencephalographic activity in adult males. Neuropsychopharmacology, 8, 365-370. https://doi.org/10.1038/npp.1993.36
Demos, J. N. (2019). Getting started with neurofeedback (2nd ed.). W. W. Norton & Company.
Dias Alves, M., Micoulaud-Franchi, J. A., Simon, N., & Vion-Dury, J. (2018). Electroencephalogram modifications associated with atypical strict antipsychotic monotherapies. Journal of Clinical Psychopharmacology, 38(6), 555-562. https://doi.org/10.1097/JCP.0000000000000953
Dijk, D. J., & Cajochen, C. (1997). Melatonin and the circadian regulation of sleep initiation, consolidation, structure, and the sleep EEG. Journal of Biological Rhythms, 12(6), 627-635. https://doi.org/10.1177/074873049701200618
Dimpfel, W., Schober, F., & Spuler, M. (1993). The influence of caffeine on human EEG under resting condition and during mental loads. The Clinical Investigator, 71, 197-207. https://doi.org/10.1007/BF00180102
Drapeau, C., Hamel-Hebert, I., Robillard, R., Selmaoui, B., Filipini, D., & Carrier, J. (2006). Challenging sleep in aging: The effects of 200 mg of caffeine during the evening in young and middle-aged moderate caffeine consumers. Journal of Sleep Research, 15. https://doi.org/10.1111/j.1365-2869.2006.00518.x
Eschmann, G., Irrgang, V., & Ruther, E. (1983). Effects of beta-receptor blockers in pharmacology EEG. Neuropsychobiology, 10(2-3), 190-192. https://doi.org/10.1159/000118008
Faigle, R., Sutter, R., & Kaplan, P. W. (2013). Electroencephalography of encephalopathy in patients with endocrine and metabolic disorders. Journal of Clinical Neurophysiology, 30(5), 505-516. https://doi.org/10.1097/WNP.0b013e3182a73db9
Flachenecker, P. (2013). A new multiple sclerosis spasticity treatment option: Effect in everyday clinical practice and cost-effectiveness in Germany. Expert Review of Neurotherapeutics, 13(3 Suppl 1), 15-19. https://doi.org/10.1586/ern.13.1
Fontani, G., Corradeschi, F., Felici, A., Alfatti, F., Migliorini, S., & Lodi, L. (2005). Cognitive and physiological effects of Omega-3 polyunsaturated fatty acid supplementation in healthy subjects. European Journal of Clinical Investigation, 35(11), 691-699. https://doi.org/10.1111/j.1365-2362.2005.01570.x
Förstera, B., Castro, P. A., Moraga-Cid, G., & Aguayo, L. G. (2016). Potentiation of gamma aminobutyric acid receptors (GABAAR) by ethanol: How are inhibitory receptors affected? Frontiers in Cellular Neuroscience, 10, 114. https://doi.org/10.3389/fncel.2016.00114
Foxe, J., Morie, K., Laud, P., Rowson, M., Bruin, E., & Kelly, S. (2012). Assessing the effects of caffeine and theanine on the maintenance of vigilance during a sustained attention task. Neuropharmacology, 62, 2320-2327. https://doi.org/10.1016/j.neuropharm.2012.01.020
Galderisi, S., Mucci, A., Volpe, U., & Boutros, N. (2009). Evidence-based medicine and electrophysiology in schizophrenia. Clinical EEG and Neuroscience, 40(2), 62-77. https://doi.org/10.1177/155005940904000206
Garcia, P., Kreuzer, M., Hight, D., & Sleigh, J. (2021). Effects of noxious stimulation on the electroencephalogram during general anaesthesia: A narrative review and approach to analgesic titration. British Journal of Anaesthesia, 126(2), 445-457. https://doi.org/10.1016/j.bja.2020.10.036
Gibbs, F. A., & Gibbs, E. L. (1950). Atlas of electroencephalography: Vol. 1. Methodology and controls. Addison-Wesley.
Gibbs, F. A., & Gibbs, E. L. (1952). Atlas of electroencephalography: Vol. 2. Epilepsy. Addison-Wesley.
Goldstein, L., Murphree, H. B., & Pfeiffer, C. C. (1968). Comparative study of EEG effects of antihistamines in normal volunteers. The Journal of Clinical Pharmacology and the Journal of New Drugs, 8(1), 42-53. https://doi.org/10.1002/j.1552-4604.1968.tb00091.x
Graversen, C., Malver, L., Kurita, G., Staahl, C., Christrup, L., Sjogren, P., & Drewes, A. (2015). Altered frequency distribution in the electroencephalogram is correlated to the analgesic effect of Remifentanil. Basic & Clinical Pharmacology & Toxicology, 116. https://doi.org/10.1111/bcpt.12330
Guo, J., Wang, D., Ren, M., Xiong, B., Li, Z., Wang, X., & Zeng, K. (2014). QEEG analysis of the effects of sodium valproate on adult Chinese patients with generalized tonic-clonic seizures. Metabolic Brain Disease, 29(3), 801-807. https://doi.org/10.1007/s11011-014-9561-0
Han, G., Matsumoto, S., Diaz, J., Greene, R. W., & Vogt, K. E. (2022). Dihydropyridine calcium blockers do not interfere with non-rapid eye movement sleep. Frontiers in Neuroscience, 16, 969712. https://doi.org/10.3389/fnins.2022.969712
Hasan, M., Pulman, J., & Marson, A. G. (2013). Calcium antagonists as an add-on therapy for drug-resistant epilepsy. The Cochrane Database of Systematic Reviews, 2013(3), CD002750. https://doi.org/10.1002/14651858.CD002750.pub2
Heninger, G. R. (1978). Lithium carbonate and brain function. I. Cerebral-evoked potentials, EEG, and symptom changes during lithium carbonate treatment. Archives of General Psychiatry, 35(2), 228-233. https://doi.org/10.1001/archpsyc.1978.01770260106013
Herning, R. I., Glover, B. J., Koeppl, B., Phillips, R. L., & London, E. D. (1994). Cocaine-induced increases in EEG alpha and beta activity: Evidence for reduced cortical processing. Neuropsychopharmacology, 11(1), 1-9. https://doi.org/10.1038/npp.1994.30
Herning, R. I., Jones, R. T., Hooker, W. D., Mendelson, J., & Blackwell, L. (1985). Cocaine increases EEG beta: A replication and extension of Hans Berger's historic experiments. Electroencephalography and Clinical Neurophysiology, 60(6), 470-477. https://doi.org/10.1016/0013-4694(85)91106-X
Hotz, M., Ritz, R., Linder, L., Scollo-Lavizzari, G., & Haefeli, W. (2000). Auditory and electroencephalographic effects of midazolam and alpha-hydroxy-midazolam in healthy subjects. British Journal of Clinical Pharmacology, 49(1), 72-79. https://doi.org/10.1046/J.1365-2125.2000.00104.X
Hughes, A., Lynch, P., Rhodes, J., Ervine, C., & Yates, R. (1999). Electroencephalographic and psychomotor effects of chlorpromazine and risperidone relative to placebo in normal healthy volunteers. British Journal of Clinical Pharmacology, 48(3), 323-330. https://doi.org/10.1046/J.1365-2125.1999.00021.X
Hyun, J., Baik, M. J., & Kang, U. G. (2011). Effects of psychotropic drugs on quantitative EEG among patients with schizophrenia-spectrum disorders. Clinical Psychopharmacology and Neuroscience, 9(2), 78-85. https://doi.org/10.9758/cpn.2011.9.2.78
Ilan, A. B., Smith, M. E., & Gevins, A. (2004). Effects of marijuana on neurophysiological signals of working and episodic memory. Psychopharmacology, 176(2), 214-222. https://doi.org/10.1007/s00213-004-1868-9
Insel, T., Cuthbert, B., Garvey, M., Heinssen, R., Pine, D. S., Quinn, K., Sanislow, C., & Wang, P. (2010). Research domain criteria (RDoC): Toward a new classification framework for research on mental disorders. American Journal of Psychiatry, 167(7), 748-751. https://doi.org/10.1176/appi.ajp.2010.09091379
Johnstone, J., Gunkelman, J., & Lunt, J. (2005). Clinical database development: Characterization of EEG phenotypes. Clinical EEG and Neuroscience, 36(2), 99-107. https://doi.org/10.1177/155005940503600209
Joutsiniemi, S., Gross, A., & Appelberg, B. (2001). Marked Clozapine-induced slowing of EEG background over frontal, central, and parietal scalp areas in schizophrenic patients. Journal of Clinical Neurophysiology, 18, 9-13. https://doi.org/10.1097/00004691-200101000-00003
Julien, R. M., Advokat, C. D., & Comaty, J. E. (2023). Julien's primer of drug action: A comprehensive guide to the actions, uses, and side effects of psychoactive drugs (15th ed.). Worth Publishers.
Khajehpour, H., Mohagheghian, F., Ekhtiari, H., Makkiabadi, B., Jafari, A. H., Eqlimi, E., & Harirchian, M. H. (2019). Computer-aided classifying and characterizing of methamphetamine use disorder using resting-state EEG. Cognitive Neurodynamics, 13(6), 519-530. https://doi.org/10.1007/s11571-019-09550-z
Knott, V. J. (2000). Quantitative EEG methods and measures in human psychopharmacological research. Human Psychopharmacology, 15, 479-498.
Knott, V., Labelle, A., Jones, B., & Mahoney, C. (2001). Quantitative EEG in schizophrenia and in response to acute and chronic clozapine treatment. Schizophrenia Research, 50(1-2), 41-53. https://doi.org/10.1016/s0920-9964(00)00165-1
Knott, V., Mahoney, C., Kennedy, S., & Evans, K. (2000). Pre-treatment EEG and its relationship to depression severity and paroxetine treatment outcome. Pharmacopsychiatry, 33(6), 201-205. https://doi.org/10.1055/s-2000-8356
Krepel, N., van Dijk, H., Sack, A. T., Swatzyna, R. J., & Arns, M. (2021). To spindle or not to spindle: A replication study into spindling excessive beta as a transdiagnostic EEG feature associated with impulse control. Biological Psychology, 165, 108188. https://doi.org/10.1016/j.biopsycho.2021.108188
Landolt, H., Retey, J., Tonz, K., Gottselig, J., Khatami, R., Buckelmuller, I., & Achermann, P. (2004). Caffeine attenuates waking and sleep electroencephalographic markers of sleep homeostasis in humans. Neuropsychopharmacology, 29, 1933-1939. https://doi.org/10.1038/sj.npp.1300526
Laurian, S., Le, P., Baumann, P., Perey, M., Gaillard, J., & Muller, P. (1981). Relationship between plasma-levels of Chlorpromazine and effects on EEG and evoked potentials in healthy volunteers. Pharmacopsychiatry, 14, 199-204. https://doi.org/10.1055/s-2007-1019598
Lindgren, M., Molander, L., Verbaan, C., Lunell, E., & Rosen, I. (1999). Electroencephalographic effects of intravenous nicotine: A dose-response study. Psychopharmacology, 145, 342-350. https://doi.org/10.1007/s002130051067
MacCrimmon, D., Brunet, D., Criollo, M., Galin, H., & Lawson, J. S. (2012). Clozapine augments delta, theta, and right frontal EEG alpha power in schizophrenic patients. ISRN Psychiatry, 2012, 596486. https://doi.org/10.5402/2012/596486
Malver, L., Brokjaer, A., Staahl, C., Graversen, C., Andresen, T., & Drewes, A. (2014). Electroencephalography and analgesics. British Journal of Clinical Pharmacology, 77. https://doi.org/10.1111/bcp.12137
Marciani, M. G., Gigli, G. L., Maschio, M. C., Stefani, N., Stefanini, F., & Bernardi, G. (1992). EEG changes induced by carbamazepine therapy at rest and during mental processes. Italian Journal of Neurological Sciences, 13(9), 729-733. https://doi.org/10.1007/BF02229157
Matousek, M. (1987). EEG assessment of the sedative and excitatory properties of CNS-active compounds in the patients with depression. Neuropsychobiology, 17(1-2), 118-120. https://doi.org/10.1159/000118348
McClelland, G., Cooper, S., & Pilgrim, A. (1990). A comparison of the central nervous system effects of haloperidol, chlorpromazine and sulpiride in normal volunteers. British Journal of Clinical Pharmacology, 30(6), 795-803. https://doi.org/10.1111/J.1365-2125.1990.TB05444.X
Mecarelli, O., Piacenti, A., Pulitano, P., Vicenzini, E., Rizzo, C., Rinalduzzi, S., de Feo, M. R., & Accornero, N. (2001). Clinical and electroencephalographic effects of topiramate in patients with epilepsy and healthy volunteers. Clinical Neuropharmacology, 24(5), 284-289. https://doi.org/10.1097/00002826-200109000-00005
Mecarelli, O., Vicenzini, E., Pulitano, P., Vanacore, N., Romolo, F. S., Di Piero, V., Lenzi, G. L., & Accornero, N. (2004). Clinical, cognitive, and neurophysiologic correlates of short-term treatment with carbamazepine, oxcarbazepine, and levetiracetam in healthy volunteers. The Annals of Pharmacotherapy, 38(11), 1816-1822. https://doi.org/10.1345/aph.1E136
Melchior, J. R., & Jones, S. R. (2017). Chronic ethanol exposure increases inhibition of optically targeted phasic dopamine release in the nucleus accumbens core and medial shell ex vivo. Molecular and Cellular Neurosciences, 85, 93–104. https://doi.org/10.1016/j.mcn.2017.09.007
Merlotti, E., Mucci, A., Bucci, P., Volpe, U., Montefusco, V., Galderisi, S., & Maj, M. (2007). Topographic and tomographic EEG changes after a single oral dose of antipsychotic drugs in healthy young subjects. European Psychiatry, 22, S160-S161. https://doi.org/10.1016/j.eurpsy.2007.01.521
Montgomery, P., Burton, J. R., Sewell, R. P., Spreckelsen, T. F., & Richardson, A. J. (2013). Low blood long chain omega-3 fatty acids in UK children are associated with poor cognitive performance and behavior: A cross-sectional analysis from the DOLAB study. PLoS ONE, 8(6), e66697. https://doi.org/10.1371/journal.pone.0066697
Morrison, P. D., Nottage, J., Stone, J. M., Bhattacharyya, S., Tunstall, N., Brenneisen, R., Holt, D., Wilson, D., Sumich, A., McGuire, P., Murray, R. M., Kapur, S., & ffytche, D. H. (2011). Disruption of frontal theta coherence by Δ9-tetrahydrocannabinol is associated with positive psychotic symptoms. Neuropsychopharmacology, 36(4), 827-836. https://doi.org/10.1038/npp.2010.222
Muñoz-Torres, Z., del Río-Portilla, Y., & Corsi-Cabrera, M. (2011). Diazepam-induced changes in EEG oscillations during performance of a sustained attention task. Journal of Clinical Neurophysiology, 28, 394-399. https://doi.org/10.1097/WNP.0b013e318227323a
Neufeld, M., Kogan, E., Chistik, V., & Korczyn, A. (1999). Comparison of the effects of vigabatrin, lamotrigine, and topiramate on quantitative EEGs in patients with epilepsy. Clinical Neuropharmacology, 22(2), 80-86. https://doi.org/10.1097/00002826-199903000-00003
Newton, T. F., Cook, I. A., Kalechstein, A. D., Duran, S., Monroy, F., Ling, W., & Leuchter, A. F. (2003). Quantitative EEG abnormalities in recently abstinent methamphetamine dependent individuals. Clinical Neurophysiology, 114(3), 410-415. https://doi.org/10.1016/s1388-2457(02)00409-1
Nissen, T. D., Laursen, B., Viardot, G., l'Hostis, P., Danjou, P., Sluth, L. B., Gram, M., Bastlund, J. F., Christensen, S. R., & Drewes, A. M. (2020). Effects of vortioxetine and escitalopram on electroencephalographic recordings: A randomized, crossover trial in healthy males. Neuroscience, 424, 172-181. https://doi.org/10.1016/j.neuroscience.2019.09.039
Noldy, N., Santos, C., Politzer, N., Blair, R., & Carlen, P. (1994). Quantitative EEG changes in cocaine withdrawal: Evidence for long-term CNS effects. Neuropsychobiology, 30(4), 189-196. https://doi.org/10.1159/000119160
Ott, G. E., Rao, U., Lin, K. M., Gertsik, L., & Poland, R. E. (2004). Effect of treatment with bupropion on EEG sleep: Relationship to antidepressant response. The International Journal of Neuropsychopharmacology, 7(3), 275-281. https://doi.org/10.1017/S1461145704004298
Patat, A., Rosenzweig, P., Enslen, M., Trocherie, S., Miget, N., Bozon, M., Allain, H., & Gandon, J. (2000). Effects of a new slow release formulation of caffeine on EEG, psychomotor and cognitive functions in sleep-deprived subjects. Human Psychopharmacology, 15.
Patrick, R. P., & Ames, B. N. (2015). Vitamin D and the omega-3 fatty acids control serotonin synthesis and action, part 2: Relevance for ADHD, bipolar disorder, schizophrenia, and impulsive behavior. FASEB Journal, 29(6), 2207-2222. https://doi.org/10.1096/fj.14-268342
Peltola, M. E., Leitinger, M., Halford, J. J., Vinayan, K. P., Kobayashi, K., Pressler, R. M., Mindruta, I., Mayor, L. C., Lauronen, L., & Beniczky, S. (2023). Routine and sleep EEG: Minimum recording standards of the International Federation of Clinical Neurophysiology and the International League Against Epilepsy. Epilepsia, 64(3), 602-618. https://doi.org/10.1111/epi.17448
Pickworth, W., Herning, R., & Henningfield, J. (1986). Electroencephalographic effects of nicotine chewing gum in humans. Pharmacology Biochemistry and Behavior, 25, 879-882. https://doi.org/10.1016/0091-3057(86)90401-6
Pollock, V., Teasdale, T., Stern, J., & Volavka, J. (1981). Effects of caffeine on resting EEG and response to sine wave modulated light. Electroencephalography and Clinical Neurophysiology, 51(5), 470-476. https://doi.org/10.1016/0013-4694(81)90223-6
Prashad, S., Dedrick, E., & Filbey, F. (2018). Cannabis users exhibit increased cortical activation during resting state compared to non-users. NeuroImage, 179, 176-186. https://doi.org/10.1016/j.neuroimage.2018.06.031
Ranzi, P., Thiel, C., & Herrmann, C. (2016). EEG source reconstruction in male nonsmokers after nicotine administration during the resting state. Neuropsychobiology, 73, 191-200. https://doi.org/10.1159/000445481
Rubinson, M., Horowitz, I., Naim-Feil, J., Gothelf, D., Levit-Binnun, N., & Moses, E. (2019). Effects of methylphenidate on the ERP amplitude in youth with ADHD: A double-blind placebo-controlled cross-over EEG study. PLoS ONE, 14. https://doi.org/10.1371/journal.pone.0217383
Saletu, B., Anderer, P., & Saletu-Zyhlarz, G. M. (2006). EEG topography and tomography (LORETA) in the classification and evaluation of the pharmacodynamics of psychotropic drugs. Clinical EEG and Neuroscience, 37(2), 66-80. https://doi.org/10.1177/155005940603700205
Saletu, B., Anderer, P., & Saletu-Zyhlarz, G. M. (2010). EEG mapping and tomography in drug evaluation. Medicographia, 32, 190-200.
Saletu, B., Grunberger, J., & Linzmayer, L. (1986). Evaluation of encephalotropic and psychotropic properties of gabapentin in man by pharmaco-EEG and psychometry. International Journal of Clinical Pharmacology, Therapy, and Toxicology, 24(7), 362-373.
Siepmann, M., & Kirch, W. (2002). Effects of caffeine on topographic quantitative EEG. Neuropsychobiology, 45, 161-166. https://doi.org/10.1159/000054958
Simeon, J. G., Ferguson, H. B., & Van Wyck Fleet, J. (1986). Bupropion effects in attention deficit and conduct disorders. Canadian Journal of Psychiatry, 31(6), 581-585. https://doi.org/10.1177/070674378603100617
Skosnik, P., Krishnan, G., D'Souza, D., Hetrick, W., & O'Donnell, B. (2014). Disrupted gamma-band neural oscillations during coherent motion perception in heavy cannabis users. Neuropsychopharmacology, 39, 3087-3099. https://doi.org/10.1038/npp.2014.166
Stahl, S. M. (2017). Stahl's essential psychopharmacology prescriber's guide (6th ed.). Cambridge University Press.
Stahl, S. M. (2021). Stahl's essential psychopharmacology prescriber's guide (7th ed.). Cambridge University Press.
Sutter, R., & Kaplan, P. W. (2013). Clinical and electroencephalographic correlates of acute encephalopathy. Journal of Clinical Neurophysiology, 30(5), 443-453. https://doi.org/10.1097/WNP.0b013e3182a73bc2
Swatzyna, R. J., Arns, M., Tarnow, J. D., Turner, R. P., Barr, E., MacInerney, E. K., Hoffman, A. M., & Boutros, N. N. (2022). Isolated epileptiform activity in children and adolescents: Prevalence, relevance, and implications for treatment. European Child & Adolescent Psychiatry, 31(4), 545-552. https://doi.org/10.1007/s00787-020-01597-2
Swatzyna, R. J., Morrow, L. M., Collins, D. M., Barr, E. A., Roark, A. J., & Turner, R. P. (2024). Evidentiary significance of routine EEG in refractory cases: A paradigm shift in psychiatry. Clinical EEG and Neuroscience, 15500594231221313. Advance online publication. https://doi.org/10.1177/15500594231221313
Swatzyna, R. J., Tarnow, J. D., Tannous, J. D., Pillai, V., Schieszler, C., & Kozlowski, G. P. (2014). EEG/QEEG technology identifies neurobiomarkers critical to medication selection and treatment in refractory cases. Journal of Psychology & Clinical Psychiatry, 1(7), 00046. https://doi.org/10.15406/jpcpy.2014.01.00046
Tan, X., Uchida, S., Matsuura, M., Nishihara, K., & Kojima, T. (2003). Long-, intermediate- and short-acting benzodiazepine effects on human sleep EEG spectra. Psychiatry and Clinical Neurosciences, 57. https://doi.org/10.1046/j.1440-1819.2003.01085.x
Tashkin, D. P. (2013). Effects of marijuana smoking on the lung. Annals of the American Thoracic Society, 10(3), 239-247. https://doi.org/10.1513/AnnalsATS.201212-127FR
Thanacoody, H. K., & Thomas, S. H. (2005). Tricyclic antidepressant poisoning: Cardiovascular toxicity. Toxicological Reviews, 24(3), 205-214. https://doi.org/10.2165/00139709-200524030-00013
Thomaides, T., Tagaris, G., & Karageorgiou, C. (1996). EEG and topographic frequency analysis in migraine attack before and after sumatriptan infusion. Headache, 36(2), 111-114. https://doi.org/10.1046/j.1526-4610.1996.3602111.x
Thompson, M., & Thompson, L. (2015). The neurofeedback book: An introduction to basic concepts in applied psychophysiology (2nd ed.). Association for Applied Psychophysiology and Biofeedback.
Thompson, M., & Thompson, L. (2016). The neurofeedback book: An introduction to basic concepts in applied psychophysiology (2nd ed.). Association for Applied Psychophysiology and Biofeedback.
Van Cott, A., & Brenner, R. P. (2003). Drug effects and toxic encephalopathies. In J. S. Ebersole & T. A. Pedley (Eds.), Current practice of clinical electroencephalography (3rd ed.). Lippincott Williams & Wilkins.
van der Post, J., Schram, M. T., Schoemaker, R. C., Pieters, M. S., Fuseau, E., Pereira, A., Baggen, S., Cohen, A. F., & van Gerven, J. M. (2002). CNS effects of sumatriptan and rizatriptan in healthy female volunteers. Cephalalgia, 22(4), 271-281. https://doi.org/10.1046/j.1468-2982.2002.00344.x
Volavka, J., Dornbush, R., Feldstein, S., Clare, G., Zaks, A., Fink, M., & Freedman, A. (1971). Marijuana, EEG, and behavior. Annals of the New York Academy of Sciences, 191. https://doi.org/10.1111/j.1749-6632.1971.tb13999.x
Wang, W. W., Li, J. C., & Wu, X. (2003). Quantitative EEG effects of topiramate. Clinical EEG (Electroencephalography), 34(2), 87-92. https://doi.org/10.1177/155005940303400208
Wu, X., & Xiao, C. H. (1996). Quantitative pharmaco-EEG of carbamazepine in volunteers and epileptics. Clinical EEG (Electroencephalography), 27(1), 40-45. https://doi.org/10.1177/155005949602700107
Yoshimura, M., Koenig, T., Irisawa, S., Isotani, T., Yamada, K., Kikuchi, M., Okugawa, G., Yagyu, T., Kinoshita, T., Strik, W., & Dierks, T. (2007). A pharmaco-EEG study on antipsychotic drugs in healthy volunteers. Psychopharmacology, 191, 995-1004. https://doi.org/10.1007/s00213-007-0737-8
Zajicek, J., Fox, P., Sanders, H., Wright, D., Vickery, J., Nunn, A., Thompson, A., & UK MS Research Group (2003). Cannabinoids for treatment of spasticity and other symptoms related to multiple sclerosis (CAMS study): Multicentre randomised placebo-controlled trial. The Lancet, 362(9395), 1517-1526. https://doi.org/10.1016/S0140-6736(03)14738-1
Zhu, J., Coppens, R. P., Rabinovich, N. E., & Gilbert, D. G. (2017). Effects of bupropion sustained release on task-related EEG alpha activity in smokers: Individual differences in drug response. Experimental and Clinical Psychopharmacology, 25(1), 41-49. https://doi.org/10.1037/pha0000109
Return to Top