
Research
Research allows us to assess the efficacy of clinical and performance biofeedback (BF) and neurofeedback (NF) interventions. Peer-reviewed randomized controlled trials (RCTs) and meta-analyses that summarize their results are critical to BF and NF credibility.
Please click on the podcast icon below to hear a lecture over this unit.

Practitioners who claim success but refuse to submit their findings to peer review have continually endangered the field's reputation. Our stakeholders demand that we "show our receipts" or not be taken seriously. The field's reputation is critical since it impacts respect for providers, professional referrals, third-party reimbursement, and public demand for our services.
Large-scale randomized controlled trials represent the "gold standard" in research because experiments [alone] allow us to draw causal conclusions due to their internal validity. Protocol development should be personalized, goal-directed, and responsive to client progress. In forensic settings, experts should prioritize objectivity, disclose all limitations, and employ consistent analytic practices. Preparation for cross-examination should include awareness of potential criticisms and the ability to justify every methodological choice. Clinicians must remain current with scientific literature and technological advances, using this knowledge to inform ethical, effective, and transparent practices.
As the field evolves, practitioners must continue to refine their methods, advocate for interdisciplinary integration, and promote ethical standards. Only through such commitment can qEEG fulfill its potential to illuminate the neural underpinnings of behavior and contribute responsibly to health care and legal systems alike. Due to their expense and time demands, experimental studies exceed the resources of most practitioners.
However, clinicians can integrate the scientific method into their practice. They can utilize nonexperimental techniques like case studies and publish their results in journals like Applied Psychophysiology and Biofeedback. Case studies and case series can generate valuable hypotheses and provide the rationale for RCTs. Graphic © ZyabichTyler Olson/Shutterstock.com.

Evidence-Based Practice in Biofeedback and Neurofeedback, an Association for Applied Psychophysiology and Biofeedback publication, summarizes the peer-reviewed literature and conservatively assigns efficacy ratings for specific applications. Drs. Inna Khazan (pictured below), Donald Moss, Randy Lyle, and Fred Shaffer are the editors of the fourth edition of this industry reference (Khazan et al., 2023).

IQCB Blueprint Coverage
This unit addresses VII. Research (2 Hours). Knowledge of experimental research designs and practice. The purpose is to facilitate research in the field of electrophysiology and to help evaluate published data for purposes of adaptation to clinical practice.

This unit covers:
A. Basic vs. Clinical Research
B. Experimental Design
C. Basic Statistics and Differences Between Parametric vs. NonParametric Statistics
E. Definitions of Types of Validation and Reliability
F. Meta-Analysis
G. Reporting Results and Publication Standards
Please click on the podcast icon below to hear a full-length lecture.
A. Basic vs. Clinical Research
Basic and Clinical Research can be seen as two ends of a continuum in biomedical research. Although they differ in their objectives, methodologies, and outcomes, one can inform the other.
Objectives
Basic research, also known as preclinical research or bench research, aims to increase the scientific knowledge base. It's often driven by curiosity or interest in a scientific question. The main purpose is to enhance understanding of fundamental principles and how things work. For example, it might explore how certain brain networks function or how their communication breaks down in disease (Bauer et al., 2015).Clinical research, on the other hand, involves studies that actually involve patients. These studies are designed to improve overall human health, develop new treatments, or learn more about human biology and disease. It is more application-oriented and directly impacts patient care (Rubio et al., 2010).
Methodologies
Basic research usually involves experiments conducted in laboratories using animal models or healthy human participants. The methods are typically more controlled and more manipulable (Alberts et al., 2014). These studies require ethical board approval to protect animal and human welfare.Clinical research often involves human trials and observational studies. It requires approvals from ethical boards and follows strict guidelines to protect patients' rights. It can be further divided into observational studies and clinical trials. Observational studies observe patients in a natural setting, while clinical trials test the efficacy and safety of new drugs or treatments (Rubio et al., 2010).
Outcomes
The results of basic research often form the foundation for further research and are usually a step towards clinical research. It may lead to the discovery of new drugs or therapies, which are then tested in preclinical studies (Bauer et al., 2015). The outcomes of clinical research directly affect medical practices and policy-making. They can lead to the development of new diagnostic tools, treatments, or prevention strategies for various diseases (Rubio et al., 2010).B. Experimental Design
Nonexperimental and Experimental Designs
Nonexperimental designs do not manipulate independent variables or randomly assign participants to treatment conditions. These methods, including correlational and quasi-experimental designs, lack internal validity (Myers & Hansen, 2012).Independent, Dependent, and Extraneous Variables
An independent variable (IV) is the variable (antecedent condition) an experimenter intentionally manipulates.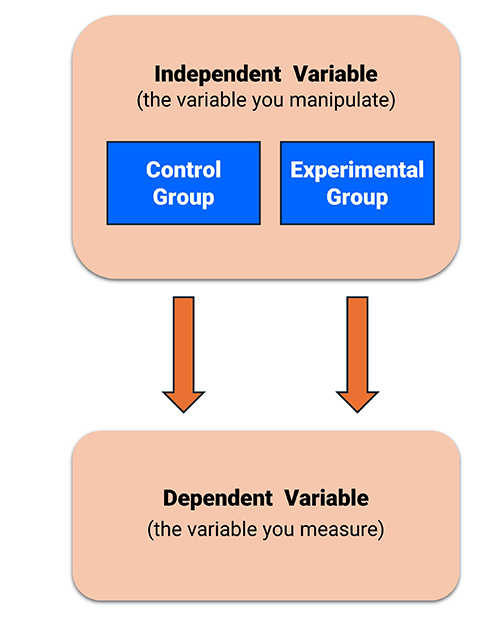
An experiment requires at least two levels (values) of an independent variable like slow cortical potential (SCP) NF and listening to relaxing music. The levels can consist of active and inactive treatments (experimental-control) or two active treatments (experimental-experimental).
A dependent variable (DV) is the outcome measure the experimenter uses to assess the change in behavior produced by the independent variable. The value of a dependent variable depends on the level of the IV. In a study of the efficacy of SCP NF in treating migraine, the number of emergency room visits per month could serve as one of the DVs. Graphic © Monkey Business img/ Shutterstock.com.

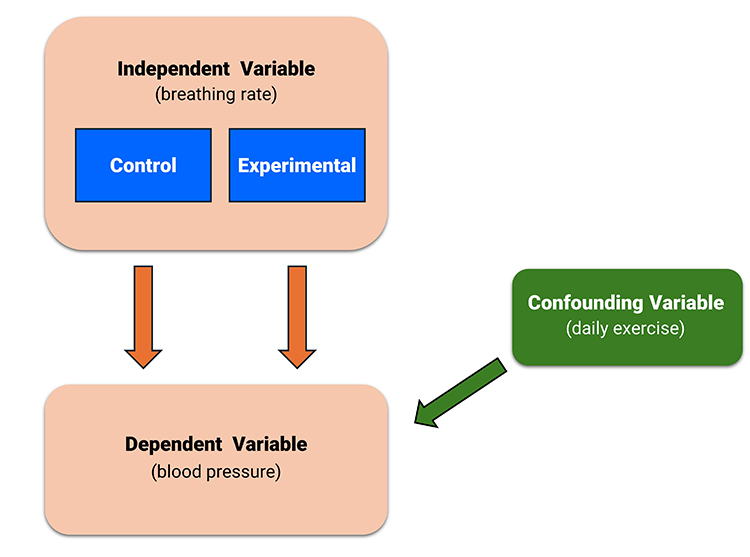
An extraneous variable (EV) is a variable not controlled by the experimenter that could affect the DV. Failure to control EVs can result in confounding.
Confounding occurs when an EV changes systematically across conditions, making it a potential cause of changes in the DV.
For example, in a study comparing the effects of breathing rate on lowering blood pressure, if the experimental group also exercised more than the control group, this would confound the experiment.
When confounding occurs, a researcher has competing explanations for the experimental findings, which cannot be ruled out. In this case, an investigator cannot draw cause-effect conclusions.
Internal and External Validity
Experiments can achieve high internal validity, which is the degree to which we can attribute changes in the dependent variable to the independent variable. Experiments attain internal validity by creating at least two levels of an independent variable and then randomly assigning participants to one or more conditions.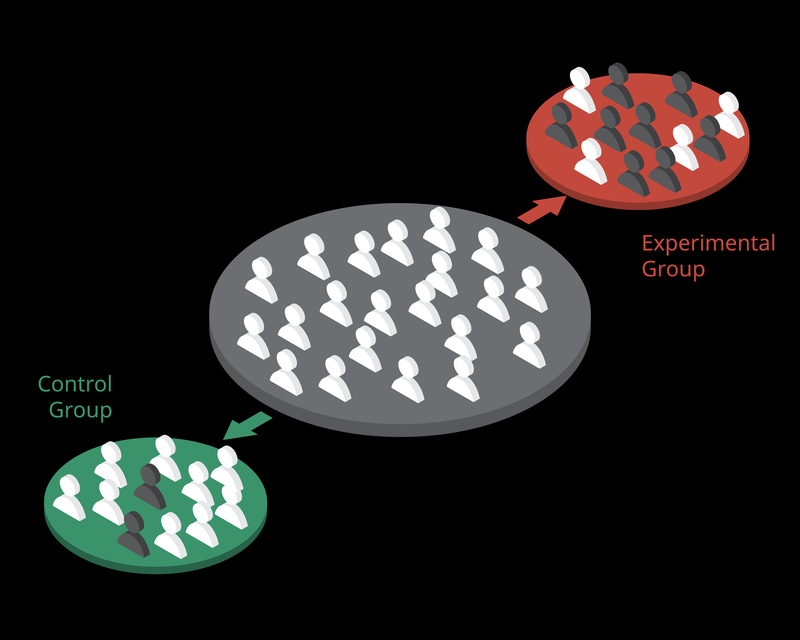
Internal validity is important because it establishes a causal relationship between the independent and dependent variables.
Nonexperimental designs cannot achieve internal validity because they don't control EVs. They may not create levels of the IV, randomly assign participants to conditions, or both.
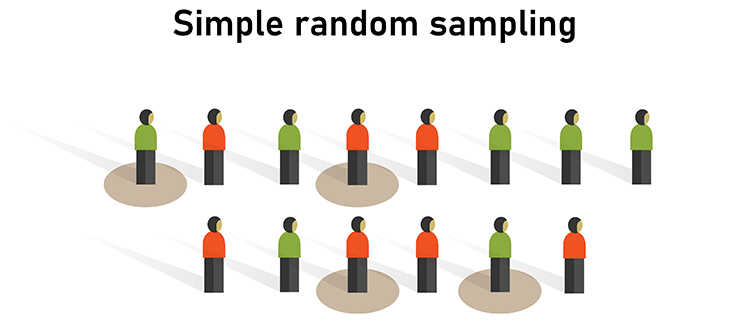
A sample is a subset of the target population. A population is a group of individuals sharing at least one characteristic (e.g., long-COVID patients). Graphic © Bakhtiar Zein/Shutterstock.com.
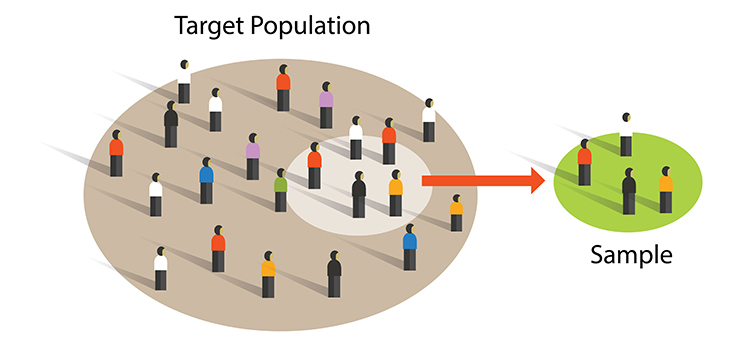
Researchers achieve external validity by using probability sampling to select participants from a population. External validity is the degree to which we can generalize sample findings to the population from which it was drawn.
Both experimental and nonexperimental designs can achieve external validity since this depends on the sampling method and not the control of EVs. Random sampling, where each member of a population has an equal chance to be selected, is a prerequisite for external validity. Graphic © Bakhtiar Zein/Shutterstock.com.
Threats to Internal Validity
Classic threats to internal validity include history, maturation, testing, instrumentation, statistical regression, assignment, mortality, and assignment-interaction (Campbell, 1957; Campbell & Stanley, 1966).A history threat occurs when an event outside the experiment threatens internal validity by changing the DV. For example, in a NF study to increase continuous attention, participants in group A were run in the morning while those in group B were run in the afternoon.
A maturation threat is produced when physical or psychological changes in the participant threaten internal validity by changing the DV. For example, boredom may increase participant errors on a test of continuous attention.
A testing threat occurs when prior exposure to a measurement procedure affects performance on this measure during the experiment. For example, suppose experimental participants regularly use a self-inflating blood pressure cuff during HRV BF training, and control participants only use one during pre- and post-testing. In that case, the experimental participants could have lower pressures due to their greater experience.
An instrumentation threat is when changes in the measurement instrument or measurement procedure threaten internal validity. For example, EEG sensor placement could be less accurate in one treatment group than in another.
A statistical regression threat occurs when participants are assigned to conditions based on extreme scores. The measurement procedure is not wholly reliable and participants are retested using the same method to show change on the DV. The scores of both extreme groups tend to regress to the mean on the second measurement: high scorers are lower and low scorers are higher on the second testing. This effect is caused by random variability of measurement error.
For example, all participants are pre-tested on anxiety, and only those who scored high or low are used as participants. If assignment to two different relaxation training conditions did not produce groups that started with equal levels of anxiety, apparent group differences at post-test might be due to regression threat.
An assignment threat occurs when the assignment procedure does not balance participant variables across treatment conditions. For example, despite random assignment, participants in the experimental group may have higher systolic blood pressures than those in the control group.
A mortality threat occurs when participants drop out of experimental conditions at different rates. For example, even if random assignment distributed participant characteristics equally across the conditions at the start of the experiment, dropout could render the conditions unequal on an extraneous variable like hypnotic susceptibility.
An assignment-interaction threat occurs when an assignment threat combines with at least one other threat (history, maturation, testing, instrumentation, statistical regression, or mortality).
When one of these classic threats confounds an experiment, the study lacks internal validity, and we cannot establish a cause-effect relationship between the independent and dependent variables.
Control of Physical Variables
Physical variables are aspects of the physical environment like time of day, room size, or noise. Researchers can control these EVs, in order of preference, through elimination, constancy of conditions, and balancing.Elimination removes the variable (soundproofing a room). Constancy of conditions keeps the variable about the same for all treatment conditions (running all participants in the morning).
Balancing distributes the variable's effects across all treatment conditions (running half of each condition's participants in the morning and half in the afternoon).
Control of Social Variables
Experiments are social situations, and their results can be confounded if the demand characteristics or experimenter behaviors differ systematically across treatment conditions. Social variables are aspects of the relationships between researchers and participants.Two significant social variables are demand characteristics and experimenter bias. Demand characteristics are situational cues (like students packing up their belongings at the end of class) that signal expected behavior (dismissal of class).
An experimenter can control demand characteristics by performing a single-blind experiment in which participants are not told their treatment condition. Graphic adapted from publichealthnotes.com.

For example, in a single-blind BF study of heart failure patients, the experimental and control groups receive the same training using identical screens and practice assignments. The only difference between the groups is their target breathing rate (6 bpm for the experimental and 12 bpm for the control group).
Experimenter bias occurs when a researcher knows the participants' treatment condition and acts to confirm the experimental hypothesis. Graphic adapted from @BogusandBias.

In the previous heart failure example, an experimenter might provide more encouragement to 6-bpm than 12-bpm participants.
A double-blind experiment, which conceals the participants' treatment condition from both participants and the experimenter, can control demand characteristics and experimenter bias. For example, in a double-blind drug study, the experimental and control groups receive capsules that look and taste identical. The experimenter does not know whether a participant has received a drug or placebo. Graphic retrieved from medindia.net.

There have been few double-blind BF studies because participants can often detect and experience frustration when receiving false feedback (e.g., the display shows heart rate increasing when it is decreasing). Also, unless BF training is automated, training will be ineffective if the experimenter doesn't know the training goal (e.g., heart rate down).
An alternative to a double-blind experiment is to blind participants and research technicians to the experimental hypothesis. Where a technician does not know which group is expected to perform better, this can reduce–but not eliminate–experimenter bias.
Control of Participant Characteristics
Participant characteristics are attributes like HRV or resting breathing rates. These variables can confound an experiment when associated with the DV, and failure to control these subject variables results in groups that are not equivalent. Researchers can control participant personality variables through random assignment to treatment conditions, matching participants on this variable and randomly assigning them to different conditions. They can also randomly assign participants to all treatment conditions using a within-participants design.Correlational Studies
A correlational study is a nonexperimental design because it does not manipulate an IV. These designs only obtain data regarding participant characteristics and performance (no IVs, only DVs). Scatterplots graphically display the magnitude (-1 to +1) and direction (negative or positive) of a correlation. Graphic retrieved from courses.lumenlearning.com.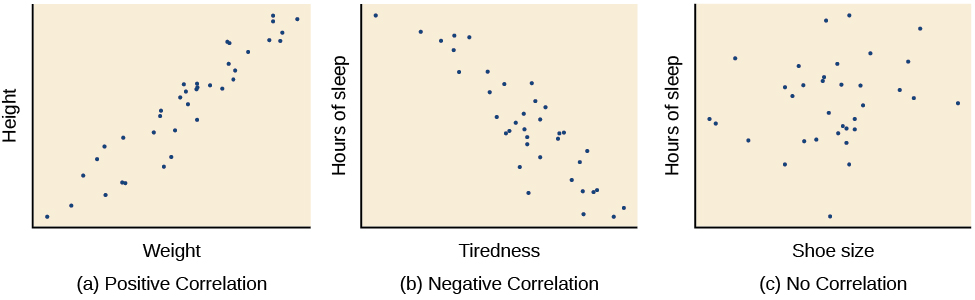
For example, the test-retest reliability of resonance frequency (RF) measurements is an unresolved question in HRV BF. The RF is stimulation rate using techniques like paced breathing or rhythmic skeletal muscle contraction that produces the greatest HRV. Studies that address this question measure participants' RF at two different points in time, often two weeks apart, and calculate a Pearson r statistic.
Investigators use correlational studies when they cannot or should not manipulate an independent variable. Since the RF is characteristic brings into an experiment, the test-retest reliability question falls into the "cannot manipulate" category.
Although valuable, correlation does not imply causation. Correlational studies lack internal validity for three reasons. Graphic © VectorMine/Shutterstock.com.
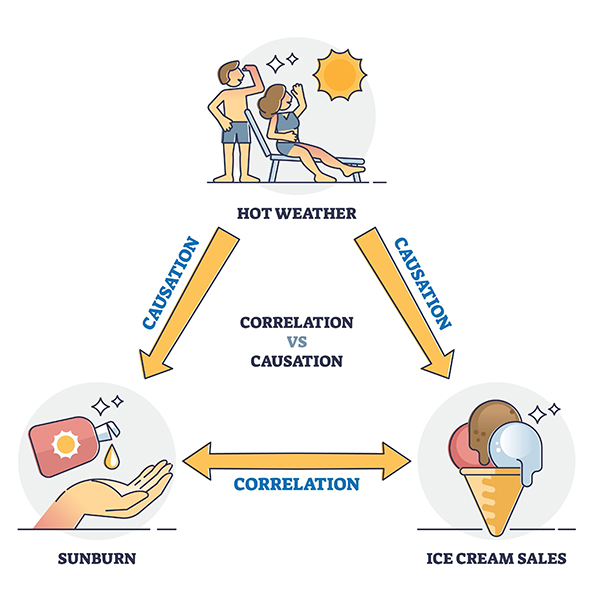
First, correlations are not directional (depression can cause insomnia, or impaired sleep can cause depression). Second, the problem of bidirectional causation means that each variable could influence the other (depression could trigger insomnia, and insomnia could worsen depression). Finally, the third variable problem occurs when a hidden variable affects both correlated variables (financial worries could disrupt sleep and worsen depression). Hot weather was the third variable in the Infographic above.
Check out the YouTube video Correlation vs. Causality: Freakonomics Movie.
Common Quasi-Experimental Designs
Although quasi-experimental designs have the superficial appearance of experiments, they do not create two or more IV levels and randomly assign participants to conditions. Two examples are pre-test/post-test designs and ex post facto studies.Pre-test/Post-test Design
In a pre-test/post-test design, researchers measure participants on the DV at least before and after administering training. For example, a practitioner could measure children's continuous attention (the DV) before and after NF training (the IV).
Since pre-test/post-test designs lack a control group, we cannot rule out the possibility that history or maturation threats or a placebo effect accounted for changes.
Confounding is a pervasive problem when the DV is a symptom (e.g., depression) that waxes and wanes. A client may enter NF training when depression is most severe and concludes training when it would naturally remit.
For these reasons, practitioners should not make claims regarding training effectiveness until their protocols have been evaluated by experimental studies that can rule out possible sources of confounding. The requirement of impartial experimental validation is particularly acute when a practitioner has a financial or reputational stake in a protocol and its related hardware and software.
Ex Post Facto Designs
"Ex post facto" means after the fact. Examples of ex post facto studies are comparisons of participants based on existing characteristics (e.g., the posterior dominant rhythm (PDR) frequency of 30-year-olds versus 60-year-olds) or self-selected treatments (e.g., the PDR frequency of individuals who chose NF versus mindfulness meditation).In the first example, participants may vary on characteristics other than age (e.g., the 30-year-olds may be healthier). In the second example, participants may differ in more ways than their self-regulation technique (e.g., individuals who chose NF training may have higher socioeconomic status). Since ex post facto studies do not create IV levels and randomly assign participants to conditions, they do not permit us to draw cause-and-effect conclusions.
Randomized Controlled Trials
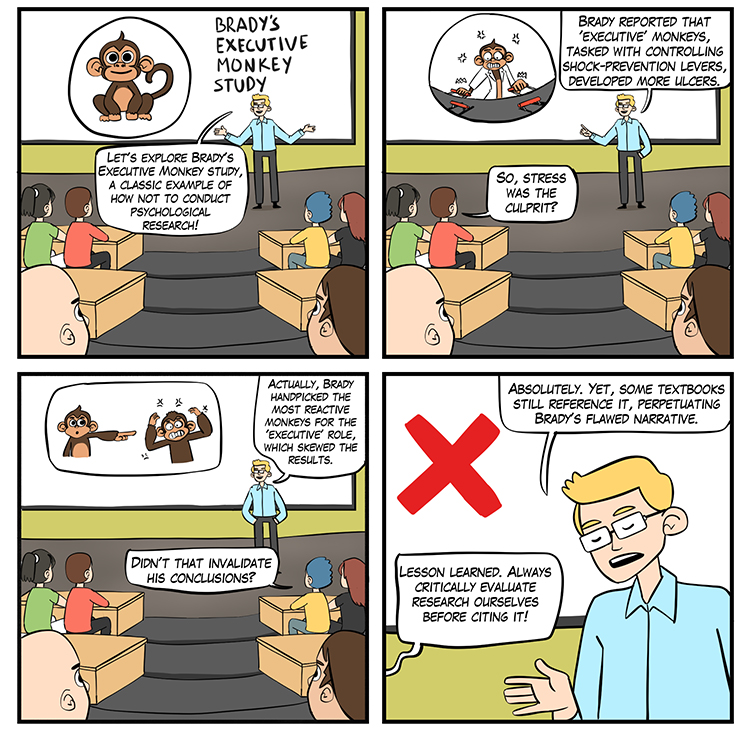
In a randomized controlled trial (RCT), researchers manipulate an independent variable and randomly assign participants to conditions, with or without, prior matching on participant variables (Bordens & Abbott, 2022). A RCT can achieve strong internal validity because matching and random assignment increase the likelihood that the groups will be identical on relevant participant characteristics at the start of an experiment. Check out the YouTube video Randomized Controlled Trials vs. Observational Studies. The Brady (1958) "Executive Monkey" study is a textbook example of how to confound an experiment.
Artist: Dani S@unclebelang. This WEBTOON is part of our Real Genius series.
The Brady Study
Brady pre-tested primates on their speed when performing a shock avoidance task and then assigned the faster learners to the executive condition and the slower learners to the yoked control condition. The executives could prevent a painful shock by pressing the control button at least once every 20 seconds. Failure to do this caused both the executive and yoked control participants to receive a shock. The controls had no control over the delivery of the painful shock.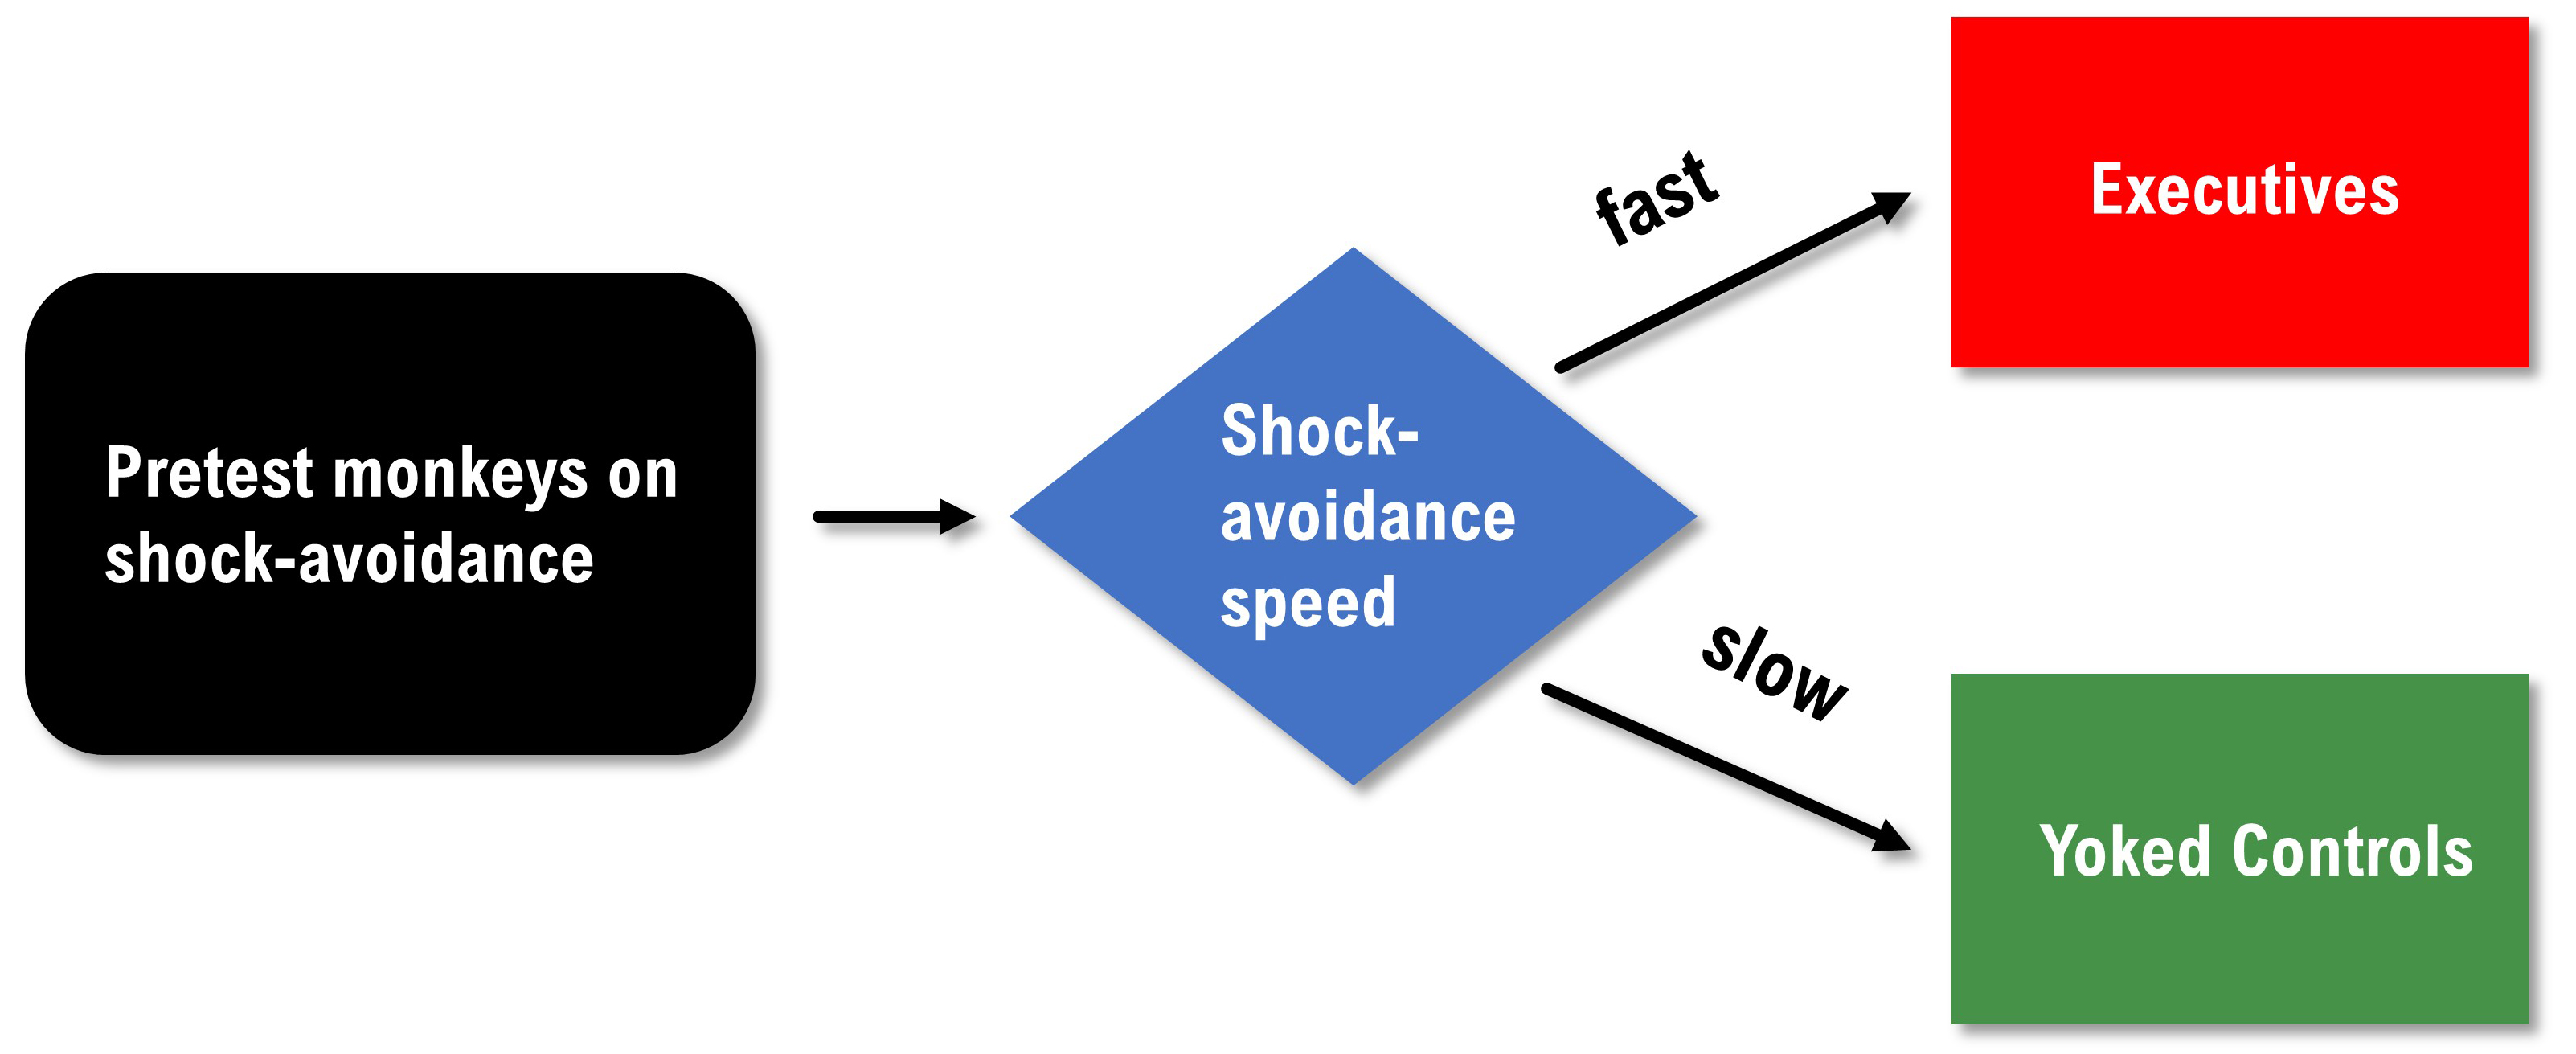
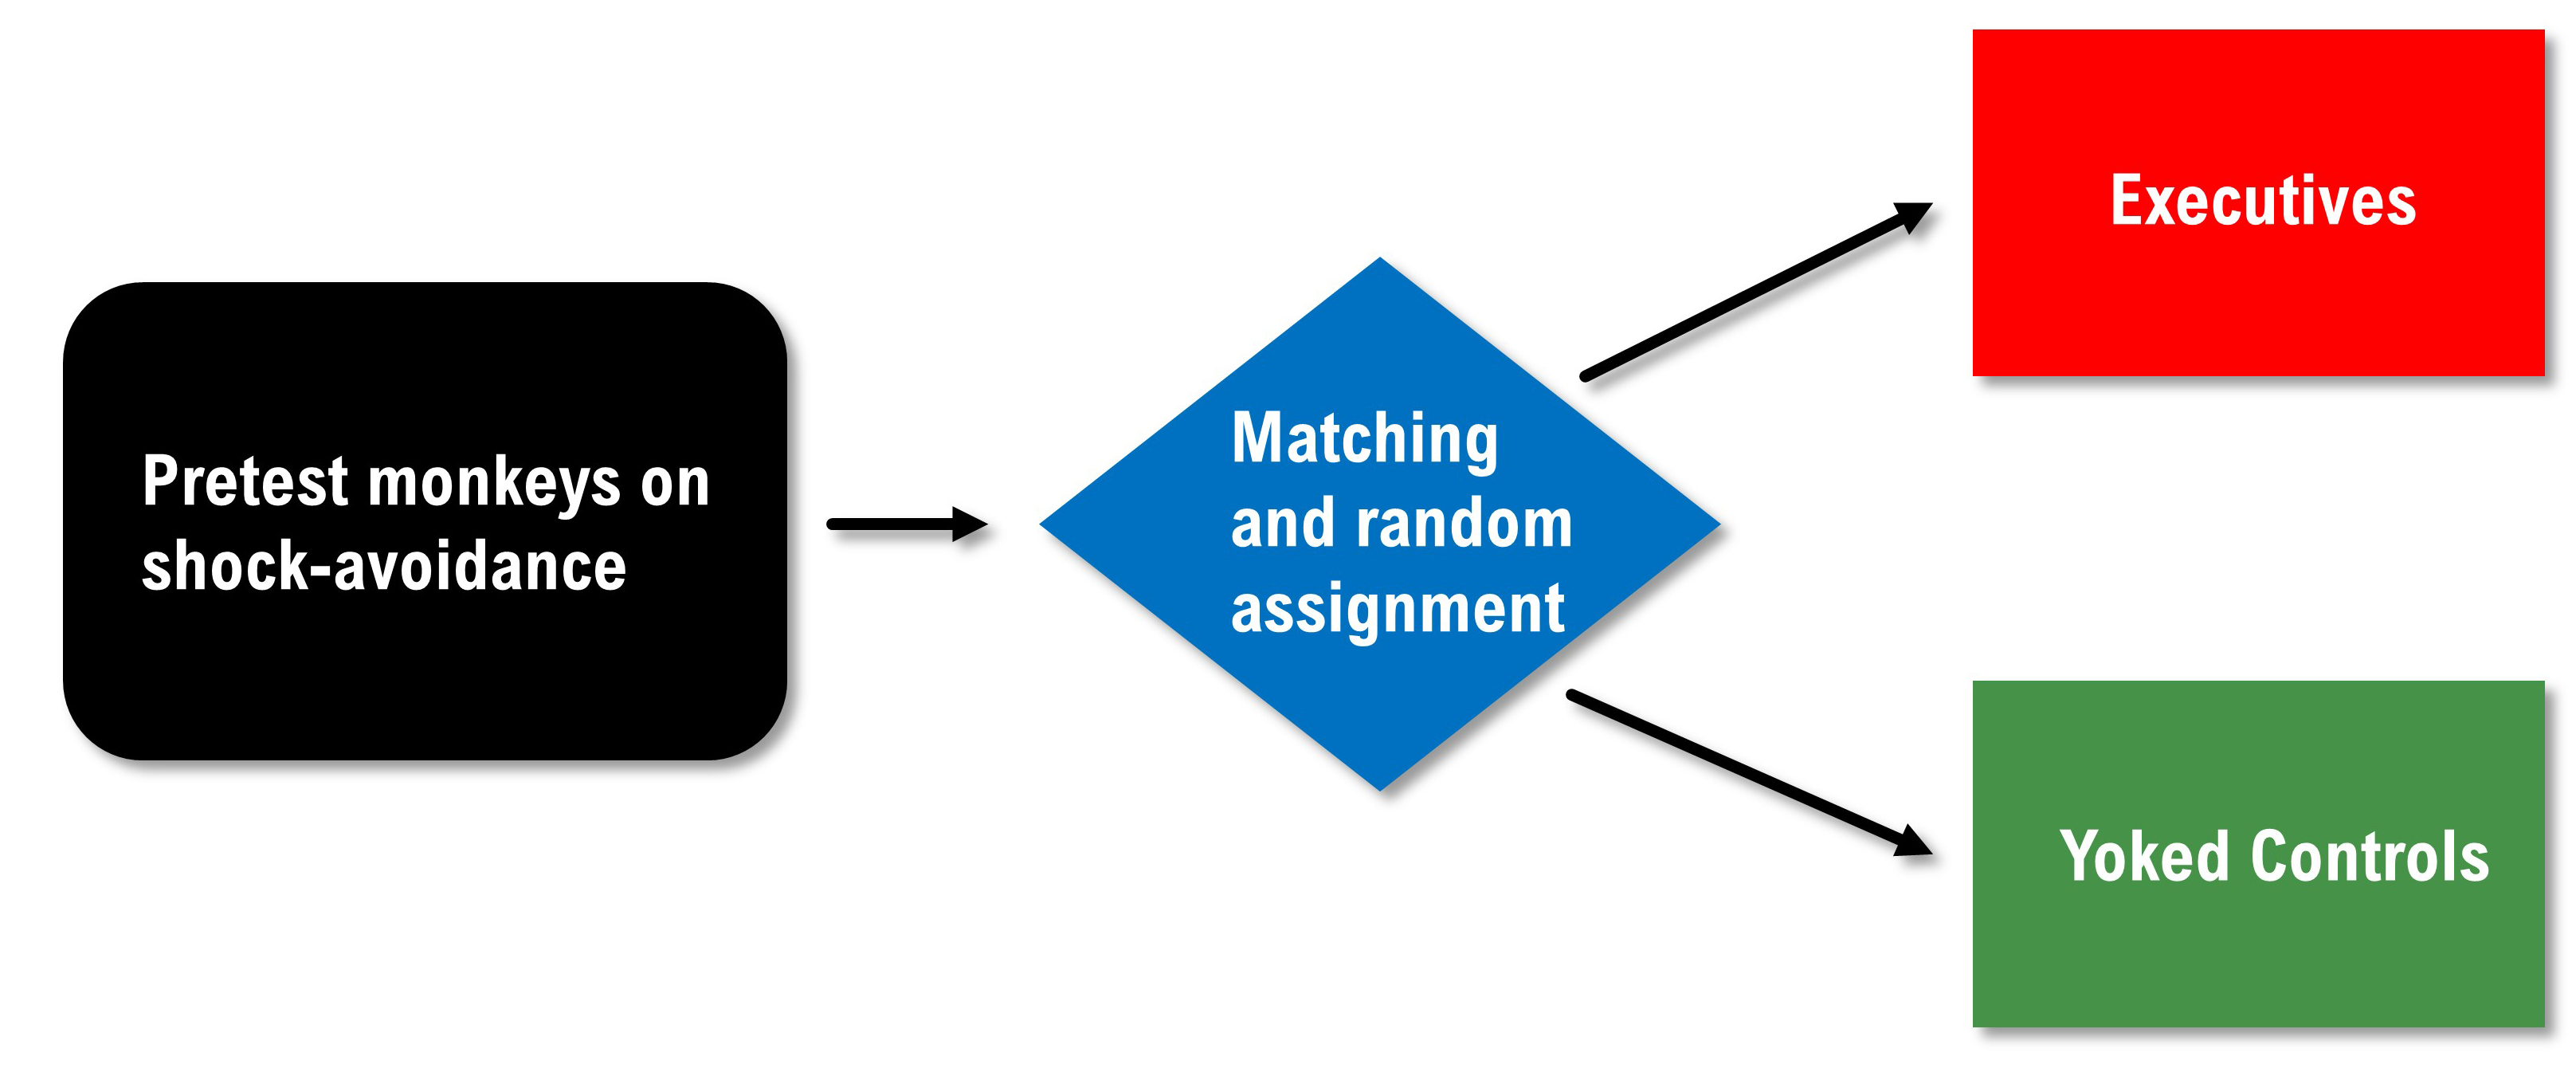
Brady reported that executives had many ulcers while the controls did not. Was this due to the executive's greater responsibility for avoiding painful shocks? We can't answer this question based on Brady's data because he confounded this study through a biased assignment. We have no reason to believe that the two groups had an equal risk of developing ulcers at the start of this study. Alternative explanations are that the executives were more sensitive to shock than the controls or were more ulcer prone. An internally valid redesign of the Brady study would pre-test the primates, match them on their speed of shock avoidance, and randomly assign them to the executive or yoked control conditions.
Weiss (1972) replicated the Brady study using rats and randomly assigned them to executive and control conditions. In contrast to Brady, he found that lack of control over shock was more stressful than the responsibility for pushing a control button to prevent shock. These findings are supported by organizational research that shows that executives experience lower rates of health problems like heart attacks and ulcers than their subordinates. The subordinates have less perceived control than management, which may contribute to less resilience.
There are three essential takeaways from Weiss' replication of the Brady study. First, lack of control–and not responsibility–can contribute to illness. Second, educators and textbook authors often do not evaluate the internal validity of studies they quote. Third, poorly designed research has a long half-life. While the Brady study was reported in 1958, textbooks in disciplines as diverse as Business and Health Psychology still recycle Brady's flawed conclusions.
Specific and Nonspecific Treatment Effects
Treatment effects can be specific and nonspecific. A specific treatment effect is a measurable symptom change associated with a measurable psychophysiological change produced by BF. For example, there would be a specific treatment effect on airway resistance in a patient diagnosed with asthma if decreased resistance were correlated with increased heart rate variability (HRV).A nonspecific treatment effect is a measurable symptom change not correlated with a specific psychophysiological change. For example, researchers might report that NF to reduce fast beta produced larger reductions in state anxiety (situational anxiety) than Progressive Relaxation with the caveat that the fast-beta amplitude and state anxiety changes were not correlated.
In this case, demand characteristics may have contributed to state anxiety reduction. Since effective NF and accepted medical treatments produce specific and nonspecific treatment effects, it is vital to control demand characteristics in clinical outcome studies to ensure internal validity and understand the mechanisms of action.
The Search for an Appropriate Control Condition
A control group receives a zero level of the independent variable. While placebos are easy to administer in pharmaceutical research, researchers find that selecting an appropriate control group is challenging in NF research. Weak control conditions can stack the deck in favor of the experimental condition, defeating the purpose of an experiment. Graphic © Sashkin/ Shutterstock.com.
No-biofeedback control groups include baseline only, waiting list, and relaxation conditions. Participants in a baseline-only condition are only measured on the DVs and receive no treatment. Individuals assigned to a waiting list are measured on the DVs with the expectation of later NF training. participants in a relaxation condition receive instructions like Autogenic phrases. These three control strategies are not equivalent to the experimental condition because their demand characteristics are often weaker (e.g., none of these controls provide physiological feedback). Their activities are less engaging than BF training.
Biofeedback control groups include noncontingent feedback, reverse contingent feedback, and contingent feedback of an unrelated response. In noncontingent feedback, participants receive false pre-programmed feedback that may be easy (e.g., heart rate) or hard (e.g., slow cortical potentials) to detect. Noncontingent feedback can be frustrating when participants perceive that feedback is inconsistent with internal cues and that they cannot learn to control the signal. Since noncontingent feedback is inherently deceptive, the researchers mustexplain this deception during debriefing.
Reverse contingent feedback reinforces physiological changes in the opposite direction as the experimental group (e.g., alpha down instead of alpha up).
Finally, contingent feedback of an unrelated response reinforces physiological changes in a system that should not powerfully affect the DVs (e.g., skin conductance down versus alpha up).
Reverse contingent feedback and contingent feedback of an unrelated response can serve as effective control conditions as long as participants experience comparable engagement and training success. Reverse contingent feedback should not be used when the physiological changes could harm participants (e.g., HRV down).
Case Study Designs
In case studies, a researcher compiles a descriptive study of a participant's experiences, observable behaviors, and archival records kept by an outside observer (Myers & Hansen, 2012).Case studies have several advantages and limitations.
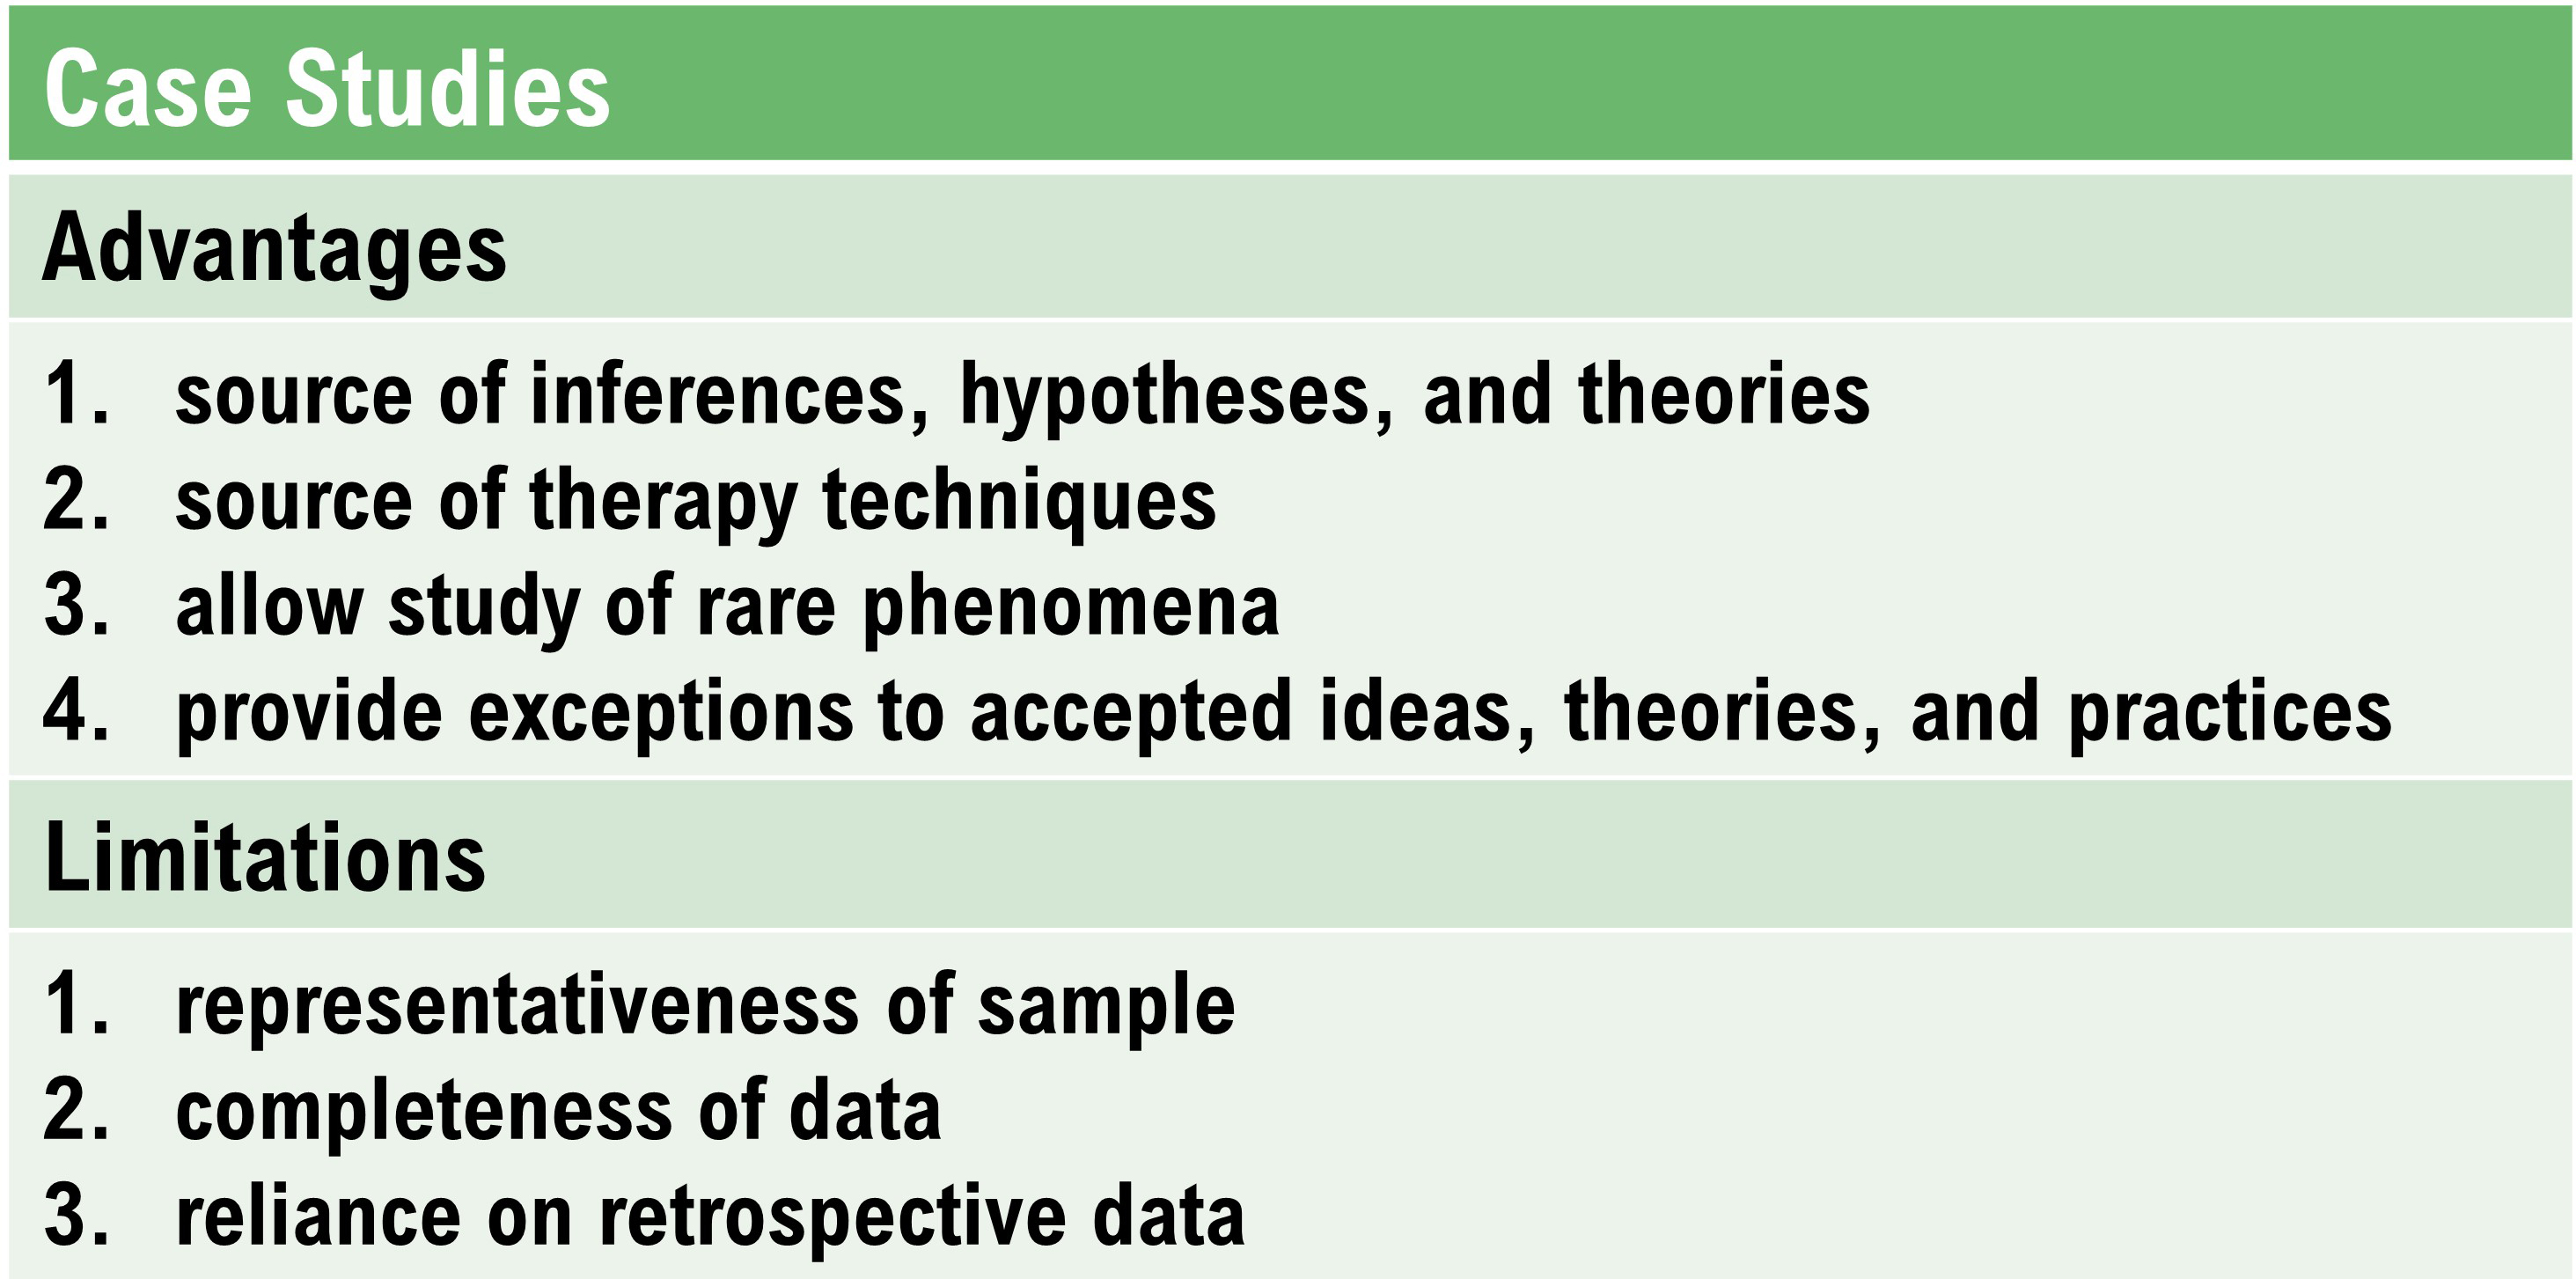
In NF research, a case study is a record of patient experiences and behaviors compiled by a therapist and is nonexperimental. A therapist documents change in patient symptoms across the phases of treatment but cannot prove that the change was due to biofeedback training. A descriptive case study might use an AB design, where A is the baseline phase and B is the treatment phase.
Small-N Designs
N represents the number of participants required for an experiment. Classic experiments like Peniston and Kulkosky's (1990) alcoholism study utilized large-N designs that compared the performance of groups of participants (those who received alpha-theta NF and those who received conventional medical treatment).A small-N design examines one or two participants. The individual featured below learned to control a synthesizer by manipulating his EEG.

A clinical psychologist could use a small-N design to test a treatment when there are insufficient participants to conduct a large N study and when they want to avoid the ethical problem of an untreated control group. Animal researchers prefer small-N designs to minimize the acquisition and maintenance cost, training time, and possible sacrifice of their animal participants.
Small-N designs have been most extensively used in operant conditioning research. B. F. Skinner examined the continuous behavior of individual participants in preference to analyzing discrete measurements from separate groups of participants.
Small-N researchers often use variations of the ABA reversal design to participate in all treatment conditions. A participant is observed in a control condition (A), treatment condition (B), and then returns to the control condition. The requirement for this design is that the treatment is reversible.
In both large- and small-N designs, baselines are control conditions that allow us to measure behavior without the influence of the independent variable.
Removing the independent variable and returning to baseline are crucial in ruling out confounding.
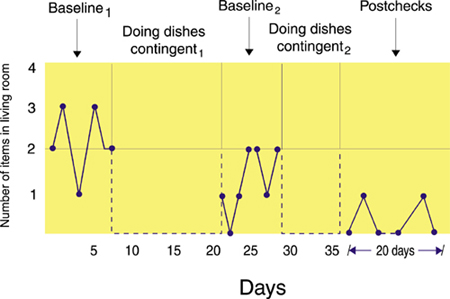
The return to baseline, which may be repeated several times, is needed to rule out the effects of extraneous variables like history and maturation threats.An ABABA design is illustrated below. Baseline1 measured the number of items of clothing the husband leaves in the living room. Doing dishes contingent1 penalized the husband with dishwashing when he left more clothes in the living room than his wife. Baseline2 measured the number of clothes the husband left in the living room without penalty. Doing dishes contingent2 penalized the husband with dishwashing when he left more clothes in the living room than his wife. Post-checks measured the dependent variable after completion of training to assess the maintenance of behavior change, which was picking up clothing. John Balven adapted the illustration below from Myers and Hansen (2012).
Many clinical reversal studies do not return to a final baseline because it would be unethical to risk patient relapse after treatment appeared to improve behavior. When a reversal study does not end with a baseline condition, we can't rule out the possibility that an extraneous variable caused the patient's clinical improvement.
A multiple baseline design overcomes the ethical problem of withdrawing an effective treatment by never withdrawing a treatment. Instead, this approach uses baselines of different lengths to measure the same behavior at different times or locations, or other behaviors.
C. Basic Statistics and Differences Between Parametric vs. NonParametric Statistics
Basic statistics include descriptive and inferential statistics. Descriptive statistics report the attributes of a sample of scores. Measures of central tendency and variability are two important families of descriptive statistics (Myers & Hansen, 2012).
Measures of Central Tendency
Measures of central tendency are descriptive statistics that describe the typical score within a sample. Three measures of central tendency are the mean, median, and mode.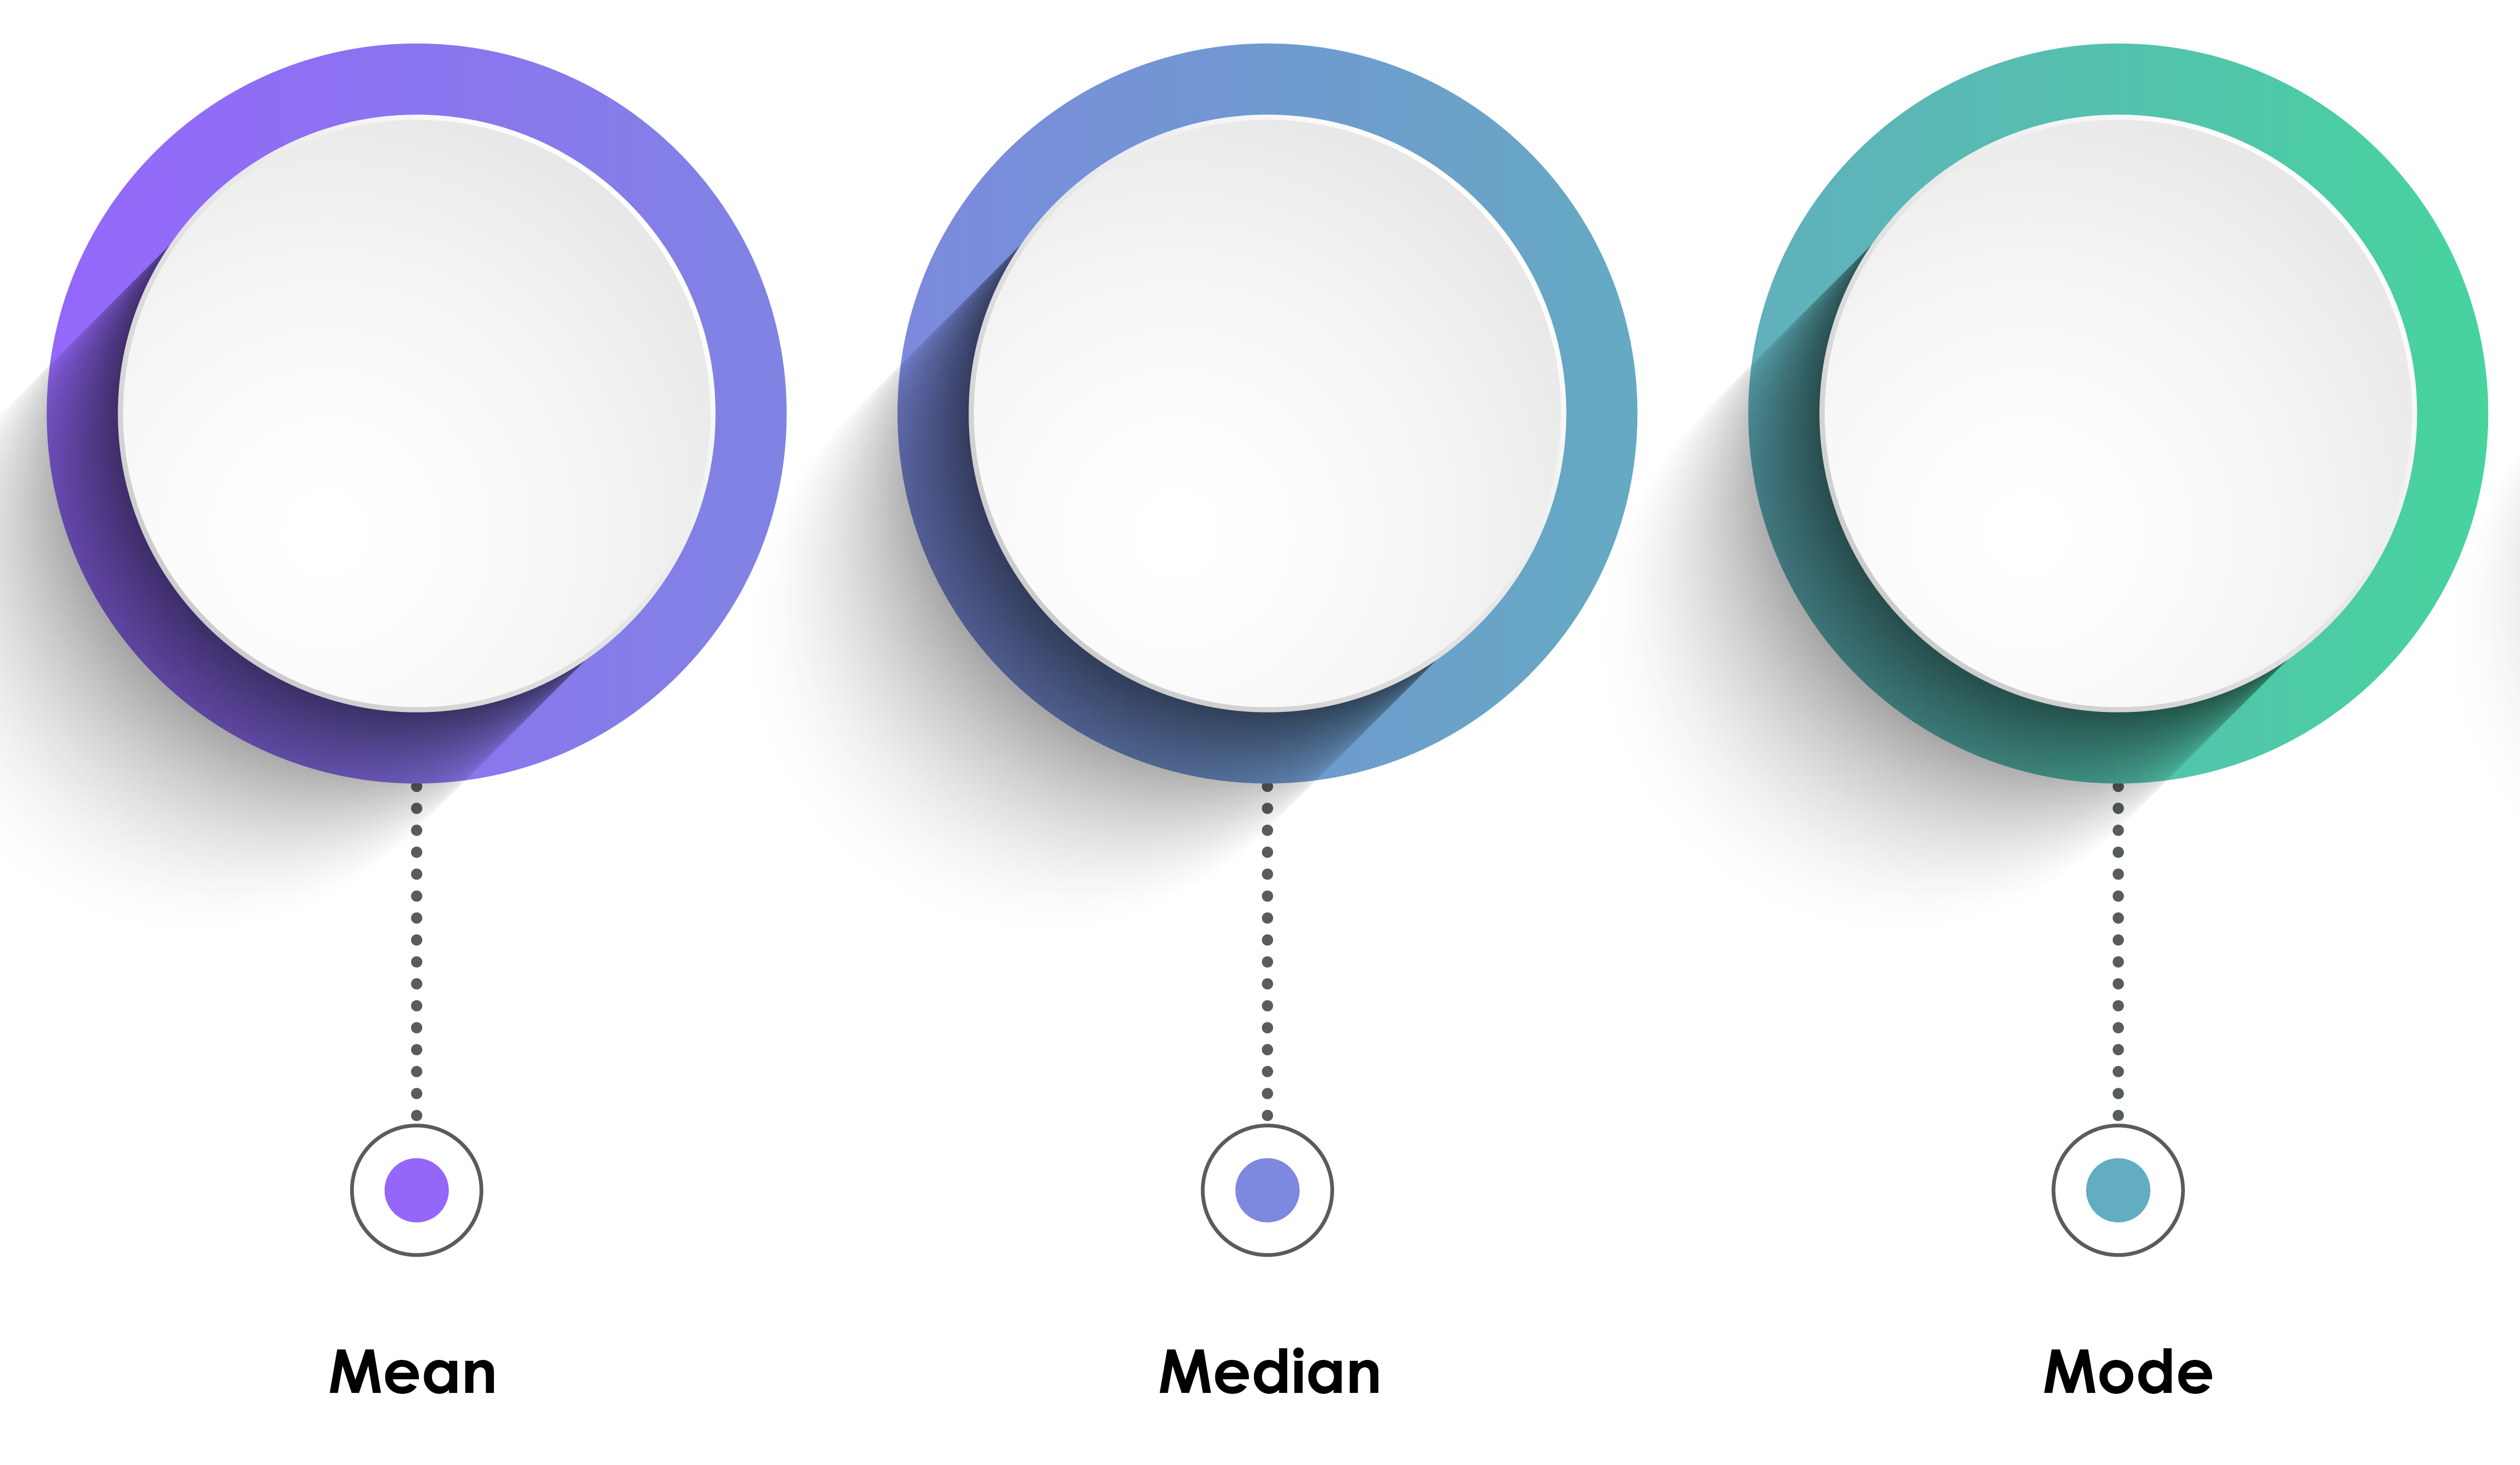
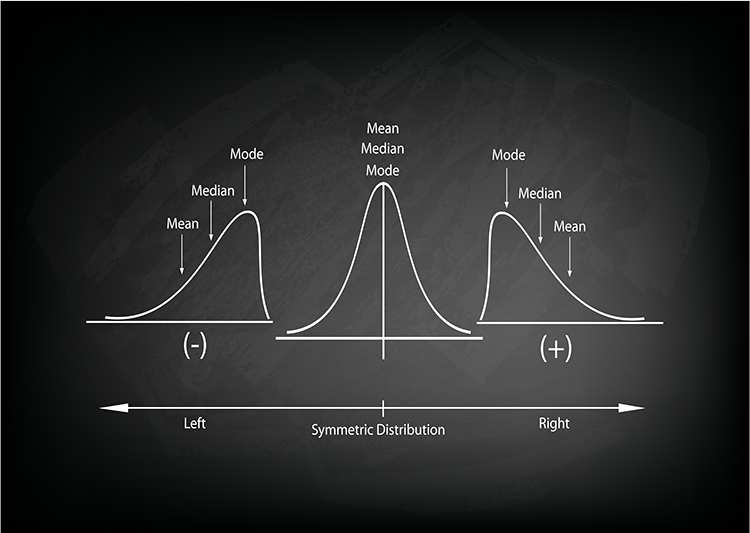
Their relative position depends on a distribution's symmetry. The mean is lower than the median and mode when a distribution is skewed to the left. The mean is higher than its counterparts when a distribution is skewed to the right. Graphic © Iamnee/iStockphoto.com.
The mean is the arithmetic average and the most commonly reported measure of central tendency. The mean's principal limitation is its vulnerability to outliers (extreme scores).
The median divides the sample distribution in half. The median is the middle score or the average of two middle scores. Since the median is unaffected by outliers, statisticians prefer it to the mean when extreme scores are present.
The mode is the most frequent score calculated when there are at least two different sample values. There may be no mode or multiple modes.
Measures of Variability
Statistical measures of variability like the range, standard deviation, and the variance index the dispersion in our data. There is no variability [all of these measures are 0] when all sample scores are identical.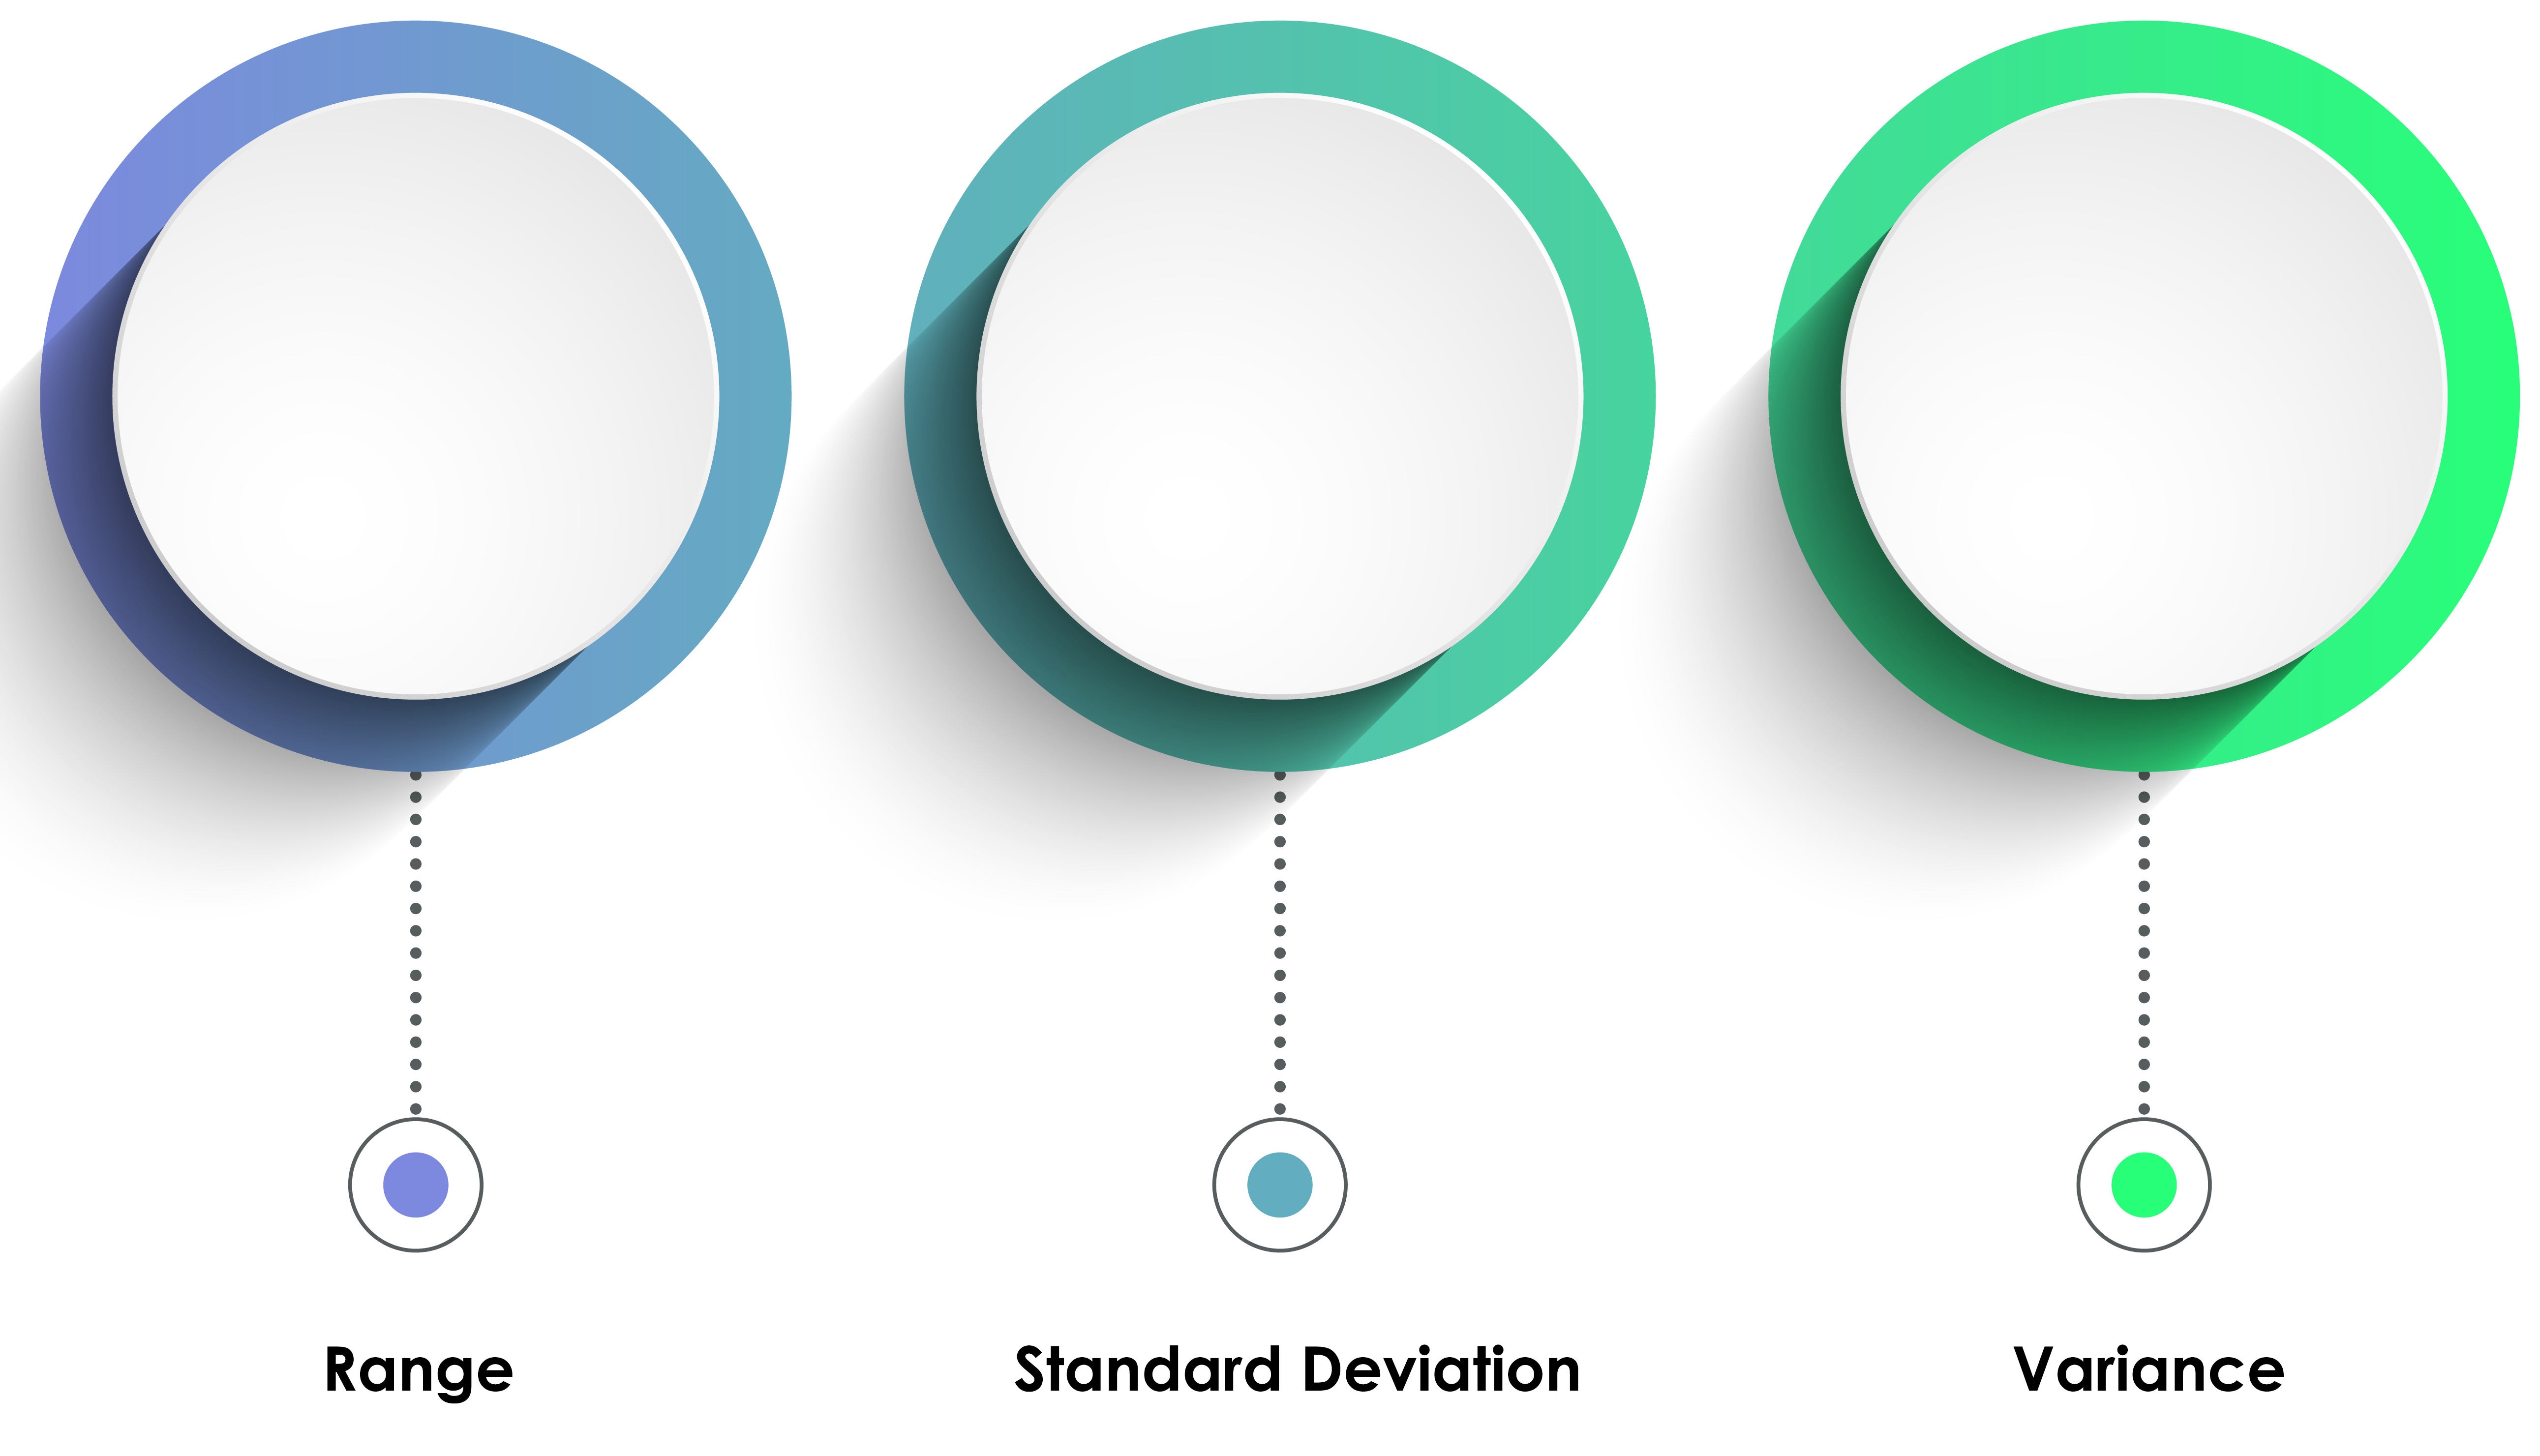
The range is the difference between the lowest and highest values (or this difference minus 1). For example, for 5, 10, 20, and 25, the range is 20. Since the range is calculated using only two scores in a series, it can be influenced by outliers and cannot show whether data are evenly distributed or clumped together.
The standard deviation is the square root of the average squared deviations from the mean. For example, for 2, 4, 4, 4, 5, 5, 7, and 9, the standard deviation is the square root of 4, which is 2. When the standard deviation is low, the data points cluster more closely about the mean. When it is high, scores are distributed farther from the mean. The standard deviation better characterizes the dispersion of scores than the range since it uses all of the data points and is not distorted by outliers.
When values are normally distributed, the percentage of scores within 1, 2, and 3 standard deviations from the mean are 68%, 95%, and 99.7%, respectively. Graphic © Elena Pimukova/Shutterstock.com.
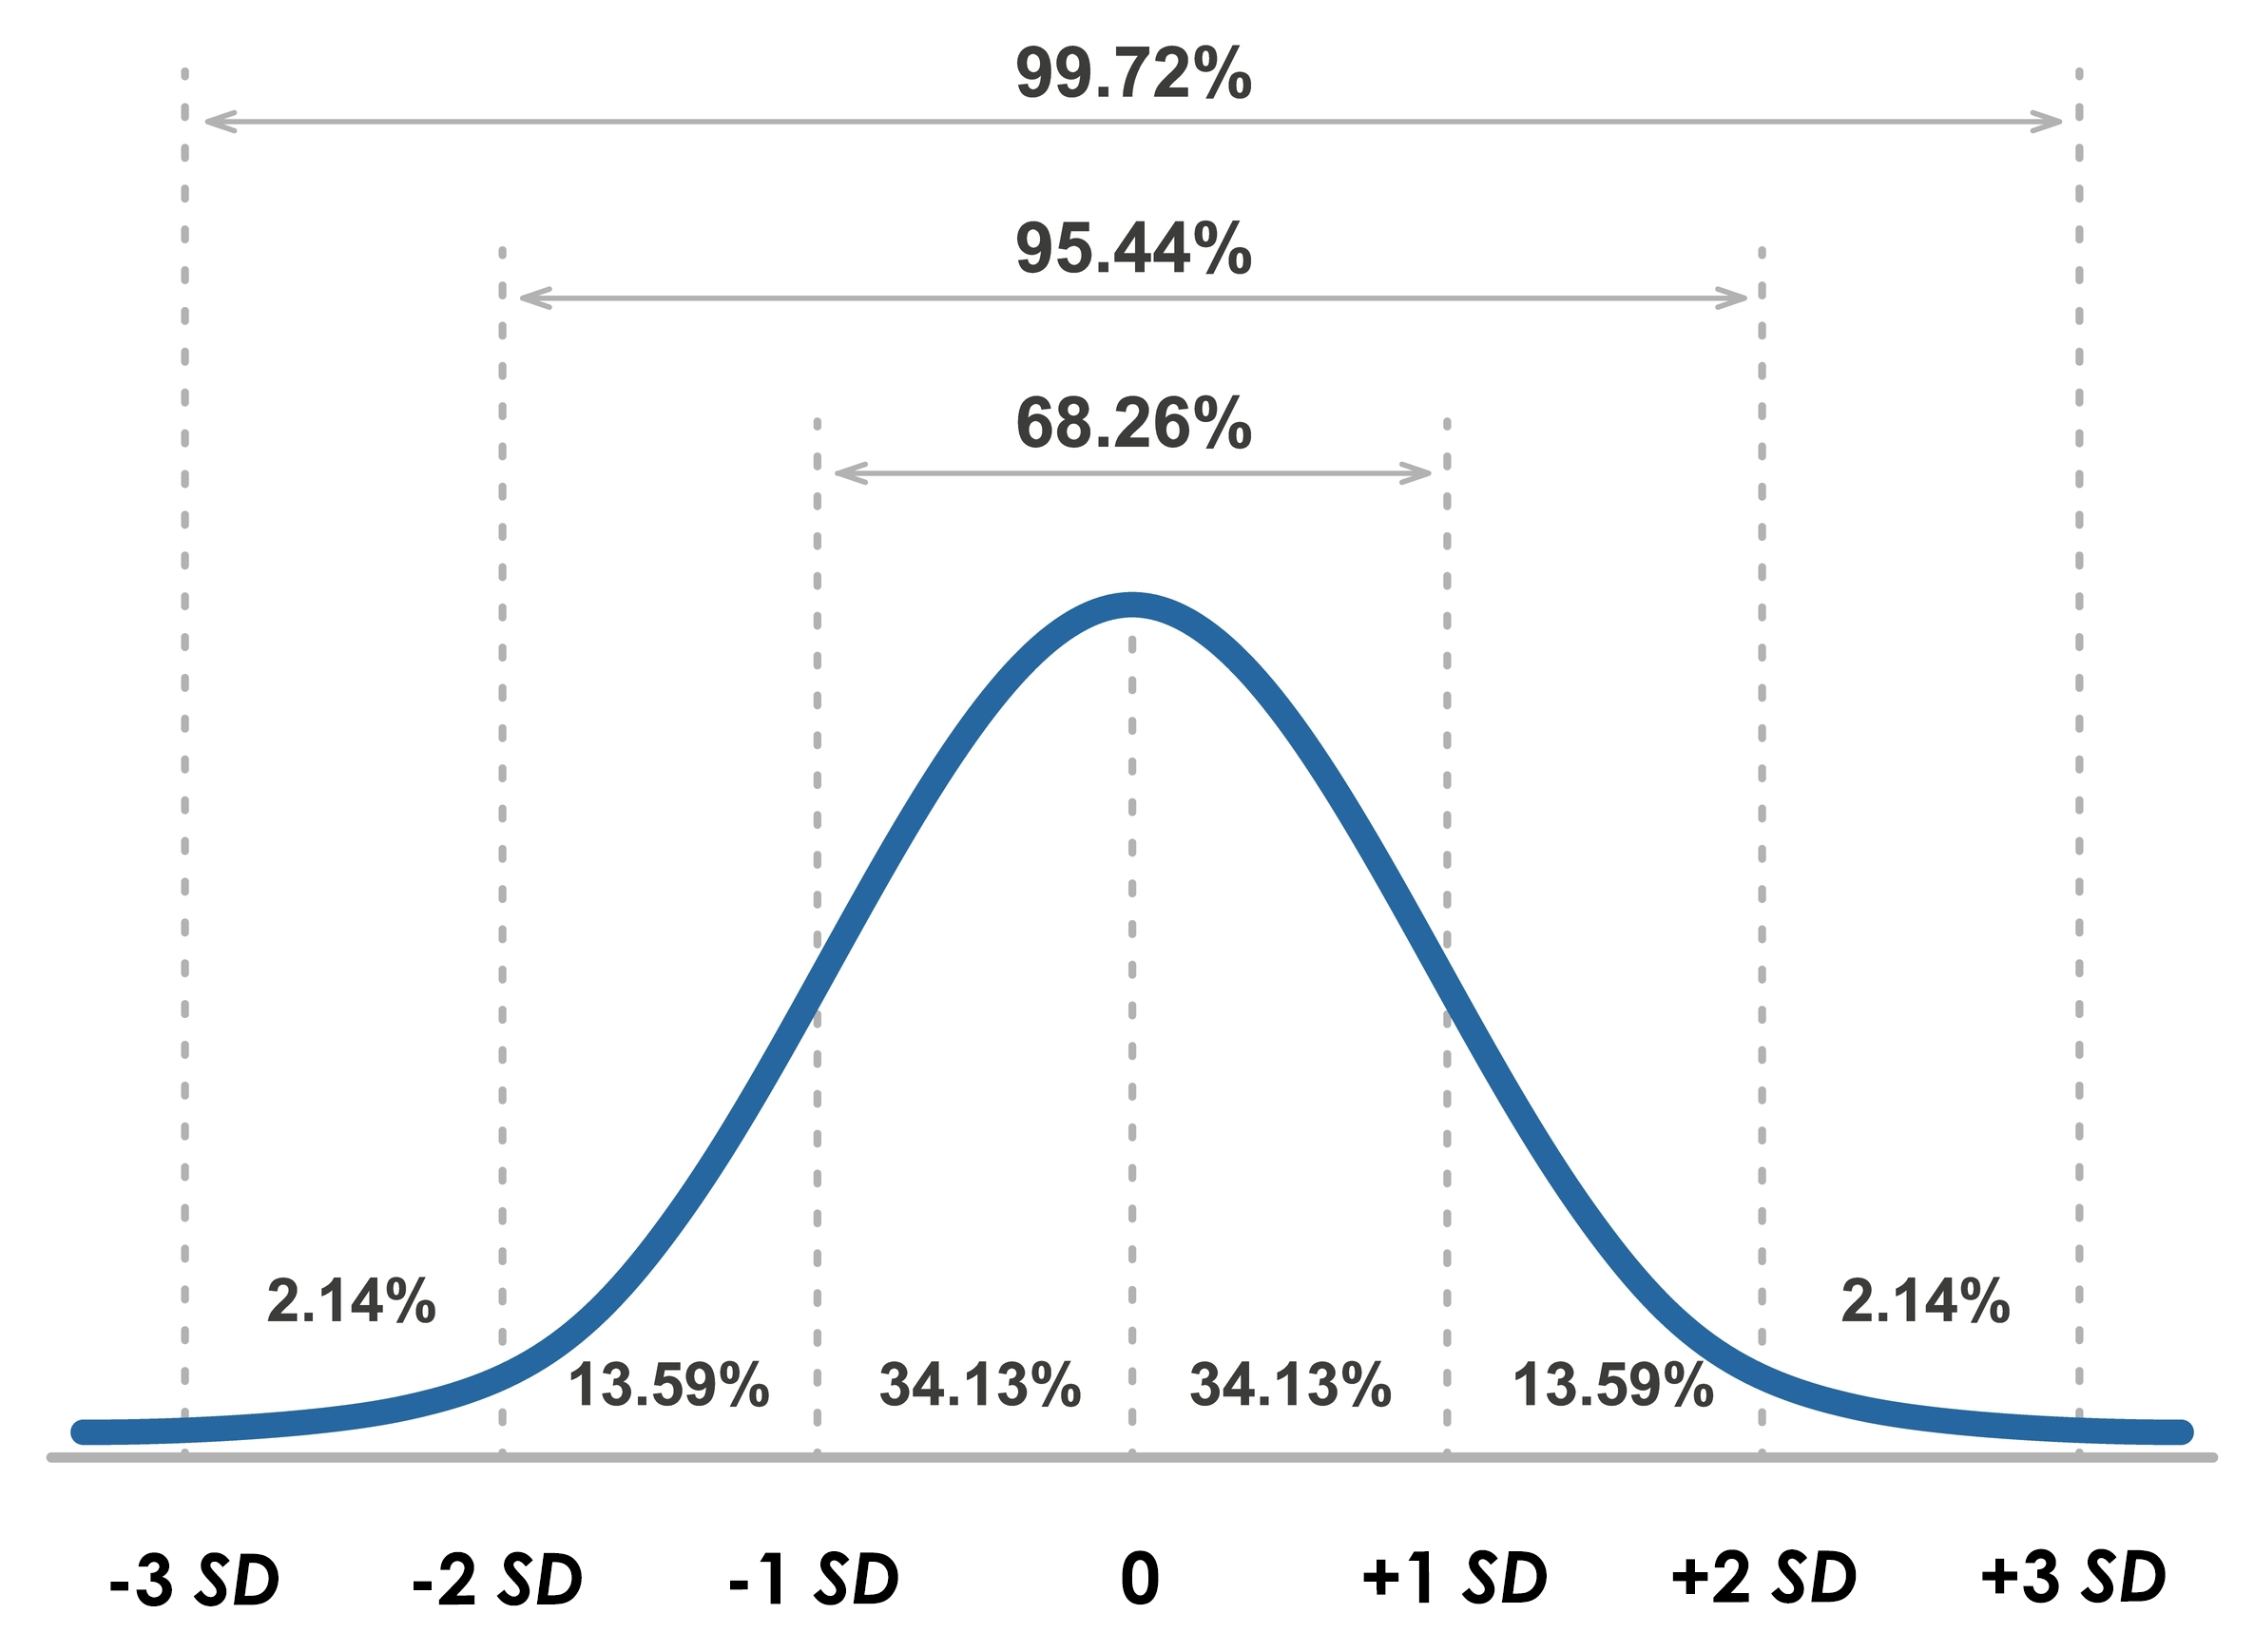
Clinicians use the standard deviation to determine whether physiological measurements or psychological test scores differ significantly from the standardization sample mean. In NF, z-score training protocols attempt to reduce the discrepancy in real-time between instantaneous EEG values and values within a normative database. Graphic retrieved from breakthroughpsychologyprogram.com.
Check out the YouTube video What Is The Standard Deviation?
The variance is the average squared deviation of scores from their mean and is the square of the standard deviation. For example, for 2, 4, 4, 4, 5, 5, 7, and 9, the variance is 4. A disadvantage of the variance compared with the standard deviation is that it is reported in squared units.
Parametric vs. Nonparametric Statistics
Inferential statistics include parametric and nonparametric statistical methods. These approaches attempt to draw conclusions about the population using sample data. They differ in their underlying assumptions, the types of data they handle, and the statistical inferences they can make.Assumptions
Parametric statistics make assumptions about the population parameters and the distribution of the data. Commonly, these methods assume data to be normally distributed, homogeneity of variances (equal variances) among groups, and independence of observations. Examples of parametric tests include t-tests, Analysis of Variance (ANOVA), and regression analysis (Corder & Foreman, 2014).Nonparametric statistics, on the other hand, do not make strong assumptions about the population parameters and are distribution-free. Therefore, they can be applied to non-normal data, including ordinal data and nominal data. Examples of nonparametric tests include the Mann-Whitney U test, Kruskal-Wallis H test, and Spearman's rank correlation coefficient (Hollander, Wolfe, & Chicken, 2013).
Types of Data
Parametric statistics are used when the data are measured on an interval or ratio scale. This method is appropriate when the data conforms well to a normal distribution (Field, 2013).Nonparametric statistics are used when the data are measured on an ordinal or nominal scale. This method is appropriate when the data does not meet the assumptions of parametric methods, for instance, when the data is skewed, or the sample size is too small to determine the distribution. (Sprent & Smeeton, 2001).
Statistical Inference
Parametric tests generally have greater statistical power compared to nonparametric tests given that their assumptions are met, as they make use of more specific information about the population (Zar, 2010).Inferential statistics allow researchers to test hypotheses. Hypotheses are predictions of the relationship between the IV and DV. Inferential statistics like the F-test and t-test allow researchers to test the null hypothesis, the prediction that IV did not affect the DV. When the difference between the experimental and control conditions scores is greater than what we should expect from normal variability in the population, we reject the null hypothesis because our findings are statistically significant (probably not due to chance).
Statistical significance is the lowest bar in inferential statistics because it only means a rare event has occurred.
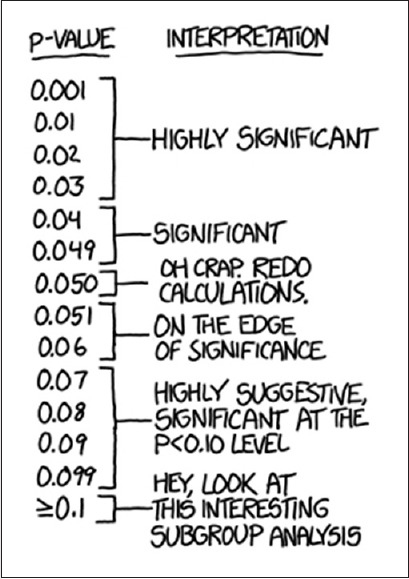
Caption: “If all else fails, use ‘significant at p > 0.05 level’ and hope no one notices.” (http://xkcd.com/1478/, Randall Munroe, Creative Commons Attribution-NonCommercial 2.5 License).
Christopher Zerr (2021) likens a significant outcome to a sighting of a Black Swan since these are uncommon. Graphic © Andreas Prott/Shutterstock.com.

Statistical significance does not reveal the magnitude of the treatment effect, called its effect size. Following Christopher's analogy, statistical significance doesn't convey whether the Black Swan is lilliputian or mammoth. Effect size is a higher bar because large effect sizes are more likely to be replicated and produce important clinical or performance outcomes.

Nonparametric tests are more robust against violations of assumptions and can be used when the distribution of the data is unknown or not normally distributed. However, these tests may be less powerful (i.e., have a lower chance of detecting a significant effect when one exists) compared to parametric tests when the assumptions of the latter are met (Gibbons & Chakraborti, 2011).
These are broad generalizations, and the choice between parametric and nonparametric methods should be based on the specific research question, the nature and quality of the data, and the assumptions of each method.
E. Definitions of Types of Validation and Reliability
Validity and reliability are key components in establishing the soundness of measurement in research, including in medical and psychological fields.
Validity
Validity refers to the extent to which a test measures what it claims to measure. In other words, validity is about accuracy. The major types of validity include content, criterion, and construct validity.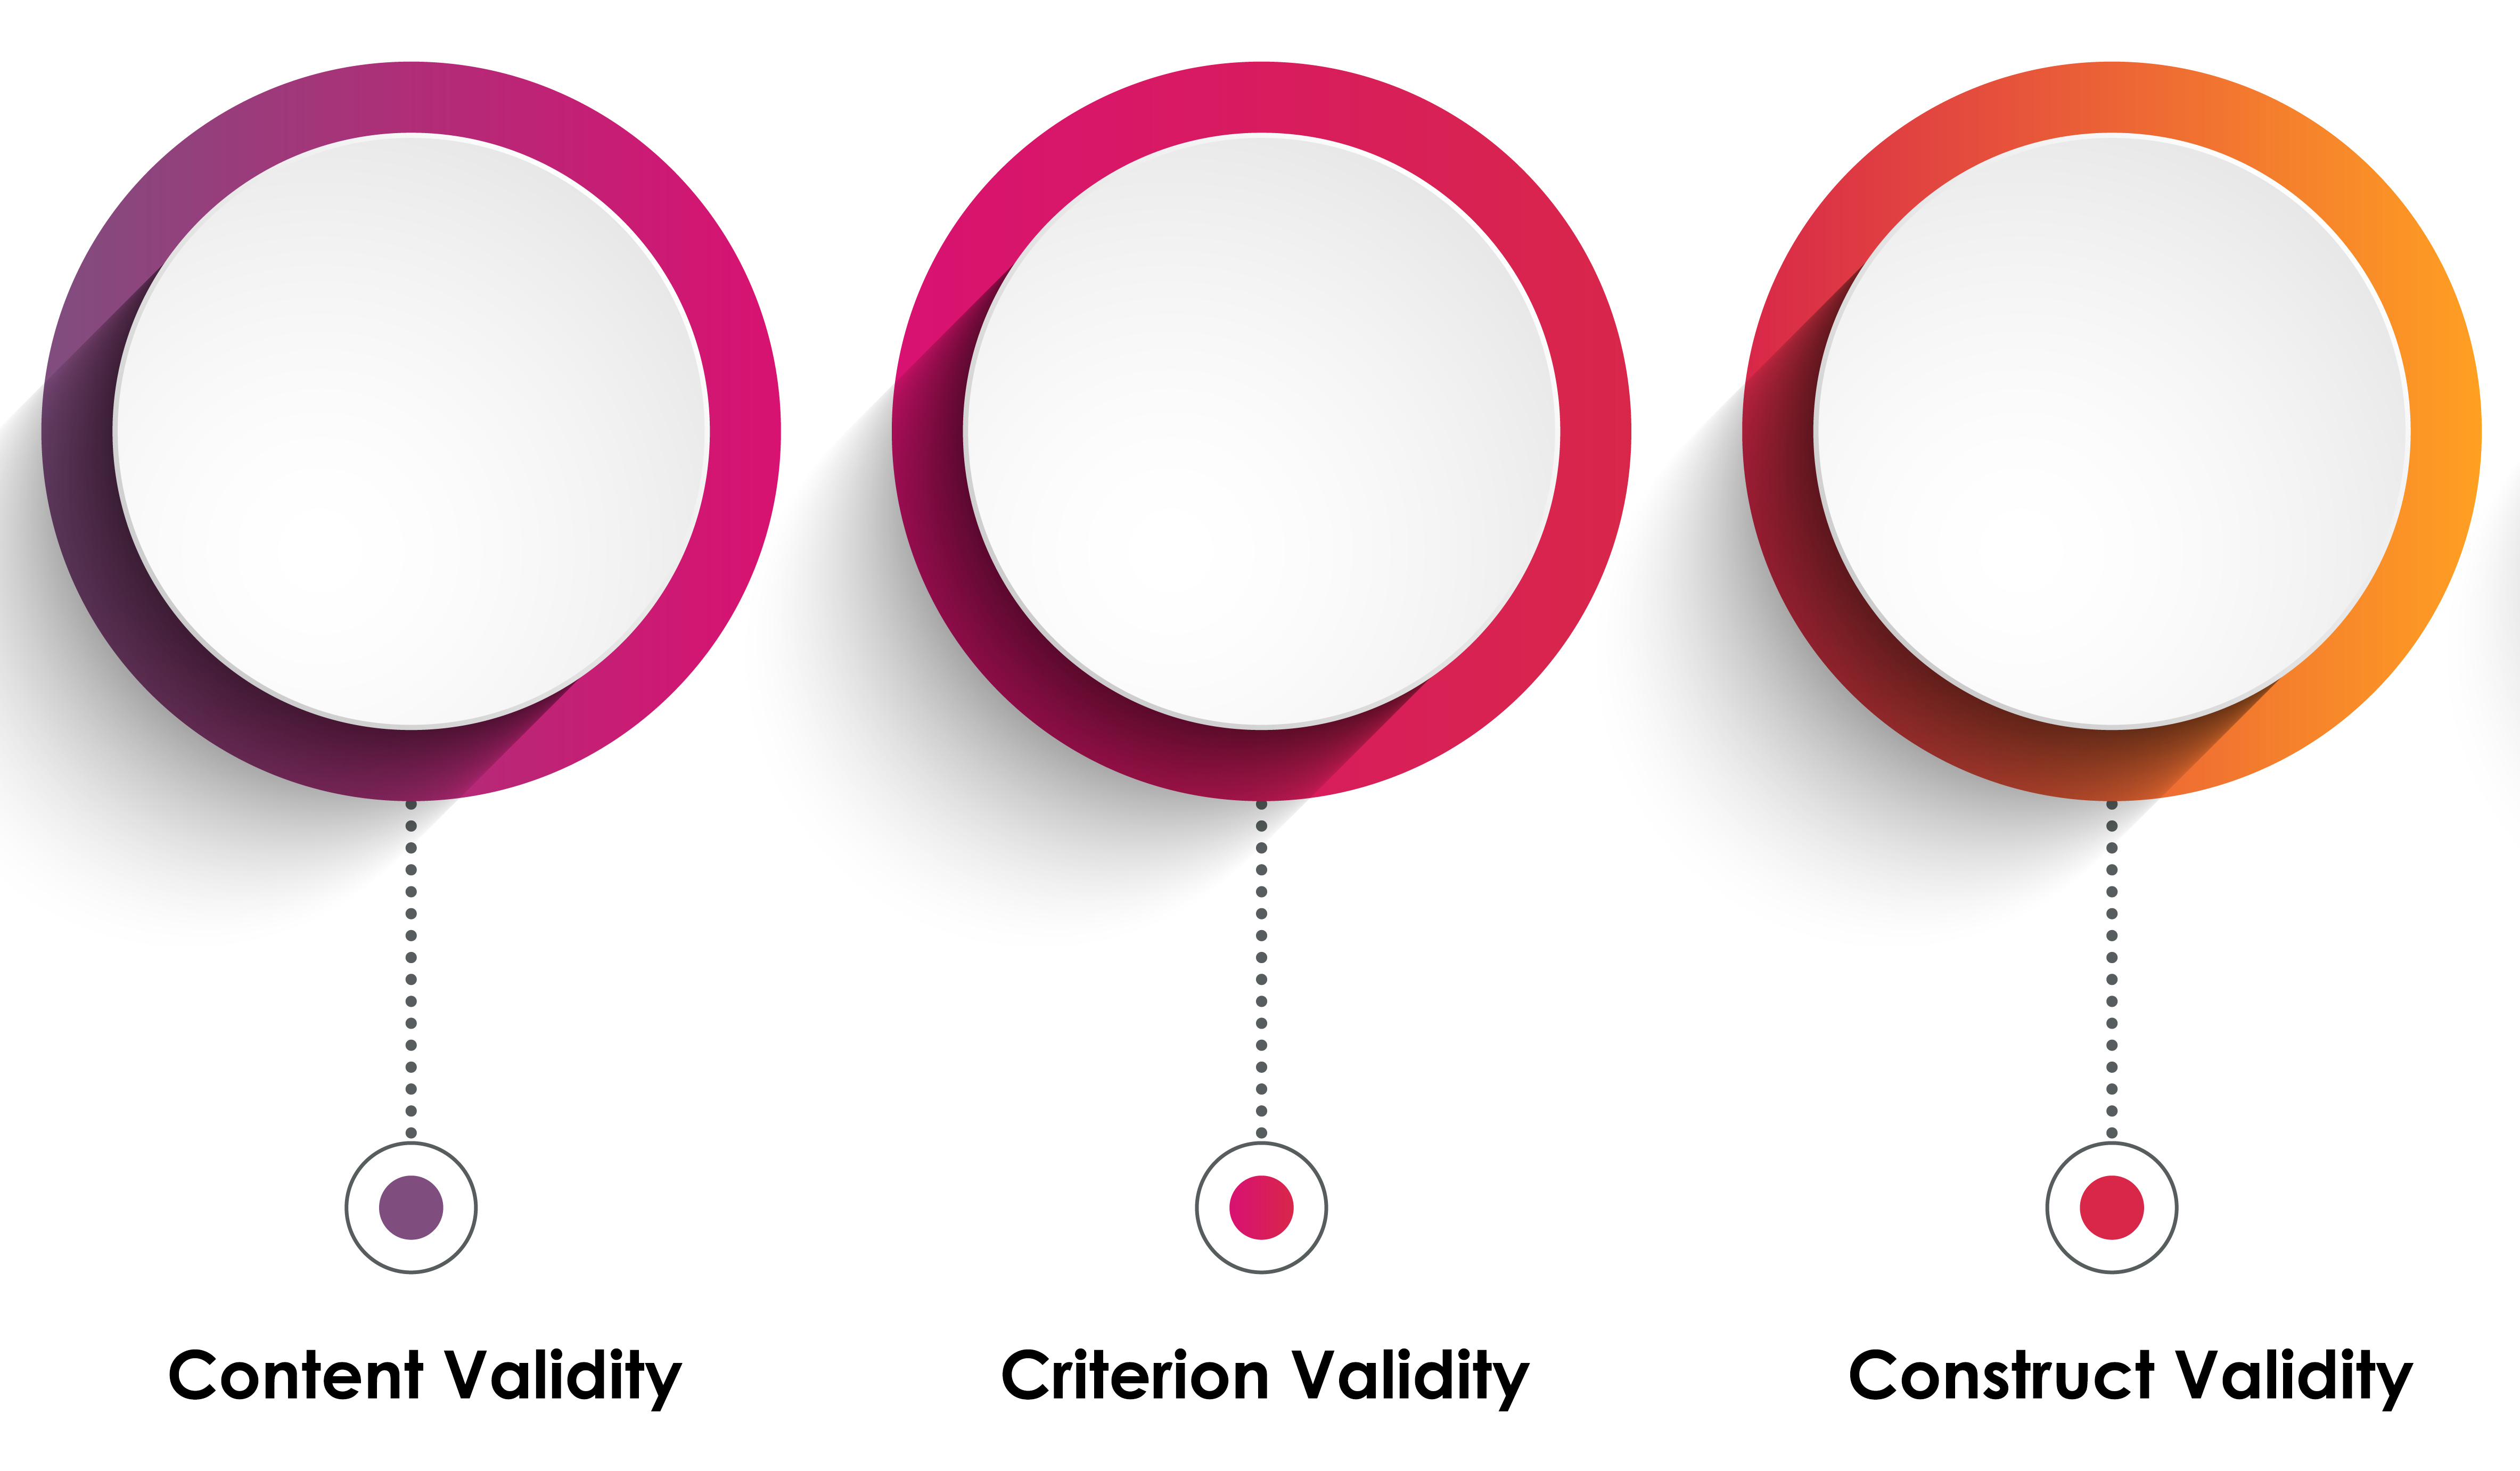
Content validity refers to the extent to which a measure represents all facets of a given construct. For example, a depression scale should cover all aspects of depression and not just focus on one aspect such as mood (Haynes, Richard, & Kubany, 1995).
Criterion validity assesses whether a test reflects a certain set of abilities. Criterion validity is often divided into concurrent validity (measurements taken at roughly the same time) and predictive validity (ability of the measure to predict future occurrences of the criterion). For example, the SAT test would be said to have criterion validity if it accurately predicts college GPA (Salkind, 2010).
Construct validity refers to the degree to which a test measures the theoretical construct it is intended to measure. It often involves correlating the test with other measures or outcomes (convergent validity) or showing lack of correlation with dissimilar, unrelated constructs (divergent or discriminant validity; Messick, 1995).
Reliability
Reliability refers to the consistency or repeatability of a measure. If the same measurement is repeated and produces similar results, it is said to be reliable. The major types of reliability include test-retest, inter-rater or inter-observer, and internal consistency reliability.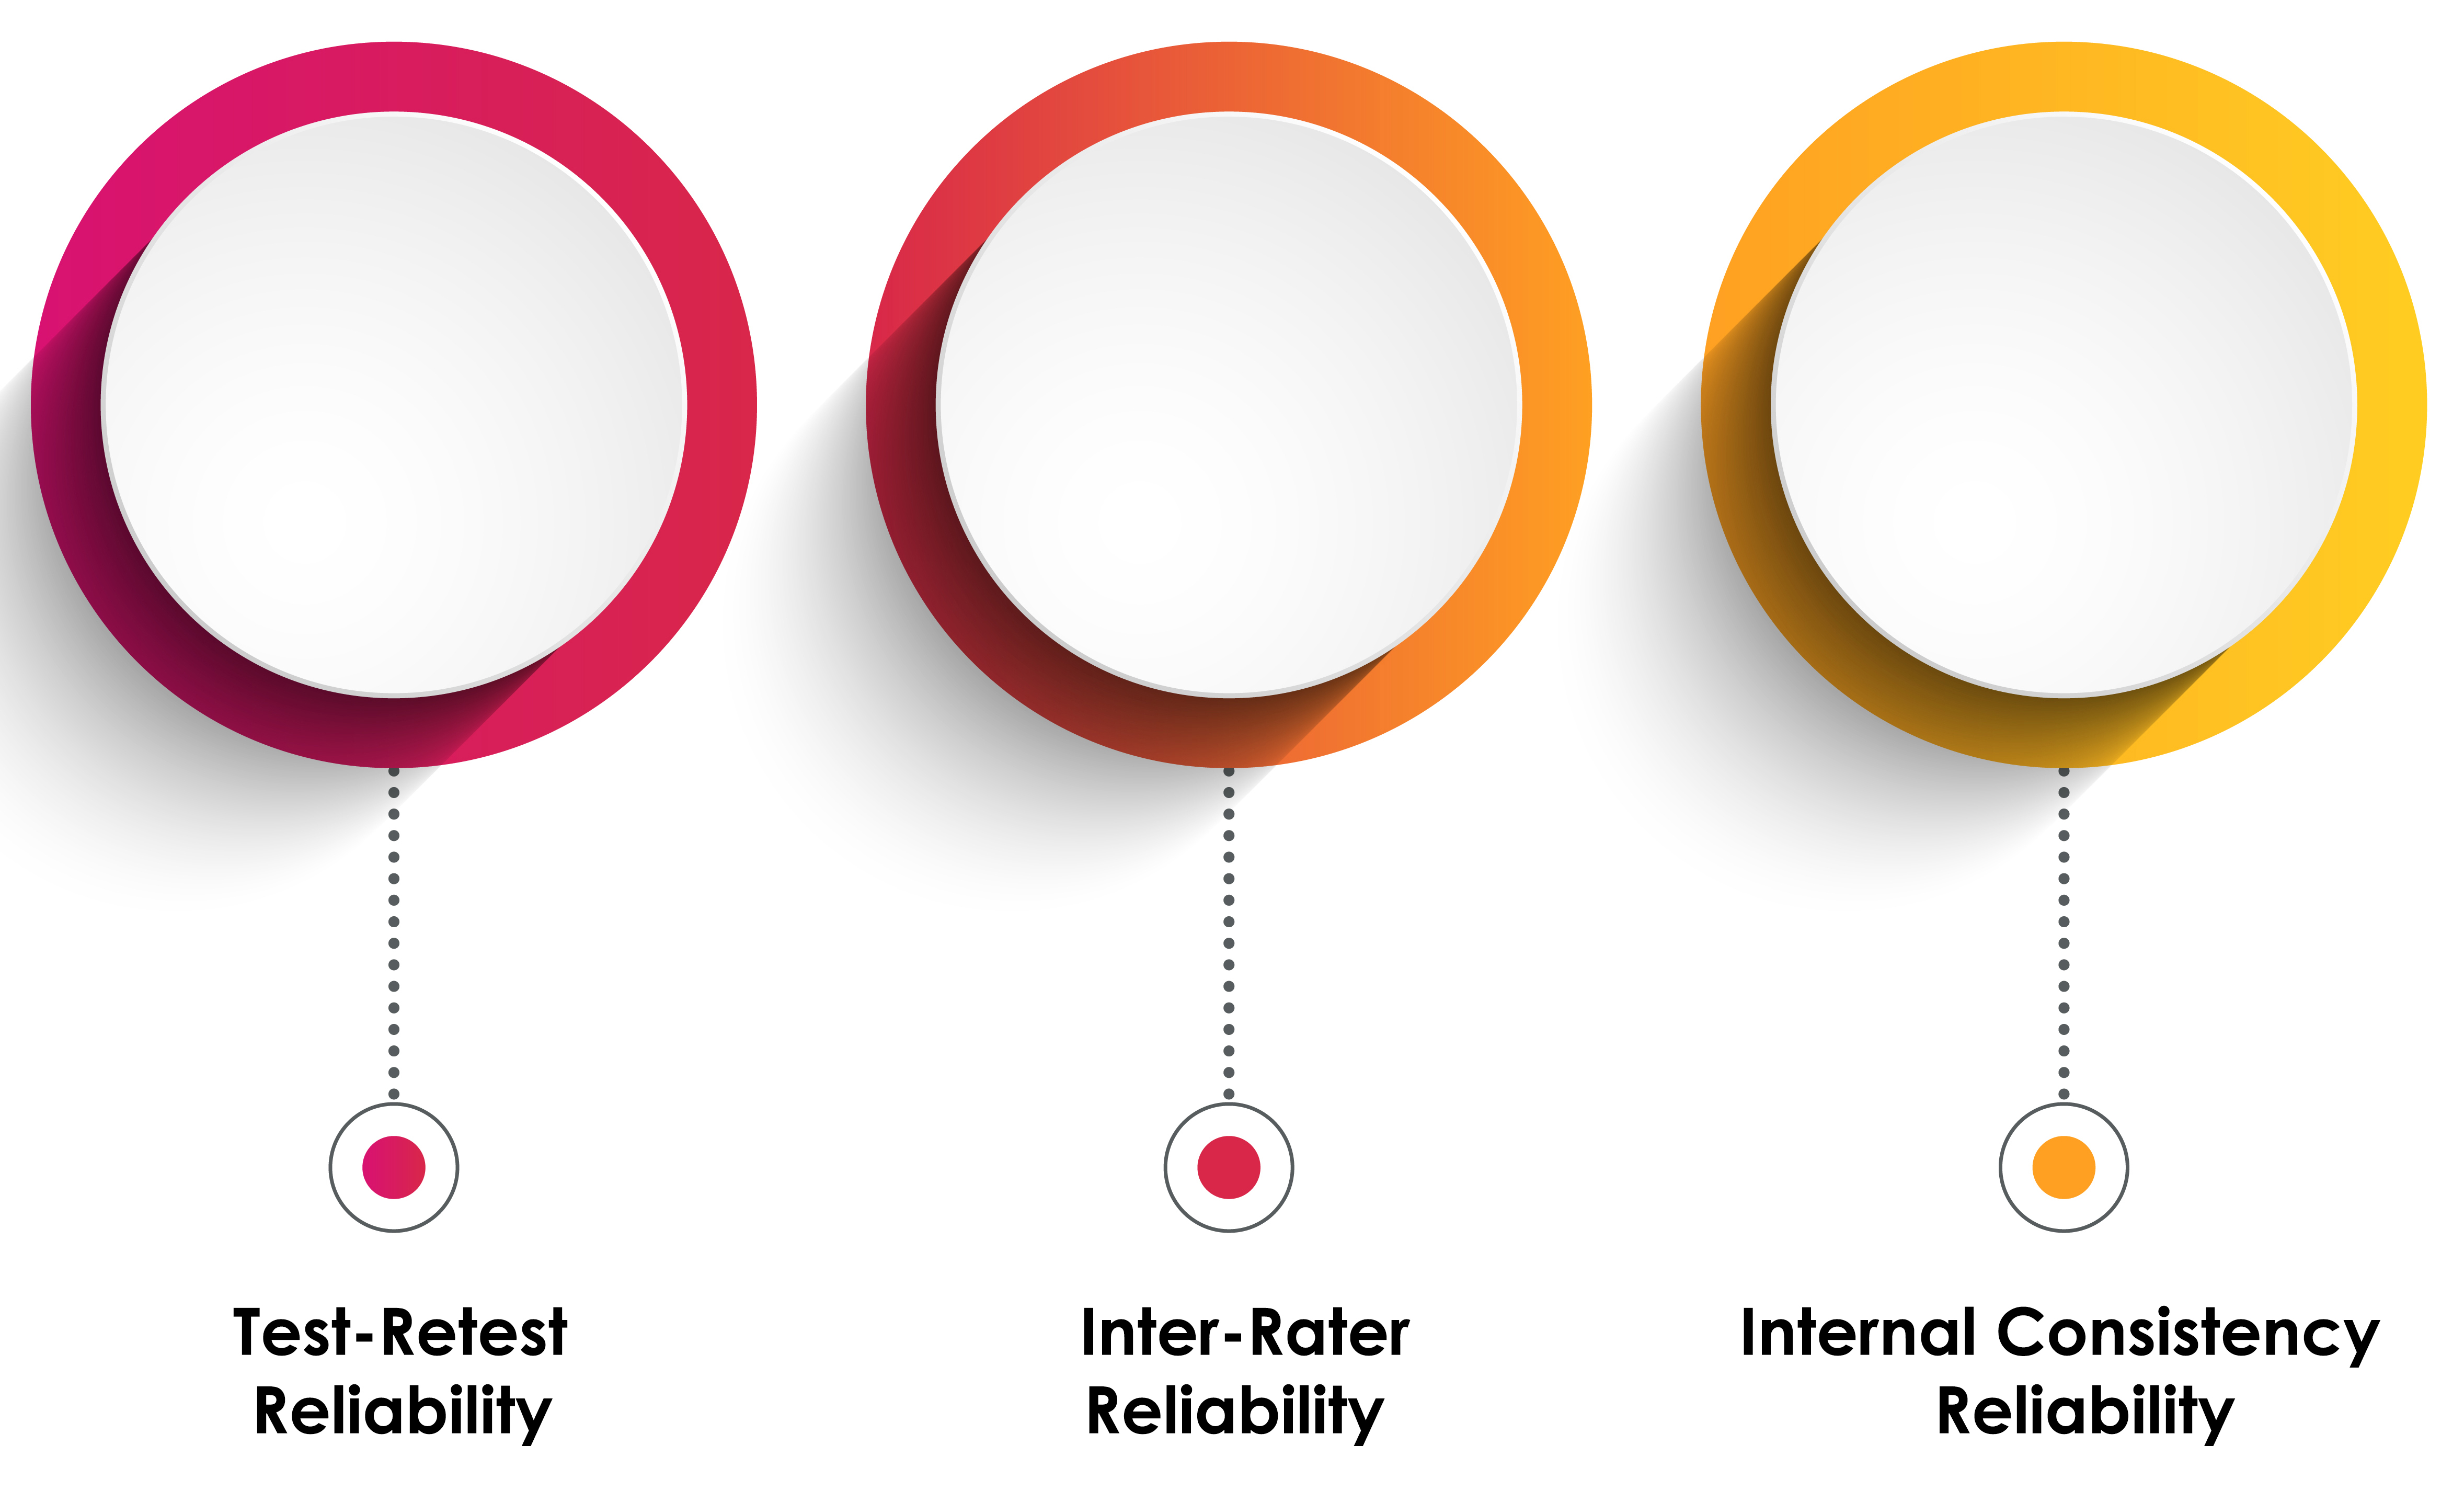
Test-retest reliability refers to the stability of a test over time. A test has good test-retest reliability if it produces similar results at two different points in time (Traub, 1994).
Inter-rater or inter-observer reliability refers to the degree to which different raters/observers give consistent estimates of the same phenomenon (Hallgren, 2012).
Internal consistency reliability is typically measured with Cronbach’s alpha, refers to the consistency of results across items within a test (Tavakol & Dennick, 2011).
Each of these forms of reliability and validity can provide different information and are used for different purposes within the research context. It is often necessary to use multiple forms to establish a comprehensive understanding of the quality and utility of a measure.
F. Meta-Analysis
A meta-analysis is a statistical analysis of related studies. A meta-analysis utilizes statistical procedures to combine and quantify data from many experiments that employ the same operational definitions for their independent and dependent variables to calculate a typical effect size (Bordens & Abbott, 2022).
Effect size indexes the magnitude of an IV's effect on the DV. Researchers measure effect size using percentage and standard deviation approaches.
The percentage method calculates the percentage of variability in the DV that the IV can predict. Statistics like r2 and eta2 estimate the strength of association between the IV and DV. Possible values range from 0-1.0. A small r2 = 0.01, medium = 0.09, and large ≥ 0.5. An r2 of 0.5 means that the IV accounted for 50% of the variability in the DV. Graphic © Jacek Fulawka/Shutterstock.com.

The standard deviation approach estimates the degree of change in the DV in standard deviation units. For example, Cohen's d calculates the effect size for both t- and F-tests. A small effect = 0.2, medium = 0.5, and large = 0.8.
Check out the YouTube video Introduction to Meta-analysis.
A meta-analysis is often used in systematic reviews and is valuable because it provides a quantitative approach to synthesizing and summarizing research findings, which can increase statistical power and improve estimates of effect size compared to individual studies. By aggregating data, a meta-analysis can detect effects that may not be evident in a single study due to small sample sizes (Borenstein, Hedges, Higgins, & Rothstein, 2011).
Strengths
Four meta-analysis strengths include:1. Greater statistical power. Because a meta-analysis pools data from multiple studies, it can often detect effects that individual studies cannot.
2. Increased precision. Estimates of effect size derived from meta-analyses are often more precise than those from individual studies due to larger sample sizes.
3. The ability to resolve uncertainty when studies disagree. Meta-analyses can help reconcile conflicting findings from different studies.
4. Examination of between-study variability. Meta-analyses can explore potential reasons for variability in findings across studies, including different study characteristics or methodologies.
Weaknesses
Four meta-analysis weaknesses include:1. Publication bias. The tendency for only studies with significant or positive results to be published can lead to an overestimation of effect size in meta-analyses. Treatments may appear more effective than in real-world practice when a meta-analysis excludes unpublished studies that did not achieve statistically significant results. This is called the file drawer effect.
2. Quality of included studies. The validity of a meta-analysis depends on the quality of the studies included. Poorly conducted studies can bias results. Treatments may appear less effective than when a meta-analysis includes studies by inexperienced clinicians and those who utilized inadequate training protocols (e.g., did not train until a criterion was reached).
3. Heterogeneity. Variations in study design, sample characteristics, or outcome measures across studies can make it difficult to combine studies.
4. Lack of access to raw data: Meta-analyses often rely on published results, which limits the level of detail that can be considered and potentially overlooks important nuances. A meta-analysis may overstate or understate treatment efficacy depending on the representativeness of the studies they select.
Meta-Analysis vs. Systematic Review
Both meta-analyses and systematic reviews are methods used to pool evidence and provide a comprehensive synthesis of research on a particular topic. The key difference is that a systematic review is a qualitative summary of the evidence, while a meta-analysis is a quantitative synthesis of the data from included studies.A systematic review involves identifying, evaluating, and synthesizing all relevant studies on a particular topic, with a clear and transparent methodology. The findings of the studies are then qualitatively discussed.
Meta-analysis, on the other hand, goes a step further to statistically combine the results of the studies, providing a pooled effect estimate. Not all systematic reviews include a meta-analysis, especially when the studies are too diverse to be combined statistically (Higgins, Thomas, Chandler, Cumpston, Page, & Welch, 2021).
In summary, while both meta-analyses and systematic reviews aim to provide comprehensive overviews of existing evidence, they do so in slightly different ways and can offer different insights into the topic of interest.
G. Reporting Results and Publication Standards
In the process of advancing scientific knowledge, accurate and transparent reporting of research findings is critical. A common challenge faced in scientific publishing is the lack of consistency and rigor in reporting experimental results, which can impact the repeatability, reproducibility, and overall trust in the findings. To address these concerns, various standards and guidelines have been developed to aid researchers in reporting their findings (Ioannidis et al., 2014).
Methods and Results Reporting
A variety of protocols have been developed for different fields and types of studies to guide the reporting of methods and results. These guidelines often specify what information should be included for each section of the research article (e.g., materials, methods, results, etc.) to ensure adequate detail is provided.For example, CONSORT (Consolidated Standards of Reporting Trials) provides guidelines for randomized controlled trials (Schulz, Altman, & Moher, for the CONSORT Group, 2010), while STROBE (Strengthening the Reporting of Observational Studies in Epidemiology) serves similar purposes for observational studies (von Elm et al., 2007).
Statistical Reporting
Accurate statistical reporting is crucial to the interpretation of research findings. The American Statistical Association emphasizes transparency and reproducibility, highlighting the importance of providing a detailed description of the statistical methodologies used, including software and code, presenting results with measures of uncertainty like confidence intervals, effect size, and interpreting results in the context of the study design and data (Wasserstein & Lazar, 2016; Yaddanapudi, 2016).Avoid Questionable Research Practices
The frequent failure to replicate (reproduce) results from a flawed incentive system that reinforces questionable research practices (QRP; Larson, 2020).
Caption: Michael J. Larson, PhD
An anonymous survey (John et al., 2012) of 6000 American Psychological Association (APA) members is summarized below.

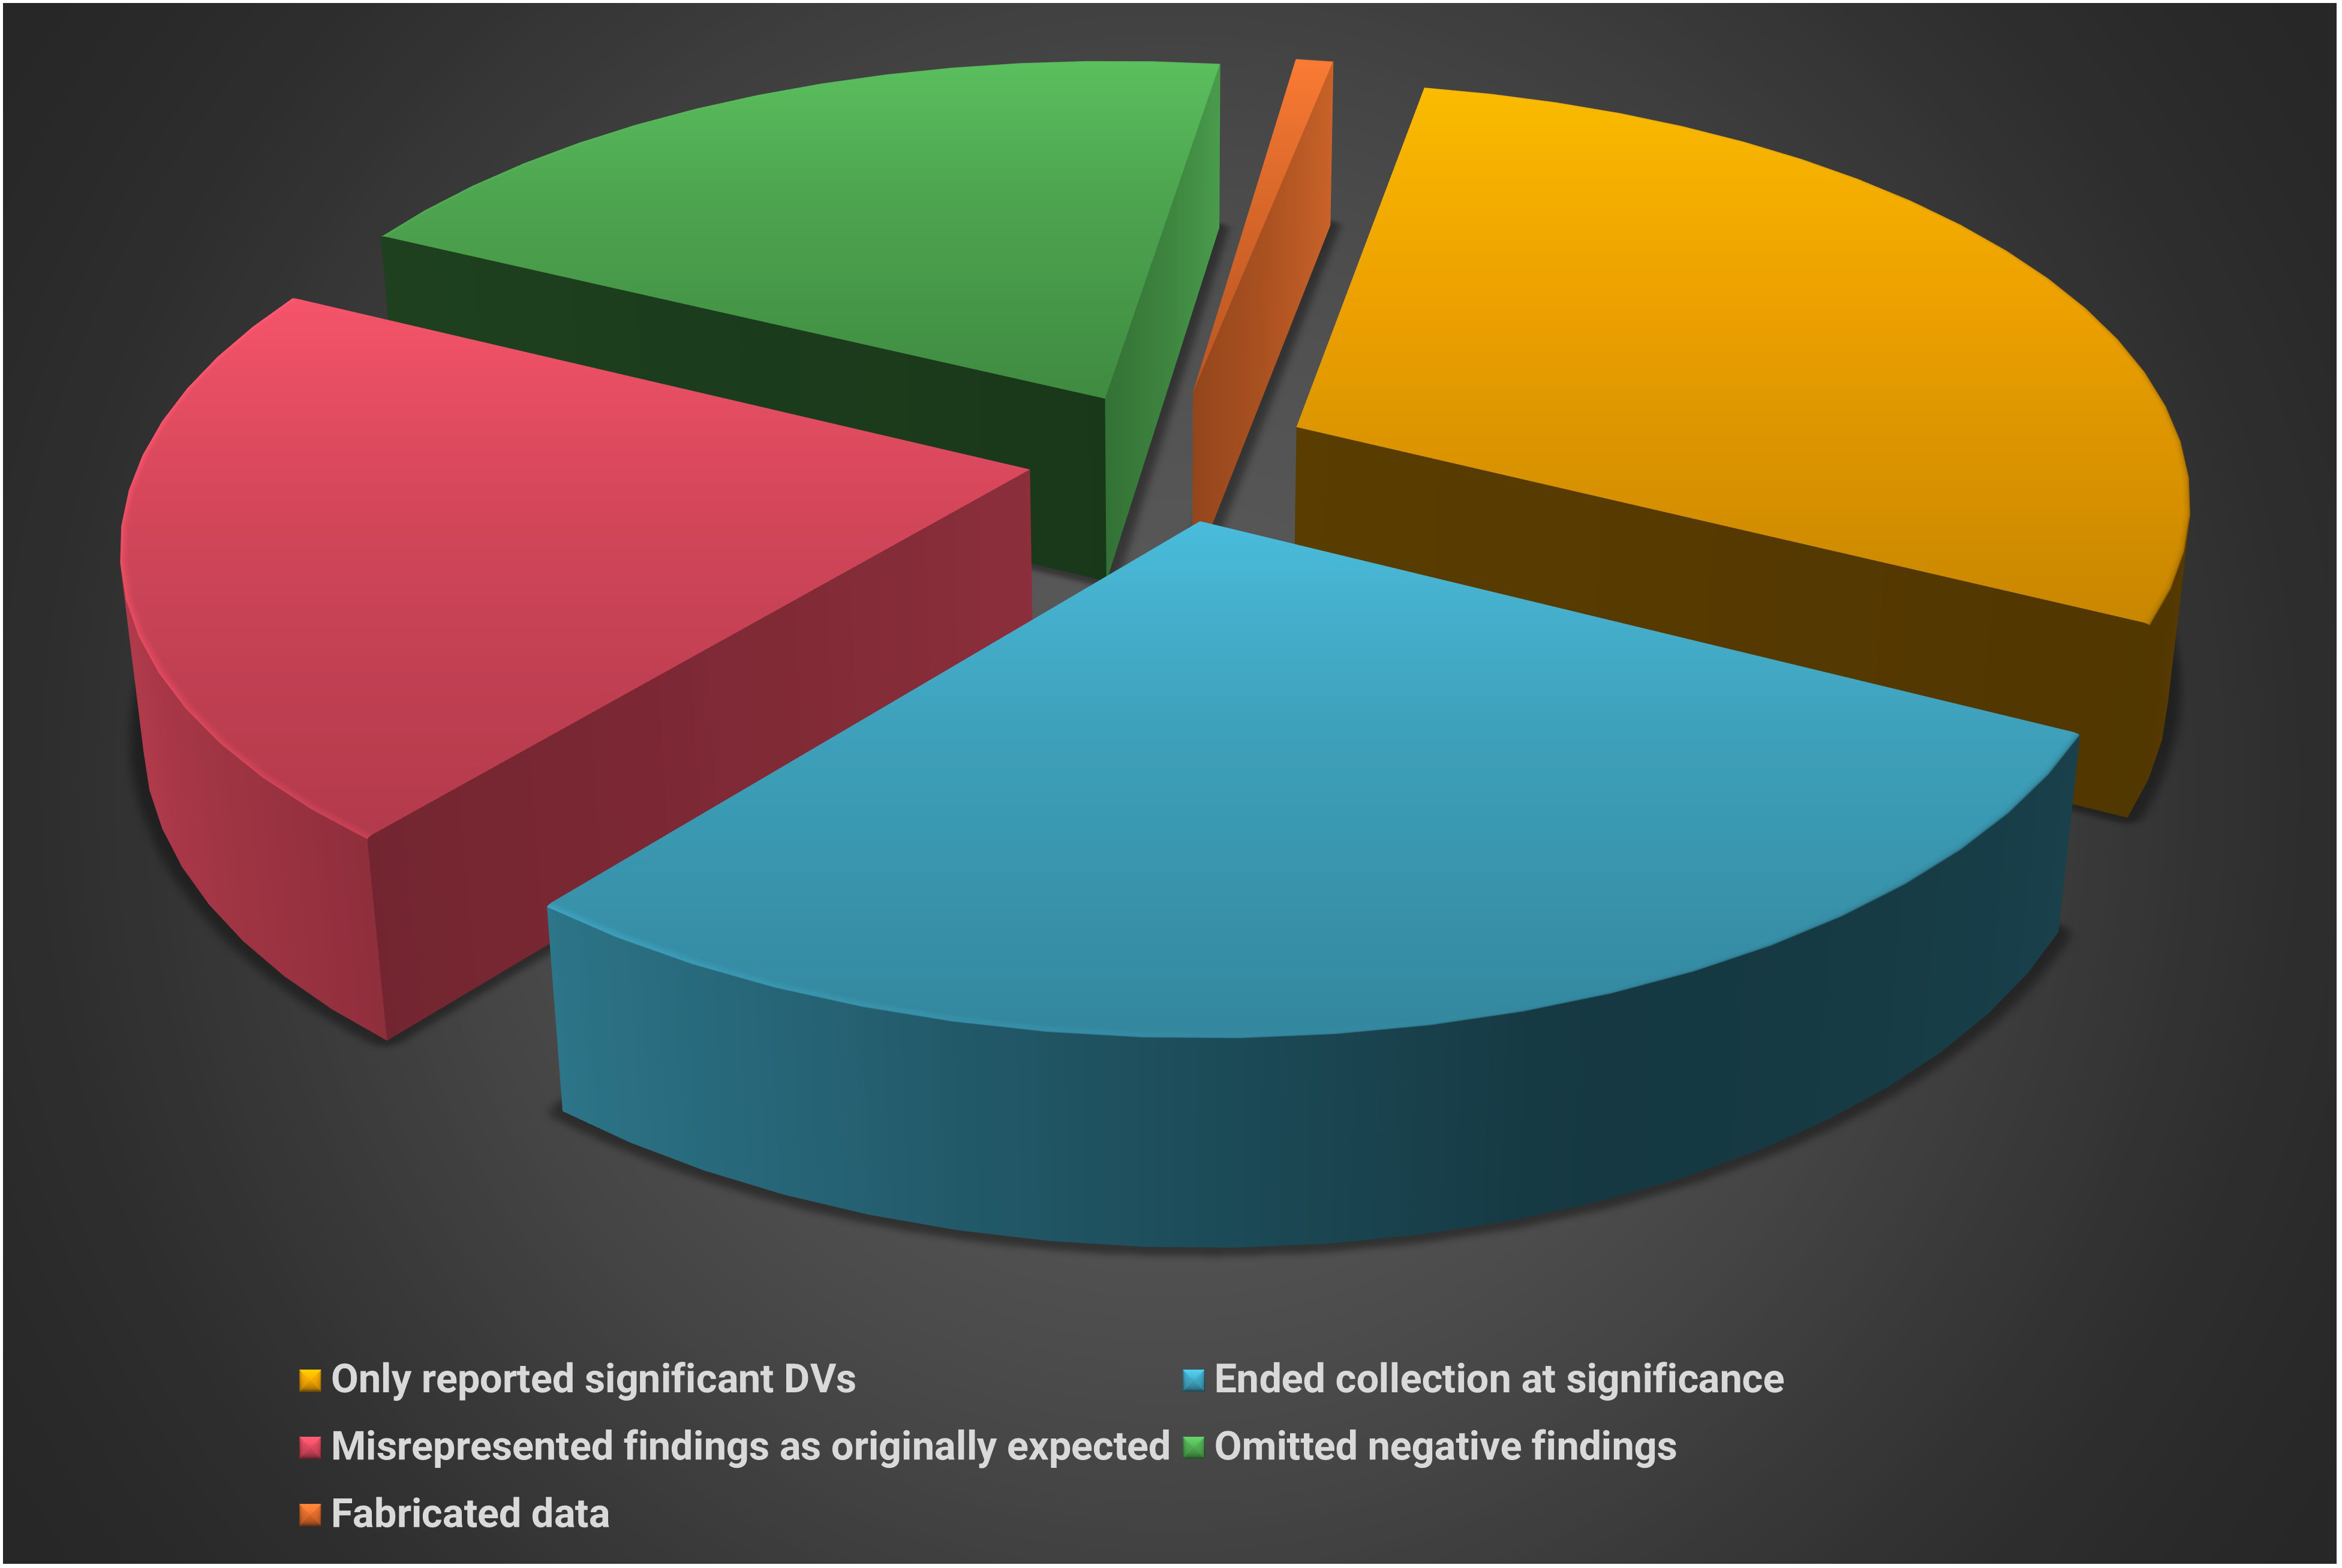
Artist: Dani S@unclebelang. These WEBTOONS are part of our Real Genius series.


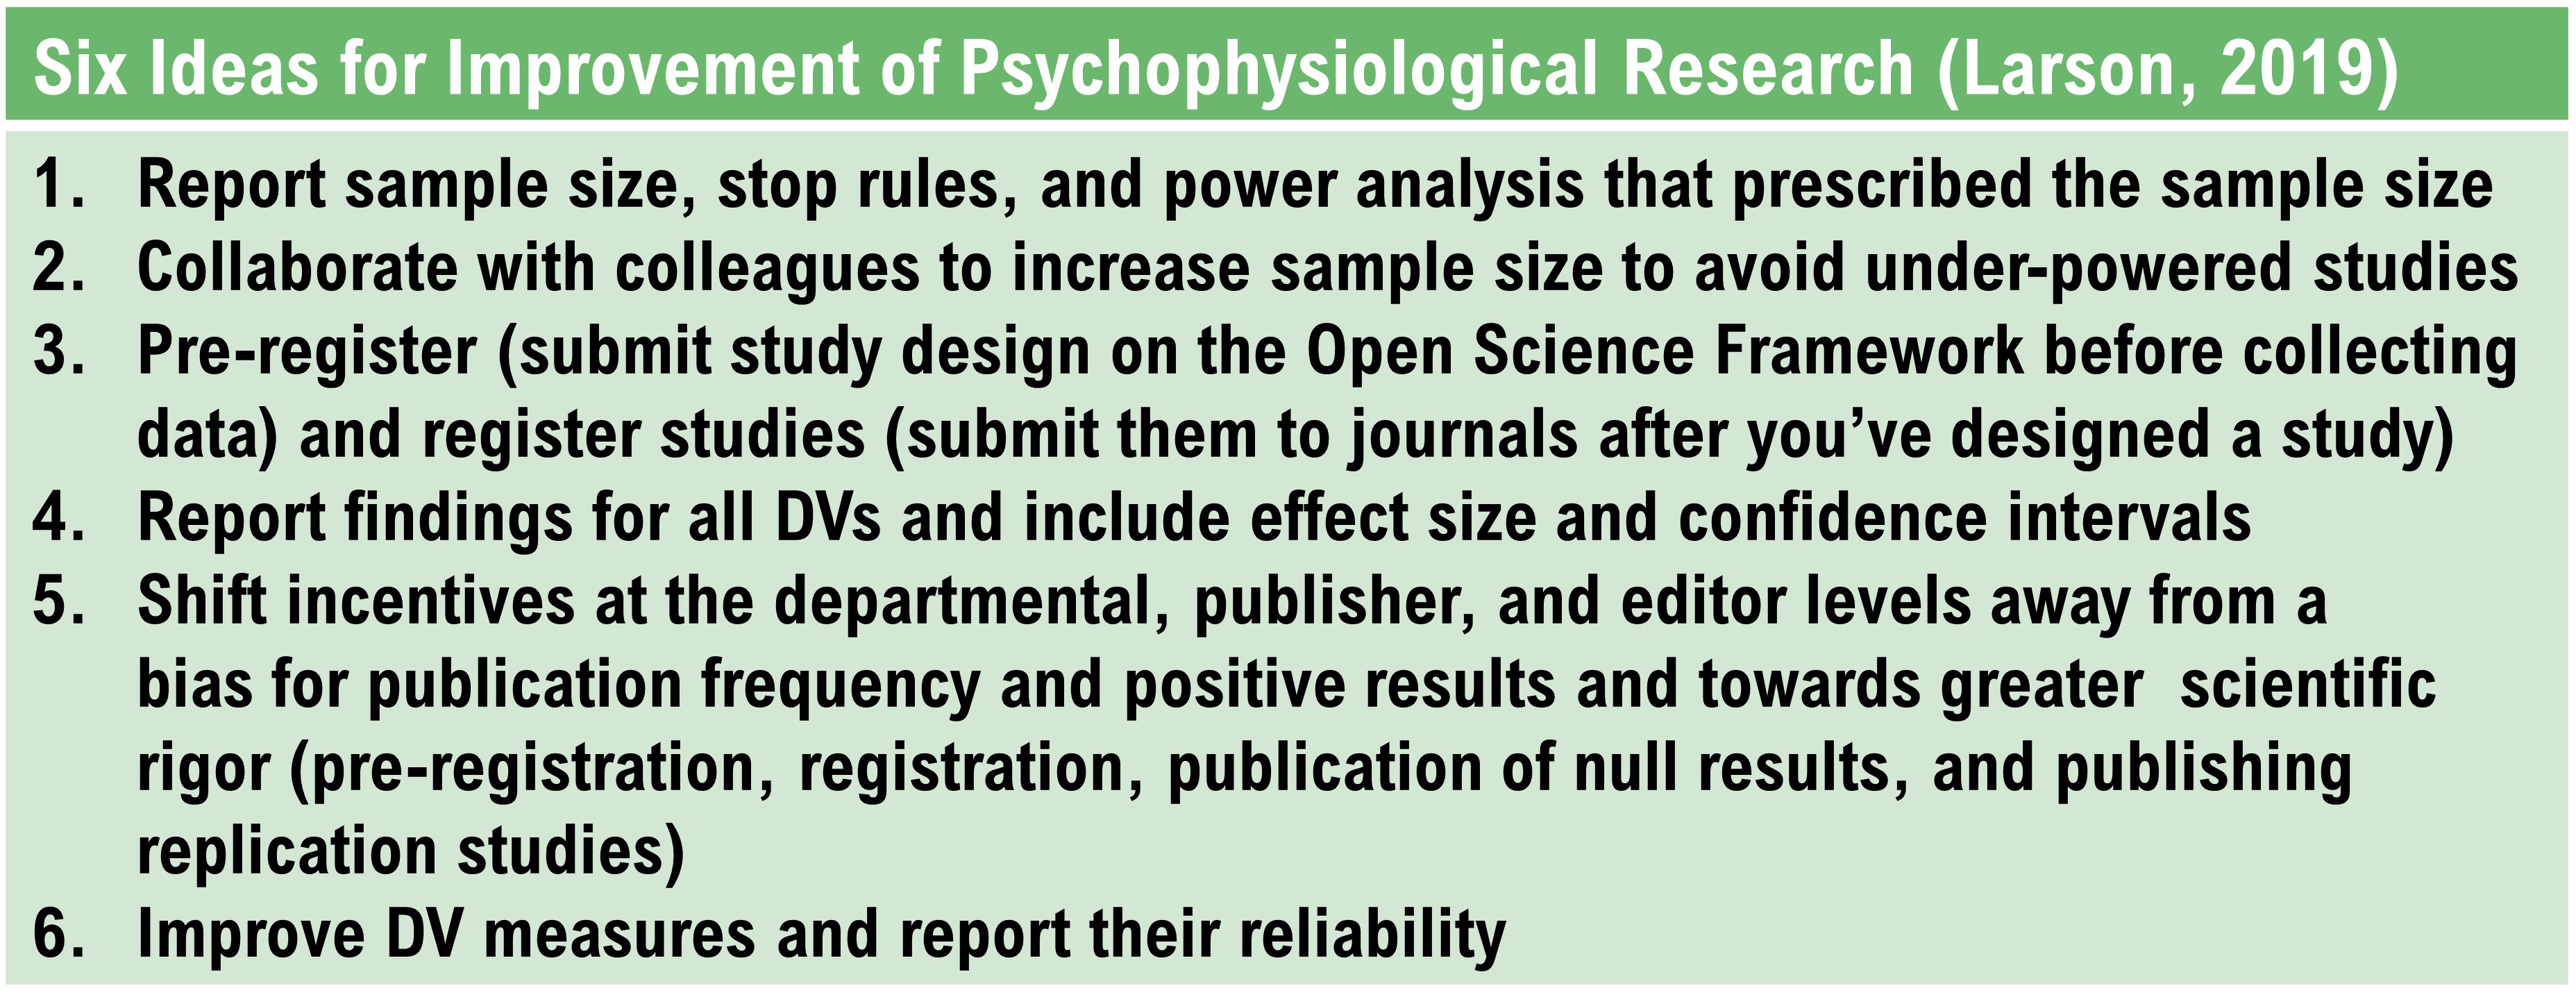
Larson (2020) proposed six steps to increase the integrity of psychophysiological research.
Data Availability
More recently, the scientific community has been promoting the idea of open science, where researchers are encouraged to make their datasets publicly available. Journals are increasingly requiring data availability statements, and some are implementing more stringent data sharing policies, such as PLOS journals and Nature (Stodden et al., 2016).Discussion and Conclusion Reporting
In the discussion and conclusion sections, it is important to interpret the results in the context of the initial hypothesis and the current literature. Any limitations of the study should be openly discussed, and claims should not go beyond what the data can support (Ioannidis, 2016).Ethical Considerations
Ethical considerations must be addressed, including conflicts of interest, funding sources, and study approval by relevant ethical review boards. These aspects need to be reported to ensure the integrity of the research process (Besley & McCright, 2019).Peer Review Process
Before publication, scientific research usually undergoes a peer-review process, which can provide critical evaluation and feedback to improve the quality of the paper. Peer review is an essential part of maintaining the standards and quality of scientific publications (Smith, 2006).Conclusion
Adhering to established standards and guidelines in scientific reporting is crucial to ensure the integrity, clarity, and reproducibility of published research. This promotes scientific transparency, enhances the reliability of published findings, and helps build public trust in science. Continued efforts are needed to further refine these guidelines and to encourage their broad adoption across different scientific disciplines.The Clinical Efficacy of Established Medical Practices
Prasad et al. (2013) examined 363 studies of an accepted drug or medical procedure published in The New England Journal of Medicine from 2001 to 2010. More than 40% were ineffective or harmful, 38% were beneficial, and 22% had uncertain value.
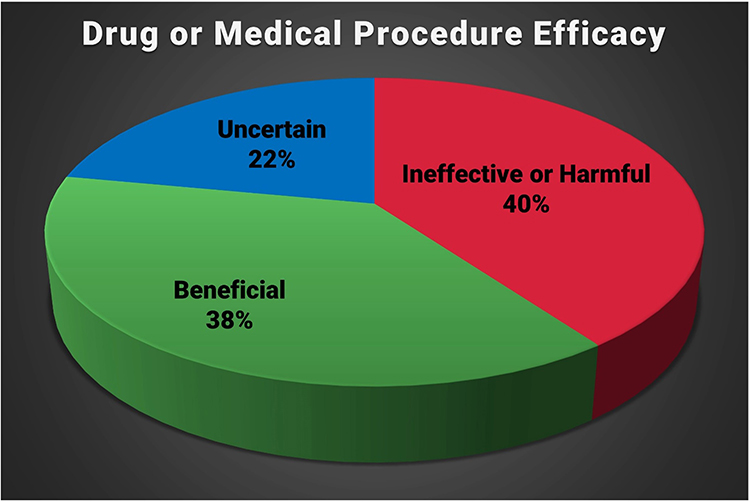
Examples of ineffective or harmful practices included hormone replacement therapy in postmenopausal women and aggressive blood sugar reduction in Type 2 diabetics treated in intensive care, which increased mortality rates.
The authors observed: “Nevertheless, the reversals we have identified at the very least call these practices into question. Some practices ought to be abandoned, whereas others warrant retesting in more powerful investigations. One of the greatest virtues of medical research is our continual quest to reassess it.” (p. 796)
Criteria for Clinical Efficacy
The core membership organizations in our field have developed efficacy guidelines and have engaged in an ongoing assessment of clinical and optimal performance practices. There have been four editions of Evidence-Based Practice in Biofeedback and Neurofeedback, and multiple White Papers.

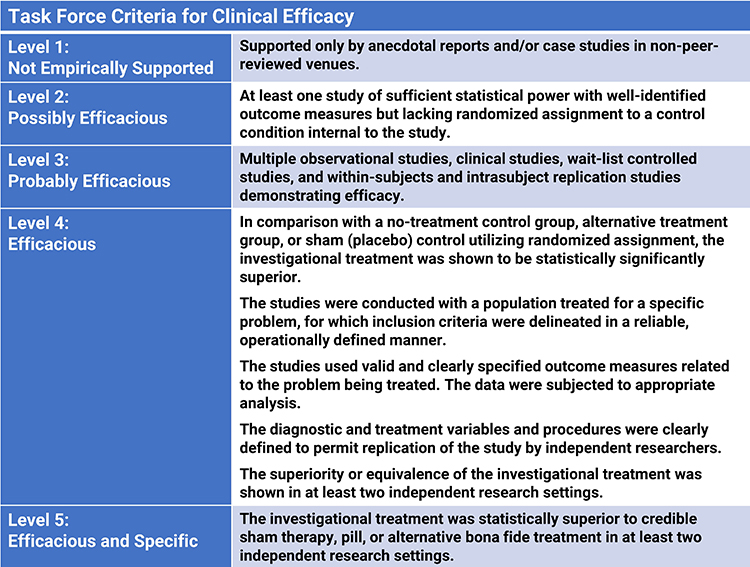
The following guidelines for evaluating the clinical efficacy of BF and NF interventions were recommended by a joint Task Force and adopted by the Boards of Directors of the Association for Applied Psychophysiology (AAPB) and the International Society for Neuronal Regulation (ISNR; LaVaque et al., 2002).
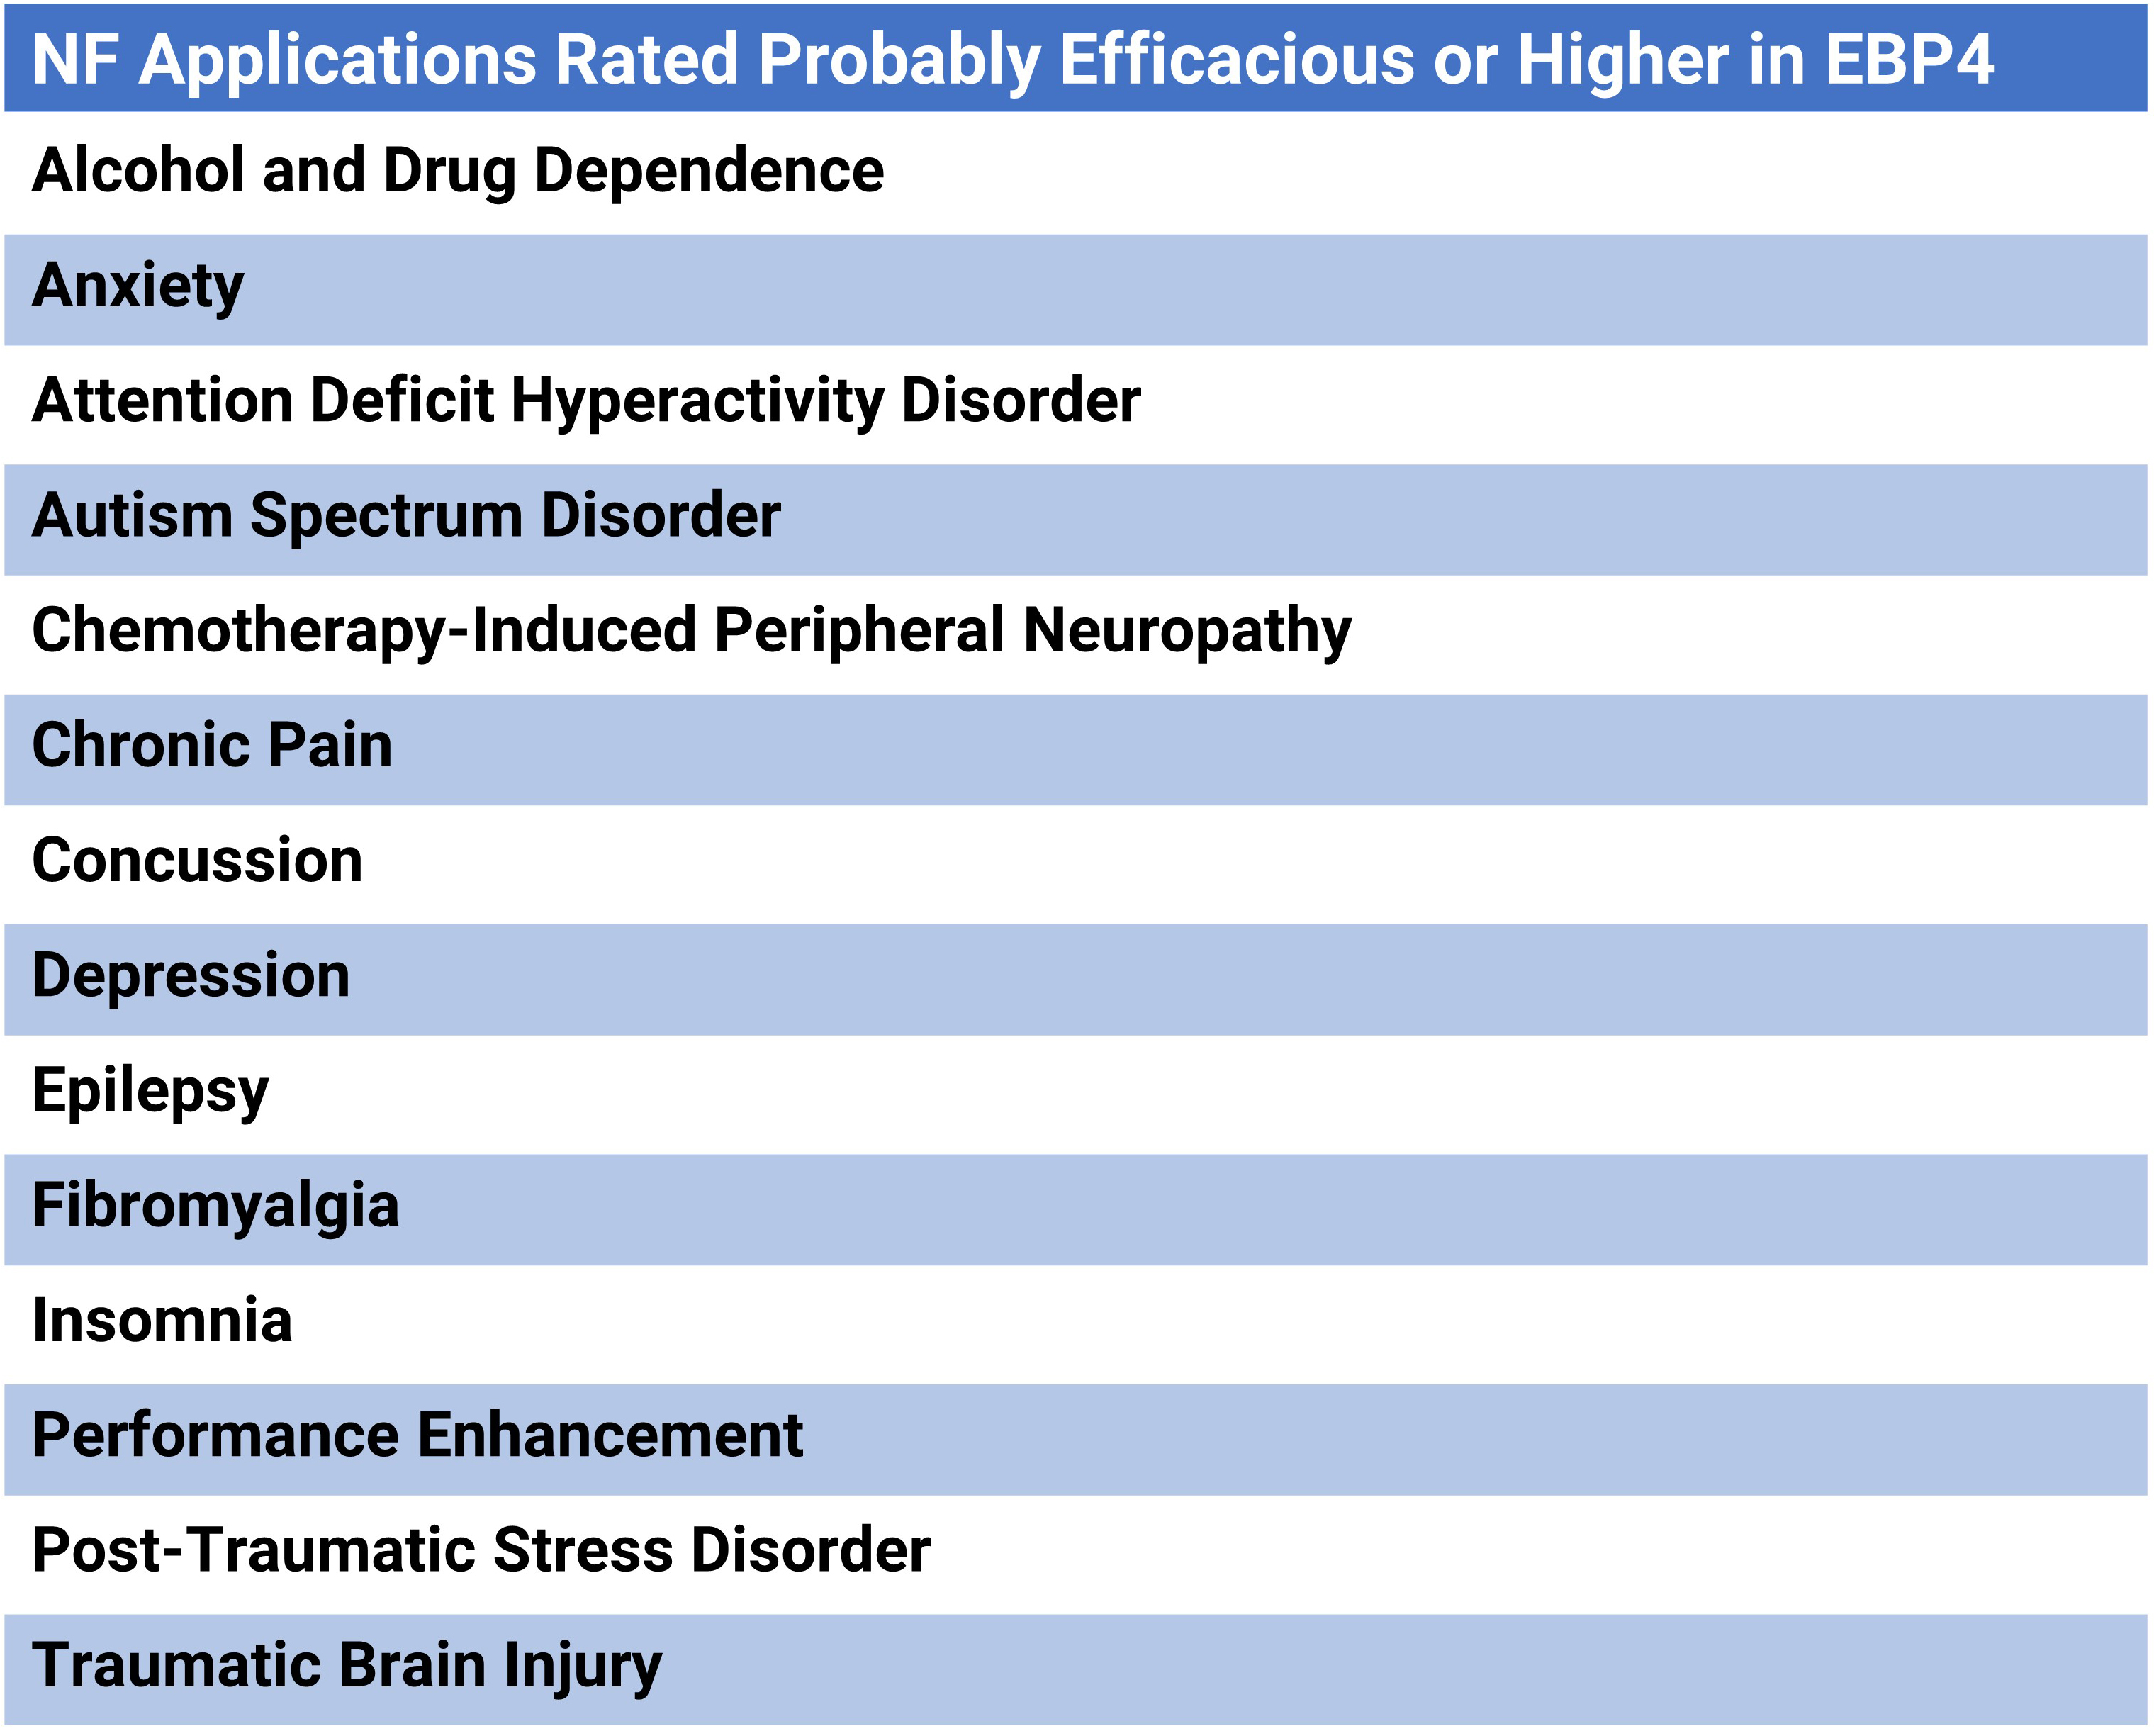
Evidence-Based Practice in Biofeedback and Neurofeedback (4th ed.) reported increased evidence of NF efficacy in diverse clinical and performance applications (Khazan et al., 2023).

Glossary
AB design: a small N design where a single subject or group is studied before (A) and after (B) an intervention.
ABA reversal design: a small N design where a baseline is followed by treatment and then a return to baseline.
alternative hypothesis (H1): a prediction there will be a significant relationship between variables.
assignment threat: a classic threat to internal validity in which individual differences are not balanced across treatment conditions by the assignment procedure.
assignment-interaction threat: the combination of a selection threat with at least one other threat (history, maturation, testing, instrumentation, statistical regression, or mortality).
balancing: a method of controlling a physical variable by distributing its effects across all treatment conditions (running half of each condition's participants in the morning and half in the evening).
baseline: a control condition in which participants receive a zero level of the independent variable (sitting quietly without receiving feedback about physiological performance).
baseline-only control condition: participants sit quietly without receiving feedback about their physiological performance.
basic research: fundamental or pure research driven by a scientist's curiosity or interest in a scientific question with the aim of expanding knowledge within the field, rather than solving a specific, pragmatic problem.
bidirectional causation: a reason that correlation does not imply causation. Each of two variables could influence the other.
case study: a nonexperimental descriptive study of a participant’s experiences, observable behaviors, and archival records kept by an outside observer.
clinical research: applied or translational research that seeks to directly benefit patients by improving methods of disease diagnosis, developing treatments, or enhancing the well-being of patients.
confounding: the loss of internal validity when an extraneous variable systematically changes across the experimental conditions.
constancy of conditions: controlling a physical variable by keeping it constant across all treatment conditions (running all participants in the evening).
construct validity: the degree to which a test measures the theoretical construct it's supposed to measure.
content validity: the degree to which to which a measure represents all facets of a given construct.
contingent feedback: feedback of a participant's actual physiological performance.
contingent feedback of an unrelated response: a design where the participant receives feedback based on a response that is unrelated to the treatment variable.
control group: in an experiment, a group that receives a zero-level of the independent variable (placebo or wait-list).
correlational study: a nonexperimental procedure in which the researcher does not manipulate an independent variable and only records data concerning traits or behaviors (investigating the relationship between body mass index and severity of low back pain).
criterion validity: the degree to which a measure is related to an outcome.
demand characteristics: situational cues (like placing EEG sensors on a client's forehead) that signal expected behavior (increased attention).
dependent variable (DV): the outcome measure the experimenter uses to assess the change in behavior produced by the independent variable (airway resistance could be used to measure the effectiveness of HRV training for asthma).
descriptive statistics: statistics that summarize and describe the main features of a collection of data.
detectable noncontingent feedback: noncontingent feedback that a participant can detect as false when the display fails to mirror voluntary behavior like muscle bracing.
double-blind crossover experiment: an experimental approach using a double-blind design where participants start with one treatment and conclude with an alternative treatment (controls demand characteristics, experimenter bias, and individual differences).
double-blind experiment: the experimenter and participant do not know the condition to which the participant has been assigned to control both demand characteristics and experimenter bias.
effect size: the magnitude of an IV's effect on the DV.
elimination: a method of controlling a physical variable by removing it (soundproofing a room).
ex post facto study: a quasi-experimental design in which a researcher compares participants on pre-existing characteristics.
experimenter bias: confounding that occurs when the researcher knows the participants' treatment condition and acts in a manner that confirms the experimental hypothesis.
external validity: the extent to which the results of a study can be generalized or extended to others.
extraneous variable (EV): variable not controlled by the experimenter (room temperature).
file drawer effect: excluding unpublished studies that did not obtain significant treatment effects from a meta-analysis or systematic review.
heterogeneity in meta-analysis: the variability or differences between studies included in a meta-analysis.
history threat: a classic threat to internal validity that occurs when an event outside the experiment threatens internal validity by changing the DV.
hypothesis: a prediction made by a researcher about the potential outcome of an experiment or a study.
independent variable (IV): the variable (antecedent condition) an experimenter intentionally manipulates (HRV or SEMG BF).
inferential statistics: statistics that allow researchers to infer or presume something about a population based on a sample of that population.
instrumentation threat: a classic threat to internal validity in which changes in the measurement instrument or measurement procedure threaten internal validity.
inter-rater reliability (inter-observer reliability): level of agreement among multiple raters or judges who independently assess behavior.
internal consistency reliability: the degree of consistency among the items on a test.
internal validity: the degree to which the experiment can demonstrate that changes in the dependent variable across treatment conditions are due to the independent variable.
large-N designs: studies that examine the performance of groups of participants.
level 1: not empirically supported.
level 2: possibly efficacious.
level 3: probably efficacious.
level 4: efficacious.
level 5: efficacious and specific.
maturation threat: a classic threat to internal validity that occurs when physical or psychological changes in participants threaten internal validity by changing the dependent variable.
mean: the arithmetic average and the most commonly reported measure of central tendency.
measures of central tendency: descriptive statistics (mean, median, and mode) that describe the typical score within a sample.
measures of variability: descriptive statistics (range, standard deviation, and variance) that describe the dispersion of scores within a sample and allow us to compare different samples.
median: the score that divides a sample distribution in half. It is the middle score or the average of two middle scores.
meta-analysis: a statistical analysis that combines and quantifies data from many experiments that use the same operational definitions for their independent and dependent variables to calculate an average effect size.
mode: the most frequent score calculated when there are at least two different sample values.
mortality threat: a classic threat to internal validity that occurs when participants drop out of experimental conditions at different rates.
multiple baseline design: a type of small-N design where the response of a subject is measured over time under different conditions.
N: the number of participants.
no-biofeedback control group: a control condition in which participants do not receive physiological feedback.
noncontigent feedback: a control condition in which feedback is delivered randomly, not in response to a specific action or behavior.
nonexperimental design: a research method where the investigator does not manipulate variables, but rather, observes them as they naturally exist and then draws conclusions from the observations.
nonparametric statistics: statistical methods used when the data do not meet the assumptions required for parametric statistics, often used with categorical or ordinal data.
nonspecific treatment effect: a measurable symptom change that is not correlated with a specific psychophysiological change.
null hypothesis (H0): the prediction of no relationship between the variables being studied.
observational studies: nonexperimental procedures like naturalistic observation and correlational studies.
parametric statistics: statistical methods used when the data meet certain assumptions typically involving interval or ratio level data, and often assuming a normal distribution.
participant characteristics: the attributes or traits of the individuals participating in a study which could affect the study results.
Pearson r: a statistical procedure that calculates the strength of the relationship (from -1.0 to +1.0) between pairs of variables measured using interval or ratio scales.
personality variables: personal aspects of participants or experimenters like anxiety or warmth.
physical variables: the properties of the physical environment like time of day, room size, or noise.
placebo response: an associatively-conditioned homeostatic response.
population: the total group of individuals that a researcher is interested in and to which they wish to generalize their findings.
power analysis: a statistical method used to determine the minimum sample size required for a study based on the desired level of significance, the desired power, and the expected effect size.
pre-registration: submitting a study on the Open Science Framework before data collection.
pre-test/post-test design: a research design where measurements are taken before and after a treatment or intervention to assess its effect.
quasi-experimental design: a design research design that includes some, but not all, of the features of a true experiment. It lacks the creation of experimental conditions or random assignment, so it achieves low internal validity.
random sample: a subset of a target population selected using an unbiased method so that every member of the population has an equal chance to be chosen.
randomized controlled trial (RCT): researchers manipulate an independent variable and randomly assign participants to conditions, with or without prior matching on participant variables.
range: the difference between the lowest and highest values.
registration: submitting a study design to a journal before data collection for Stage 1 and Stage 2 peer review.
relaxation control condition: participants receive a non-BF relaxation procedure.
registration: submitting a study design to a journal before data collection for Stage 1 and Stage 2 peer review.
resonance frequency (RF): the frequency at which a system, like the cardiovascular system, can be activated or stimulated.
reverse contingent feedback: feedback that trains participants to produce changes that are the reverse of those shaped by a clinical protocol (beta decrease and theta increase in children diagnosed with ADHD).
sample: a selected subset of a target population.
sample size: the number of observations within a statistical sample.
selection interactions: the combination of a selection threat with at least one other threat (history, maturation, testing, instrumentation, statistical regression, or participant mortality).
single-blind experiment: participants are not told their treatment condition.
small-N designs: studies involving one or two participants.
social variables: aspects of the relationships between researchers and participants like demand characteristics and experimental bias.
specific treatment effect: a measurable symptom change associated with a measurable psychophysiological change produced by BF.
standard deviation: the square root of the average squared deviations from the mean.
statistical power: the probability that a statistical test will correctly reject a false null hypothesis, or in simpler terms, the ability of a test to detect an effect if the effect actually exists. Power is typically represented as a value between 0 and 1.
statistical regression threat: a classic threat to internal validity that occurs when participants are assigned to conditions using extreme scores, the measurement procedure is not wholly reliable, and participants are retested using the same method to show change on the DV. The scores of both extreme groups tend to regress to the mean on the second measurement so that high scorers are lower and low scorers are higher on the second testing.
statistical significance: a statistical statement that the observed findings did not occur by chance alone, and there is a low probability of making a Type I error (rejecting a true null hypothesis).
stop rules: predetermined criteria for discontinuing data collection or ending a study, often based on safety concerns or clear evidence of effectiveness.
study quality in meta-analysis: the degree to which the studies included in a meta-analysis have good design and execution. Poor quality studies may introduce bias into the meta-analysis results.
systematic review: a qualitative exploration of a clearly formulated question that uses systematic and explicit methods to identify, select, and critically appraise relevant research and to collect and analyze data from the studies that are included in the review.
testing threat: a classic threat to internal validity that occurs when prior exposure to a measurement procedure affects performance on this measure during the experiment.
third variable problem: a reason that correlation does not mean causation. A hidden variable may affect both correlated variables. For example, alcohol abuse could both disrupt sleep and increase depression.
validity: the degree to which a procedure measures what it is intended to measure, including IVs and DVs.
variance: the average squared deviation of scores from their mean.
wait-list control group: participants are measured like the experimental group(s) but are placed on a waiting list for an experimental treatment.
z-score training: a NF protocol that reinforces closer approximations of client EEG values to those in a normative database in real-time.
Test Yourself
Customers enrolled on the ClassMarker platform should click on its logo to take 10-question tests over this unit (no exam password).

REVIEW FLASHCARDS ON QUIZLET
Click on the Quizlet logo to review our chapter flashcards.

Visit the BioSource Software Website
BioSource Software offers Physiological Psychology, which satisfies BCIA's Physiological Psychology requirement, and Neurofeedback100, which provides extensive multiple-choice testing over the Biofeedback Blueprint.

Assignment
Now that you have completed this unit, consider how you could use the case study approach in your clinical practice to assess treatment efficacy?
References
Alberts, B., Kirschner, M. W., Tilghman, S., & Varmus, H. (2014). Rescuing US biomedical research from its systemic flaws. Proceedings of the National Academy of Sciences of the United States of America, 111(16), 5773–5777. https://doi.org/10.1073/pnas.1404402111
Bauer, M. S., Damschroder, L., Hagedorn, H., Smith, J., & Kilbourne, A. M. (2105). An introduction to implementation science for the non-specialist. BMC Psychol, 3, 32. https://doi.org/10.1186/s40359-015-0089-9
Bordens, K., & Abbott, B. B. (2022). Research design and methods: A process approach (11th ed.). McGraw-Hill.
Brady, J. V. (1958). Ulcers in "executive" monkeys. Scientific American, 199(4), 95-100. https://psycnet.apa.org/doi/10.1038/scientificamerican1058-95
Campbell, D. T. (1957). Factors relevant to the validity of experiments in social settings. Psychological Bulletin, 54, 297-312. https://psycnet.apa.org/doi/10.1037/h0040950
Campbell, D. T., & Stanley, J. T. (1966). Experimental and quasi-experimental designs for research. Rand McNally.
Hersen, M., & Barlow, D. H. (1976). Single case experimental designs. Pergamon Press.
Ioannidis J. P. (2016). The mass production of redundant, misleading, and conflicted systematic reviews and meta-analyses. The Milbank Quarterly, 94(3), 485–514. https://doi.org/10.1111/1468-0009.12210
Ioannidis, J. P., Greenland, S., Hlatky, M. A., Khoury, M. J., Macleod, M. R., Moher, D., Schulz, K. F., & Tibshirani, R. (2014). Increasing value and reducing waste in research design, conduct, and analysis. Lancet, 383(9912), 166–175. https://doi.org/10.1016/S0140-6736(13)62227-8
Khazan, I., Shaffer, F., Moss, D., Lyle, R., & Rosenthal, S. (Eds). Evidence-based practice in biofeedback and neurofeedback (4th ed.). Association for Applied Psychophysiology and Biofeedback.
Ivry, R. B., & Lebby, P. C. (1993). Hemispheric differences in auditory perception are similar to those found in visual perception. Psychological Sciences, 4(1), 41-45.
Larson, M. J. (2020). Improving the rigor and replicability of applied psychophysiology research: Sample size, standardization, transparency, and preregistration. Biofeedback, 48(1), 2-6. https://doi.org/10.5298/1081-5937-48.1.2
LaVaque, T. J., Hammond, D. C., Trudeau, D., Monastra, V., Perry, J., Lehrer, P., Matheson, D., & Sherman, R. (2002). Template for developing guidelines for the evaluation of the clinical efficacy of psychophysiological evaluations. Applied Psychophysiology and Biofeedback, 27(4), 273-281. https://dx.doi.org/10.1023/A:1021061318355
Myers, A., & Hansen, C. (2012). Experimental psychology (7th ed.). Wadsworth.
Peniston, E. G., & Kulkosky, P. J. (1990). Alcoholic personality and alpha-theta brainwave training. Medical Psychotherapy, 3, 37-55.
Prasad, V., Vandross, A., Toomey, C., Cheung, M., Rho, J., Quinn, S., . . . Vifu, A. (2013). A decade of reversal: An analysis of 146 contradicted medical practices. Mayo Clinic Proceedings, 88(8), 790-798. https://dx.doi.org/10.1023/A:1021061318355
Rubio, D. M., Schoenbaum, E. E., Lee, L. S., Schteingart, D. E., Marantz, P. R., Anderson, K. E., Platt, L. D., Baez, A., & Esposito, K. (2010). Defining translational research: Implications for training. Academic Medicine: Journal of the Association of American Medical Colleges, 85(3), 470–475. https://doi.org/10.1097/ACM.0b013e3181ccd618
Schulz, K. F., Altman, D. G., Moher, D., & CONSORT Group (2010). CONSORT 2010 statement: updated guidelines for reporting parallel group randomized trials. Annals of Internal Medicine, 152(11), 726–732. https://doi.org/10.7326/0003-4819-152-11-201006010-00232
Weiss, J. M. (1972). Psychological factors in stress and disease. Scientific American, 226(6), 104-113. https://doi.org/10.1038/scientificamerican0672-104
Smith R. (2006). Peer review: A flawed process at the heart of science and journals. Journal of the Royal Society of Medicine, 99(4), 178–182. https://doi.org/10.1177/014107680609900414
Stodden, V., McNutt, M., Bailey, D. H., Deelman, E., Gil, Y., Hanson, B., Heroux, M. A., Ioannidis, J. P., & Taufer, M. (2016). Enhancing reproducibility for computational methods. Science, 354(6317), 1240–1241. https://doi.org/10.1126/science.aah6168
von Elm, E., Altman, D. G., Egger, M., Pocock, S. J., Gøtzsche, P. C., Vandenbroucke, J. P., & STROBE Initiative (2014). The Strengthening the Reporting of Observational Studies in Epidemiology (STROBE) statement: Guidelines for reporting observational studies. International Journal of Surgery, 12(12), 1495–1499. https://doi.org/10.1016/j.ijsu.2014.07.013
Wasserstein, R. L., & Lazar, N. A. (2016). The ASA's Statement on p-Values: Context, process, and purpose. The American Statistician, 70(2), 129–133. Wickramasekera, I. A. (1988). Clinical behavioral medicine: Some concepts and procedures. Plenum Press.
Wickramasekera, I. A. (1999). How does biofeedback reduce clinical symptoms and do memories and beliefs have biological consequences? Toward a model of mind-body healing. Applied Psychophysiology and Biofeedback, 24(2), 91-105. https://doi.org/10.1023/a:1022201710323
Yaddanapudi L. N. (2016). The American Statistical Association statement on P-values explained. Journal of Anaesthesiology, Clinical Pharmacology, 32(4), 421–423. https://doi.org/10.4103/0970-9185.194772
Yaremko, R. M., Harari, H., Harrison, R. C., & Lynn, E. (1982). Reference handbook of research and statistical methods in psychology: For students and professionals. Harper & Row, Publishers, Inc.
Yucha, C. B., Clark, L., Smith, M., Uris, P., Lafleur, B., & Duval, S. (2001). The effect of biofeedback in hypertension. Applied Nursing Research, 14(1), 29-35. https://doi.org/10.1053/apnr.2001.21078
Yucha, C. B., & Montgomery, D. (2008). Evidence-based practice in biofeedback and neurofeedback (2nd ed.). Association for Applied Psychophysiology and Biofeedback.