Developing Treatment Protocols
Overview
The development of training protocols in neurofeedback has been the result of an evolution of training practices, some growing out of early observational results related to research studies and some developing from attempts to elicit responses in the human or animal EEG that were either atypical or were an attempt to enhance already existing characteristics. This section will explore the history of this evolution and some of the significant milestones that have guided neurofeedback clinical applications during its 60+ year history.
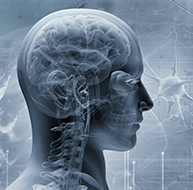
The term protocol refers to a procedure for teaching individuals to achieve proficiency through instruction and practice. This definition works quite well for neurofeedback training and is an excellent description of the process. Neurofeedback training is, indeed, a training process that utilizes reinforcement and instruction to enable an individual to develop improved proficiency or skill in a particular cognitive, mental or central nervous system activity-related task. Graphic courtesy of Mitsar.
Another protocol definition from the National Institutes of Health (NIH) is as follows: “A detailed plan of a scientific or medical experiment, treatment, or procedure. In clinical trials, it states what the study will do, how it will be done, and why it is being done.” This is a more medically or research-oriented definition and suggests a more rigorously organized training plan where the clinician or researcher has identified an issue or condition and has a specific approach to its resolution.
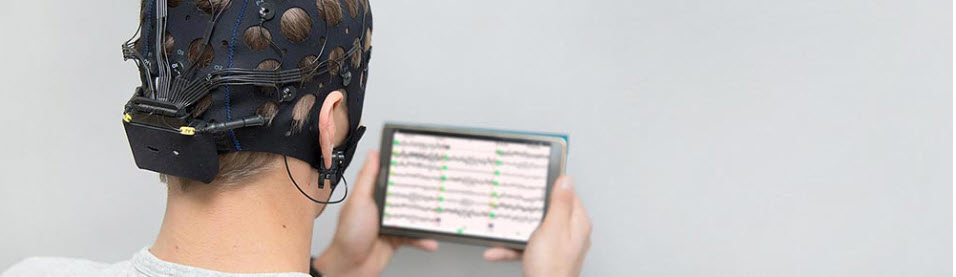
Generally accepted definitions of neurofeedback suggest that it is a process of operant conditioning leading to self-regulation of brain activity. Marzbani and colleagues (2016) state that “Neurofeedback is a kind of biofeedback, which teaches self-control of brain functions to subjects by measuring brain waves and providing a feedback signal.”
However, Strehl (2014) wrote that the learning process associated with neurofeedback requires more than operant conditioning and simple feedback. We also need to understand the influence of classical conditioning, skill learning, and motivational aspects.

Caption: Ute Strehl
She noted that all types of learning, including neurofeedback, result from trial and error, conscious and unconscious responses to events, including feedback and reinforcement, and an awareness of the results of such efforts. To facilitate the ability to incorporate these new skills into everyday life, known as generalization, we need to incorporate a behavioral therapy approach to the process of neurofeedback training. Therefore, our analysis of the development of training protocols will include evaluating which protocols may more effectively meet the client's needs in light of the learning requirements noted above.
In the field of neurofeedback, the term protocol has come to mean a set of training guidelines that can be applied based upon specific assessment criteria or, in some cases, a simple diagnostic category, such as attention deficit hyperactivity disorder (ADHD). This development of preset training approaches has been helpful by allowing new practitioners to begin training clients without necessarily understanding all of the science behind the choices made in a particular training approach.
However, the same ease-of-use has sometimes led practitioners with minimal experience to apply training approaches without proper assessment and without appropriate monitoring to determine the efficacy of a training approach. Additionally, such practitioners may not recognize the negative consequences of inappropriate training, and so the development of standardized, diagnosis-based training protocols has, in some cases, been a mixed blessing. Therefore training protocols, if utilized in neurofeedback training, should be done with an understanding of why such approaches could be appropriate for an individual client, and this decision must be based upon adequate assessment tools and a level of licensure, certification, training, and experience that qualifies the practitioner to work with each client.
BCIA Blueprint Coverage
This unit covers VII. Developing Treatment Protocols - A. Evolution of Neurofeedback Protocols and B. Steps in Protocol Development and Treatment Planning.

This unit covers the History of Neurofeedback Training Protocols, Defining an Effective Training Protocol, and Primary Schools of Thought in Neurofeedback Training.
Please click on the podcast icon below to hear a full-length lecture.

History of Neurofeedback Training Protocols
Two early researchers in brain activity were Joe Kamiya and Barry Sterman. Kamiya began by exploring the alpha rhythm, the first EEG pattern identified by Hans Berger in 1929. Alpha is generally specified as 8-11 or 8-12 Hz.
Caption: Hans Berger
Kamiya
Kamiya (1968) worked with subjects to determine whether they could identify alpha activity and develop volitional control to increase the voltage in the measured alpha activity. His earliest experiments began in 1956 and are described in Neurofeedback The First Fifty Years (Evans, Dellinger, & Russell (2020). These experiments at the University of Chicago involved presenting a direct feedback signal to the subject to indicate a specific EEG behavior, in this case, an increase in alpha amplitude above a set threshold. This was likely the first instance of EEG training in history.
Caption: Joe Kamiya
Kamiya’s work eventually led to work at the Menninger Foundation by Elmer and Alyce Green and Dale Walters. Eugene Peniston’s experience at Menninger resulted in Peniston’s alpha-theta training protocol (Peniston & Kulkosky, 1989, 1990). Kamiya's research influenced Fehmi’s work with alpha synchronization (Fehmi & Robbins, 2007), Budzynski’s twilight learning (Budzynski, 1977, 1996; Sittenfeld et al., 1976), Hardt’s alpha training (Hardt, 2007; Hardt & Kamiya, 1978), and Scott’s addiction disorder treatment programs. Kamiya inspired many practitioners and researchers to explore clinical and research applications.
Caption: James Hardt
Out of this history of alpha and alpha-related training, the protocol most often used in current clinical practice is Peniston’s alpha-theta protocol, including various individual adaptations and modifications of his original approach. This approach will be covered in detail in the section on training protocols.

Caption: Eugene Peniston
Sterman
Barry Sterman’s EEG work initially began with cats. He credits his earliest efforts in studying the EEG to the Russian physiologist Ian Pavlov, who developed the theory of classical conditioning (Pavlov, 1927). Sterman’s initial interest was related to the concept of internal inhibition (Sterman, 1996) in its relationship to sleep onset. He decided to utilize EEG recordings to evaluate the behavior of cats. He attempted to use operant conditioning techniques instead of the classical conditioning used by Pavlov (Ross, Sterman, & Clemente, 1967; Sterman & Wyrwicka, 1967; Wyrwicka & Sterman, 1968). <
<
Caption: M. Barry Sterman
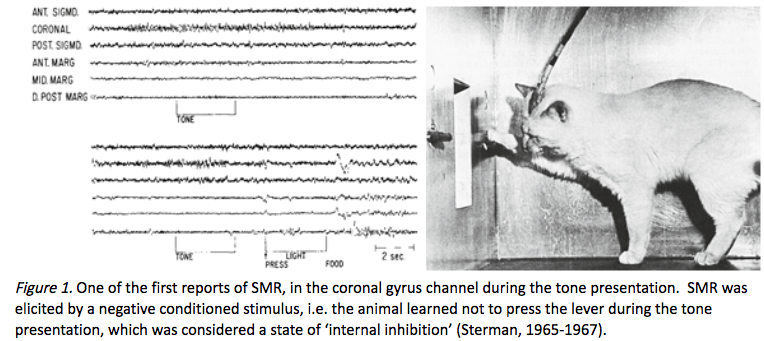
Sterman and his colleagues worked with cats who were first trained to press a bar to receive a food reward. They then introduced a tone that was associated with the withholding of the food reward. If the cat pressed the bar while the tone was on, the tone would be prolonged, but if the cat waited until the tone stopped and pressed the bar, the food was delivered immediately.
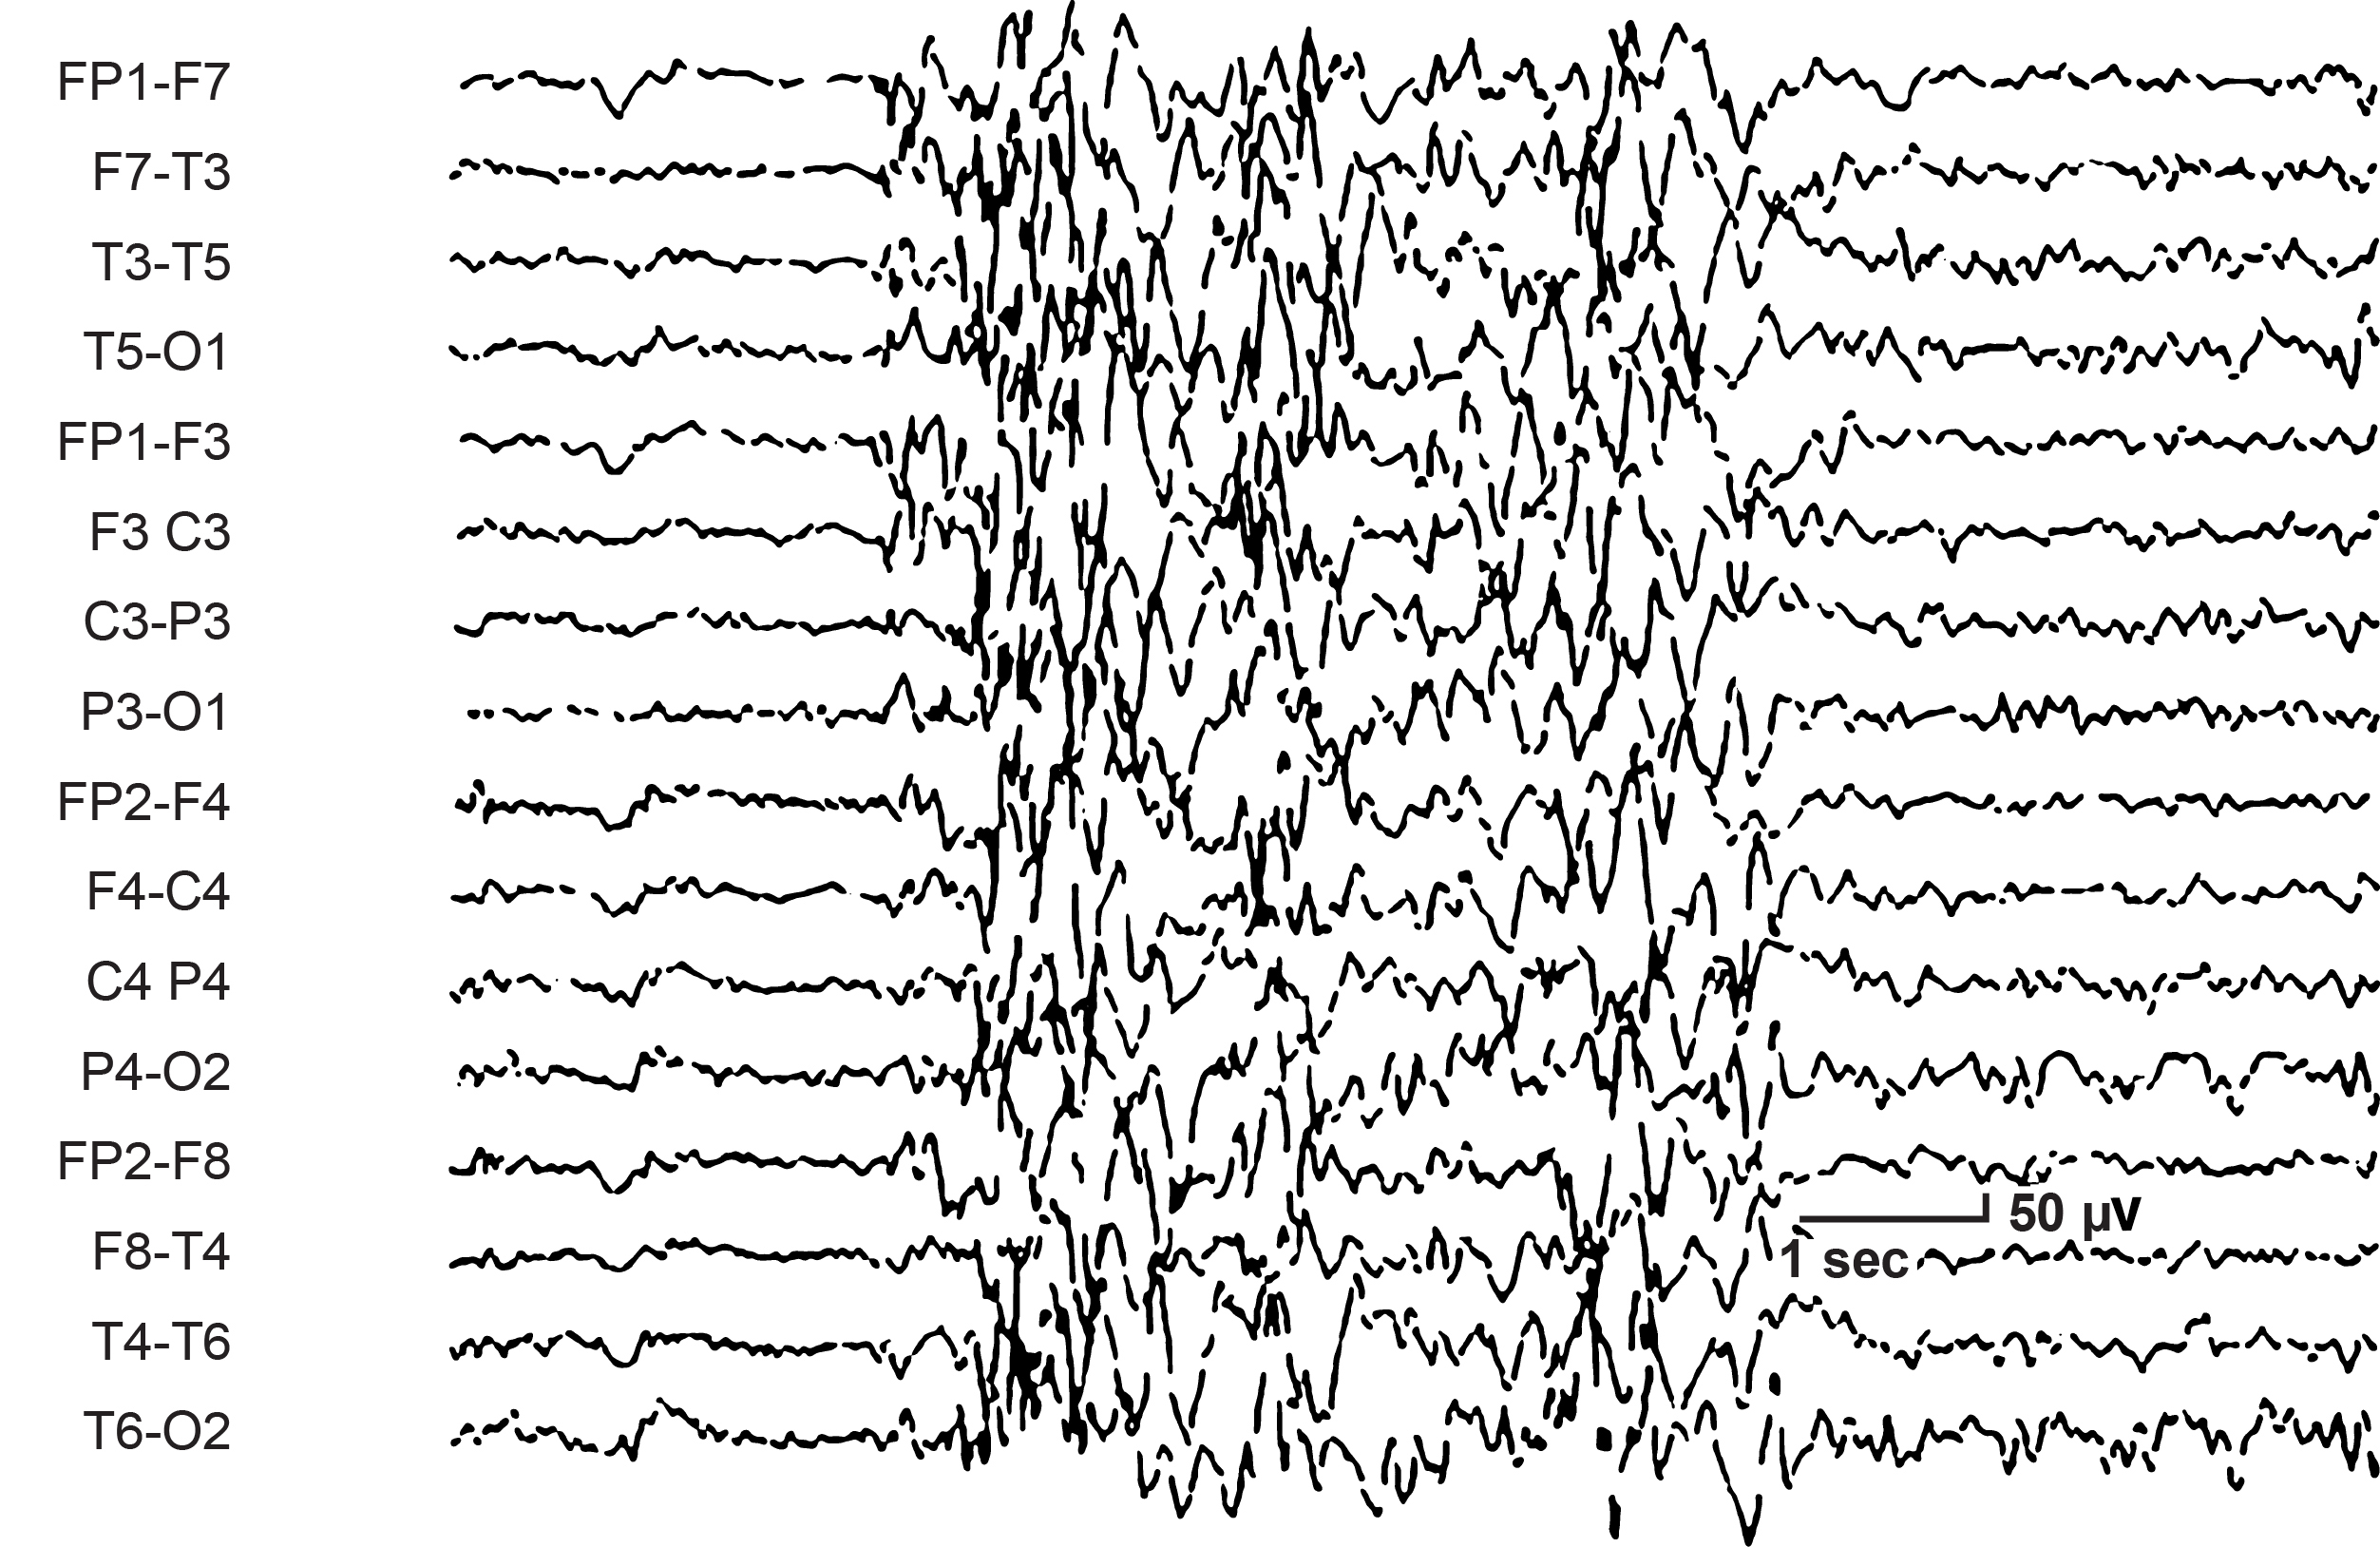
In his 1996 paper describing the history of his work with EEG, he reported two behaviorally specific EEG patterns emerging from the study. One pattern was related to the learned suppression of the bar press response during the tone presentation. The other was related to the experience of the reward, following the completion of a correct response. The pattern associated with the suppression of bar pressing behavior was in the 12-20 Hz frequency band, seen within the sensorimotor cortex. Because of the localization to the sensorimotor cortex, Sterman reported labeling this rhythmic activity the sensorimotor rhythm (SMR). He noted a similarity between this pattern and the EEG pattern seen during sleep, known as sleep spindles, that typically show a rhythmic burst of activity in the 12-15 Hz range.
SMR graphic redrawn by minaanandag on fiverr.com.
Caption: SMR Activity
The pattern he noted associated with the food reward was a 4-12 Hz rhythm in the posterior dorsal cortex, along the midline at approximately the 10-20 system coordinate Pz. He labeled this EEG behavior post reinforcement synchronization or PRS.
Noting that these were the two most clearly defined patterns seen in the trained cats, the decision was made to attempt to operantly condition activity associated with these findings. The initial training focused on the SMR pattern. A signal detection filter centered at 13 Hz was set to activate the feeder when a defined amplitude and duration of 12-14 Hz activity occurred to trigger a relay (Sterman, Wyrwicka, & Roth, 1969; Wyrwicka & Sterman, 1968). The cats were found to be amenable to this training, and they learned to produce this rhythm voluntarily. He reports that between 150 and 200 conditioned responses could be elicited before the cats became satiated and were no longer interested in further food rewards.
The behavior associated with this conditioned response was the suppression of motor activity. This was not simply physical stillness but a progressive process beginning with a reduction in muscle tone, followed by sustained immobility and then the increased production of the 12-15 Hz rhythm.
Further studies identified the origin of the activity's occurrence in the somatosensory relay nuclei of the thalamus known as the ventral basal nuclei (Howe & Sterman, 1972). Further studies indicated that during the production of increased SMR activity, the behavior of these ventral basal relay cells changed from what was described as random bursting, which more recent knowledge of neurophysiology shows to be associated with the transmission of incoming sensory input, to a more rhythmic pattern that suppressed somatosensory information conduction (Howe & Sterman, 1973).
The thalamus to cortex relay system, or TCR, is a complex system that regulates the transmission of afferent information pathways, through the thalamus and specific thalamic nuclei, to the cortex. Graphic courtesy of Zachary Barry and featured in Wikipedia's article Recurrent ThalamoCortical Resonance.
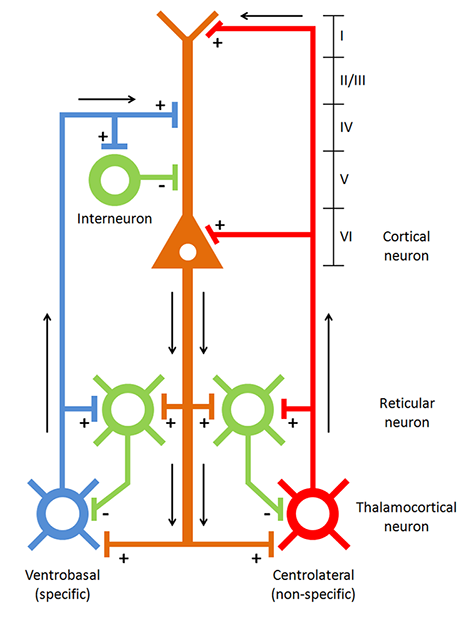
Caption: Thalamocortical circuit diagram depicting both specific/sensory and nonspecific intralaminar thalamocortical systems
A variety of neurochemical relationships either facilitate the transmission of ascending sensory information or block this information by supplanting it with rhythmic patterns of activity transmitted to specific cortical regions such as the somatosensory cortex and the parietal and occipital areas associated with visual processing. When seen in the visual processing areas, this rhythmic activity is generally known as the alpha rhythm, also known as the posterior dominant rhythm (PDR). The movie below is a 19-channel BioTrace+ /NeXus-32 display of alpha activity under eyes-closed and eyes-open conditions © John S. Anderson.
Depending on the state of the cortical neurons receiving these bursting patterns, they may respond by firing synchronously with this incoming input. This primarily depends upon what other tasks these cortical neurons may be engaged in and other characteristics that determine the level of excitation.
The association between these findings and the experimental results with the cats led Sterman and his colleagues to conduct multiple studies with cats and primates to determine the EEG correlates of a variety of lesions at various points in the somatosensory pathway (Sterman 1996). The exact mechanism that facilitates the oscillatory discharges that include the SMR rhythms also, when propagated for more extended periods and when associated with fatigue and drowsiness, can lead to increased rhythmicity, synchronization, and slower EEG frequencies in the range that is typically identified as theta, generally in the 4-8 Hz range.
The movie below is a 19-channel BioTrace+ /NeXus-32 display of SMR activity © John S. Anderson. Brighter colors represent higher SMR amplitudes. Frequency histograms are displayed for each channel. Notice the runs of high-amplitude SMR activity.
Much of the information that Sterman and his colleagues developed from these studies presented entirely new information at the time but which has now become accepted science in the understanding of degrees of arousal and inhibition and their association with EEG patterns seen on the scalp surface, as well as the behavioral and attentional characteristics associated with them.
Through a serendipitous series of events (Sterman et al., 2010), some of the cats that had been trained in previous studies were subsequently included in a study of the toxic effects of a component of rocket fuel known as monomethylhydrazine (MMH). The cats trained to produce increased and sustained sensorimotor rhythm activity showed a significant reduction in reactivity to the chemical compound, including increased latency before the onset of seizure response compared to untrained cats.
Initially, the results of this research were not available to the public, as it was conducted under the auspices of the U.S. Air Force, and therefore it was not published in typical journals. However, it has now become available and serves to underpin the subsequent studies regarding the apparent protective effect of SMR training for individuals with seizure disorders.
The interesting finding from this early research into the effect of MMH was the significant delay or even absence of convulsions in the cats that were trained to produce increased SMR voltage and duration compared to those cats not trained in this activity.
Sterman notes that these cats had not received SMR training for over 3 months before the drug test, and therefore any effect was retained by the cats in the absence of recent training. His conclusions (historical archives included in Sterman, 2010) were that SMR training could provide effective protection against the most devastating consequences of this compound, i.e., seizures.
Subsequently, Sterman published a paper in 1972 (Sterman, & Fryer, 1972) that noted that a localized rhythm similar to the cat SMR can be recorded from the sensorimotor cortex of humans with surface electrodes and that this rhythm can be trained using operant conditioning techniques through EEG biofeedback. This training resulted in an increase in the amplitude and persistence of this rhythm and a greater differentiation from other cortical EEG rhythms. Because of their success with EEG operant conditioning in the cat and its positive effect on reducing seizure activity caused by chemical exposure, they decided to try SMR biofeedback training with a subject with a 7-year history of convulsive disorder. The previous examination of this individual showed no localized lesions and reported generalized slowing but no proximal discharges during a typical EEG recording. Immediately before the beginning of training, the client was experiencing seizures approximately two times per month and had tried several anticonvulsant medications.
After the third session of neurofeedback training, the client demonstrated the beginning of control of the SMR response, and following this session, there were no seizures reported for 3 months. Training, of course, continued, and the client began showing changes in other areas of her life as well, becoming more outgoing, showing increased personal confidence, and an enhanced interest in her appearance. She also reported improved sleep and an easier time waking up in the morning. She had one small seizure after 3 months and then had no additional seizures for the rest of the training.
Subsequent studies by Sterman and others have resulted in over 25 years of peer-reviewed, published research demonstrating the effectiveness of neurofeedback training for seizure reduction. However, a review article (Monderer et al., 2002) concludes that “In the absence of any rigorously controlled studies, the relationship between neurofeedback and seizure frequency cannot be firmly established. Despite these limitations, the promising role of neurofeedback as a treatment for epilepsy is illustrated.”
Defining an Effective Training Protocol
Difficulties with establishing the efficacy of a particular behavioral intervention have been covered in the Research Evidence Basis for Neurofeedback section. However, it is helpful to note that this review article (Monderer et al., 2002) cites multiple research studies that utilized treatments other than the sensorimotor rhythm training, including slow cortical potential training, training to inhibit epileptiform activity in the EEG and several other techniques. They also did not evaluate specific training approaches and whether interventions were applied appropriately. In light of Strehl (2014), it appears clear that simply using operant conditioning techniques without appropriate additional components noted in her paper may result in reduced effectiveness for otherwise helpful treatment.
In an attempt to elucidate the factors associated with effective neurofeedback training, Rogala and colleagues (2016) identify some of the dos and don’ts of effective neurofeedback training. Included in the list of approaches with positive effects is using more specific electrode locations chosen to be associated with known sources of the particular EEG frequency activity being trained, for example, frontal midline theta or posterior alpha activity.
The use of multiple electrodes in the general area identified as a source of this activity is also recommended to represent the source areas more completely. They suggest that neurofeedback clinicians and researchers should identify optimal training electrode locations based on anatomical and functional studies and develop protocols that may use a weighted average approach for the input from various electrode locations.
Suggestions from the same paper of what not to do include avoiding training multiple EEG frequencies simultaneously to avoid confusion and cross-frequency interactions that may result in effects other than those desired for the training protocol. This suggestion did not have much basis in research and was merely an observation that studies involving multiple frequencies appeared to have less robust effects.
Ultimately Rogala and colleagues found that lack of specificity in the training approach seemed to elicit less clear and easily measurable results. However, they did not conclude that improved behavioral results were attributable to this narrower and easily measured focus, making their attempts to define the best approach somewhat inconclusive.
So, how do new practitioners learn the prevailing neurofeedback approaches? There are many perspectives in neurofeedback with sometimes widely varied methods, types of equipment, clinical populations, etc. In clinical practice, individuals providing neurofeedback training generally choose their training protocols based upon instructions from trainers and mentors, and therefore their approaches reflect these influences. In light of what may be considered a type of apprenticeship approach to the study of neurofeedback, which is a common entry point for new practitioners, it is worth discussing the various schools of neurofeedback training and how they have evolved and contributed to the development of the field of neurofeedback.
Primary Schools of Thought in Neurofeedback Training
Various individuals have developed a variety of clinical approaches and in some cases by research groups. The following discussion will try to identify the main proponents of each approach. This is not an exhaustive treatment but will attempt to hit the high points.
Ayers
One of the earliest practitioners of neurofeedback training was Margaret Ayers. She developed her initial interest in EEG as a student of Barry Sterman while working with him at the Veteran’s Administration Center in Sepulveda, California. She developed EEG training protocols mainly by evaluating subtle patterns in the EEG of each client that she was able to see with an enhanced neurofeedback system evolved from software created for missile guidance systems. She claimed a sample rate of more than 25,000 samples per second, which allowed for identifying patterns that she then correlated with known medical diagnoses (Ayres & Montgomery, 2007).
Caption: Margaret Ayers
Ayers based her approaches on her knowledge of neurophysiological characteristics of the brain in correlation with client symptoms (Montgomery, 2019). One of her most important contributions was with individuals with traumatic brain injuries, including those in persistent coma states (Ayers, 1977; Byers, 1998). Her training approaches were mainly focused on the inhibition of unwanted activity, primarily in the theta frequency band. Her partner, Penny Montgomery, continues her work to this day, continuing the training focused mainly on inhibiting unwanted frequencies in the client’s EEG.
Lubar
Following in Barry Sterman's footsteps, Joel Lubar at the University of Tennessee replicated and validated Sterman’s work with seizure disorders. In 1976, he published a study of 8 individuals with epilepsy trained to increase SMR activity (12-14 Hz) and reduce or inhibit 4-7 Hz. Patients showed improvement generally, with two of the participants having the most severe epilepsy becoming seizure-free for up to one month (Lubar & Bahler, 1976). Seizure intensity and duration also decreased in other participants. There was a correlation between participants showing increases in the amplitude of SMR during the training period with decreases in seizure activity.
Caption: Joel Lubar
In 1981, Lubar published a study (Lubar et al., 1981) using a controlled, double-blind crossover design that showed similar results in experimental participants compared to controls.
During the years of studying the effects of SMR training, Lubar and his colleagues noted improvements in behavior and cognitive function similar to those indicated by Sterman. They decided to study the impact of such training on individuals diagnosed with what was then called “minimal brain dysfunction syndrome.” Later, this condition was labeled hyperkinetic disorder and, more recently, attention deficit hyperactivity disorder (ADHD).
Again, using an ABA study design, Lubar and colleagues noted that behaviors improved with increases in SMR and decreases in 4-7 Hz activity, that problematic behavior returned when the training was reversed and then again improved following a subsequent return to the proper training (Lubar, 1976; Shouse & Lubar, 1979).
This finding led to the widespread use of neurofeedback training for ADHD and other behavioral and cognitive function issues. Rewarding increases in 12-15 Hz and rewarding decreases in 4-7 or 4-8 Hz became common practice. Multiple studies have been published, demonstrating the positive effects of such training in clinical, research, and even school environments (Anderson, 1994-1998, unpublished project report manuscripts).
Monastra
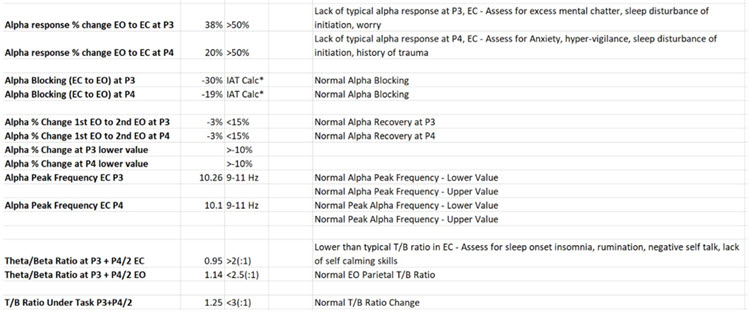
Vincent Monastra followed Lubar’s work with an assessment process for ADHD that utilizes the ratio between the amount (voltage, amplitude, and/or power) of 4-7 Hz theta and 13-21 Hz beta, measured from various locations, most typically along the midline and generally in the anterior midline near the 10-20 system location Fz. This is known as the theta/beta ratio or T/B ratio and has been the subject of several large, multi-site studies to determine both its sensitivity (the ability of an assessment measure to identify individuals known to have the condition or diagnosis for which the measure was developed) and specificity (the ability of the measure to accurately differentiate those with the condition from those who do not have the condition).
Caption: Vincent Monastra
The best of these studies in terms of research design, multi-site participation, and degree of control of variables (Snyder et al., 2006) showed a sensitivity of 87% and a specificity of 94%, for a combined overall accuracy of 89%. The next best assessment tool commonly used for ADHD screening, the Connors Rating Scale for teachers, showed a combined score of 58%, and other methods were even less accurate.
Monastra’s work led to a technique for training clients with ADHD that simply trained for desirable levels of the T/B ratio rather than training the individual components of that ratio with narrower frequency band choices such as 12-15 Hz or 15-18 Hz that others were using to target the activity or behavior of interest more specifically. Many practitioners have used the T/B ratio training approach and reported success with their clients. However, others suggest it lacks the specific focus required for the best effect.
Othmers
Two prominent individuals who have contributed substantially to the field and have a large following are Susan and Siegfried Othmer. They initially studied with Margaret Ayers when she worked with their son, Brian, who experienced temporal lobe epilepsy. After several transitions, they developed a training institute and proceeded to work with clients and train new practitioners.
Caption: Sigfried and Susan Othmer
In the early years of the 1990s, the training they offered clinicians generally stayed with the standard operant conditioning concepts taught by Sterman, Lubar, and others, with a fairly basic Cz midline central electrode location (personal experience, John Anderson, 1992) and training protocols consisting of rewarding increases in either 12-15 Hz or 15-18 Hz and inhibiting increases in 4-8 Hz and faster beta frequencies in the 20-30 Hz range. This evolved into an approach that utilized an attempt to balance training between left and right hemispheres by training to increase 15-18 Hz at C3, the left side sensory-motor area, and 12-15 Hz C4, the right side sensory-motor area. The amount of time spent in an individual session at one or the other of these sites was titrated specifically for each client.
After some experience with this approach, training began to include a bipolar or sequential montage, rather than the referential or monopolar montage that used an ear reference (negative electrode) with the positive (active) electrode on a scalp location.
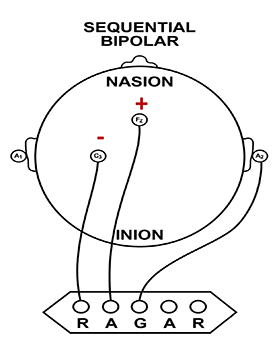
The bipolar or sequential montage involved placing the positive electrode on one scalp location and the negative electrode on another scalp location. The locations were initially C3-C4 or T3-T4 but continued to evolve from practice and experimentation to include combinations of right or left side locations, anterior to posterior combinations, and other combinations and frequency bands.
In light of this expanding complexity, Susan Othmer developed a protocol guide in a flow-chart design with a “start here and progress” to another combination of sensor locations and frequency bands and so on until the most effective combination for that client was found. They began to call this optimal response frequency (ORF) training (Othmer in Evans, 2020).
One component of this training was finding the optimal reward frequency within an individual training session by shifting the reward band to higher or lower values. These values would often end up in very low frequencies in the theta and delta ranges, which caused much condemnation from others in the neurofeedback community. Charges were made that the Othmers were rewarding frequencies that would trigger seizures, and other concerns were expressed (personal experience, 1996-2001).
Some of these concerns were due to ignorance of the nature of common-mode rejection (CMR), which is covered in detail in Neurofeedback Tutor: An Introduction. CMR is important when using a bipolar montage because one is not training to increase or decrease voltage or synchronous activity. In this context, the effect of CMR results in training for the increased difference between the rewarded activity between the two locations.
With CMR, the amplifier amplifies the difference between the signals at each active sensor location and rejects anything that is the same. Because of this, the apparent increase in 12-15 Hz represents a change in the relative amount of this frequency at one or both sensor locations. This could result from a variety of factors. Still, CMR is primarily sensitive to phase relationships between the EEG waveforms at each pair of sensors (whether the waves are in phase, oscillating synchronously up and down at the same time, or out of phase by 180 degrees or somewhere in between) and somewhat less sensitive to the relative voltage at each location.
If voltage increases or decreases in both sensors by the same amount and their phase remains the same, there will appear to be no change in voltage, and if the voltage stays the same but phase changes, then the apparent voltage will change in the displayed signal. This is demonstrated by the simple table below. The actual mechanism of CMR is more complex, but the basic concepts are valid. All examples assume a frequency of 10 Hz.
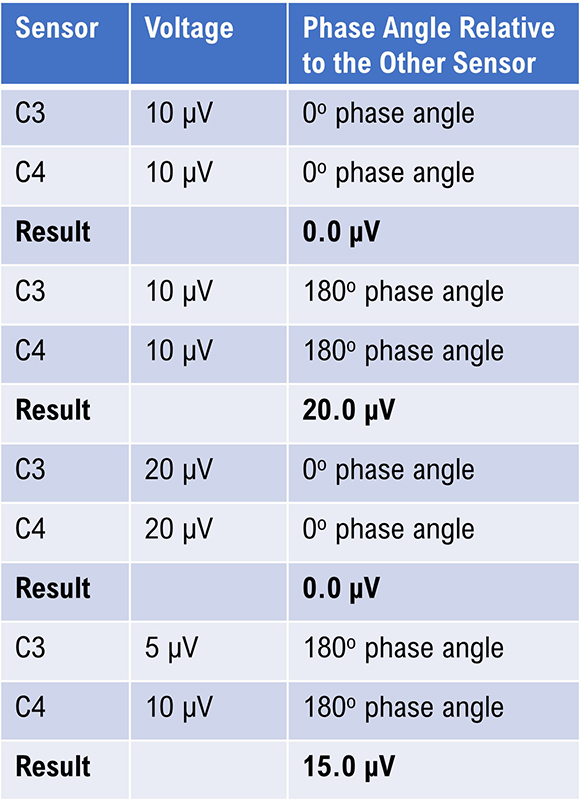
Caption: The Effect of Phase on the Displayed Voltage.
Therefore, the training the Othmers recommended and used in their clinical practice was to promote a more significant difference between sensor locations. The theory put forth to explain the effectiveness of this approach was that to accomplish this task, the client’s brain must communicate internally and exercise greater control and coordination between these training locations. This would then result in better self-regulation in the central nervous system generally. The Othmers and their students applied these approaches. They reported excellent results, often supported by objective testing, primarily based on continuous performance tests discussed in the assessment portion of this program. There were several published studies of results using this, or similar training approaches at this phase of their work (Kaiser, 1998; Kaiser & Othmer, 2000; Linden et al., 1996; Lubar, 1995; Othmer, Othmer, & Kaiser, 1999; Putman et al., 2005).
Ultimately, the evolution of the Othmer method led to training in a frequency below 0.1 Hz, known as infra-low frequencies. This caused even more controversy in the field because these portions of the EEG frequency spectrum are poorly understood. The mechanisms of control of this area of electrophysiology are even less clear. This is also within the frequency spectrum occupied by such artifacts as eye blink, eye movement, cable sway, electrodermal responses (GSR), electrode drift, and other factors. Siegfried Othmer has a doctorate in physics and has explained that these issues have been addressed and that the training proceeds effectively despite these factors due to proprietary signal processing methods (personal communication, 2021).
There have been multiple published reports regarding infra-low frequency training (Legarda et al., 2011; Othmer & Legarda, 2011; Sasu & Othmer, 2020). Other clinicians have also developed their applications associated with training in these areas of brain electrophysiology below 1 Hz.
Following the move to ILF frequencies training, the Othmers continued to incorporate A-T training, using a two-channel sum training approach. They have recently included a two-channel synchrony training approach using the alpha and gamma frequency bands.
The Othmers have a large following, and many clinics and individual practitioners employ these methods and report positive results with their clients. An explanation of what is being trained in the ILF protocol is difficult to come by and must wait for future revelations.
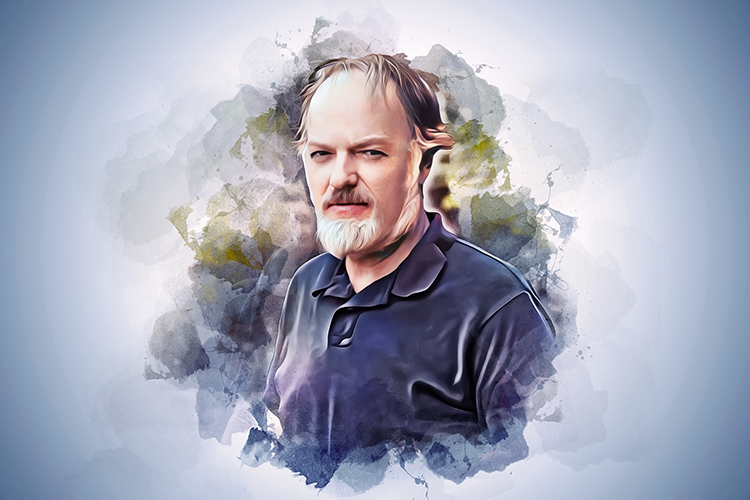
Mark Smith
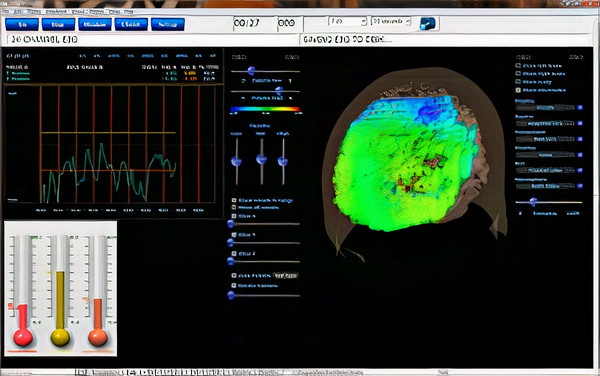
Another prominent clinician in the neurofeedback field, Mark Smith, has also pursued a similar low-frequency training that he terms infra-slow frequency training, utilizing different amplifiers and software. He initially trained with the Othmers but then began developing his approach in providing a feedback signal for activity below 0.1 Hz. As time went on, he began to incorporate database training, also known as z-score training, using the Neuroguide database developed by Robert Thatcher. He incorporated quantitative EEG, learning from Jonathan Walker, MD, and others.
Caption: Mark Smith
Smith's explanation of his approach to infra-slow-frequency (ISF) training in collaboration with Thomas Collura (Smith et al., 2014) is that the training involves providing the client with information regarding the phase of the ISF signal rather than the typical amplitude fluctuations of an alternating current EEG frequency derived from a peak to peak digital processing function. As noted in the above-mentioned article, the time constant is quite long, requiring significant time (3 minutes is noted in the article example) for the filters to return to baseline following a significant shift in the signal being measured.
Unfortunately, as noted in the Othmers' ILF training discussion, significant voltage shifts occur with typical eye movement, eye blink, electrodermal, and cable sway artifacts. There is no discussion in the article regarding these issues, and therefore, the validity of the training signal feedback is in question. There may be more to the signal processing than is explained in the article to mitigate these effects.
Again, the training results with this approach, using a combination of ISF, z-score, synchrony, and referential enhancement training, have been positive and clinical examples and book chapters (Smith, 2014, 2017, 2018) support continued study.
qEEG-Based Neurofeedback Training
Following the development and proliferation of high-quality EEG recording devices capable of recording 19 scalp electrode locations simultaneously and software capable of creating images derived from the recorded data, the use of a quantitative approach to the EEG began to be more broadly utilized. EEG cap graphic © Roman Zaiets/shutterstock.com.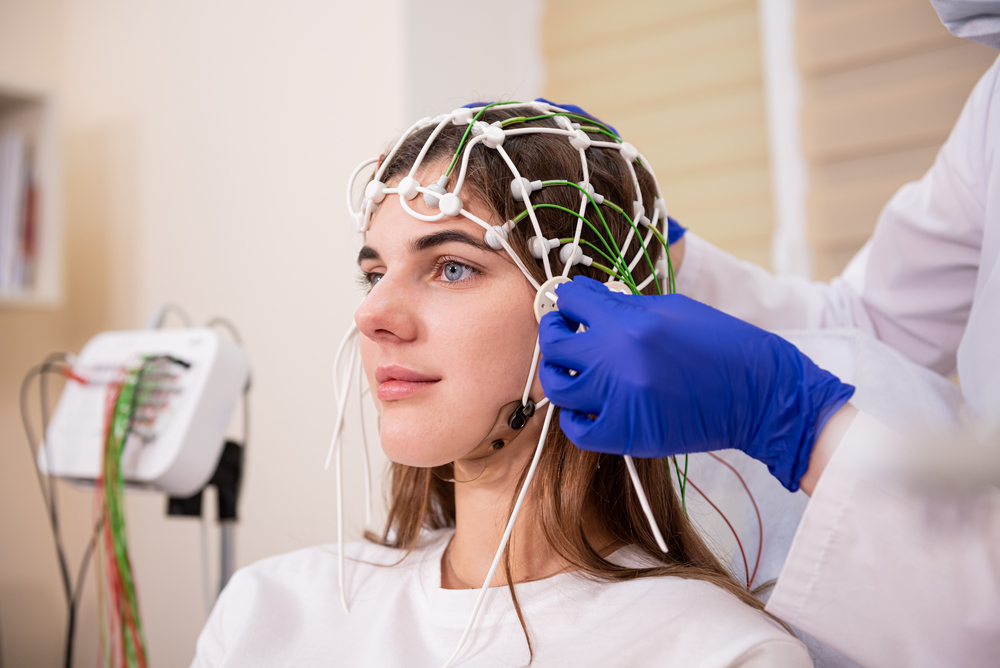
The quantitative assessment of scalp electrical recordings was made possible by the Fast Fourier Transformation (FFT) algorithm, developed in 1965 (Cooley & Tukey, 1965; Dumermuth & Fluhler, 1967).
This method of computation allowed for the deconstruction of the complex EEG information, consisting of multiple frequency components with different amplitudes and characteristics, into frequency and power spectral displays, initially as tables and later as representative values mapped onto topographic head maps (brain maps).
As inexpensive and powerful personal computers became more available in the 1990s, clinicians and researchers were able to utilize these advanced computational methods and begin to identify the components associated with various conditions and disorders. This was facilitated by developing EEG normative databases developed by E. Roy John at New York University, Robert Thatcher at the University of Maryland, Frank Duffy of Harvard University, and others.
Caption: E. Roy John

Caption: Frank Duffy
The EEG has been shown to have strong stability and specificity across multiple ethnic and cultural groups (John, Ahn, & Prichep, 1980) and to be highly consistent in evaluations of test-retest reliability (Fein et al., 1983; Oken & Chiappa, 1988).
Because of this consistency and reliability, the quantitative assessment of the EEG (qEEG) and the availability of qEEG databases became useful clinical tools for individualized training protocol development. Each client could be assessed using multiple techniques, including a qEEG with normative database comparison (see the Assessment unit).
As described by Thatcher (1998), the value of the normative EEG database comparison included the ability to assess the neuropsychological status of the client to help determine the potential basis for the client’s complaints. Using a normative EEG database also helped identify strengths and weaknesses of the client’s neurophysiology to design the optimal training regime and aid in the evaluation of results following a given intervention.

Caption: Robert Thatcher
Many clinicians began to utilize these tools to determine the best training approach for their clients. If an area of the brain showed excess or deficient activity in one or more frequencies, that area would be targeted with uptraining or down-training methods to address those specific issues. This often led to the resolution of the client’s presenting complaints that were potentially associated with these underlying patterns of dysregulation.
The benefits of these approaches for training protocol development were obvious. There was no need to guess at the location of training based upon an understanding of neuroanatomy or neurophysiology. There was no need to guess at the frequency to target in training and no need to guess at the direction of that training – whether to reward increases or decreases in a given frequency or set of frequencies. Finally, the training results were identifiable upon subsequent analysis with follow-up qEEG assessment.
As database-guided training progressed, a few difficulties emerged. One of the first and the one most often called out by neurologists (Nuwer & Coutin-Churchman, 2014) is the problem of artifacts in the EEG. Inexperienced practitioners who had little training in electroencephalography often made errors in data selection and rejection when evaluating an EEG for subsequent processing and database comparison. The presence of eye artifact, including blink, lateral eye movement, eye flutter, and others, leads to an overabundance of delta frequency activity in frontal and lateral frontal EEG sensor locations compared to a normative database. Graphic © eegatlas-online.com.
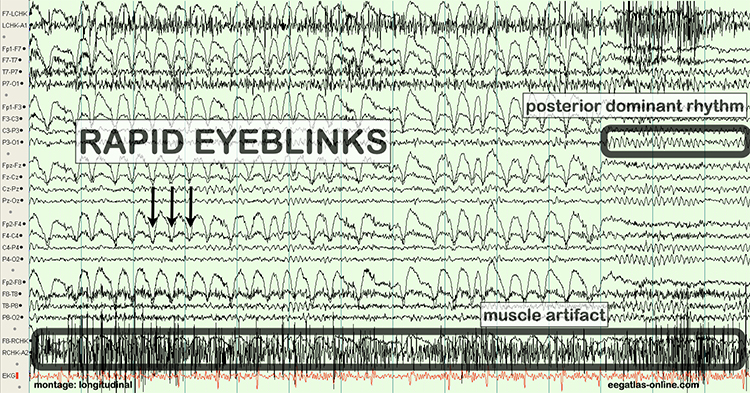
This is due to the frequency of eye artifact (slow, in the 1-4 Hz range) and amplitude (generally quite high, in the 50 to 100 uV range or higher) that is thus in the same frequency as the delta frequency band but with much higher voltages than typical resting delta activity.
Several other artifacts produced additional false-positive findings in the database report. These include EMG (muscle activation) artifact that artificially elevates beta and fast or high beta frequencies, cable sway artifact (in the delta range), electrical “mains” artifact or electromagnetic frequency (EMF) artifact that increases fast beta findings as well as a wide variety of other artifacts. Please see the section on EEG artifacts.
The second major error was to train any finding that showed deviation from normal or typical values when compared to a database of well screened, typical subjects.
As inexpensive and powerful personal computers became more available in the 1990s, clinicians and researchers could utilize these advanced computational methods and begin to identify the components associated with various conditions and disorders. This was facilitated by the development of EEG normative databases developed by E. Roy John (NxLink, later known as BrainDX) at New York University, Robert Thatcher (NeuroGuide) at the University of Maryland, Frank Duffy of Harvard University (BEAM), and others. More recent additions have included the Human Brain Institute (HBI) database developed by Juri Kropotov and the iSyncBrain database developed by a group of Korean researchers.
In some cases, training an abnormal finding resulted in the client reporting worsening symptoms, the return of previously resolved symptoms, and in some cases, the emergence of serious negative symptoms that were new to the client.
This led to the understanding that not all abnormal or out of range findings on a qEEG assessment were associated with pathology. Findings on qEEG assessments needed to be correlated with other assessment findings and with client-reported symptoms. It became clear that some changes in the EEG were compensatory and reflected the system’s attempts to find balance or homeostasis. Removing these compensatory behaviors often resulted in the negative effects noted previously.
From this developing understanding grew an idea that training address only the specific symptom or network that was most problematic for the client and that would have built-in mechanisms to correct for movement of EEG variables in undesirable directions. This has led to the creation of direct database training or z-score training.
The Development of Z-Score Training
To meet the need for z-score training, Robert Thatcher, developer of the NeuroGuide database, in cooperation with Thomas Collura of BrainMaster Technologies, developed Live Z-Score Training (LZT). Beginning in about 1996 (Thatcher et al., 2019), they started with a simple 1- or 2- channel approach that quickly developed into a 4-channel system for training clients by providing them with real-time information about how closely their EEG matched a database of age-matched typical controls. There were approximately 72 variables available within the Thatcher database, including power, relative power, phase and coherence values, and more for the standard EEG frequencies.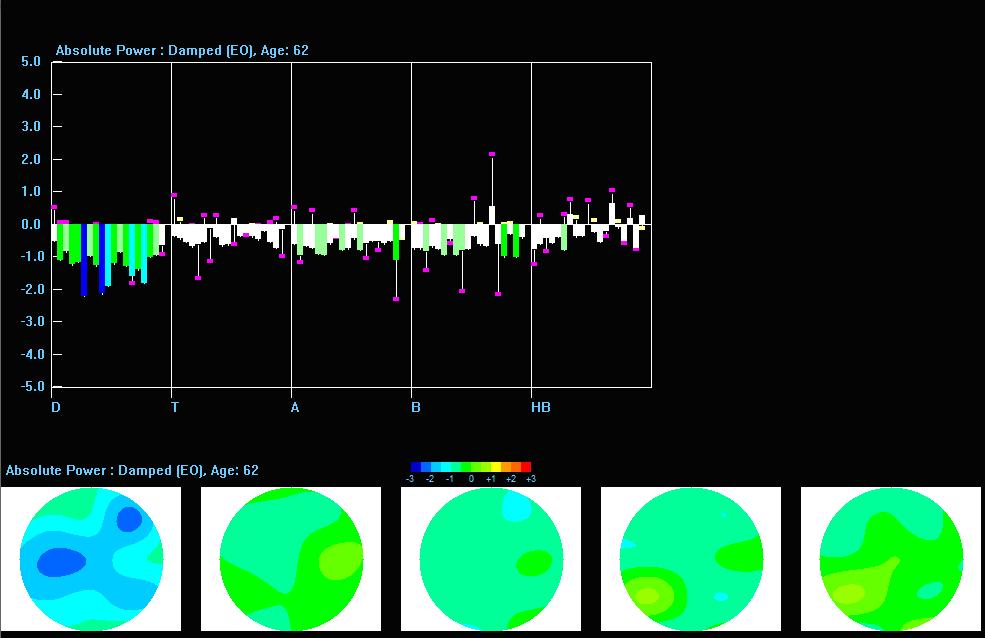
Caption: Z-PLUS LZT Live Z-Score Training with Z-Bars and Z-Maps Display
The client’s EEG values were compared to these values, and differences were displayed in standard deviations. The goal was to train toward z-zero standard deviations.
Caption: Tom Collura
Subsequent advances resulted in 19-channel, real-time surface z-score training, and then 19-channel LORETA z-score training, using the LORETA source localization method to train in 3 dimensions. Ultimately, Collura and his colleagues shifted to the E. Roy John database, BrainDX. Then they more recently shifted again to a database known as qEEGPro, which was developed by using client EEG recordings that were cleaned of clinical EEG patterns identified by a client questionnaire (qEEG.pro/database/). This approach is based upon questionable assumptions, and many qEEG researchers consulted about this expressed skepticism regarding this database approach (personal communication, John Anderson, 2019-2021).
Caption: qEEGPro 19-Channel sLORETA Z-Score Training
Robert Thatcher and his team continued to work with the Neuroguide database and have continued to develop the features of 19-channel z-score training, most recently with the development of swLORETA, a more precise and accurate iteration of the LORETA source localization method.
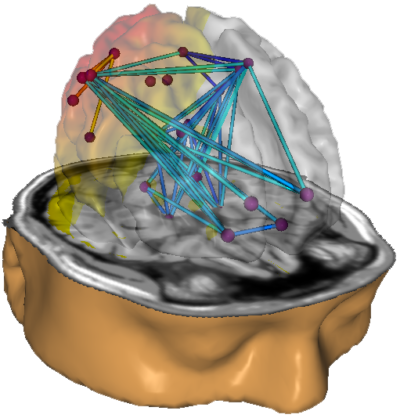
Caption: NeuroNavigator swLORETA
This has resulted in a large base of clinicians using this approach. More than 50 publications have presented evidence of the efficacy of z-score neurofeedback training, suggesting widespread acceptance within the scientific literature (https://www.appliedneuroscience.com/PDFs/Z_Score_NFB_Publications.pdf).
Clinical Database Development
Concurrently with the development of the normative database came another approach to protocol development. Skilled and experienced practitioners who also trained new neurofeedback clinicians began to develop what came to be known as a clinical database.This approach was based upon the clinician’s personal experience with often hundreds of clients and their perception of the similarities and differences in the findings associated with those clients. These individuals also consulted the published research about electroencephalography, neurofeedback and identified correlations between that information and their own experiences.
This led to several semi-automated approaches to assessment and training.
In his article in NeuroConnections (Swingle, 2014), Paul Swingle stated, “For Clinicians, the most accurate databases are clearly clinical.” He describes several logical problems with the use of normative databases, such as the issue of using a group of supposedly "normal" individuals as a reference standard with which to compare a client with clinical symptoms.

Caption: Paul Swingle
Swingle questioned the fundamental premise of symptom-free individuals selected for a normative database having no underlying abnormalities. He offers the example of heritable disorders such as migraine, schizophrenia, and others, which may have verifiable neurophysiological components that have not manifested due to a lack of triggering factors. In other words, genetic characteristics or predispositions that have not been expressed in the form of identifiable symptoms.
This would lead to a database of individuals who pass all the screening tests yet have notable EEG findings that will become components of the normal standard. Because of this, Swingle suggests that such comparisons are not useful for accurate client assessment and training.
Others also have called into question the concept of the normal individual and pointed out that a symptom-free individual may still have abnormal findings on a clinical EEG assessment done strictly based on visual inspection of the EEG by a skilled electroencephalographer (Johnstone & Gunkelman, 2008). They also stated that differences identified by a database comparison refer to differences from average, not from optimal. The term normal is difficult to define, particularly when it comes to a highly variable measure like the EEG.
Proponents of clinical databases claim exceptional accuracy when used with clinical populations because they were developed from experience with similar individuals experiencing similar symptoms, causal factors, symptom progression, treatment histories from the general medical and psychiatric communities, and psychotherapeutic clinicians.
Because of this reported accuracy and the clinical database’s close alignment with client symptomology, they are often more descriptive and, some say, user-friendly. This is one of the concerns regarding the use of a normative database.
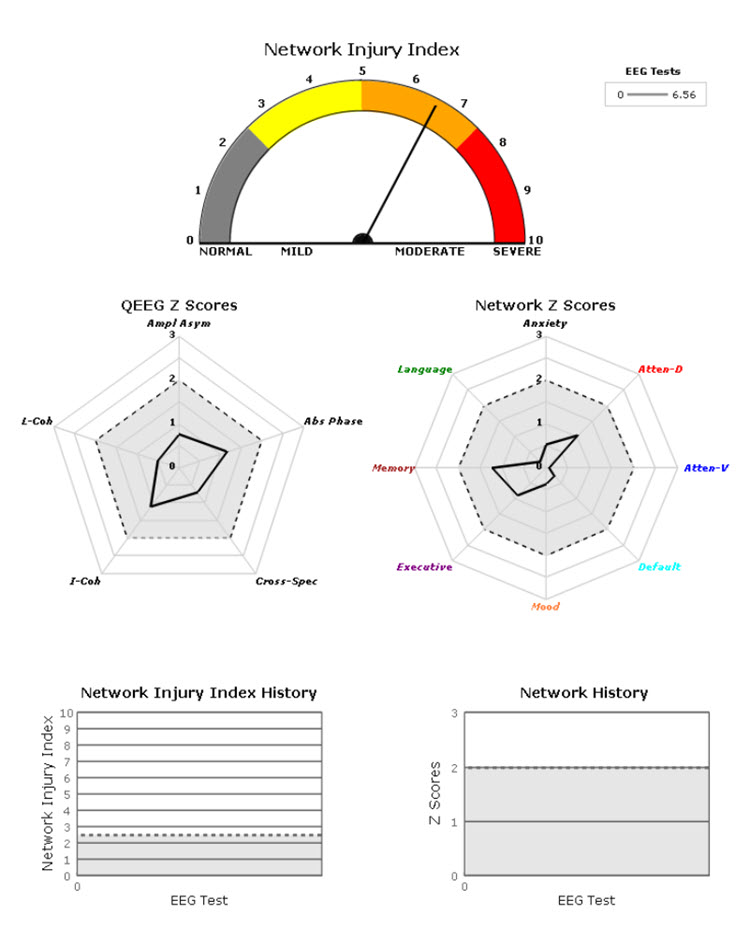
A normative database analysis may produce 200-300 pages of tables, graphs, and topographic brain maps such as the ones below. This impressive array of information can be quite overwhelming and difficult to interpret. Questions arise regarding which components of the analysis are important, which relate to the client’s symptoms, and which are useful metrics for planning client training sessions.
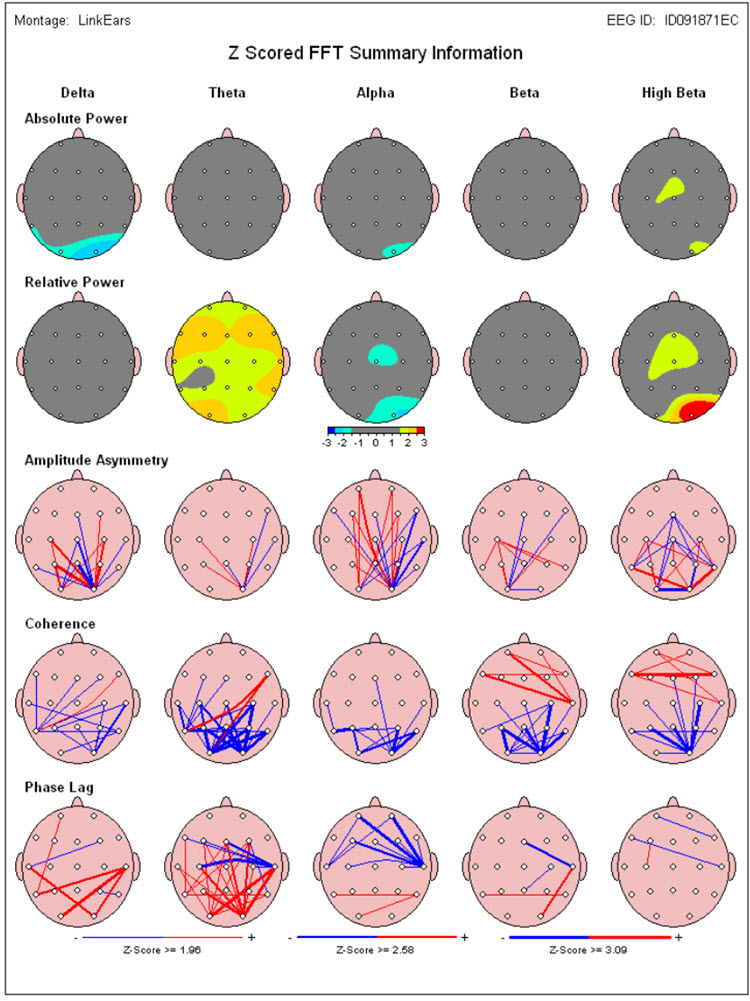
Caption: Image from NeuroGuide Normative Database, Applied Neuroscience.
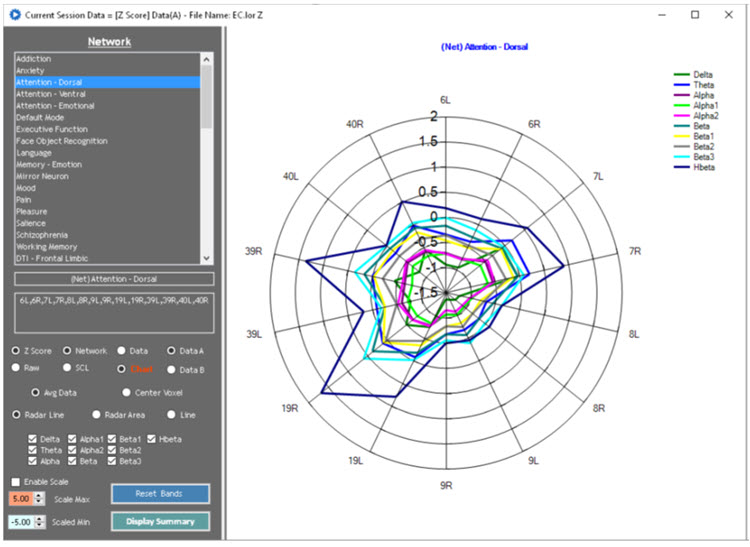
Caption: Image from LORETA Progress Report by Phil Jones.
Caption: Image from NeuroGuide Normative Database, Applied Neuroscience.
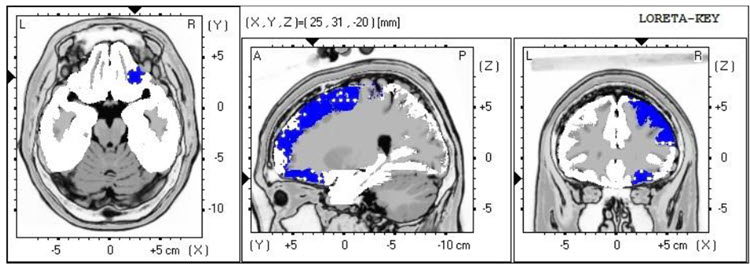
Image from Low Resolution Electromagnetic Tomography (LORETA), Roberto Pascual-Marqui.
Caption: Image from NeuroGuide Normative Database, Applied Neuroscience.
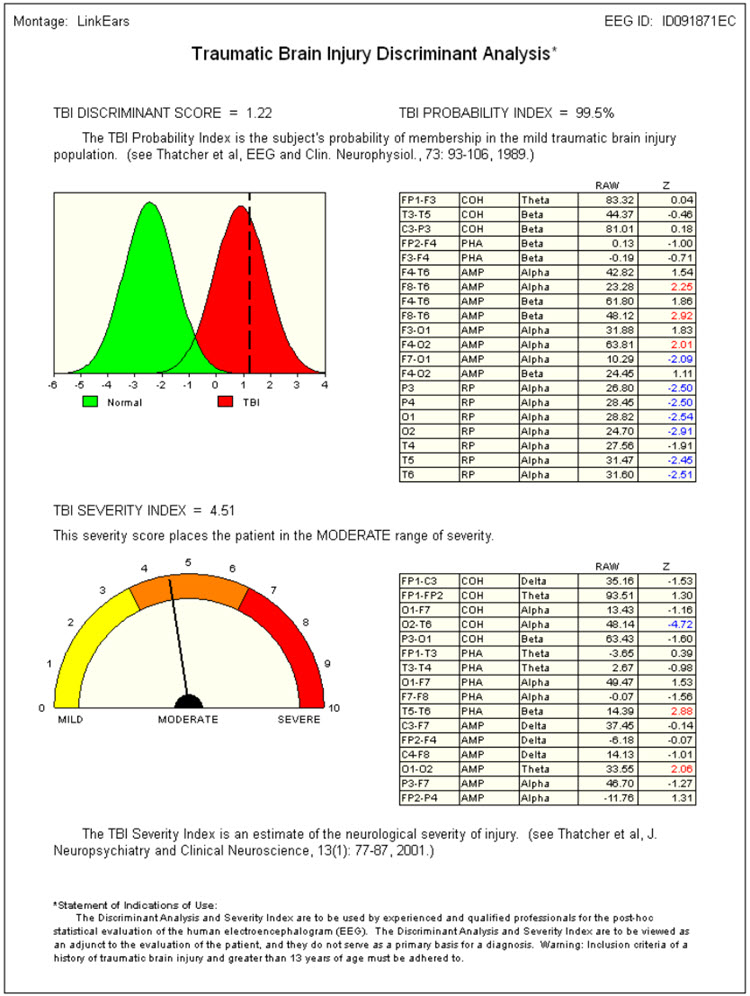
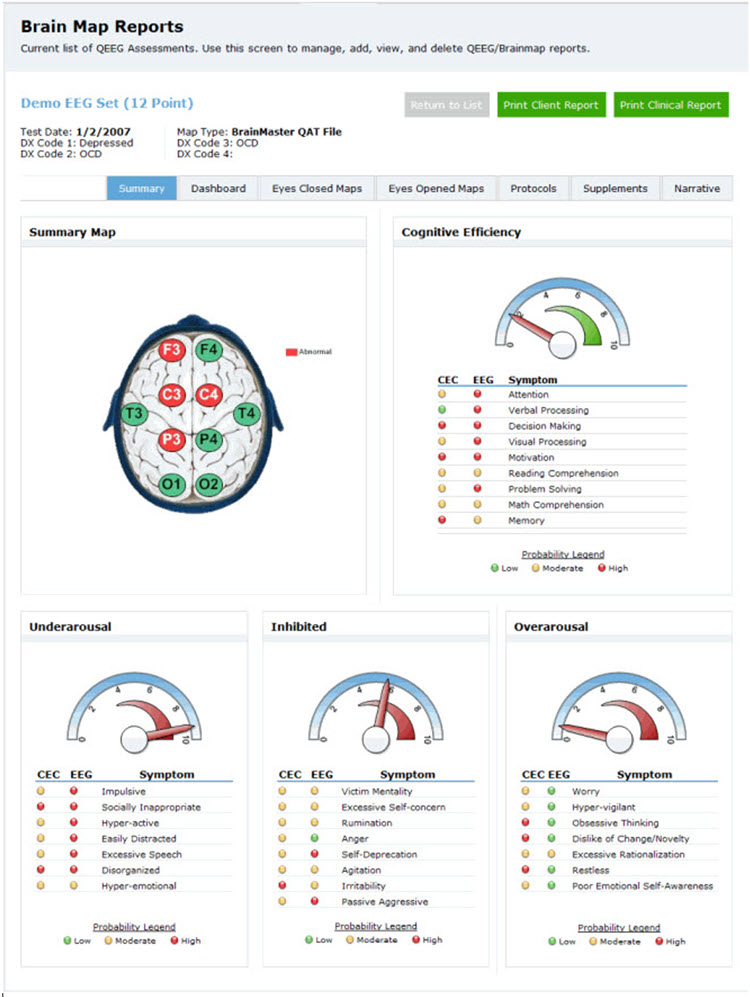
On the other hand, a clinical database is often more descriptive. Some only provide graphs and tables, but most also suggest relationships between the findings and probable client symptoms. Swingle’s Clinical Q provides a data analysis that shows differences from expected data and offers "probes" for client symptoms or behaviors that may be consistent with these findings.
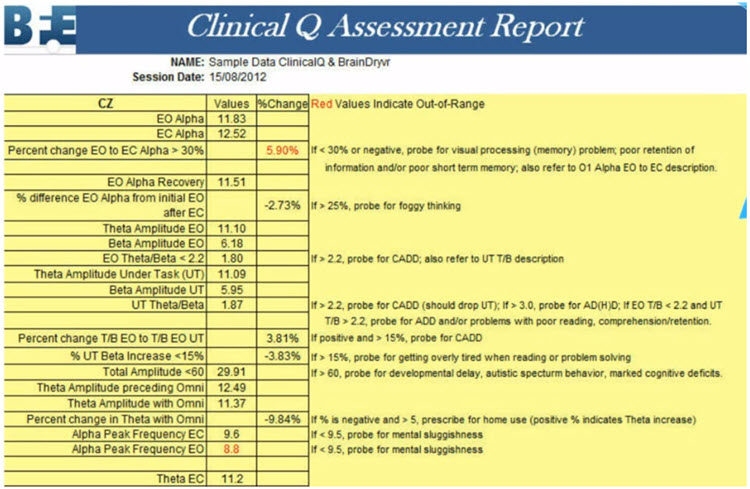
Caption: Clinical Q example report.
Peter Van Deusen
One of the earliest clinical databases was created by Peter Van Deusen (Ribas et al., 2016), who initially studied with Joel Lubar. His goal was to identify client symptoms and behavioral issues without utilizing diagnostic categories so that clients could be trained using neurofeedback approaches no matter what the issue.The culmination of his years of work with clients, training practitioners, and studying the EEG was an approach known as The Learning Curve (TLC). TLC organized client symptoms and findings into six broad categories and identified training approaches to train these clients.
Caption: Peter Van Deusen.
Richard Soutar
Another approach to this method and arguably the most comprehensive is the New Mind Maps developed by Richard Soutar. This system has a variety of levels of analysis up to 19 channels and a detailed report that covers most of the typical metrics and provides narrative content and protocol recommendation for standard amplitude training and z-score training. It offers advice about additional interventions such as audio-visual entrainment (AVE).
Caption: Richard Soutar
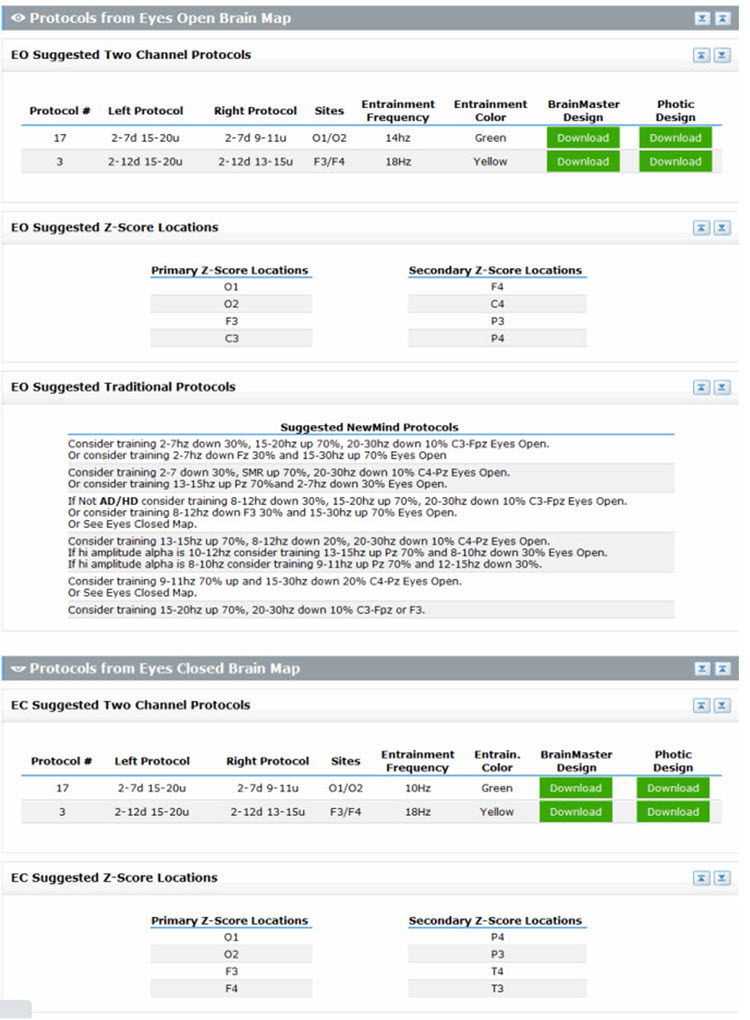
Caption: New Mind Maps, Richard Soutar – http:/www.newmindmaps.com.
Caption: New Mind Maps, Richard Soutar – http:/www.newmindmaps.com.
John Demos
The Jewel Clinical Database, developed by John Demos, author of Getting Started with Neurofeedback (2nd ed.), is another clinical database for ages 7-19 and adults that produces surface and sLORETA representations (maps, graphs, etc.) and training recommendations based on client checklists.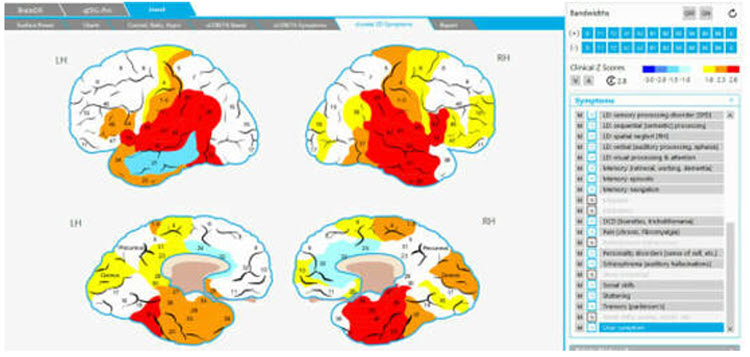
Caption: The Jewel Clinical Datavase, John Demos.

Caption: John Demos.
John Anderson
John Anderson developed an assessment specifically for the Nexus/BioTrace system known as the NewQ.
Caption: John Anderson
This system is like the Clinical Q of Paul Swingle and uses 6 locations, recorded sequentially, two locations at a time. There are four age ranges, 6-11, 12-15, 16-20, and 21+ (adult).
Caption: NewQ, John Anderson.
The following is the disclaimer from the NewQ assessment. These cautions are worth keeping in mind when utilizing such an approach to assessment.
Disclaimer: This assessment tool is based upon a general understanding of the EEG literature plus the author's clinical experience. It should not be viewed as a statistically validated or rigorously referenced instrument and constitutes a set of clinical observations. It is not a diagnostic instrument, and results must be evaluated based on the client's presenting concerns. The clinical judgment of the practitioner must remain primary in any assessment process.
The clinical database approach has value in that it provides practitioners a perspective on client assessment based upon the author’s knowledge and experience. It can be a helpful shortcut for beginning practitioners and experienced clinicians alike as they benefit from different clinical perspectives.
However, because the sensor locations are often recorded sequentially (except for Soutar’s 19-channel version of New Mind Maps), the assessments cannot calculate such important metrics as phase and coherence, except for sensor locations recorded simultaneously. Also, the perspective of the designer/author is quite subjective and, while reflecting knowledge and experience, may also reflect unconscious biases and assumptions that are not rigorously grounded in published research.
Ideally, there will eventually be a blending of the normative database approach with the clinical assessment to the point where a truly accurate and effective "expert" system can be designed to develop best practices for neurofeedback training.
Conclusion
Other advances in protocols will likely be developed over time as clinicians and researchers use more and more sophisticated hardware and software tools to define and refine these training parameters. There are many clinicians and researchers who have made substantial contributions that were not mentioned in this section. Hopefully, a representative sample of protocols and their development has been presented, allowing students to evaluate the different offerings used in their practices.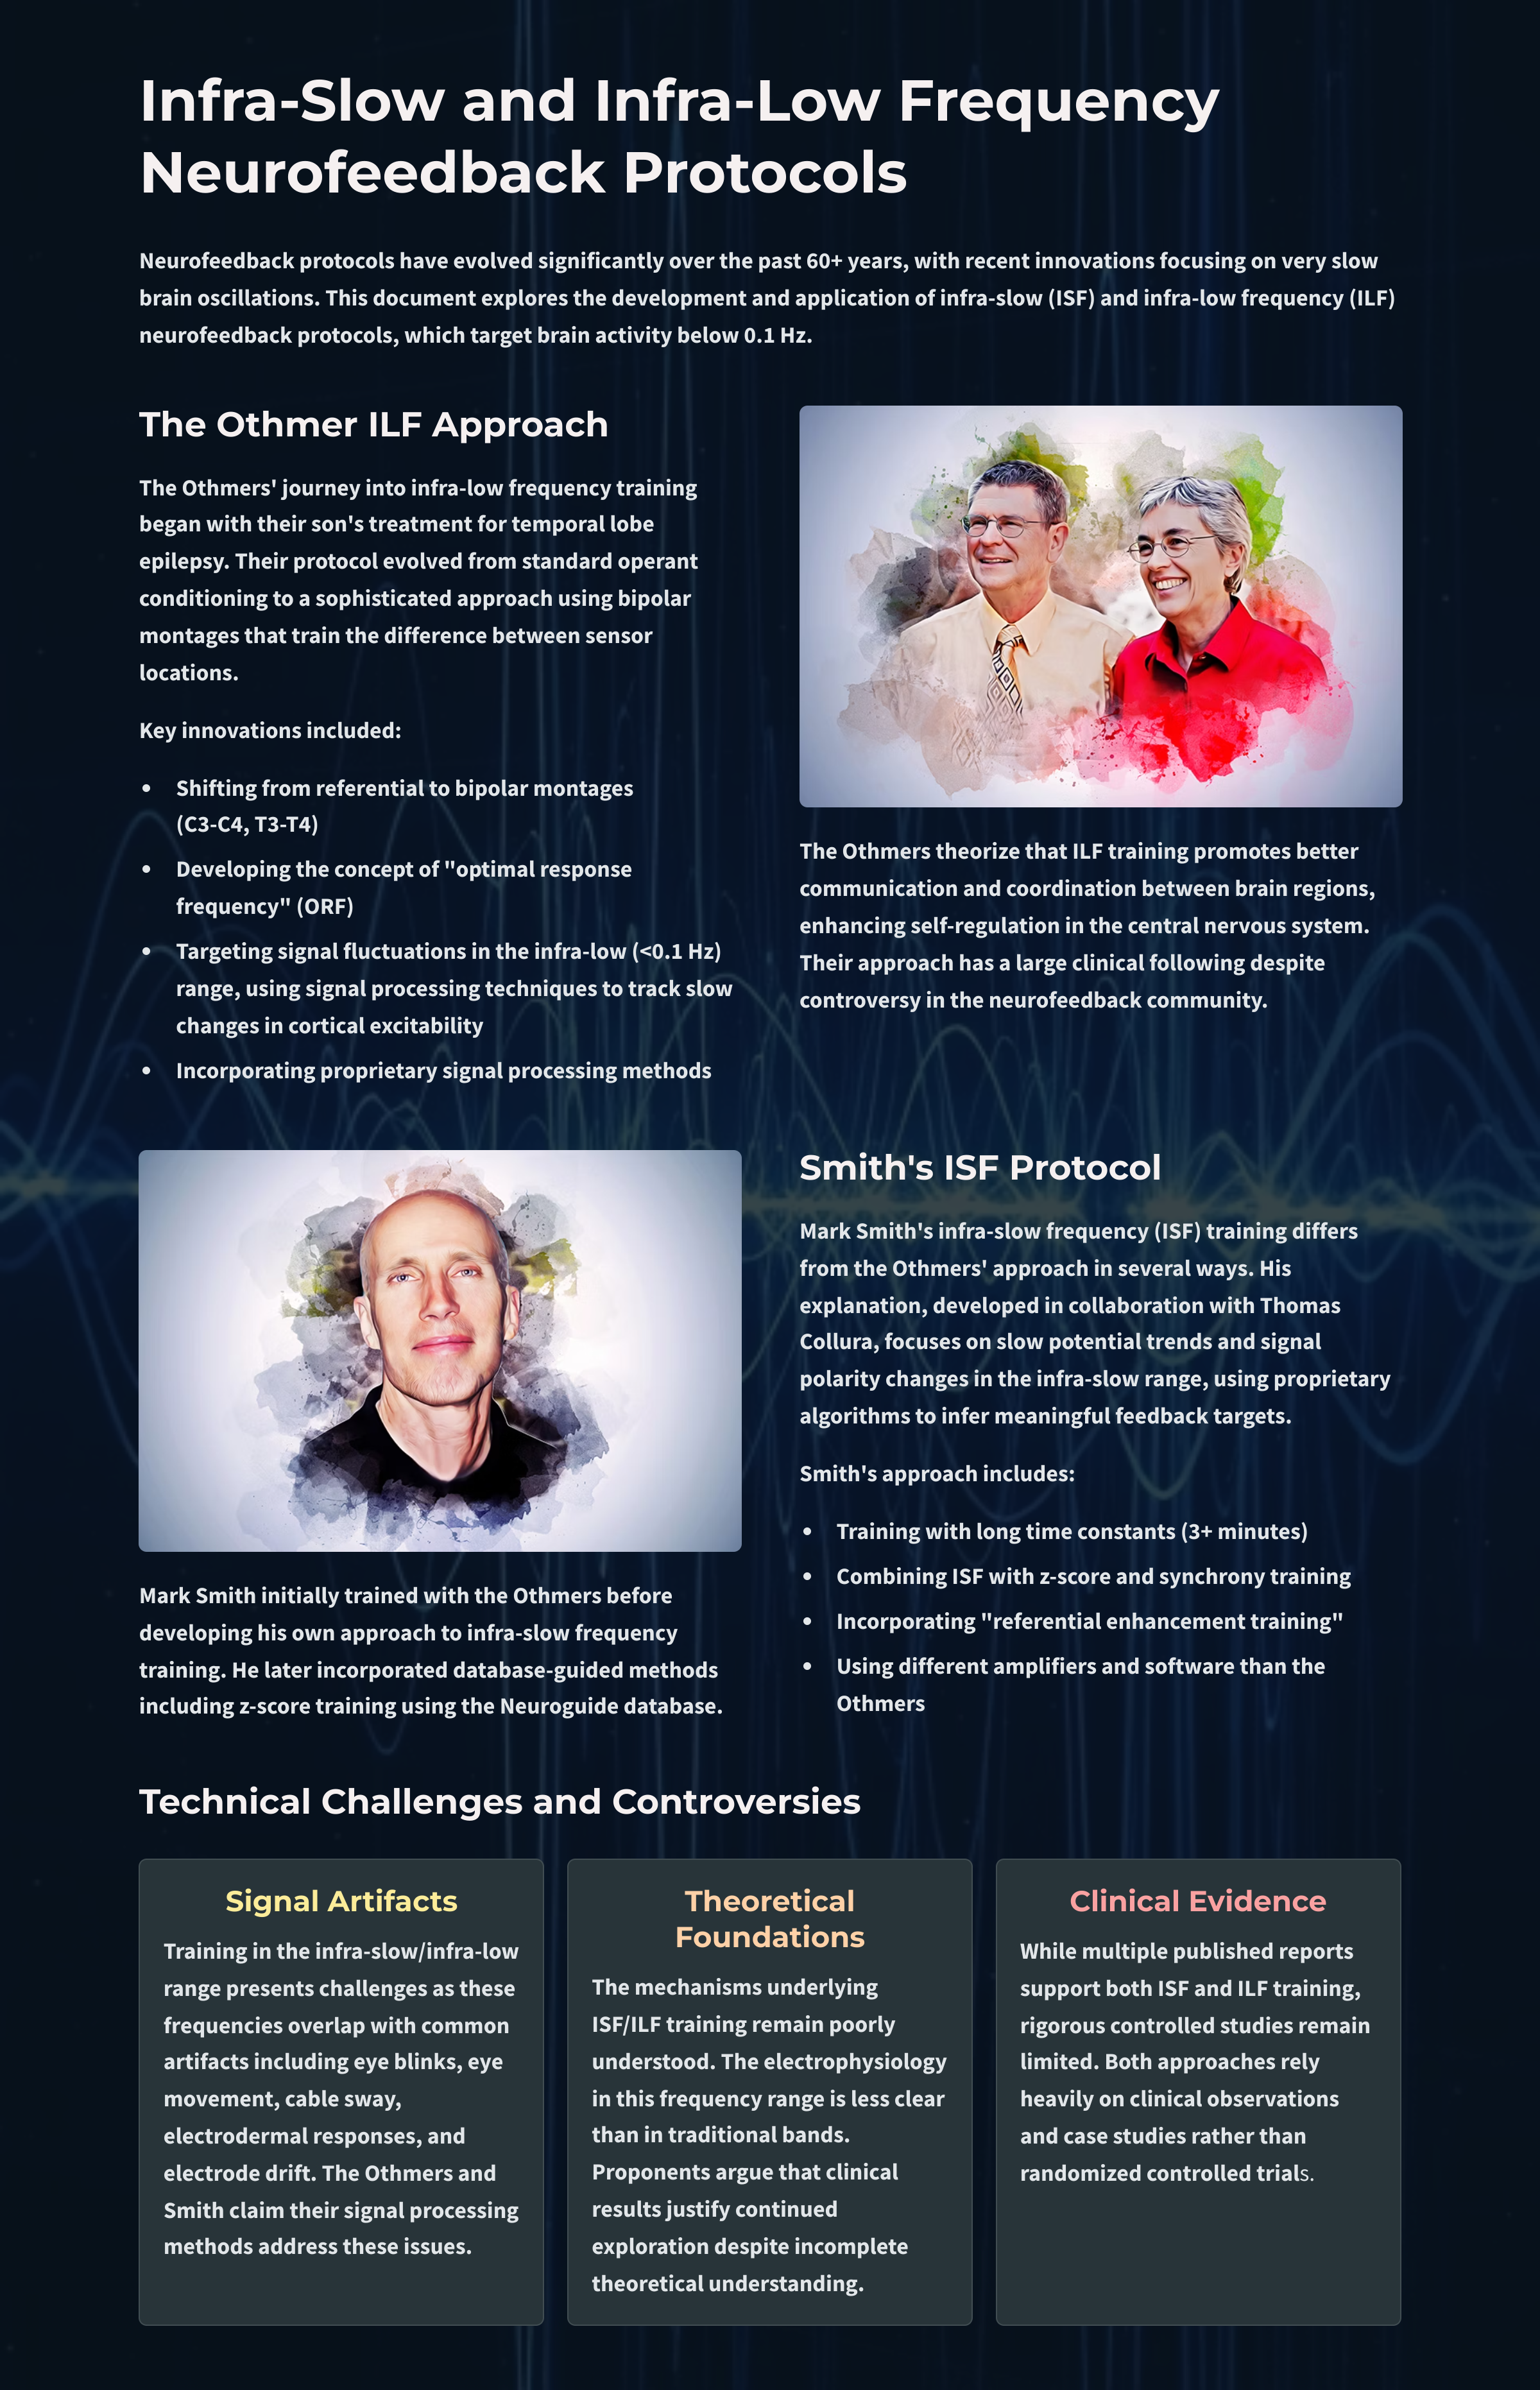
Glossary
ABA reversal design: a small N design where a baseline is followed by treatment and a return to baseline.
alpha blocking: the replacement of the alpha rhythm by low-amplitude desynchronized beta activity during movement, attention, mental effort like complex problem-solving, and visual processing.
alpha rhythm: 8-12-Hz activity that depends on the interaction between rhythmic burst firing by a subset of thalamocortical (TC) neurons linked by gap junctions and rhythmic inhibition by widely distributed reticular nucleus neurons. Researchers have correlated the alpha rhythm with relaxed wakefulness. Alpha is the dominant rhythm in adults and is located posteriorly. The alpha rhythm may be divided into alpha 1 (8-10 Hz) and alpha 2 (10-12 Hz).
alpha spindles: trains of alpha waves that are visible in the raw EEG and are observed during drowsiness, fatigue, and meditative practice.
amplitude: the strength of the EMG signal measured in microvolts or picowatts.
beta rhythm: 12-38-Hz activity associated with arousal and attention generated by brainstem mesencephalic reticular stimulation that depolarizes neurons in the thalamus and cortex. The beta rhythm can be divided into multiple ranges: beta 1 (12-15 Hz), beta 2 (15-18 Hz), beta 3 (18-25 Hz), and beta 4 (25-38 Hz).
beta spindles: trains of spindle-like waveforms with frequencies that can be lower than 20 Hz but more often fall between 22 and 25 Hz. They may signal ADHD, especially with tantrums, anxiety, autistic spectrum disorders (ASD), epilepsy, and insomnia.
bipolar (sequential) montage: a recording method that uses two active electrodes and a common reference.
common-mode rejection (CMR): the degree by which a differential amplifier boosts signal (differential gain) and artifact (common-mode gain).
delta rhythm: 0.05-3 Hz oscillations generated by thalamocortical neurons during stage 3 sleep.
desynchrony: pools of neurons fire independently due to stimulation of specific sensory pathways up to the midbrain and high-frequency stimulation of the reticular formation and nonspecific thalamic projection nuclei.
EEG activity: a single wave or series of waves.
epileptiform activity: spikes and sharp waves associated with seizure disorders.
Fast Fourier Transform (FFT): a mathematical transformation that converts a complex signal into component sine waves whose amplitude can be calculated.
frequency: the number of complete cycles that an AC signal completes in a second, usually expressed in hertz.
hertz (Hz): a unit of frequency measured in cycles per second.
infra-low-frequencies (ILF): frequencies below 0.1 Hz.
infra-slow-frequencies (ISF): frequencies below 0.1 Hz.
low resolution electromagnetic tomography (LORETA): Pascual-Marqui's (1994) mathematical inverse solution to identify the cortical sources of 19-electrode quantitative data acquired from the scalp.
posterior dominant rhythm (PDR): the highest-amplitude frequency detected at the posterior scalp when eyes are closed.
power: the amplitude squared and may be expressed as microvolts squared or picowatts/resistance.
protocol: a rigorously organized plan for training.
Quantitative EEG (qEEG): digitized statistical brain mapping using at least a 19-channel montage to measure EEG amplitude within specific frequency bins.
raw EEG signal: oscillating electrical potential differences detected from the scalp.
reference electrode: an electrode placed on the scalp, earlobe, or mastoid.
sampling rate: the number of times per second that an ADC samples the EEG signal.
sensorimotor rhythm (SMR): 13-15 Hz spindle-shaped sensorimotor rhythm (SMR) detected from the sensorimotor strip when individuals reduce attention to sensory input and reduce motor activity.
sleep spindles: waves that range from 12-15 Hz and last from 0.5 to several seconds widely distributed over the scalp and are observed during Stage 2 and 3 sleep.
standardized LORETA (sLORETA): a refinement of LORETA that estimates each voxel's electrical potentials without regard to their frequency, expresses normalized F-values, and achieves a 1-cubic-cm resolution.
surface Laplacian (SL) analysis: a family of mathematical algorithms that provide two-dimensional images of radial current flow from cortical dipoles to the scalp.
swLORETA: a more precise and accurate iteration of the LORETA source localization method.
theta/beta ratio (T/B ratio): the ratio between 4-7 Hz theta and 13-21 Hz beta, measured most typically along the midline and generally in the anterior midline near the 10-20 system location Fz.
theta rhythm: 4-8-Hz rhythms generated a cholinergic septohippocampal system that receives input from the ascending reticular formation and a noncholinergic system that originates in the entorhinal cortex, which corresponds to Brodmann areas 28 and 34 at the caudal region of the temporal lobe.
z-score training: neurofeedback protocol that reinforces in real-time closer approximations of client EEG values to those in a normative database.
Test Yourself
Customers enrolled on the ClassMarker platform should click on its logo to take 10-question tests over this unit (no exam password).

REVIEW FLASHCARDS ON QUIZLET
Click on the Quizlet logo to review our chapter flashcards.

Visit the BioSource Software Website
BioSource Software offers Physiological Psychology, which satisfies BCIA's Physiological Psychology requirement, and Neurofeedback100, which provides extensive multiple-choice testing over the Biofeedback Blueprint.

Assignment
Now that you have completed this unit, explain the rationale for z-score training using a normative database.
References
Ayers, M. E. (1977). EEG Neurofeedback to bring individuals out of Level Two Coma [Abstract]. Biofeedback and Self-Regulation, 20(3), 304–305.
Berger, H (1929). Über das elektroenkephalogramm des menschen. Arch Psychiatr Nervenkr 87(1), 527–570.
Budzynski, T. H. (1977). Tuning in on the twilight zone. Psychology Today, 11, 38–44.
Budzynski, T. H. (1996). Brain brightening: Can neurofeedback improve cognitive process? Biofeedback, 24, 14–17.
Byers, A. P. (1998). Neurotherapy reference library (2nd ed.). Applied Psychophysiology and Biofeedback.
Evans, J. R., Dellinger, M. B., & Russell, H. L. (Eds.) (2020). Neurofeedback: The first fifty years. Academic Press.
Fehmi, L. G., & Robbins, J. (2008). Sweet surrender-Discovering the benefits of synchronous alpha brainwaves (pp. 231-254). Measuring the immeasurable: The scientific case for spirituality. Sounds True, Inc.
Fein, G., Galin, D., Johnstone, J., Yingling, C. D., Marcus, M., & Kiersch, M. E. (1983).EEG power spectra in normal and dyslexic children. I. Reliability during passive conditions. Electroencephalogr Clin Neurophysiol, 55(4), 399-405. https://doi.org/10.1016/0013-4694(83)90127-x
Hardt, J. V., & Kamiya, J. (1978). Anxiety change through electroencephalographic alpha feedback seen only in high anxiety subjects. Science, 201(4350).79-81. https://doi.org/10.1126/science.663641 PMID: 663641.
John, E. R., Ahn, H., & Prichep, L., Trepetin, M., Brown, D., & Kaye, H. (1980). Developmental equations for the electroencephalogram. Science, 210(4475), 1255-1258. https://doi.org/10.1126/science.7434026
Johnstone, J. & Gunkelman, J. (2003). Use of databases in QEEG evaluation. Journal of Neurotherapy, 7, 3-4, 31-52. https://doi.org/10.1300/J184v07n03_02
Kamiya, J. (1968). Conscious control of brain waves. Psychology Today, 1, 56-60.
Legarda, S. B., McMahon, D., Othmer, S., & Othmer S. (2011). Clinical neurofeedback: Case studies, proposed mechanism, and implications for pediatric neurology practice. J Child Neurol., 26(8),1045-1051. https://doi.org/10.1177/0883073811405052
Leong, S. L., Vanneste, S., Lim, J., Smith, M., Manning, P., & De Ridder, D. (2018). A randomised, double-blind, placebo-controlled parallel trial of closed-loop infraslow brain training in food addiction. Sci Rep 8(11659). https://doi.org/10.1038/s41598-018-30181-7
Lubar, J. F., & Bahler, W. W. (1976). Behavioral management of epileptic seizures following EEG biofeedback training of the sensorimotor rhythm. Biofeedback Self Regul, 1(1), 77-104. https://doi.org/10.1007/BF00998692. PMID: 825150.
Lubar, J. F., Shabsin, H. S, Natelson, S. E., Holdson, S. E., Holder, G. S., Whittsett, S. F., Pamplin, W. E., & Krulikowski, D. I. (1981). EEG operant conditioning in intractable epileptics. Archives of Neurology, 38, 700–704.
Lubar, J. F., & Shouse, M. N. (1976). EEG and behavioral changes in a hyperkinetic child concurrent with training of the sensorimotor rhythm (SMR): A preliminary report. Biofeedback Self Regul,1(3), 293-306. https://doi.org/10.1007/BF01001170. PMID: 990355.
Marzbani, H., Marateb, H. R., & Mansourian, M. (2016). Neurofeedback: A comprehensive review on system design, methodology and clinical applications. Basic and clinical neuroscience, 7(2), 143–158.
Monastra, V. J., Lubar, J. F., Linden, M., VanDeusen, P., Green, G., Wing, W., Phillips, A., & Fenger, T. N. (1999). Assessing attention deficit hyperactivity disorder via quantitative electroencephalography: An initial validation study. Neuropsychology, 13(3), 424–433. https://doi.org/10.1037/0894-4105.13.3.424
Nuwer, M. R., & Coutin-Churchman, P. (2014). Brain mapping and quantitative electroencephalogram. Encyclopedia of the Neurological Sciences (2nd ed.). Elsevier.
Oken, B. S., & Chiappa, K. H. (1988). Short-term variability in EEG frequency analysis. Electroencephalogr Clin Neurophysiol, 69, 191–198. https://doi.org/10.1016/0013-4694(88)90128-9
Peniston, E. G., & Kulkosky, P. J. (1989). Alpha-theta brain wave training and beta-endorphin levels in alcoholics. Alcoholism, Clinical and Experimental Research, 13, 271 – 279. https://doi.org/10.1111/J.1530-0277.1989.TB00325.X
Peniston, E. G., & Kulkosky, P. J. (1990). Alcoholic personality and alpha-theta brain wave training. Medical Psychotherapy, 3, 37–55.
Putman, J. A., Othmer, S. F., Othmer, S., & Pollock, V. E. (2005). TOVA results following inter-hemispheric bipolar EEG training. Journal of Neurotherapy: Investigations in Neuromodulation, Neurofeedback and Applied Neuroscience, 9(1), 37-52. https://doi.org/10.1300/J184v09n01_04
Ribas, V. R., Ribas, R., & Martins, H. (2016). The learning curve in neurofeedback of Peter Van Deusen: A review article. Dementia & Neuropsychologia, 10(2), 98–103. https://doi.org/10.1590/S1980-5764-2016DN1002005
Rogala, J., Jurewicz, K., Paluch, K., Kublik, E., Cetnarski, R., & Wróbel, A. (2016). The do's and don'ts of neurofeedback training: A review of the controlled studies using healthy adults. Frontiers in Human Neuroscience, 10, 301. https://doi.org/10.3389/fnhum.2016.00301
Shouse, M. N., & Lubar, J. F. (1979). Operant conditioning of EEG rhythms and ritalin in the treatment of hyperkinesis. Biofeedback and Self-Regulation, 4, 299–312. https://doi.org/10.1007/BF00998960
Sittenfeld, P., Budzynski, T., & Stoyva, J. (1976). Differential shaping of EEG theta rhythms. Biofeedback and Self-Regulation, 1, 31–45. https://doi.org/10.1007/BF00998689
Smith, M. L., Collura, T. F., Ferrara, J., & de Vries, J. (2014). Infra-slow fluctuation training in clinical practice: A technical history. NeuroRegulation, 1(2), 187–207. https://doi.org/10.15540/nr.1.2.187
Smith, M. L., Leiderman, L., & de Vries, J. (2017). Infra-slow fluctuation (ISF) for autism spectrum disorders. In T. F. Collura & J. A. Frederick (Eds.), Handbook of clinical QEEG and neurotherapy. Routledge Taylor and Francis Group.
Sterman, M. B. (1976). Effects of brain surgery and EEG operant conditioning on seizure latency following monomethylhydrazine in the cat. Exp. Neurol., 50, 757-765. https://doi.org/10.1016/0014-4886(76)90041-8
Sterman, M. B., & Friar, L. (1972). Suppression of seizures in an epileptic following sensorimotor EEG feedback training. Electroencephalogr Clin Neurophysiol,33(1), 89-95. https://doi.org/10.1016/0013-4694(72)90028-4. PMID: 4113278.
Sterman, M. B., Lopresti, R. W., & Fairchild, M. D. (1969). Electroencephalographic and behavioral studies of monomethylhydrazine toxicity in the cat. AMRL-TR-69-3, Aerospace Medical Research Laboratory, Air Force Systems Command, Wright-Patterson Air Force Base, Ohio.
Sterman, M. B., LoPresti, R. W., & Fairchild, M. D. (2010). Electroencephalographic and behavioral studies of monomethyl hydrazine toxicity in the cat. Journal of Neurotherapy, 14(4), 293-300, https://doi.org/10.1080/10874208.2010.523367
Strehl, U. (2014). What learning theories can teach us in designing neurofeedback treatments. Frontiers in Human Neuroscience, 8(894).
Swingle, P. (2014). Clinical versus normative databases: Case studies of clinical Q assessments. NeuroConnections.
Thatcher, R. W. (1998). Normative EEG databases and EEG biofeedback. Journal of Neurotherapy, 2(4), 8-39. https://doi.org/10.1300/J184v02n04_02
Thatcher, R. W., Lubar, J. F., & Koberda, J. L. (2019). Z-Score EEG biofeedback: Past, present, and future. Biofeedback, 47(4), 89–103. https://doi.org/10.5298/1081-5937-47.4.04