- Assessment:
- Home
- Intake
- EEG
- Ongoing
- Demonstration
- Treatment Protocols:
- Early Protocols
- Steps
- Demonstration
- Trends
- Ethics
- Treatment Implementation:
- Client Preparation
- Relationship
- Procedures
- Alpha-Theta
- Remote
- Demonstration
Demonstration and Case Example Exercises for Practice
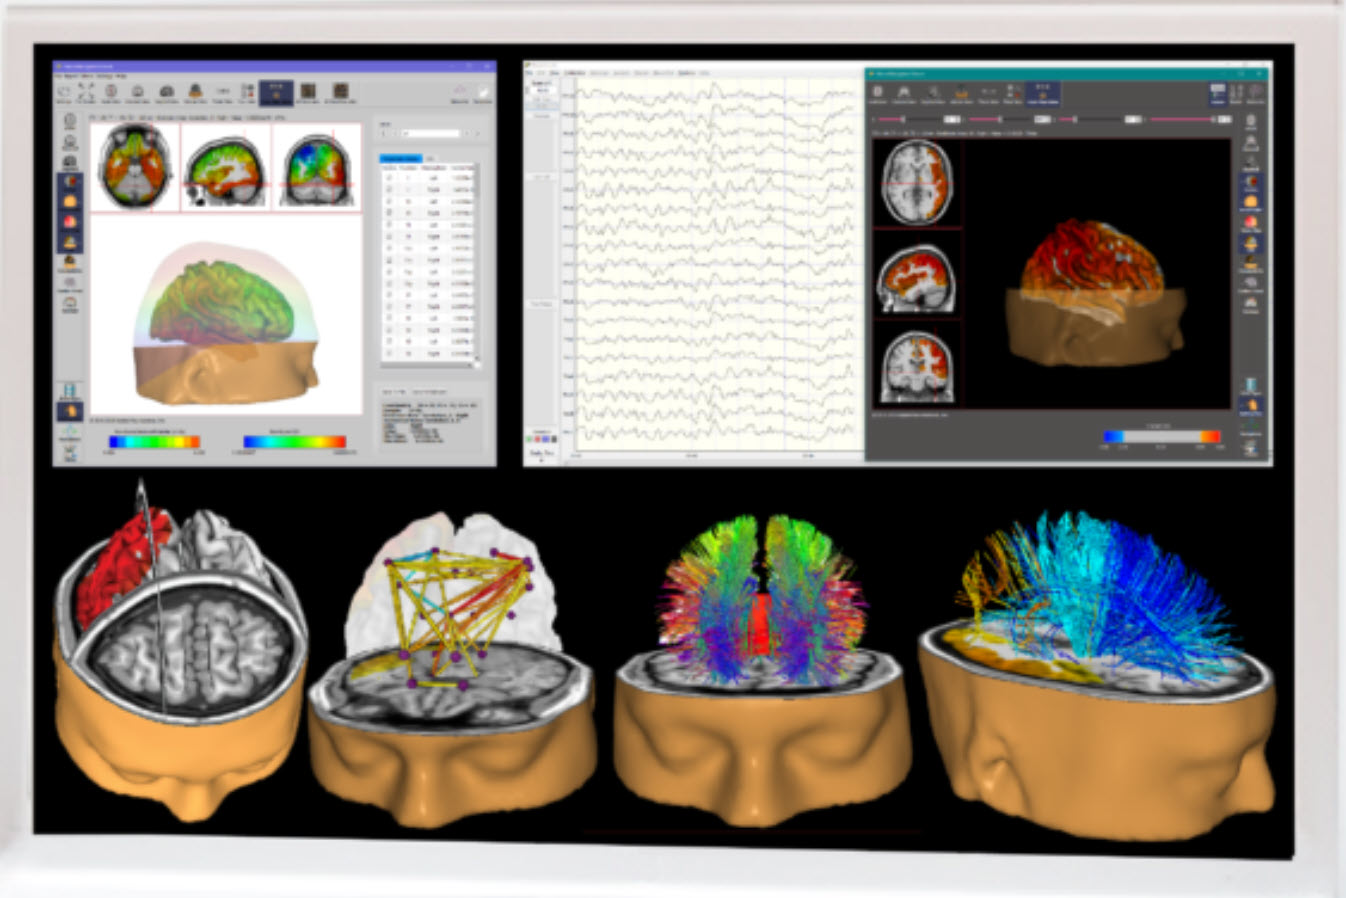
In the Steps in Protocol Development and Treatment Planning unit, we introduced a steps/decision tree for selecting protocols and treatment plans based on assessment data. In this unit, we will review three case examples to illustrate this decisionmaking process. Treatment plans should be evidence-based, informed by neuroscience, and tailored to each client. Graphic courtesy of Applied Neuroscience.
BCIA Blueprint Coverage
This unit covers VII. Developing Treatment Protocols - C. Demonstration and Case Example Exercises.

This unit presents a brief demonstration of neurofeedback training and three case examples that illustrate the steps/decision tree for applying client assessment data to neurofeedback protocol selection and treatment/training planning.
Please click on the podcast icon below to hear a full-length lecture.

BRIEF DEMONSTRATION OF NEUROFEEDBACK TRAINING
Neurofeedback Training to Increase 12-15 Hz EEG activity
This video shows the client (played by Travis, the clinician’s husband) in a typical chair used for training. The clinician, Cortney Amundson of Mindful Restoration in Edina, Minnesota, provided Travis with visual and auditory feedback that responds to his training goals, which have been previously identified using a brief, six-location assessment tool known as the NewQ. A training protocol was identified as appropriate for his concerns from this assessment.The specific training protocol is to increase 12-15 Hz EEG activity, known as the sensorimotor rhythm or SMR, at the Cz electrode in the central vertex area over the sensorimotor cortex. At the same time, two additional training signals are selected for what is known as inhibit training, which involves setting a threshold or goal to train Travis to limit the activity in these signals, in this case, 4-8 Hz theta and 22-36 Hz high or fast beta.
This combination training approach is a standard, evidence-based training intervention. The clinician instructs Travis to observe the training screen, which responds to his EEG activity by presenting a video in normal mode when all goals are being met and which changes to a screening or masking mode in a gradual response to undesirable EEG changes.
Travis observes the screen to watch the video, as much as possible, in the unaltered normal mode, minimizing the masking changes by regulating his EEG activity. As he progresses, the clinician changes the threshold manually, first informing him of this change to understand the resulting change in the feedback display. He is encouraged to modify his EEG a bit more to return to an unimpeded visual and auditory reward. Threshold changes are only made when the client’s progress warrants such changes. There are no automatic threshold adjustments as these violate the training nature of the procedure, which requires the client to reach the defined goal to receive the full reward. An automatic change to the thresholds would remove the need for the client to demonstrate skill acquisition to receive the reward. The client would receive a set percentage reward at all times, despite his participation or lack thereof.
Travis is engaged in skill acquisition even though the clinician instructs him to do nothing but observe the screen. Before the beginning of the session, the requirements for success were described in detail to know what changes would result in positive feedback. However, the effortful attempt to “make” the feedback occur generally impedes the learning process. Therefore, his participation is essentially to know what needs to change, maintain his attention and interest in the feedback, and be motivated to receive the full feedback reward.
The areas of the central nervous system responsible for making the changes are not under conscious volitional control. The training process has been described as one of passive volition. Simply attending to the feedback and remaining alert and interested in the process typically results in skill acquisition. The client needs to attend to how they feel and notice internal changes that correspond to full reward feedback. This will allow them to alter their EEG activity in a non-cognitive volitional manner, resulting in a more consistent state corresponding to the set goals. Once the responses become more dependable, the threshold goals may be changed to encourage even greater change in the desirable direction, as demonstrated in the video.
Video © J. S. Anderson.
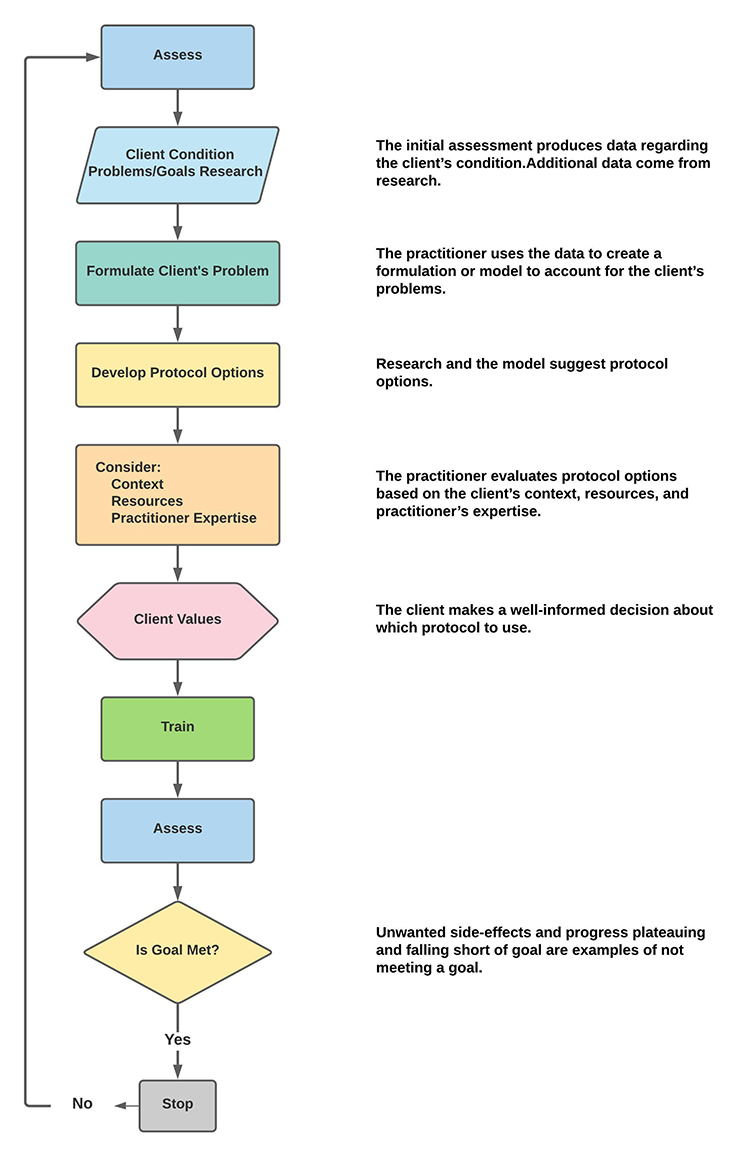
SIMPLIFIED FLOWCHART
Below is a simplified flowchart that guided the three case examples presented in this unit.
PATIENT EXAMPLE A
PATIENT INFORMATION
| Name: Client B | Date: 02/20/2014 |
| Exam#: Client B 10001 | Ref. By: Self |
| Age: 57.51 | Test Site: MNI |
| Gender: Male | Handedness: Left |
RECORDING
| Analysis Length: 01:42 | Ave. LE Split-Half Reliability: 0.98 |
| Ave. LE Test-Retest Reliability: 0.94 | Eyes: Closed |
MEDICATION: None noted
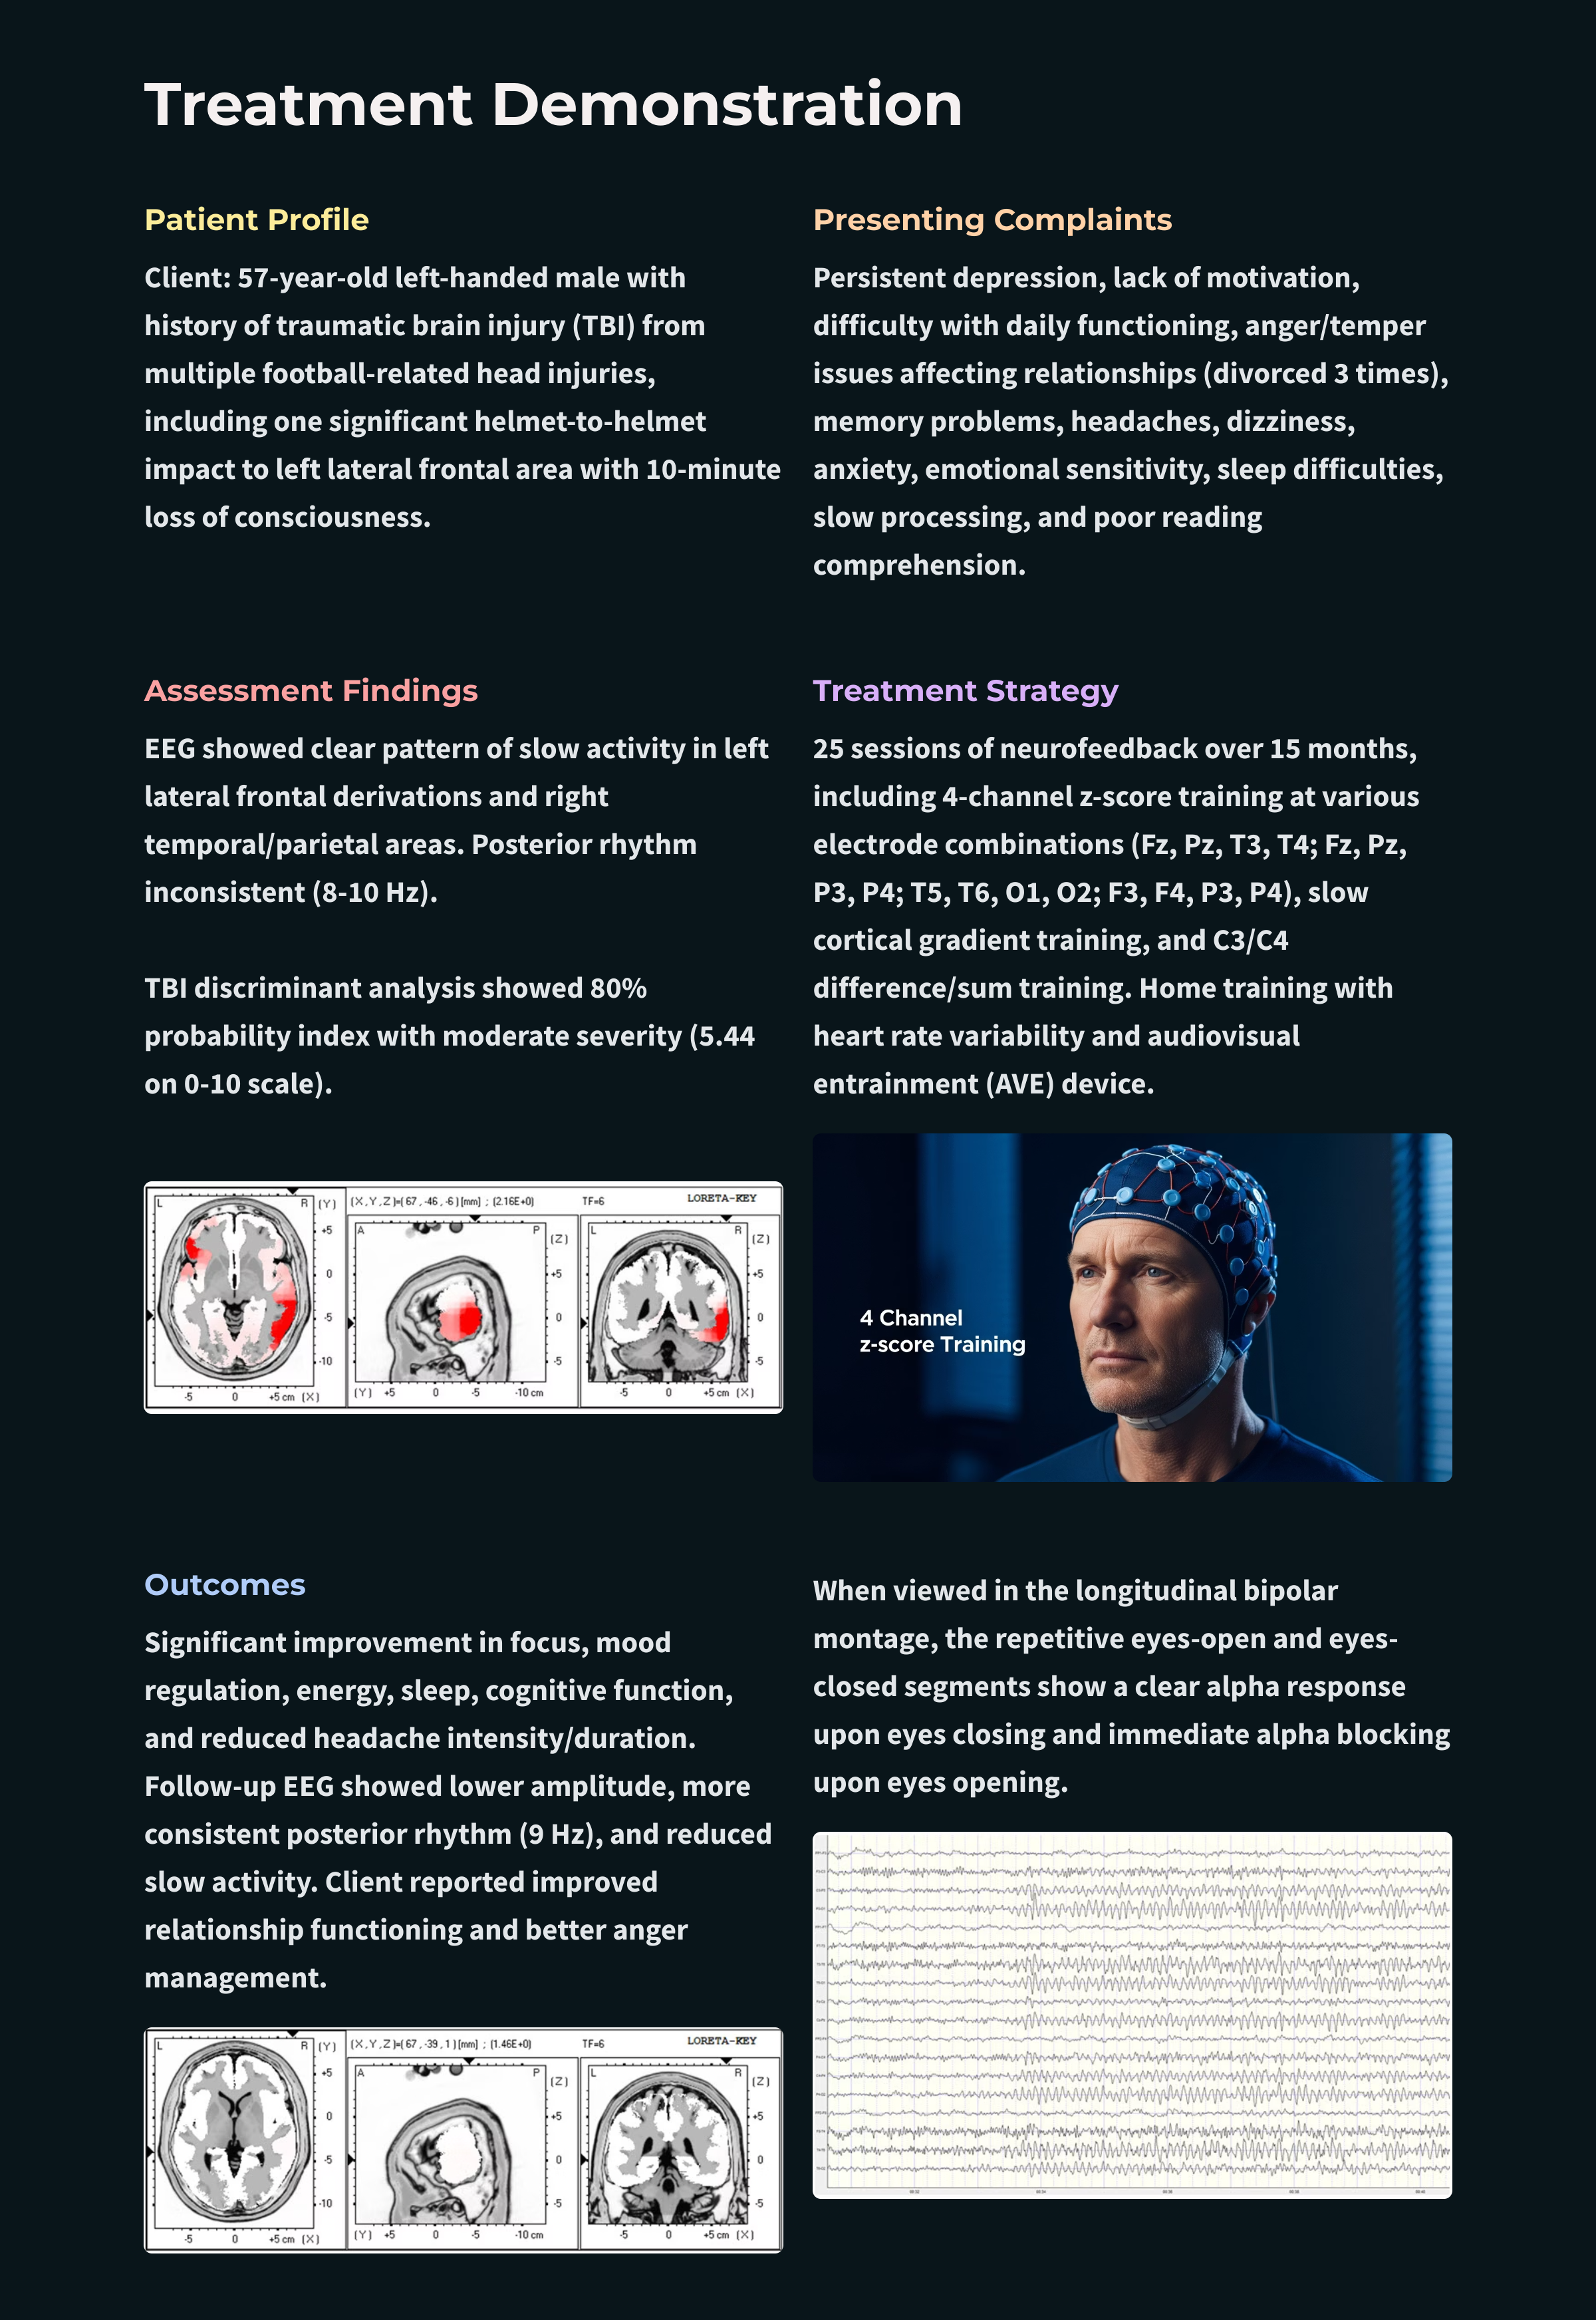
HISTORY: Client B presents with a diagnosis of traumatic brain injury (TBI). His history is significant for multiple head injury events associated with high school and college football. During his college football career, he reports one significant injury from helmet-on-helmet impact to the left lateral frontal area with a period of loss of consciousness for approximately 10 minutes, some confusion, and dizziness immediately following. He reports returning to the game in the second half after sitting out for the rest of the first half. He describes lingering symptoms through the following summer, following graduation, and states he hasn’t played football since. The symptoms faded with time, and though he never felt that he was back to his “normal self,” he became a successful businessperson.
He reports persistent depression with a lack of motivation. He finds it a great struggle to function in his day-to-day activities. He also mentioned that he has a “temper” and that this has cost him several relationships. He is currently divorced from his 3rd wife and feels his mood regulation problems are mostly responsible for these problems.
Symptoms endorsed include depression, headaches, feelings of loneliness, memory problems, occasional dizziness, mild to moderate general anxiety, some fear or panic experiences, difficulties with sequential processing, emotional sensitivity, some social discomfort, problems falling asleep and restless sleep, slow processing and slow response, poor reading comprehension, difficulty understanding concepts, and a lack of feelings of well-being.
VISUAL INSPECTION OF 19-CHANNEL EEG:
EYES-CLOSED CONDITION
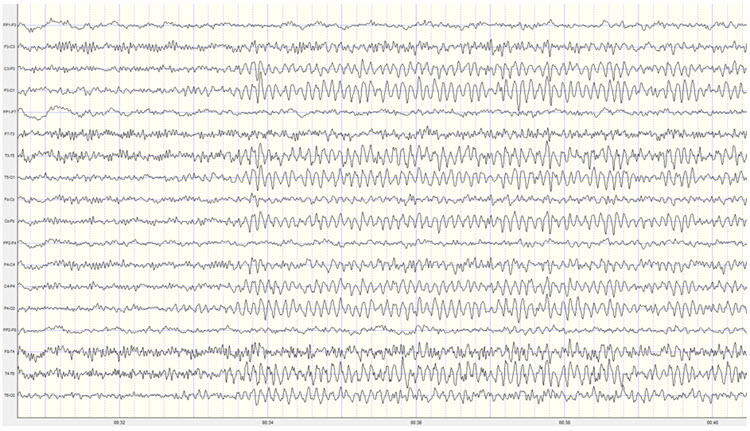
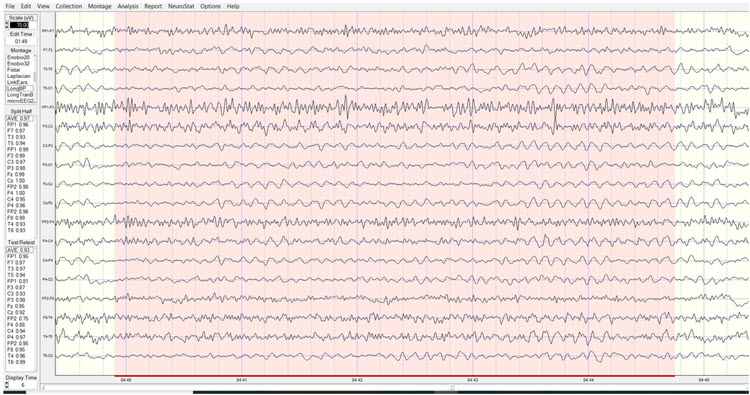
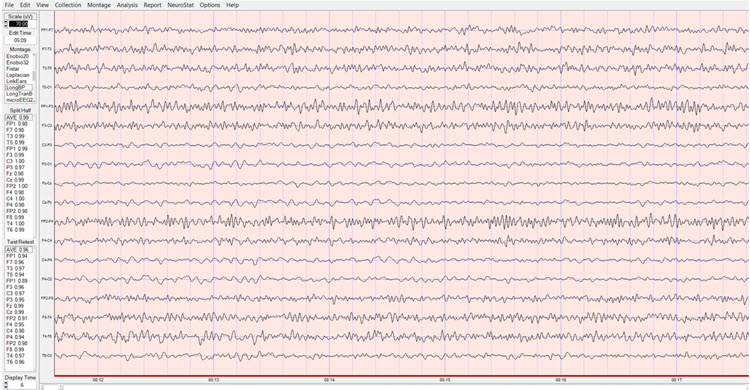
Longitudinal Bipolar Montage – this is a good quality recording with moderate eye movement artifact and only intermittent movement and EMG artifact. There are no discernable mains or equipment artifacts.
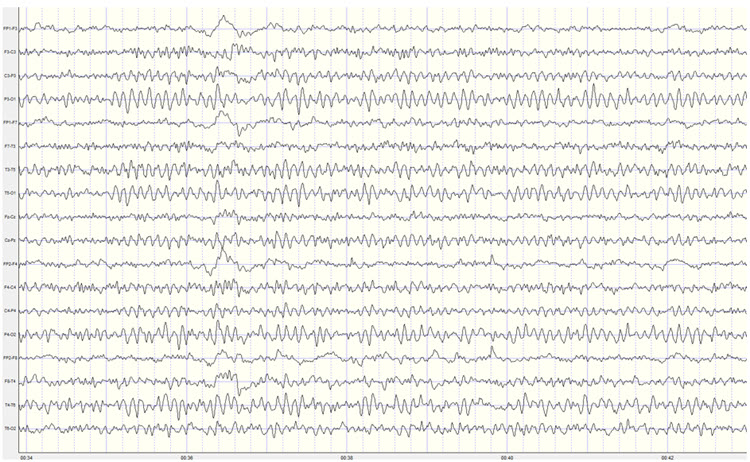
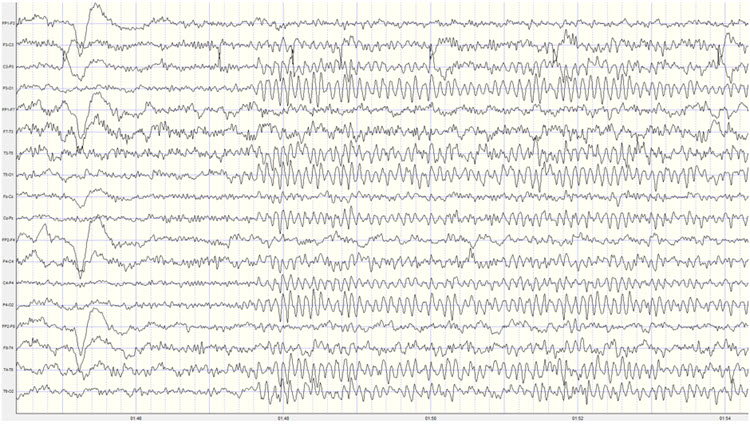
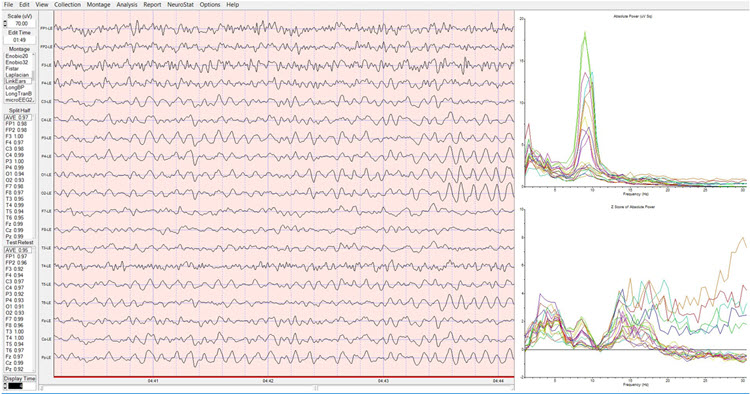
Caption: Example of Eyes-Closed EEG in Longitudinal Bipolar Montage – Scale 50 µV 1st Recording
The longitudinal bipolar montage shows a clearly defined posterior rhythm in derivations including temporal, parietal, and occipital electrodes. The frequency of the posterior rhythm appears to be somewhat inconsistent and ranges from 8-10 Hz. Amplitudes are generally in the 10-15 µV range with bursts up to 40 µV, occasionally exceeding 55 µV.
There is a clear pattern of slow activity in left lateral frontal derivations that include the Fp1-F3, Fp1-F7, F7-T3, and T3-T5 electrodes. There is also what appears to be a corresponding area of slow activity in the right temporal and temporal-parietal derivations. There is beta activity frontally in the 15-20 Hz range.
There is a period of apparent light or stage one sleep in the middle of the recording, interspersed with brief awakenings. The sleep EEG shows occasional vertex sharp waves but no other sleep characteristics. This pattern resolves, and Client B returns to an awake eyes-closed state for the rest of the recording.
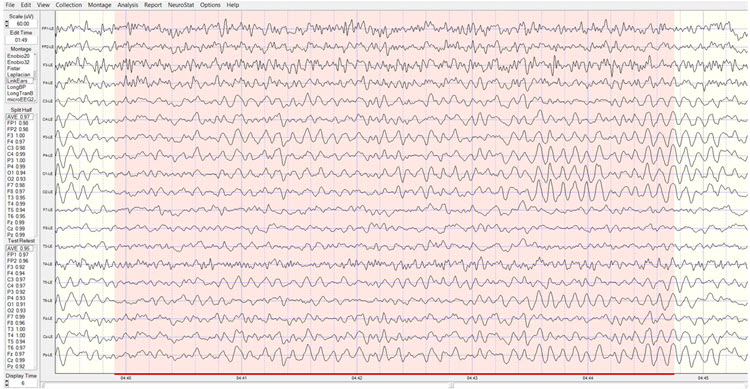
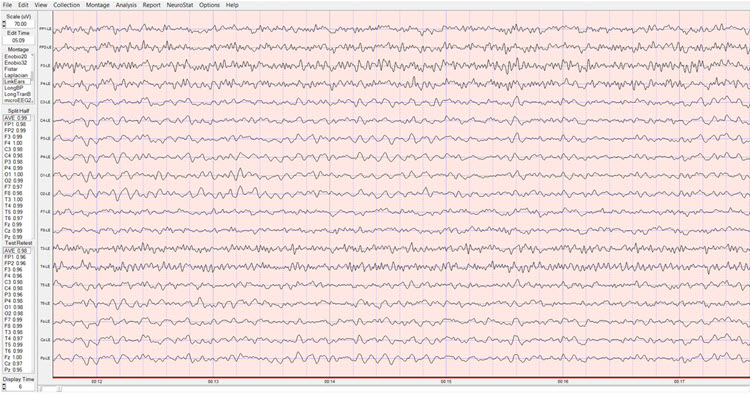
The average reference montage also shows a well-developed posterior rhythm with the maximum voltage in the O1 and O2 electrodes, with additional posterior rhythm activity at T5, T6, P3, and P4. The voltage at T6 is nearly as high as in occipital sensors. The frequency continues to fluctuate between 8-10 Hz, and voltage is in the 10-20 µV range with bursts regularly exceeding 40 µV and occasionally 50 µV.
A pattern of slow activity is seen in this montage as well, with the clearest and most consistent activity in the left and central frontal, left central, right frontal, and right parietal and occipital areas, with frequencies varying between 2 and 4 Hz. There is also some alpha activity in frontal sensors, particularly at F3 and Fz.
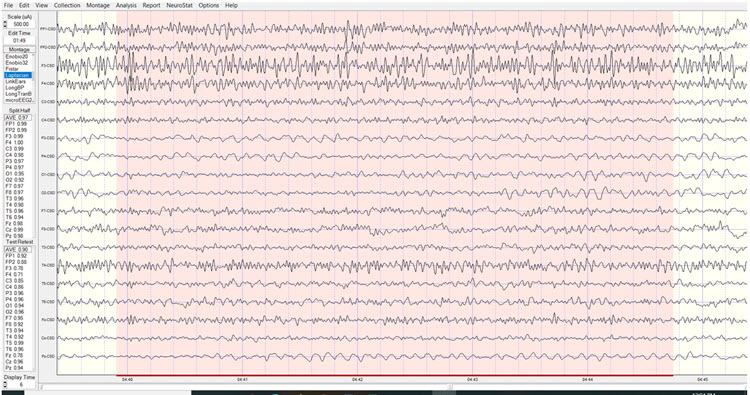
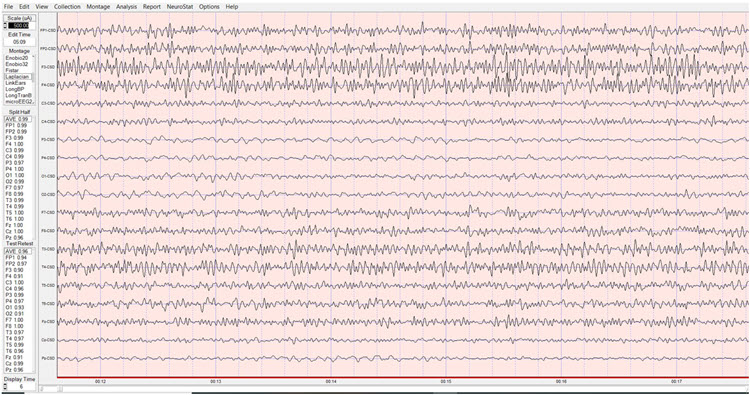
The Laplacian montage also shows the posterior rhythm in occipital and parietal areas and shows a mixed pattern of activity at the T4 and T6 electrodes, with slower activity in the delta and theta frequencies mixed with alpha and beta frequencies. Left-sided slow activity is also seen.
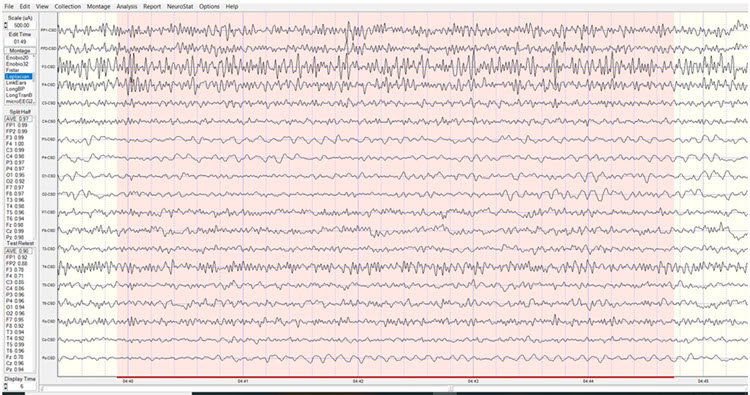
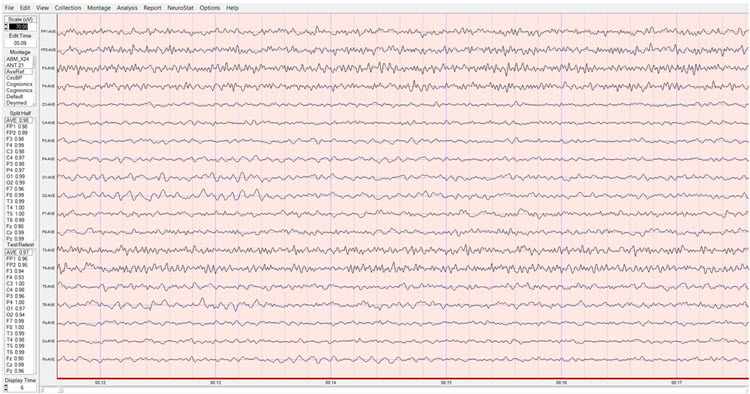
The linked ears montage shows broadly distributed alpha activity suggesting reference contamination. The highest voltage of the posterior rhythm is in the occipital electrodes. There is alpha activity in the reference electrodes and a pronounced ECG artifact that will likely produce excess 1 Hz statistical values in the z-score analysis. This should be disregarded.
The sequential eyes-open, eyes-closed recording shows a typical alpha response upon eyes closing and appropriate alpha blocking upon eyes opening in this repetitive series of 15-30 second eyes-open and eyes-closed segments (see image below).
Caption: Example of Eyes-Open to Eyes-Closed EEG in Longitudinal Bipolar Montage – Scale 50 µV 1st Recording
EYES-OPEN CONDITION
Visual inspection of the eyes-open longitudinal bipolar montage recording shows appropriate attenuation of the posterior rhythm upon eyes opening.
Background activity shows mixed frequencies, including delta, theta, and beta frequencies. Beta frequencies are in the 20-30 Hz range. Alpha intrusions are also seen quite often in central-parietal, temporal-parietal, and parietal-occipital derivations. The slow patterns noted earlier are seen in frontal-central, central-parietal, and right-sided temporal-parietal and parietal-occipital derivations.
The average reference montage shows more widely distributed alpha activity throughout the recording, possibly due to the generalizing effect of averaging all electrodes for the reference. Otherwise, the findings are consistent with the long bipolar montage.
The Laplacian montage shows the alpha activity mostly in occipital areas and the mixed slow and fast activity in the T6 electrode noted in the eyes-closed recording.
The linked ears montage shows a generalized pattern of 9-10 Hz activity mixed with beta and theta frequencies.
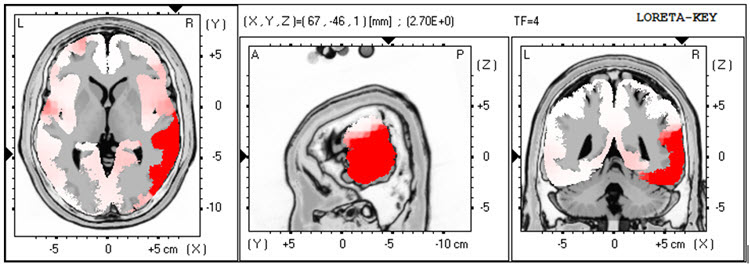
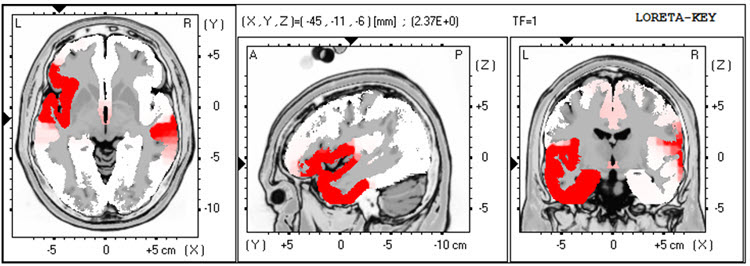
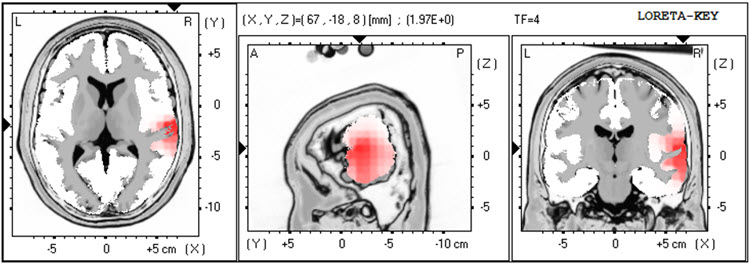
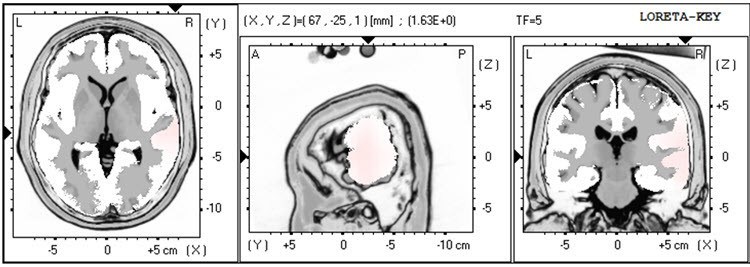
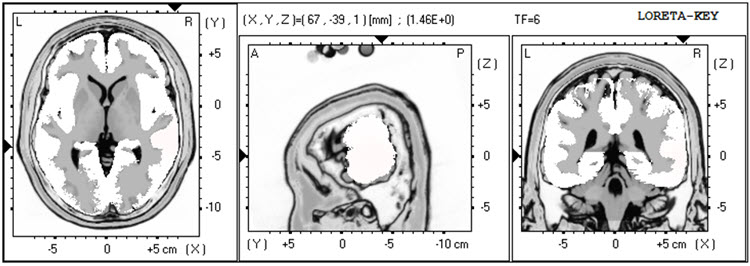
The LORETA analysis shows broadly distributed 1-Hz activity which is expected due to the ECG artifact, and also shows the lateralized left frontal and right posterior temporal/parietal areas as exceeding 2 standard deviations at 2-6 Hz, as well as right lateral frontal 9 Hz activity exceeding 2 standard deviations (see LORETA images below).
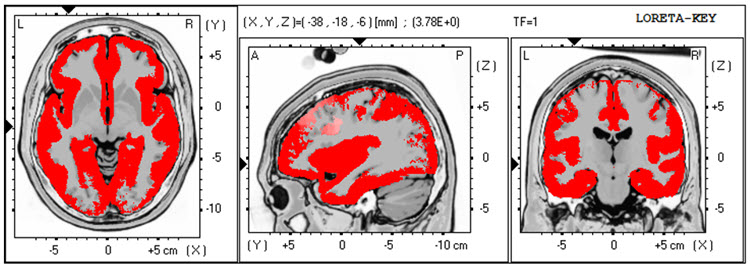
EC Recording 1 – LORETA 1 Hz – red = >2 SD
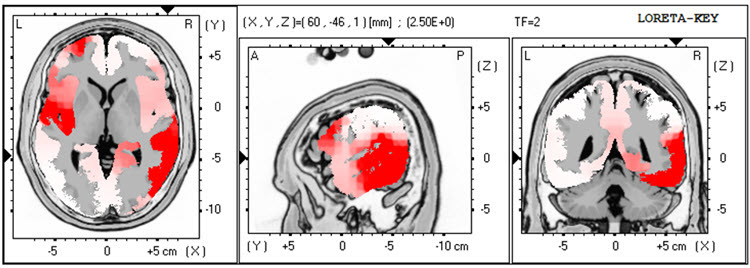
Caption: EC Recording 1 – LORETA 2 Hz – red = >2 SD
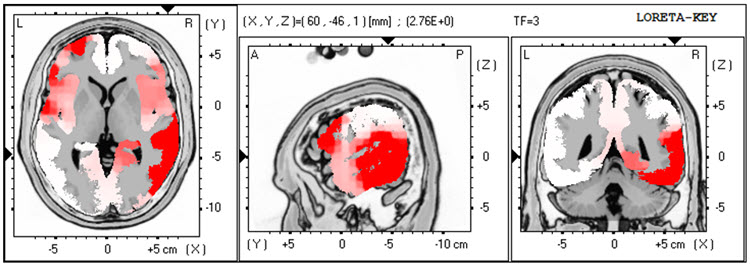
Caption: EC Recording 1 – LORETA 3 Hz – red = >2 SD
Caption: EC Recording 1 – LORETA 4 Hz – red = >2 SD
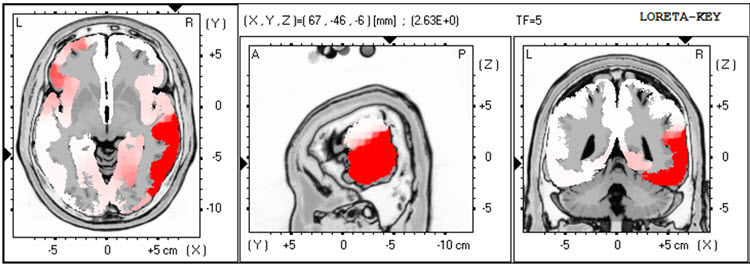
Caption: EC Recording 1 – LORETA 5 Hz – red = >2 SD
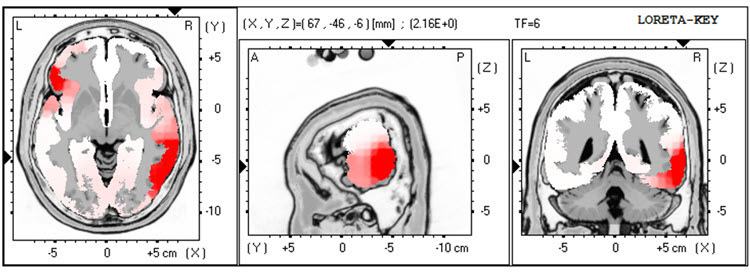
Caption: EC Recording 1 – LORETA 6 Hz – red = >2 SD
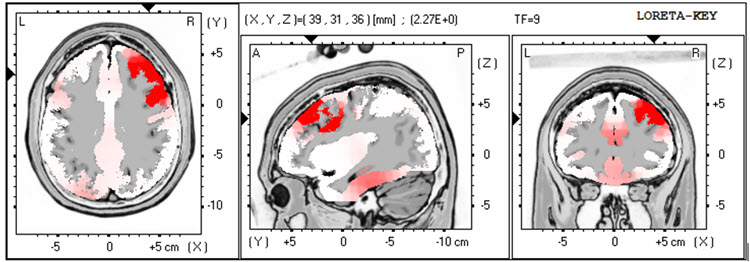
EC Recording 1 – LORETA 9 Hz – red = >2 SD
QUANTITATIVE ANALYSIS:
The analysis of the absolute power topographic maps of the average reference montage of the eyes closed recording shows the maximum voltage of the 8-12 Hz frequency band to be at 9 Hz in bilateral occipital electrodes, followed by 10 Hz at approximately half the power. There is a clear right posterior temporal/parietal activity distribution from 2-15 Hz, reflecting the visual inspection findings.
The statistical topographic maps of the eyes closed average reference montage show broad distribution of 2.5-3 SD activity at 1 Hz, associated with the ECG artifact noted earlier, and this should be disregarded. There is excess activity in Fp1, F7, C3, Fz, F4, T4, T6, Pz, O1, and O2 electrodes from 2-3 Hz, with lesser, mostly right temporal and posterior excess from 4-5 Hz. The greatest deviation is at the F4, T6, and O2 electrodes exceeding 2.5-3 SD.
There is also excess bilateral frontal and left frontal/central and right parietal/occipital 9 Hz activity with the greatest deviation between F3, Fz, C3, and Cz. There are moderate excess occipital and right parietal 12-14 Hz activity and some 19-22 Hz excesses.
The peak alpha frequency is slightly slow but does not exceed -1 SD at any location.
The Laplacian montage shows the 1 Hz activity related to the ECG artifact. This montage shows the maximum deviation from 2-5 Hz at T6 with lesser deviations in the left lateral frontal, frontal, central, parietal and occipital areas. The excess 9 Hz is seen here, with some minimal 13-14 Hz activity in the right occipital and parietal areas.
The linked ears montage shows more distribution and greater deviation in most frequencies noted previously. Interestingly, the excess slow activity shows a much more lateralized presentation than was seen in the other montages. This may be due to reference contamination, and it could be coming from the area of the T4 and T6 electrodes, which are near the right-sided reference.
Coherence abnormalities are pronounced, but this is likely not reliable due to reference contamination in the linked ears montage.
Due to the reports of multiple impact injuries to the head, the Traumatic Brain Injury Discriminant Analysis was performed. It yielded a TBI discriminant score of -0.43, a TBI probability index of 80.0%, and a TBI severity index of 5.44, which is in the moderate range on a 0-10 scale, where z0 represents mild severity and 10 is severe.
CONCLUSIONS:
This client presents with multiple issues that may be related to the findings observed in this EEG recording. This may be particularly true of the slow activity seen in the left frontal areas and the presence of both slow activity in the right posterior temporal/parietal areas and higher than the typical amplitude of alpha activity in the same area. Also, the slowing of the peak alpha frequency, even though it is not statistically significant, suggests that working to normalize this frequency may improve his cognitive function.
RECOMMENDATIONS:
A course of neurofeedback training is recommended, and initial training will begin with 4 channel z-score training, rotating between a variety of electrode combinations, beginning with Fz, Pz, T3, and T4; followed by F3, F4 T5, and T6; followed by C3, C4, P3, and P4. Other protocols may be explored as training progresses.
SUMMARY OF CLIENT RESPONSES TO TRAINING:
Client B progressed through 25 sessions of neurofeedback training over the course of 15 months, generally averaging one session per week, with a decrease in frequency in the last half a year. He also utilized a home training device for heart rate variability training and an AVE device. Session training locations included 6 sessions of Fz, Pz, T3, and T4; 2 sessions of Fz, Pz, P3, and P4; 11 sessions of T5, T6, O1, and O2; 1 session of F3, F4, P3, and P4 – all 4 channel z-score training. He also received 2 sessions of 4 channel slow cortical gradient training and 3 sessions of C3 and C4 2 channel difference and sum training with variable reward frequency. Alpha-theta training was attempted on a few occasions, but he did not like it, so training was changed within the session to one of the protocols noted above.
He reports feeling significant improvement in his ability to focus and in his mood regulation. He is in a new relationship and states that his temper is much more manageable and that he has learned improved communication skills through couples counseling with his current significant other. He notes that he has more energy, his sleep has improved, and his cognitive function is also better. He occasionally has headaches though the intensity and duration have decreased markedly. He feels he has resolved his presenting concerns and wishes to have a follow-up EEG recording to see if the assessment will show the changes that he is experiencing.
SECOND RECORDING
| Analysis Length: 01:32 | Ave. LE Split-Half Reliability: 0.97 |
| Ave. LE Test-Retest Reliability: 0.94 | Eyes: Closed |
VISUAL INSPECTION OF FOLLOW-UP 19-CHANNEL EEG:
EYES-CLOSED CONDITION:
Visual inspection of the 19-channel EEG in the eyes closed condition using the longitudinal bipolar montage shows a good quality recording with typical eye movement artifact and some brief episodes of what appears to be drowsy or light sleep activity. There is no evidence of EMG artifact, mains, or other exogenous artifacts in this recording. This recording appears to be significantly lower in amplitude than the previous recording.

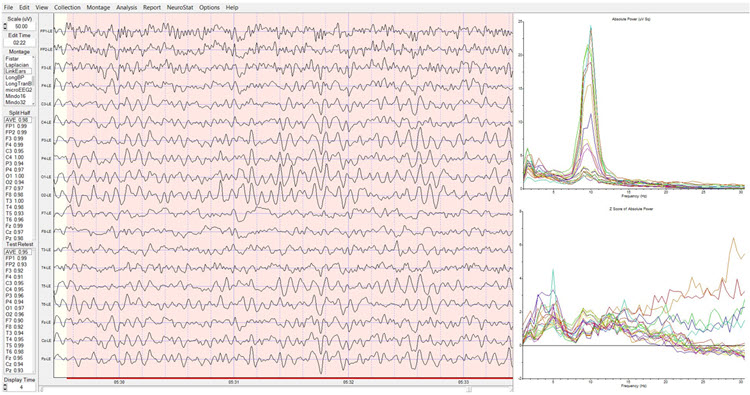
Caption: Example of Eyes-Closed EEG in Longitudinal Bipolar Montage – Scale 50 µV 2nd Recording
A well-developed posterior rhythm is seen primarily in parietal and occipital derivations with some temporal-parietal and central-parietal derivations. There is some spindling beta activity seen with the frequency of 20-25 Hz. This occasionally occurs in frontal-central derivations. There is some slow activity in the left lateral frontal areas and the right posterior temporal/parietal areas. The posterior rhythm shows a consistent frequency of 9 Hz with a well-developed sinusoidal rhythm and amplitudes generally in the 20-30 µV range, with occasional bursts exceeding 30 µV. The posterior rhythm appears quite symmetrical between left and right locations, with the maximum voltage in parietal-occipital derivations.
The average reference montage shows more generalized alpha activity, possibly suggesting some distribution associated with the averaging method of the montage. The posterior rhythm is seen with the highest voltage at O2 and O2, closely followed by T6. The frequency remains at 9 Hz and is quite consistent, with amplitudes in the 20-30 µV range occasionally exceeding 30 µV. Again, the periods of possible drowsiness or light sleep are seen that occur quite infrequently and do not persist for any length of time.
The Laplacian montage also shows the posterior rhythm and occipital sensors and right parietal T6 and lateral parietal P3 and P4 locations. There is beta activity in the 15-25 Hz range in frontal and central sensors, and there is some slow activity in left-sided frontal and right-sided parietal areas.
The linked ears montage shows widespread alpha activity in all sensors, including the bilateral reference channels, and therefore reference contamination is present.
When viewed in the longitudinal bipolar montage, the repetitive eyes-open and eyes-closed segments show a clear alpha response upon eyes closing and immediate alpha blocking upon eyes opening (see example below).
Caption: Example of Eyes-Open to Eyes-Closed EEG in Longitudinal Bipolar Montage – Scale 50 µV 2nd Recording
EYES-OPEN CONDITION:
Visual inspection of the eyes-open longitudinal bipolar montage recording shows appropriate attenuation of the posterior rhythm with typical eyeblink and eye movement artifact. There is beta activity in the 15-25 Hz range in all electrode derivations. There are occasional alpha intrusions into the eyes-open recording, although these are infrequent and do not persist.
The average reference montage shows essentially the same findings though there is some persistent mixed frequency activity in the T4 and T6 electrodes, with alpha and beta frequencies occurring simultaneously.
The Laplacian montage shows higher amplitude mixed frequency activity at the F7 electrode and T4 and T6 electrodes. This activity includes a pattern of activity at approximately 8-9 Hz, 13 Hz, and also at 23 Hz.
The linked ears montage again shows broadly distributed activity that is quite synchronous and likely represents reference contamination.
LORETA analysis of the follow-up 19-channel EEG recording shows the same lateralization exceeding 2 standard deviations seen in the previous recording, but in this case, only seen at 1 Hz in the left lateral frontal and right temporal areas. This activity is not seen at 2-3 Hz, and there is an area of excess activity in the right temporal area at 4 Hz, again exceeding 2 standard deviations. There is minimal excess activity at 9 Hz in the bilateral inferior temporal, fusiform, and parahippocampal gyri. (See LORETA images below).
Caption: EC Recording 2 – LORETA 1 Hz – red = >2 SD
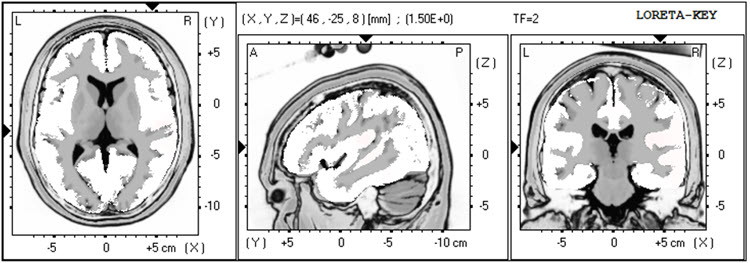
Caption: EC Recording 2 – LORETA 2 Hz – red = >2 SD
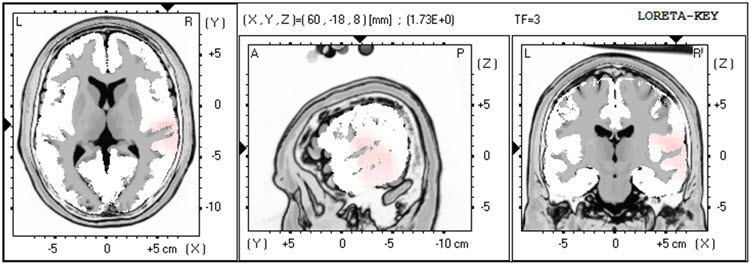
Caption: EC Recording 2 – LORETA 3 Hz – red = >2 SD
Caption: EC Recording 2 – LORETA 4 Hz – red = >2 SD
Caption: EC Recording 2 – LORETA 5 Hz – red = >2 SD
Caption: EC Recording 2 – LORETA 6 Hz – red = >2 SD
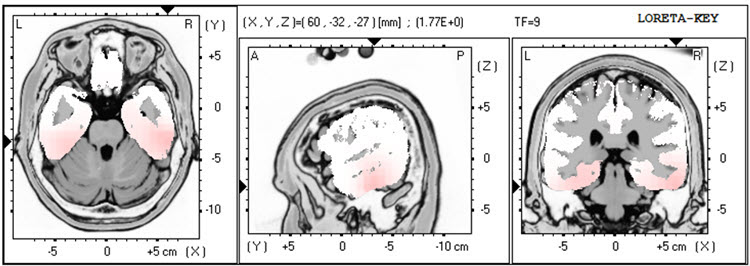
Caption: EC Recording 2 – LORETA 9 Hz – red = >2 SD
Analysis of the eyes-closed average reference montage absolute power topographic maps from the 2nd recording shows the maximum voltage in the 8-12 Hz frequency band at 9 Hz, with a power value of approximately two-thirds seen in the previous recording.
The statistical analysis of the absolute power topographic maps in the average reference montage of the eyes-closed recording shows excess activity exceeding 2 standard deviations at F7 and T4, with lower levels of deviation at Fp1, F8, Cz, C4, and T6. Additional activity areas exceed 2 standard deviations at 2 and 3 Hz at T4 and T6. There is excess activity in the 1-1.5 standard deviation range in the left frontal and central areas and the bilateral posterior, including T6, and finally, a small area of excess activity at 13 Hz at T6 and O2. These findings are significantly diminished from the previous recording and likely reflect behavioral experience changes. Some areas of excess activity from 21-23 Hz appear associated with the Fz electrode, which will be evaluated further in other montages.
The peak alpha frequency remains within the normal range in all locations and only exceeds a -1 standard deviation at the T4 electrode location.
The Laplacian montage essentially shows the same findings except for the right temporal/parietal area activity extending up to 5 Hz and the excess 9 Hz activity in more circumscribed locations. Also, the excess 21-23 Hz activity is associated with the Cz electrode, and therefore that seen in the average reference more broadly distributed is almost certainly due to reference contamination from the averaging mechanism in that montage.
As expected, the linked ears montage shows a broadly distributed excess activity pattern from 6-15 Hz across frontal areas reflecting the reference contamination noted earlier.Otherwise, it also shows the same lateralized activity seen in the previous recording, extending from the left lateral frontal to the right temporal regions, possibly related to reference contamination.
The comparison to the previous traumatic brain injury discriminant analysis shows very similar findings, with the TBI discriminant score at -0.03, the TBI probability index at 90%, and the TBI severity index at 5.42, which is similar to that seen previously.
CONCLUSIONS:
It appears that the results are substantially improved and support his self-report of improvement in multiple areas of functioning. Client B was encouraged to return for further sessions if he noticed an increase in problematic symptoms. He was also encouraged to continue heart rate variability training at home and continue using the audiovisual entrainment device (AVE) at home.
PATIENT EXAMPLE B
HISTORY
TR is a 41-year-old man injured in a car collision two years earlier. At the time, he sustained a mild concussion and soft tissue injuries associated with the inability to perform his work as an independent construction contractor. He gradually returned to part-time work.
He was referred because of anger and aggressive behavior problems that were directed primarily to his insurance provider. TR considered that his insurer had not provided sufficient benefits immediately after his injury and that the insurer continued to withhold the benefits he deserved. In addition to ruminating about conflict with the insurer, TR was much more likely to feel and express anger to day-to-day conflicts (e.g., traffic). TR described his experience of anger as his “brain being on fire.”
In addition to feelings of anger and aggressive behavior, TR also reported that his head felt “heavy and full” most of the time, and he had difficulty falling asleep. He denied any thinking deficits, however. These emotional, behavioral, and somatic symptoms developed slowly following the traffic collision but appeared to worsen his pre-injury condition concerning anger and aggression. TR reluctantly admitted that his anger, though justified regarding his insurer, was interfering with his ability to work with his construction teammates.
TR’s only medication was low-dose amitriptyline for sleep. He did not drink alcohol. Previous medical history was significant only for a construction-related dislocated shoulder. TR had no history of treatment for psychiatric, alcohol, or drug problems. He had graduated from high school before working full-time in home and agricultural construction. TR had no history of legal difficulties. A paralegal assisted with the traffic collision insurance claim. However, he did have a significant history of conflict with his father, from whom he was estranged. TR visited his mother regularly. TR and his wife had no children.
TR is the younger of two siblings, having an older sister who lives some distance from TR. His family health history included his father’s alcoholism and his mother’s congestive heart failure. His father had not completed high school and worked as a builder of barns and other types of agricultural buildings.
ASSESSMENT
The information above was gathered during an interview with TR and his wife, who corroborated TR’s history. TR’s wife was very concerned that his anger was a problem and had facilitated his attempt to get counseling. TR’s behavior was notable for his loud and rapid speech, intimidating posture, and tense facial expression during the assessment.
A review of health records was consistent with the history above and showed no cerebral injury in a head CT done on the day of the collision two years previous. A neuropsychological screening assessment performed six months post-injury showed most cognitive domains to be within expectation, except for attention and speed of processing which were mildly deficient. The psychological assessment showed elevated symptoms of anxiety and anger/aggression. Still, it did not reveal symptoms that met all criteria for PTSD (e.g., TR did not believe he would die at the time of the collision and did not have re-experiencing symptoms).
Limits of confidentiality were reviewed with TR, and he agreed to a qEEG assessment, the results of which follow below.
Pre-Neurofeedback qEEG Assessment
19-channel EEG recordings were collected in both eyes-open and eyes-closed conditions, artifacted, and analyzed with NeuroGuide’s software and normative database after examining EEG traces in several montages (i.e., longitudinal bipolar, linked ears, Laplacian, average reference). All artifacted data were sufficiently reliable for analysis. The range of significance in color for topographic maps extends from + 1.5 standard deviations to + 4.5 standard deviations to show the greatest area of localization for extremely high values of beta activity. All LORETA analyses set their significance level at 3 standard deviations.Baseline Eyes-Closed EEG Traces
EEG traces showed good production of symmetric alpha activity, although with a peak only at 9 Hz. There appeared to be excess beta activity, most prominently at F3 and Fp1, Fp2, F4, and T4. The four montages shown below appeared consistent, with the excess high beta wave morphology consistent with EEG rather than EMG activity.
Longitudinal Bipolar Montage – Eyes-Closed Pre-training Baseline
Linked Ears Montage – Eyes-Closed Pre-training Baseline
Laplacian Montage – Eyes-Closed Pre-training Baseline
Average Reference Montage – Eyes-Closed Pre-training Baseline
Baseline Eyes-Closed qEEG Findings
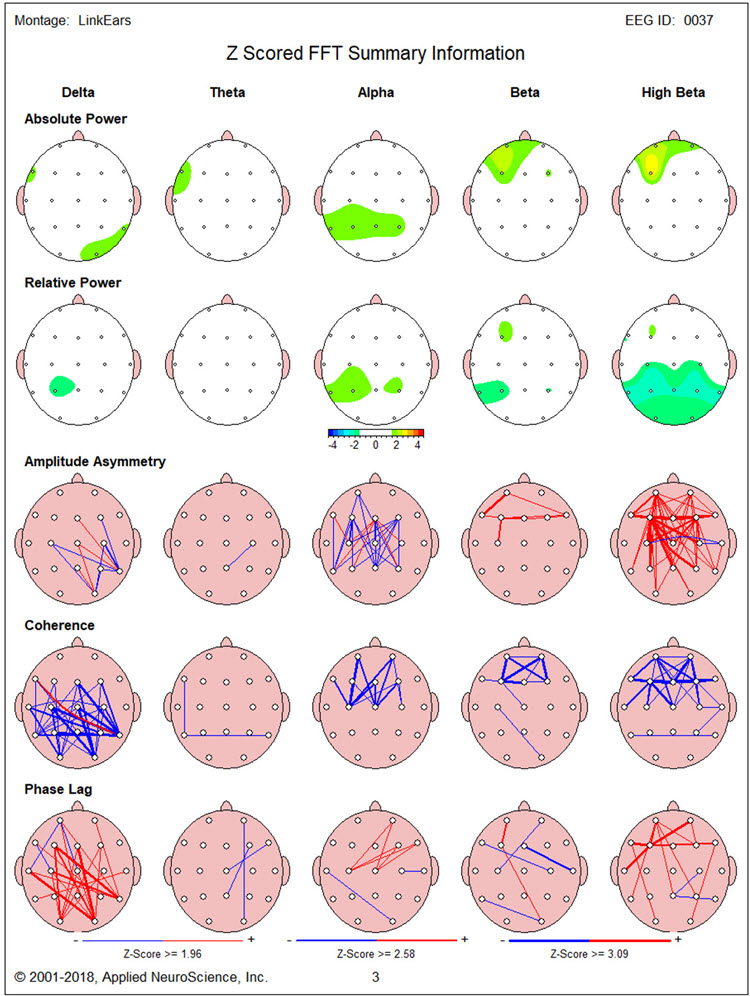
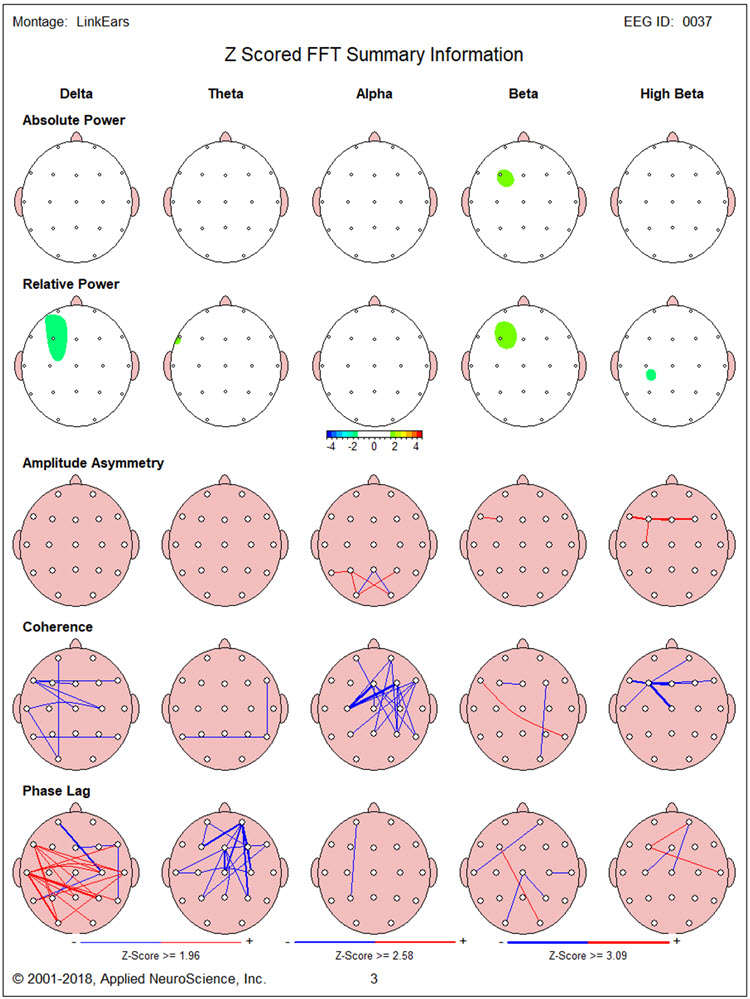
Figure 1 shows the NeuroGuide topographic map summary page for the z score FFT analysis. qEEG findings showed significantly elevated high beta, localized primarily between Fp1 and F3. Posterior hypocoherence and excessive phase lag were seen in the delta range, with significant anterior hypocoherence seen in the high-beta range.
Figure 1 – Baseline Eyes-Closed NeuroGuide Z-Score FFT Summary Report
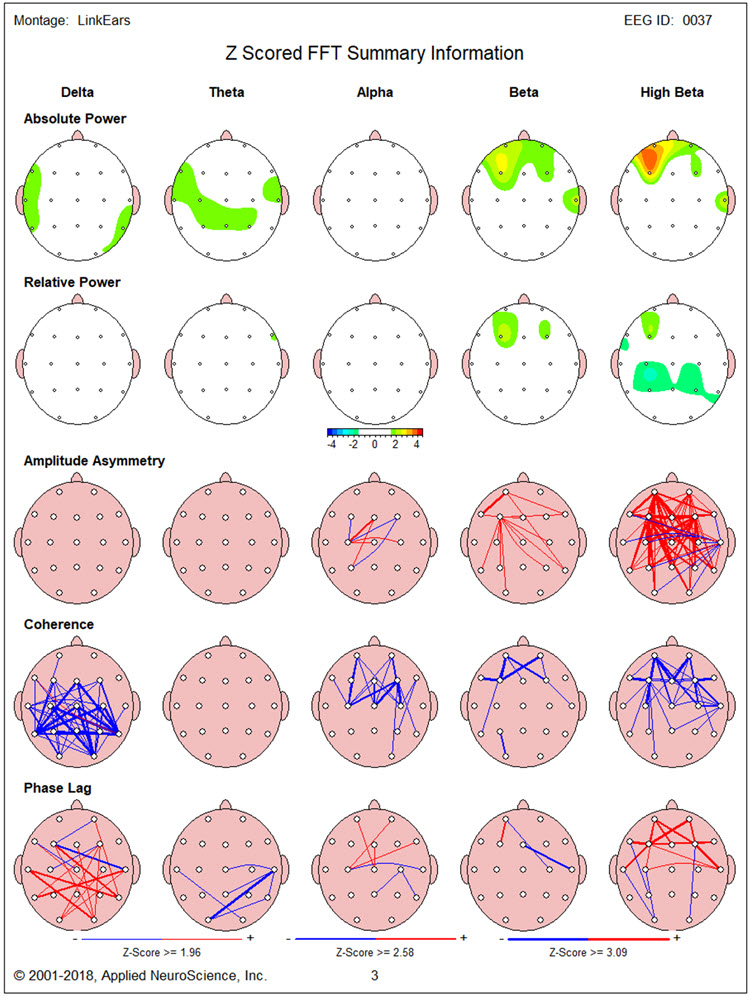
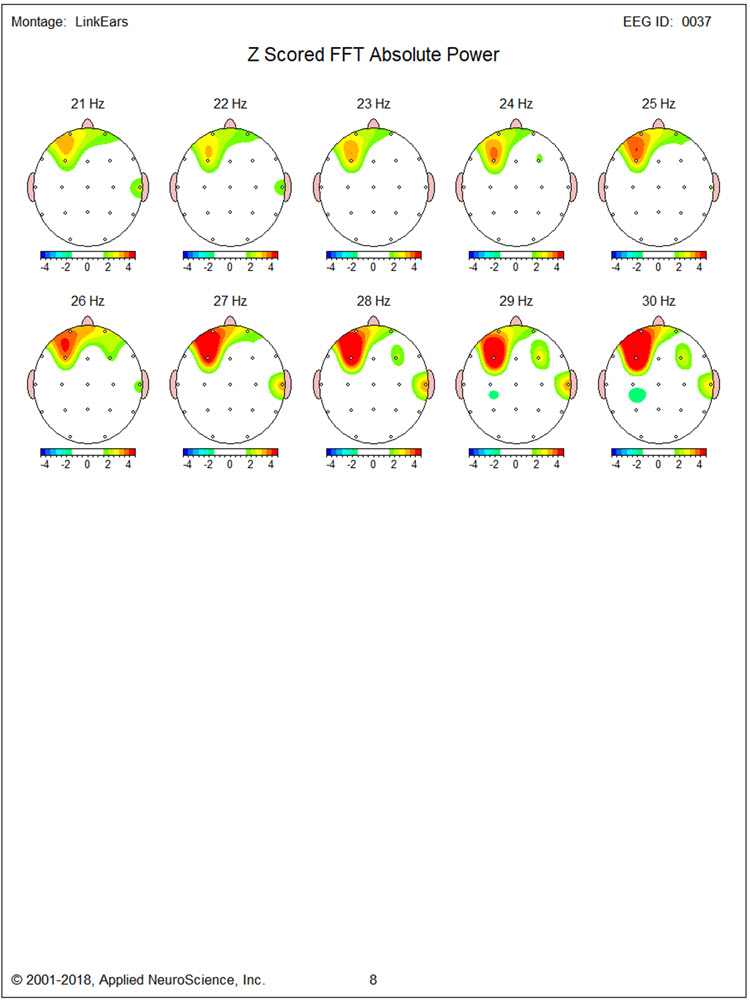
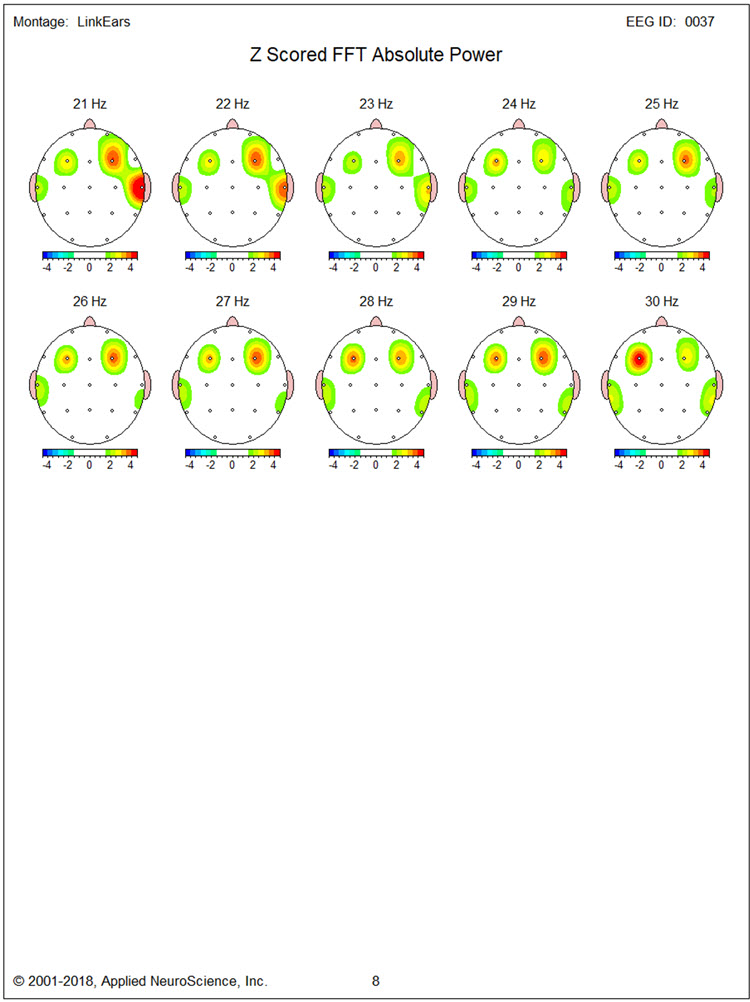
Figures 2 and 3 show single-Hz bins for the z-score FFT analysis to define the exact elevated beta activity range. This appeared to be mainly between 14 and 19 Hz and above 25 Hz. In addition, excess beta, mainly between 15 and 20 Hz, was seen at T4. Excess delta and theta between 3 and 4 Hz were also found in the region of F7.
Figure 2 – Baseline Eyes-Closed Z-Score FFT Absolute Power Single-Hz Bins (1-20 Hz)
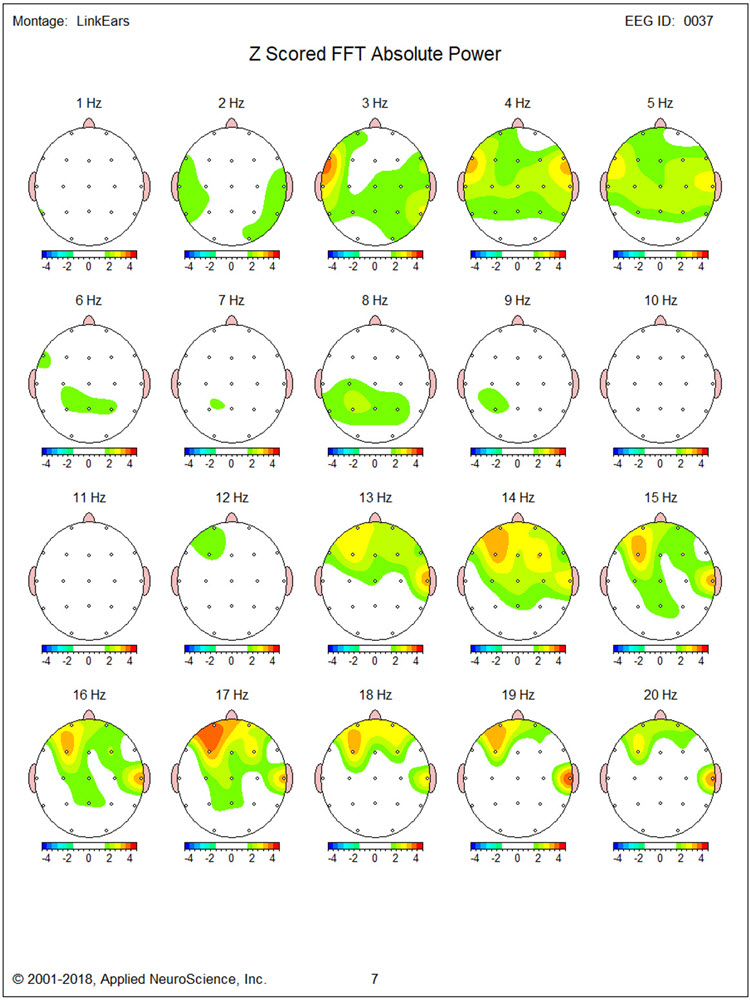
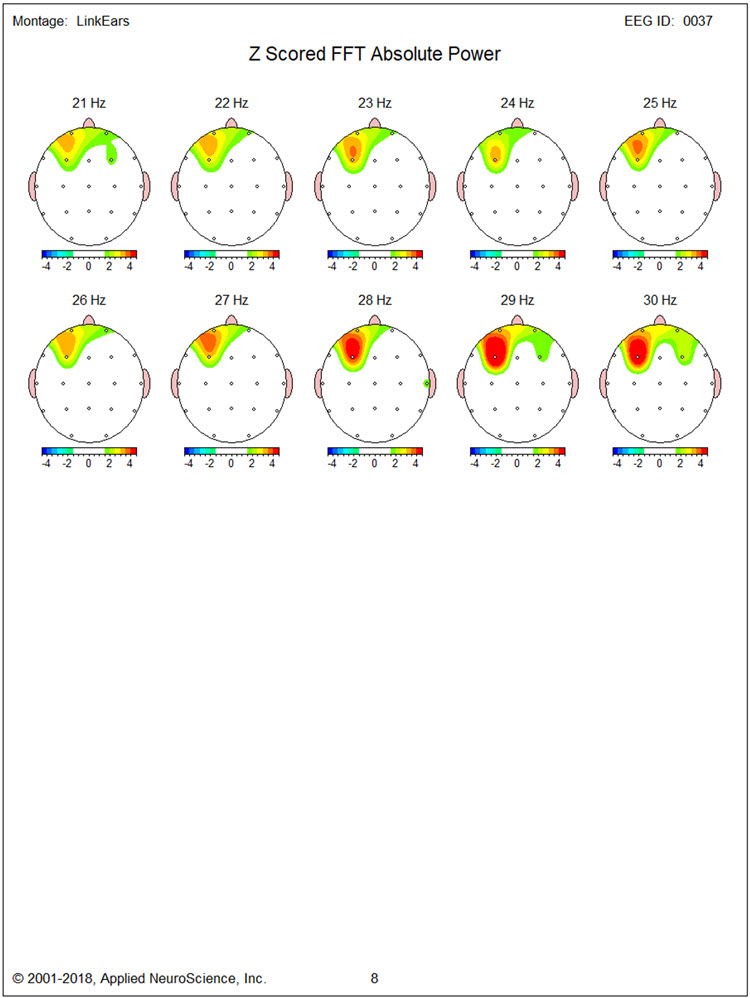
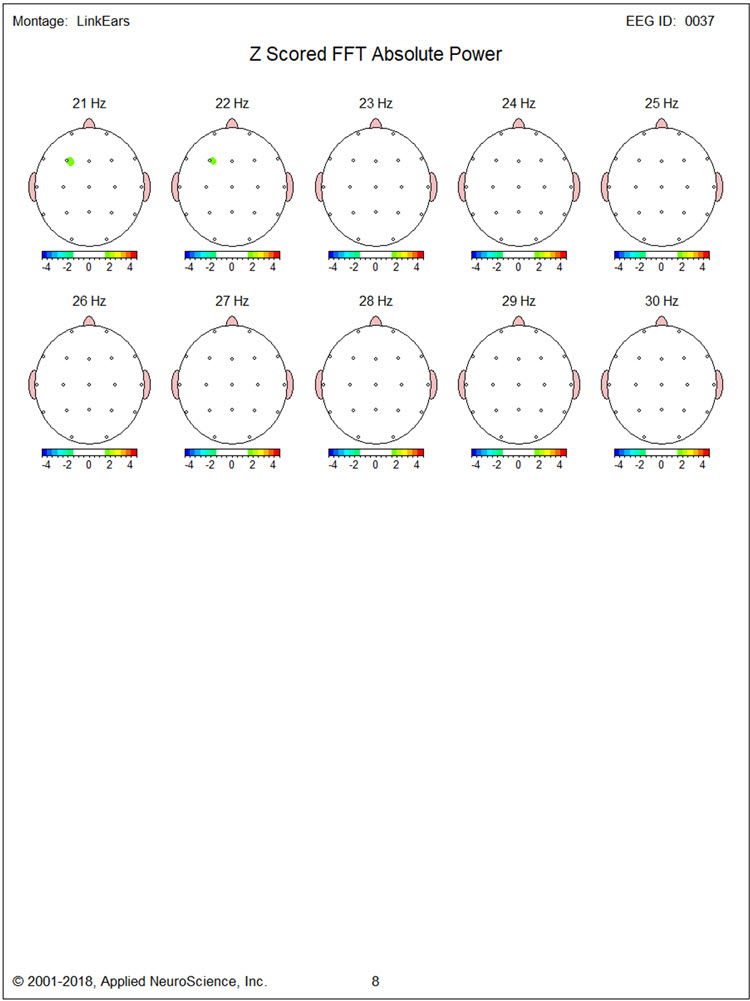
Figure 3 – Baseline Eyes-Closed Z-Score FFT Absolute Power Single-Hz Bins (21-30 Hz)
Figures 4 through 8 show LORETA analyses using the NeuroGuide normative database for 3 Hz, 17 Hz, 19 Hz, 27 Hz, and 30 Hz, respectively. Figure 4 for 3 Hz does not show regions of elevated activity to correspond with the single-Hz topographic map.
Figure 4 – Baseline Eyes-Closed Z-Score LORETA Analysis for 3 Hz
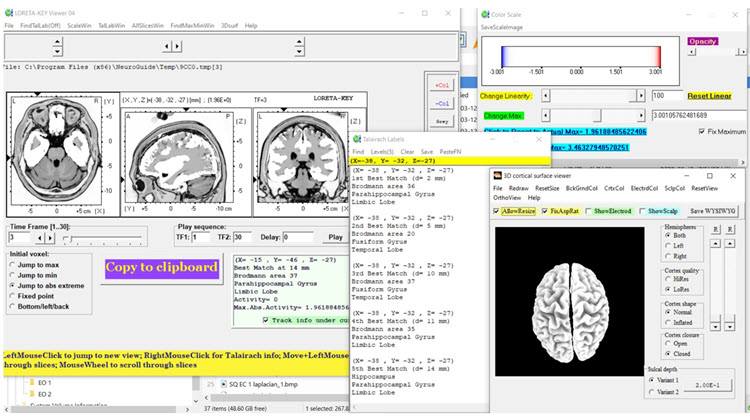
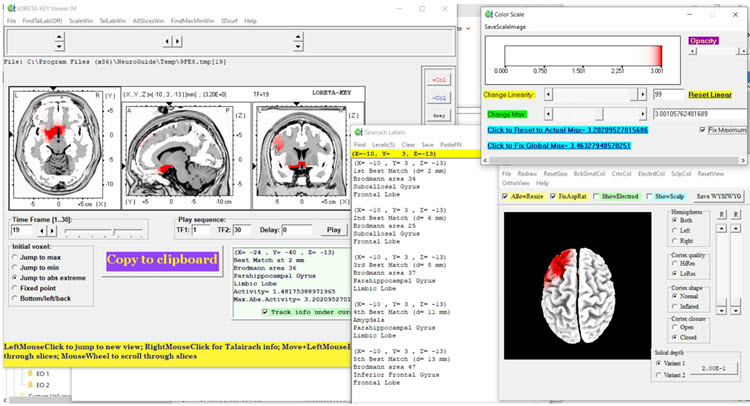
Figures 5 and 6 for 17 Hz and 19 Hz show maximal localization of the source of excess beta in that range to medial frontotemporal structures (i.e., subcollosal gyrus parahippocampal gyrus, inferior frontal gyrus).
Figure 5 – Baseline Eyes-Closed Z-Score LORETA Analysis for 17 Hz
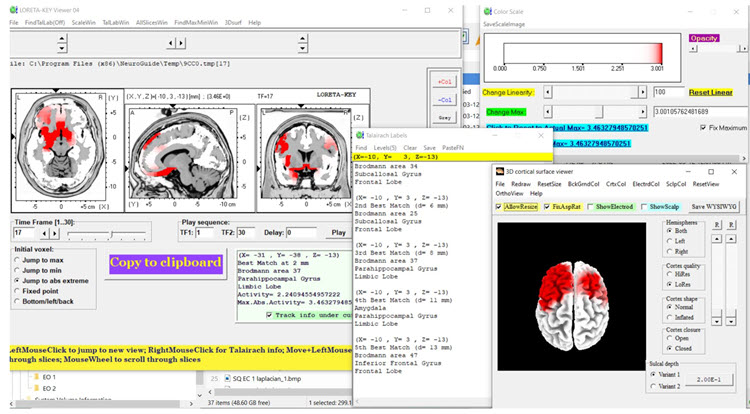
Figure 6 – Baseline Eyes-Closed Z-Score LORETA Analysis for 19 Hz
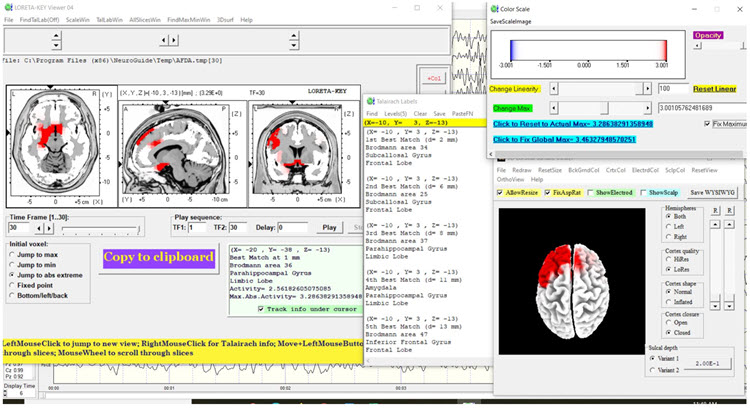
Figures 7 and 8 show maximal localization of 27 and 30 Hz excess beta to the same structures with excess beta at 17 Hz and 19Hz.
Figure 7 – Baseline Eyes-Closed Z-Score LORETA Analysis for 27 Hz
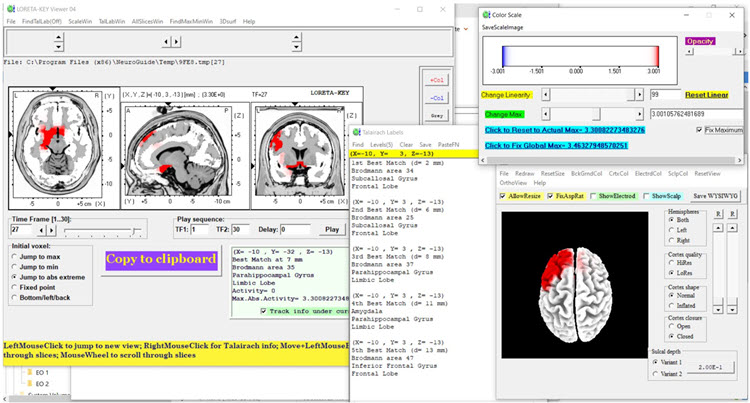
Figure 8 – Baseline Eyes-Closed Z-Score LORETA Analysis for 30 Hz
Baseline Eyes-Open EEG Traces
Findings were similar to those for the eyes-closed condition with good blocking of alpha activity. Segments of traces from each of the four montages are shown below.
Longitudinal Bipolar Montage – Eyes-Open Pre-training Baseline
Linked Ears Montage – Eyes-Open Pre-training Baseline
Laplacian Montage – Eyes-Open Pre-training Baseline
Average Reference Montage – Eyes-Open Pre-training Baseline
Baseline Eyes-Open qEEG Findings
Figure 9 shows the NeuroGuide summary page with similar findings to that seen in the eyes-closed condition. However, the excess beta activity appears lateralized more to the right hemisphere.
Figure 9 – Baseline Eyes-Open NeuroGuide Z-Score FFT Summary Report
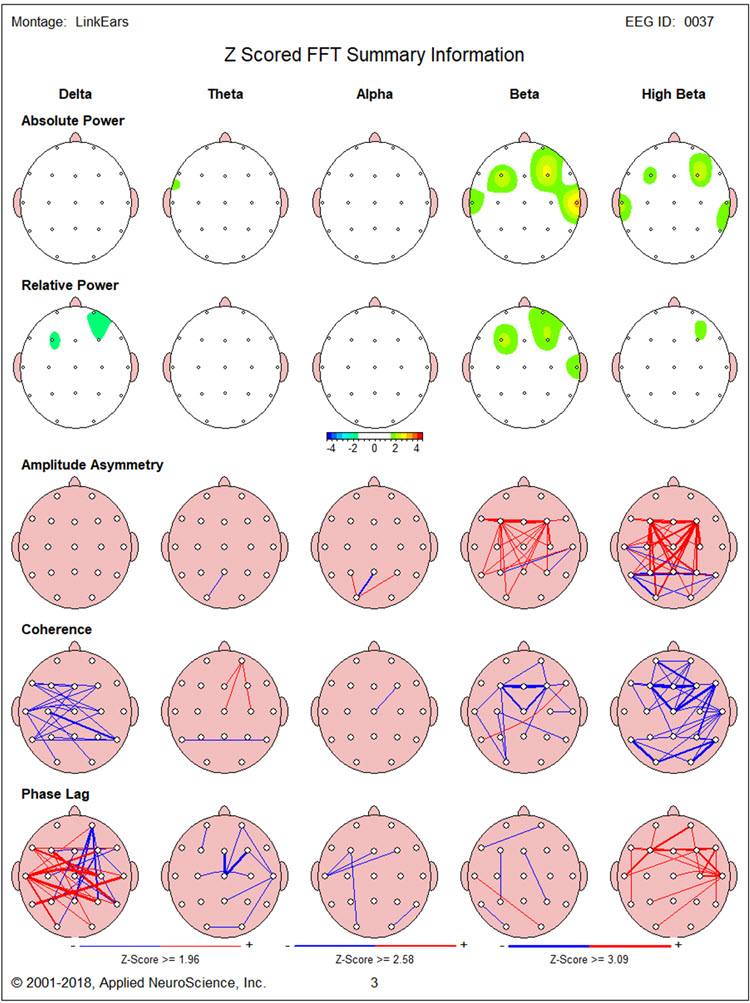
Figure 10, again, shows elevated 3 Hz activity in the region of F7. Figures 10 and 11 show prominent excess 14 Hz activity at F3, with excess 16-22 Hz activity at T4. In addition, particularly high elevations are seen of 24-30 Hz at F3 and 19-29 Hz at F4.
Figure 10 – Baseline Eyes-Open Z-Score FFT Absolute Power Single-Hz Bins (1-20 Hz)
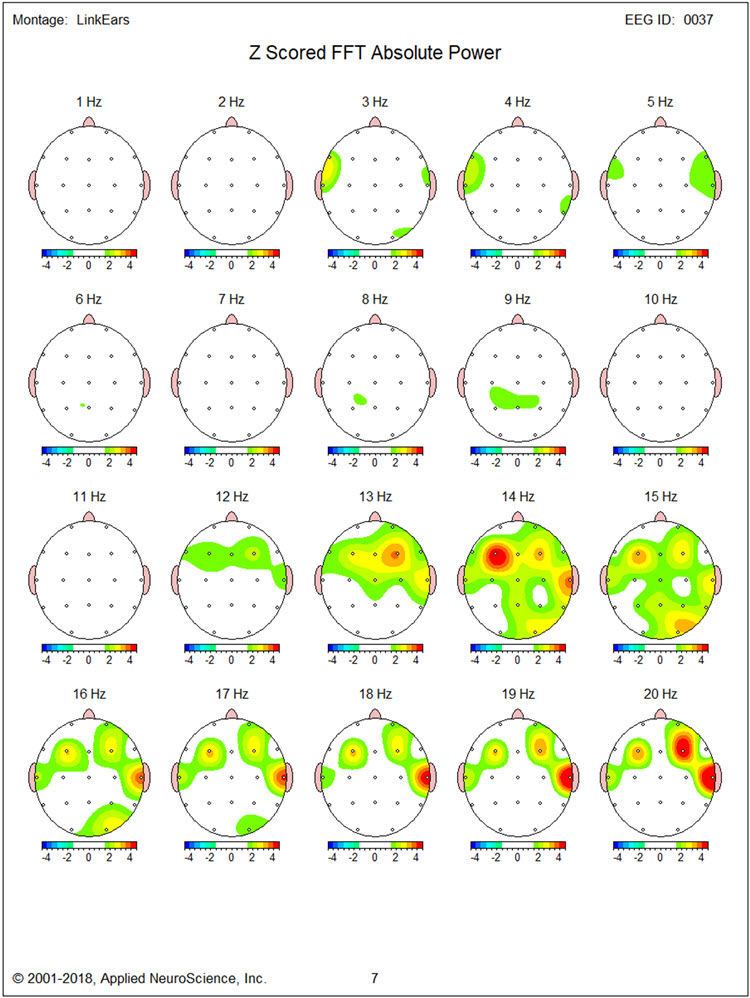
Figure 11 – Baseline Eyes-Open Z-Score FFT Absolute Power Single-Hz Bins (21-30 Hz)
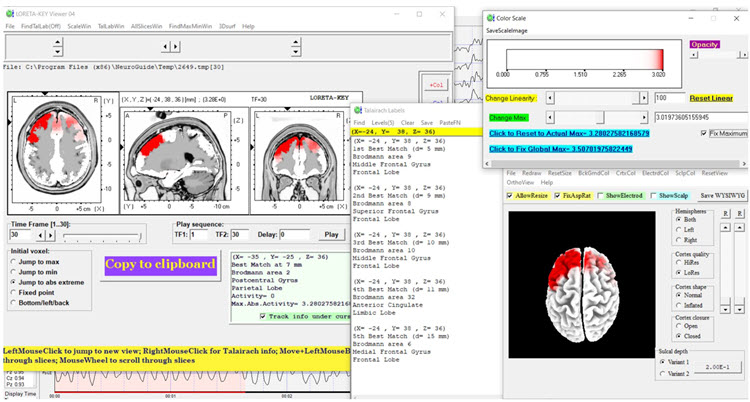
Figures 12, 13, and 14 show LORETA analyses using the NeuroGuide normative database for 14 Hz, 20 Hz, and 30 Hz, respectively. Inferiorly located structures are less involved than in the eyes-closed condition. Medial and superior frontal regions bilaterally show significantly elevated beta activity at 14 Hz and 20 Hz, though much less so at 30 Hz.
Figure 12 – Baseline Eyes-Open Z-Score LORETA Analysis for 14 Hz
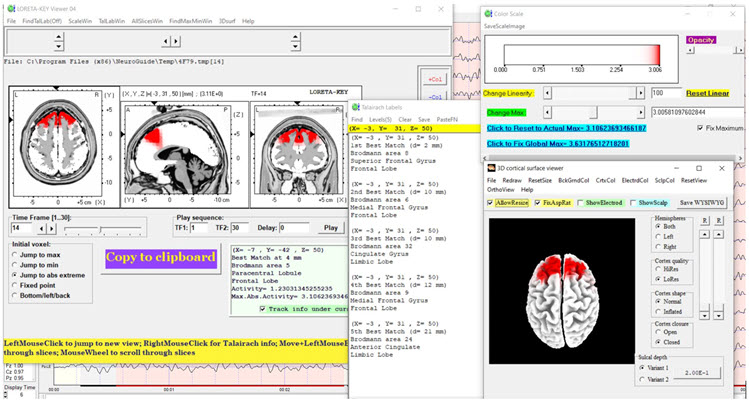
Figure 13 – Baseline Eyes-Open Z-Score LORETA Analysis for 20 Hz
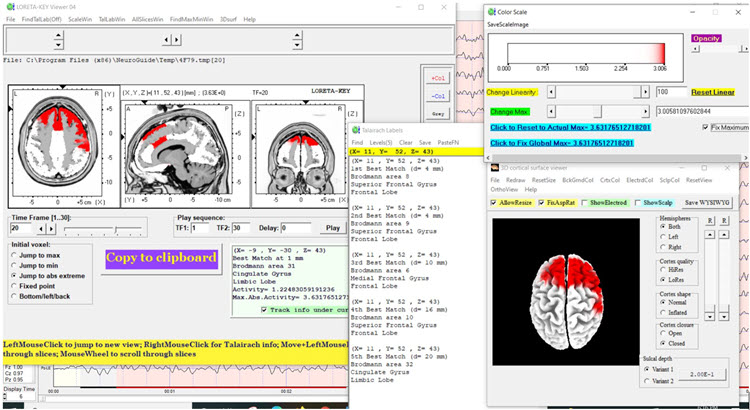
Figure 14 – Baseline Eyes-Open Z-Score LORETA Analysis for 30 Hz
NEUROFEEDBACK TRAINING
Neurofeedback training was conducted in two stages. First, 13 sessions of 2-channel beta (20-38 Hz) downtraining at F3 and F4 was carried out with eyes open. Second, 6 sessions of alpha-theta training were provided. This was done with concurrent psychotherapy based on cognitive-behavioral and Acceptance and Commitment Therapy (ACT) methods. These included education components about anger and aggression, acquisition and rehearsal of cognitive and behavioral skills during sessions, and application of skills between sessions. Although no peripheral biofeedback was provided, TR was taught progressive muscle relaxation and slow diaphragmatic breathing skills.
ANECDOTAL OUTCOME
TR and his wife reported significantly reduced expression of anger by TR both at home and around the community. TR reported that he experienced less intense and lengthy anger and expressed aggressive behavior less frequently when working at construction sites. During sessions, TR appeared significantly less tense and verbalized few angry complaints. Although TR remained angry at his insurer, the degree to which he experienced this was reduced, and he appeared more willing to allow his paralegal representative to take helpful actions.
POST-NEUROFEEDBACK qEEG ASSESSMENT
Post-Training Eyes-Closed qEEG Findings
Figure 15 shows the post-training eyes closed z score FFT NeuroGuide summary report. Compared to the baseline eyes closed qEEG, excess high beta is reduced at F3. However, significant delta and high beta hypocoherence remain, as does delta phase lag.
Figure 15 – Post-Neurofeedback Eyes-Closed NeuroGuide Z-Score FFT Summary Report
Figures 16 and 17 show single-Hz bins, showing a reduction in the excess beta and high-beta activity seen in the baseline qEEG, with reduction occurring mainly in the beta range (14-19 Hz) and less so at higher frequencies.
Figure 16 – Post-Neurofeedback Eyes-Closed Z-Score FFT Absolute Power Single-Hz Bins (1-20 Hz)
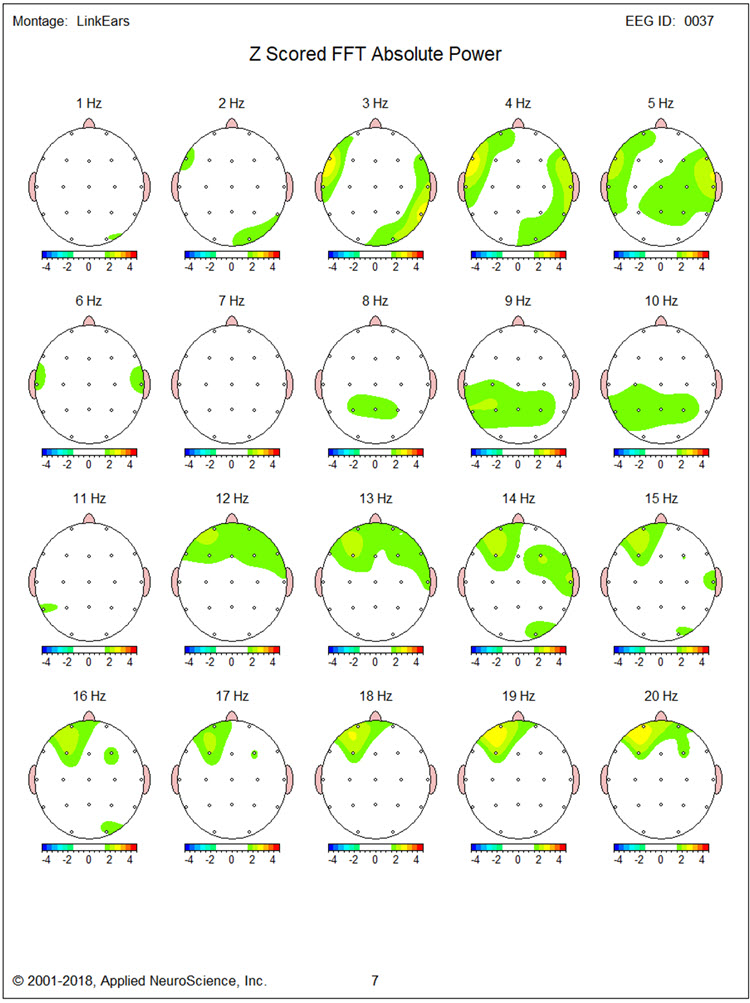
Figure 17 – Post-Neurofeedback Eyes-Closed Z-Score FFT Absolute Power Single-Hz Bins (21-30 Hz)
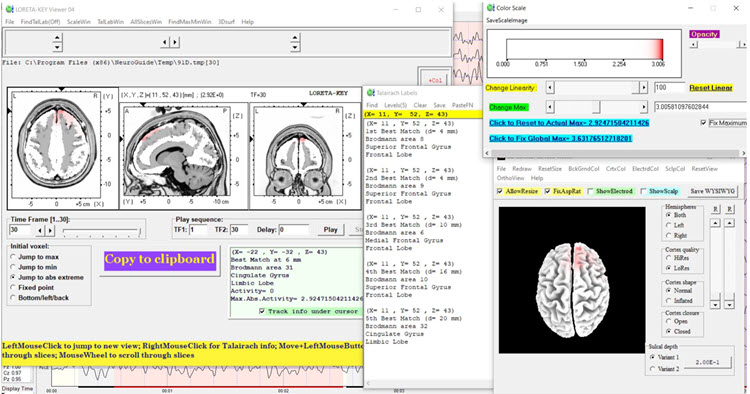
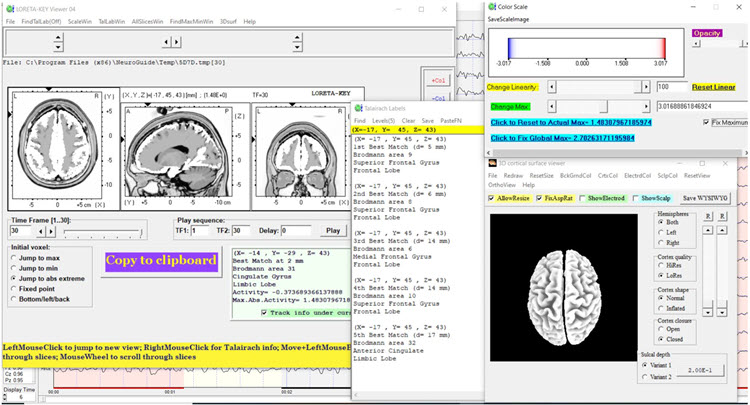
LORETA findings again show no elevated 3 Hz activity in Figure 18. Figures 19 and 20 for 17 Hz and 19 Hz, respectively, show a reduction of cortical territory with excess activity. However, Figures 21 and 22 show little discernable change for 27 Hz and 30 Hz activity.
Figure 18 – Post-Neurofeedback Eyes-Closed Z-Score LORETA Analysis for 3 Hz
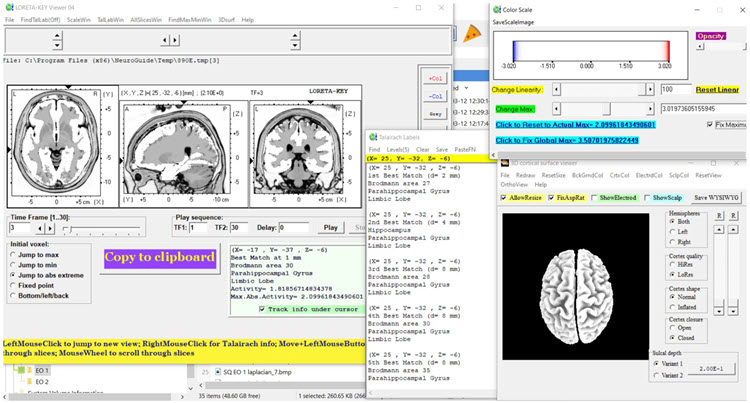
Figure 19 – Post-Neurofeedback Eyes-Closed Z-Score LORETA Analysis for 17 Hz
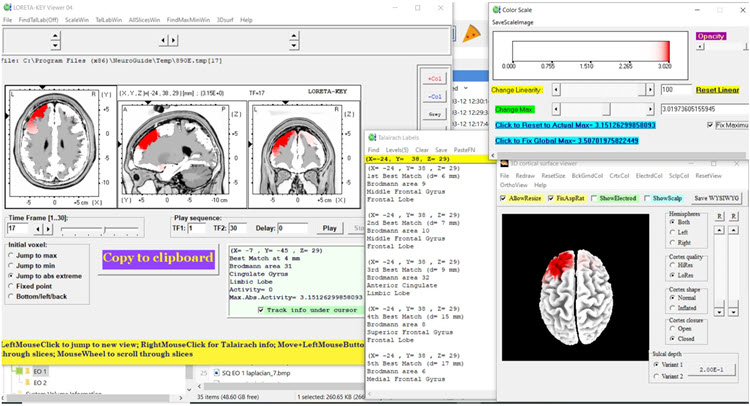
Figure 20 – Post-Neurofeedback Eyes-Closed Z-Score LORETA Analysis for 19 Hz
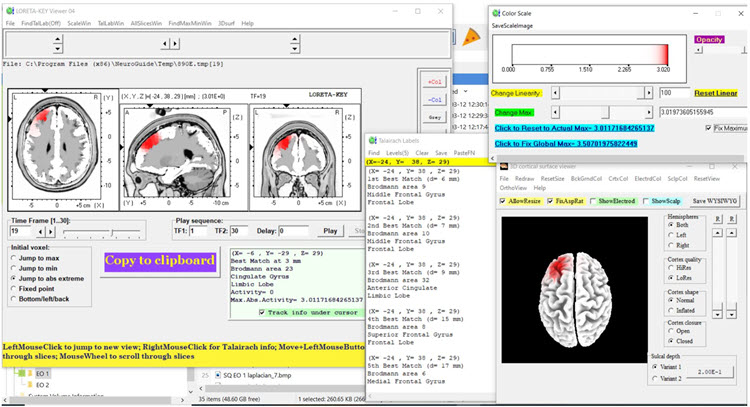
Figure 21 – Post-Neurofeedback Eyes-Closed Z-Score LORETA Analysis for 27 Hz
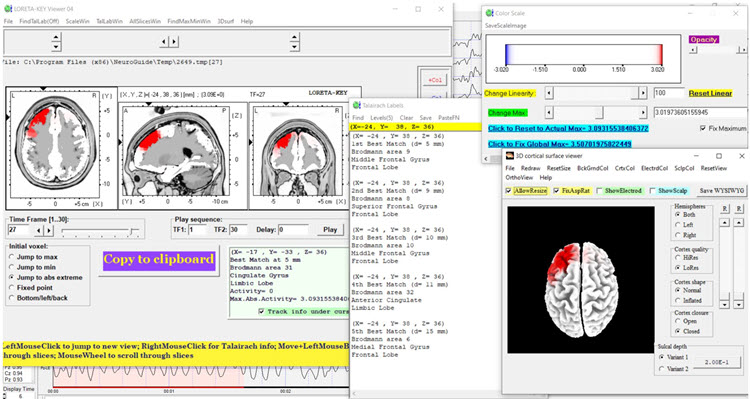
Figure 22 – Post-Neurofeedback Eyes-Closed Z-Score LORETA Analysis for 30 Hz
Post-training Eyes-Open qEEG Findings
Figure 23 shows the post-training eyes open z score FFT NeuroGuide summary report. The excess beta and high beta activity seen during the baseline qEEG assessment is largely absent. There is also less delta and high beta hypocoherence than baseline, although delta phase lag remains significantly elevated.
Figure 23 – Post-Neurofeedback Eyes-Open NeuroGuide Z-Score FFT Summary Report
This change is seen in more detail for single-Hz bins in Figures 24 and 25.
Figure 24 – Post-Neurofeedback Eyes-Open Z-Score FFT Absolute Power Single-Hz Bins (1-20 Hz)
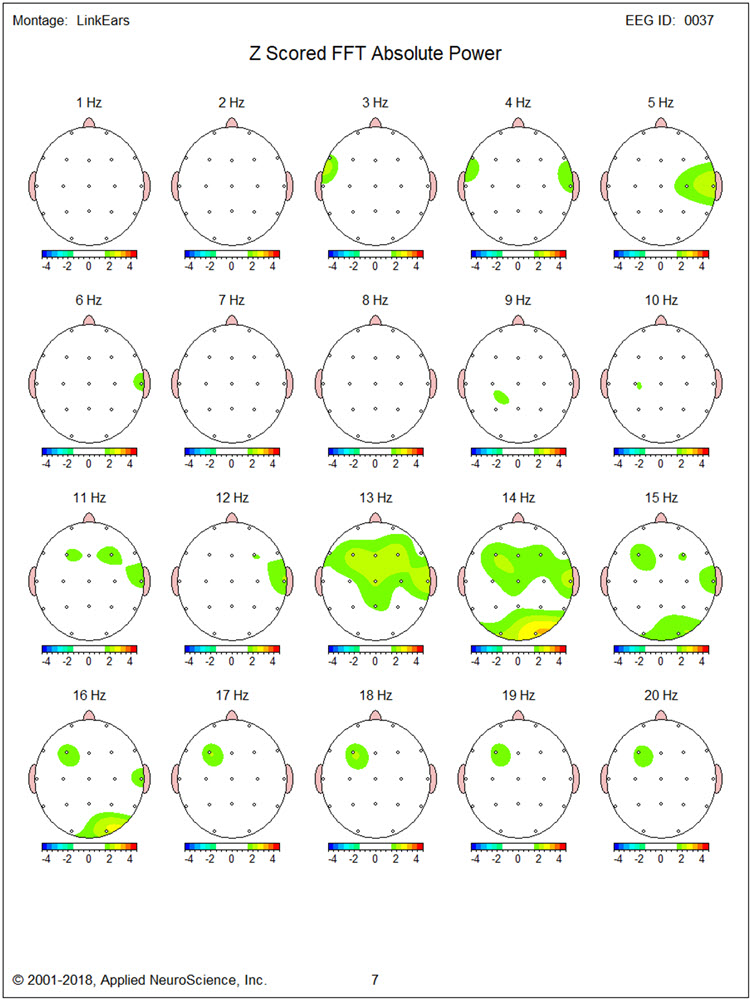
Figure 25 – Post-Neurofeedback Eyes-Open Z-Score FFT Absolute Power Single-Hz Bins (21-30 Hz)
LORETA images in Figures 26, 27, and 28 show very little of the excess activity found during baseline at 14, 20, and 30 Hz.
Figure 26 – Post-Neurofeedback Eyes-Open Z-Score LORETA Analysis for 14 Hz
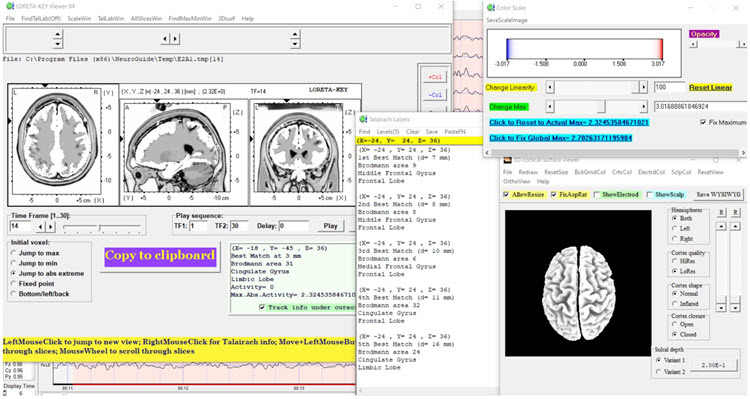
Figure 27 – Post-Neurofeedback Eyes-Open Z-Score LORETA Analysis for 20 Hz
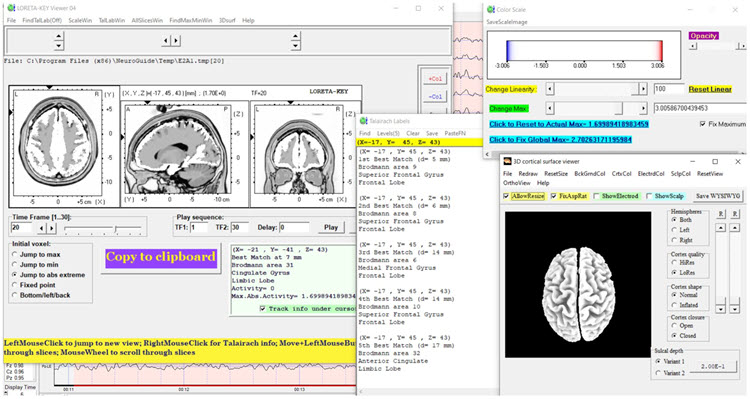
Figure 28 – Post-Neurofeedback Eyes-Open Z-Score LORETA Analysis for 30 Hz
SUMMARY
TR is a 41-year-old man injured in a traffic collision two years before neurofeedback training. At the time, he sustained a mild concussion and soft tissue injuries that prevented him from returning to work as a general building contractor more than part-time. He was referred primarily for excessive anger and aggressive behavior.
Baseline qEEG assessment showed predominately bilateral frontal excess beta and high beta activity, the source of which LORETA methods localized to medial and inferior frontal regions.
Neurofeedback training provided eyes open 2-channel downtraining of higher beta frequencies at F3 and F4 and alpha-theta training.
Anecdotal reports from TR and his wife and behavioral observations by the trainer suggested a significant reduction in the experience and the expression of anger.
Post-training qEEG findings were significant for reduced beta activity in the eyes-closed condition. In the eyes-open condition, in which most of the neurofeedback took place, excess beta was significantly reduced along with delta and high beta hypocoherence.
Dynamic FFT z-score analysis of eyes-closed data improved alpha peak frequency from approximately 9 Hz in the baseline eyes-closed condition to about 10 Hz in the post-neurofeedback eyes-closed condition as seen in the figures below.
Dynamic Z-Score FFT – Eyes-Closed Baseline
Dynamic Z-Score FFT – Eyes-Closed Post-training
In sum, neurofeedback was associated with significant changes in qEEG finds along with clinical changes in TR’s emotional condition and behavior.
PATIENT EXAMPLE C
Jill is a 30-year-old married lawyer who made an initial appointment with a psychotherapist, Sharon, who provides neurofeedback and biofeedback following her family physician’s recommendation to ask for help with stress management.
Before the appointment, Sharon sent clinic information, a background questionnaire, and a standardized questionnaire to Jill, requesting that she complete them and bring them to the clinic for the first appointment.
At the first appointment, Sharon collected the questionnaires, documented her review of confidentiality issues with Jill, and conducted an intake interview. Sharon asked for consent to request relevant reports from Jill’s family physician. Sharon provided Jill with a stress model and explained why Jill is suffering from stress. She described options for reducing stress and explained that she provides neurofeedback and biofeedback, which are helpful adjuncts to psychotherapy for stress management. Jill said that she was interested, so Sharon recommended a further appointment to complete an EEG assessment for neurofeedback planning and a psychophysiological stress assessment to plan for biofeedback. Jill returned for the two assessments.
Sharon scored the questionnaires, talked with Jill’s husband and family physician by phone, and examined the EEG and peripheral psychophysiological data, along with the information she collected during the intake interview.
Assessment Highlights
Jill is a 30-year-old married lawyer with no children. She was self-referred for stress management. Jill wants to understand what is causing stress and options for management.Presenting Problem from the Interview
Stress occurs daily and varies from none to severe intensity. Intense stress occurs about 3 times per week, lasting several hours on average. Precipitants of stress episodes are being given large assignments at work and encountering obstacles in those assignments, for example, the inability to quickly access information. Low-intensity stress occurs primarily at home when enjoying meals with her husband and during outdoor exercise activities.
During times of severe stress, Jill has difficulty concentrating and recalling information related to her work task. Physical stress correlates include holding her breath and tightening her muscles from the shoulders up. She experiences what she believes are tension headaches a couple of times per week.
Presenting Problem History
Jill says that she always performed well in school, but as she advanced through her education and began work as a lawyer, her experience of stress gradually worsened. She began avoiding some work assignments during her first year as an associate in her current law firm. This was followed by some informal criticism by other lawyers at the firm. As stress worsened, Jill recalled that self-criticism related to academic and professional performance also increased.
Functional Status
Jill works full-time as a lawyer and has no significant deficits in self-care, domestic activity, mobility, or independent activities of daily living. However, her engagement in self-care and pleasurable activities is limited, and fatigue has prevented her from spending as much time enjoying travel and entertainment with her husband as she would like and socializing with friends.
Medication and Social Drugs
Jill uses over-the-counter remedies such as Tylenol for headaches.
Past History
Physical
Jill has had no major surgeries, illnesses, injuries, or diagnosed diseases. She has received the normal complement of vaccinations during childhood and is fully vaccinated with boosters for COVID-19.
Mental Health
Jill has never received any mental health diagnosis but did see a counselor during high school and then during law school to address high stress levels.
Substance Use
She has a couple of drinks at a time with her husband two to three times per week. She does not use recreational drugs.
Academic
Jill completed law school 2 years ago.
Work
She works in a moderately-sized corporate legal firm.
Legal
Jill has never been arrested or charged with any legal offense.
Social
Jill married after achieving an undergraduate degree. She and her husband have no children. Earlier in their marriage, they traveled and visited with friends more often. Jill has a small circle of friends with whom she talks by phone, texts, and enjoys sometimes going out to dinner and shows. She is on good terms with her parents, younger sister, and her husband’s family. Jill reports that her parents emphasized academic achievement and excellence in extracurricular activities during her childhood and seemed to personalize occasions when her performance was not the best.
Family History
Jill’s parents do not have any significant problems concerning areas of medical, psychiatric, substance use, academic, or work history.
Collateral Report
A phone interview with Jill’s husband, conducted with her consent, essentially corroborates what she reported during her interview. Her husband comments that she worries about minor issues and sometimes has difficulty falling asleep.
Medical Records
A phone interview with Jill’s family physician provided information consistent with interviews with Jill and her husband. There were no significant medical test results or reports to send.
Behavioral Observation
During the interview, Jill was observed to fidget frequently and appeared tense. She expressed misgivings about her abilities and performance several times.
Psychological Assessment
Questionnaire results from the Depression, Anxiety, and Stress Scale – 21 (DASS21) showed significant elevation of stress and anxiety, but not of depression.
EEG Assessment
There was excessive posterior beta amplitude and deficient alpha production in an eyes-closed condition.
Psychophysiological Stress Test
Shoulder-neck EMG increased significantly in response to stressors, failing to return to baseline levels. Heart rate variability was deficient. Finger temperature and skin conductance were unremarkable.<
Formulation
Jill is a young professional who seeks help for managing high levels of stress that, to some extent, compromise her enjoyment of her work and personal life. As a child, she may have learned to value high levels of performance and feel anxious about less than excellent outcomes, developing critical and evaluative beliefs and thoughts about herself in challenging situations. Upon entering the legal profession with the challenges it presents, Jill’s feelings of stress have worsened, leading her to consult her family physician and then Sharon, a therapist who also provides biofeedback and neurofeedback.Jill brings many strengths such as her intellect, capacity for good social relationships, academic and professional success, and supportive family and friends. However, her beliefs and cognitions about challenging situations and her withdrawal from many pleasurable activities may perpetuate stress. The questionnaire, EEG, and psychophysiological test results are consistent with stress and anxious mood. Methods to relieve Jill’s stress may include medication, cognitive-behavior therapy, neurofeedback, and biofeedback. At this time, Jill defers medication but expresses interest in the latter three methods, which Sharon can provide.
Cognitive-behavior therapy for stress management is recommended. Psychophysiological stress test results suggest that a combination of respiration, HRV, and EMG biofeedback will be helpful and serve to familiarize Jill with the process of biofeedback in advance of neurofeedback training. EEG assessment suggests using a posterior site using a referential montage at Pz or a sequential montage at P3-P4 in which the alpha band is reinforced and EEG in the higher beta band is inhibited.
A review of AAPB’s Evidence-based Practice in Biofeedback and Neurofeedback supports using biofeedback and neurofeedback as just outlined. A review of published EEG and neurofeedback research suggests that elevated posterior beta amplitude and deficient eye-closed alpha production are consistent with elevated anxiety, and that training alpha amplitude increases and inhibiting excess beta have been found to relieve anxiety.
This formulation was reviewed with Jill, who provided her consent with its treatment options. Sharon provided several biofeedback sessions plus cognitive-behavior therapy and then introduced neurofeedback training using a referential montage at Pz to reinforce alpha and inhibit beta with eyes closed.
Jill practiced skills learned from cognitive-behavior therapy and HRV biofeedback between in-office sessions. Sharon graphed data from the DASS21 and self-report stress ratings that Jill completed between sessions. Sharon also graphed data from HRV and neurofeedback training, particularly session pre-training baseline values of average alpha and high beta amplitudes. Sharon also asked Jill to provide stress ratings at the beginning and end of each session and graphed those data. Sharon and Jill briefly reviewed these graphs during each session.
Summary and Conclusion
This model of decision-making and problem-solving also highlights the importance of a data-based approach to neurofeedback training. Initial protocols are selected based on the best available data, and their effect on an individual is judged by changes in data following the implementation of training. The close involvement of the client from the start and during training also integrates ethical considerations of autonomy and informed consent into this model of treatment protocol decision-making steps.
Glossary
alpha asymmetry neurofeedback for mood disorders: a protocol that trains depressed clients to relax and warm their hands using diaphragmatic breathing and autogenic phrases and then decrease left frontal alpha with respect to the right frontal alpha.
alpha rhythm: 8-12-Hz activity that depends on the interaction between rhythmic burst firing by a subset of thalamocortical (TC) neurons linked by gap junctions and rhythmic inhibition by widely distributed reticular nucleus neurons. Researchers have correlated the alpha rhythm with "relaxed wakefulness." Alpha is the dominant rhythm in adults and is located posteriorly. The alpha rhythm may be divided into alpha 1 (8-10 Hz) and alpha 2 (10-12 Hz).
alpha spindles: regular bursts of alpha activity.
amplitude: the energy or power contained within the EEG signal measured in microvolts or picowatts.
beta rhythm: 12-38-Hz activity associated with arousal and attention generated by brainstem mesencephalic reticular stimulation that depolarizes neurons in both the thalamus and cortex. The beta rhythm can be divided into multiple ranges: beta 1 (12-15 Hz), beta 2 (15-18 Hz), beta 3 (18-25 Hz), and beta 4 (25-38 Hz).
beta spindles: trains of spindle-like waveforms with frequencies that can be lower than 20 Hz but more often fall between 22 and 25 Hz. They may signal ADHD, especially with tantrums, anxiety, autistic spectrum disorders (ASD), epilepsy, and insomnia.
Broca's area: the area located in the inferior frontal gyrus (BA 44 and 45) of the dominant hemisphere (F7-T3 in the left hemisphere) concerned with speech production, grammar, language comprehension, and sequencing.
Brodmann areas: 47 numbered cytoarchitectural zones of the cerebral cortex based on Nissl staining.
connectivity training: a strategy designed to correct deficient or excessive communication between two brain sites measured by indices like coherence and comodulation.
default mode network (DMN): a cortical network of sites located in frontal, temporal, and parietal regions that is most active during introspection and daydreaming and relatively inactive when we pursue external goals.
delta rhythm: 0.05-3-Hz oscillations generated by thalamocortical neurons during stage-3 sleep.
dominant frequency: the EEG frequency with the greatest amplitude.
evidence-based assessment: client evaluation using instruments that are reliable, valid, and possess clinical utility.
gamma rhythms: 28-80 Hz rhythm that includes the 38-42 Hz Sheer rhythm and is associated with learning and problem-solving, meditation, mental acuity, and peak brain function in children and adults.
hertz (Hz): unit of frequency, an abbreviation for cycles per second.
high alpha (alpha 2): 10-12-Hz alpha associated with open awareness.
high beta (beta 4): 25-38-Hz activity mostly seen in the frontal lobes and is associated with hyper-perfusion and increased glucose metabolism. High or fast beta activity may be related to peak performance and cognitive processing and related to specificity and precision in information processing. Excessive high beta is associated with alcoholism, anxiety, OCD, rumination, and worry.
local loops: neighboring cortical macrocolumns that share input generate frequencies above 30 Hz in the high-beta and gamma ranges.
local synchrony: synchrony that occurs when the coordinated firing of cortical neurons produces high-amplitude EEG signals.
low alpha (alpha 1): 8-10-Hz alpha below a client's peak alpha frequency when eyes are closed.
low resolution electromagnetic tomography (LORETA): Pascual-Marqui's (1994) mathematical inverse solution to identify the cortical sources of 19-electrode quantitative data acquired from the scalp.
module: a set of interconnected nodes in a neural network.
negative SCPs: slow cortical potentials produced by glial cells that increase the probability of neuron firing.
neural network: a system of interconnected ensembles of neurons that collaborate to achieve a goal. These networks communicate and perform functions via hub- or node-based communication systems.
node: vertex within a neural network.
normative database: means and standard deviations for EEG variables such as amplitude, power, coherence, and phase that are calculated for single hertz bins, frequency bands, or band ratios based on the EEG data collected from healthy normal subjects who are grouped by age, eyes-open or eyes-closed conditions, and sometimes gender and task, which also allows for the specification of z-scores with a mean of 0 and standard deviation of 1 for the various combinations of EEG variables, frequency ranges, subject ages, eyes open or eyes closed conditions, and other variables.
positive SCPs: slow cortical potentials produced by glial cells that decrease the probability of neuron firing.
quantitative EEG (qEEG): digitized statistical brain mapping using at least a 19-channel montage to measure EEG amplitude within specific frequency bins.
sensorimotor rhythm (SMR): 13-15 Hz spindle-shaped sensorimotor rhythm (SMR) detected from the sensorimotor strip when individuals reduce attention to sensory input and reduce motor activity.
slow cortical potential (SCP) training: neurofeedback to increase the gradual negative changes in the membrane potentials of cortical dendrites that last from 300 milliseconds to several seconds to reduce neuronal excitability in conditions like grand mal epilepsy and migraines.
slow cortical potentials (SCPs): gradual changes in the membrane potentials of cortical dendrites that last from 300 ms to several seconds. These potentials include the contingent negative variation (CNV), readiness potential, movement-related potentials (MRPs), and P300 and N400 potentials. SCPs modulate the firing rate of cortical pyramidal neurons by exciting or inhibiting their apical dendrites. They group the classical EEG rhythms using these synchronizing mechanisms.
swLORETA: a more precise and accurate iteration of the LORETA source localization method.
theta/beta ratio (T/B ratio): the ratio between 4-7 Hz theta and 13-21 Hz beta, measured most typically along the midline and generally in the anterior midline near the 10-20 system location Fz.
theta/beta training: a protocol that decreases theta amplitude and increases beta amplitude.
Wernicke's area: the area of the temporoparietal cortex (BA 22) of the dominant hemisphere specialized for speech perception and production. Damage can result in an inability to understand the meaning of speech and construct intelligible sentences.
z-score training: a strategy that attempts to normalize brain function with respect to mean values in a clinical database. EEG amplitudes that are 2 or more standard deviations above or below the database means are down-trained or uptrained to treat symptoms and improve performance.
TEST YOURSELF ON CLASSMARKER
Click on the ClassMarker logo below to take a 10-question exam over this entire unit.

REVIEW FLASHCARDS ON QUIZLET
Click on the Quizlet logo to review our chapter flashcards.

Visit the BioSource Software Website
BioSource Software offers Physiological Psychology, which satisfies BCIA's Physiological Psychology requirement, and Neurofeedback100, which provides extensive multiple-choice testing over the Biofeedback Blueprint.

Assignment
Now that you have completed this unit, explain the roles of neuroscience and peer-reviewed outcome studies in developing protocols.
References
Amzica, F., & Lopes da Silva, F. H. (2018). Cellular substrates of brain rhythms. In Schomer, D. L. & F. H. Lopes da Silva (Eds.). Niedermeyer's electroencephalography: Basic principles, clinical applications, and related fields (7th ed.). Oxford University Press.
Breedlove, S. M., & Watson, N. V. (2020). Behavioral neuroscience (9th ed.). Sinauer Associates, Inc.
Collura, T. F. (2014). Technical foundations of neurofeedback. Taylor & Francis.
Demos, J. N. (2019). Getting started with neurofeedback (2nd ed.). W. W. Norton & Company.
Gollan, J. K., Hoxha, D., Chihade, D., Pflieger, M. E., Rosebrock, L., & Cacioppo, J. (2014). Frontal alpha EEG asymmetry before and after behavioral activation treatment for depression. Biol Psychol, 99, 198-208. https://doi.org/10.1016/j.biopsycho.2014.03.003
Herbet, G., & Duffau, H. (2020). Revisiting the functional anatomy of the human brain: Toward a meta-networking theory of cerebral functions. Physiol Rev, 100, 1181-1128. https://doi.org/10.1152/physrev.00033.2019
Kaiser, D. A. (2008). Functional connectivity and aging: Comodulation and coherence differences. Journal of Neurotherapy, 12, 123-139. https://doi.org/10.1080/10874200802398790
LaVaque, T. J., Hammond, D. C., Trudeau, D., Monastra, V., Perry, J., Lehrer, P., Matheson, D., & Sherman, R. (2002). Template for developing guidelines for the evaluation of the clinical efficacy of psychophysiological evaluations. Applied Psychophysiology and Biofeedback, 27(4), 273-281.
Nunez, P. L., & Srinivasan, R. (2006). Electric fields of the brain (2nd ed.). Oxford University Press.
Swingle, P. G. (2015). Adding neurofeedback to your practice: Clinician’s guide to ClinicalQ, neurofeedback, and braindriving. Springer.
Thatcher, R. W. (1998). Normative EEG databases and EEG biofeedback. Journal of Neurotherapy, 2(4), 8-39. https://doi.org/10.1300/J184v02n04_02
Thatcher, R. W., Lubar, J. F., & Koberda, J. L. (2019). Z-Score EEG biofeedback: Past, present, and future. Biofeedback, 47(4), 89–103. https://doi.org/10.5298/1081-5937-47.4.04
Thompson, M., & Thompson, L. (2015). Neurofeedback Book: An introduction to basic concepts in applied psychophysiology (second edition). Association for the Advancement of Psychophysiology and Biofeedback. https://doi.org/10.5298/1081-5937-44.1.09
G. Tan, F. Shaffer, R. R. Lyle, & I. Teo (Eds.). Evidence-based practice in biofeedback and neurofeedback (3rd ed.). Association for Applied Psychophysiology and Biofeedback.