Procedures and Mechanics of Conducting a Neurofeedback Session
Overview
This section of Neurofeedback Tutor outlines typical procedures that practitioners may follow when conducting individual neurofeedback sessions. The information here owes much to the writing of Demos (2019), Soutar and Longo (2022), and Thompson and Thompson (2015).
EEG equipment literacy requires that applicants understand how to measure the scalp, identify International 10-20 System sites, and attach electrodes. They must understand what a normal raw EEG looks like and gain experience creating and controlling artifacts so that EEG measurements and brain maps are valid. Finally, applicants must learn to recognize abnormal EEG waveforms and distinguish them from benign activity.
Clinicians monitor EEG activity using the classical International 10-20 System for standardized electrode placement or the modified "10-10" system known as the Modified Combinatorial Nomenclature System. They often record from several sites and measure the amplitude of EEG signals within frequency bands (like alpha and theta) to provide a complete picture of brain activity. Software-based montage reformatting allows clinicians to reanalyze session data by referencing an electrode to other sites or combinations of sites. This system also allows for the computation of multiple variables associated with communication and network functions within the central nervous system (CNS)
The Quantitative EEG (qEEG) measures EEG amplitudes within selected frequency bands. A full-cap 21-channel EEG recording (19 scalp sensors and two "reference" sensors) and resulting qEEG analysis may be valuable in designing treatment protocols for complicated cases like Asperger's or traumatic brain injury. EEG topography displays the qEEG on a cortical surface map to show the spatial distribution of EEG activity.
Contamination of the EEG by physiological and exogeneous artifacts requires that clinicians take extensive precautions, examine the raw EEG record, and remove contaminated epochs through artifacting. Impedance tests and behavioral tests help ensure the fidelity of EEG recording.
This unit covers VIII. Treatment Implementation - C. Procedures and Mechanics of Conducting a Neurofeedback Session.
This unit reviews: 1. Monitoring client reaction to treatment (e.g., use of pre-session questionnaires, etc.), 2. Obtaining clean EEG data (e.g., proper
electrode attachment, impedance, artifact elimination, etc.), 3. Selecting appropriate electrode montages, 4. Setting Thresholds for Amplitude Training, 5. Critical Elements in Neurofeedback Training, 6. Setting thresholds for amplitude training, and 7. Monitoring client progress (e.g., identifying drowsiness, revising protocols and moving to new sites, medication issues, identifying contraindications to treatment and adverse reactions, reading/interpreting session reports/graphs, etc.).
Please click on the podcast icon below to hear a full-length lecture.
Monitoring Client Reaction to Treatment
Before a session, the practitioner should review information from previous sessions. This information includes training goals and graphs of self-report, questionnaire data, and EEG results. Therefore, the practitioner is best advised to construct and update graphs with data as soon as possible after its collection. Whereas self-report rating scales can usually be graphed relatively straightforwardly, questionnaires often require converting responses to norm-based results. EEG data from the previous session may need to be artifacted before calculating values for parameters such as mean amplitude or coherence.
In some cases, data from self-report scales and questionnaires completed during the time between sessions may be forwarded electronically by the client or even completed online. In other cases, the client may bring the scales and questionnaires to the practitioner only immediately before the session or complete such measures only after coming to the office for training. Depending on the situation, the practitioner may want to schedule time before training to score and review these data before inviting the client into the room where training occurs.
The practitioner should consider how consistent the results to date are with the hypothesis that training will lead to the resolution of problems or achievement of training goals. This consideration allows the practitioner to be prepared to discuss the current session with the client in terms of continuing with the training montage or montages of previous sessions, making changes to the training regimen, or concluding training.
It can be very helpful to prepare a form for each session to guide the practitioner for that session and on which to take notes. For example, the form can be used before the session to document the montage(s) to use, findings to review, and questions to ask. Then the practitioner can use that session’s form to record responses to the questions and other pertinent information during the session.
The practitioner may also want to have updated graphs ready to show the client, either printed or electronically, as a vehicle for engaging the client in a discussion about session progress or problem-solving concerning training methods.
In-person sessions require good hygiene and infection control. Therefore, the practitioner should ensure that their hands are washed, furniture surfaces are disinfected, and electrodes have been cleaned.
Equipment and materials should be set out in locations that afford efficient access during the session. This applies to the location of the computer, monitor, speakers, and EEG amplifier and the arrangement of electrodes, gel, paste, and other items such as alcohol, cotton balls, and facial tissue.
Client Check-In
Self-report
Though it may seem a small matter, greeting the client attentively and setting them at their ease is important at the outset of each session. It may come naturally to ask how they are generally, which opens the door to more specific inquiry and self-disclosure by the client. Direct behavioral observation with follow-up inquiry can also begin at this point in the session.
The practitioner should assess the client’s current state, asking how they are that day. Follow-up questions can include questions regarding any changes to their health and circumstances.
Practitioners should inquire about the effects of training following the previous session. These questions may progress from general open-ended to more specific closed-ended questions about changes the client noticed in the hours and days after training concerning emotional, cognitive, somatic, and behavioral function. The practitioner may also want to ask for details regarding the particular situations in which the client experienced those changes. Changes can be contrasted with the client’s condition before the beginning of training, and connections can be made between those changes of the previous week and experiences during neurofeedback training proper. The practitioner should also conduct follow-up and problem-solving regarding homework practice of skills or use of ancillary devices.
Review of quantitative data
Following the client’s subjective self-report, the practitioner can review any self-monitoring scales or questionnaires the client completed before the session. The practitioner should review how quantitative data compare to pre-training assessment with the client’s self-report about their current state and response to training.
The practitioner can then review EEG results with the client. In particular, EEG metrics that are the target of training and outside normal expectations should be the focus of this review. This review also provides the opportunity for further education about brain-behavior relationships, how the client’s brain is changing with neurofeedback training, and what the client can expect from those changes. Presenting self-reported ratings, questionnaires, and EEG data in graphs can be a very helpful supplement to the practitioner’s verbal description of changes.
Before transitioning to neurofeedback training itself, it is wise to ask if the client has any further questions or comments about their progress or the training itself before asking whether they are ready to proceed with that day’s session.
Obtaining Clean EEG Data
Connecting Electrodes
Overview
Before the practitioner connects the electrodes, they may remind the client of their location and how the montage relates to the agreed-upon training plan. As per the selected montage, electrode locations are located using methods based on measurements between cranial landmarks using the 10-20 system.
Electrode sites are typically prepared using abrasive gel-like NuPrep, the excess of which can be wiped from the electrode site. It can help to prepare a cotton-tipped swap with electrode paste ahead of time so that a dab of paste can be applied to mark the electrode site while one’s other hand continues to stay in place at the just-prepped site. This can help to hold hair apart so that the next step of applying paste to the electrode and placing it at the desired site can easily be done.
Click on the Read More button to review 10-20 Site Locations.
The International 10-20 system is a
standardized procedure for electrode placement on 19 scalp and reference and ground sites. Electrodes measure electrical activity from a surrounding area the size of a quarter. Due to neural pathways, the site recorded may be distant from the EEG generator.
The nasion is the depression
at the bridge of the nose.
The inion is the bony prominence on the back of the skull in the middle of the inion ridge.
The left and right
preauricular points are slight depressions located in front of the
ears and above the earlobe. The flap at the opening of the ear is called the tragus.
The vertex (Cz)
intersects imaginary lines drawn from the nasion to inion and between the two preauricular points. Cz is 50% of the total distance between the nasion and inion and 50% between the two preauricular points. Minaanandag adapted the diagram below from Fisch (1999).
The 10-20 system received its name because
electrode sites are separated by 10% or 20% of the distance between two
corresponding anatomical landmarks. In the graphic below adapted from Fisch (1999) by minaanandag, each midline site is 10% or 20% of the distance from the nasion to the inion.
Each horizontal axis site is 10% or 20% of the distance from the two preauricular points. Graphic adapted from Fisch (1999) by minaanandag.
Each circumferential site is 10% of the total circumference, excluding Fpz or Oz. Graphic adapted from Fisch (1999) by minaanandag.
Intermediate sites are halfway between sets of adjacent sites. Graphic adapted from Fisch (1999) by minaanandag.
The graphic by Dailey (2013) shows the correspondence between 10-20 sites and Brodmann areas.
The 10-20 system assigns recording electrodes a letter and subscript. The
letters represent the underlying region and include Fp (frontopolar or
prefrontal), F (frontal),
C (central),
P (parietal), O (occipital),
and A (auricular). A subscript of
z represents a
midline (central axis from nasion to inion) placement.
Numerical subscripts range from 1-8 and increase with distance from the
midline. The 10-20 system assigns odd-numbered recording electrodes on
the left and even-numbered electrodes on the right side of the head. Two
reference electrodes are usually placed on the earlobe. John Balven adapted the diagram below from Fisch (1999).
10-20 System Electrode Placements
Click on the Read More button to review short cuts for electrode placement.
Most sites do not require all the steps outlined below. Calculate Cz by marking 50% of the nasion-inion distance and 50% of the left-right preauricular distance. You can obtain Fz, Pz, C3, C4, T3, and T4 from these two measurements.
The Biofeedback Foundation of Europe generously provided the site location and preparation instructions, and graphics.
Step-By-Step Guide for Electrode Placement
Consistently mark perpendicularly on the same side of the measuring tape.
Nasion to Inion – Anterior to Posterior
Measure from nasion to inion. Note the total and keep the tape measure on this line.
Mark 50% (or halfway). This is Cz.
Mark 20% forward from Cz. This is Fz.
Mark 20% forward from Fz. This is FPz. This should be 10% up from the nasion.
Mark 20% back from Cz. This is Pz.
Mark 20% back from Pz. This is Oz. This should be 10% up from the inion.
Ear to Ear (Pre-Auricular)
Measure from pre-auricular notch to pre-auricular notch. Find the tragus (the flap at the opening of the ear). Move forward to the indention between the
skull and jaw. Place the end of the tape measure at this notch, pass it over Cz and to the pre-auricular
notch on the opposite ear. Record this measurement.
Mark 50% (or halfway). This should intersect with Cz and form a “+.”
From Cz, mark 20% on each side toward the tragus. These will be C3 and C4.
From C3 and C4, mark 20% toward the tragus. These will be T3 and T4. These sites will be 10 percent up from
the pre-auricular notch, directly above the ear.
Circumferential Measurements
Place the tape measure on FPz, T3, Oz, T4, and back to FPz. Record the total circumference.
From FPz, mark 5% on either side. These will be FP1 and FP2.
From Oz, mark 5% on either side. These will be O1 and O2.
Mark at 10% increments from FP1 and FP2. These will be F7 and F8.
Mark at 10% increments from O1 and O2. These will be T5 and T6.
Final Measurements
Measure from Fz to F7: 50% between these points is F3.
Measure from Fz to F8: 50% between these points is F4.
Measure from Pz to T5: 50% between these points is P3.
Measure from Pz to T6: 50% between these points is P4.
Click on the Read More button to review preparing the site.
The COVID-19 pandemic has changed site preparation. Now, both clinician and client should wear masks. The clinician should also wear a face shield and gloves. See the unit on Aseptic Techniques for a more comprehensive review of infection mitigation.
Instruct clients to wash their hair and not use any conditioner or hair-styling products the night before the session. A recent haircut is helpful (particularly for children), and hair must be brushed or combed.
Ask your client to remove jewelry. If your client has pierced ears, do not place the electrode over the hole.
The numbered steps below can be used when applying electrodes one at a time. For 19-channel recordings, early instructions required obtaining skin-electrode impedance below 5 Kohms by slightly abrading the skin with the tip of the blunt needle that is used to inject electrode gel. However, this has been challenged recently because modern amplifiers with high input impedance make it unnecessary, and because abrading the skin risks infection transmission (Ferree et al., 2001; Kappenman & Luck, 2010). Therefore, we do not recommend this step, especially during the COVID-19 pandemic.
When not using an electrode cap, first identify and mark the necessary sites, then follow the steps below.
Prepare the scalp by cleaning with alcohol. Let the alcohol dry before applying the electrodes.
Scoop up a small quantity of NuPrep™
skin preparation gel or a similar product on a cotton swab or tissue.
Avoid contaminating the gel tube by avoiding direct contact with the Q-tips ®.
With the thumb and index finger of one hand, separate the hair around the electrode site that was previously
found and marked.
Run the gel in the direction of the natural line formed along the scalp by the split hair. Some light force must be used, enough to redden the scalp slightly (again, not recommended but an accepted standard), but not enough to break the skin.
Wipe away the excess prepping gel with a dry, lint-free cloth. Take care to keep the hair parted and keep track of the site after wiping clean.
Use a popsicle or craft stick to cover the electrode site with a 1/4-inch layer of Ten20™ conductive paste.
Start by securing the electrode cables to the patient and ensuring strain relief.
Fill the electrode cup with Ten20™
conductive paste so that no air bubbles exist in the cup.
Add more Ten20™
conductive paste onto the cup electrode, just enough to form a ball on the cup, not so much that it spills
over the edge. The ideal amount of paste is shown.
Place the cup face down on the landing pad previously prepared. Gently push the electrode down to fix it to
the scalp. A little bit of paste should run out along the edge of the cup to form a thin ring around it. Place
the electrode so that the direction of the cable does not place undue stress on the cup (so that it gets
pulled, lifted, or twisted off). The cable should hang naturally and towards the plastic clip (as shown).
Leave enough slack in the cable to allow for comfortable head movement.
Repeat the above preparation and placement steps on the earlobes. Do not put too much paste on the ear clip
electrode but ensure that the gold disc is completely covered.
Leave enough slack in the cable to allow the patient to turn their head easily, but not too much that it can
get caught. Think about the angle of the cable from the ear clip to the neck clip so that no extra tension is
placed on the ear clip. Note the position of the clip, the direction of the cables, and the slack left to
provide mobility. The final configuration should look like the photograph below when viewed from behind.
During this process, the practitioner may engage in a monolog to help the client feel at ease or provide helpful information. The client may also participate in a dialog, which may be to ask questions or disclose progress or problems.
Impedance
After the practitioner has positioned all electrodes, they should check their impedances or offsets using methods appropriate for their equipment. Electrodes that show excessive values can be reapplied after removing them to prepare the electrode site again, if necessary.
Before starting training, the practitioner can show the client a screen that displays the EEG. For example, they can instruct the client about minimizing the production of artifacts due to muscle tension, eye movement, and cable sway. If necessary, the practitioner can coach the client to produce artifacts while watching the effects on the EEG display, followed by encouragement to minimize the behavior that just produced those effects. During subsequent training, the practitioner should be vigilant to changes in the EEG that could represent artifacts and coach the client to minimize behaviors that might produce them.
EEG artifact control strategies
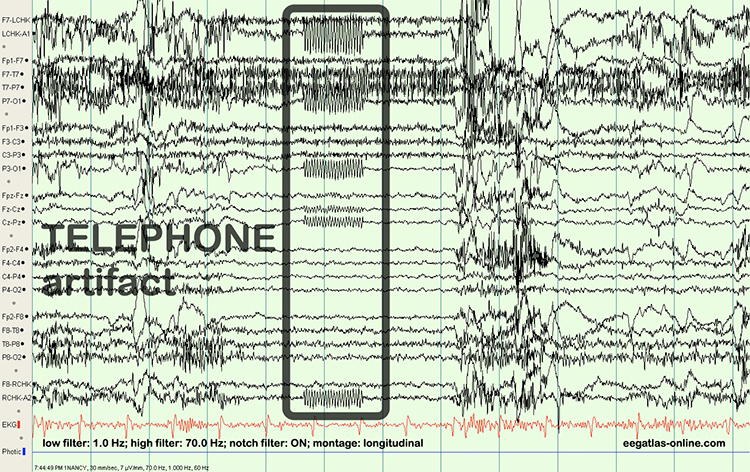
EEG artifacts, consisting of noncerebral electrical activity, can be divided into physiological and exogenous artifacts. Physiological artifacts include electromyographic, electro-ocular (eye blink and eye movement), cardiac (pulse), sweat (skin impedance), drowsiness, and evoked potential. Exogenous artifacts include movement, 50/60Hz, field-effect, and electrode (impedance, bridging, and electrode pop) artifacts.
Electromyographic (EMG) artifact
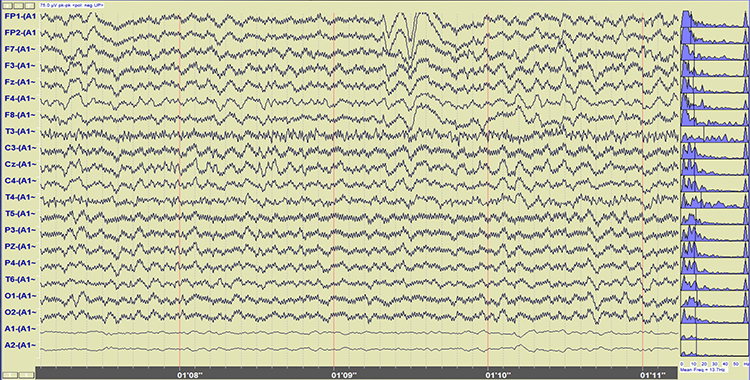
EMG artifact is interference in EEG recording by volume-conducted signals
from skeletal muscles. This artifact contains high-frequency activity that resembles a "buzz" of fast activity during a contraction. EMG is seen as fast beta activity in the qEEG. While some frequencies are between 10-70 Hz, most are 70 Hz or higher.
The graphic shows how high-frequency filter (HFF) selection can affect contamination by this artifact. A high-frequency filter (low-pass filter) attenuates frequencies above a cutoff frequency. In the examples below, the cutoffs are 35 Hz and 15 Hz.
All the channels on the left side of the tracing show SEMG artifact admitted by a 35-Hz high-frequency filter. The right tracing is free from SEMG artifact since its 15-Hz high-frequency filter attenuates the higher frequencies that contain this artifact.
Below is a BioGraph ®
Infiniti EMG artifact display. Note how the amplitude of the EEG spectrum increases with each contraction.
Thompson and Thompson (2015) observed that EMG artifact is readily detected
because it affects one or two channels, particularly at T3 and T4 at
the periphery, and less often at O1,
O2, Fp1, and Fp2.
You can identify EMG artifacts by visually inspecting the raw signal. The following graphic shows SEMG artifacts using a 70-Hz high-frequency filter.
Electro-ocular artifact
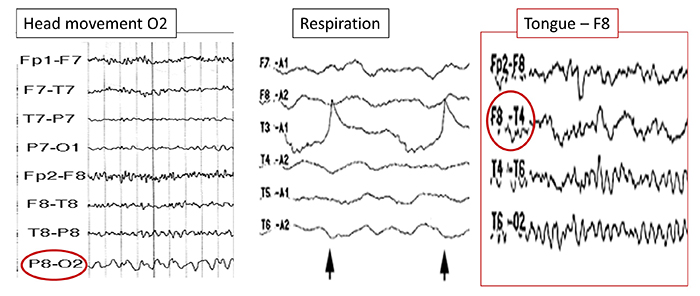
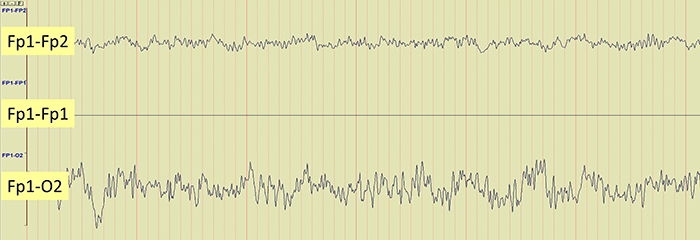
Electro-ocular artifact contaminates EEG recordings with potentials generated by eye blinks, eye flutter, and other eye movements. For example, anxious patient eyelid flutter may cause deflections at Fp1 and Fp2 (Klass, 2008).
This artifact is due to the movement of the eye’s electrical field when the eye rotates and the contraction of the extraocular muscles. The eye creates a dipole that is electropositive at the front and electronegative at the back. Bell’s Phenomenon refers to the upward rotation of the eye when it closes and causes an artifact seen as an apparent increase in EEG.
The video above shows sensor locations Fp1 (top tracing) and O2 (lower tracing) in the linked ears montage. You can see eye blink primarily in the Fp1 location due to proximity to the frontal eye fields and only minimally in the O2 location, which is far from the electrical discharge generated by eyeball rotation. There is also an occasional EMG artifact from teeth clenching in the recording that appears to a similar degree in both locations.
An upward eye movement will create a positive deflection at Fp1, while a downward eye movement may create a negative deflection. In a longitudinal sequential montage, the artifact is typically seen at frontal sites (Fp1- F3 and Fp2-F4). A left movement may produce a positive deflection at F7 and a negative deflection at F8 (Thompson & Thompson, 2015).
You can detect cardiac artifacts by inspecting chart recorder, data
acquisition, or oscilloscope displays of the raw EEG waveform. Cardiac
artifacts appear as a wave that repeats about once per second (Thompson
& Thompson, 2015). Below is a BioGraph ®
Infiniti ECG artifact display.
A short circuit produces a bridging artifact between adjacent electrodes due to excessive application of electrode paste or a client sweating excessively or arriving with a wet scalp. Bridging artifacts can cause adjacent electrodes to create a short circuit that produces identical referential EEG recordings or a flat line with a bipolar montage. The Fp1-F3 channel's reduced amplitude and frequency illustrate the bridging artifact.
When you detect drowsiness artifact during a training session, suspend recording and instruct your clients to move their hands and legs to increase wakefulness.
Evoked potential
Evoked potential artifact (also called event-related potential artifact)
consists of somatosensory, auditory, and visual signal processing-related transients that
maycontaminate multiple channels of an EEG record. Reject an epoch when its amplitude is 50% greater than
background activity. While evoked potentials increase recording
variability and reduce its reliability, they minimally affect averaged
data (Thompson & Thompson, 2015).
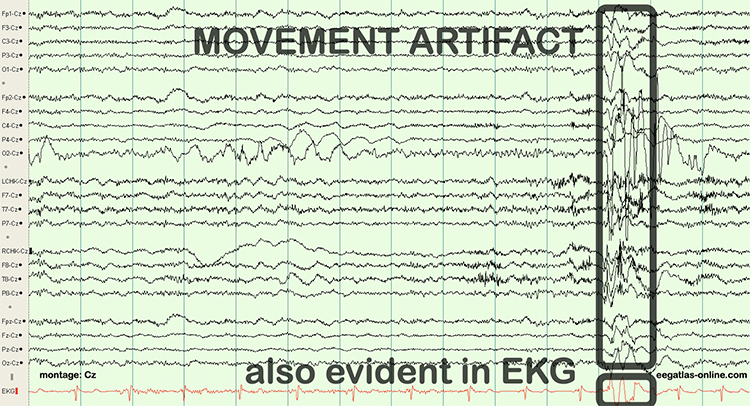
Movement artifact is caused by client movement or the movement of electrode wires by other individuals. Most of these artifacts are produced by brief changes in electrode-skin surface connection. Cable movement is called cable sway. The cable sway graphic was redrawn by minaanandag on fiverr.com.
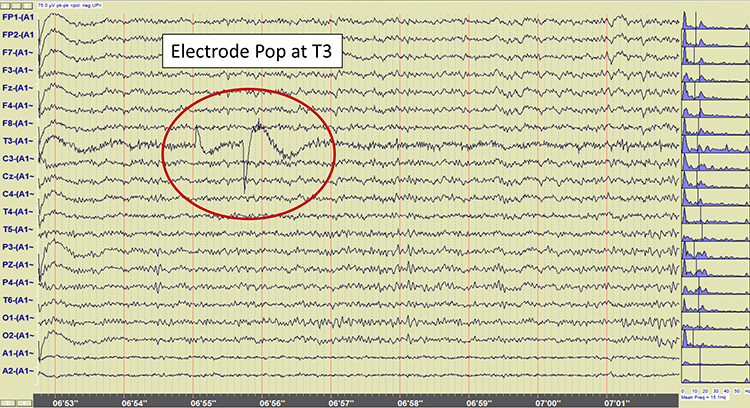
There are several sources of electrode artifacts. Even with proper care, electrode surfaces can become corroded and the leads and connectors damaged. Using sensors with mismatched electrode metals can cause polarization of amplifier input stages.
Peer-reviewed evidence suggests that more EEG channels provide a more accurate assessment and achieve superior clinical or performance outcomes compared with fewer channels (Lau et al., 2012).
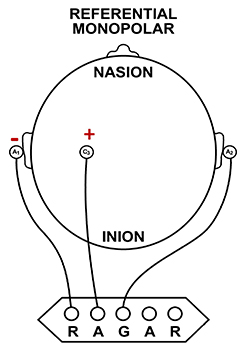
A channel is an EEG amplifier output resulting from scalp electrical activity from three electrode/sensor connections to the scalp. These sensors are commonly known as active, reference, and ground electrodes, though they are more appropriately called positive +, negative - and reference. They are placed on the head in the following manner: an active or positive electrode is placed over a known EEG generator like Cz. A reference or negative electrode may be located on the scalp, earlobe, or mastoid. A ground/reference electrode may also be placed on an earlobe or mastoid (Thompson & Thompson, 2015).
Active and reference sensors are identical balanced inputs and interchangeable. However, some neurofeedback data acquisition systems require the designation of a specific sensor as a "reference," as in a linked-ears reference.
A derivation is the assignment of two electrodes to an amplifier's inputs 1 and 2. For example, Fp1 to O2 means Fp1 is placed in input 1 and O2 in input 2.
A montage groups electrodes together (combines derivations) to record EEG activity (Thomas, 2007).
All montages compare EEG activity between one or more pairs of electrode sites.
Modern amplifiers record all input sensors in reference to a common sensor - often Cz - and all montage (sensor comparison) changes are performed in the software. Amplifiers no longer require manual switching of electrodes between inputs.
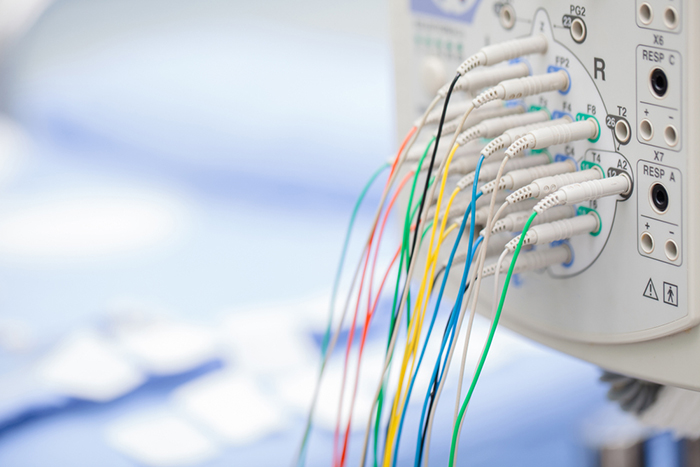
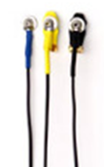
A referential montage assumes that the EEG activity seen on the computer screen represents the active (+) site because the reference (-) site is assumed to be neutral (i.e., producing no EEG activity) and because of the subtraction of signals produced by noise and artifacts that are common to both active and reference sites (common-mode rejection). In the photograph below, the blue cable would be used for the active electrode, the yellow cable with an ear clip for reference, and the black cable with an ear clip for the ground.
However, this montage is vulnerable to artifacts from the contraction of facial muscles (Demos, 2019). The ear reference is also known to produce reference contamination, where EEG signals from this electrode are contributed or added to other electrodes via the mechanism of the differential amplifier, where anything different between the "active" and "reference" sensors is retained. This commonly results in alpha activity produced by posterior alpha sources close to the ear.
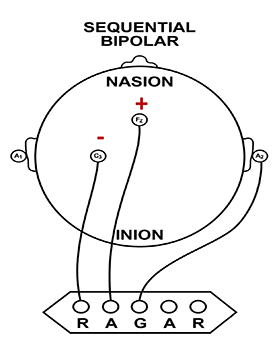
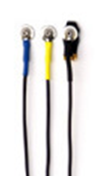
The sequential montage detects the difference in EEG between the positive and the negative electrodes (active and reference), as the referential montage does. Still, now the signal for the channel represents the difference between two sources of EEG activity. In cases when 19-channels are used, this montage is usually presented with electrode pairs shown in sequence. Note that only the black cable for the ground has an ear clip in the photograph below.
When used as only a single channel, this montage does not detect localized EEG activity well because it shows only the difference between the A and R signals. However, when used as part of a 19-channel assessment, it localizes EEG events related to epilepsy. This montage can also reduce artifacts when the A and R electrodes are relatively close.
A sequential montage is frequently used in neurofeedback and trains the difference between EEG activity at the A and R electrodes. However, when neurofeedback training produces a change, it remains uncertain whether it is because of a change in EEG at the A electrode, the R electrode, or both electrodes.
In single-channel training, a clinician can manually set reward and inhibit thresholds. In amplitude training, thresholds correspond to microvolt values (Demos, 2019). The purpose of a reward threshold is to increase brainwave amplitude (e.g., SMR). A practitioner often sets a reward threshold slightly beneath the average amplitude for that brainwave.
Often practitioners want to train simultaneously increases of the amplitude of one EEG band while controlling or decreasing amplitudes of other bands. For example, training may aim to increase SMR amplitude while limiting or decreasing amplitudes of theta and high beta. Using percentage instruments to show percentage of time each band meets its criterion for presenting feedback can be helpful.
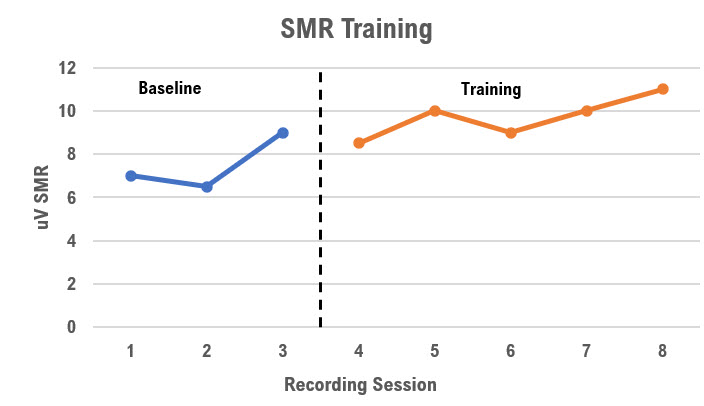
In this example, if the practitioner wants to emphasize the increase of SMR, then they would set the SMR threshold to a level at which SMR amplitude exceeded threshold 80 percent of the time. They would also set the theta and high beta thresholds to a level at which their amplitudes would each be below threshold 90 of the time. Multiplying the three percentages shows how often the three thresholds will be simultaneously met with the resulting presentation of feedback: .80 X .90 X .90 = .65 (i.e., 65 percent of the time).
As training progresses through a session, the practitioner can watch the changing percentages. After the SMR percentage gradually increases from 80 percent to 85 to 90 percent range, and remains stable, the practitioner can very slightly increase the threshold. This will increase the requirement on the brain to produce SMR, and with repetition will gradually increase CNS capacity to produce that frequency band through the operant conditioning process of shaping by successive approximations toward a higher amplitude of SMR.
Automatic Thresholds
Sherlin et al. (2011) strongly state that the automatic setting of thresholds violates the principles of operant conditioning. Many neurofeedback systems have implemented auto-thresholding to make life easier for beginning and advanced clinicians alike. However, as Sherlin and colleagues point out, automatically adjusting thresholds runs the risk of punishing change in the desired direction and rewarding behavior that is being inhibited. This occurs because once the client increases voltage in the reward signal, the threshold automatically rises to maintain the percentage reward set by the clinician. Therefore, the client does not experience the increase in positive feedback that should attend the improved behavior. Likewise, suppose the voltage of an inhibit signal increases. In that case, the threshold will be increased to maintain the set percentage of inhibit. The client continues to receive the same level of positive feedback, even though the signal is moving in the wrong direction. The video below provides a visual example of how this works and why it is not recommended.
Single-Channel Ratio Thresholds
A ratio-threshold reinforces changes in the ratio of two EEG bandpasses. For example, clinicians use a theta-to-beta ratio-threshold when training children diagnosed with ADHD whose ratios may far exceed 3:1. Clients usually receive variable-pitch feedback when the theta-to-beta ratio falls (Demos, 2019). So-called inverse proportional feedback in this example results in more feedback when the ratio is smaller and less feedback when the ratio is larger.
Sum Squash Threshold
A sum squash threshold reduces bandpass amplitude over a wide scalp area by using inhibit thresholds on two channels using referential (monopolar) or sequential (bipolar) recording. For example, clients would receive feedback when theta at Cz and Fz decreases simultaneously (Demos, 2019).
Alpha Synchrony Threshold
An alpha synchrony threshold increases alpha amplitude over the scalp. For example, trainers may reward simultaneous increases in alpha amplitude at O1 and O2, reinforcing phase-synchronous alpha activity (Demos, 2019).
Alpha Variability Threshold
Alpha variability is alpha amplitude fluctuation measured in standard deviations (SDs). When alpha amplitude or its variability is too high, as in migraines, clinicians can use an alpha variability threshold to reduce them. For monitoring alpha using a C3-C4 sequential montage, feedback would be enabled when alpha variability drops below a dynamic threshold (Demos, 2019).
Z-Score Thresholds
Z-score thresholds consist of upper and lower boundaries expressed in z-scores. Clinicians use z-score thresholds (in standard deviation units) like a scalpel to normalize specific EEG metrics and regions of interest (ROIs). For example, if the mean alpha power has a z score of 3 (i.e., 3 standard deviations above normal), then the z-score threshold might be set to a z value of 2.5. This results in the production of feedback when alpha amplitude is equal or less than 2.5 standard deviations from normal.
When z-score training involves multiple channels, scores of ROIs, and hundreds to thousands of z-score metrics, a percentage of success protocol offers greater flexibility than fixed boundaries. In this approach, a client receives feedback when a predetermined percentage of EEG components fall within ±1, 2, or 3 standard deviations from normal. A clinician has two options when the training criteria are too demanding. First, they can expand the range. If ±1 is too challenging, a clinician can expand the range to ±2 or 3 until a target percentage of EEG components falls within the chosen range.
Second, they can reduce the percentage of success.
Dynamic Z-Score Thresholds
Dynamic z-score thresholds incorporate dynamic thresholds that deliver feedback almost 50% of the time. Dynamic thresholds are calculated on shorter periods (e.g., 10 seconds) than automated thresholds (60 seconds). Demos (2019) warns that this protocol is particularly vulnerable to contamination by various artifacts.
Unanswered Questions
Definitive findings are still needed regarding the best feedback parameters, threshold adjustment, discontinuous versus continuous neurofeedback training effectiveness, and the superiority of z-score training over amplitude training. First, researchers have not determined whether amplitude-integration (Hardt & Kamiya, 1976) or percent-time alpha feedback (Landsky et al., 1979) yield superior outcomes (Sherlin et al., 2011). Second, are automatic and manual threshold adjustment protocols effective (Strehl, 2014)? Third, should neurofeedback training sessions be continuous or discontinuous (Strehl, 2014)? Does game or video feedback interfere with PRS and neurofeedback training by eliminating the small breaks needed for PRS? Would discontinuous training, interspersed with breaks, produce superior outcomes? Finally, does z-score training produce superior clinical outcomes to amplitude training?
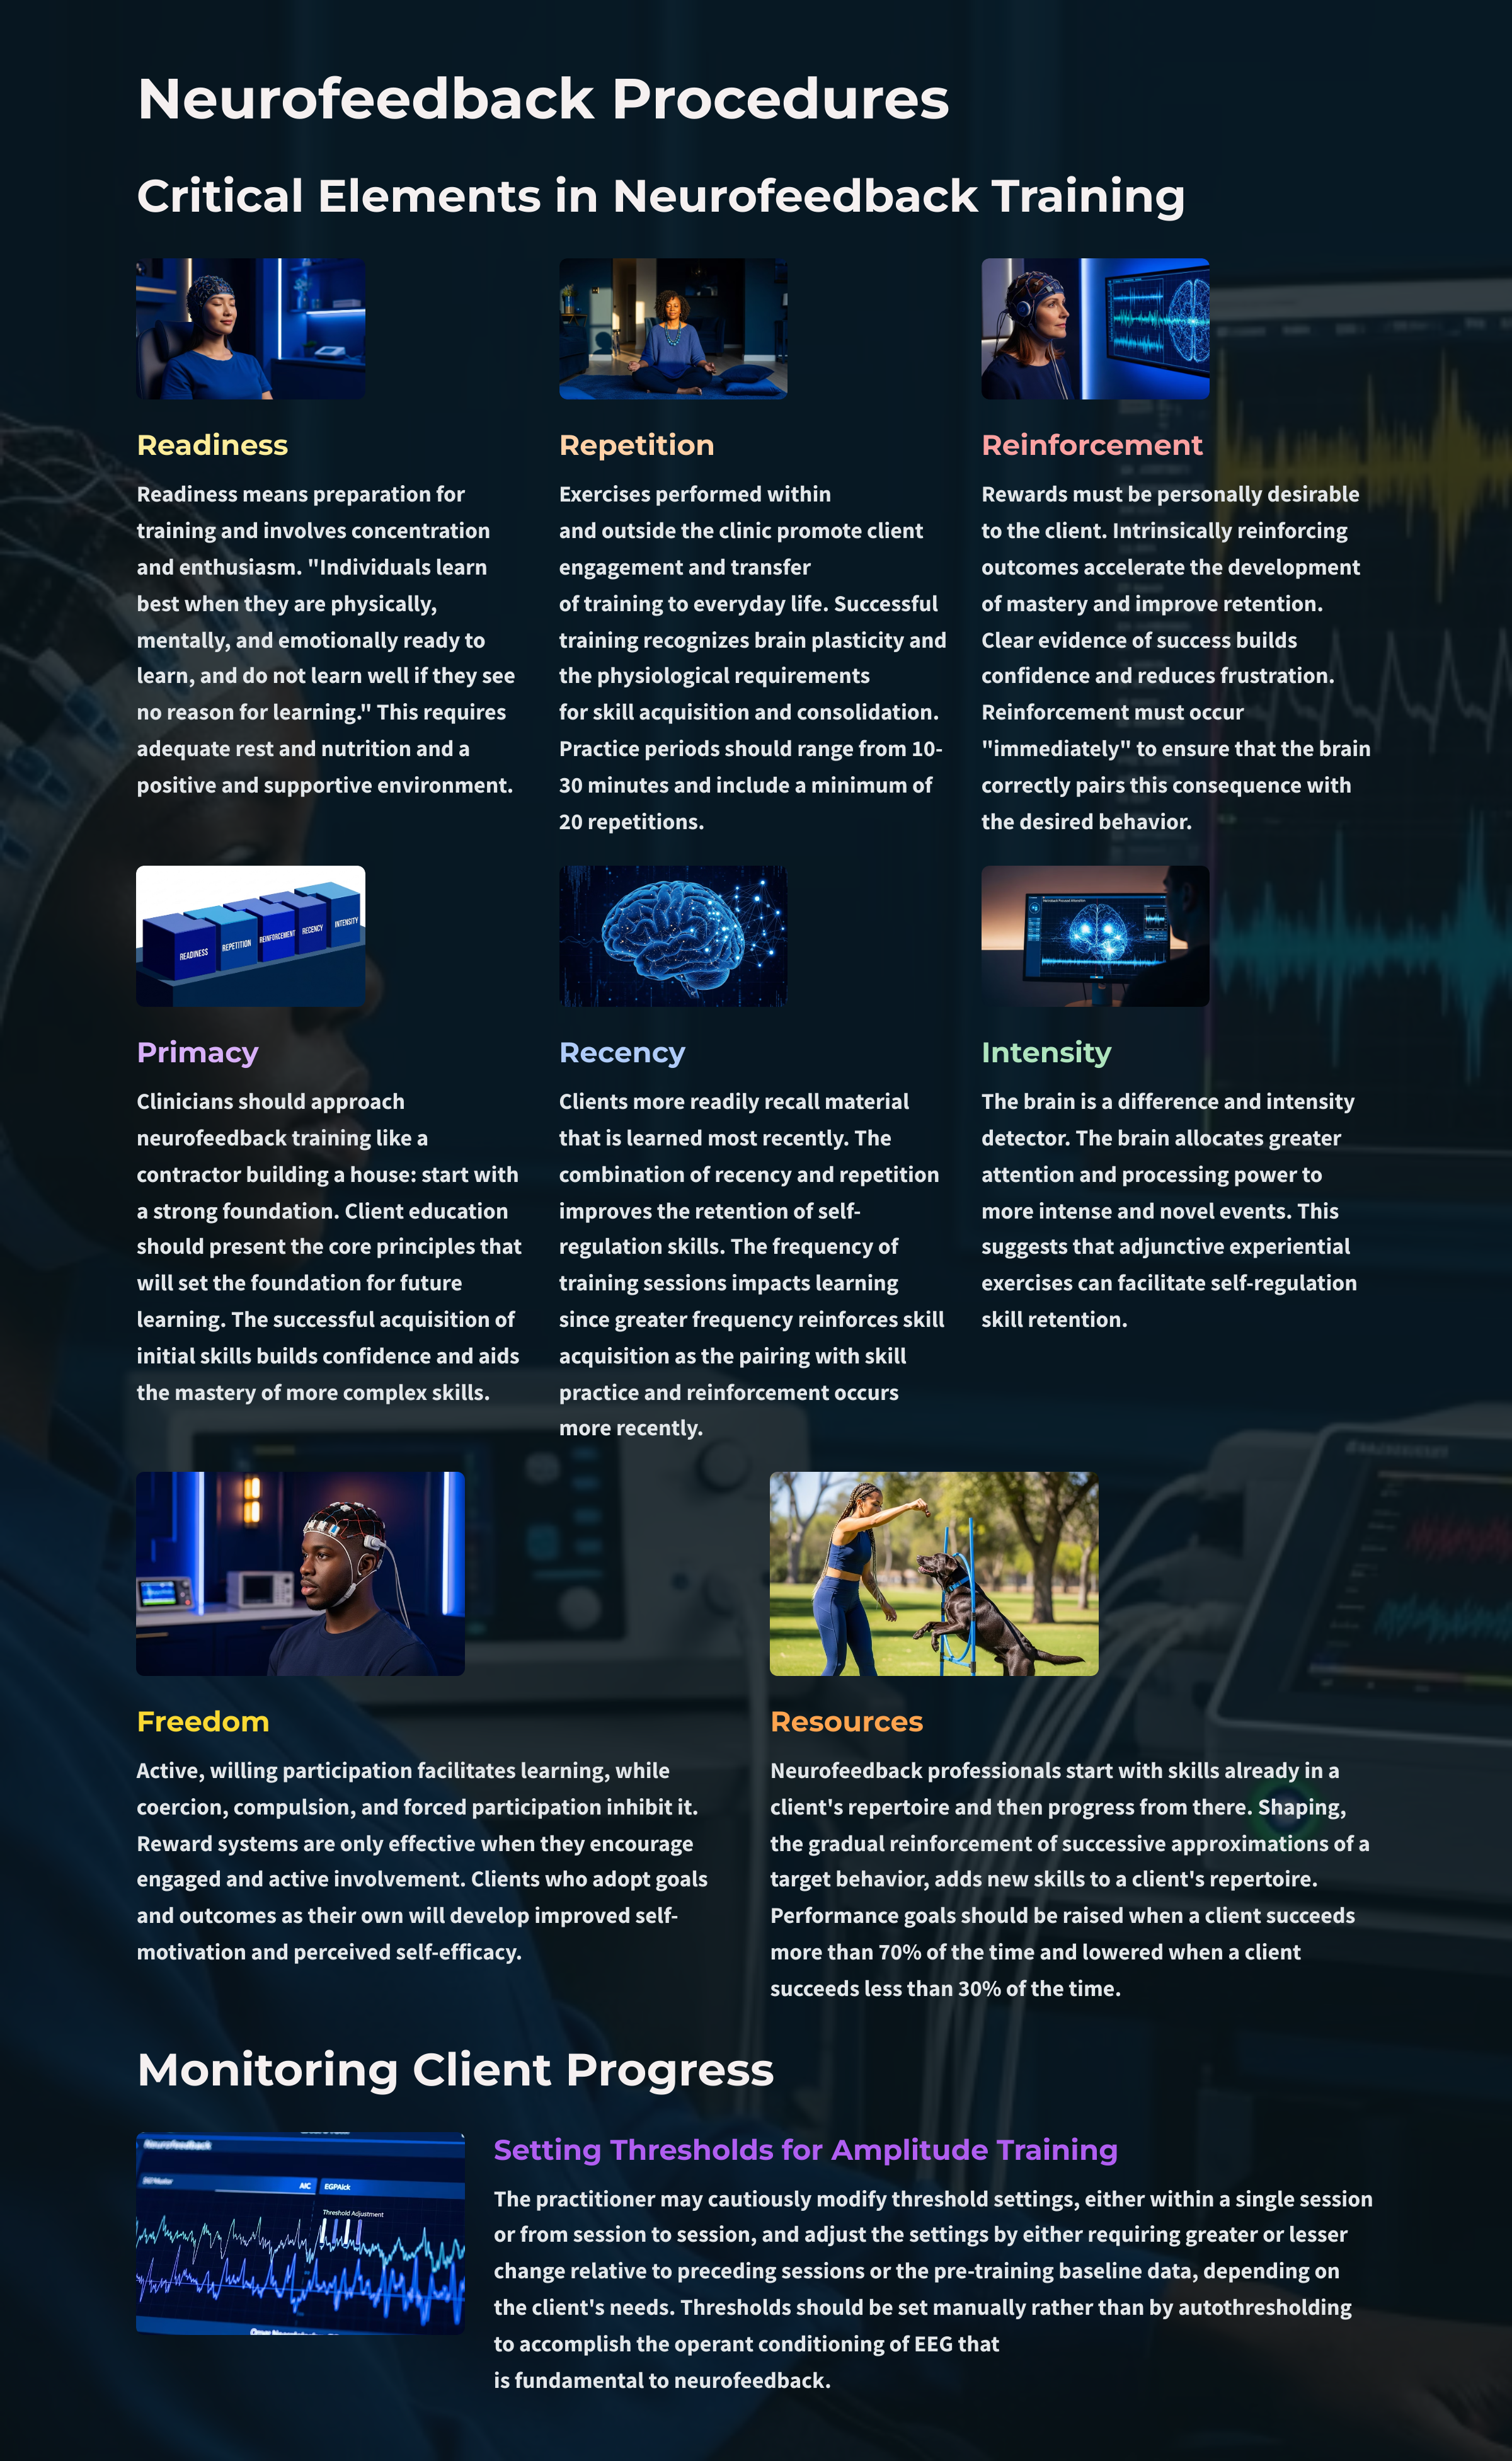
Critical Elements in Neurofeedback Training
Successful neurofeedback training incorporates readiness, repetition (exercise), reinforcement (effect), primacy, recency, intensity, freedom, and resources (requirement).
This requires adequate rest and nutrition and a positive and supportive environment. Client education that explains the training process clearly defines goals and outcomes and links training to personally relevant benefits enhances readiness.
In contrast, poor client motivation, lack of understanding of potential benefits, and biopsychosocial impediments can impair readiness.
Significant biopsychosocial constraints include a chaotic, disruptive, or traumatic environment, inadequate rest and nutrition, developmental delays, lack of resources, and traumatic brain injury or other medical problems.
Rewards must be personally desirable to the client. Clinicians can confirm this by observing the impact of reinforcers on engagement, motivation, and performance. Intrinsically reinforcing outcomes accelerate the development of mastery and improve retention. Clear evidence of success builds confidence and reduces frustration. Encouragement by staff and family is essential to sustain progress as a client experiences difficulty.
Sherlin et al. (2011) speculated that secondary reinforcement for achievement during neurofeedback (monetary rewards or points redeemed for a prize) might accelerate learning self-regulation skills. They cautioned that secondary reinforcement should be delivered for EEG changes and not simple attendance.
Reinforcement must occur "immediately" to ensure that the brain correctly pairs this consequence with the desired behavior that preceded it. Early studies determined that the optimal delay between an operant behavior and reinforcement is less than 250 to 350 ms (Felsinger & Gladstone, 1947; Grice, 1948). The faster the delivery of reinforcement following the desired behavior, the less time required for skill acquisition. This means that shorter EEG filter response times are better (Sherlin et al., 2011, p. 298),
Egner and Sterman (2006) cautioned that neurofeedback training "should stress exercise rather than entertainment" because complex games might prevent clients from linking brain responses to reinforcement due to distraction produced by more salient game stimuli.
Client education should present the core principles that will set the foundation for future learning. Like home construction, skill acquisition should proceed in a stepwise fashion that builds upon previous experience. The successful acquisition of initial skills builds confidence and aids the mastery of more complex skills.
Olton and Noonberg (1980) proposed that performance goals should be raised when a client succeeds more than 70% of the time and lowered when a client succeeds less than 30% of the time. Neurofeedback systems incorporate algorithms that automatically revise goals based on the client's performance (e.g., time above threshold) to maintain motivation and ensure sufficient challenge.
Selecting and Modifying Thresholds
Thresholds should be set manually rather than by autothresholding to accomplish the operant conditioning of EEG that is fundamental to neurofeedback.
When beginning the first session of neurofeedback with a client, the practitioner may want to conduct a pre-training baseline for that session. Before starting the feedback during the session, a minute or two of baseline EEG data can be collected by turning off the speakers and the secondary computer monitor that the client views.
If a computer with a single monitor is used, it can be turned away from the client and its speakers muted. The practitioner then instructs the client to sit quietly with relaxed attention with eyes either open or closed, depending on the condition that will be used during training. During the baseline, the practitioner can then adjust the threshold(s) by observing the conditions of the display instruments and the percentage of time they are on or off, and making appropriate adjustments to the thresholds of the reward and/or inhibit instruments so that the desired rate of feedback occurs. Thresholds that result in feedback being on between 50 and 75 percent of the time are often selected by practitioners. Some select a threshold closer to 50 percent, others closer to 75 percent, and others somewhere in between.
Setting the threshold so that feedback is on a higher percentage of the time may help to reduce difficulty in some clients for whom less frequent feedback is frustrating. On the other hand, a good teaching opportunity may be present with less frequent feedback if the client can learn to achieve a state that attentively observes when feedback occurs, and what correlates with it, instead of too effortfully trying to force the feedback to occur.
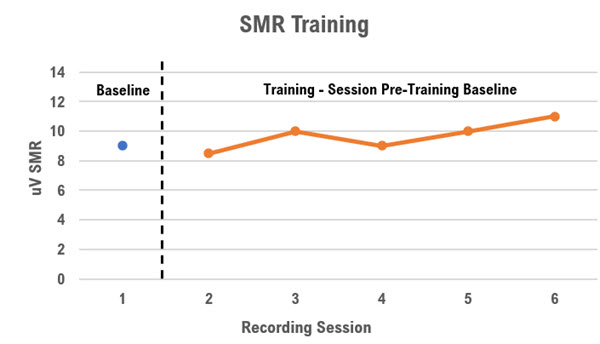
The caution with the threshold setting method that uses session pre-training baseline data is that the client may become more alert simply by viewing the feedback screen when it is finally enabled, resulting in a non-optimal rate of feedback. If this pattern is seen with a client during the first session or sessions, then the thresholds for the first few sessions can be set during the first minute in which the feedback is active. For sessions that follow, the same threshold that was in effect at the end of the previous session can be used.
The data from the session pre-training baseline can be saved for later artifacting and analysis, or even used for the quick calculation of values of relevant EEG variables based on unartifacted data so that they can be shown immediately to the client and then compared with values from training epochs, and with session post-training values at the end of the session.
Instructions to the client
After the session pre-training baseline and before starting the presentation of feedback, the practitioner can provide instructions that vary somewhat depending on the stage of neurofeedback training. For the first neurofeedback training session, a fairly non-directive instruction can be given, such as, “Let yourself be comfortably relaxed and notice when the feedback is on. If possible, notice what it’s like for you, what it feels like, when the feedback is on.” Somewhat more specific directions may be given to explain that the client should notice subjective qualities such as how active their thinking is, the content of thoughts, emotions, and physical sensations, as well as how these dimensions evolve during the training session.
In later stages of training, the client may have learned to identify more distinct subjective qualities associated with feedback being either on or off and strategies to voluntarily or consciously make those states occur. At that stage of training, the practitioner can, with greater success, begin to instruct the client to “make the feedback occur as much as possible.”
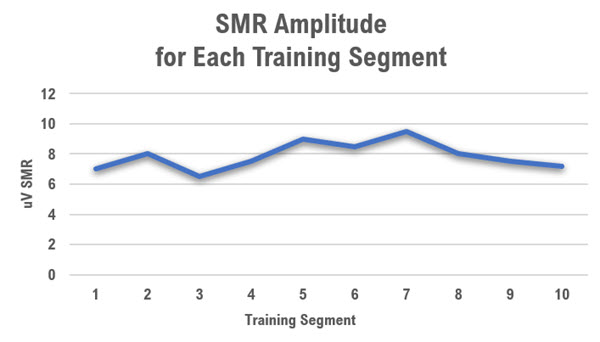
Training segments
Depending on the type of neurofeedback used, training in a session may occur in one continuous period or a series of briefer segments. For example, it is typical to provide feedback during one continuous period of 45 minutes or longer in deep states training. For many other applications, feedback may be presented as ten 3-minute segments with brief rest periods in between or in a series of segments of other durations.
Setting Thresholds for Amplitude Training
The practitioner may cautiously modify threshold settings, either within a single session or from session to session, and adjust the settings by either requiring greater or lesser change relative to preceding sessions or the pre-training baseline data, depending on the client's needs.
If a session begins with the threshold used at the end of the previous session, it may sometimes need to be adjusted if feedback occurs at too high or low a rate. In those cases, patience is encouraged to see how the client responds before making changes.
After a minute or two, or even a segment or two, the client may produce feedback that increases to the desired percentage if it had been low. Or, on the other hand, after a minute or two, the client’s cortical state may change so that feedback decreases from an overly high rate to one that offers more opportunity for learning to occur. However, the practitioner may choose to continue using the final settings of the preceding session, particularly if the previous consecutive series of sessions have used those threshold settings with reasonable success.
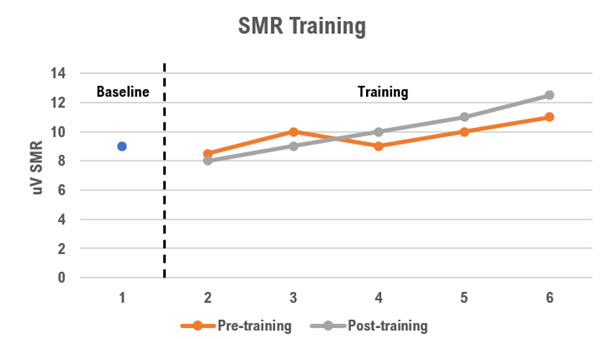
As the session proceeds, the rate of feedback may show a changing trend from segment to segment. If the amount of feedback gradually increases, it suggests that the brain is learning to function in a manner more consistent with the intention of the protocol (e.g., producing more SMR and less theta). This may raise the question of whether to change the threshold settings so that the rate of feedback remains the same as earlier in the session, that is, changing the thresholds to make training more difficult.
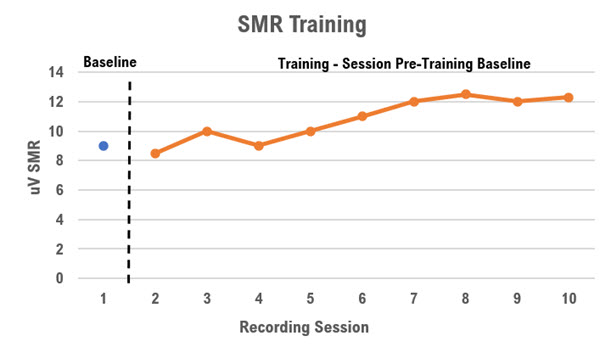
It may, however, be more in keeping with an operant conditioning principle of overlearning to keep the current thresholds so that improvement can be consolidated and more durable. However, if session-to-session trends quantitatively demonstrate that a high rate of feedback is achieved earlier and earlier within sessions or that session pre-training baseline data are improving, a better case for changing thresholds is made.
When considering whether to make thresholds more “strict” or setting thresholds to require more change from pre-training baseline values to produce feedback, the practitioner should follow the operant conditioning method of shaping by successive approximations (Cooper et al., 2019; Martin & Pear, 2019). However, the caution to bear in mind is to proceed slowly based on stable trends in the data. Failing to do may result in the schedule of reinforcement becoming too lean, resulting in performance deterioration. If performance does deteriorate and remains stable at a less desirable level, thresholds need to be revised to make them less “strict” so that more feedback is forthcoming.
In another scenario, a gradual decrease in the percentage of time receiving feedback may be seen from segment to segment, possibly due to the client becoming less and less able to sustain the state that produces feedback, suggesting that the client is fatiguing. Rather than change the thresholds, however, another strategy is to shorten the duration of the training segments, or reduce the number of segments for that session. What may then be seen is a gradual session-to-session improvement in the duration of segments showing achievement of feedback and a greater ability to sustain brain states that produce feedback for the entire session.
We cover thresholds in extensive detail in the Setting Thresholds in Amplitude Training section toward the end of the Therapeutic Relationship, Coaching, and Reinforcement Strategies unit.
Monitoring Client Progress
The preceding discussion rests on monitoring client progress within a single neurofeedback session. That is, during a session, the practitioner intermittently asks themselves the general question, “How is the client doing during today’s session?” The answer to the question is based on quantitative data (e.g., values of EEG variables as just discussed) and qualitative inspection of the EEG for changes in alpha, theta, or high beta production that may betoken increasing drowsiness, emotional distress, or physical discomfort. Direct observation of the client’s motor and verbal behavior through the session can also be revealing, for example, if the client appears more relaxed, alert, drowsy, or tense as the session progresses. Pauses between segments of neurofeedback training can be used to ask the client about their state and coach them in ways to address these developments.
The use of peripheral biofeedback monitoring, such as hand temperature, skin conductance or respiration, can also provide the practitioner and the client with response information identifying increased or decreased physiological arousal during the training session.
The practitioner should also ask the client about their experience when feedback has been sustained for a particularly long time, or similarly when feedback has not been forthcoming for a lengthy period. This inquiry can help the client discriminate internal subjective states and volitional efforts associated with either more or less feedback. With repetition, it may be possible for the client to begin making successful intentional efforts to produce more feedback and gradually do so for longer periods. Achieving this ability can serve the client by strengthening their ability to selectively apply in relevant situations (e.g., paying attention in a classroom).
As described at the beginning of this section, a recording form that the practitioner prepares before a session can be used not only to specify the montage for that session but also to record changes the client experiences in their own words so that these possibly idiosyncratic labels can be used to prompt the client’s return to the desired state in the future.
To interpret initial assessment and ongoing assessment data, a clinician should obtain a complete list of prescription drugs, over-the-counter supplements, and social drugs (including caffeine and nicotine). The practitioner should encourage clients to report medication changes to differentiate drug effects from training effects on the EEG, performance, and symptoms.
Take drug effects into account when interpreting your initial assessment battery and subsequent reassessment testing. Develop training goals based on initial testing with medication. Retest with the same medication unless it has been withdrawn to ensure a valid comparison.
Develop a personalized neurofeedback training strategy that does not attempt to train against a drug's principal effects on the EEG.
Gunkelman (2009) offered valuable context for understanding how drugs effect the EEG.
There is a generally reciprocal effect between alpha and beta, as brain stem stimulation desynchronizes the alpha generators, beta is seen. During states of under-arousal, this relationship is not seen, as when the subject is alerted, when both alpha and beta increase.
The point is that the arousal level changes the EEG responses expected, as when a stimulant
is given to an under-aroused subject, increasing alpha. In a normally aroused subject,
stimulants decrease alpha, and in an anxious (low voltage fast EEG variant) subject alpha will not be seen as changed by a stimulant.
Though there is a response stereotype for each medication, there are also individual
responses, which vary. Mixtures of medications become too complex to evaluate each
individual medication’s contribution, not to speak of synergistic effects not seen with any
single medication, which may be seen in polytherapy. (p. 1)
Medication and recreational drug considerations for monitoring client progress during neurofeedback sessions
A broad generalization is that there are large individual differences in medication effects and side effects concerning how psychoactive medications affect a unique individual’s EEG. Therefore, it isn't easy to arrive at an absolute description of how different doses of different medications reliably affect the EEG. For example, while the effects of barbiturates or alcohol on the EEG are fairly well understood, the dose that produces such effects may differ greatly between one person and another. However, it is important to know what possible consequences might be seen so that EEG patterns do not get misattributed to problems with the brain itself. An understanding of psychopharmacology is important to neurofeedback because drugs can affect a client's clinical presentation, EEG, assessment, and training success.
When monitoring client progress through a course of EEG training sessions, it can therefore be good practice to ask the client at the beginning of each session whether there has been any significant change to their medications or use of drugs and alcohol. If there has been, and the EEG during that session is not consistent with what has been seen during previous sessions or assessment. Further, suppose the inconsistent EEG signs are consistent with the changes reported by the client. In that case, the practitioner can speculate that those changes may be related to the changes in medication, drug, or alcohol use.
As Blume (2006) described, medication factors to consider include dose, method of administration, rate of metabolism, systemic effects, and genetic or epigenetic patient characteristics.
These observations may sometimes seem paradoxical (e.g., increased beta activity following a sedative such as a barbiturate), and it must be remembered that not all clients will show such effects.
For sessions when these medication effects seem likely, neurofeedback training effects may well be altered or even compromised. If the medication change is ongoing (e.g., the client’s physician has introduced an SSRI that the client intends to continue using), re-assessment after dosing and response to the medication has stabilized may be in order. The principle to follow is to make only one treatment change at a time and wait for any subsequent response to stabilize before introducing a second treatment change.
Another important principle to follow is supporting client autonomy, particularly acting only with the client’s informed consent. The practitioner must be clear about their scope of practice and limitations to their knowledge and skills concerning medications. The practitioner should not make absolute conclusions about medication effects and medication management unless they are licensed to do so.
However, it is appropriate to discuss with clients the possibility that medications they are taking may have a different effect or magnitude of effect than had been the case before neurofeedback training began. If this develops, then the practitioner can encourage the client to report the changes to their prescribing physician so that the client and physician can consider possible adjustments to the medication regimen.
In the interest of good client care, it can be more than a simple courtesy for the neurofeedback provider to communicate with the client’s health care providers. Neurofeedback professionals can contact these providers before initiating neurofeedback. This ensures that those providers will be better prepared to talk with the client about medication adjustments when needed. Also, sharing pre-training assessment information with the client’s health care providers may suggest improvements to the client’s medication regimen and alert the prescribing physician to the possibility that a good response to neurofeedback may set the stage for safe reduction of some medication.
Concerning the occasional use of alcohol or drug use that appears to be producing EEG changes for a training session, the practitioner is wise to defer the session until the likely EEG effects have subsided.
Drugs can rapidly affect the EEG
A single dose of a prescription psychotropic drug can markedly change the EEG within 1-3 hours of administration. Families of psychotropic drugs that share therapeutic equivalence (e.g., chlorpromazine-like neuroleptics and haloperidol-like neuroleptics) produce similar systematic EEG changes (Knott, 2000). A drug's plasma level, which depends on the dose, distribution volume, and metabolism, influences the magnitude of EEG alterations, which should be symmetrical and often widespread.
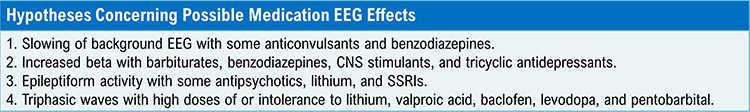
Common EEG changes include a slowing of background activity, increased beta activity, epileptiform activity, triphasic waves, and widespread delta and increased theta activity (Blume, 2006).
An overview of the drugs covered in this section
We will summarize the effects of Antidepressants, Antipsychotics, Benzodiazepines, CNS Stimulants, Mood Stabilizers, Opioid Analgesics, and Recreational Drugs on the EEG.
Antidepressants
Tricyclic Antidepressants (TCAs)
Sedating TCAs like amitriptyline (Elavil) and imipramine (Tofranil) increase theta and fast-beta power and decrease alpha and total power (Knott, 2000; Saletu, 2010; Thompson & Thompson, 2015). However, nonsedating TCAs that resemble desipramine (Norpramin) increase alpha and fast beta (Knott, 2000).
At higher doses, sedating TCAs can increase delta and widespread theta power (Bauer & Bauer, 2005; Van Cott & Brenner, 2003).
TCAs can cause asynchronous slow waves and increase sleep spindles (Thompson & Thompson, 2015). TCAs and SSRIs can provoke spikes or polyspikes. Excessive TCA doses
can increase delta and theta power, where theta appears diffusely (Blume, 2006).
Monoamine Oxidase Inhibitors (MAOIs)
The nonselective, irreversible MAO inhibitor iproniazid (Marsalid) increases theta to a smaller degree than amitryptiline (Elavil), while it increases fast-beta power to a greater degree. MAO inhibitors like isocarboxazid (Marplan) increase 20-30 Hz power while decreasing power in slower and high frequencies like CNS stimulants (Thompson & Thompson, 2015).
Serotonin Selective Reuptake Inhibitors (SSRIs)
The SSRIs fluoxetine (Prozac), paroxetine HCl (Paxil), and sertraline HCl (Zoloft) modestly increase 18-25 Hz frontocentral beta and decrease anterior alpha power (Thompson & Thompson, 2015).
The nonsedating SSRI citalopram (Celexa) decreases total, delta, theta, and alpha power, while it increases beta power (Bauer & Bauer, 2005; Saletu, 2010; Van Cott & Brenner, 2003).
High SSRI doses may produce bisynchronous spikes or polyspikes. Serotonin syndrome is associated with triphasic waves, which signal toxic encephalopathy (Blume, 2006).
Antipsychotics
All FGAs do not produce identical EEG changes. Chlorpromazine (Thorazine), a sedating FGA, increases EEG coherence, reduces total power, increases delta and theta power, and reduces alpha and beta power. FGAs may slow the peak alpha frequency and produce synchronous slow-wave activity.
Chlorpromazine can increase sharp theta transients at frontal and temporal sites. Chlorpromazine can significantly slow the posterior dominant rhythm (PDR) (Demos, 2019). The attenuation of alpha blocking in response to sensory stimuli may be associated with memory deficits produced by this drug (Saletu, 2010; Thompson & Thompson, 2015). High phenothiazine doses may produce bisynchronous spikes or polyspikes (Blume, 2006).
Haloperidol (Haldol), a nonsedating FGA, does not affect total power, increases delta and theta power, modestly decreases alpha power, and increases beta power (Saletu, 2010).
Excessive doses of the SGA clozapine
can increase delta and theta power, where theta appears diffusely (Blume, 2006).
Where dopamine receptor hypersensitivity produces extrapyramidal side effects like tardive dyskinesia, FGAs may cause extended trains of mixed fast/sharp transients, EEG slowing, and potentiation of latent epileptiform activity (J. Gunkelman cited by Thompson & Thompson, 2015).
Benzodiazepines
Benzodiazepines do not increase delta or theta power. They reduce alpha and increase beta power, especially over 20 Hz. They can reduce the PDR (Demos, 2019).
Benzodiazepines may increase spindling beta and inhibit epileptiform activity (Advokat et al., 2019; Bauer & Bauer, 2005; Blume, 2006; Knott, 2000; Thompson & Thompson, 2015; Van Cott & Brenner, 2003).
CNS stimulants
Amphetamine (Adderall) reduces total power and reduces absolute delta, theta, alpha, and beta power (Saletu, 2010). Methylphenidate (Ritalin) reduces delta and theta power, increasing posterior alpha and low beta power up to 6 hours following drug administration (Blume, 2006; Thompson & Thompson, 2015).
A client's level of arousal modulates the EEG response to a CNS stimulant. Stimulants increase alpha power in under-aroused, decrease alpha power in typically aroused, and do not alter alpha in anxious (fast-EEG) clients (G. Gunkelman cited by Thompson & Thompson, 2015).
Mood stabilizers
Phenobarbital can induce rhythmic 18-26 Hz activity that starts in the frontal lobe and can progressively extend to the whole cortex. Progressively higher doses promote EEG slowing and reduced beta activity until slow-wave activity eclipses beta activity. Voltage can decrease until the brain enters an iso-electric state as in a medically induced coma (Blume, 2006; Thompson & Thompson, 2015). Barbiturate withdrawal may increase beta activity. Pentobarbital intoxication can result in triphasic waves.
In general, antiepileptic drug reduction may increase the frequency of focal spikes or spike waves (Blume, 2006). Lithium can cause generalized asynchronous slowing that includes a reduction in the peak alpha frequency. Lithium may increase theta and beta power and greatly potentiate latent epileptiform activity. High lithium doses may produce bisynchronous spikes or polyspikes
and increase delta and theta power, where theta appears diffusely (Blume, 2006). Lithium toxicity dramatically slows the EEG and causes triphasic discharges (Thompson & Thompson, 2015).
Neurotoxicity caused by high levels of antiepileptic drugs may cause diffuse delta and increased theta power. Valproic acid intoxication can produce triphasic waves (Blume, 2006).
Opioid analgesics
Immediately after morphine administration, during the euphoric high, alpha power increases, and the peak alpha frequency slows. Delta and theta power may increase along with the time spent in REM sleep. Increasing the dose causes EEG slowing and may progress to an iso-electric brain as in a barbiturate-induced coma (Thompson & Thompson, 2015).
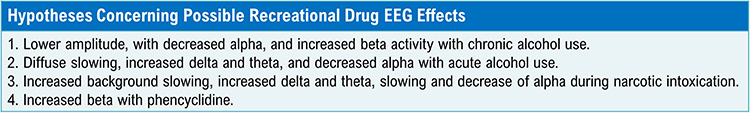
Recreational Drugs
Caffeine
Caffeine acutely reduces theta and alpha power with rebound increases in these bands (Thompson & Thompson, 2015).
Cannabis
Cannabis acutely increases frontal alpha and chronically promotes frontal interhemispheric connectivity (hypercoherence and phase synchrony) (Thompson & Thompson, 2015).
Cocaine
Cocaine decreases delta and theta and increases alpha and beta power (Bauer & Bauer, 2005; Herning et al., 1985). The cortical distribution of beta power is frontal and central, resembling the effects of barbiturates and benzodiazepines (Herning et al., 1994).
Ethanol
Ethanol acutely increases theta and low-alpha power and decreases beta power above 20 Hz. Individuals diagnosed with alcohol use disorder or who are vulnerable to developing this disorder frequently present with elevated beta (> 20 Hz and between 24-26 Hz) and decreased 6-10 Hz and alpha power (Thompson & Thompson, 2015). Alcohol withdrawal may increase beta activity and spikes and polyspikes (Blume, 2006).
Nicotine
Like caffeine, nicotine acutely reduces theta and alpha power with rebound increases in these bands (Thompson & Thompson, 2015).
Recommended medication management approaches
Discuss the scope and limitations of your professional license and your ability to address medication issues. Review your client's plans regarding medication.
Continue current prescriptions? If not, have they consulted with their prescribing physician?
Decrease or eliminate current medications? Your client's best choice is to discuss medication adjustment with the prescribing physician. If they wish to proceed without physician consultation, explain your limitations and ethical concerns about proceeding with neurofeedback training under these circumstances.
Medications often need to be adjusted due to the effects of training. The clinician or client must interact with the prescribing physician regarding these changes. As neurofeedback changes brain function and structure, medications may need to be titrated or withdrawn. Standardized psychological (Beck Depression Inventory) and performance (Computerized Continuous Performance Test) instruments may help inform the physician's decision.
Wherever possible, involve your client in this process since physicians may not welcome your involvement in medication decisions, and clients may find it easier to interact with the prescribing physician when given accurate information.
Neurofeedback contraindications
Paul Swingle (2015) astutely warned:
Not every individual or family is ready for EEG neurofeedback training. It may be contraindicated due to the nature of the disorder or the limits of the treatment facility. During the initial interview (before qEEG analysis), it is essential to continue to assess clients’ readiness to undergo the training process. They must have the time and the finances to complete the training process. Also, it is essential to determine if the clients have Axis II disorders. If the initial interview has revealed a pattern of interpersonal problems, biofeedback training may be contraindicated. Dialectical behavior therapy may be the first place to start treatment (Linehan, 1993). Neurofeedback training will not magically undo the covert nature of transference, countertransference, splitting, or distrust (Demos, 1995). Neither will the risk of suicidality, self-harm, or explosive anger melt away with biofeedback training. (p. 273)
Neurofeedback training may be contraindicated for those with severe learning disorders, psychotic behaviors, or mental deficits. The appropriate candidate must be able to learn a new skill in a relatively healthy and supportive environment. If you are a new provider, some problems will be over your head. Consult with your supervisor (mentor) and jointly determine if you are ready to take on a new challenge. (p. 275)
The following are conditions and issues that may be viewed as contraindications for neurofeedback training.
Recent stroke, TBI, or other brain trauma
This caution is speculative and is not informed by actual research findings. However, independent measurements with hemoencephalography (HEG) show that brain training generally increases blood flow and oxygenation to the areas trained (Toomin et al., 2008). Suppose a potential client has recently experienced a hemorrhagic stroke or an impact or acceleration/deceleration trauma to the brain tissue. In that case, it may be prudent to avoid potentially exacerbating the damage by delaying neurofeedback training. Then the question becomes, how long is long enough, and for that answer, a consultation with the potential client’s physician is recommended. Conversely, beginning training as soon as is prudent may enhance the recovery process and encourage further healing.
Childhood attention disorders, behavioral disorders, and trauma
Children diagnosed with attention deficit disorder (ADHD), oppositional defiant disorder (ODD), and other conditions have been shown to respond readily to neurofeedback training. In fact, the efficacy of neurofeedback training for ADHD is the most extensively studied application of neurofeedback training to date, and there are numerous published studies (Arns et al., 2009; Van Doren et al., 2019). However, one of the leading researchers, Joel Lubar, has suggested that family therapy interventions are essential for successfully resolving the client’s ADHD condition (Lubar, 1995; Swingle, 2008).
Therefore, if a family of an ADHD child is not willing and/or able to participate in family therapy, it may be counterproductive to train the child alone. This can also be extrapolated to other childhood behavioral conditions.
Similarly, childhood disorders of attentional and behavioral regulation often respond well to various interventions such as occupational therapy, vision therapy, and more (New Visions School Annual Reports, 1992-1998). Therefore, a comprehensive intervention strategy may be best rather than simply providing neurofeedback alone.
Emotional and physical trauma
Individuals who have experienced emotional or physical trauma, are in abusive relationships, are experiencing racism, gender identity, or other types of discrimination, and those experiencing a toxic work environment may need additional types of support and protection. Before initiating neurofeedback training, these issues should be addressed to ensure that such training is effective and not simply masking these consequences.
Dementia
Dementia is a progressive decline in cognitive ability that is accompanied to a greater or lesser extent by changes in emotional and behavioral functioning. Various dementias can be characterized as having prodromal, early, middle, and late stages. The delivery of neurofeedback may be most beneficial during the prodromal and early stages due to the client’s better ability to consistently cooperate with the practitioner and sustain attention to the feedback stimuli.
Severe mental illness
Some diagnosable mental illnesses are so severe that they may preclude the client from paying sufficient attention to the feedback stimuli. Examples include schizophrenia and bipolar disorder, whose symptoms have not responded yet to treatment. In such cases, the neurofeedback provider can collaborate with other treatment providers to deliver training during intervals when the mental illness has abated. As discussed below, some mental illnesses also show exacerbation and remission patterns that may constitute a significant instability. Although training might best be deferred during exacerbation of the illness, neurofeedback may be effectively delivered during a period of remission.
Significant instabilities
It is best to conduct neurofeedback when the client is in what could be called a steady state when they and the world around them are not already changing in a significantly problematic direction. For example, if a client is rapidly declining because of a physical or mental condition, or if their life is suffering from a major upheaval in social or material resources, it may be wise to postpone training. Also, it may be best to defer training when the client and their world have significant variability in their conditions, that is, major “ups and downs” in their mental or emotional condition, or multiple unpredictable disruptions in their social, work or living circumstances. Instead, the neurofeedback provider may consider that a better response to neurofeedback is likely once this variability has decreased.
Sometimes, however, a client may not be in a steady non-changing state but rather already showing improvements before introducing neurofeedback. In that case, although the client’s condition is not stable in the sense of showing no changing trend, the delivery of neurofeedback may proceed nonetheless because it may accelerate or add an increment of benefit to whatever is already leading to the client’s improvement. Nevertheless, ethical considerations suggest that the practitioner review the already improving trend with the client before beginning neurofeedback. A pause allows the client to choose whether to wait and see if the already improving trend achieves all their goals or if there are remaining issues that can still be addressed with neurofeedback.
Cautions
Paul Swingle (2014) outlined interpersonal (e.g., trauma survivers) and interventional cautions (e.g., relaxation-induced anxiety) that could rise to the level of contraindications. Below are two clinical pearls from his excellent Adding neurofeedback to your practice: Clinician’s guide to ClinicalQ, neurofeedback, and braindriving:
If the prescribing physician frequently changes medication type and dosage, it will likely sabotage training. Once a new medication has been started, it takes 3–6 weeks to become fully active. If EEG neurofeedback is started immediately, the results are questionable. What is causing changes for the better or worse? Is it the medication? Is it the training? Or is it a combination of the two?
Never train an artifact: An entire training session can be in vain if muscle tension or eye movements are skewing the EEG. Z-score training targets can shift from normalizing real EEG component Z-scores to artifact reduction. Excessive artifacts often have the highest power Z-scores, and sEMG often lowers Z-score coherence—be watchful of electrodes near the temporomandibular region (T3, T4, F7, and F8). The raw EEG must be reviewed before training begins. Note that some artifact is normal—perfection is not possible. (p. 277)
Adverse effects
Intermittent assessment of how the client is progressing during the session also provides an opportunity to detect any unwanted side-effects of training such as sedation, overarousal, headache, or excessive muscle tension. Once seen, these side-effects can then be addressed and minimized to not interfere with training success and persist beyond the training session.
Please see the Cautions section in the Alpha-Theta unit for a detailed discussion of negative reactions to A-T training.
The occurrence of adverse effects is a phenomenon about which the practitioner should be vigilant, the ethical principle being nonmaleficence, that is, to do no harm. The types of adverse effects that have been reported include excessive arousal, excessive sedation, anxiety or irritability, headache, and emotional abreaction (Hammond, 2011).
Although consensus suggests that unwanted side-effects are probably mild, infrequent, and brief (cf. Luctkar-Flude & Groll, 2015), neurofeedback providers disagree about the risk of adverse effects. This may, to some extent, be due to differing training protocols having differing risks, the use of various protocols by different providers, and the client sample seen by various practitioners and researchers (e.g., Rogel et al., 2015). However, adverse effects may be prolonged unless you adjust the training protocol used when they appeared.
A relevant question is how adverse effects become apparent. During a client’s initial assessment, the practitioner can inquire about whether the client has ever experienced an adverse effect from any treatment or inquire about the client’s level of sensitivity to their environment. The client’s general level of sensitivity, or even experience of adverse effects in response to previous neurofeedback training, informs the practitioner about steps to prevent their recurrence.
After training has begun, however, the practitioner should remain alert to EEG or psychophysiological signs, behavioral indicators, and client statements that may suggest an adverse reaction. With respect to EEG signs, a pattern of excessive high-beta or excessive low-frequency activity may reflect excessive arousal or sedation, respectively.
If the practitioner monitors peripheral psychophysiological states, then adverse reactions may be signaled by marked changes in EMG, skin temperature, skin conductance, breathing pattern, heart rate or HRV, or some combination of these variables.
Behavioral indicators include changes in motor behavior, for example, shown by the client moving more slowly or unsteadily, or more quickly and abruptly. The client’s verbal behavior may also suggest an adverse effect if their speech production markedly declines or accelerates, becomes softer or louder, or begins to include content that suggests the experience of strong emotions (e.g., feeling anxious or depressed), untoward cognitive changes (e.g., grogginess, racing thoughts), physical experiences (e.g., unsteadiness), or behavioral associations (e.g., ideas about going to bed, pursuing an argument, engaging in harmful activities).
Regardless of response modality (physiological, behavioral, verbal, cognitive), the practitioner is wise to immediately follow up by asking the client about their current condition to ascertain whether they have just experienced a change for the worse and if the change followed the introduction of neurofeedback.
If the client has just experienced a change for the worse, it is sometimes difficult to determine whether or not to attribute the shift to neurofeedback training per se. Doing so may require the emergence of a pattern of such adverse effects over a series of sessions. However, the practitioner can inquire about what attribution the client has made regarding the reason for the adverse effect’s occurrence and what might help to alleviate it. Sometimes, determining whether a side effect is due to neurofeedback is difficult because the effect may be delayed until after the neurofeedback session.
Some clients may be more likely to experience adverse effects. They appear to be more sensitive or reactive to persons, places, and things (Matthews, 2007). One type of sensitivity may be seen among clients with some kinds of emotional disorders. These include severe anxiety and PTSD, dissociative identity disorder or personality disorder, and severe mental illness such as bipolar disorder and schizophrenia.
Rogel et al. (2015), in a study with healthy volunteers, found that side-effects occurred even in this group of normal undergraduates, with more side-effects seen among those who received SMR feedback than those who received upper alpha feedback, with the latter group showing about the same level of side-effects as the sham-control group. Rogel et al. (2015) concluded that side-effects are not uncommon. However, compare Thompson and Thompson (2015) who reported not seeing any side-effects in their large practice. Rogel et al. (2015) recommended that practitioners use signed informed consent, ask clients about the occurrence of side-effects, and document client reports of side effects.
Protocol characteristics may be associated with adverse effects, as reviewed by Rogel et al. (2015). Symptoms related to ADHD may be worsened by training that increases theta (Lubar & Shouse, 1976). Epileptiform activity may be increased if a protocol trains theta increases and SMR decreases (Lubar et al., 1981). Protocols that increase power may be more likely to be associated with undesirable results (Hammond, 2008), and excessively long training sessions may be associated with side effects (Matthews, 2007).
Deep state training in which feedback rewards lower frequencies at occipital or parietal sites may also be related to emotional states that require urgent attention (Martins-Mourao & Kerson, 2016). These authors recommend that practitioners who provide alpha/theta training be competent in providing treatment for abreactions and formulate an emergency plan ahead of time to take efficient steps to minimize the abreaction, if necessary.
Prevention of adverse effects is an important goal. Given the above discussion, downtraining EEG bands may be a useful initial neurofeedback protocol. Following downtraining, you can introduce protocols that reinforce frequency bands. Consider preliminary peripheral biofeedback training before introducing EEG biofeedback. Beginning neurofeedback when the client’s condition and circumstances are reasonably stable is another preventive strategy. To avoid premature overtraining, gradually increase the duration of training segments or training sessions. Using common protocols that initially focus on SMR along the sensorimotor strip or occipital alpha training before providing feedback for upper theta rhythms may reduce the risk of side effects. Z-score training is also an approach that trains EEG value toward the normal range, suggesting that side effects may be avoided.
If adverse effects do appear to occur, several strategies can be considered. The first is to interview the client about the side-effects, that is, what exactly they are, when exactly they began to appear, if they are similar at all to experiences that have been occurring outside the training session, and what factors seem associated with those experiences, if they have been occurring.
Based on information from interviewing the client, changes to the neurofeedback protocol may be considered. These include adjusting features of the protocol implementation such as duration of training segments, total session length, rate of feedback (e.g., making feedback more or less frequent), or type of feedback (e.g., eyes closed vs. eyes open, or specific quality of visual or auditory feedback). The protocol itself may also be changed, for example, from one that reinforces amplitude to one that downtrains amplitude, from a conventional amplitude protocol to a z-score protocol, or from a protocol that provides feedback for typical EEG bands to one that is based on slow cortical potentials.
A principle inherent in the above discussion is to avoid treating a condition for which the practitioner is not trained or supervised. Lacking such experience or supervision risks missing adverse effects, unnecessarily misattributing side-effects to neurofeedback, and managing side-effects less than optimally if they do occur.
Reading/interpreting session reports/graphs
For some clients it can be helpful to generate statistics for EEG variables at the end of each training segment. Most software easily does this and can be copied and pasted to an Excel file before continuing to the next training segment. The data can also be saved for later artifacting and graphing of more accurate data if necessary. If the practitioner plans to do this, it is helpful to build an Excel graphic template in advance. This will allow the practitioner to paste data from session trials, automatically adding a new data point to the graph. The practitioner can then use unartifacted data to show the client how their performance is changing from segment to segment quantitatively. The graph can easily communicate information about their within-session progress.
Concluding a Session
A neurofeedback session typically concludes with several steps, some occurring with the client present and some occurring after the client leaves.
With the Client Present
Session post-training baseline EEG
Some practitioners may want to collect session post-training baseline data to compare with the pre-training data collected at the start of the session. The rationale for doing so might be to investigate whether EEG values have changed in a desirable direction from the beginning to the end of the session. If these data are collected, they allow the practitioner to graph session-to-session trends in both session pre-training and post-training baselines, as well as change scores (i.e., the difference between pre-training and post-training values).
Removing electrodes
The practitioner removes the electrodes and can use a facial tissue or cotton ball with a small quantity of isopropyl alcohol to remove residual electrode paste. Subsequently, the client may want to arrange their hair or put jewelry back on, either in the training room or an adjacent bathroom.
Debriefing
It can be helpful for the practitioner to ask the client open-ended questions about their experience of the session, following up with more specific questions as necessary to clarify useful information.
Home practice instructions
The client may be given tasks to complete before the next training session. These may include self-monitoring of states of emotion, cognition, somatic experience, and specific behaviors in specific situations. Homework may also include the practice of tasks that supplement neurofeedback. This latter may include using biofeedback devices (e.g., HRV, temperature, skin conductance, respiration), mindfulness meditation, the voluntary practice of states achieved during neurofeedback in particular situations, or supplementary electronic devices (e.g., AVE stimulation, micro-electrical stimulation).
HRV biofeedback practice
Portable HRV biofeedback devices like the Institute of HeartMath's Inner Balance allow personal training whenever your clients want.
Apps like Elite HRV allow you to take HRV snapshots with limited artifact correction.
Temperature biofeedback practice
Encourage your clients to monitor their hand temperature using inexpensive alcohol thermometers to see whether their practice resulted in warming or cooling.
Rating scales and questionnaires
Before the client leaves, the practitioner may ask them to quantify various aspects of their post-training state using rating scales developed for the individual client, standardized rating scales, or brief standardized questionnaires.
After the Client Leaves
Clean-up
Electrodes and desk surfaces should be cleaned as soon as possible following a session for the sake of infection control. Depending on the office, it may be wise to store equipment in a location where it is safe from damage.
Documenting the session
Documentation as soon as possible after a session is recommended. The amount may be relatively modest if the practitioner has already written notes on the form they prepared before the session. On the other hand, the practitioner may want to elaborate entries on the form or enter notes into a word processing file. In addition to detailed session notes, it can also be very helpful to have a table that shows the dates on which the series of neurofeedback training sessions took place, along with the montage(s) used.
Post-session artifacting
Depending on the level of detail the practitioner wants and the data collected during the just-completed session, there will be session pre-training baseline data, data from multiple training segments, and session post-training baseline data to artifact. After removing artifacts and saving the now-artifacted data file, the practitioner can generate accurate statistics that s/he can copy and paste into an Excel file.
The resulting data then produce graphs whose visual inspection can efficiently show how the client responds to training. These graphs will then be ready to review with the client at the next session and available for inclusion in any later written report of training for the client, their healthcare provider, or insurer.
Reading and Interpreting Session Graphs
Introduction
An essential principle to follow when providing neurofeedback is to do so in a way that is based on quantitative data. In the clinical application of neurofeedback, that quantitative data, as reviewed elsewhere in Neurofeedback Tutor, comes from various sources, not the least of which is the client’s EEG results. Those results are seen in data from initial assessment, training sessions, end-of-training recordings, and possibly follow-up data. This section will present basic information regarding the graphic representation, visual inspection, and interpretation of session graphs to identify possible beneficial or harmful responses to training or the absence of training success. The construction and interpretation of graphs of various types is central to decision-making in neurofeedback training. This discussion is based largely on Copper, Heron, and Heward’s (2020) applied behavior analysis text.
Baseline logic
In addition to information valuable for deciding which training protocol to select, initial EEG assessment provides a pre-training baseline against which EEG values during and after training can be evaluated. Usually, however, these initial assessment data represent only one data point rather than a series of baseline values. Although rarely discussed by neurofeedback providers, this can be problematic because having only one data point does not provide the opportunity to see whether the baseline data are stable or show an increasing or decreasing trend. Neither is it possible with one data point to verify that the initial EEG assessment data are variable or not.
Figure 1 shows three hypothetical initial assessment baseline points that show a possibly increasing trend with significant variability. The interpretation might be that the pre-training data are unstable and suggest that improvement might continue even without neurofeedback training. However, in the presence of variability alone, interpretation of subsequent data trends may be limited because the initial variability suggests that some uncontrolled factor influences the baseline data and may account for data seen during training apart from the neurofeedback itself.
Because the clinical practice of neurofeedback, as contrasted with the experimental investigation of neurofeedback, rarely allows for more than a single initial pre-training assessment, the assumption is usually made that the data from initial assessment are stable and not unduly variable. The practitioner assumes that the initial EEG assessment can serve as a benchmark or valid baseline against which data from training can be inspected. However, the lesson in the preceding discussion is to exert a degree of caution in the interpretation of changes seen during neurofeedback when there is only one baseline data point. With that caveat, the inspection of training versus baseline data allows for the understanding of data changes from which conclusions are made regarding whether the training is having any effect.
Session data
Session data should be based on EEG variables that are the same as those of importance during the initial baseline assessment. That is, apples should be compared to apples rather than oranges; average SMR amplitude from baseline should be compared to average SMR amplitude from training sessions, for example.
When to collect session data
An important consideration is when to save EEG data during training sessions. For instance, for any given session EEG data can be collected, saved, and graphed from a pre-training baseline period, training periods or segments, or post-training baseline period. Data collected during training sessions may be before beginning feedback, during periods of feedback, and after the feedback conclusion.
Pre-training baseline session data
Most often, if practitioners graph and save data from training sessions, they do so from a pre-training baseline. This has the advantage of allowing the practitioner and client to answer two questions. The first question is whether neurofeedback training is producing a stable change in EEG values, which is a core objective of neurofeedback training. Data from session training periods and post-training baseline answer this question less well because in the first instance training is in the process of perturbing the client’s EEG, and in the second instance, insufficient time has elapsed after training to determine whether any change in EEG is stable. The second question involves setting thresholds for a given session; a topic discussed elsewhere Neurofeedback Tutor.
Figure 2 represents hypothetical data in which session pre-training baseline data show a trend of increasing SMR amplitude and SMR values higher than those seen in the baseline assessment data collected during the initial assessment. Therefore, visual inspection of the graph may lead to the interpretation that neurofeedback is causing the production of SMR to increase relative to values seen during the initial assessment.
If pre-training EEG data are collected during a training session, the question arises of whether one should collect such data for every session. The advantage of collecting pre-training data for each session is that it can identify variability and trends in more detail. For example, factors that cause variability (e.g., inconsistent sleep) might be minimized. Saving and analyzing data from each session comes at the cost of perhaps 2 minutes of data collection, and then the subsequent time to artifact and graph the data. In fact, with practice, these steps become very efficient and brief. However, if the practitioner collects pre-training session data for only a sample of sessions, it is probably best to do so at equal intervals, for example, every other session or every fifth session.
Data from training periods within a session
Various software platforms make it easy to generate data for EEG variables either before, during, or after training during a session. Therefore, during a session with the client, it is easy to generate unartifacted data that can be immediately copied and pasted into an Excel file with a prepared template that produces a graph. The data, of course, can be saved for post-session artifacting and producing graphs based on more veridical data. Nevertheless, particularly if one is recording from 10-20 sites at which little artifact is likely and during an eyes-closed condition, it can be helpful to immediately see whether training leads to EEG changes during a session.
There are several benefits to graphing and displaying these within-session data. Graphic display of such information can encourage the client to engage their attention in training. This kind of graph can also be helpful to the practitioner in coaching the client. Trends in these data can also inform the practitioner when to discontinue training during the session, for instance, if changes plateau or decrease toward the end of a series of training periods (see Figure 3). The question these data answer when compared to session pre-training baseline data is whether, during a particular session, training is producing a change during that session.
Post-training baseline session data
After the conclusion of the training portion of a session, data can be collected during a brief post-training baseline. These data can be contrasted with session pre-training baseline data to ask whether there was at least a short-term change in an EEG variable from the beginning to the end of the session. Either absolute values or z-scores can be compared and represented in a single graph, or change scores can be calculated and graphed (see Figure 4). However, clinicians should exercise caution in interpreting session post-training data because they may be very unstable, immediately coming after training has stopped for that session. Also, they may index fatigue, for instance, if a client becomes progressively less able to focus their attention with resulting diminution of EEG values for faster frequencies.
Decision-making
Use of session data graphs for decision-making may occur before introducing the feedback phase of a session or during the series of feedback segments presented in a session.
Before beginning training with neurofeedback during a session, the practitioner should examine whether the graph of session pre-training baseline values shows a value that may influence the thresholds or protocol montage used for that session. This graph may be based entirely on artifacted data from previous sessions or include that session’s unartifacted pre-training baseline data. Figure 5 shows a trend that increases after baseline, then stabilizes. The leveling off of the trend may suggest to the practitioner that SMR training can conclude and then introduce another montage.
As suggested above, examining graphs of EEG data from training segments within a given session can help decide when to change thresholds or discontinue training that day.
End of training and follow-up data
Graphs of session data help the client and practitioner decide when to discontinue neurofeedback training. It can be helpful to document the outcome of training by collecting and graphing EEG data during a session devoted entirely to post-training assessment, that is, without any scheduled neurofeedback. The resulting data can be graphed and contrasted with data collected during the initial assessment.
In addition, there may be reasons for collecting and graphing data at a point in time when the client follows up for re-assessment. For example, the client and practitioner, or even those who have funded the training, may be interested in whether the gains seen just after a series of training sessions are preserved for longer periods. This can inform decisions about whether further training may be helpful to reinstate the gains that the client made earlier.
Non-EEG session graphs
In addition to graphs of EEG data, the client and practitioner may wish to repeat the collection of other types of quantitative data that made up the initial assessment. Such data may be derived from rating scales, questionnaires, peripheral psychophysiological measures, or cognitive tests. The latter often include continuous performance tests that measure selective and sustained attention and inhibition.
HRV training is a frequent adjunct to neurofeedback training and may be one psychophysiological measure that results in data for each session. Questionnaires related to a subjective emotional state or to functional behavior (e.g., study time) may be completed by the client or those having a significant relationship with the client (e.g., parent or teacher, spouse). Client-specific rating scales may also be used. Data from these measures can be graphed vis a vis the data collected during the client’s initial assessment to answer questions related to the generalization of gains, answering the question, “Is the improvement seen in the EEG reflected in how the client feels, in level of cognitive performance, or in a type of behavior that matters in a particular situation?”
Summary
This section of Neurofeedback Tutor focuses on EEG data collected during individual sessions. It describes what part of the session those data may be taken from, questions they may answer, and how they may influence decision-making during and after neurofeedback training.
Conclusion
This section of Neurofeedback Tutor describes the steps that practitioners often take during the delivery of a neurofeedback session, from preparation to post-session clean-up and documentation. This illustrates how the practitioner uses an approach that is client-centered and places value on both quantitative and qualitative data. Suggestions for how to monitor the client’s idiosyncratic response to training are noted. Decision-making about threshold adjustment within a session and between sessions is also outlined.
Glossary
A (auricular): International 10-20 system earlobe reference placement.
alpha rhythm: 8-12-Hz activity that depends on the interaction between rhythmic burst firing by a subset of thalamocortical (TC) neurons linked by gap junctions and rhythmic inhibition by widely distributed reticular nucleus neurons. Researchers have correlated the alpha rhythm with relaxed wakefulness. Alpha is the dominant rhythm in adults and is located posteriorly. The alpha rhythm may be divided into alpha 1 (8-10 Hz) and alpha 2 (10-12 Hz).
amplitude: the strength of the EEG signal measured in microvolts or picowatts.
arousal: a process that combines alertness and wakefulness, produced by at least
five neurotransmitters, including acetylcholine, histamine, hypocretin, norepinephrine, and serotonin.
artifacts: false signals like 50/60Hz noise produced by line current.
asynchronous waves: oscillating electrical potentials created when neurons depolarize and hyperpolarize independently.
benzodiazepine receptor agonist (BZRA) hypnotics: nonbenzodiazepine BZRAs like zolpidem (Ambien) that are prescribed to treat insomnia.
beta rhythm: 12-38-Hz activity associated with arousal and attention
generated by brainstem mesencephalic reticular stimulation that depolarizes neurons in both the thalamus and cortex. The beta rhythm can be divided into multiple ranges: beta 1 (12-15 Hz), beta 2 (15-18 Hz), beta 3 (18-25 Hz), and beta 4 (25-38 Hz).
bilateral synchronous slow waves: a pathological sign observed in drowsy
children. When detected in alert adults, intermittent bursts of high amplitude slow waves may signify gray
matter lesions in deep midline structures.
bipolar (sequential) montage: a recording method that uses two active electrodes
and a common reference.
bridging artifact:
a short circuit between adjacent electrodes due to excessive application of
electrode paste or a client who is sweating excessively or arrives with a wet
scalp.
C (central): sites in the International 10-20 system that detect frontal, parietal-occipital, and temporal EEG activity.
channel: EEG amplifier input from three leads (active, reference, and ground electrodes) placed on the head.
delta rhythm: 0.05-3-Hz oscillationsgenerated
by thalamocortical neurons during stage 3 sleep.
drowsiness artifact: in adults, 1-Hz (or slower) waveforms can be detected with the greatest amplitude, and reverse polarity at F7 and F8 may progress to 1-2 Hz slowing of the alpha rhythm.
dual-action antidepressants: medications like duloxetine (Cymbalta) that activate 5-HT1 receptors to
produce antidepressant and anxiolytic effects, while they blockade 5-HT2 (agitation, restlessness, and sexual
dysfunction) and 5-HT3 (nausea, headache, and vomiting) receptors to minimize their side effects.
EEG artifacts: noncerebral electrical activity in an EEG recording can be divided into physiological and exogenous artifacts.
electro-ocular artifact: contamination of EEG recordings by potentials generated by eye blinks, eye flutter, and eye movements.
electrode pop artifact: sudden large deflections in at least one channel when an electrode abruptly detaches from the scalp.
EMG artifact: interference in EEG recording by volume-conducted signals from skeletal muscles.
exogenous artifacts: noncerebral electrical activity generated by movement, 50/60 Hz and field effect, bridging, and electrode (electrode “pop" and impedance) artifacts.
F (frontal): sites in the International 10-20 system that detect frontal lobe EEG activity.
fast cortical potentials: EEG rhythms that range from 0.5 Hz-100 Hz. The main
frequency ranges include delta, theta, alpha, sensorimotor rhythm, and beta.
first-generation antipsychotics (FGAs): FGAs like chlorpromazine (Thorazine) are prescribed to treat the positive symptoms of schizophrenia and exert their effects through D2 receptor blockade.
focal waves: EEG waves detected within a limited area of the scalp,
cerebral cortex, or brain.
Fp (frontopolar or prefrontal): sites in the International 10-20 system that detect prefrontal cortical EEG activity.
hertz (Hz): unit of frequency measured in cycles per second.
impedance (Z): complex opposition to an AC signal measured in
Kohms.
impedance meter: a device that uses an AC signal to measure
impedance in an electric circuit, such as between active and reference
electrodes.
impedance test: automated or manual measurement of skin-electrode impedance.
inhibit threshold: criterion for suspending feedback, analogous to a limbo bar, designed to decrease bandpass amplitude.
inion: the bony prominence on the back of the skull.
intermediate-acting benzodiazepines: benzodiazepines with mean half-lives from 15-80 hours prescribed for the management of anxiety.
irregular waves: successive waves that constantly alter their shape and
duration.
irreversible MAO inhibitors (MAOIs): MAOIs like selegeline (Emsam) that form permanent bonds with the MAO enzyme and are prescribed for major depressive disorder (MDD).
International 10-20 system: a standardized procedure for 21
recording and one ground electrode on adults.
long-acting benzodiazepines: benzodiazepines like diazepam (Valium) with mean half-lives ranging from 10-80 hours prescribed to manage anxiety.
low resolution electromagnetic tomography (LORETA): Pascual-Marqui's (1994) mathematical inverse solution to identify the cortical sources of 19-electrode quantitative data acquired from the scalp.
mastoid bone: the bony prominence behind the ear.
microvolt (μV): a unit of amplitude
(signal strength) that is one-millionth of a volt.
mixed opioid agonist-antagonists: drugs like pentazocine (Talwin) that are kappa agonists and weak mu antagonists that are prescribed for the management of pain.
monoamine oxidase (MAO): an enzyme that degrades and inactivates the monoamine
neurotransmitters dopamine, norepinephrine, and serotonin.
monoamine oxidase inhibitors (MAOIs): antidepressant drugs that interfere with
MAO's breakdown of monoamines and increase monoamine availability and are prescribed to manage major depressive disorder (MDD).
montage: a grouping of electrodes (combining derivations) to record EEG activity.
movement artifacts: voltages caused by client movement or the movement of electrode wires by other individuals.
nasion: the depression at the bridge of the nose.
notch filter: a filter that suppresses a narrow band of frequencies, such as those produced by line current at 50/60Hz.
O (occipital): sites in the International 10-20 system that detect occipital lobe EEG activity.
ohm (Ω): a unit of impedance or resistance.
P (parietal): sites in the International 10-20 system that detect parietal lobe EEG activity.
partial opioid agonists: drugs like buprenorphine (Subutex) that produce less-than-maximal analgesia and are prescribed to manage pain.
peak alpha frequency: the highest-amplitude alpha frequency (8-12, 8-13 Hz) within an epoch.
physiological artifacts: noncerebral electrical activity that includes electromyographic, electro-ocular (eye blink and eye movement), cardiac (pulse), sweat (skin impedance), drowsiness, and evoked potential.
polyphasic (multiphasic) wave: a wave that contains two or more deflections of
opposite polarity from baseline.
polyspikes: a series of three or more consecutive spikes (≥ 10 Hz) that last a minimum of 300 milliseconds.
posterior dominant rhythm (PDR): the highest-amplitude frequency detected at the posterior scalp when eyes are closed.
power: the amplitude squared and may be expressed as microvolts squared or picowatts/resistance.
preauricular point: the slight depression located in front of the ear and above the earlobe.
protocol: a rigorously organized plan for training.
pulse artifacts: noncerebral voltages due to mechanical movement of an electrode in relation to the skin surface due to the pressure wave of each heartbeat.
pure opioid agonists: drugs like morphine that produce maximal analgesia and are prescribed to manage pain.
Quantitative EEG (qEEG): digitized statistical brain mapping
using at least a 19-channel montage to measure EEG amplitude within
specific frequency bins.
reference electrode: an electrode placed on the scalp, earlobe, or mastoid.
regular or monomorphic waves: successive waves with identical shapes.
Regular waves may resemble sine waves (sinusoidal) or maybe arched (resembling wickets), or saw-toothed
(asymmetrical and triangular).
rhythmic temporal theta of drowsiness (RMTD): bitemporal left is greater than right in this longitudinal bipolar montage. Noted are notched rhythmic waveforms localized to the temporal regions, some of which are sharply contoured.
second-generation antipsychotics: SGAs like clozapine (Clozaril) are prescribed to treat the positive symptoms of schizophrenia and antagonize D2 receptors less effectively than D1 receptors and significantly less than 5-HT2 receptors.
selective norepinephrine reuptake inhibitors (SNRIs): drugs like atomoxetine (Strattera) that specifically interfere with norepinephrine reuptake for the management of major depressive disorder (MDD).
selective serotonin reuptake inhibitors (SSRIs): drugs like fluoxetine (Prozac) that specifically interfere with serotonin reuptake for the management of major depressive disorder (MDD).
sensorimotor rhythm (SMR): 13-15-Hz spindle-shaped sensorimotor rhythm (SMR) that is detected from the sensorimotor strip when individuals reduce attention to sensory input and reduce motor activity.
short-acting benzodiazepines: benzodiazepines like alprazolam (Xanax) with mean half-lives that range from 2.5-12 hours prescribed to manage anxiety.
spike: a negative transient with a pointed peak at conventional paper speeds,
20-70-ms duration, and 40-100 μV amplitude.
spike-and-slow-wave complex: a spike followed by a higher amplitude
slow wave at 3 Hz. In an absence seizure, the amplitudes are very high (e.g., 160 μV).
spindle waves: waves that originate in the thalamus and occur during
unconsciousness and stage 2 sleep.
standardized LORETA (sLORETA): a refinement of LORETA that estimates each voxel's electrical potentials without regard to their frequency, expresses normalized F-values, and achieves a 1-cubic-cm resolution.
sum squash threshold: a criterion for receiving feedback that reduces bandpass amplitude over a wide scalp area by using inhibit thresholds on two channels using referential (monopolar) or sequential (bipolar) recording.
surface Laplacian (SL) analysis: a family of mathematical algorithms that
provide two-dimensional images of radial current flow from cortical dipoles to the scalp.
swLORETA: a more precise and accurate iteration of the LORETA source localization method.
theta/beta ratio (T/B ratio): the ratio between 4-7 Hz theta and 13-21 Hz beta, measured most typically along the midline and generally in the anterior midline near the 10-20 system location Fz.
theta rhythm: 4-8-Hz rhythms generated a cholinergic septohippocampal system
that receives input from the ascending reticular formation and a noncholinergic system that originates in the
entorhinal cortex, which corresponds to Brodmann areas 28 and 34 at the caudal region of the temporal lobe.
third-generation antipsychotics (TGAs): drugs like aripiprazole (Abilify) that is a partial agonist at D2 and 5-HT1A receptors and an antagonist at 5-HT2 receptors prescribed for the management of the positive and negative symptoms of schizophrenia.
transient: a single wave or sequence of regular waves, called a complex,
distinguishable from background EEG activity.
triphasic waves (TWs): medium-to-high-amplitude sharp transients that often involve a negative-positive-negative sequence. TWs are distributed diffusely and symmetrically with frontal predominance.
z-score thresholds: upper and lower boundaries expressed in z-scores (e.g., z-score) used to normalize specific EEG metrics and regions of interest (ROIs).
z-score training: a neurofeedback protocol that reinforces in real-time closer approximations of client EEG values to those in a normative database.
tragus: the flap at the opening of the ear.
transient: isolated waveforms or complexes that can be distinguished from background activity.
vertex (Cz): the intersection of imaginary lines drawn from the nasion to inion and between the two preauricular points in the International 10-10 and 10-20 systems.
Test Yourself
Customers enrolled on the ClassMarkerplatform should click on its logo to take 10-question tests over this unit (no exam password).
REVIEW FLASHCARDS ON QUIZLET
Click on the Quizlet logo to review our chapter flashcards.
Visit the BioSource Software Website
BioSource Software offers Physiological Psychology, which satisfies BCIA's Physiological Psychology requirement, and Neurofeedback100, which provides extensive multiple-choice testing over the Biofeedback Blueprint.
Assignment
Now that you have completed this unit, explain the role of shaping in neurofeedback training. How do you manually adjust reward thresholds?
References
Advokat, C. D., Comaty, J. E., & Julien, R. M. (2019). Julien's primer of drug action: A comprehensive guide to the actions, uses, and side effects of psychoactive drugs (14th ed.). Worth Publishers.
Arns, M., de Ridder, S., Strehl, U., Breteler, M., & Coenen, A. (2009). Efficacy of neurofeedback treatment in ADHD: The effects on inattention, impulsivity and hyperactivity: a meta-analysis. Clinical EEG and neuroscience, 40(3), 180–189. https://doi.org/10.1177/155005940904000311
Banoczi, W. R. (2005). How some drugs affect the electroencephalogram (EEG). Am J END Technol, 45, 118-129. PMID: 15989074
Bauer, G., & Bauer, R. (2005). EEG drug effects and central nervous system poisoning. In E. Niedermeyer & F. Lopes da Silva (Eds.). Electroencephalography: Basic principles, clinical applications, and related fields (5th ed.). Lippincott Williams & Wilkins.
Blume, W. T. (2006). Drug effects on EEG. Journal of Clinical Neurophysiology, 23(4), 306-311. https://doi.org/10.1097/01.wnp.0000229137.94384.fa
Cooper, J. O., Heron, T. E., & Heward, W. L. (2019). Applied behavior analysis (3rd
ed.). Pearson.
Collura, T. F. (2014). Technical foundations of neurofeedback. Taylor & Francis.
Demos, J. N. (2019). Getting started with EEG neurofeedback (2nd ed.). W. W. Norton.
Ferree, T. C., Luu, P., Russell, G. S., & Tucker, D. M. (2001). Scalp electrode impedance, infection risk, and EEG data quality. Clinical Neurophysiology, 112(3), 536–544. https://doi.org/10.1016/s1388-2457(00)00533-
Fisch, B. J. (1999). Fisch and Spehlmann's EEG primer (3rd ed.). Elsevier.
Hammond, D. C. (2008). First do no harm: Adverse effects and the need for practice standards in neurofeedback. Journal of Neurotherapy, 1, 79-88. https://doi.org/10.1080/10874200802219947
Hammond, D. C. (2011). What is neurofeedback: An Update. Journal of Neurotherapy, 15, 305-336. https://doi.org/10.1080/10874208.2011.623090
Kappenman, E. S., & Luck, S. J. (2010). The effects of electrode impedance on data quality and statistical significance in ERP recordings. Psychophysiology, 47(5), 888-904. https://doi.org/10.1111/j.1469-8986.2010.01009.x.
Lubar, J. F. (1995). Neurofeedback for the management of attention-deficit/hyperactivity disorders. In M. S. Schwartz (Ed.). Biofeedback: A practitioner's guide (pp. 493–522). The Guilford Press.
Lubar, J. F., Shabsin, H. S., Natelson, S. E., Holder, G. S., Whitsett, S. F., Pamplin, W. E., & Krulikowski, D. I. (1981). EEG operant conditioning in intractable epileptics. Archives of Neurology, 38, 700-704.
https://doi.org/10.1001/archneur.1981.00510110060009
Lubar, J. F., & Shouse, M. N. (1976). EEG and behavioral changes in a hyperactive child concurrent with training of the sensorimotor rhythm (SMR): A preliminary report. Biofeedback and Self-Regulation, 1, 293-306. https://doi.org/10.1007/bf01001170
Luctkar-Flude, M., & Groll, D. (2015). A systematic review of the safety and effect of neurofeedback on fatigue and cognition. Integrative Cancer Therapies, 14, 318-340. https://doi.org/10.1177/1534735415572886
Martin, G., & Pear, J. (2019). Behavior modification: What it is and how to do it (11th ed.). Routledge.
Martins-Mourao, A. M., & Kerson, C. (2016). Equipment, training and ethical issues. In C. Kerson & A. Martins-Maurao (Eds.), Alpha-theta training in the 21st century: A handbook for clinicians and researchers (pp. 249-258). Foundation for Neurofeedback and Neuromodulation Research.
Matthews, T. V. (2007). Neurofeedback overtraining and the vulnerable patient. Journal of Neurotherapy, 11, 67-71. https://doi.org/:10.1080/10874200802126290
Rogel, A., Guez, J., Getter, N., Keha, E., Cohen, T., Amor, T., & Todder, D. (2015). Transient adverse side effects during neurofeedback training: A randomized, sham-controlled, double-blind study. Applied Psychophysiology and Biofeedback, 40, 209-2018. https://doi.org/10.1007/x10484-015-9289-6
Soutar, R., & Longo, R. (2020). Doing neurofeedback: An introduction (2nd ed.). ISNR Research Foundation.
Stahl, S. M. (2017). Stahl's essential psychopharmacology prescriber's guide (6th ed.). Cambridge University Press.
Swingle, P. G. (2008). Biofeedback for the brain: How neurotherapy effectively treats depression, ADHD, autism, and more. Rutgers University Press.
Swingle, P. G. (2015). Adding neurofeedback to your practice: Clinician’s guide to ClinicalQ, neurofeedback, and braindriving. Springer.
Thomas, C. (2007). What is a montage? EEG instrumentation. American Society of Electroneurodiagnostic Technologists, Inc.
Thompson, M., & Thompson, L. (2015). Neurofeedback Book: An introduction to basic concepts in applied psychophysiology (2nd ed.). Association for the Advancement of Psychophysiology and Biofeedback.
Toomim, H., Mize, W., Kwong, P. C., Toomim, M., Marsh, R., Kozlowski, G. P., Kimball, M., & Rémond, A. (2004). Intentional increase of cerebral blood oxygenation using hemoencephalography (HEG): An efficient brain exercise therapy. Journal of Neurotherapy, 8, 5-21. https://doi.org/10.1300/J184v08n03_02
Van Cott, A., & Brenner, R. P. (2003). Drug effects and toxic encephalopathies. In J. S. Ebersole & T. A. Pedley (Eds.). Current practice of clinical electroencephalography (3rd ed.). Lippincott Williams & Wilkins.
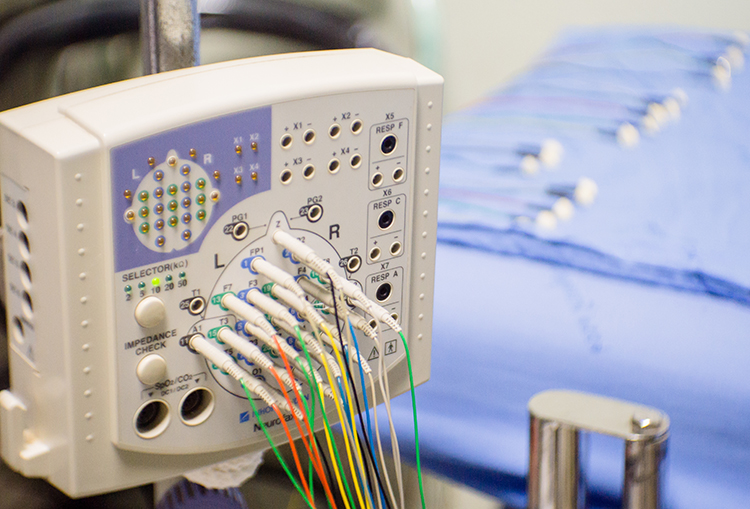


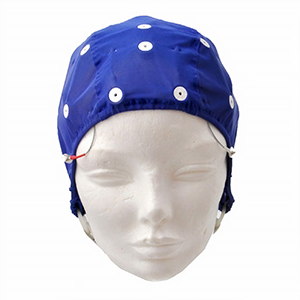

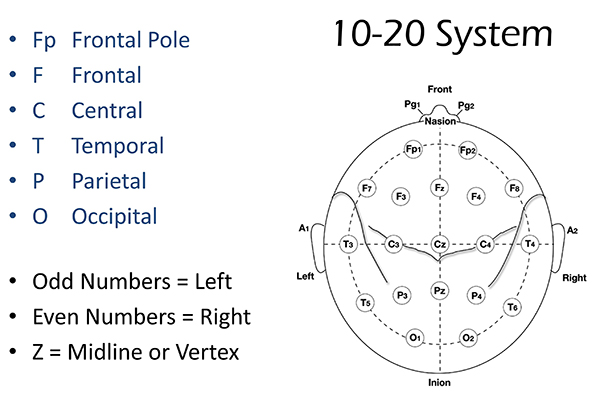
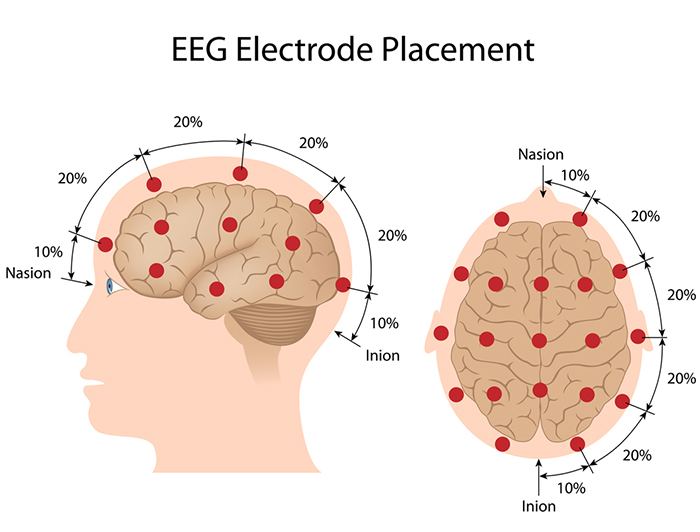
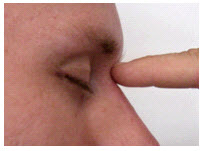
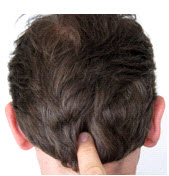
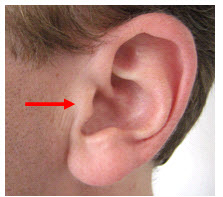
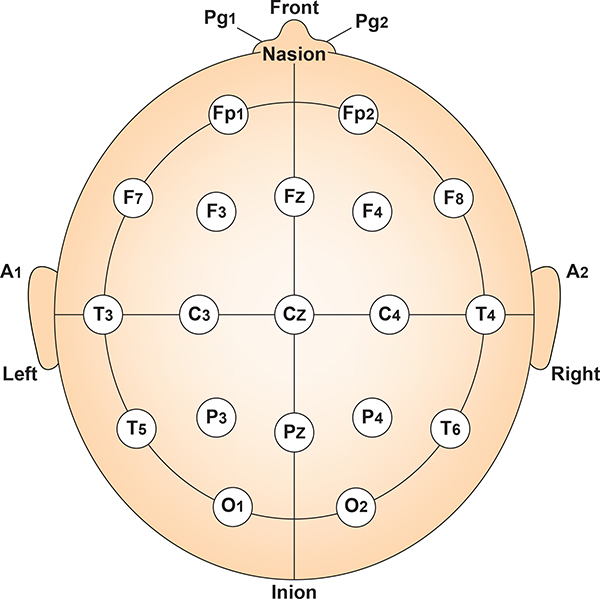
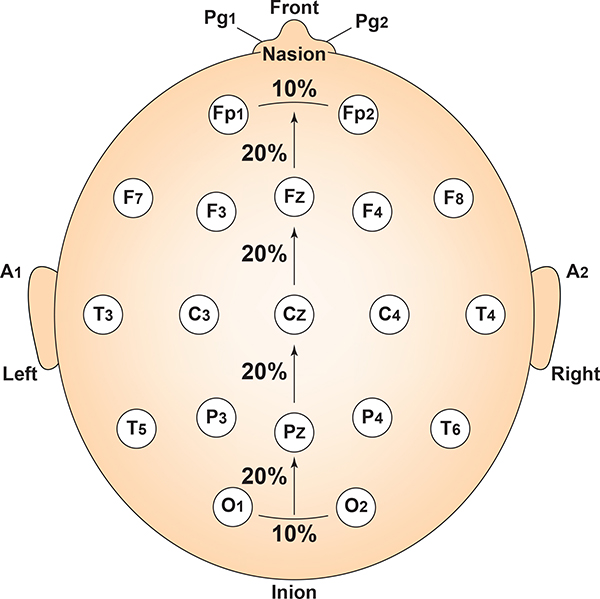
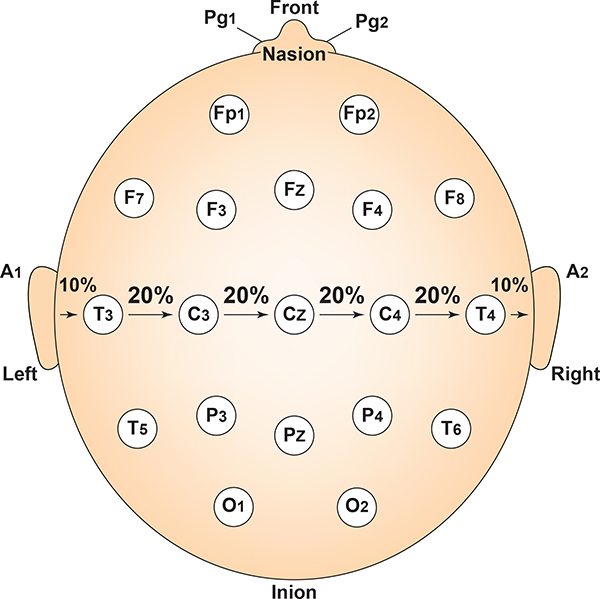
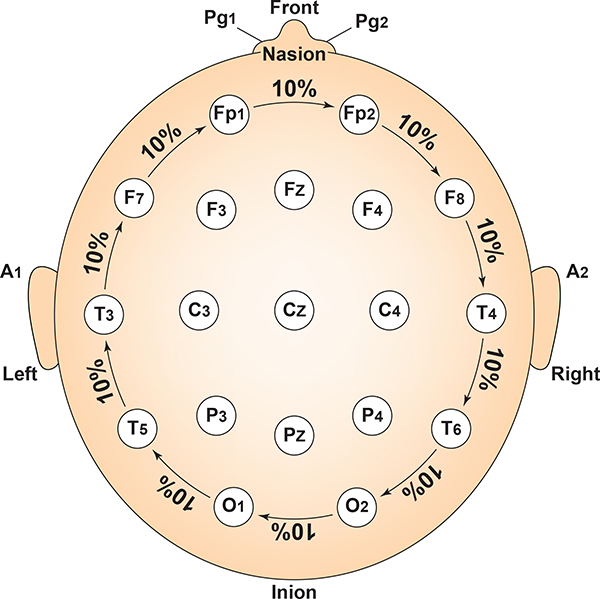
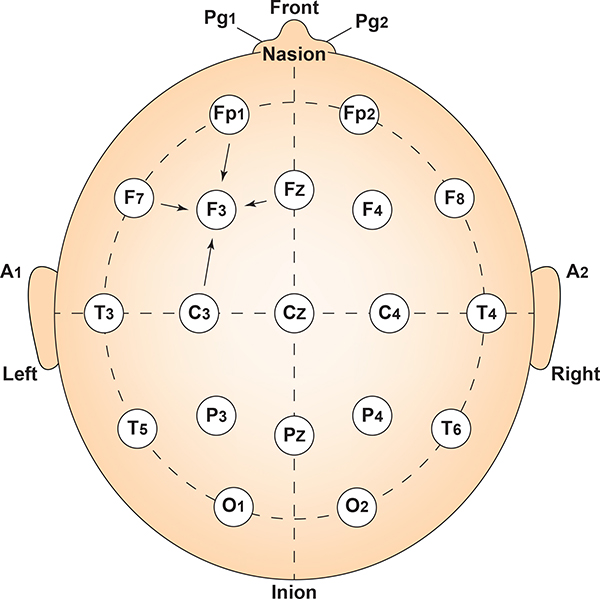
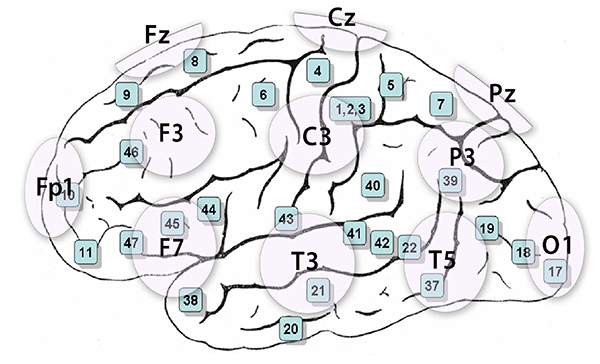
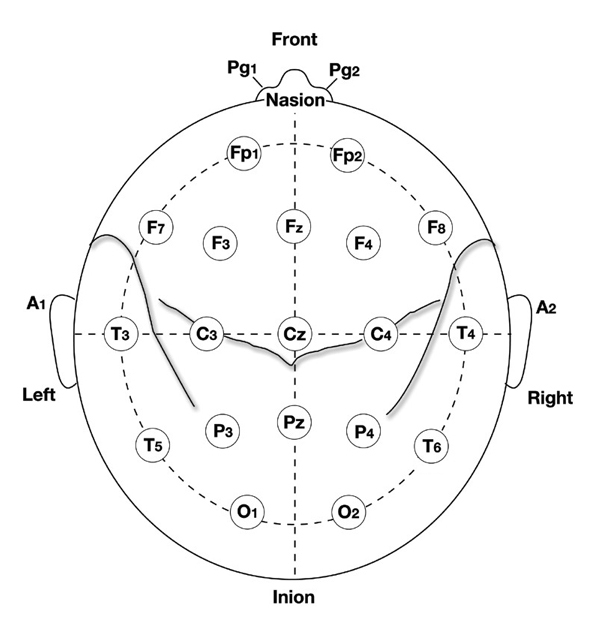
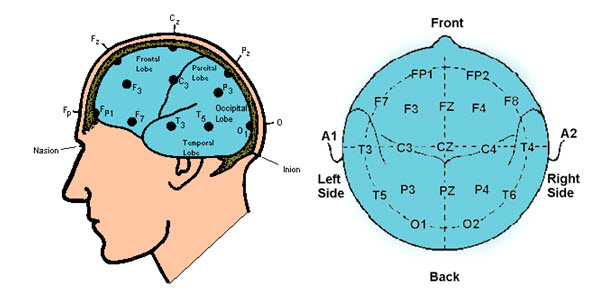


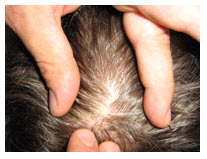
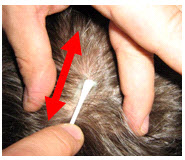
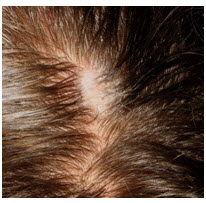
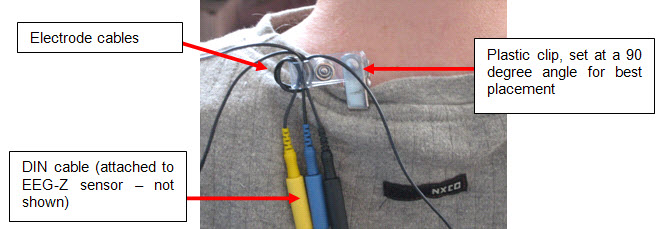
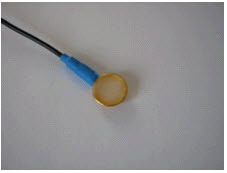
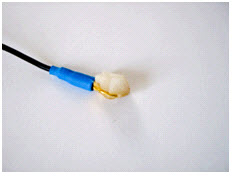
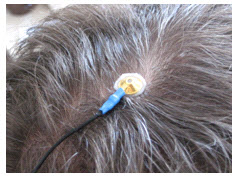
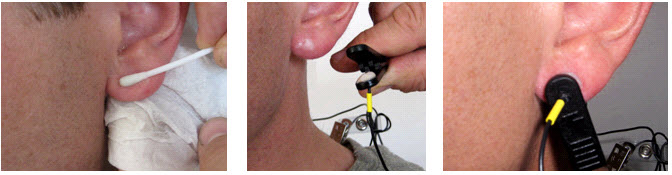
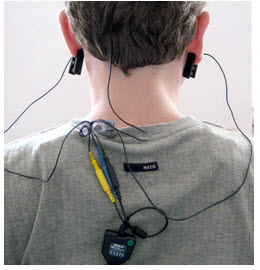
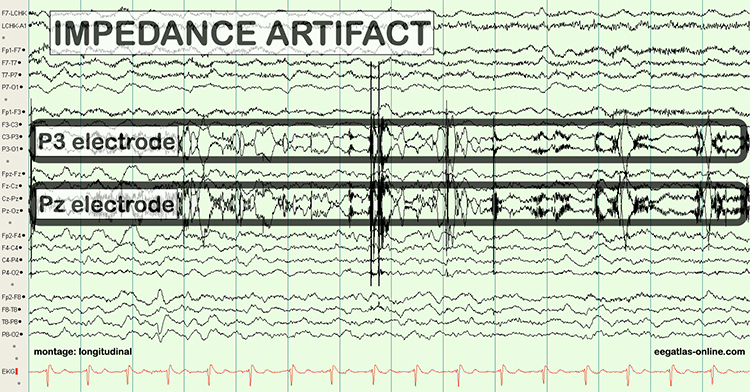
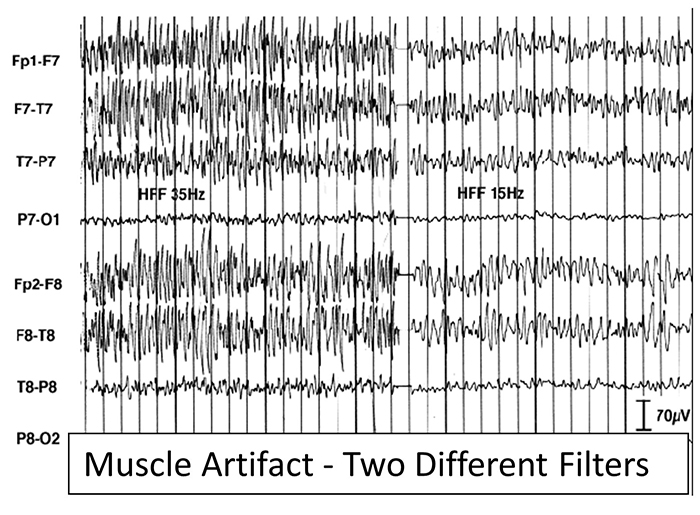
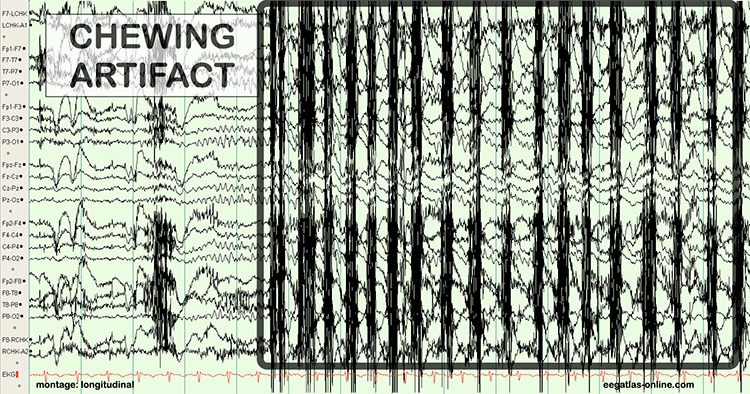
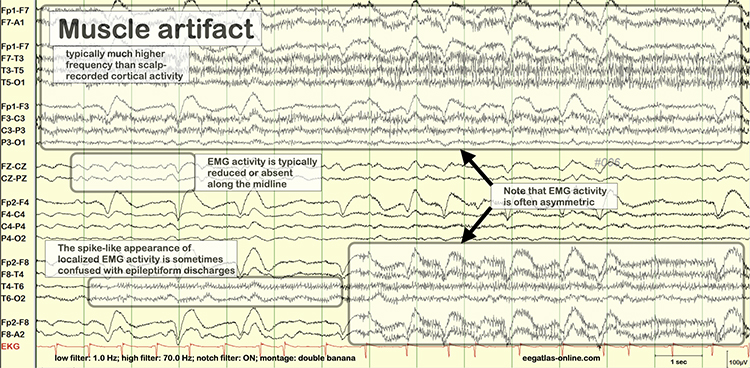
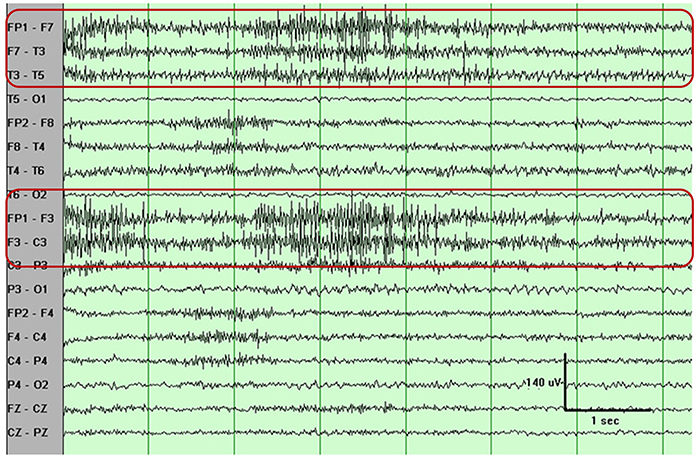
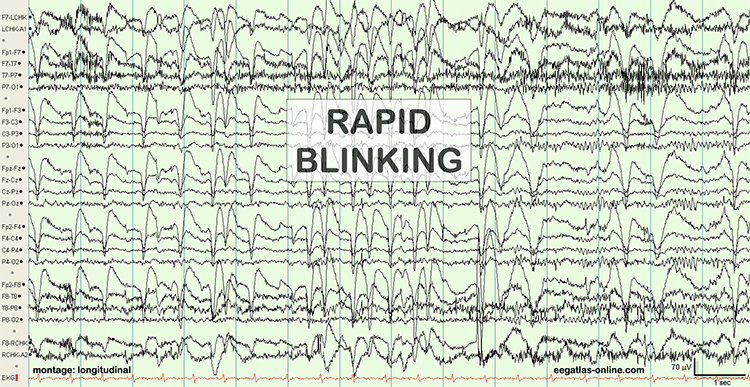
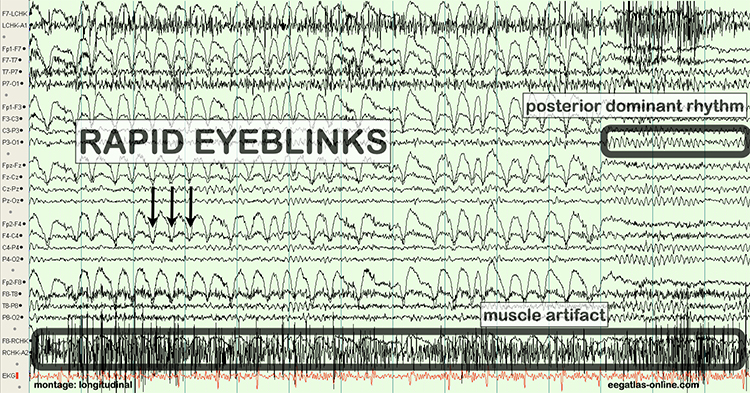
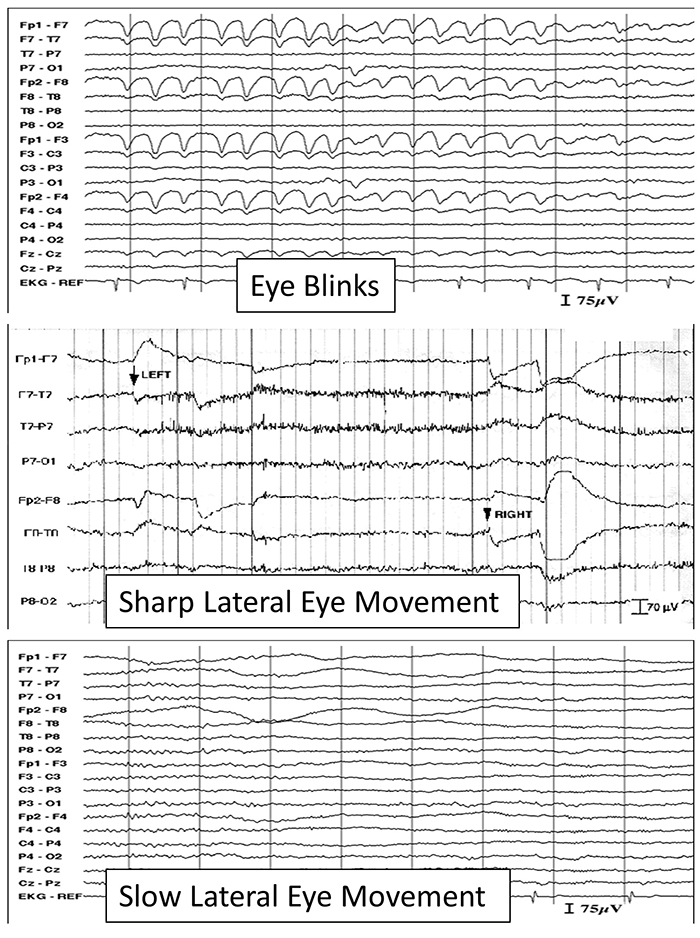
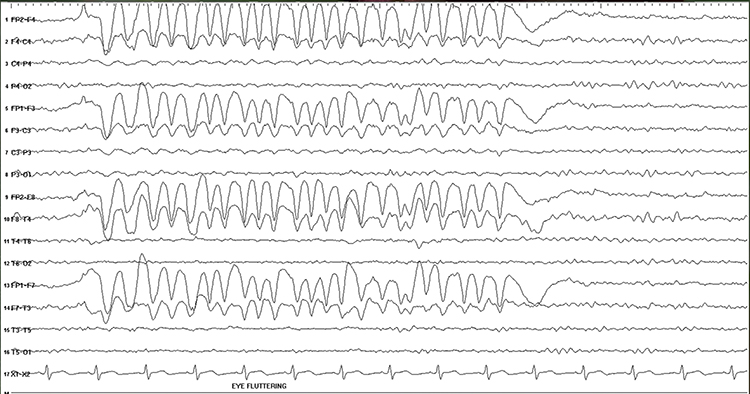
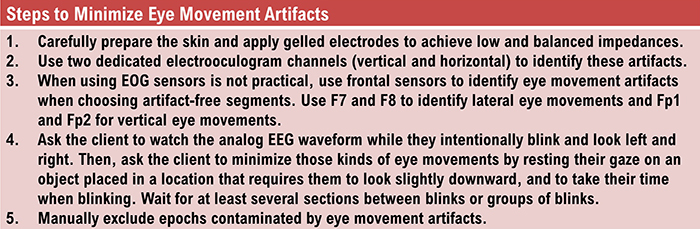
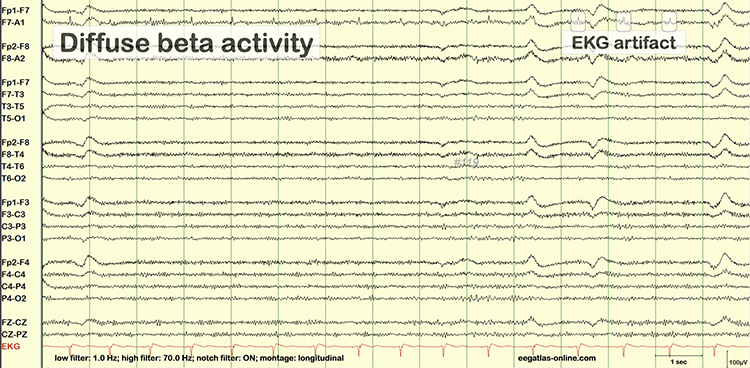
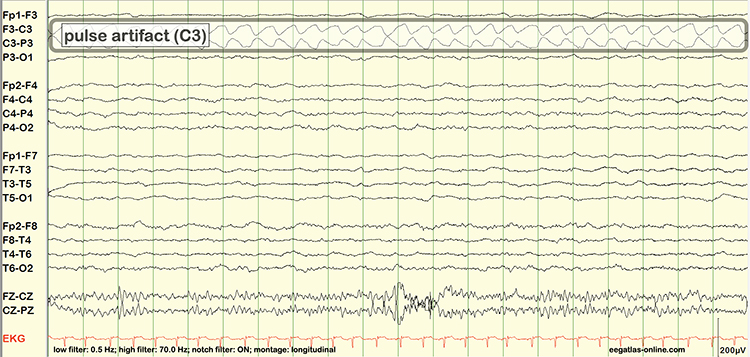
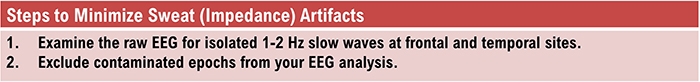
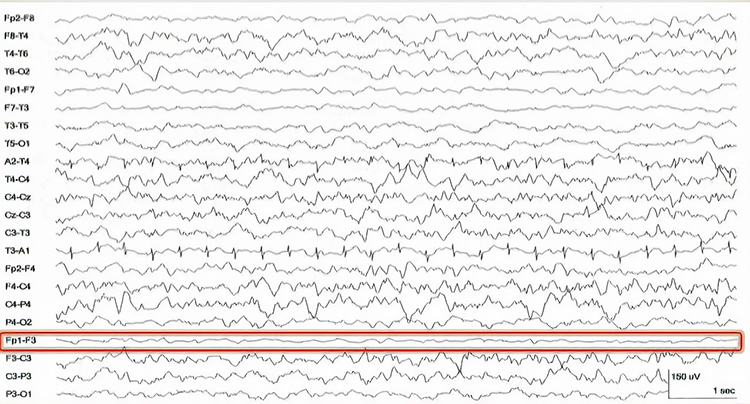
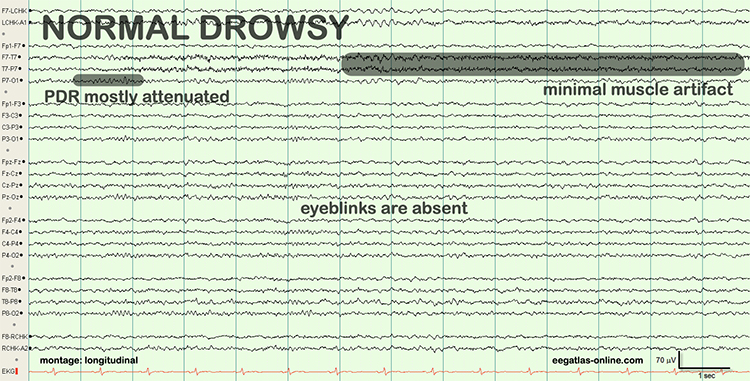
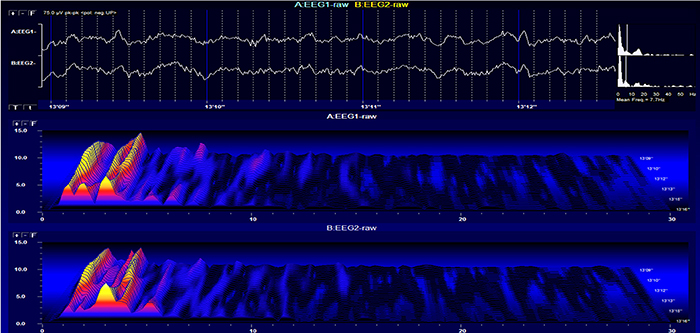

.jpg)