Signal Processing
What You Will Learn in This Chapter
How does a stream of scalp voltages become the numbers and pictures a clinician trains on? This unit follows the EEG signal from its raw analog form through digitization, filtering, and spectral analysis so that you can read a display with confidence. You will learn how frequency, amplitude, and morphology describe a waveform, and how peak-to-peak and root mean square methods quantify the energy within a frequency band. You will also see why sampling resolution, sampling rate, and epoch length set hard limits on what the Fast Fourier Transform can recover from a recording.
The unit then examines the filters that isolate activity of clinical interest, including low-frequency, high-frequency, bandpass, and notch designs, along with the finite impulse response, infinite impulse response, and Fast Fourier Transform methods used to build them. You will study the subjective correlates of the slow cortical potential, delta, theta, alpha, sensorimotor, beta, and gamma bands, together with the generators that produce them, and you will learn to recognize normal variants such as fast alpha, alpha harmonics, and subharmonic slow alpha that are easily mistaken for pathology. Finally, you will explore source localization with the LORETA family and surface Laplacian analysis, and you will learn to recognize clinically significant raw waveforms such as the kappa rhythm, lambda waves, mu waves, spike-and-wave complexes, sleep spindles, and K-complexes.
BCIA Blueprint Coverage: This unit addresses III. Instrumentation and Electronics - C. Signal Processing.
EEG waveforms may be described by their frequency, shape, and amplitude. The amount of energy within an EEG frequency band may be quantified using peak-to-peak and root mean square methods. Data acquisition systems transform the raw analog signal into a digital form. High sampling resolutions measured in digital bits are required to accurately sample direct current (DC) and alternating current (AC) components and a wide range of signal voltages. A sampling rate of more than twice the highest frequency of interest is necessary when performing Fast Fourier Transform (FFT) analysis. After the EEG signal has passed through several amplification stages, it is filtered to exclude unwanted frequencies and minimize artifact and distortion.
The EEG spectrum is composed of frequency bands which are further subdivided. EEG frequency bands are correlated with unique subjective states like internal focus and conscious problem-solving. Below delta lie the slow cortical potentials, sub-1-Hz voltage shifts that index cortical excitability and require a DC-coupled amplifier to record. Clinicians and researchers use LORETA, sLORETA, eLORETA, and surface Laplacian analysis to localize the cortical source of the scalp EEG.
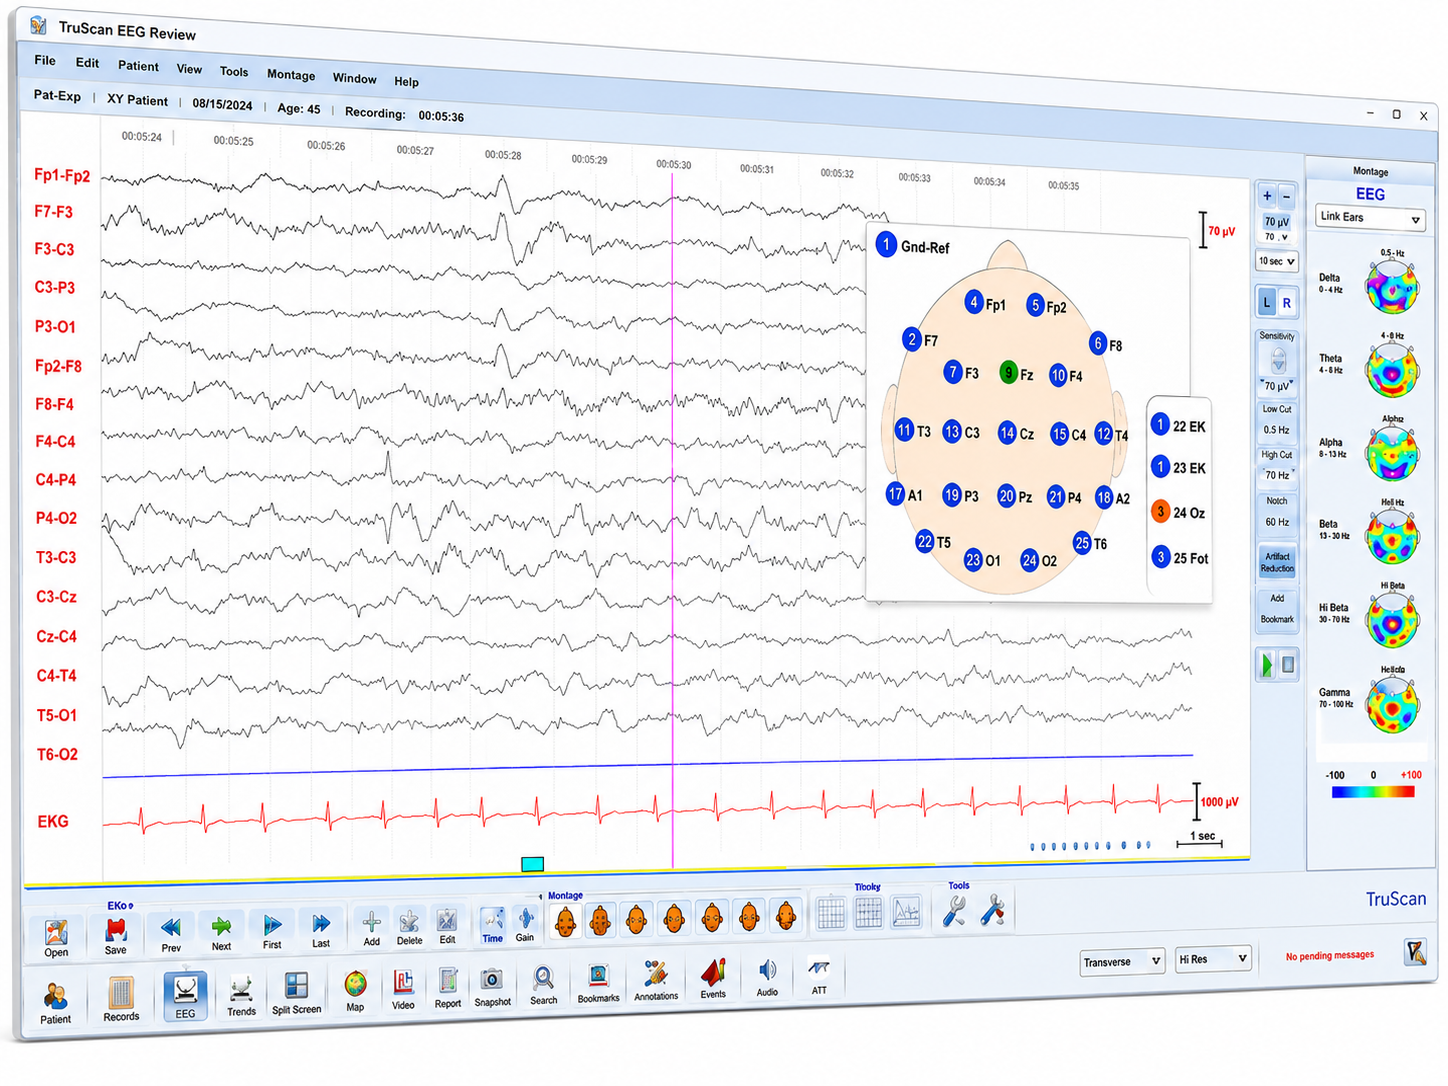
Finally, professionals need to recognize and understand the significance of clinically significant raw waveforms like the kappa rhythm, lambda waves, vertex sharp transients, mu waves, spike and wave, sensorimotor rhythm (SMR), sleep spindles, and K-complexes. We adapted the Deymed graphic below.
BCIA Blueprint Coverage
This unit addresses III. Instrumentation and Electronics - C. Signal Processing.

This unit covers Analog, Raw EEG, Basic Signal Measurement Terms, Filtering Methods, Subjective Characteristics of Frequency Bands, Waveform Morphology, Source Localization, and Clinically Significant Waveforms.
ANALOG, RAW EEG
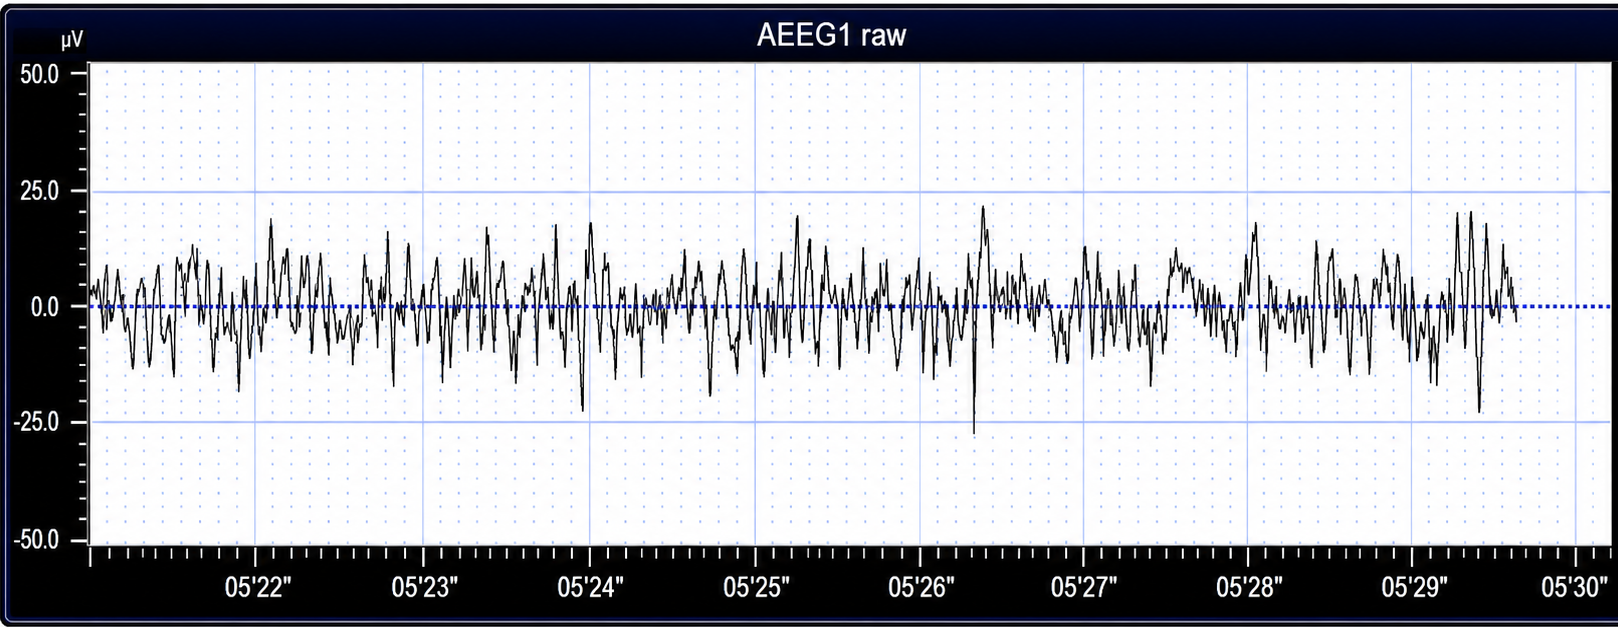
EEG activity ranges from DC (slow cortical potentials) to gamma, conventionally 30-100 Hz (Collura, 2014). Hertz (Hz) is an abbreviation for cycles per second. The raw EEG signal consists of oscillating electrical potential differences detected from the scalp. Raw or wave displays plot voltage using a bipolar (positive/negative) scale with zero in the middle. This is the analog form of the signal in which voltage continuously varies instead of digital representation using 0s and 1s.
It is always important to view EEG activity as the result of brain functions and behaviors rather than their cause. For example, alpha activity does not cause a relaxed state but is simply a reflection of that relaxed state having already occurred. Rewarding an increase in alpha amplitude is indirectly rewarding the brain for producing the state or states that result in increased alpha synchronization among the neurons being recorded.
Another example is gamma activity, which arises from the interplay of excitatory pyramidal cells and fast-spiking, parvalbumin-expressing inhibitory interneurons, whose GABAA kinetics set the rhythm’s period (Buzsáki & Wang, 2012). Astrocytes appear to modulate the amplitude and coherence of gamma through gliotransmitter release (Lee et al., 2014), but they operate on a far slower timescale than the gamma cycle and are not its generator. The graphic © John S. Anderson shows the voltage as µV peak to peak.
BASIC SIGNAL MEASUREMENT TERMS
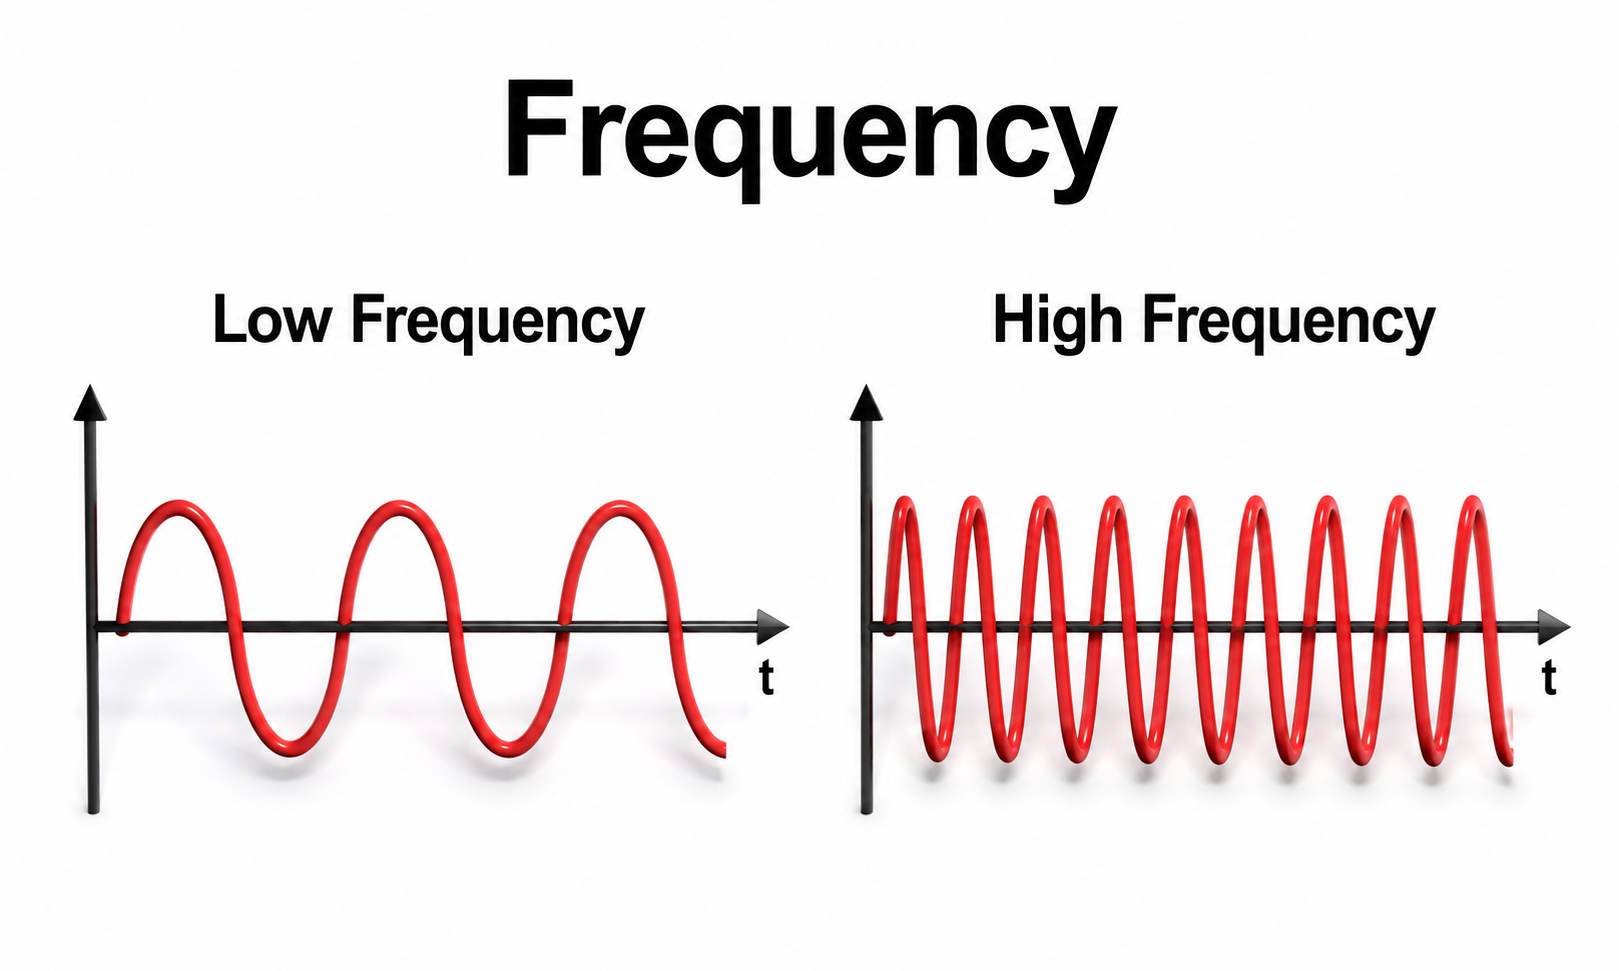
EEG waveforms share the features of frequency and shape (Libenson, 2024). Click on the Read More button to review frequency and amplitude.
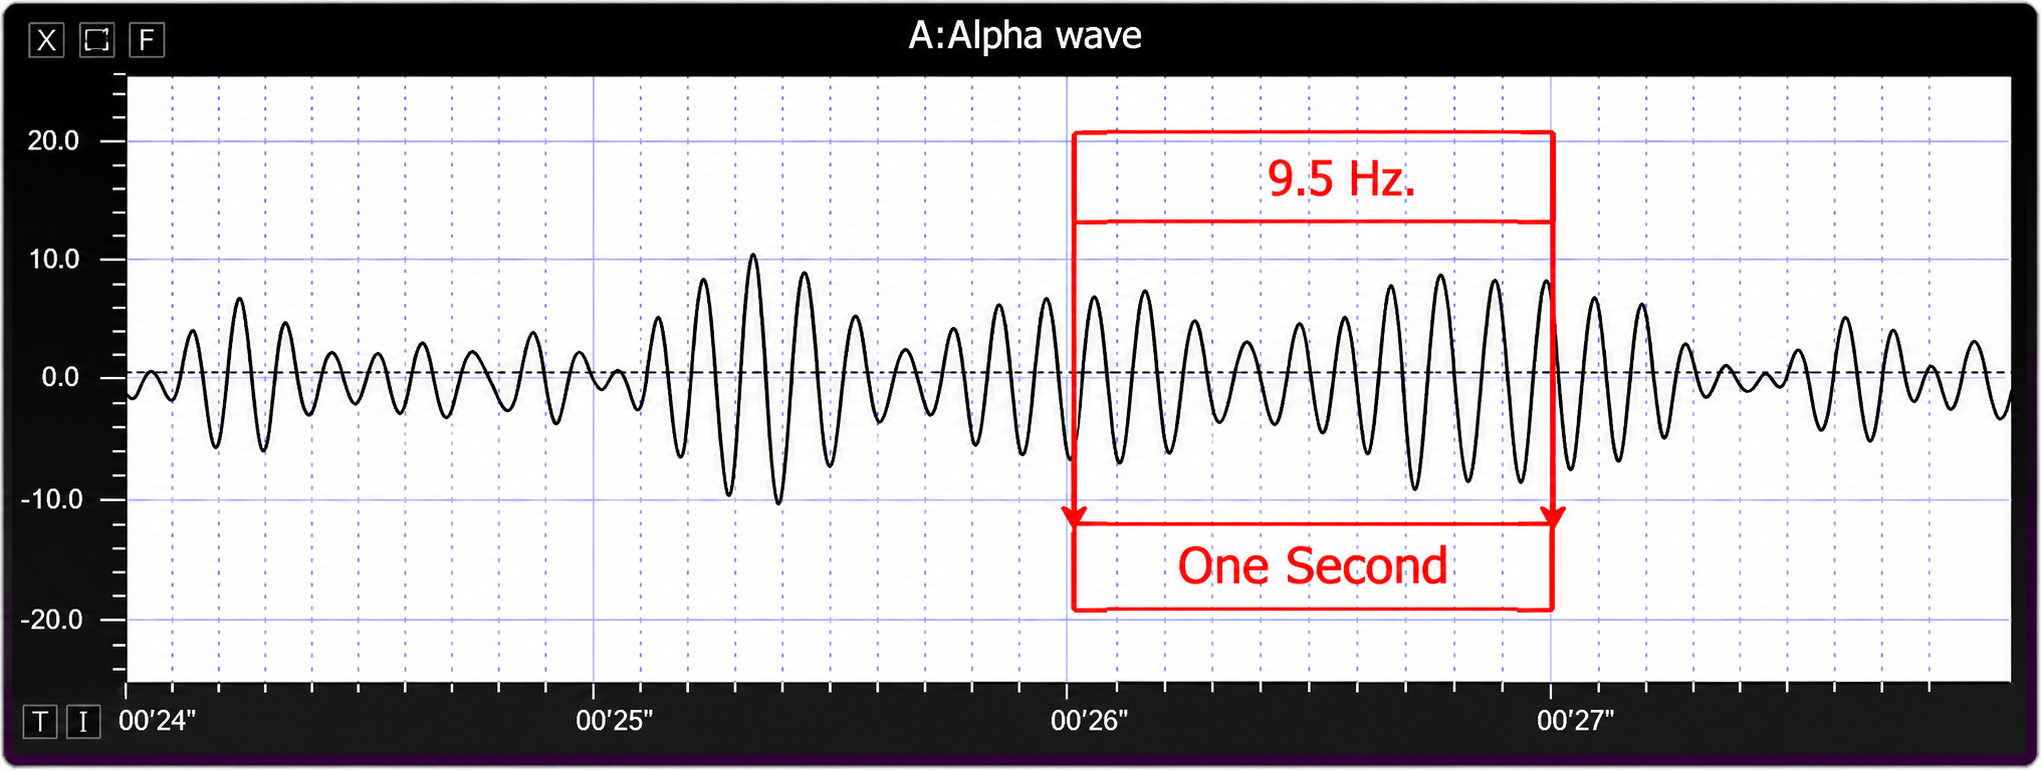
Frequency measures the speed and is the number of cycles completed each second. The higher the frequency (f), the shorter the period (T). The mathematical relationship is f = 1/T, where T is the period in seconds. (Wavelength is a distance and relates to frequency only through propagation speed, v = fλ; the EEG trace displays periods, not wavelengths.) To measure frequency in the raw waveform, count the number of positive peaks in a one-second segment — that number is the frequency in hertz — or count the number of zero crossings in one second and divide by 2, since each cycle crosses zero twice. Graphic © John S. Anderson.
Amplitude measures size, the height of the waveform in microvolts. Amplitude is not itself energy; energy is proportional to amplitude squared integrated over time, which is why magnitude, power, and percent power are distinguished below. The amplitude and morphology of any EEG frequency band reflect the number of neurons discharging simultaneously at that frequency. High amplitude means that many neurons are depolarizing and hyperpolarizing at the same time.
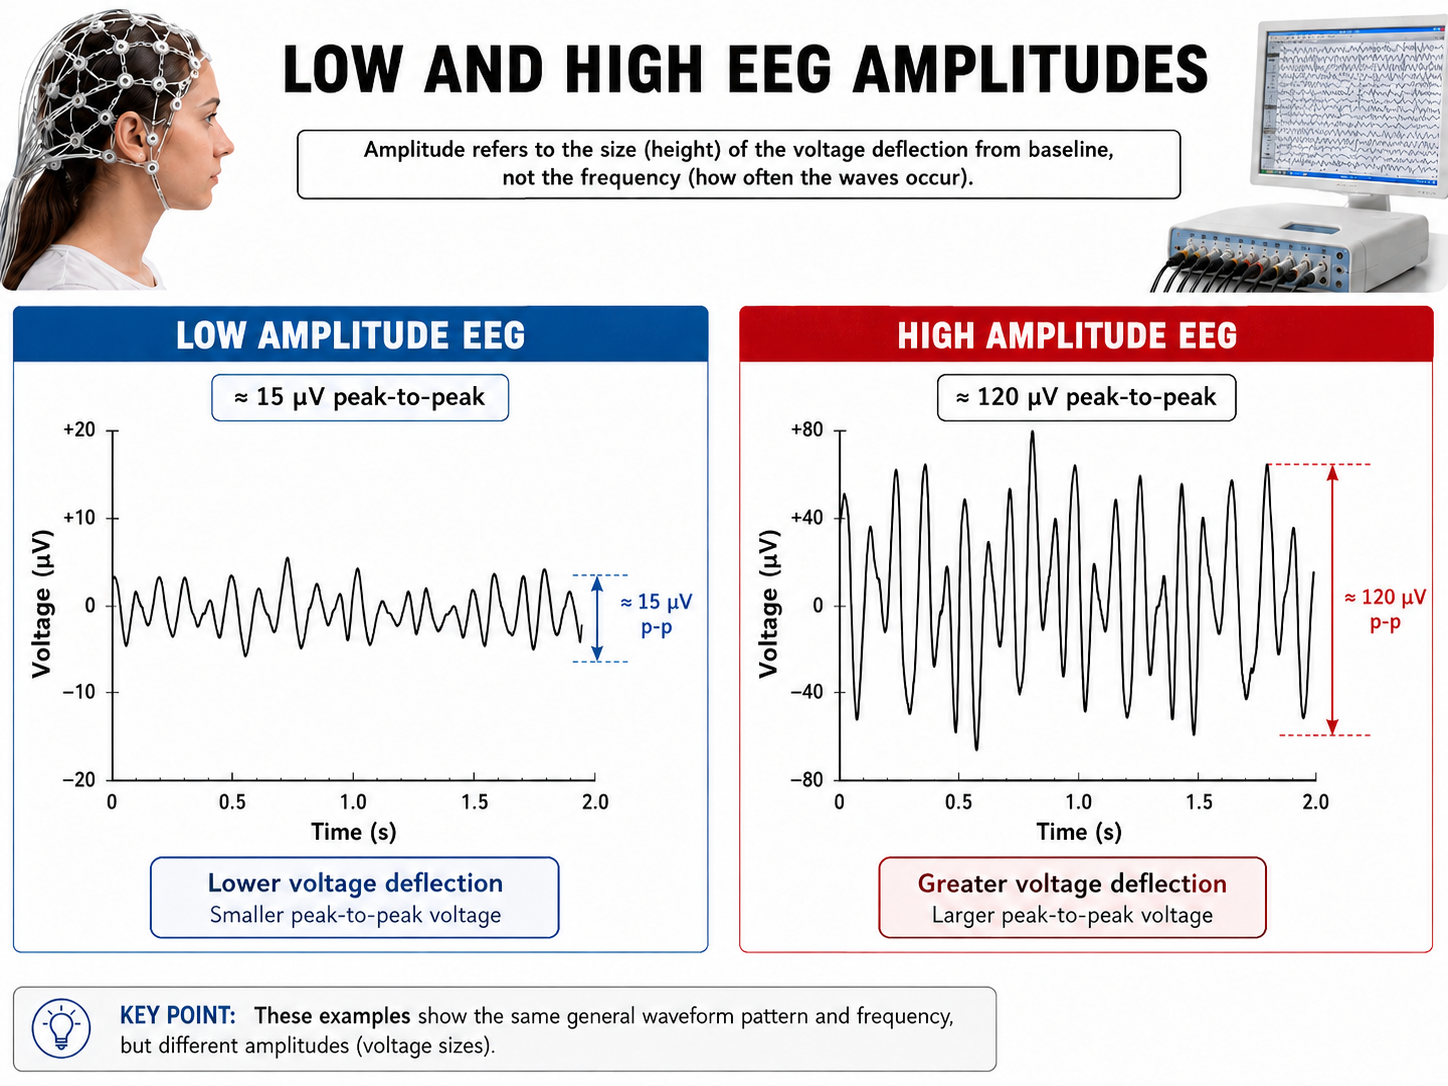
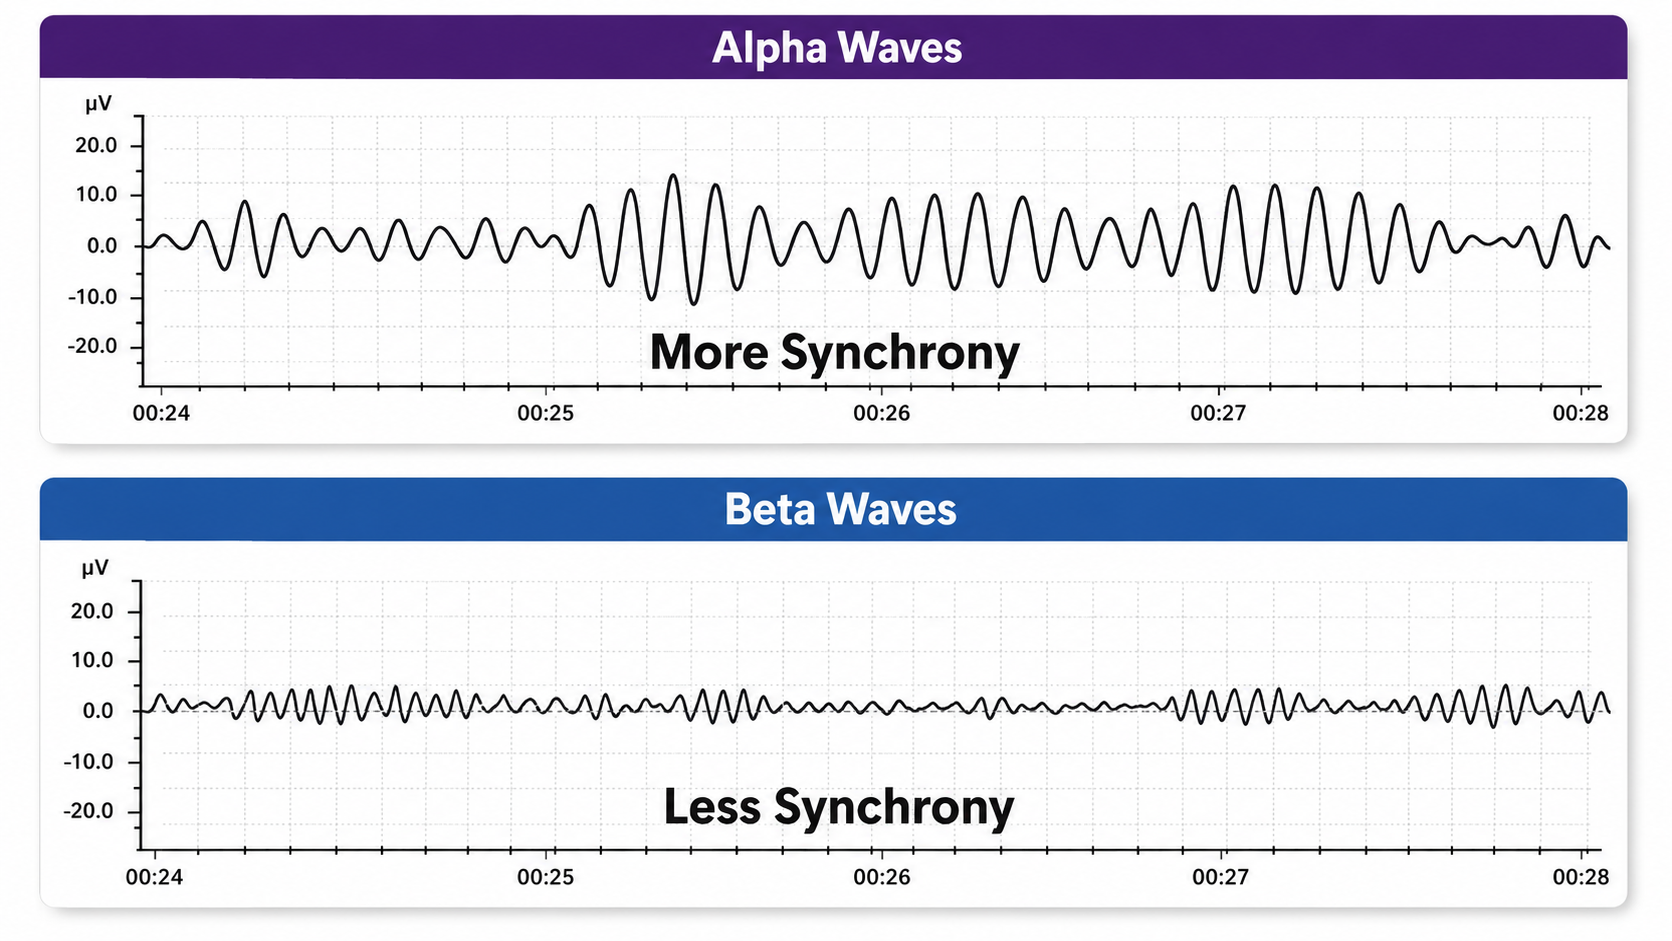
Greater synchrony among neurons firing results in higher amplitude (Demos, 2019). Graphic © John S. Anderson.
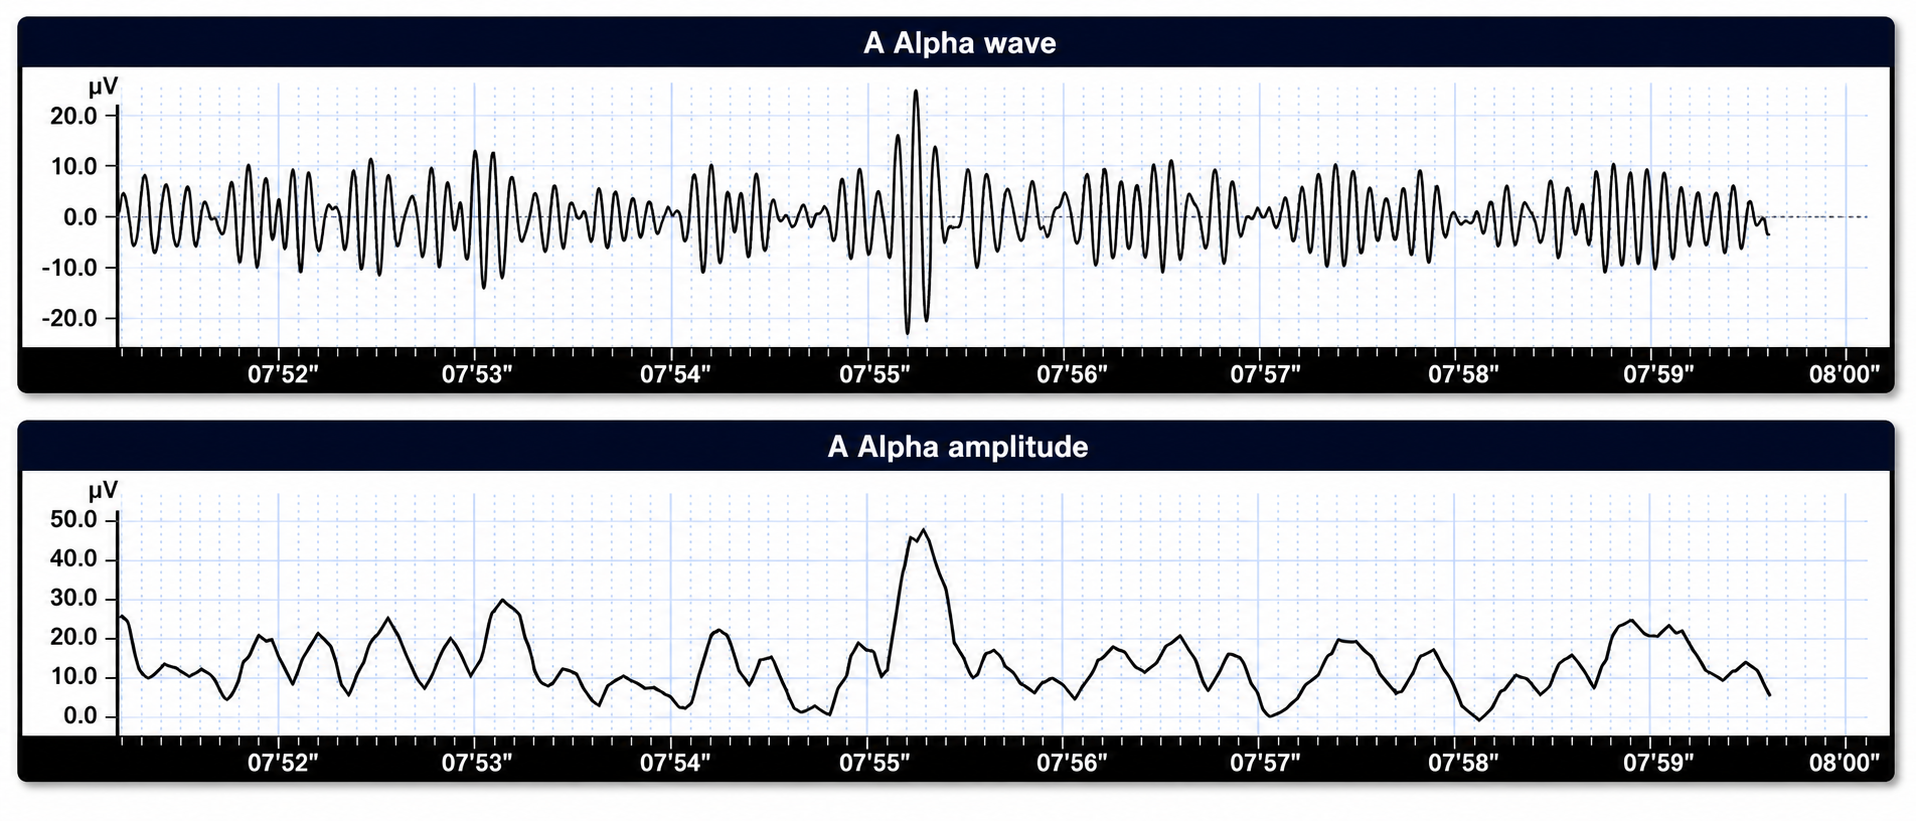
Amplitude displays show voltage using a scale where all values are positive (greater than zero). They only show voltage changes, not the signal waveform. Graphic © John S. Anderson shows the oscillating raw alpha waveform (top) and alpha amplitude (bottom).
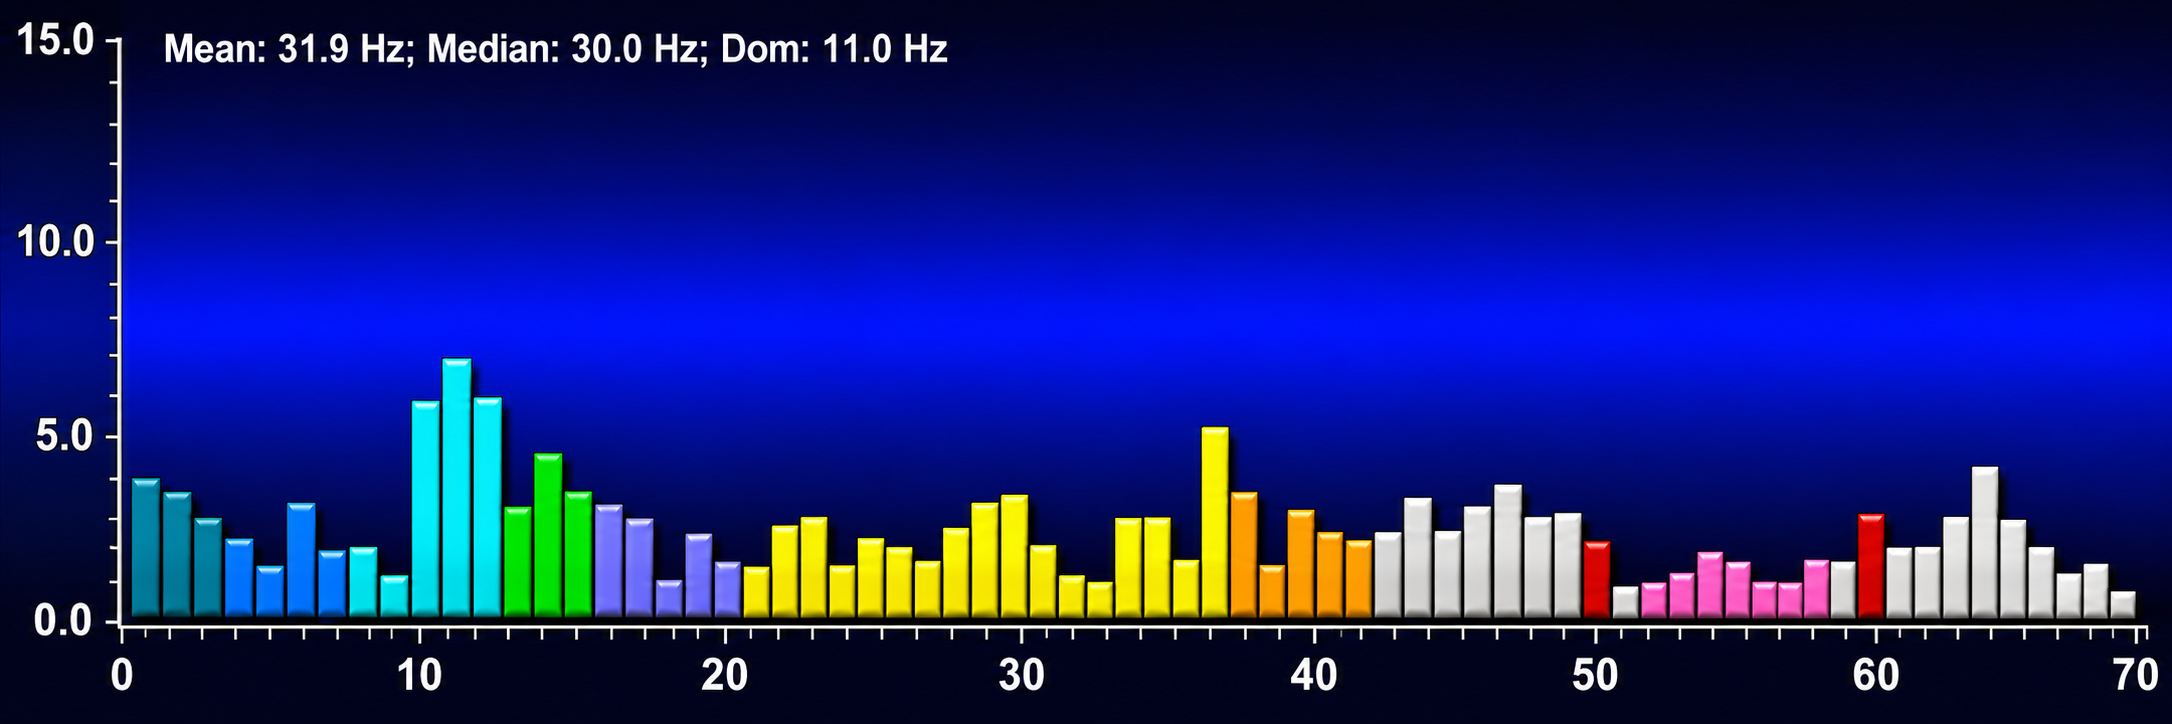
Magnitude represents the average amplitude over a unit of time using quantification methods like peak-to-peak (P-P) and root mean square (RMS). The peak-to-peak method measures waveform "height" from peak to trough. In contrast, the root mean square method squares each sample, averages the squares across the epoch, and takes the square root. RMS represents the equivalent steady voltage that would deliver the same power. For a sine wave, RMS = 0.707 × peak amplitude, and peak-to-peak = 2 × peak = 2.83 × RMS (Collura, 2014). The graphic below that illustrates EEG spectrum magnitude © John S. Anderson.
EEG signal power is the squared magnitude of the signal, conventionally expressed in microvolts squared (µV²) for band power, or microvolts squared per hertz (µV²/Hz) for power spectral density. Amplitude, by contrast, is expressed in microvolts. Converting power to watts requires assuming a load resistance (P = V²/R), which is not a standard EEG convention. Most qEEG databases convert power into standard deviations, whereas the Jewel database transforms amplitudes into standard deviations or Z-scores (Demos, 2019). The graphic below © John S. Anderson shows the EEG power spectrum instead of the magnitude spectrum.
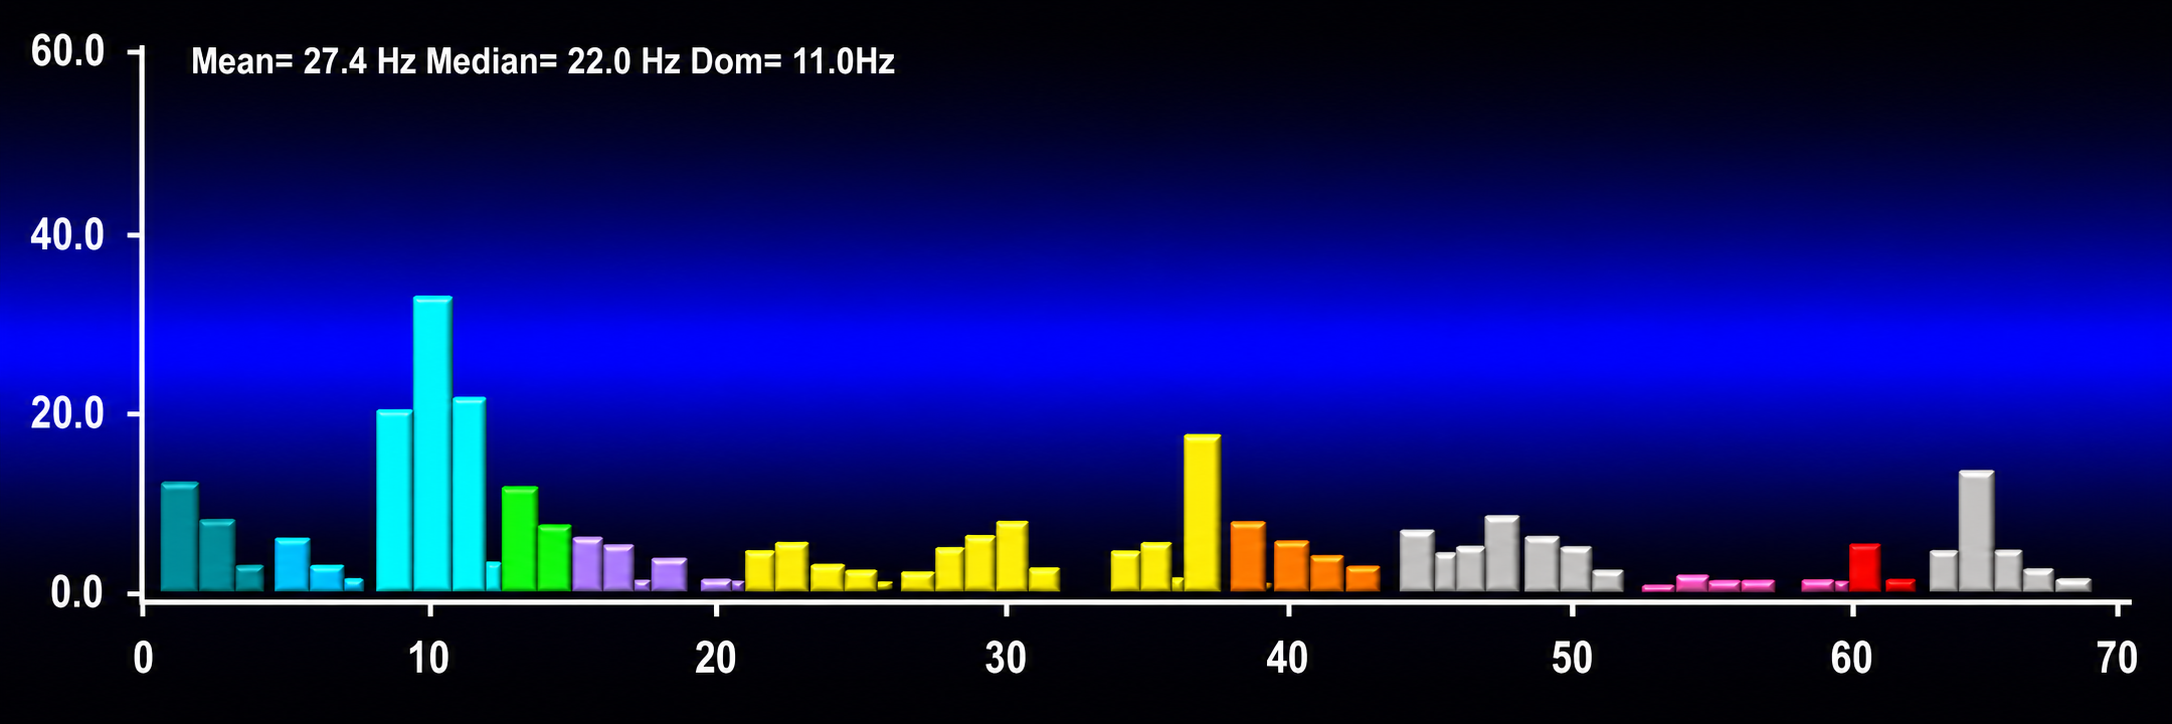
The key feature is that both displays identify the dominant frequency as 11 Hz. That makes sense: squaring a positive magnitude does not usually change which frequency is largest.
The difference is in relative emphasis. In the lower display with the larger vertical scale and more exaggerated peaks, the 10–12 Hz activity becomes much more visually dominant. That is the behavior expected of a power display: a component twice as large in magnitude contributes four times as much power. By contrast, the flatter display is what one expects from a magnitude display, where smaller frequency components remain more visible.
The summary statistics also change. In the flatter display, the mean and median frequencies are higher, about 31.9 Hz and 30.0 Hz, because many moderate high-frequency bins still carry visible weight. In the more peaked display, the mean and median shift downward, about 27.4 Hz and 22.0 Hz, because the strong alpha-range peak around 11 Hz receives disproportionate weight after squaring. These figures come from a wideband demonstration spectrum extending well beyond the clinical EEG range; in a routine clinical recording, where most power falls below 20 Hz, the corresponding means would be far lower.
The two plots therefore do not merely rescale the same picture. They change the apparent importance of frequencies. Magnitude is closer to voltage amplitude; power reflects squared amplitude/variance contribution and is the more appropriate basis for band-power comparisons.
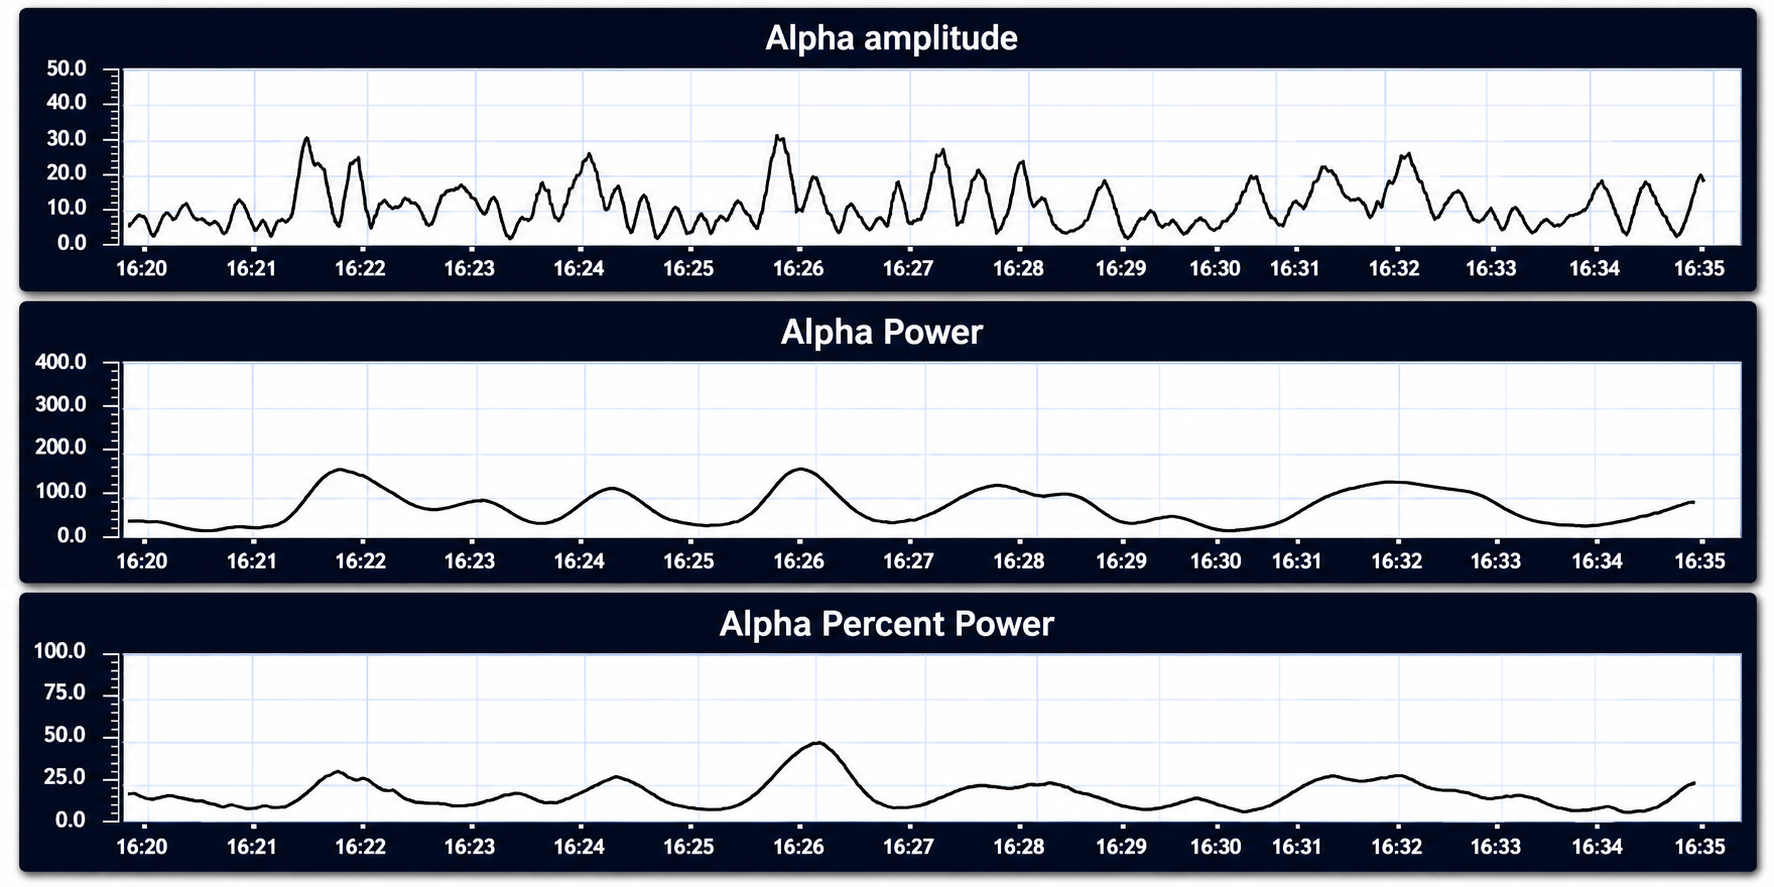
Percent power is the power within a frequency band expressed as a percentage of total EEG power. The graphic below © John S. Anderson shows alpha amplitude, alpha power, and alpha percent power.
EEG waveforms may assume a distinctive shape or morphology like positive occipital sharp transients of sleep (POSTs), spindles (oscillations), and vertex (V) waves that appear over Cz, characteristic of stage N1 and sometimes persisting into stage N2. The graphic below © eegatlas-online.com shows stage 2 sleep.
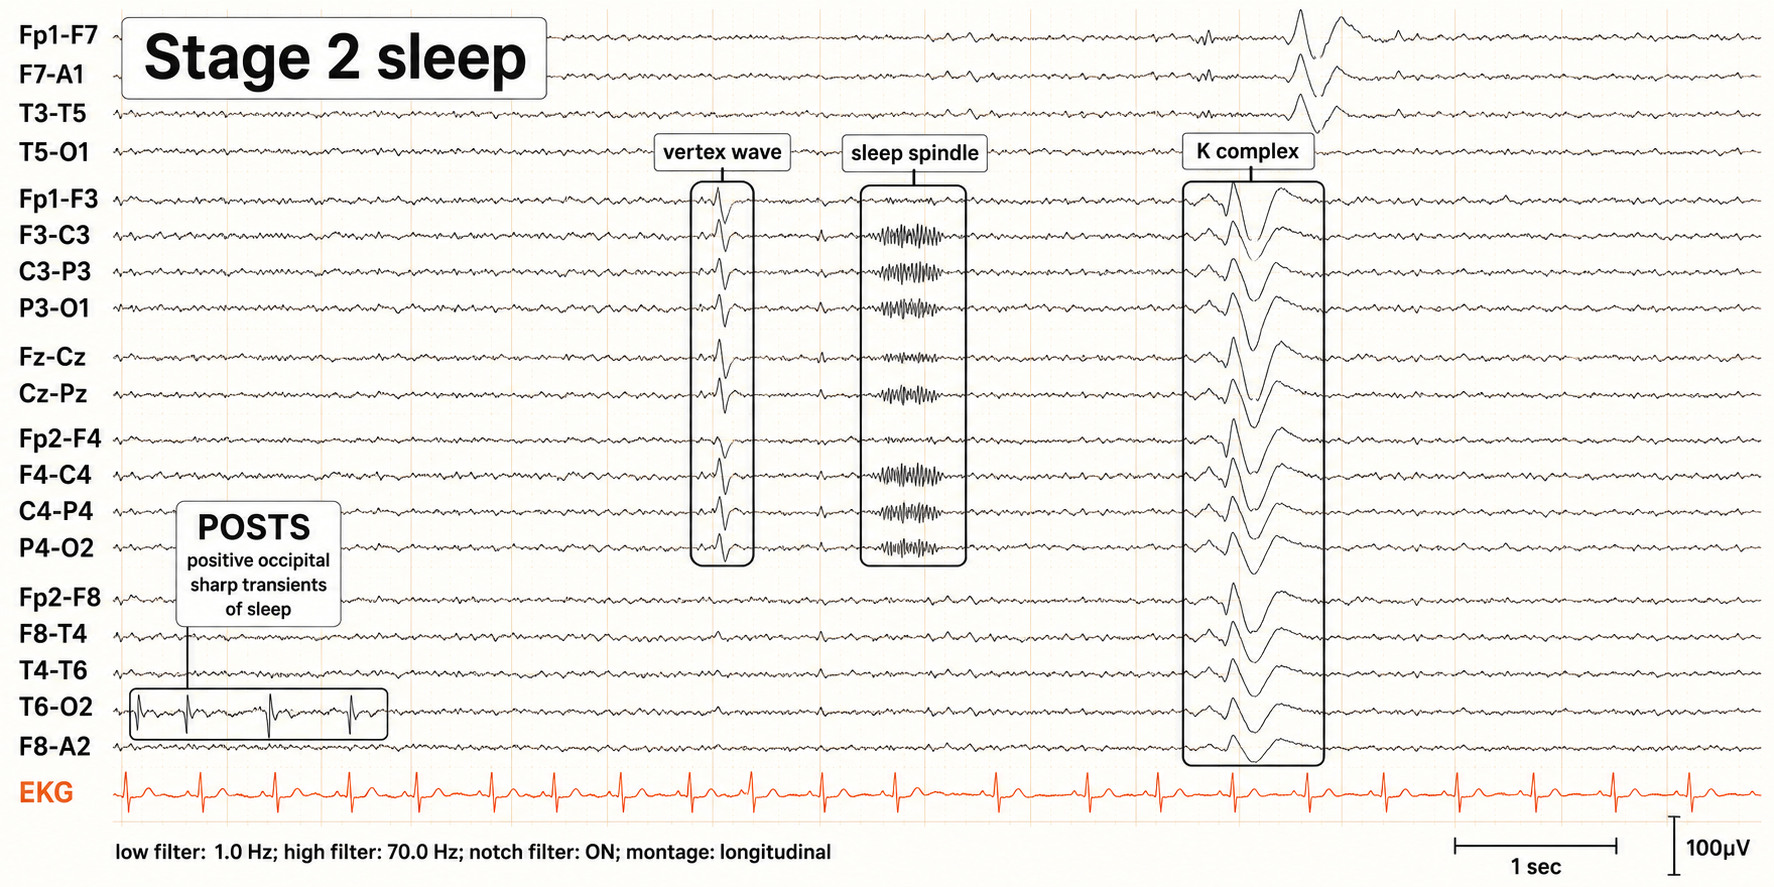
We adapted this graphic from © eegatlas-online.com. This is a teaching-style EEG in the longitudinal montage, and the header tells you the state up front: this is a page of Stage 2 sleep, laid out to introduce the handful of signature waveforms that define it. The chains run in the usual way with an EKG in orange along the bottom and a 100 microvolt, 1-second marker for scale, but the real content is the set of labeled boxes scattered across the page, each one framing and naming a different hallmark of light sleep.
The beginner's temptation is to read the page as one continuous rhythm and try to grade the background. The move that unlocks it is to treat the page as a labeled catalog, letting each box teach you one distinct graphoelement by its shape and its location, then recognizing that the whole collection is what stamps the record as Stage 2 sleep.
Start at the lower left, where the box marks POSTS, the positive occipital sharp transients of sleep. Down in the occipital rows (T6-O2 and its neighbors) you see a little run of crisp, sharp, repeating transients riding in the back of the head, checkmark-like deflections that cluster during drowsy sleep. Move to the center of the page and the tall vertical box labels the vertex wave: a single sharp, pointed deflection that is biggest right over the top of the head in the central and midline channels (the Fz-Cz and Cz-Pz region), a lone spike of sleep. Just to its right, the sleep-spindle box catches a brief, beautiful burst of fast rhythmic activity that waxes and wanes like a spindle of thread, again maximal over the central regions.
Then the largest box on the right frames the K complex: a big, slow, biphasic wave with a sharp component and a broad following swing, dominant over the front-central head and towering above everything around it. Together these are the classic furniture of light sleep, each with its own shape and its own preferred spot on the scalp.
The orange EKG ticking steadily along the bottom rounds things out, giving a heartbeat reference so the sleep transients above stay cleanly separated from the pulse.
Put it together and what this display shows is a guided tour of Stage 2 sleep through its defining waveforms: occipital POSTS in the back, a central vertex wave, a central sleep spindle, and a frontocentral K complex, each boxed and named. The insight comes from reading the page as a labeled field guide, learning each transient by its form and location, and recognizing that the presence of this particular cast of characters together is exactly what identifies the tracing as light, Stage 2 sleep.
FILTERING METHODS AND SUBJECTIVE CHARACTERISTICS OF FREQUENCY BANDS
Sampling
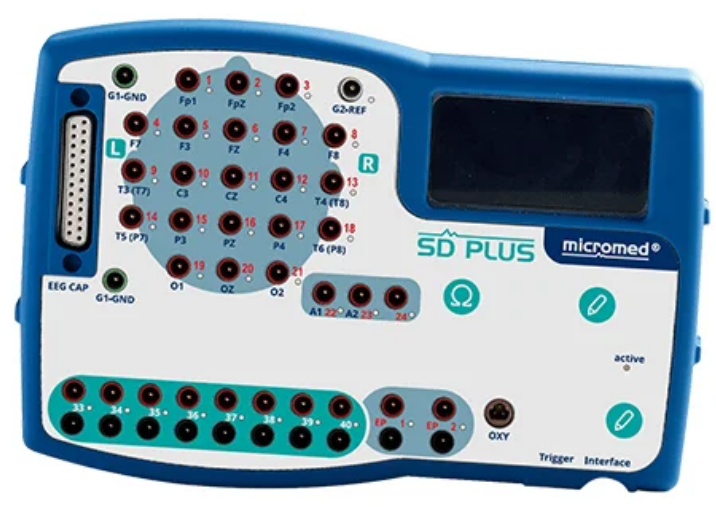
Data acquisition systems digitize and process the raw EEG signal. Digitization transforms the raw signal into a digital form. An analog-to-digital converter (ADC) samples the analog signal (transforms it into numerical values) with a sampling resolution, sampling rate, and epoch length. Graphic courtesy of Deymed,
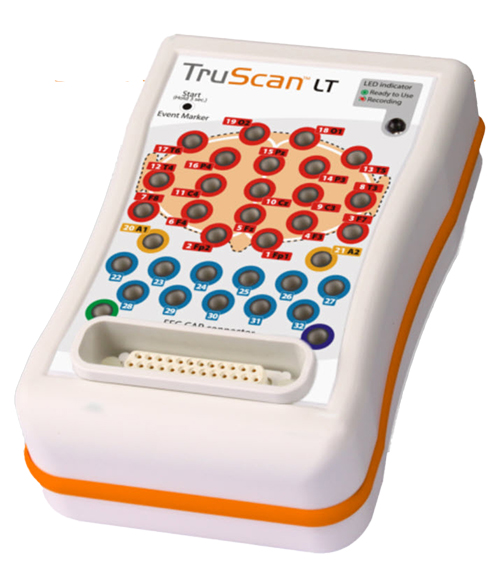
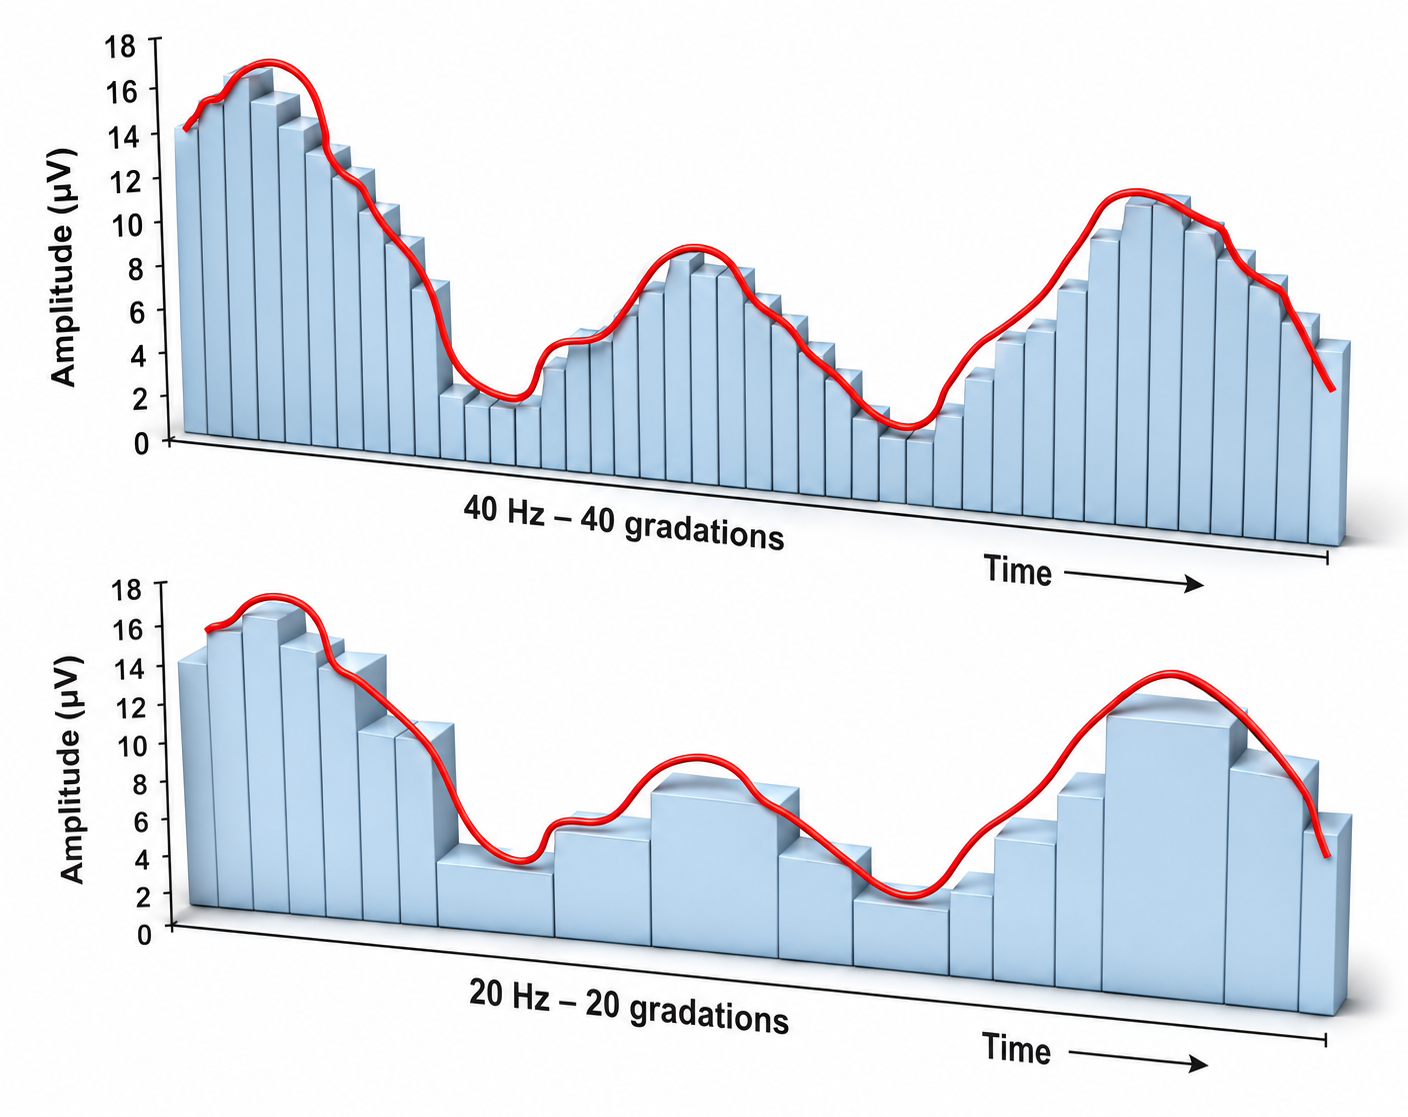
The sampling resolution is the number of digital bits used to represent a signal. Each bit (binary digit) is assigned a binary value of 0 or 1. Systems that sample the EEG signal utilize from 8-24 bits. The advantages of 24-bit sampling are an accurate sampling of the EEG signal's DC and AC components and the ability to sample a wide range of signal voltages called the dynamic range (Collura, 2014). However, the practical benefit of 24-bit conversion is limited by the amplifier’s input noise and the electrode-skin noise floor — its effective number of bits (ENOB) — rather than by the display. Screen resolution affects only how finely a waveform can be drawn; every stored bit remains available to the analysis software.
The sampling rate is the number of times that the ADC samples the EEG signal per second. A rate of more than twice the highest frequency is the minimum acceptable sampling rate when performing Fast Fourier Transform (FFT) analysis. This requirement reflects the Nyquist theorem, which holds that a waveform must be sampled at more than twice its highest frequency component to be reconstructed without distortion (Collura, 2014).
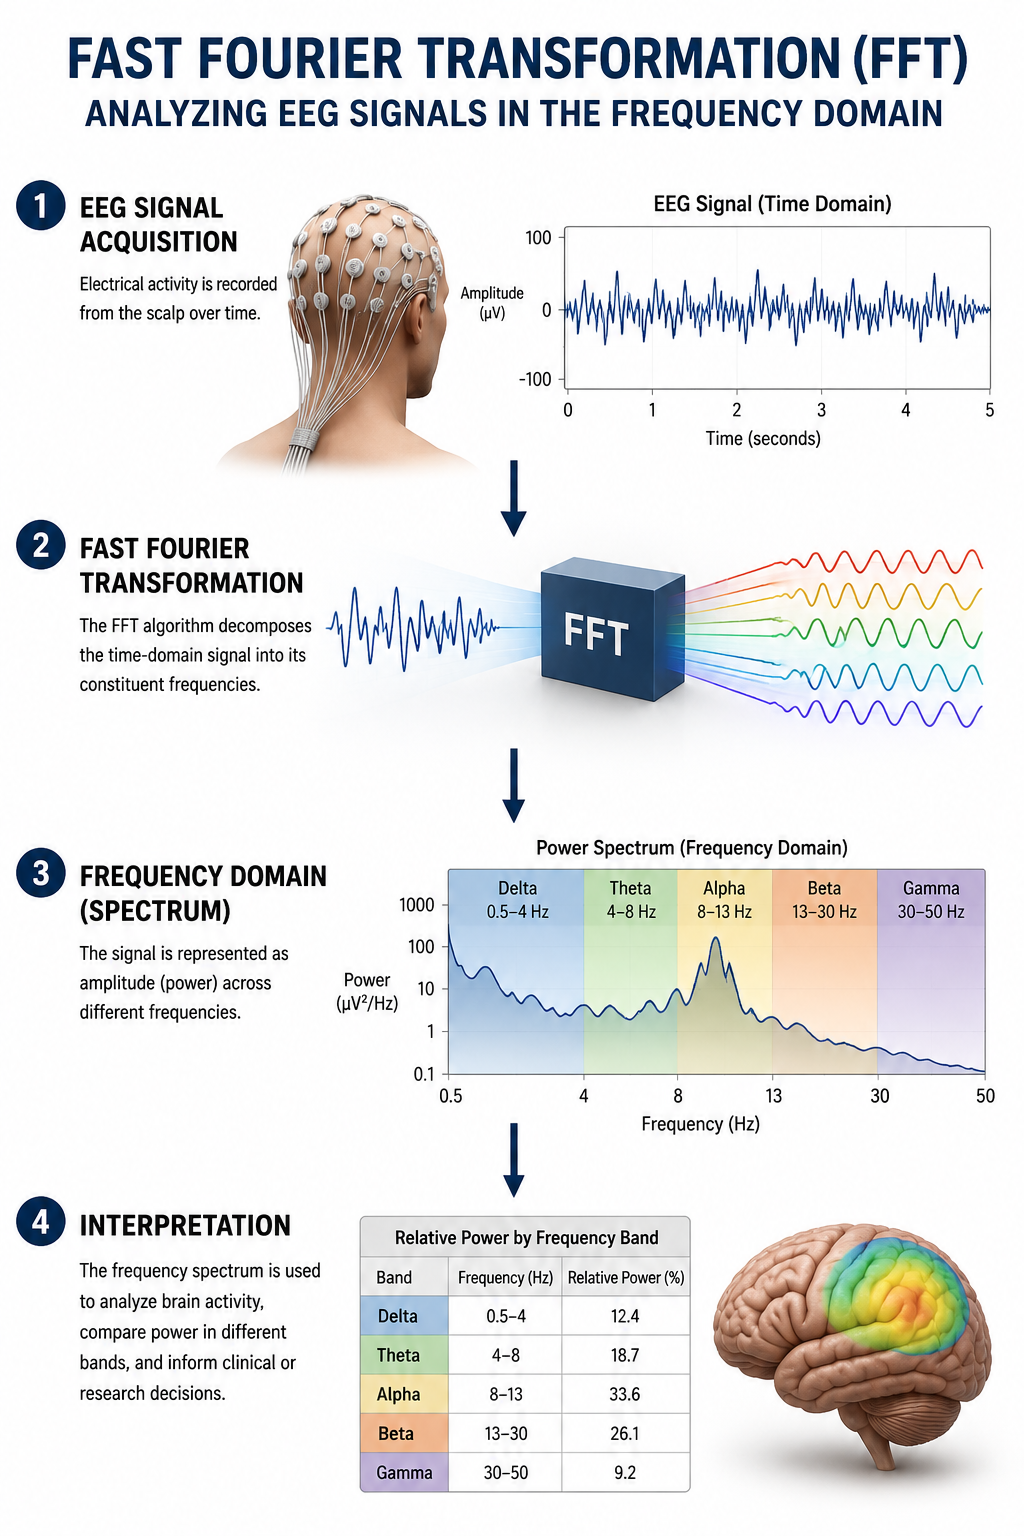
A FFT is a mathematical transformation that converts a complex signal into component sine waves whose amplitude can be calculated. The graphic below shows the decomposition of the original signal (left) into its sinewaves of different frequencies
A rate of just over twice the highest frequency is insufficient to visually represent the EEG signal since it only samples the highest frequency twice per cycle. This low rate also allows the harmonics of 50/60 Hz noise (which can extend to several hundred hertz) to contaminate the EEG signal. For example, when there is a 240-Hz harmonic of 60Hz noise, sampling at 256 samples per second (sps) can result in a spurious 16-Hz waveform. This kind of error, in which an undersampled high frequency is misrepresented as a lower one, is called aliasing (Collura, 2014).
Faster sampling rates are desirable, particularly when resolving high-frequency signals. A sampling rate of 512 sps is a good choice for frequencies up to 64 Hz, and 1024 sps is suitable for frequencies up to 128 Hz. However, a sampling rate of 256 sps is considered adequate for most purposes.
FFT analysis breaks the EEG signal into 1- to 2-s chunks called epochs. Epoch length sets the frequency resolution of the FFT and therefore the lowest frequency it can resolve; the highest frequency the FFT can represent is the Nyquist frequency, half the sampling rate, which is set by the sampling rate rather than the epoch length. Because the longest period the transform can capture equals the epoch length, a longer epoch yields finer frequency resolution: a 1-second epoch separates frequencies in 1-Hz steps, whereas a 2-second epoch separates them in 0.5-Hz steps (Collura, 2014). Graphic © John S. Anderson shows the conversion of a complex signal using FFT.
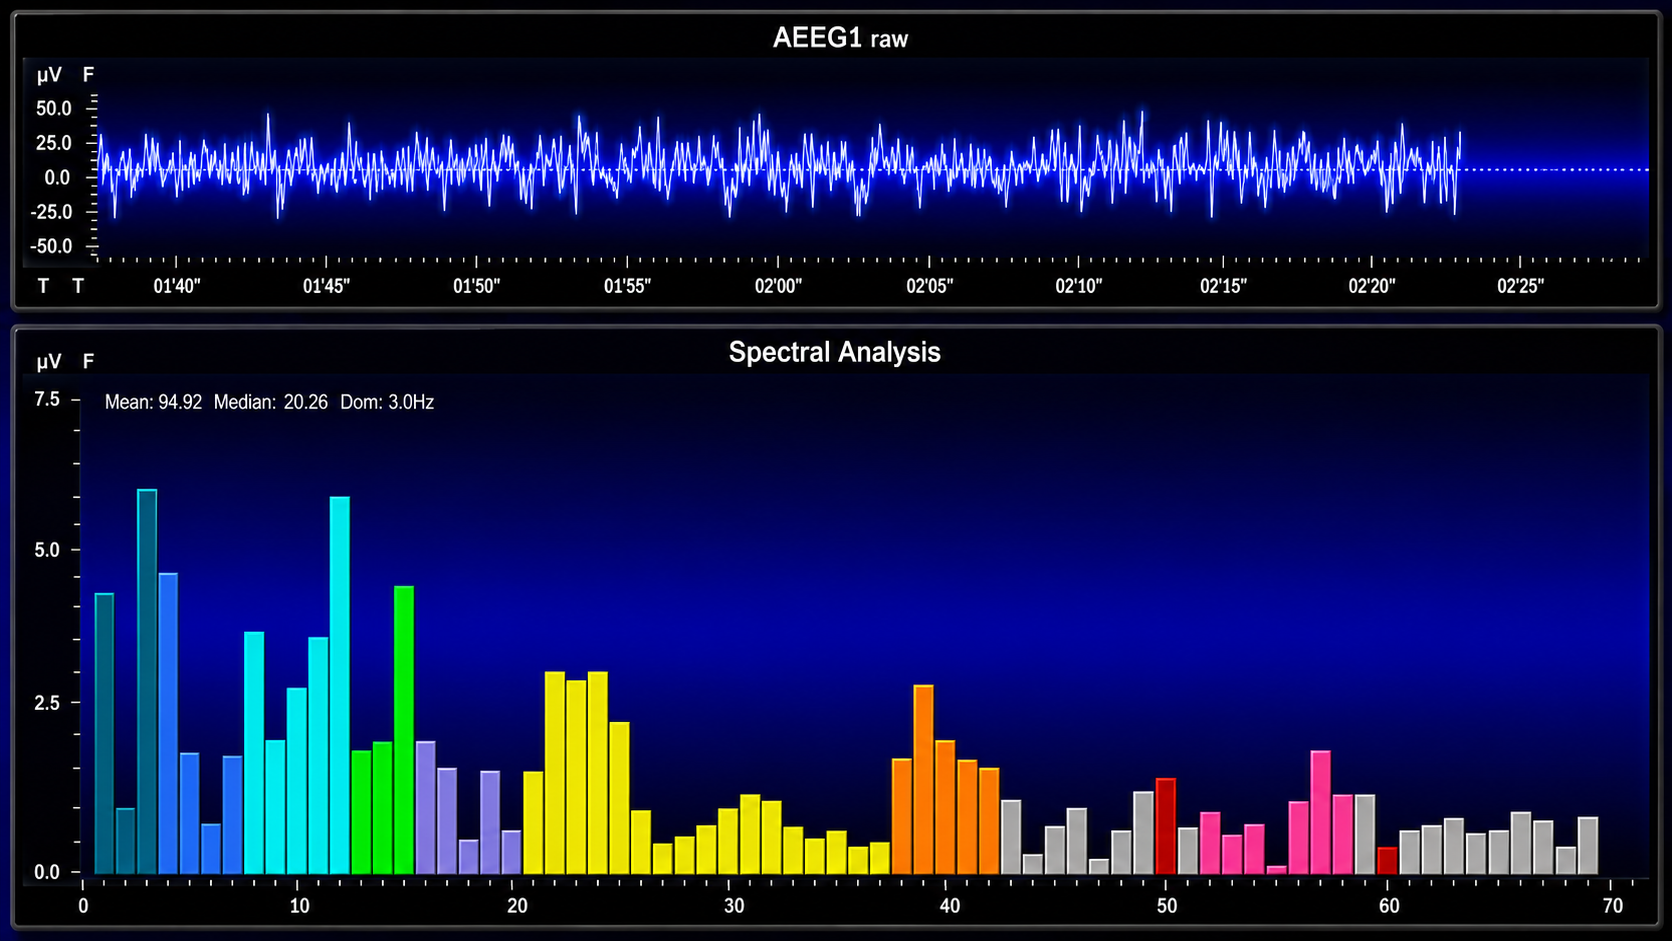
The FFT power spectral analysis video below © John S. Anderson. The top window shows the raw EEG signal, and the bottom window features a spectral display created using FFT analysis.
Joint time-frequency analysis (JTFA) computes values on each data point at rates up to 256 times per second without using a fixed epoch length. Where FFT simultaneously calculates amplitudes for all frequency bands, JTFA analyzes preselected bands. The JFTA graphic © John S. Anderson.
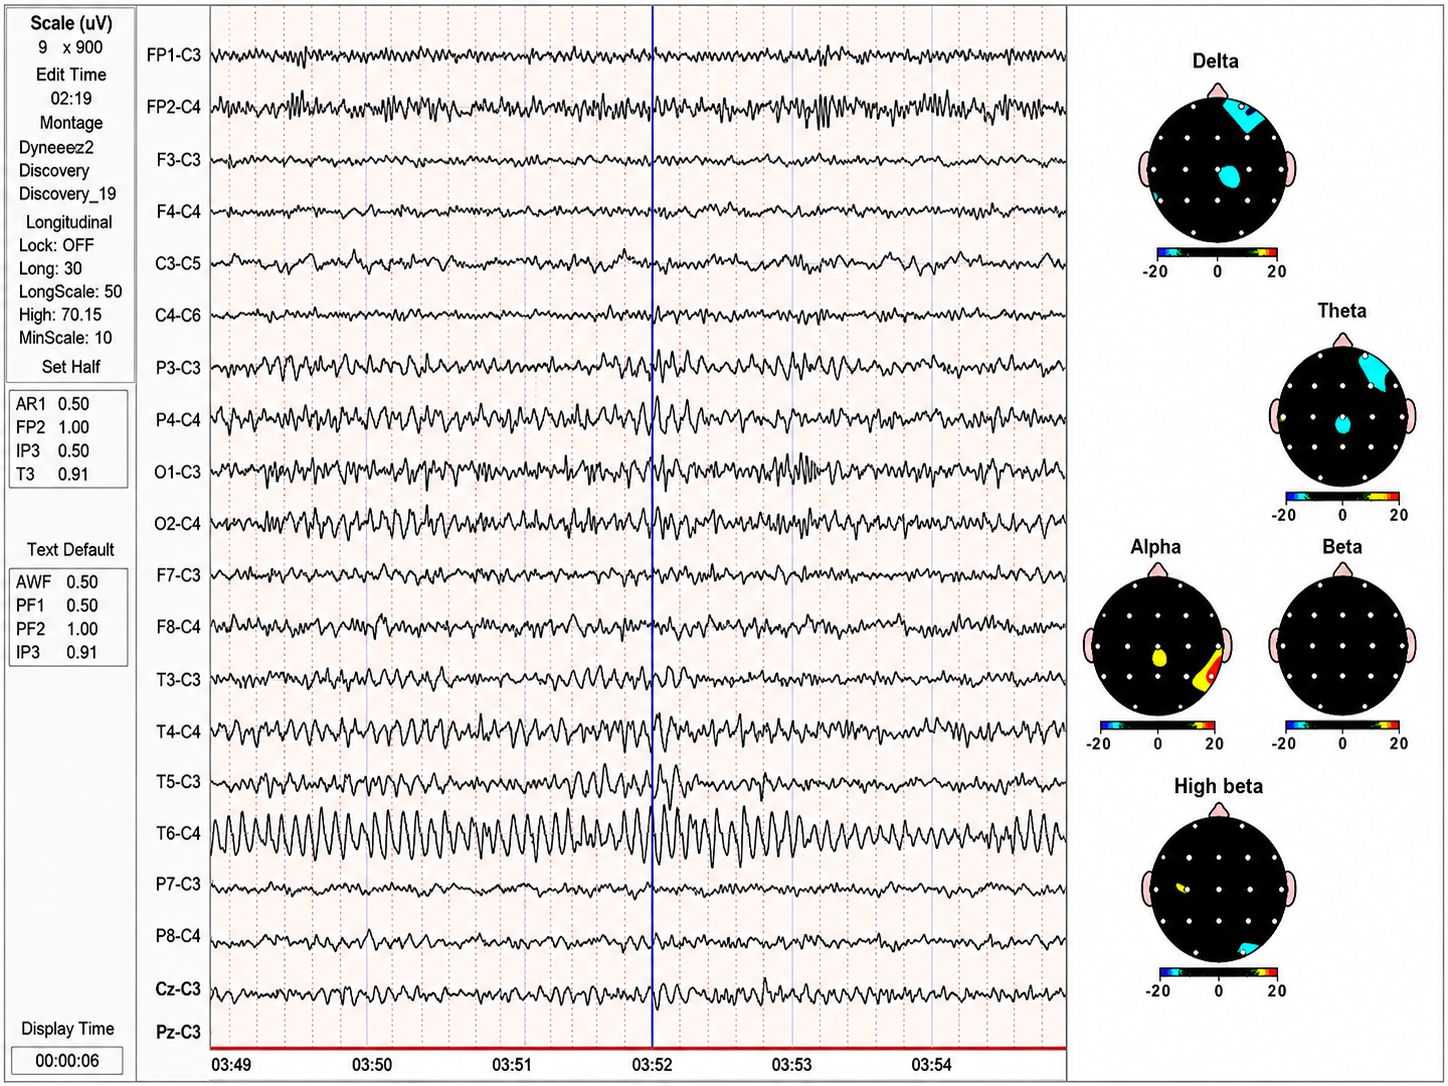
This is a quantitative EEG display, the kind used in neurofeedback work, and its power comes from showing two views of the same brain activity side by side. Down the center run the live waveforms in a longitudinal montage, each channel referenced to a central electrode, with a timeline along the bottom spanning several seconds and a bold blue cursor line dropped at one instant for reference. Off to the right sit five small head maps, one each for the delta, theta, alpha, beta, and high-beta frequency bands, each painting colored blobs onto a schematic scalp against a scale that runs from negative to positive. The left margin holds the software's settings and montage details.
The beginner's mistake is to treat this as either just a stack of squiggles or just a set of pretty brain pictures, and to read only one half. The move that unlocks it is to understand that the two halves are the same data in two languages: the raw traces show the activity moment to moment, while the head maps take that activity, sort it by frequency, and show you where on the scalp each rhythm lives. Reading the display means letting the waveforms and the maps talk to each other.
Start with the traces and one row leaps out. The right posterior-temporal channel (T6-C4) carries a striking, tall, remarkably regular sinusoidal rhythm, a smooth repeating oscillation far more organized and higher in amplitude than the busier, more mixed activity filling the other rows. It stands apart as the single most distinctive event on the page, a focal rhythmic run parked over the right posterior head.
Now turn to the maps and read them as a location guide. Each colored patch tells you where a given frequency band is concentrated: the slower delta and theta maps light up over the right frontal and central regions, while the alpha map glows warm (higher values) over the central and right temporal area, and the fast beta and high-beta maps stay comparatively sparse with only small scattered spots. Together they translate the raw traces into a topography, showing not just which rhythms are present but which corners of the scalp they favor.
Put it together and what this display shows is a quantitative marriage of waveform and map: live traces anchored by a time cursor, dominated by a focal, high-amplitude rhythmic run over the right posterior-temporal channel, paired with frequency-band head maps that localize where the slow and alpha rhythms pool across the scalp. The insight comes from reading the two panels as one, letting the standout rhythm in the traces and the colored hot spots in the maps point together to where the action sits on the head, rather than studying either the squiggles or the brain pictures alone.
Filtering the Data
After a differential amplifier boosts the EEG signal, it is filtered and then amplified by a second single-ended amplifier. Click on the Read More button to review how filters work.
Filters exclude unwanted EEG frequencies to detect activity of clinical interest and minimize artifact and distortion. Clinical EEG analysis uses low-frequency, high-frequency, bandpass, and notch filters (Libenson, 2024). Clinicians should widen filter settings — reviewing at a broad bandpass such as 1-70 Hz — before judging EEG morphology (Demos, 2019).
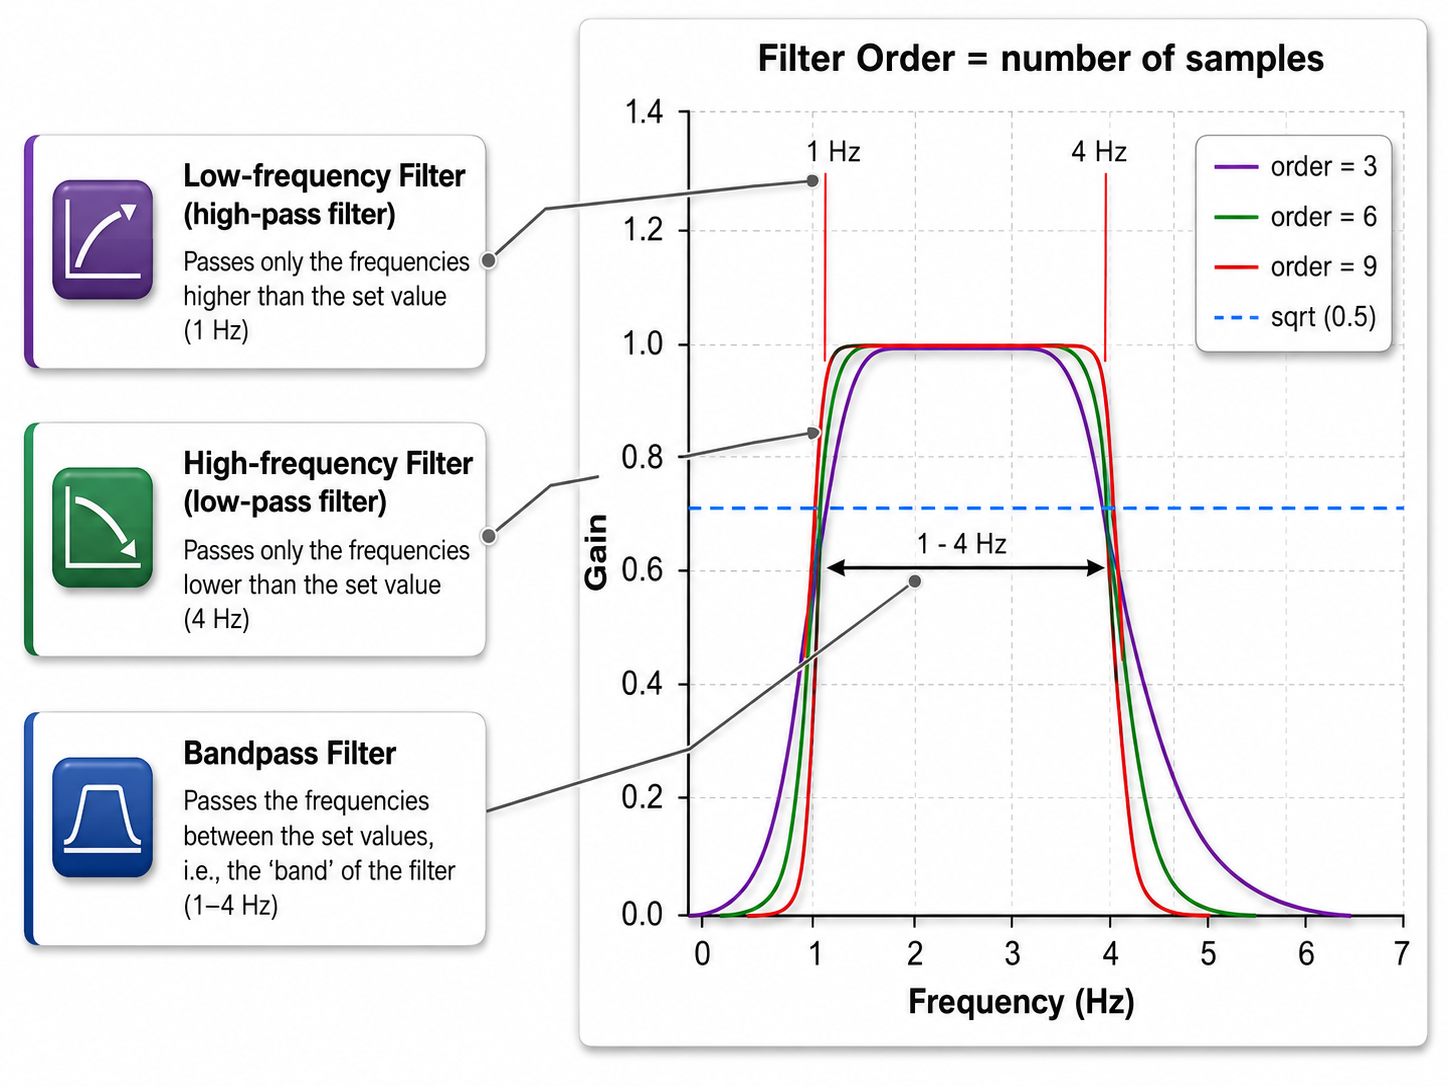
A low-frequency filter (high-pass filter) filters out low-frequency activity and passes only the frequencies above a set value (e.g., 1.6 Hz).
A high-frequency filter (low-pass filter) filters out high-frequency activity and passes only the frequencies lower than the set value (e.g.,15 Hz). This filter can help reduce the distortion that electromyographic (EMG) artifact causes to the raw EEG waveform (Thompson & Thompson, 2015).
"However, use of filters to remove EMG artifact must be used with care because muscle artifact is broadband so that the remaining signal might well contain subtle but significant muscle artifact in roughly the 15-30 Hz range, where genuine EEG power is typically low. Such subtle artifact could substantially reduce signal-to-noise ratio in the beta band” (Nunez & Srinivasan, 2006).
A bandpass filter passes the frequencies between the set values, which constitute the "band" of the filter.
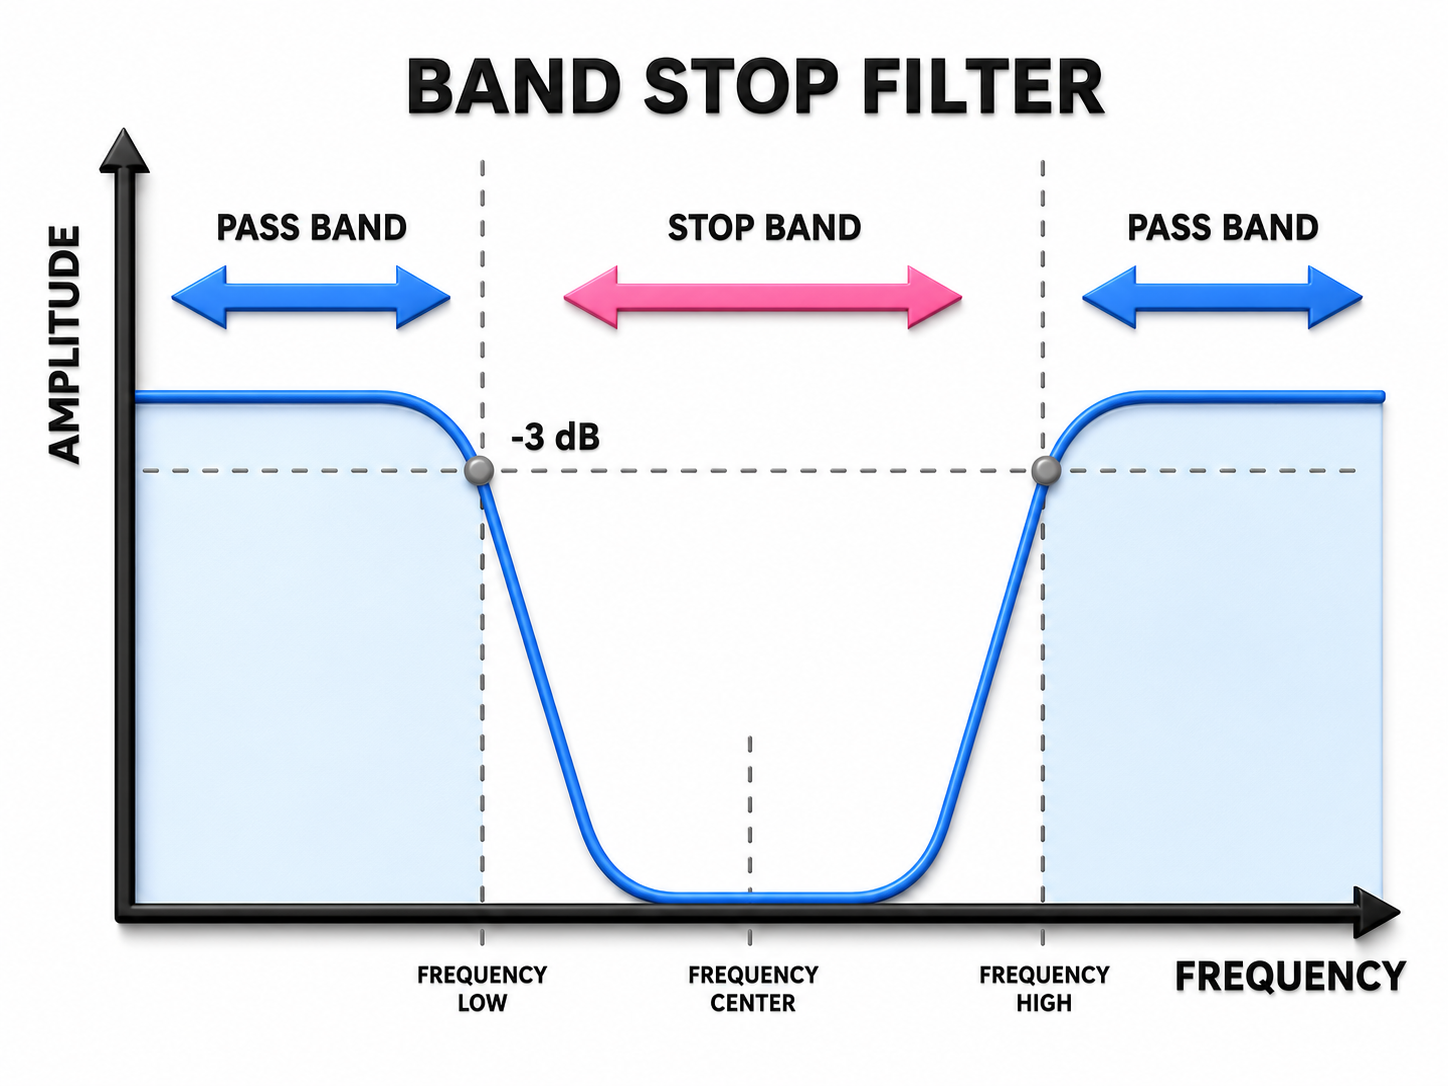
A notch filter excludes a narrow frequency band to control 50/60Hz artifact produced by line current (Libenson, 2024). The stop band is the range of frequencies attenuated by a notch filter. Use notch filters as a last resort. Stop band graphic © Pepermpron/Shutterstock.com.
Analog and Digital Filters
Analog filters contain analog circuits designed using components like capacitors, resistors, and operational amplifiers. Analog filters represent voltage as continuously varying. Any analog filter containing feedback is inherently infinite impulse response (IIR) in behavior, an approach described below.
Digital filters use digital processors, like a digital signal processing (DSP) chip, to exclude unwanted frequencies. First, an analog-to-digital converter (ADC) samples and digitizes the analog signal, representing signal voltages as binary numbers. Second, a DSP chip performs calculations on the binary numbers. Third, a digital-to-analog converter (DAC) may transform the sampled, digitally filtered signal back to analog form. We adapted this graphic © Fouad A. Saad/Shutterstock.com.
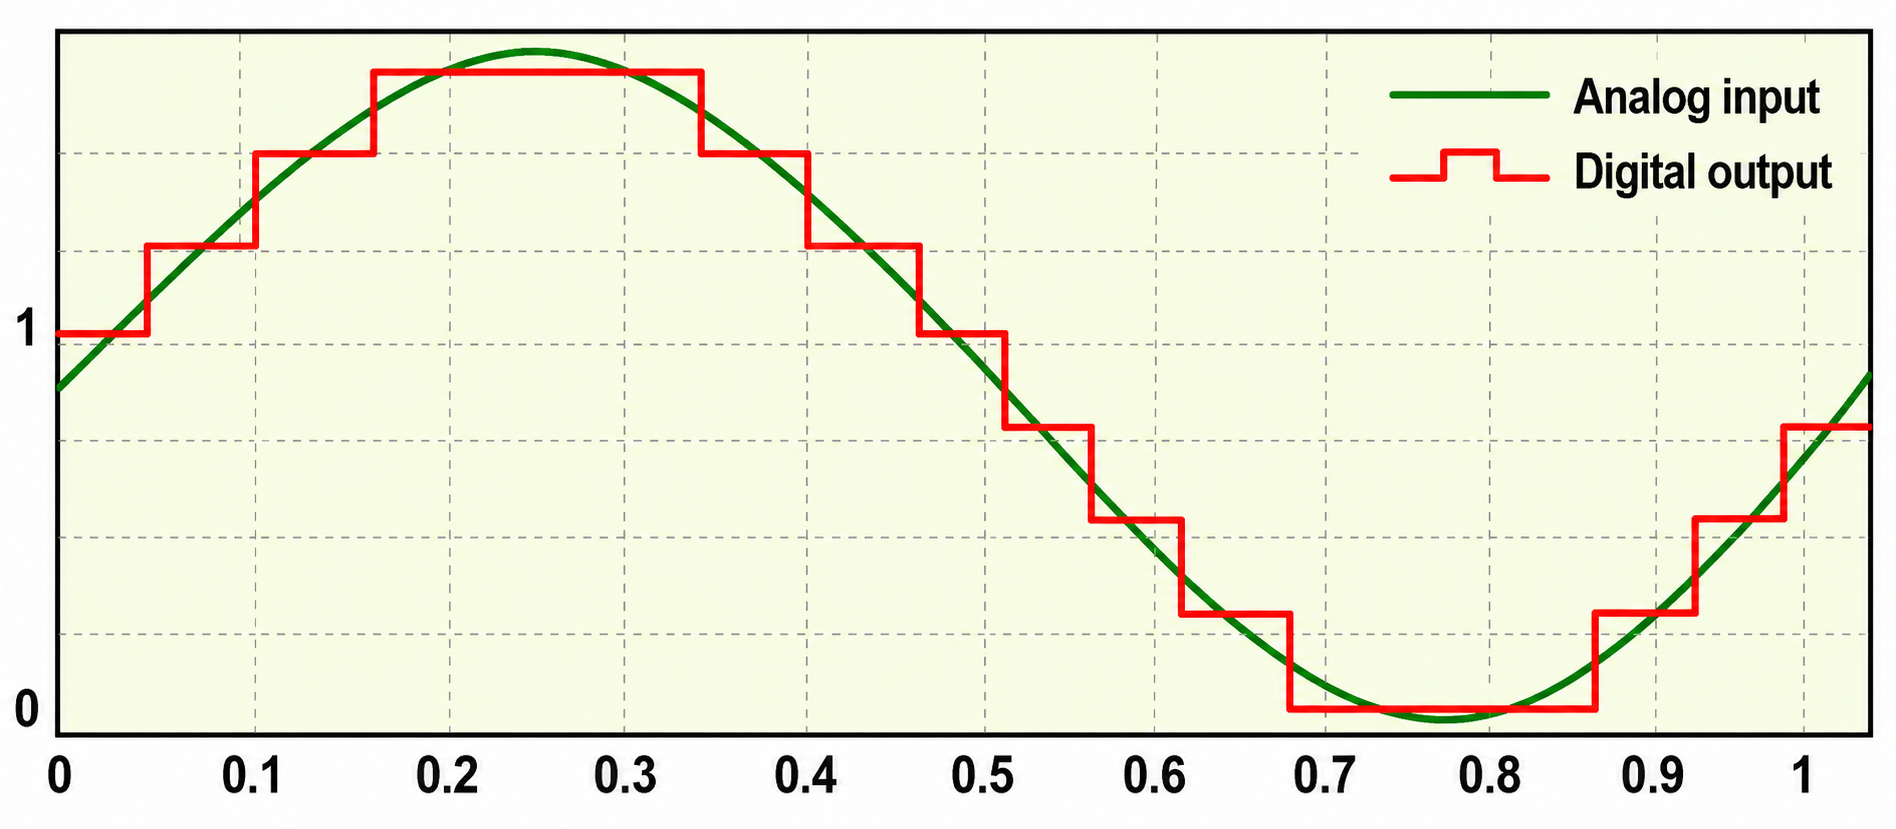
Three main methods of digital filtering are finite impulse response (FIR), infinite impulse response (IIR), and Fast Fourier Transformation (FFT). Digital filters primarily pass data within a bandpass (e.g., 13-15 Hz) but do not wholly exclude frequencies above and below this frequency range. These frequencies are attenuated to varying degrees (Thompson & Thompson, 2015).
FIR filters continuously update their averaging of EEG voltage with new data points. A filter's order is determined by the number of data points that it averages. A higher-order filter more sharply attenuates frequencies outside the bandpass. Software may allow you to select both filter type and order. FIR filters attenuate frequencies above and below the bandpass more gradually than IIR and FFT filters.
Higher-order filters trade speed and latency for precision. The output of a higher-order filter provides a more accurate picture of the power in a specified band but does so more slowly than a lower-order filter. Recall that the order of a filter refers to the number of data samples used to calculate the output. A higher-order filter computes an output using more samples and is more accurate but introduces a longer delay, as each sample represents a period.
IIR filters compute each output sample from current and previous input samples together with previously computed output samples. This feedback lets a small number of coefficients produce a very long effective impulse response. Demos (2019) likens these filters to a sieve that admits the signal of interest while discarding frequencies that won't be trained or measured. IIR filters are recursive because they use part of their output as input. IIR filters attenuate frequencies outside the bandpass more sharply than FIR filters with the same order, have greater time delay (that depends on frequency) due to greater filter sharpness, achieve faster computation due to their lower order, and are less stable than FIR filters.
FFT filters use Fast Fourier transforms to calculate the average voltage of an EEG signal's component frequencies for a specified time. This period must be at least as long as the most extended frequency period or wavelength. Therefore, to adequately represent 1 Hz (wavelength of 1000 ms) activity in the EEG using a FFT, at least 1 s of data must be used. This results in a too-slow response to provide the optimal representation of the data for real-time training - generally considered to be 250 ms or less. Because of this, FFTs are used for offline signal analysis and processing (qEEG) but not for either amplitude or z-score neurofeedback training.
Demos (2019) likens these filters to slicing a pie. FFT-based filtering computes the same result as direct FIR convolution and therefore produces the same roll-off; for long filter kernels it requires less computation, not more. A related technique — zeroing out-of-band FFT bins and inverse-transforming — can produce a very steep cutoff, but introduces ringing and edge artifacts in the time domain (Fisch, 1999; Thompson & Thompson, 2015).
Digital filtering methods enjoy four advantages over analog filters. First, clinicians can retrospectively adjust filter settings when reviewing the EEG record since digital filters are programmable. Second, digital filters can be designed to minimize phase distortion (displacement of the EEG waveform in time). Third, digital filters can achieve greater stability over time and across various frequencies. Fourth, digital filters can more accurately process low-frequency signals.
Since different digital filters can produce widely different statistics for the same frequency range, use the same filter for all statistical calculations (Thompson & Thompson, 2015).
Filters attenuate whole ranges of frequencies, but they cannot separate genuine brain activity from artifact that overlaps the band of interest, such as broadband muscle activity that intrudes on the beta range. A complementary approach decomposes the recording with independent component analysis and then classifies each component as brain or artifact. ICLabel, a classifier trained on thousands of expert-labeled components, automates this triage and returns the probability that a component reflects brain activity, muscle, eye movement, heartbeat, line noise, or channel noise (Pion-Tonachini et al., 2019). Newer deep-learning models such as the U-Net autoencoder IC-U-Net reconstruct clean multichannel EEG directly rather than discarding whole components, which preserves more of the underlying signal (Chuang et al., 2022). These tools are reshaping offline qEEG preprocessing, although real-time neurofeedback still relies on fast filters because component-based methods add latency beyond the 250-millisecond window that effective training requires.
Single-Hertz Bins
Neurofeedback providers using products like the Neuroguide LifeSpan database use single-hertz bins to determine the best training range for each client. They locate the highest amplitude bin (highest z-score) and select a range centered on that bin. Deviations from normal are correlated with clinically significant conditions. For example, lower than normal posterior dominant rhythm (PDR) values may index cognitive decline. For example, if the highest amplitude bin was 9 Hz, you could choose an 8-10 Hz training range. The wider the range, the less specific the training is to the highest amplitude bin (Demos, 2019).
Single-hertz bins also help identify the posterior dominant rhythm (PDR), the highest amplitude frequency detected at the posterior scalp. The PDR is measured with eyes closed, and interpretation is based on age. Published norms give roughly 6 Hz at 1 year, 8 Hz by about 2-3 years, 9 Hz by about 8 years, and 10 Hz between about 10 and 15 years, with sources differing on exactly when 10 Hz is reached. For adults, the normal range is 8-13 Hz, typically 9-11 Hz (Demos, 2019; Blume; Petersén & Eeg-Olofsson, 1971).
A clinician preparing an alpha uptraining protocol for a 52-year-old client with attention complaints first records two minutes of eyes-closed EEG and inspects the single-hertz bins over the posterior scalp. The highest-amplitude bin falls at 9 Hz rather than the textbook adult value near 10 Hz, a mild slowing worth noting but not alarming on its own. Rather than reinforcing a fixed 8 to 12 Hz band, the clinician centers the reward window on an 8 to 10 Hz range so that training tracks this client's individual posterior dominant rhythm. Narrowing the range increases specificity to the target bin, while widening it captures more of the client's natural variability, so the clinician documents the chosen settings for use in later sessions. This example shows why signal processing choices are clinical choices rather than merely technical ones.
Digitization converts the continuous analog EEG into numbers, and three settings govern the outcome: sampling resolution in bits, sampling rate in samples per second, and epoch length in seconds. The Nyquist theorem requires sampling above twice the highest frequency of interest, and undersampling produces aliasing, in which a high frequency masquerades as a lower one. Filters isolate activity of clinical interest, with finite impulse response, infinite impulse response, and Fast Fourier Transform methods trading speed against sharpness and time delay. Because different filters yield different statistics for the same band, clinicians should apply one filter consistently across all calculations. Single-hertz bins let providers center a training range on a client's highest-amplitude bin and help identify the posterior dominant rhythm, whose normal value depends on age.
Subjective Characteristics of Frequency Bands
Most EEG power or signal energy falls within the 0-20 Hz frequency range. You may recall that hertz (Hz) is an abbreviation for cycles per second. The dominant frequency is the frequency with the greatest amplitude. In awake adults it lies in the alpha band, 8-13 Hz and typically 9-11 Hz, with 8-8.5 Hz taken as the lower limit of normal. EEG amplitude is measured in microvolts and EEG power in microvolts squared.
Higher frequencies reflect cognitive activity and active processing of sensory input. They involve relatively desynchronized activity like alert wakefulness and rapid eye movement (REM) sleep. Lower frequencies reflect strongly synchronized activity like interactive neuronal communication, control of network activity, nondreaming sleep, and coma.
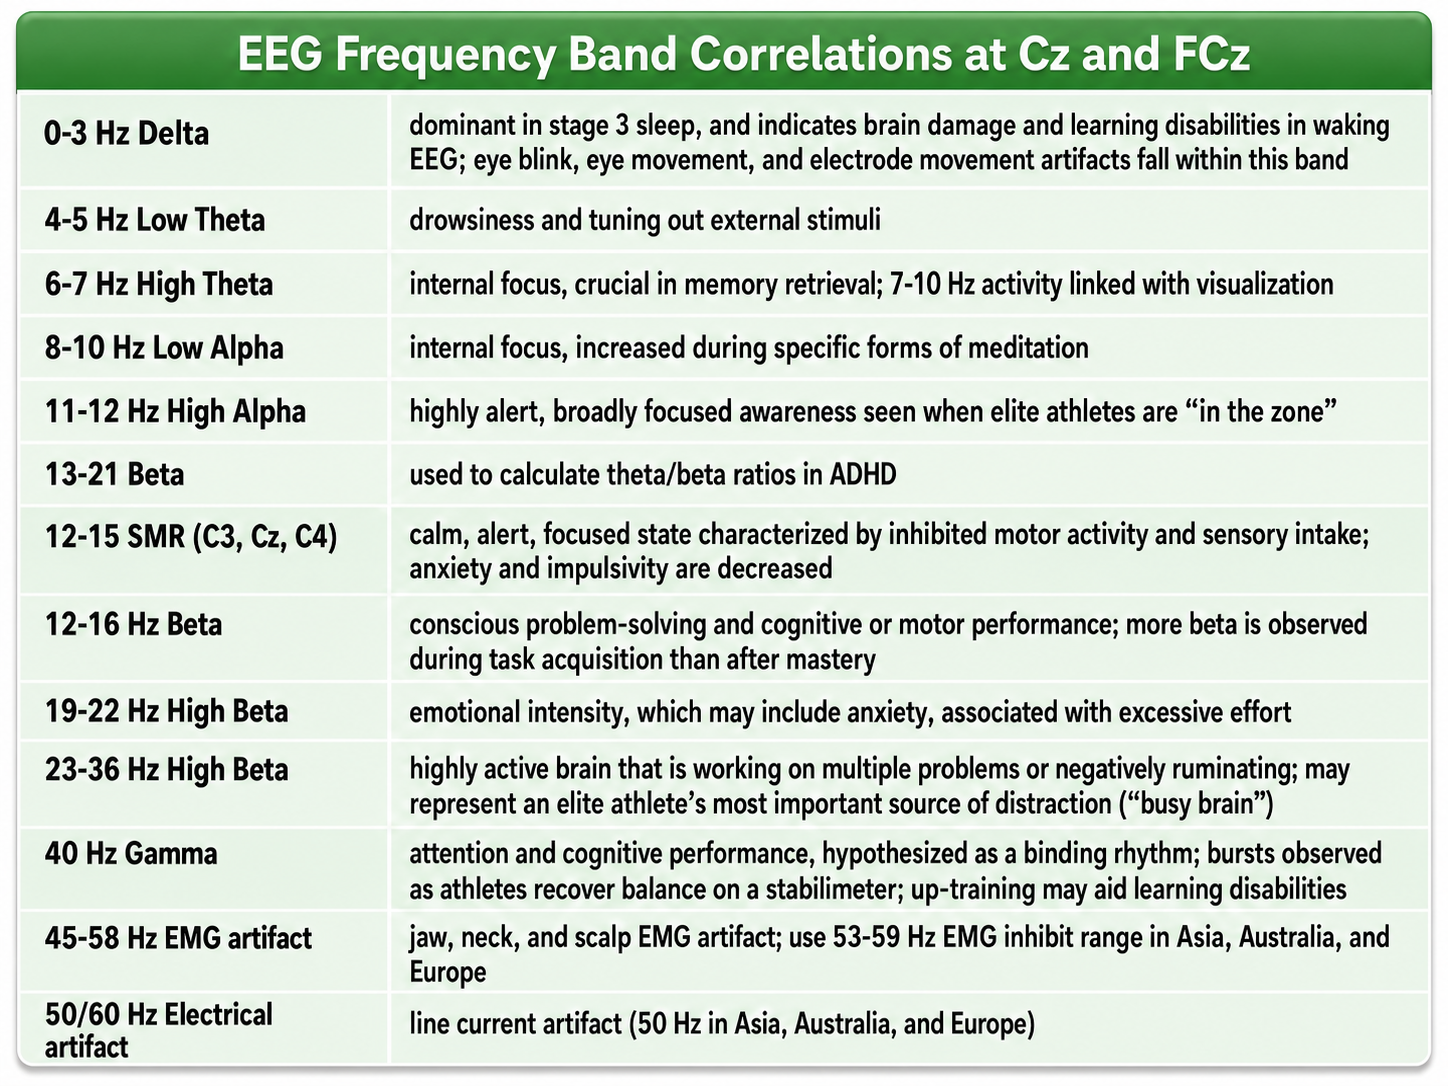
The table below is adapted from Wilson et al. (2011) and based on Thompson and Thompson (2015). Different authors define frequency bandpasses differently. For example, delta 0.5-3 Hz or 1-4 Hz.
SLOW CORTICAL POTENTIALS (BELOW 1 HZ)
Recall from the opening of this unit that EEG activity ranges from DC to gamma. The table above begins at delta, but the spectrum does not. At its slow end lie the slow cortical potentials (SCPs), gradual voltage shifts that oscillate below 1 Hz and cluster near 0.3 Hz. Because these shifts are slower than the low-frequency filter settings discussed earlier, they are invisible in a routine recording and require a DC-coupled amplifier to observe. They also differ from the bands that follow in what they represent: where delta through gamma reflect the rhythmic output of particular generators, SCPs index cortical excitability itself, the readiness of a cortical region to respond (Birbaumer et al., 1990).
Slow Cortical Potential Generators
SCP generation is primarily cortical. Slow potentials persist after extensive thalamic destruction and after transection of the corpus callosum, which shows that the thalamus is not essential to their genesis (Steriade, Nuñez, & Amzica, 1993). Cortical neurons in layers II through VI generate slow oscillations when the thalamus is removed, and the synchronized activity of large populations of these neurons produces the gradual membrane-potential shifts that reach the scalp (Birbaumer et al., 1990).
Thalamocortical interactions nonetheless shape the result. Through its relay and integrative functions, the thalamus modulates cortical excitability and contributes to the slow potential changes that appear in the record (Lopes da Silva, 1991). Thalamic reticular neurons show comparable slow spontaneous oscillations in vitro, and synchronized intracortical oscillations appear to depend on a corticothalamic network that targets those neurons.
Glial cells, non-neuronal cells that support and protect neurons and communicate chemically with one another and with neurons, contribute a third mechanism. Astrocytes in particular modulate the extracellular environment (Amzica & Steriade, 2002). Glial cells buffer local increases in extracellular potassium, and their slow depolarizations — on the order of 2 mV against a resting potential near -83 mV — accompany the cortical slow oscillation and may influence the timing of neuronal firing (Amzica & Steriade, 2000). Amzica and colleagues frame this spatial buffering as a parallel synchronizing and spreading mechanism, so glia are better described as contributing to and modulating slow potentials than as generating them. Note the contrast with rhythms like delta: SCPs do not arise from the simple summation of dendritic postsynaptic potentials but from slower cortical and glial machinery operating together.
The Meaning of SCP EEG Activity
Surface-negative SCP shifts reflect synchronized depolarization of neuronal assemblies and signal increased cortical excitability and readiness to respond. Surface-positive shifts correspond to decreased cortical excitation and often involve inhibitory processes (Hinterberger et al., 2005). Caton (1875) observed the same relationship in his earliest recordings, noting that the cortex's direct current baseline becomes negative whenever the cortex is more active. Voltage gradients of this kind are typically on the order of a few microvolts, up to roughly 20 μV.
That a scalp electrode registers a negative deflection while neurons are depolarizing seems backward at first. When neurons are activated, positive ions flow inward and the cell interior becomes more positive, which leaves the extracellular space immediately around the neuron more negative. That extracellular negativity is conducted through brain tissue, cerebrospinal fluid, skull, and scalp, and it is the potential the electrode detects. This relationship is called paradoxical negativity, and its mirror image, paradoxical positivity, occurs when neurons hyperpolarize (Birbaumer et al., 1990; Brienza & Mecarelli, 2019; Elbert et al., 1980). The point to carry forward is that a scalp recording is never a direct readout of neuronal membrane potential; it is the product of electrical field propagation through several tissues.
The sign convention has a practical consequence for training. When SCPs become more negative, cortical neurons fire more readily because they are depolarized. When SCPs become more positive, firing decreases because the neurons are hyperpolarized. A clinician who rewards cortical positivity is therefore rewarding reduced excitability, and one who rewards cortical negativity is rewarding readiness to act. The underlying "tone," or valence, of a network determines the firing characteristics of the neurons within it.
Event-Related Slow Cortical Potentials
Several SCPs are time-locked to events rather than spontaneous, and each represents a slow negative wave tied to anticipating a stimulus or preparing a movement (Brunia et al., 2012). The Bereitschaftspotential (BP), or readiness potential, is a slow negative shift that precedes a self-paced voluntary movement and reflects the planning and initiation of motor action (Shibasaki & Hallett, 2006). The contingent negative variation (CNV) develops between a warning stimulus and an imperative stimulus that requires a response, and it recruits regions such as the prefrontal cortex and supplementary motor area. The stimulus-preceding negativity (SPN) appears after a movement while the person waits for feedback about how accurate that movement was, and it reflects anticipatory attention and affective processing.
The slow rhythm of SCPs is often grouped with delta oscillations, and the two are phase-locked, which suggests close interaction across frequency bands (Steriade, Nuñez, & Amzica, 1993). Mölle and colleagues (2002) extended this observation to spindle activity, supporting the idea of a unified corticothalamic network in which the cortical slow oscillation groups the other sleep rhythms.
Slow Cortical Potentials in Psychological and Medical Disorders
Individuals diagnosed with ADHD often show abnormal SCP patterns and a reduced ability to generate negative shifts. Neurofeedback training that targets SCPs has improved attention and reduced hyperactivity in these individuals (Heinrich et al., 2004), and a multicenter randomized trial that controlled for unspecific effects supported SCP training as an active treatment component (Strehl et al., 2017).
In epilepsy, SCP neurofeedback has been used to teach clients to increase positive shifts, thereby reducing cortical excitability and seizure frequency (Rockstroh et al., 1993). As noted in the sensorimotor rhythm section below, Frey (2023) rated SCP-based neurofeedback as efficacious for seizures, which places these findings within the same evidence base.
Patients diagnosed with Parkinson's disease (PD) show altered SCP amplitude and timing during motor tasks, consistent with the impaired initiation and execution of voluntary movement that characterizes the disorder. Multi-night cortico-basal recordings show that slow-wave activity is suppressed and subcortical beta activity rises before spontaneous awakenings, and that deep brain stimulation (DBS) further modulates this pattern by enhancing cortical delta activity while reducing alpha and low beta power (Anjum et al., 2024). Pilot work on neurofeedback in PD has reported gains in motor control and in non-motor symptoms such as mood, but the studies are few and their samples small, so these results should be treated as preliminary rather than established (Erickson-Davis et al., 2012).
In depression, patients often show reduced SCP shift amplitude, and interventions aimed at normalizing SCP patterns have shown potential for alleviating symptoms.
Slow Cortical Potentials, Sleep, and Performance
SCPs participate in the transition from wakefulness to sleep, where positive shifts accompany sleep initiation and the maintenance of sleep stability. Their slow oscillations help synchronize neuronal activity, which is essential to the restorative functions of sleep, and abnormal SCP patterns have been linked to insomnia. Whether SCP training itself shortens sleep onset latency has not been established; the neurofeedback sleep literature most often cited here — Sterman (1996), Hoedlmoser et al. (2008), Vernon et al. (2003), and Gruzelier et al. (2010) — trained the sensorimotor rhythm rather than slow cortical potentials, and those studies are discussed in the sensorimotor rhythm section below.
Claims that SCP training improves performance on cognitive tasks drawing on attention, memory, and executive function, or on motor tasks requiring precise timing, should be treated as provisional for the same reason. The strongest controlled evidence for SCP training remains in ADHD (Strehl et al., 2017) and epilepsy (Rockstroh et al., 1993).
Training Slow Cortical Potentials
Two broad approaches to training slow cortical shifts have developed. The first grew out of evoked and event-related potential research, which showed correlations between cortical negativity and reaction time, signal detection, and short-term memory (Birbaumer, 1999). The resulting paradigm presents the client with sequences of 8-second trials and trains both positive and negative shifts in the cortical gradient using visual or auditory feedback that displays the shift in real time. When the goal is greater cortical positivity, the protocol supplies more positive-shift trials, and the reverse holds when negativity is the target. Transfer trials, which ask the person to produce a shift without providing feedback, test whether the skill has actually been acquired (Strehl, 2009).
The second approach addresses the same slow gradient shifts under the names infra-low frequency (ILF) neurofeedback (Othmer & Othmer, 2020) and infraslow neurofeedback (Smith, 2013). Post-traumatic stress, anxiety, and other presentations marked by excessive cortical activation have been addressed by training increased overall cortical positivity, often with a four-channel approach that rewards a gradual shift in the cortical gradient through proportional audio feedback. Clients frequently report an altered-state experience in which cognitive activity drops markedly while awareness is retained, an observation that fits the association between positive shifts and reduced excitability, though it rests on clinical report rather than controlled trials.
Summary
Slow cortical potentials are gradual voltage shifts below 1 Hz, typically near 0.3 Hz, that require a DC-coupled amplifier to record. They arise from cortical neurons and thalamocortical interactions, with glial potassium buffering contributing, rather than from the simple summation of dendritic potentials. Surface negativity signals depolarization, increased excitability, and readiness to respond, while surface positivity signals hyperpolarization and reduced excitability. The counterintuitive polarity is explained by paradoxical negativity, in which the electrode registers the extracellular field rather than the membrane potential. Event-related SCPs include the Bereitschaftspotential, the contingent negative variation, and the stimulus-preceding negativity. SCP abnormalities appear in ADHD, epilepsy, Parkinson's disease, depression, and insomnia, and both the trial-based Birbaumer paradigm and infra-low frequency approaches train these shifts clinically.
The slow oscillation that carries SCPs is phase-locked with delta, and sleep researchers routinely analyze the two together. Delta is where the conventional frequency bands begin.
DELTA (0.5-3 or 4 HZ)
Delta EEG activity, characterized by low-frequency oscillations (0.5 to 3 or 4 Hz), plays a crucial role in various brain functions, particularly during sleep and in pathological conditions.
We will explore the generators of delta activity, its significance in brain function, and its association with disease. Public Domain, https://commons.wikimedia.org/w/index.php?curid=453193
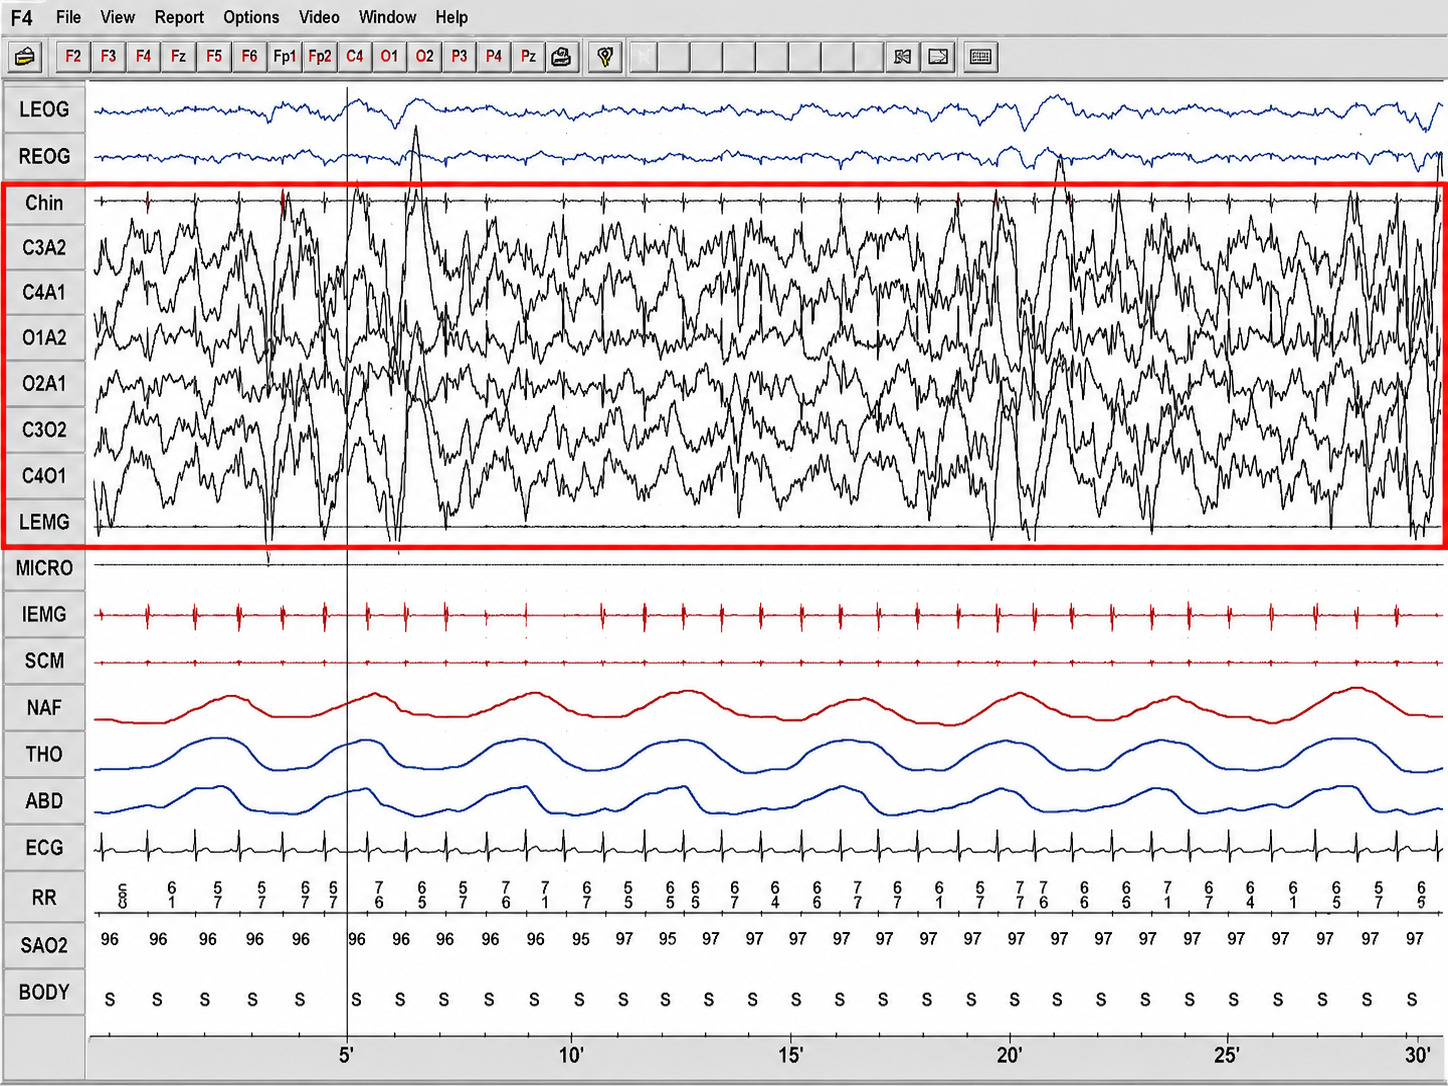
This is not a plain EEG but a full polysomnogram, a whole-body sleep study, displayed on a compressed time base that spans about half an hour along the bottom. That single fact reframes everything: instead of a few seconds of brain waves, you are looking at many different body signals stacked together over many minutes, and the art is reading them as an ensemble. From top to bottom the montage stacks eye-movement channels (the blue LEOG and REOG), a chin muscle channel, a block of EEG derivations, a leg muscle channel, then several more muscle traces, a full breathing set, the heart, and running readouts of oxygen and body position. A red box has been drawn around the brain-and-muscle group in the middle.
The beginner's mistake is to fixate on that boxed EEG, see its dense high-amplitude tangle, and try to read it like a normal brain tracing. On a thirty-minute scale that is a losing game, because individual brain waves are squeezed into an unreadable thicket. The move that unlocks the page is to pull back and read across the whole stack at once, treating the display as a conversation among organs, and to look for the signal that shows a clear, repeating pattern over the long window.
That signal is the breathing. Drop down to the respiratory channels, nasal airflow (NAF) and the thoracic (THO) and abdominal (ABD) effort belts, and a strikingly regular, smooth oscillation reveals itself, rising and falling in a repeating crescendo-and-decrescendo cycle that marches steadily across the entire half hour. The crucial detail is that airflow and both effort belts wax and wane together, in phase, so the whole breathing apparatus swells and fades as one, giving the tracing its rhythmic, periodic character.
The supporting channels round out the state. The ECG ticks along in a steady beat with its R-to-R intervals tallied beneath it, the oxygen saturation holds comfortably in the mid-90s throughout, the body-position marker reads the same (supine) the whole time, and one of the muscle channels fires off small regular bursts in the background. Together these tell you the sleeper is lying still, well-oxygenated, and steady-hearted while the breathing cycles.
Put it together and what this display shows is a compressed, multi-minute polysomnogram in which the standout feature is a periodic breathing pattern, airflow and respiratory effort waxing and waning together in a smooth, regularly repeating cycle across the whole window, set against a stable heartbeat, preserved oxygen levels, and an unchanging body position. The insight comes from reading the entire stack of body signals as one system over the long time base and letting the rhythmic, in-phase breathing cycle emerge, rather than squinting at the boxed brain waves as if they were the whole story.
Synchronous means that groups of neurons depolarize and hyperpolarize at the same time. In the resting record of a healthy awake adult, delta is a small minority of the signal while alpha dominates posteriorly with eyes closed. Published percentages vary widely with condition, montage, site, and age, and relative power and percent amplitude are not interchangeable, so specific figures should be quoted only with those parameters stated. The greatest delta amplitude is found in the central region of the scalp. The delta rhythm dominates the record in early infancy and is associated in adults with deep sleep and brain pathologies like trauma and tumors, and learning disability (Hugdahl, 1995; Thompson & Thompson, 2015).
Sleep deprivation can increase delta amplitude. Adult high-amplitude rhythmic delta indicates pathology like traumatic brain injury (TBI). This is often due to white matter damage blocking signals that would otherwise activate the damaged brain regions.
Slow-wave activity in the delta and theta range increases in young adults during demanding cognitive work such as reading, which indicates that slow activity is not confined to sleep and pathology (Angelakis et al., 2001). Children diagnosed with attention-deficit/hyperactivity disorder (ADHD) or learning disabilities may present with diffuse delta and theta. When this occurs, clinicians may inhibit 2-7 Hz instead of 4-7 Hz. Amplitude training is appropriate for inhibiting but not rewarding delta (Demos, 2019).
Low-amplitude delta may be associated with ADHD, anxiety, insomnia, and TBI. Z-score training is safest for uptraining delta (Demos, 2019).
The movie below is a 19-channel BioTrace+ /NeXus-32 display of delta activity © John S. Anderson. Brighter colors represent higher delta amplitudes. Higher peaks represent higher delta amplitudes in the graphs at the end of each line. Frequency histograms are displayed for each channel.
Delta Rhythm Generators
Delta waves are primarily associated with deep stages of sleep, especially slow-wave sleep (SWS), and are generated by the thalamocortical network. This network's synchronization of neuronal activity is critical for generating delta rhythms. Several mechanisms contribute to the generation of delta waves.
Thalamic Pacemaker Neurons
Thalamocortical relay neurons act as pacemakers for delta activity through the interplay of the hyperpolarization-activated current Ih and the low-threshold calcium current IT. These neurons exhibit rhythmic burst firing that is propagated to the cortex, resulting in synchronized delta oscillations. The thalamic reticular nucleus, by contrast, paces sleep spindles through reciprocal inhibitory connections with relay cells, and projects within the thalamus rather than to the cortex (Steriade, McCormick, & Sejnowski, 1993).
Cortical Neurons
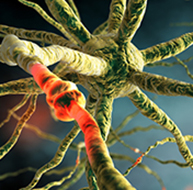
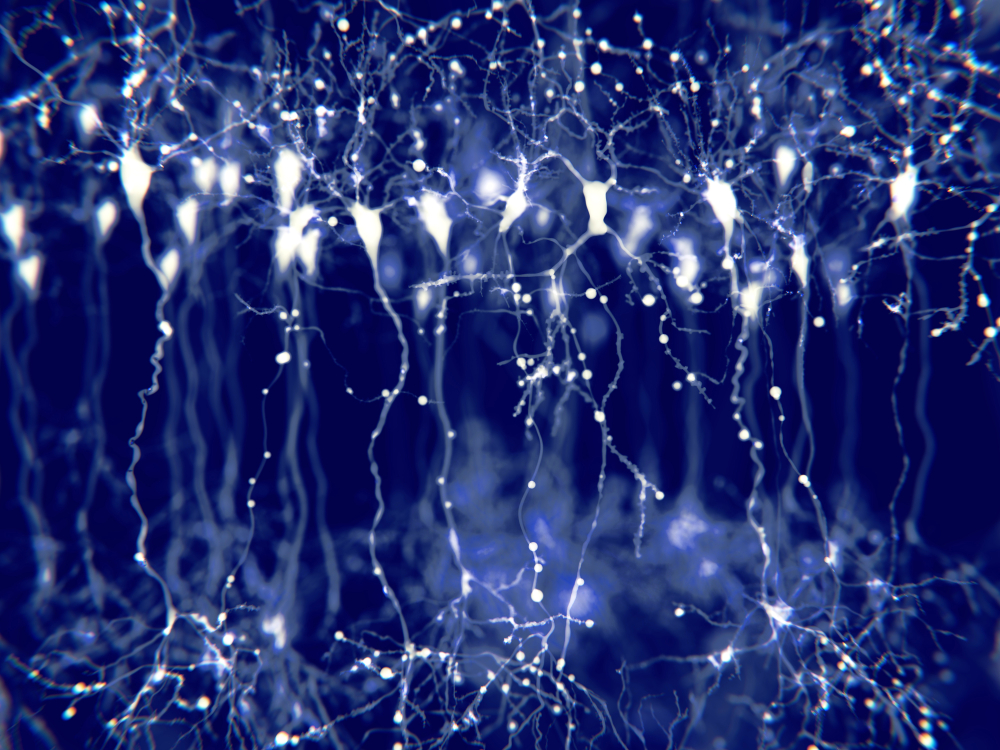
Cortical neurons, especially those in the neocortex, also play a significant role in generating delta waves. The interplay between excitatory pyramidal neurons and inhibitory interneurons within cortical columns contributes to the rhythmicity observed in delta activity (Destexhe et al., 1999). Pyramidal neuron graphic © Juan Gaertner/Shutterstock.com.
Thalamocortical Interactions
The reciprocal connections between the thalamus and cortex are essential for generating and maintaining delta rhythms. These interactions facilitate the synchronization of neuronal firing across large cortical areas, leading to the widespread presence of delta waves during sleep (Amzica & Steriade, 1998).
The Meaning of Delta EEG Activity
Delta activity is most prominently observed during the deep stages of non-REM sleep, which are believed to play several critical roles.
Sleep and Restoration
Delta waves are a hallmark of slow-wave sleep, a phase critical for physical and cognitive restoration. During this phase, the brain undergoes synaptic downscaling — a proportional weakening of synaptic strength described by the synaptic homeostasis hypothesis — and memory consolidation.
During SWS, the body undergoes several restorative processes, including tissue repair, muscle growth, and the release of growth hormones. Delta waves facilitate these processes by ensuring deep, uninterrupted sleep, which is necessary for effective physical recovery (Tononi & Cirelli, 2014). Healthy adult hypnogram adapted from Spiesshoefer et al. (2021).
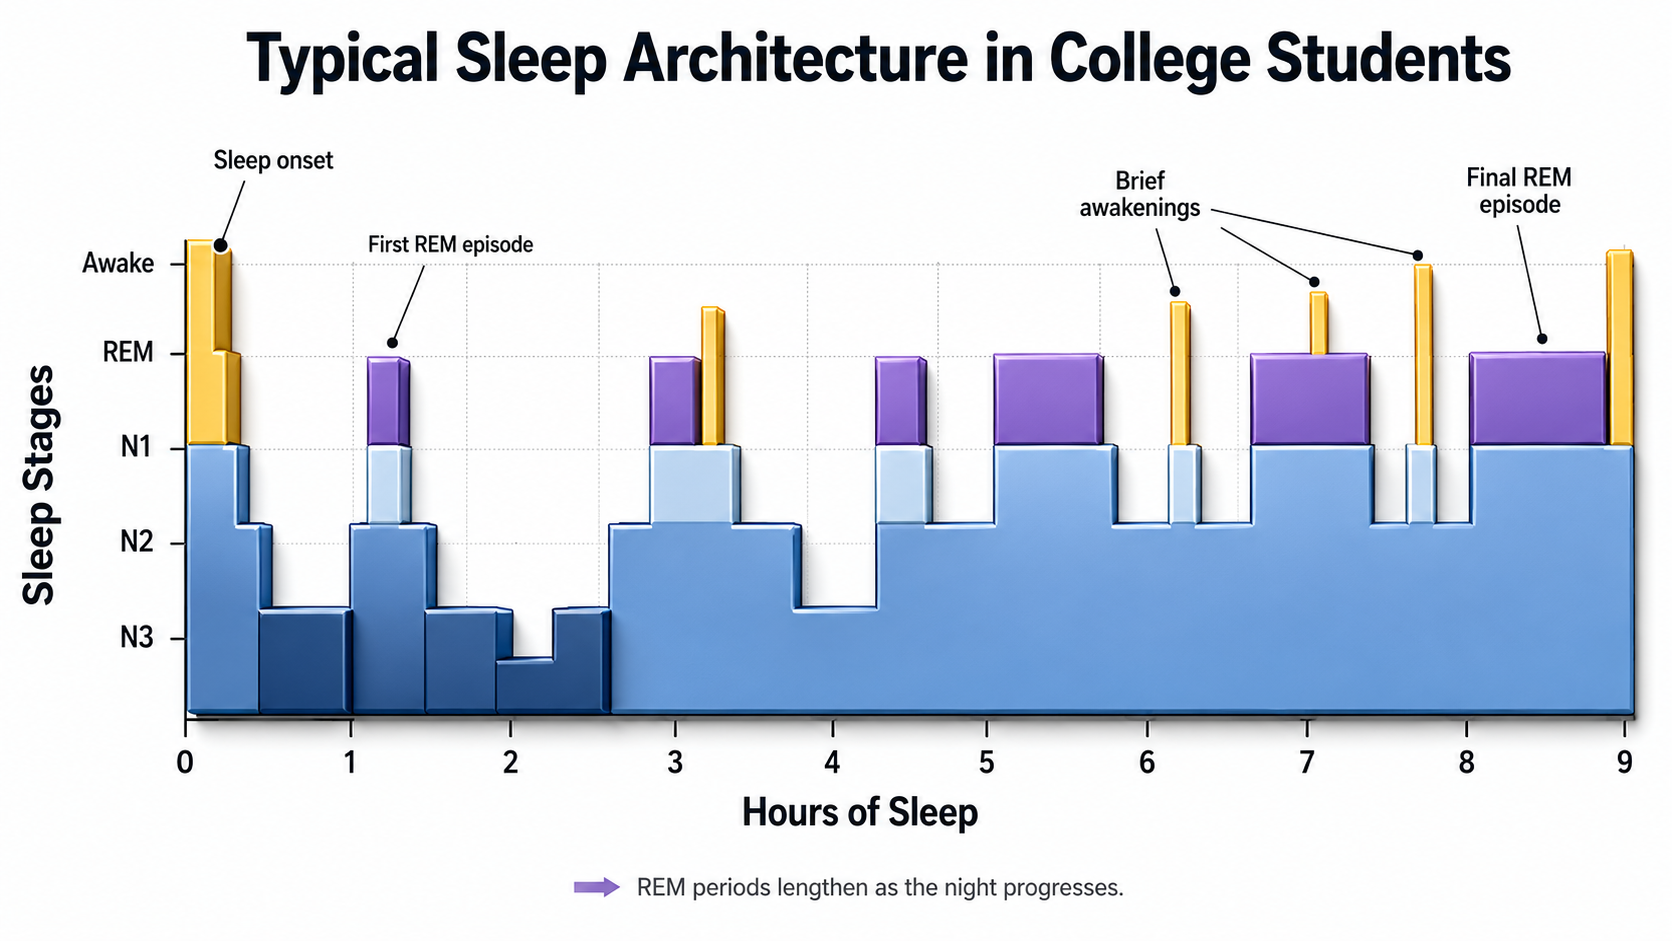
A representative polysomnogram showing healthy sleep architecture with characteristic and repetitive passage through sleep cycles. N3 represents slow-wave sleep, which occurs more during the first half of the night, whereas REM sleep is more common during the second half. Pathological sleep is characterized by reduced slow-wave sleep and/or REM sleep and/or sleep fragmentation. W: awake; N1: non-REM I sleep; N2: non-REM II sleep; N3: non-REM III sleep; R: REM sleep.
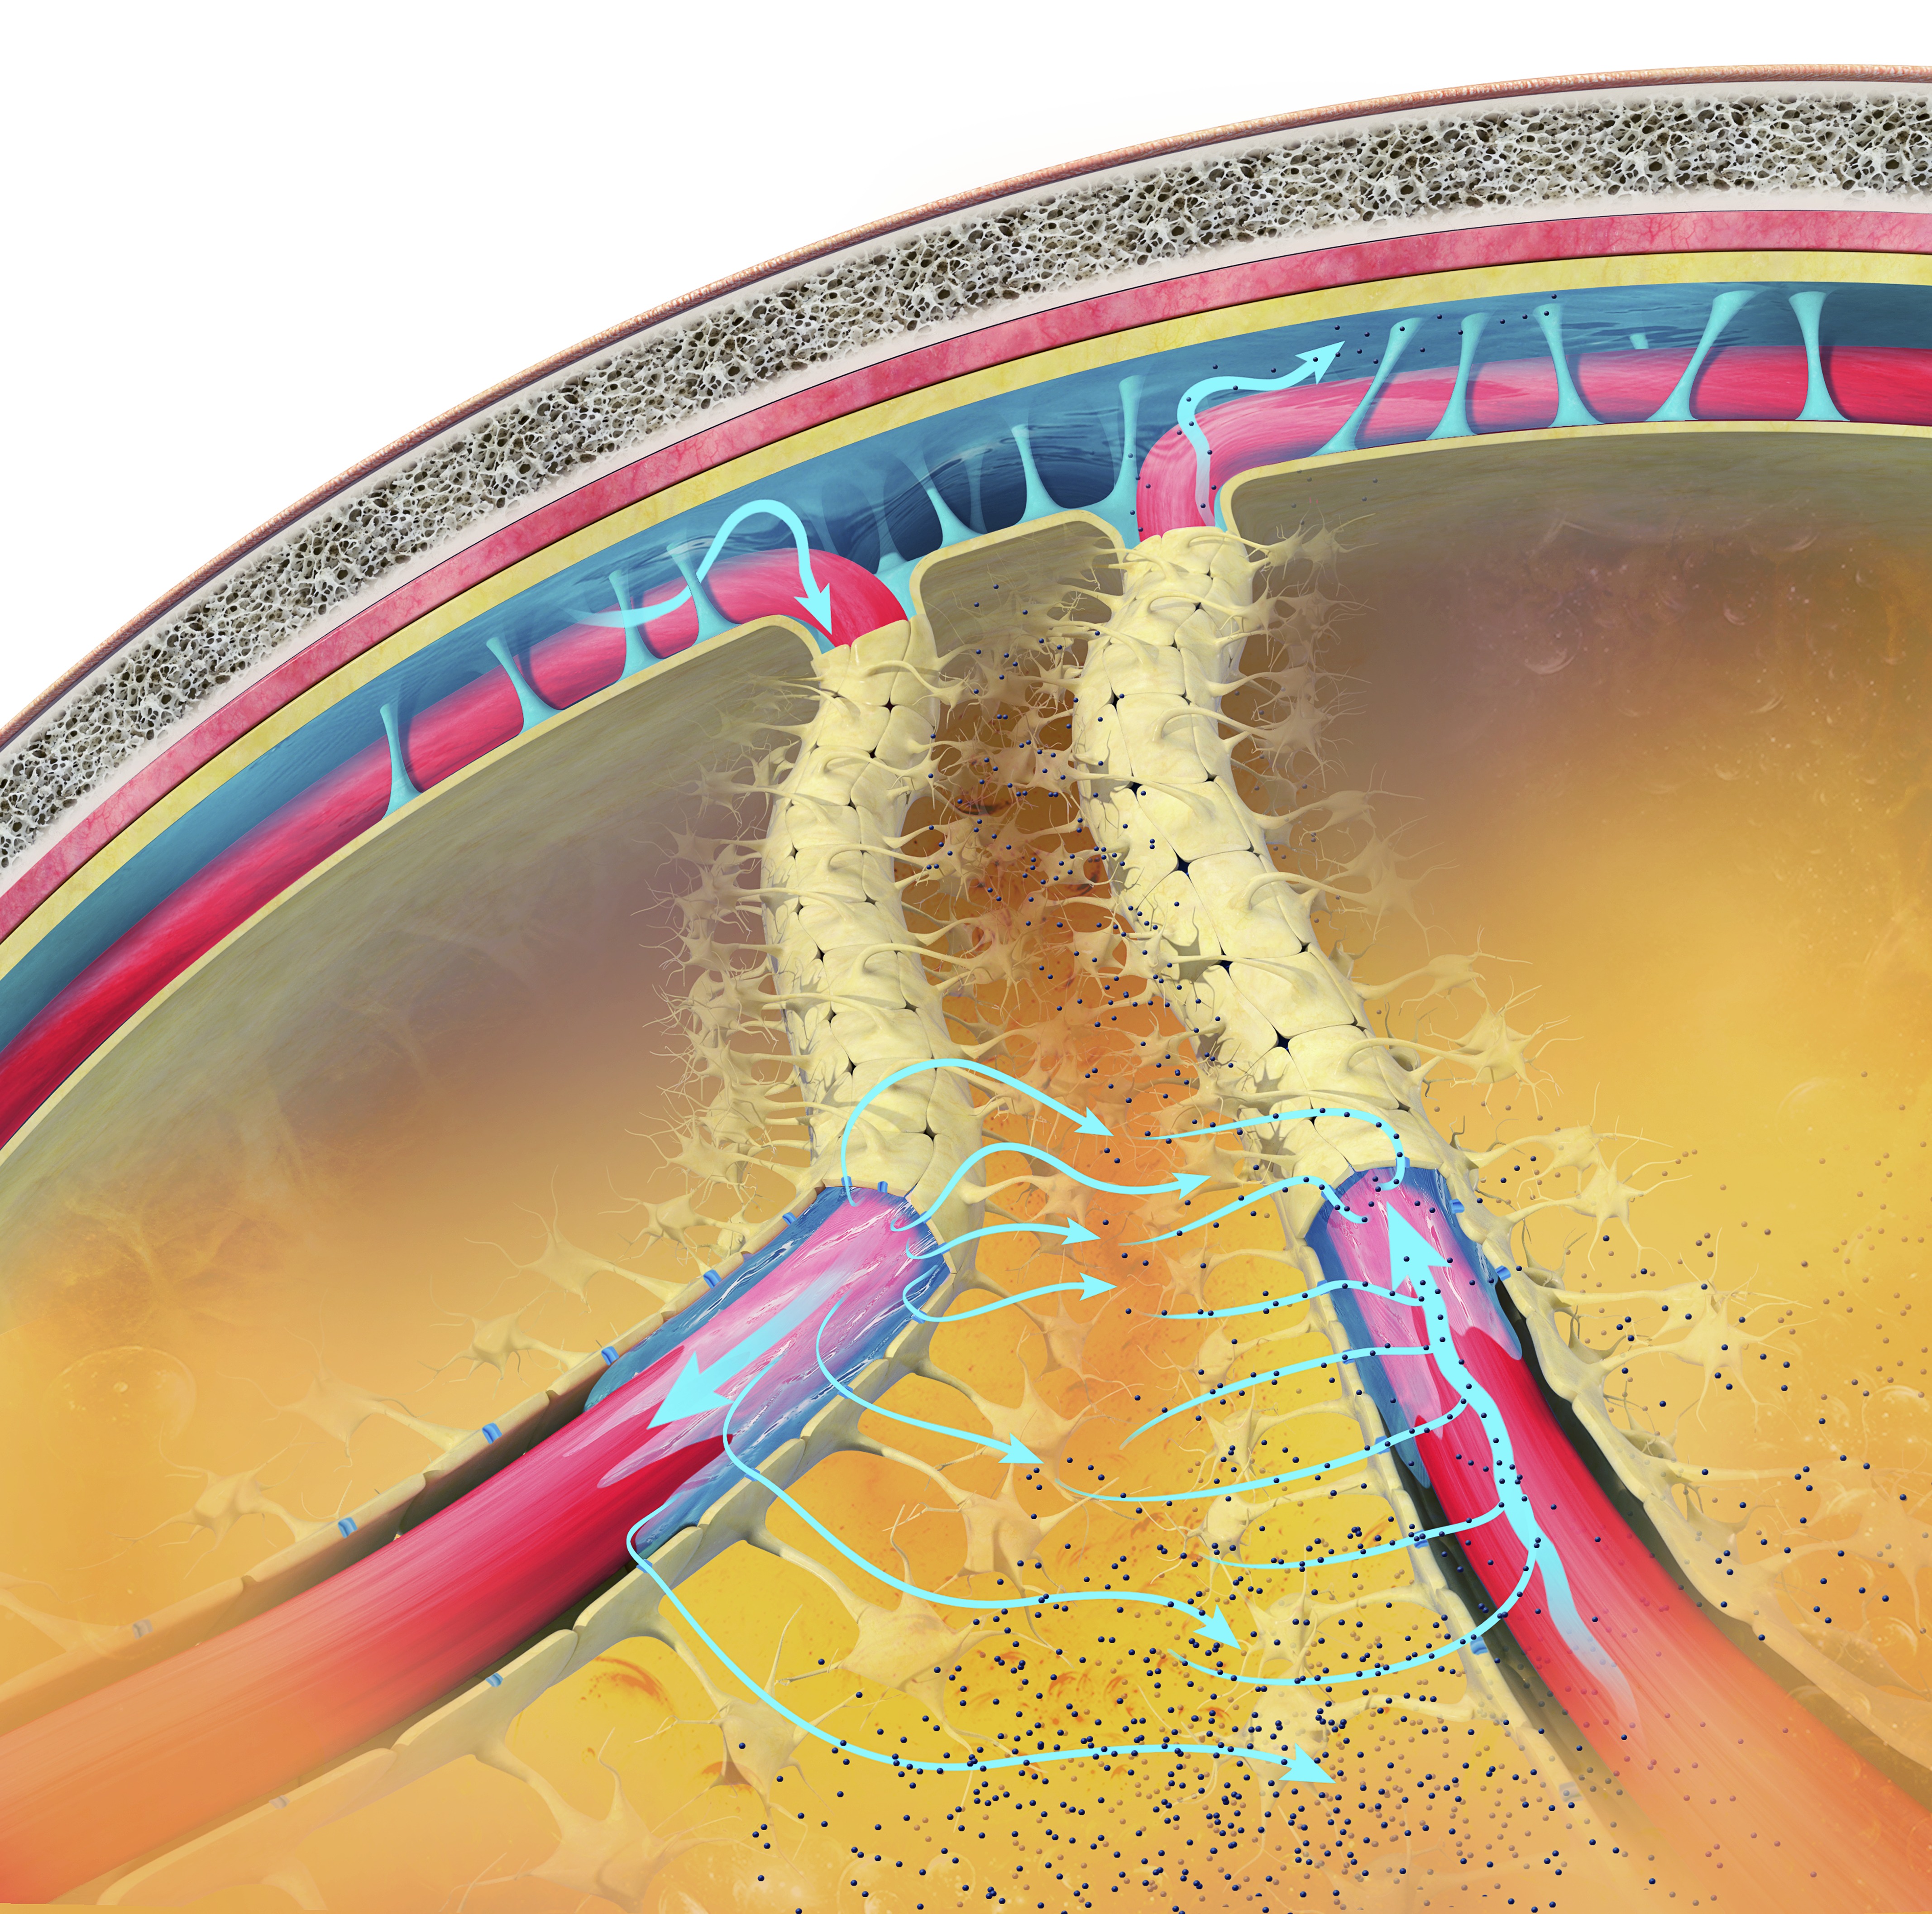
Delta activity helps in clearing metabolic waste products from the brain, such as beta-amyloid, which, if accumulated, can contribute to neurodegenerative diseases like Alzheimer's. This glymphatic clearance system is more active during SWS, supported by delta oscillations (Xie et al., 2013).
The glymphatic system, described in 2012, is a glia-dependent perivascular clearance pathway rather than a lymphatic system proper. It provides a flow of CSF through the brain's interior that helps clear cellular debris, proteins, and other wastes. Xie et al. (2013) demonstrated increased clearance during sleep in mice; the specific causal link to delta oscillations is an inference from that work rather than a direct finding. Glymphatic system graphic © Claus Lunau/Science Photo Library.
Delta EEG activity during sleep, particularly in the prefrontal cortex, is associated with better performance on neuropsychological tasks specific to the left prefrontal cortex in healthy older adults (Anderson & Horne, 2003). Sleep deprivation can increase delta waking amplitude.
Cognitive Performance
Delta EEG activity increases during mental tasks requiring attention to internal processing, such as difficult mental calculations and short-term memory tasks. This suggests that delta activity is related to the cognitive effort involved in internal processing (Harmony et al., 1996).
Memory Consolidation
Delta oscillations are associated with the consolidation of declarative memory. The synchronous activity of delta waves helps to transfer information from the hippocampus to the neocortex, facilitating long-term memory storage (Marshall & Born, 2007).
Homeostatic Regulation
Delta activity reflects the homeostatic regulation of sleep. Higher amounts of delta activity indicate a higher sleep pressure, which is the body's way of balancing sleep and wakefulness to maintain overall health (Achermann & Borbély, 2003).
Neuroprotection
Delta activity supports the maintenance and health of neurons, potentially protecting against the accumulation of neurotoxic substances. Regular deep sleep with sufficient delta activity is linked to a lower risk of developing neurodegenerative diseases (Varga et al., 2016).
Emotional Regulation
Adequate delta activity during deep sleep contributes to emotional stability and resilience.
Deep sleep, characterized by delta waves, helps regulate mood and emotional responses. Disruptions in delta sleep are associated with mood disorders such as depression and anxiety (Goldstein & Walker, 2014).
The Delta Rhythm in Disease
Neurodegenerative Disorders
Alterations in delta activity have been observed in neurodegenerative diseases such as Alzheimer's and Parkinson's disease. Patients with Alzheimer's disease, for example, exhibit disrupted delta oscillations, which correlate with cognitive decline and memory impairment (Varga et al., 2016).
In nondemented, amyloid-positive subjects, higher delta power is associated with clinical progression from subjective cognitive decline to mild cognitive impairment or dementia. This indicates that delta activity may be a prognostic marker for cognitive decline (Gouw et al., 2017).
Sleep Disorders
Changes in delta activity are also linked to sleep disorders like insomnia and sleep apnea. Reduced delta power during sleep is often associated with poor sleep quality and increased daytime fatigue (Chokroverty, 2017).
Psychological Disorders
Delta activity is implicated in various psychiatric disorders, including depression and schizophrenia. In schizophrenia, abnormal non-REM sleep oscillations, including delta activity, have been proposed as biomarkers of circuit dysfunction, suggesting a link between disrupted slow-wave activity and the pathophysiology of the disorder (Gardner et al., 2014).
Increased delta activity, along with decreased alpha activity, differentiates psychotic disorders such as schizophrenia, bipolar disorder with psychotic features, and methamphetamine-induced psychosis. This pattern indicates dysfunctional thalamocortical connectivity and may serve as a neurophysiological biomarker for these conditions (Howells et al., 2018).
Encephalopathy
Specific delta EEG patterns, such as continuous slowing and frontal intermittent rhythmic delta activity (FIRDA), are associated with different pathological conditions and outcomes in encephalopathic patients. For example, delta activity is linked to alcohol/drug abuse and HIV infection, while FIRDA is associated with past cerebrovascular accidents (Sirin et al., 2019; Sutter et al., 2012). Generalized 3-Hz spike-and-wave discharges, which sit at the delta-theta boundary, are the electrographic signature of absence seizures (formerly called petit mal) and are a marker of epileptiform activity.
Brain Lesions
Focal delta activity on EEG is significantly associated with structural brain lesions, such as those caused by strokes, tumors, and trauma. This correlation highlights the importance of delta activity in identifying underlying brain abnormalities (Gilmore & Brenner, 1981; Nazish, 2020).
Amnesic Mild Cognitive Impairment
In patients with amnesic mild cognitive impairment not due to Alzheimer's disease, those with epileptiform EEG activity show higher temporal delta source activities. This suggests the role of neural hypersynchronization in their brain dysfunctions (Babiloni et al., 2020).
Conclusion
Delta EEG activity, generated primarily by the thalamocortical network and cortical neurons, is essential for several critical brain functions, especially during slow-wave sleep (SWS). It facilitates physical and cognitive restoration, including synaptic downscaling, memory consolidation, and the clearance of metabolic waste. Delta activity is also linked to cognitive performance, homeostatic sleep regulation, neuroprotection, and emotional stability.
Recent research highlights the significance of delta activity in various health and disease contexts. In neurodegenerative disorders like Alzheimer's and Parkinson's disease, disrupted delta oscillations correlate with cognitive decline. Similarly, sleep disorders such as insomnia and sleep apnea are associated with reduced delta power, leading to poor sleep quality and increased fatigue. Psychiatric conditions, including depression and schizophrenia, often exhibit abnormal delta activity, suggesting a role in their pathophysiology. Specific delta patterns are also indicative of encephalopathy, brain lesions, and amnesic mild cognitive impairment, serving as potential neurophysiological biomarkers.
THETA (3-8 HZ)
The theta rhythm ranges from 3-7 Hz, 4-7 Hz, or 4-8 Hz with 20-100 microvolts (Thompson & Thompson, 2015). Theta may be arrhythmic or rhythmic (Demos, 2019). Theta is seen during drowsiness or starting to sleep, hypnagogic imagery (intense imagery experienced before sleep onset), and hypnosis (Libenson, 2024).
The greatest amplitude is found in the frontal and temporal regions of the scalp. Since there may be several theta generators, the theta rhythm is associated with different behavioral processes. The theta rhythm is associated with creativity, but also with anxiety, daydreaming, depression, inattention, and minor TBI. Excessive left hemisphere (LH) theta may be associated with depression, and right hemisphere (RH) theta may be linked to anxiety (Demos, 2019).
EEG activity in the theta frequency band is quite specific to the location where it is recorded. 4-8 Hz activity in temporal areas has different functional and behavioral correlates from the same frequency activity in frontal midline or posterior areas. This, again, reaffirms that location and behavior are essential components when analyzing scalp EEG.
Below is an example of filtered (4-8 Hz) theta activity.
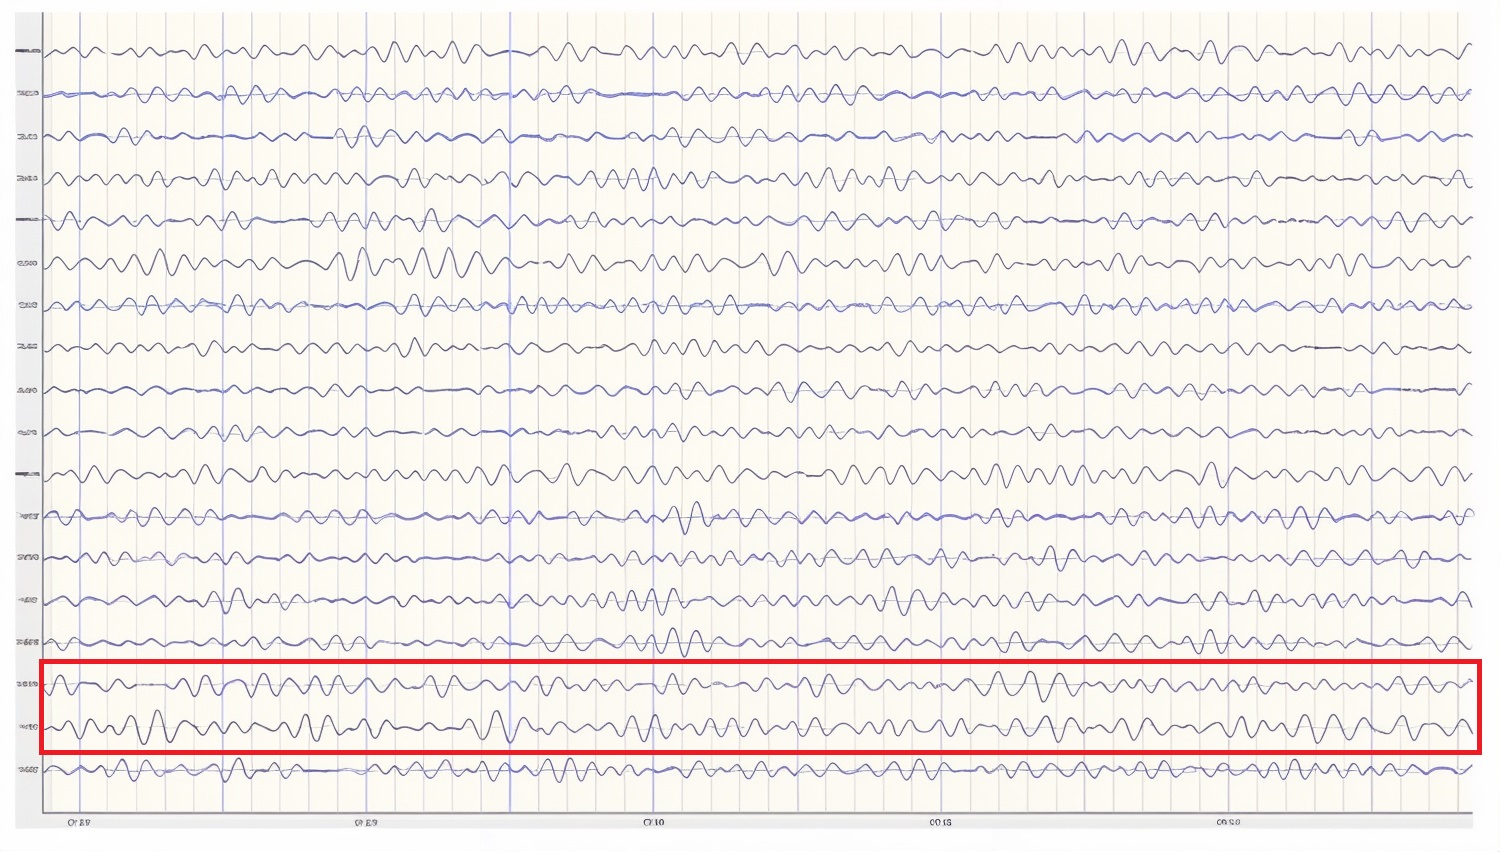
This is an eyes-closed recording in the longitudinal bipolar montage with a 20-µV scale with dark vertical lines showing the beginning of each new 1-second segment. The EEG is displayed using a 4-8 Hz filter to isolate that frequency band from the full band EEG. Observe the slightly greater amplitude and rhythmicity in temporal derivations.
Below is a 1-45 Hz display of the same EEG recording at the same time location.
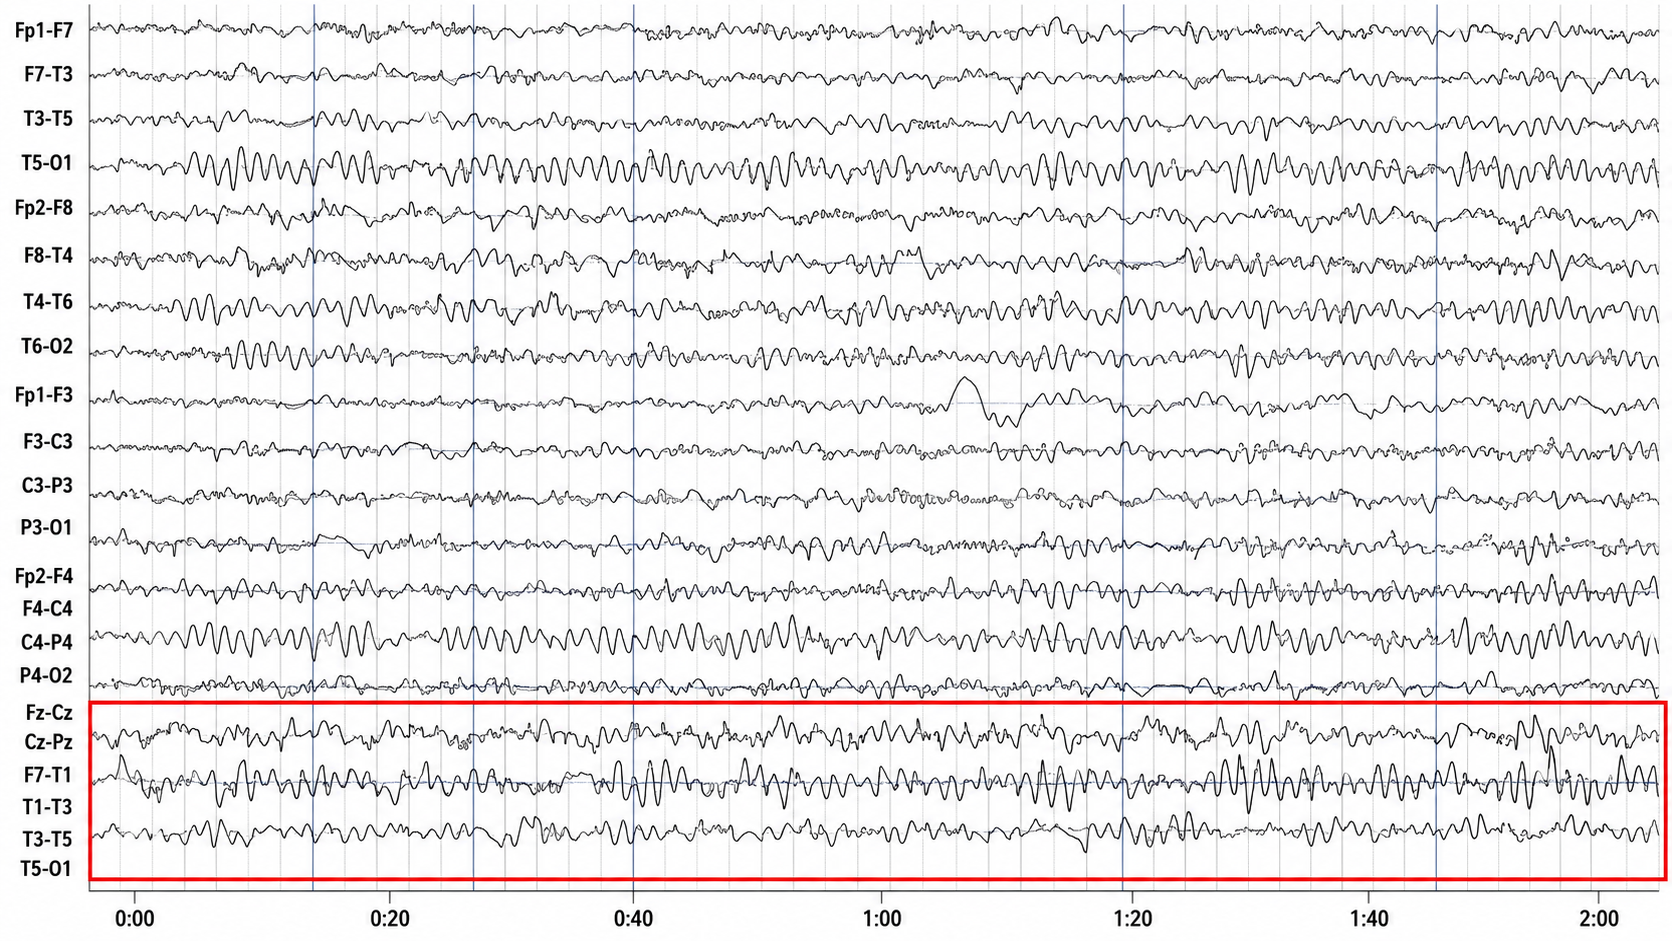
This is an eyes-closed recording in the longitudinal bipolar montage with a 50-µV scale. The EEG is displayed using a 1-45 Hz filter to show the relatively full EEG band.
Intermittent theta is common in the normal awake adult: roughly a third of healthy young adults show intermittent frontocentral theta, and a similar proportion of asymptomatic older adults show intermittent temporal theta. Frontal midline theta during focused attention is a normal cognitive phenomenon generated in medial prefrontal and anterior cingulate cortex. Theta becomes clinically significant when it is focal, persistent, or consistently lateralized (Libenson, 2024).
Amzica and Lopes da Silva (2018) cite various studies regarding the theta rhythm, which they identify as 4-7 Hz. As discussed earlier, they note that normal theta activity should not be confused with pathologic theta, which represents a slowing of the alpha frequency band into the theta range. They suggest that this slowing of alpha may result from reducing cerebral blood flow or metabolic encephalopathies. Metabolic encephalopathies can result from chemical imbalances due to various causal factors, from kidney or liver dysfunction, diabetes, or a variety of other health issues.
Arnolds et al. (1980) found significant differences between behavioral conditions when viewing hippocampal theta recorded with depth electrodes. Writing resulted in faster frequency and greater rhythmicity but lower amplitude than sitting or walking. In contrast, a word association task resulted in faster frequency, greater rhythmicity, and increased amplitude in the period of silence immediately following the question but before the answer was given.
Ekstrom and colleagues (2005) studied hippocampal and neocortical theta activity during a virtual driving task that involved location finding. They found that both areas increased theta during all tasks associated with the driving simulation. A significant correlation between all areas showed increased coordination between multiple areas while accomplishing the tasks. They concluded that cortical and hippocampal theta oscillations and coordination between these areas are associated with attention and sensorimotor integration.
Childhood Disorders
The theta rhythm is the dominant frequency in healthy young children (Thompson & Thompson, 2015). Theta amplitudes and normative theta-to-beta ratios are higher in children than in older adults. Children diagnosed with ADHD often have higher ratios than children without ADHD. Theta-to-beta ratios greater than 3:1 may indicate a slow-wave disorder, and children with a slow-wave disorder may have ratios as high as 6:1 (Demos, 2019). Excessive theta graphic retrieved from ADDYSSEY.

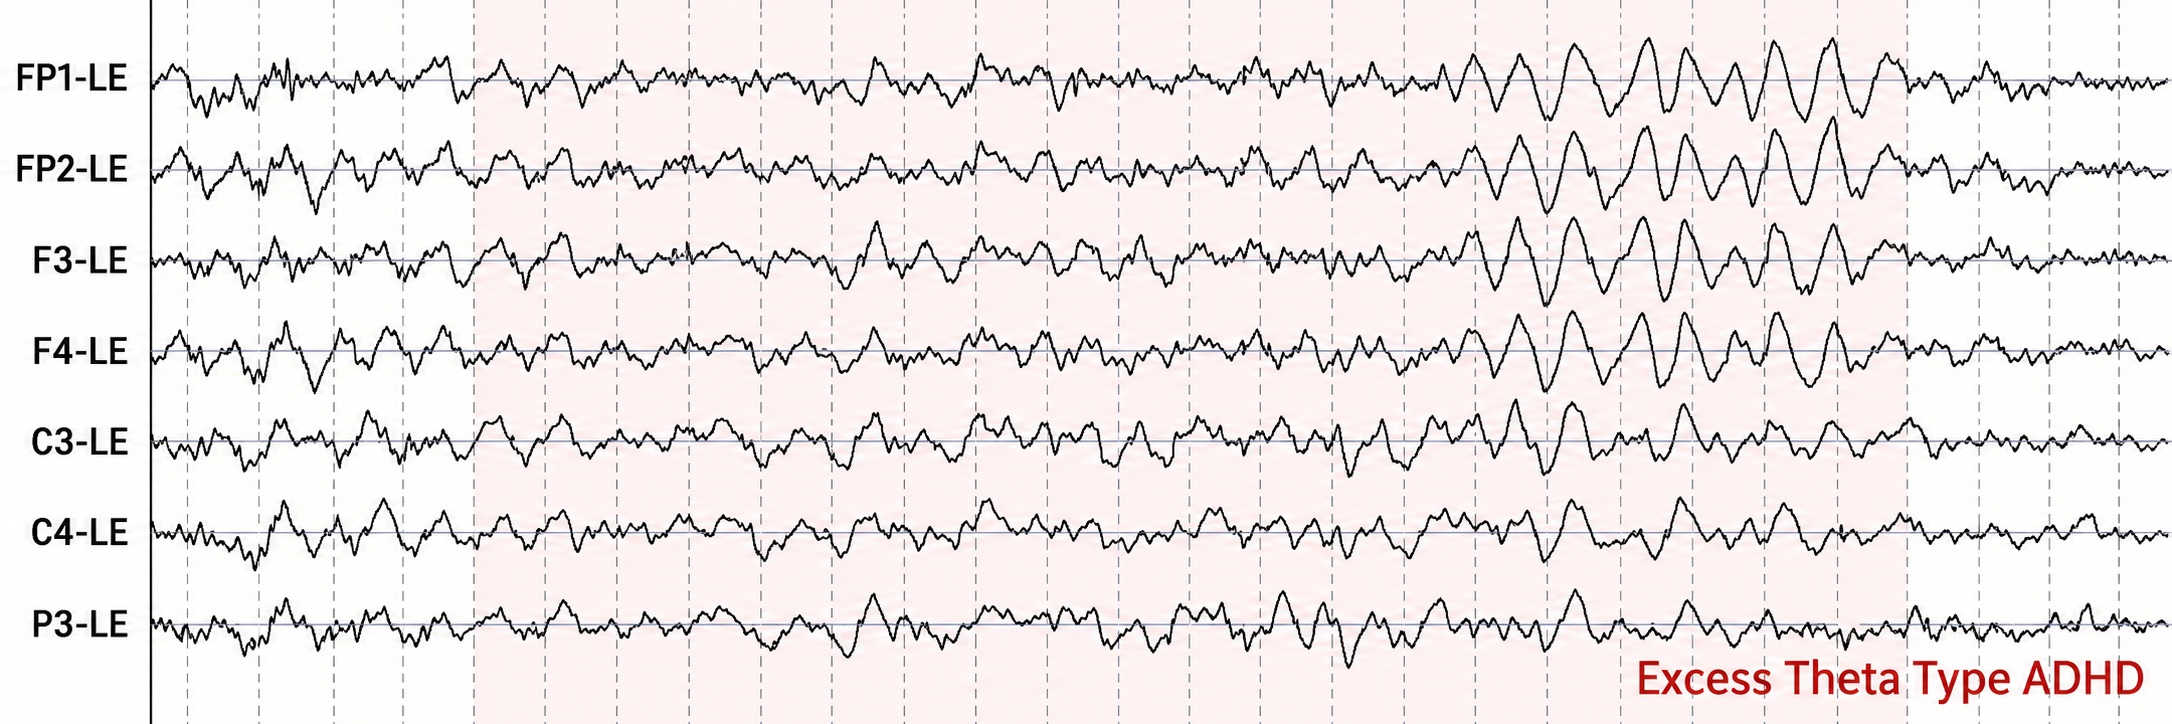
This is a referential EEG, every channel tied to a linked-ear reference (the LE label), showing a focused set of frontal, central, and parietal electrodes stacked from the frontal poles at the top down to a parietal row at the bottom. Much of the page is washed in a soft pink highlight, and a label in the corner names the pattern outright. The tracing is busy throughout, but the busyness is not uniform, and telling the difference is the whole task.
The beginner's temptation is to take in the wall of squiggle and grade it all as one texture. The move that unlocks the page is to attend to the frequency and size of the waves, and to sweep your eye from left to right along the highlighted stretch, because the story is about a particular slow rhythm swelling into prominence rather than any single sharp event.
Do that and the feature reveals itself. Riding through the record is a prominent, rhythmic slow wave in the theta range, rounded and repetitive, and toward the right side of the page it builds into a bold, high-amplitude burst that towers over the surrounding activity. These are not quick spiky transients but broad, steady, slow oscillations, and they carry real amplitude when they crest.
Now find where that theta is largest, and the answer is up front. Trace the burst down the stack and it is tallest and most sharply rhythmic in the frontal-pole and frontal rows (FP1, FP2, F3, F4), then grows more modest as you move back toward the central and parietal channels. The slow rhythm is a frontally-dominant affair, blooming over the front of the head and tapering behind it.
Put it together and what this display shows is a referential recording dominated by prominent, high-amplitude, rhythmic theta activity that builds into a bold slow-wave burst over the frontal regions, tapering toward the back, exactly the elevated frontal slow-wave signature the corner label names as the excess-theta ADHD pattern. The insight comes from reading for the slow theta rhythm and its frontal maximum, letting that swelling frontal slow wave stand out as the defining feature rather than judging the whole page as undifferentiated activity.
Historically, the study of attention disorders has focused on excess frontal theta activity in individuals with inattentive ADHD. The ratio of theta (4-8 Hz) activity to beta (13-21 Hz) activity, or the theta/beta ratio (T/B ratio), was developed to make the analysis of this metric easier. It was initially calculated using a single channel vertex location at Cz (Monastra et al., 1999). Other studies compared multiple locations and found that the Cz location was accurate and represented the location of the largest deviation of the ratio between previously diagnosed ADHD clients and typical controls (Lubar, 1991). Identifying an elevated T/B ratio (meaning more than typical theta compared to the amount of beta) compared to typical controls appeared to be an accurate way to assess attention disorders.
In a large, blinded, multi-center validation of the theta/beta ratio compared to rating scales for assessing ADHD, the researchers calculated the sensitivity and specificity of measures. They found that the T/B ratio achieved superior results than commonly used rating scales (Snyder et al., 2008). With a sample size of 159 individuals, the EEG assessment showed a sensitivity of 87% and a specificity of 94%, for an overall accuracy of 89%. Across the rating scales in that study the published figures are reported as ranges — sensitivity 38-79% and specificity 13-61%, with overall accuracy ranging from 47% to 58%. Snyder and colleagues were explicit about the limits of their finding: "the results do not support the use of EEG as a stand-alone diagnostic and should be limited to the interpretation that EEG may complement a clinical evaluation for ADHD."
The sensitivity of an assessment measure determines how accurately it identifies individuals known to have a particular condition. Specificity measures how accurately the measure correctly eliminates individuals without the condition from being identified as having the condition.
For example, the Conners Parent Rating Scale-Revised (CPRS-R) shows a sensitivity of 77%, correctly identifying 77 percent of clients with ADHD. It has a specificity of 73%, correctly identifying 73 percent of clients known not to have ADHD. The theta/beta ratio biomarker described above outperforms the CPRS-R by correctly identifying more true positive ADHD and negative non-ADHD clients (Chang et al., 2016).
However, Chang and colleagues note that the Child Behavior Checklist (CBCL), also included in their study, provides a more comprehensive analysis of the client and is more effective at identifying possible comorbidities often mistaken for the different subtypes of ADHD. They also note that using such a checklist approach provides the clinician with information they may not otherwise be able to identify in the clinical setting. It appears that a combined approach using a well-validated checklist in combination with objective measures such as the theta/beta ratio or other quantitative EEG assessment tools and a continuous performance test such as the Test of Variables of Attention (TOVA) would provide a comprehensive assessment for childhood disorders of attention.
In the research of Snyder and colleagues (2008), only 6% of typical children were incorrectly identified using the T/B ratio.
The literature since 2008 has not sustained the theta/beta ratio as a diagnostic measure, and clinicians should know this before relying on it. Arns, Conners, and Kraemer (2013), meta-analyzing nine studies (1,253 ADHD and 517 control participants), concluded that "excessive TBR cannot be considered a reliable diagnostic measure of ADHD," and documented a secular decline in the effect driven by rising TBR in non-ADHD groups; they retained the measure as a possible prognostic marker. The American Academy of Neurology (2016) issued a Level B recommendation that the theta/beta ratio combined with frontal beta power "should not replace a standard clinical evaluation," citing an unacceptably high false-positive rate. The FDA clearance for the NEBA device likewise specifies that it is "NOT to be used as a stand-alone in the evaluation or diagnosis of ADHD," but only alongside a completed clinical evaluation. A subsequent study of 417 children and adolescents by Arns' group (Boxum et al., 2024) again found no diagnostic value for TBR, while noting its possible use in stratifying clients between neurofeedback protocols. The T/B ratio therefore belongs in a comprehensive assessment as one adjunctive datum, not as a screening test used to decide whether a child should be medicated.
Interestingly, Van Son and colleagues (2019) expanded the associations that could be identified with the T/B ratio. They determined that a higher T/B ratio was negatively correlated with prefrontal executive control, including response inhibition and negative affect control. This suggests that excess theta in relation to beta activity could lead to greater impulsivity and to a lack of control of negative behaviors. They also found an association between higher T/B ratios and reward-motivated decision-making, possibly selecting immediate gratification at the expense of long-term benefit. Finally, they correlated the T/B ratio with increased mind wandering, decreased executive network functions, and increased default mode network (DMN) activity.
As with all the previous EEG frequencies and assessment measures, the correct amount of a particular frequency activity is important. For example, someone who lacks appropriate default mode functioning may experience a lack of the type of resting-state activity that appears to have a therapeutic effect. The DMN has also been called the resting state network (RSN) due to its functions that differ from task-oriented behaviors. It is thought to be important for a variety of reasons. Therefore, a person with a lower-than-typical T/B ratio may benefit from increased theta voltage and some training in activating the DMN. In contrast, an individual diagnosed with ADHD may benefit from training to reduce or inhibit excess theta voltage.
Temporal lobe theta likely reflects the hippocampal theta identified using depth electrodes. It appears to be associated with route finding and navigation, both hippocampal functions. Differential, interhemispheric (bipolar montage) training of temporal lobe areas in the theta frequency range has been a component of certain approaches to neurofeedback for some time (Othmer, 2007). This approach is used for various conditions, including migraine, tinnitus, PMS, and many others. Frequencies are adjusted to facilitate the optimal response and may range from the alpha frequencies through the theta frequencies down to the infra-low frequencies below 1 Hz.
Again, the analysis of theta activity is often aided by using a normative database. Otherwise, determining whether an amount is too high or too low in amplitude is difficult. Fortunately, for the T/B ratio assessment, Monastra (2001) has provided a table of values with three age ranges: 6-11 yrs, 12-15 yrs, and 16-20 yrs. The table of mean T/B power ratios is below.
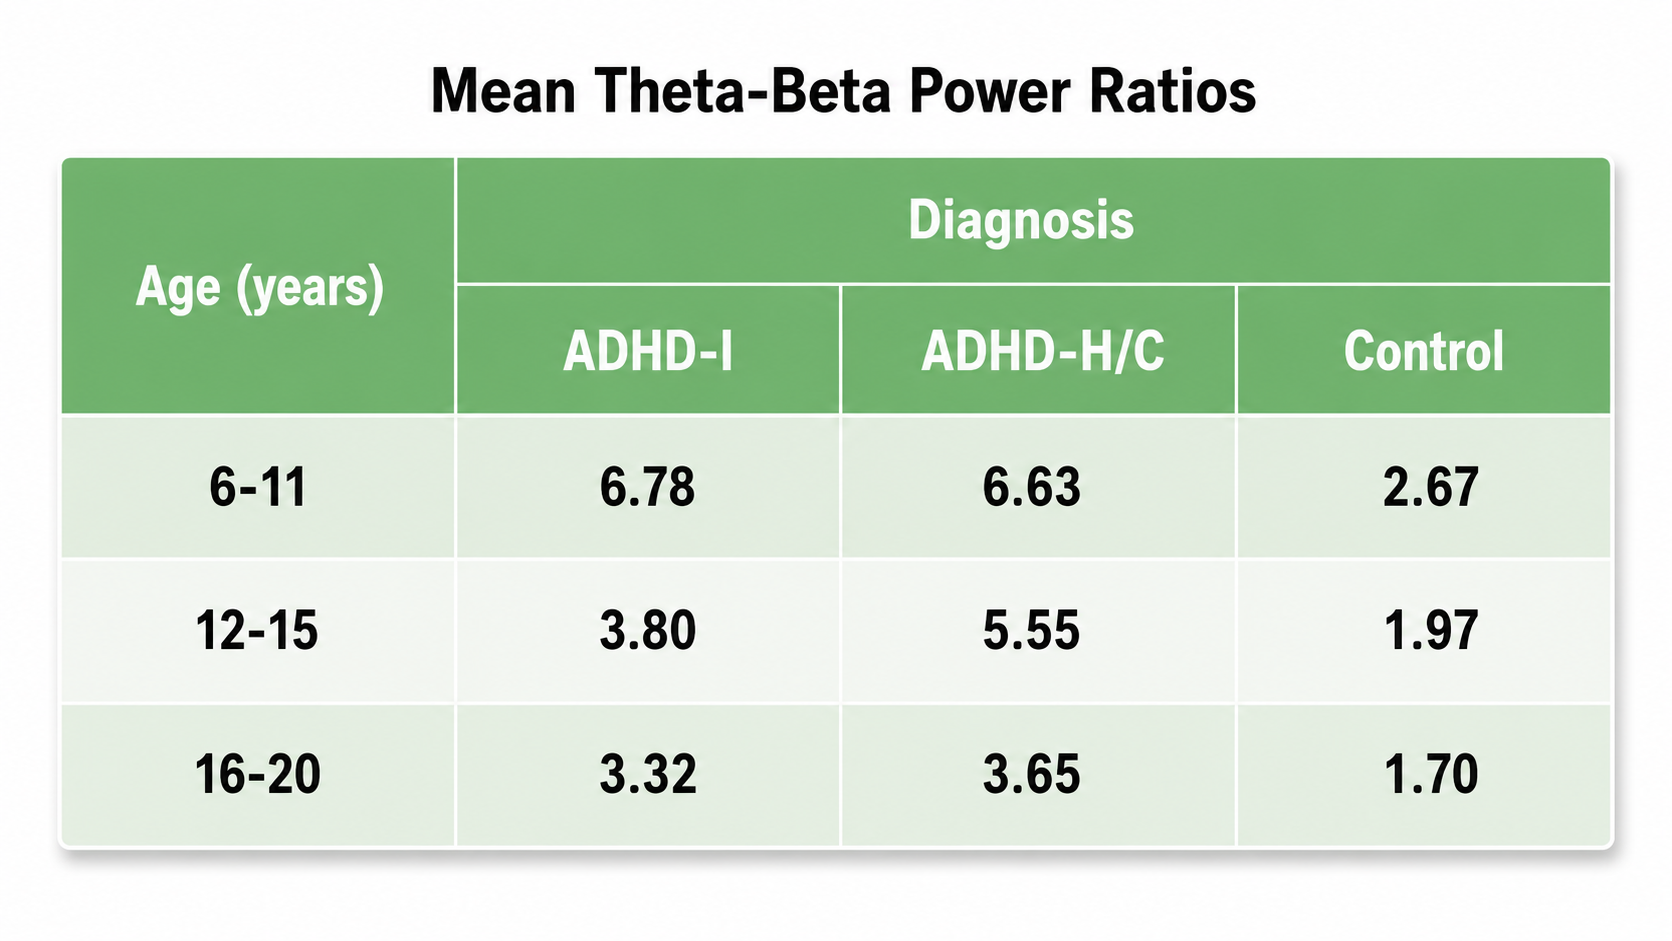
ADHD-I = attention deficit-hyperactivity disorder, inattentive type; ADHD-H/C = attention deficit-hyperactivity disorder, hyperactive-combined type.
Assessment of theta activity, more generally, beyond the T/B ratio in the central midline, is more challenging. As van Son (2019) noted, assessment under task may be essential to determine these results more accurately.
Two strategies to reduce high theta-to-beta ratios are amplitude training (down-training theta) and ratio training (rewarding decreases in the theta-to-beta ratio; Demos, 2019).
The theta-to-beta ratio and similar band-ratio measures rest on an assumption that dividing power in one band by power in another isolates oscillatory, or periodic, activity. Donoghue, Haller, et al. (2020) showed that the EEG power spectrum also contains an aperiodic component, a background that follows a one-over-frequency pattern and is described by an offset and an aperiodic exponent, or slope. Because this aperiodic activity contributes power at every frequency, a change in its slope can shift a band-ratio value even when no oscillation has changed at all (Donoghue, Dominguez, & Voytek, 2020). Their spectral parameterization method, distributed as the tool named specparam or FOOOF, separates true oscillatory peaks from the aperiodic background so that band power reflects genuine rhythms. For neurofeedback, this work is a caution that an elevated theta-to-beta ratio may reflect a steeper aperiodic slope rather than excess theta, which argues for parameterizing the spectrum before drawing conclusions about a client's oscillations.
Cognitive Decline
Brief memory lapses (senior moments) are associated with LH bursts of rhythmic temporal theta (BORTTs) due to sleepiness or reduced hippocampal perfusion. Assessment and training should incorporate memory tasks. The protocol should inhibit LH temporal lobe theta, particularly at T3.
Where BORTTs are produced by drowsiness, training should include behavioral interventions to reduce insomnia (Demos, 2019).
Because BORTTs are identified by visual inspection of the analog record rather than by a spectral display, this is one more setting in which the raw EEG carries information the processed signal does not. Demos (2019) recommends pairing assessment and training with a memory challenge such as a computerized card-matching game, and conducting the T3 inhibit protocol either with eyes closed or with eyes open while the client performs a cognitive task such as reading or attending to video graphics.
The movie below is a 19-channel BioTrace+ /NeXus-32 display of theta activity © John S. Anderson. Brighter colors represent higher theta amplitudes. Frequency histograms are displayed for each channel.
Substance Use Disorders
While alpha/theta protocols to treat substance use disorders up-train theta, this should be proscribed in epilepsy in the frontal lobes, where it could impair attention or decisions, or in PTSD due to the risk of provoking flashbacks (Demos, 2019). Using alpha-theta training protocols has generated caution from some practitioners and instructors, as indicated above in Demos (2019) and in conference presentations (personal experience). These cautions may result from a misunderstanding of the mechanism of alpha-theta training. In an upcoming post, John S. Anderson will address some of these issues and questions.
Final Notes
Recognition of standard EEG frequencies, analysis of such activity, and use of this information for training and re-assessment are important parts of neurofeedback practice. This section has attempted to provide an overview of this area to aid new practitioners and experienced clinicians in furthering their understanding of this complex study area.
One of the greatest benefits of neuroscience in general and electroencephalography and neurofeedback specifically is that they encourage lifelong learning. Suppose this section appeared overwhelming, with few hard and fast rules or concrete facts to hold on to. In that case, it is important to remember that one can do useful and effective neurofeedback without an in-depth understanding of this area. Understanding the EEG comes gradually through regular exposure to educational materials, lectures, and workshops, working with an experienced mentor, and regular interaction with clients and their EEG recordings. Pursuing and maintaining certification with the Biofeedback Certification International Alliance (BCIA) is a good way to engage in continuing professional education and lifelong learning.
There is no substitute for viewing large numbers of EEG recordings. As mentioned in the beginning, this can start with an EEG atlas and then progress to examining your own recordings, whether a single channel, a couple of channels, or multiple channels.
Patience with one’s process is an integral part of any learning experience. Think of the time it takes to learn any worthwhile skill, from swimming to learning a musical instrument to learning a new computer or phone operating system. Managing one’s expectations is crucial.
ALPHA (8-12 or 13 HZ)
Does the Alpha Rhythm Range From 8-12 or 8-13 Hz?
In electroencephalography (EEG), the alpha rhythm is generally defined as having a frequency range of 8-12 Hz or 8-13 Hz. This discrepancy arises from variations in historical definitions, regional practices, and updates in scientific standards.
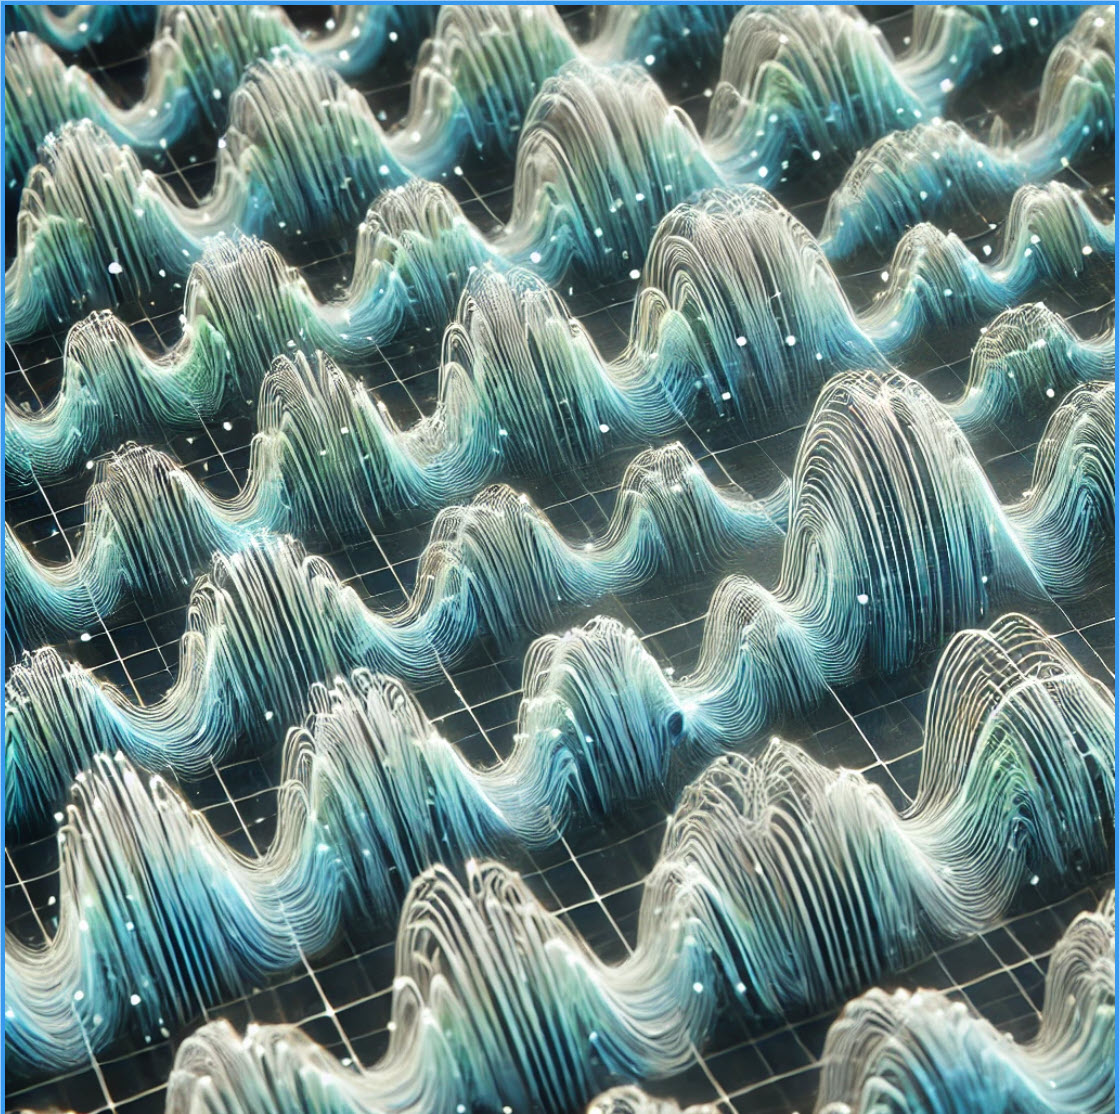
Many sources traditionally define the alpha rhythm within the 8-12 Hz range. This is common in older literature and is used in some clinical contexts to describe the typical frequency band associated with a relaxed, awake state. For example, Jadeja (2021) describes clinically relevant EEG frequency bands, including the alpha rhythm, as 8-12 Hz.
More recent or alternative standards may extend this range to 8-13 Hz to accommodate a broader spectrum of alpha activity observed in various populations and conditions. For example, Kane and colleagues (2017) offered the following revised definition:
Rhythm at 8–13 Hz inclusive occurring during wakefulness over the posterior regions of the head, generally with maximum amplitudes over the occipital areas. Amplitude varies but is mostly below 50 µV in the adult, but often much higher in children. Best seen with the eyes closed, during physical relaxation and relative mental inactivity. Blocked or attenuated by attention, especially visual, and mental effort. Comment: use of term rhythm must be restricted to those rhythms that fulfill these criteria. Activities in the alpha band which differ from the alpha rhythm as regards their topography and/or reactivity, should either have specific appellations (for instance: the mu rhythm and alpha coma) or should be referred to as rhythms of alpha frequency or alpha activity.
Summary
The slight variation in definitions typically does not impact the practical applications significantly but reflects different methodological approaches or updates in EEG research standards. The choice of definition can depend on the specific requirements of a study or the preference of a clinical guideline being followed. Both ranges are correct.
The Source of the Alpha Rhythm
Alpha has also been studied as an index of emotional regulation. Because alpha is inversely related to cortical activation, Davidson's approach/withdrawal model predicts that relatively greater right-frontal alpha (that is, lower right-frontal activation) accompanies approach-related, positive affect, while relatively greater left-frontal alpha accompanies withdrawal-related affect and has been associated with depression and disengagement. Clinicians should treat this frontal alpha asymmetry cautiously. A meta-analysis of 16 studies comparing 1,883 patients with major depression to 2,161 controls found a grand mean effect of d = -0.007, which was not significant (van der Vinne et al., 2017), and a multiverse analysis found the relationship highly sensitive to preprocessing choices, with only 13 of 270 analyses reaching significance (Kołodziej et al., 2021). Frontal alpha asymmetry is a research construct with a long history, not a validated diagnostic marker of depression.
Activity in the 8-12 Hz frequency range appears associated with reduced sensory and cognitive activity. Why is this so? What mechanism is responsible for this rhythmic activity?
One of the main communication pathways between the external world, the senses that perceive and transmit this information, and the cortical neurons that receive it is the thalamic-cortical relay system, often designated the TCR system. Remember that alpha activity is also associated with anterior/posterior interactive communication, which integrates posterior sensory processing and integration with anterior cognitive processing, decision making and executive functions.
The thalamus receives incoming sensory input (a paired structure in the brain's center. The individual nuclei of the thalamus transmit that sensory information to appropriate areas of the cortex. The occipital and parietal areas of the cortex are the primary visual processing areas, just as the temporal areas process most of the auditory information. In contrast, central Rolandic areas process tactile and other signals from the skin and muscles.
Of course, current findings indicate that brain activity is associated with coordination within and between cortical networks and influences from subcortical structures and local and TCR influences. Still, the TCR system is a primary pathway for determining which cortex areas receive each type of sensory input.
When the eyes close, the neurons responsible for processing incoming visual information no longer have “ work” to do, and so they respond to another signal coming through the TCR system. This is a rhythmic signal mediated by a membrane of inhibitory GABAergic neurons that surround most of the thalamus and provide inhibitory regulation of the signals traveling to the cortex. This is called the reticular nucleus of the thalamus (TRN) or nucleus reticularis of the thalamus (NRT). The function of this system is much too complex for this section, but a good treatment is available in Crabtree (2018), and an examination of the role of the TCR and TRN systems in consciousness is found in Min (2010).
The rhythmic signal from the TCR and NRT interaction produces a 10-Hz (8-12 Hz range) input to the visual processing neurons when visual sensory input is withdrawn (eyes closing), resulting in those neurons firing synchronously in that frequency in response to this input. This thalamocortical account is not the whole story: contemporary work assigns a substantial role to intracortical generators operating alongside the thalamocortical loop, and alpha is best understood as arising from both. Scalp EEG amplitude at a given frequency depends primarily on the area of cortex over which postsynaptic currents are synchronized, and on the orientation and folding of that source region, rather than simply on the number of neurons involved; opposing sulcal walls partially cancel, and the skull acts as a spatial low-pass filter (Nunez & Srinivasan, 2006). Therefore, when the eyes are closed, and the signal from the TCR system changes from sensory input to a rhythmic 10-Hz input, visual neurons respond to that input, and the voltage of alpha, and most specifically in adults, 10-Hz activity increases in voltage. The image below shows a spectral display of an eyes-closed EEG.
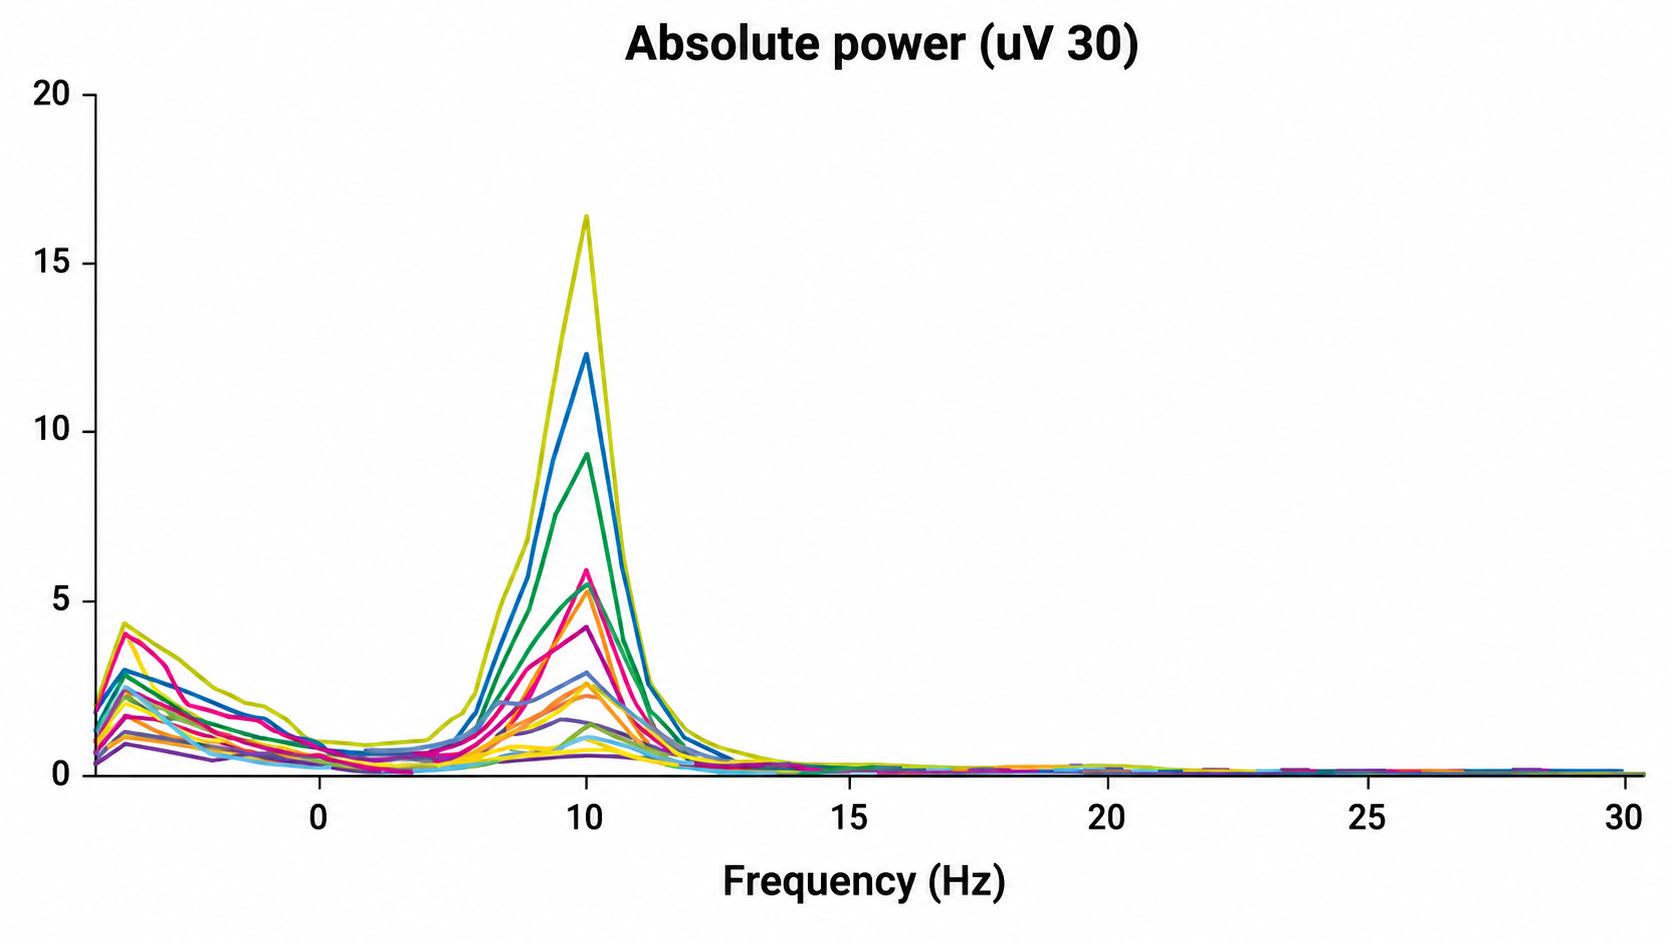
An eyes-closed EEG in a longitudinal bipolar montage is represented as a spectral display. The x-axis shows frequency from 0-30 Hz, and the y-axis shows absolute power (uV Sq). Note the peak at about 10 Hz. Voltage is higher in the P3-O1 derivation than in the P4-O2 derivation, revealing a small asymmetry. The highest power is in the T4-T6 derivation.
Identifying alpha activity in the scalp's parietal and/or occipital areas is usually quite easy, particularly in the eyes-closed condition. The image below shows an eyes-closed alpha pattern from a 15 -year-old male.
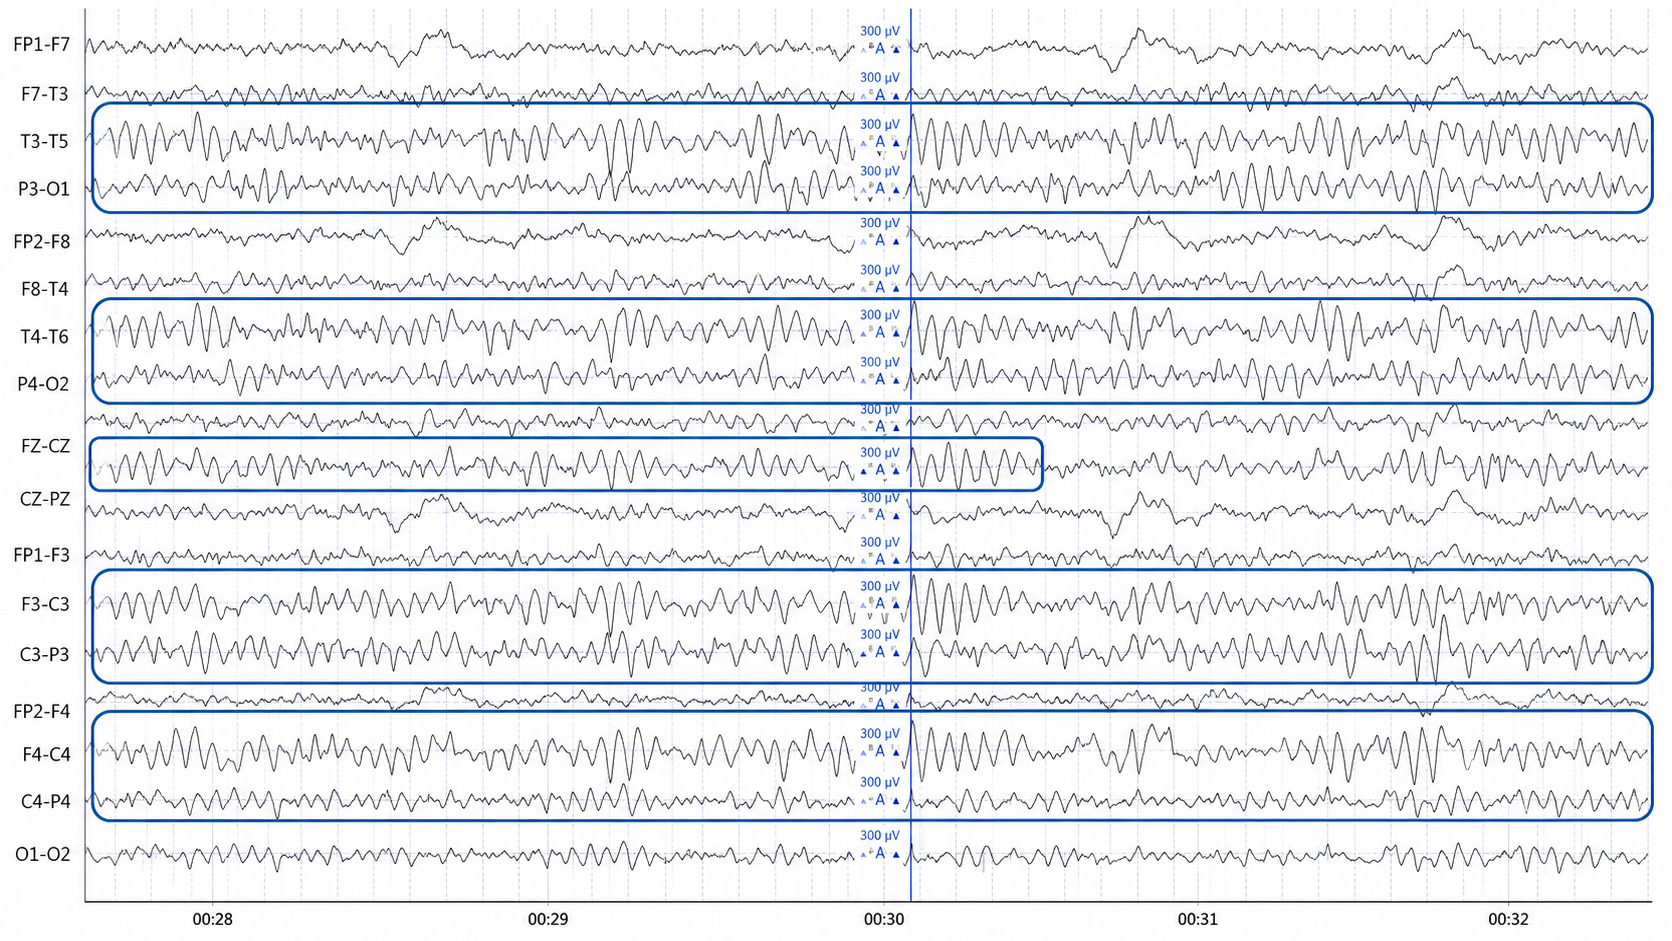
This is an eyes-closed EEG filtered to 1-45 Hz in the longitudinal bipolar montage with a 50-µV scale. Boxes indicate the most prominent 8-12 Hz activity. This montage represents a series of adjacent electrode comparisons or derivations, as each signal tracing is derived from each pair of electrode comparisons.
A longitudinal bipolar montage is displayed below.
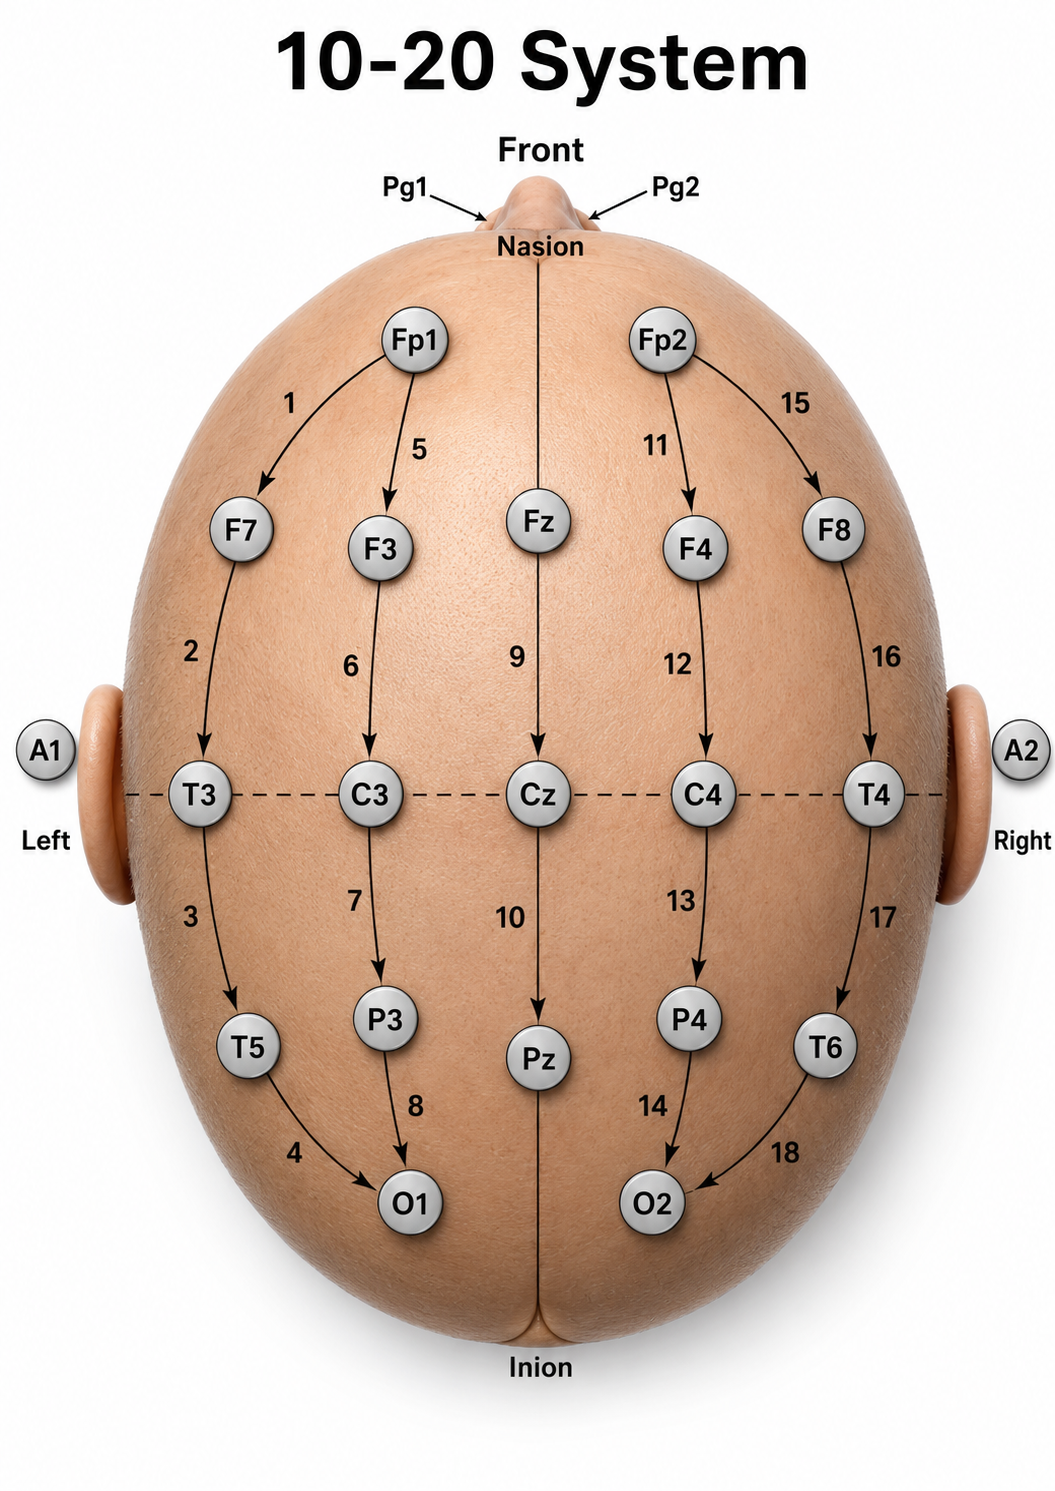
Longitudinal bipolar montage (commonly known as the “double-banana” montage).
Observe that the rhythmic activity is well-defined and has the typical bursting or spindling pattern of the alpha rhythm, resulting from the input of the TCR and NRT systems. Spindling consists of a series of distinct oscillations of a particular frequency that begin with relatively low amplitude, increase in amplitude, and then decrease in amplitude, giving the appearance of a spindle such as one used in spinning, with fiber wound around it.
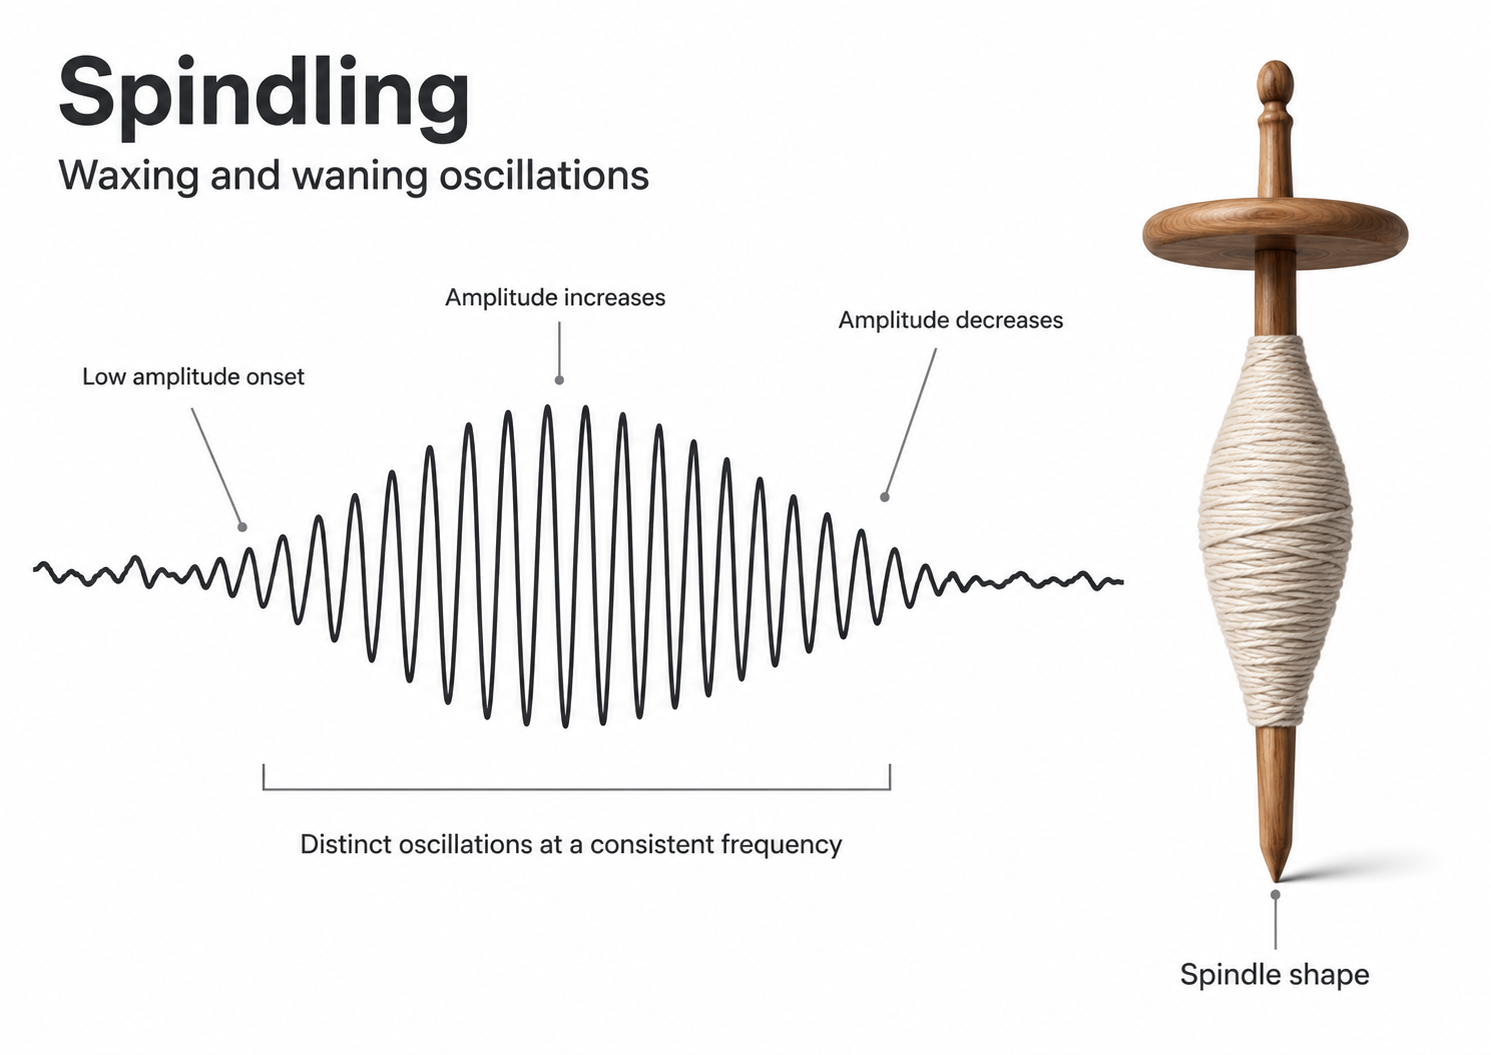
The waves are quite sinusoidal (waving up and down in a smooth rhythm similar to a sine curve) and continue throughout the recording with minimal disruption. The voltage indicator shows that the maximum voltage at the moment of the line placement was from about 20 to 30 uV at the peak of the waveform in this montage.
One can determine the wave's frequency by counting the number of peaks in a one-second segment or counting the number of times the wave crossed the zero line and dividing by 2 (zero crossings/2). Either method gives an 8-9 Hz value when multiple one-second epochs are counted. This is somewhat slow for a 15-year-old, although the voltage appears to be within normal limits. When compared to a normative database, we can see that, indeed, it is a slow peak alpha when compared to other 15-year-old males, as indicated by the chart below from the NeuroGuide™ database.
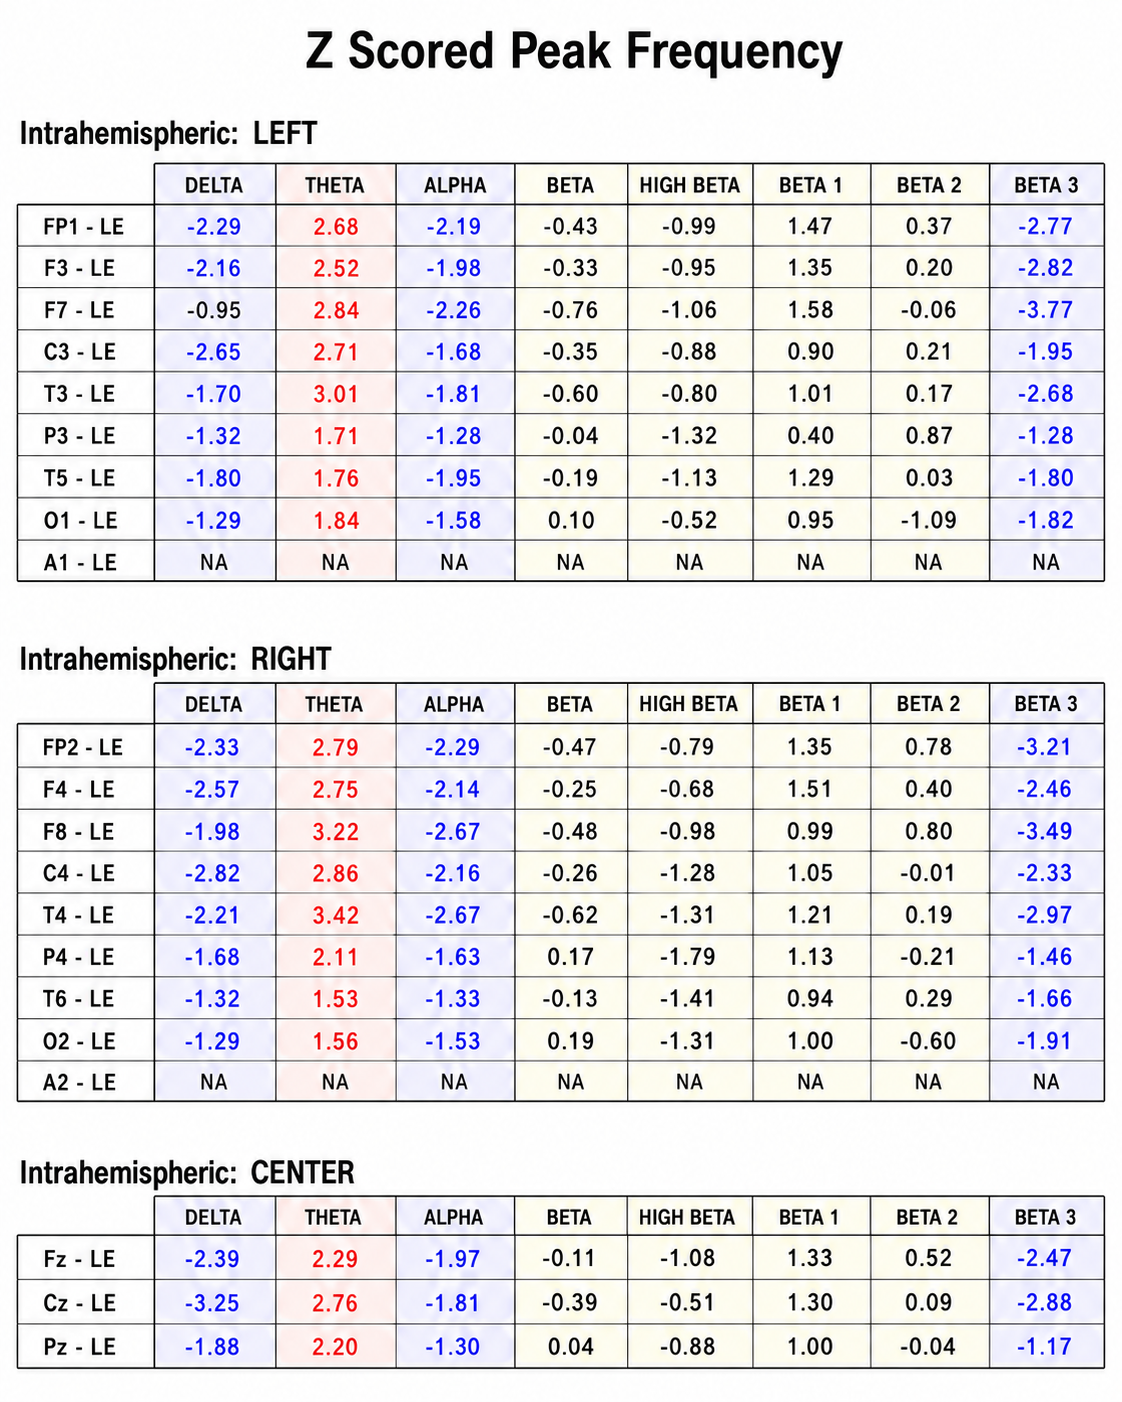
The alpha peak frequency z-scores are at least 1 SD below expected values (< -1.0 SD) in all locations, and many areas show deviations exceeding the significance cutoff of -1.96 SD (blue highlight). The database also plots the theta peak frequency as fast (red highlight) due to slow alpha in the 8-Hz frequency bin or segment. There are likely other slow components of the dominant rhythm that contribute to this incorrect plot of the frequency information. Ideally, the peak frequency of the EEG should be calculated within a broad range from approximately 6 Hz to about 14-16 Hz to avoid this type of error. This is another problem with the somewhat arbitrary designation of frequency bands using set values.
The same data processed by the iSynchBrain database show similar findings for O1 and O2 below.
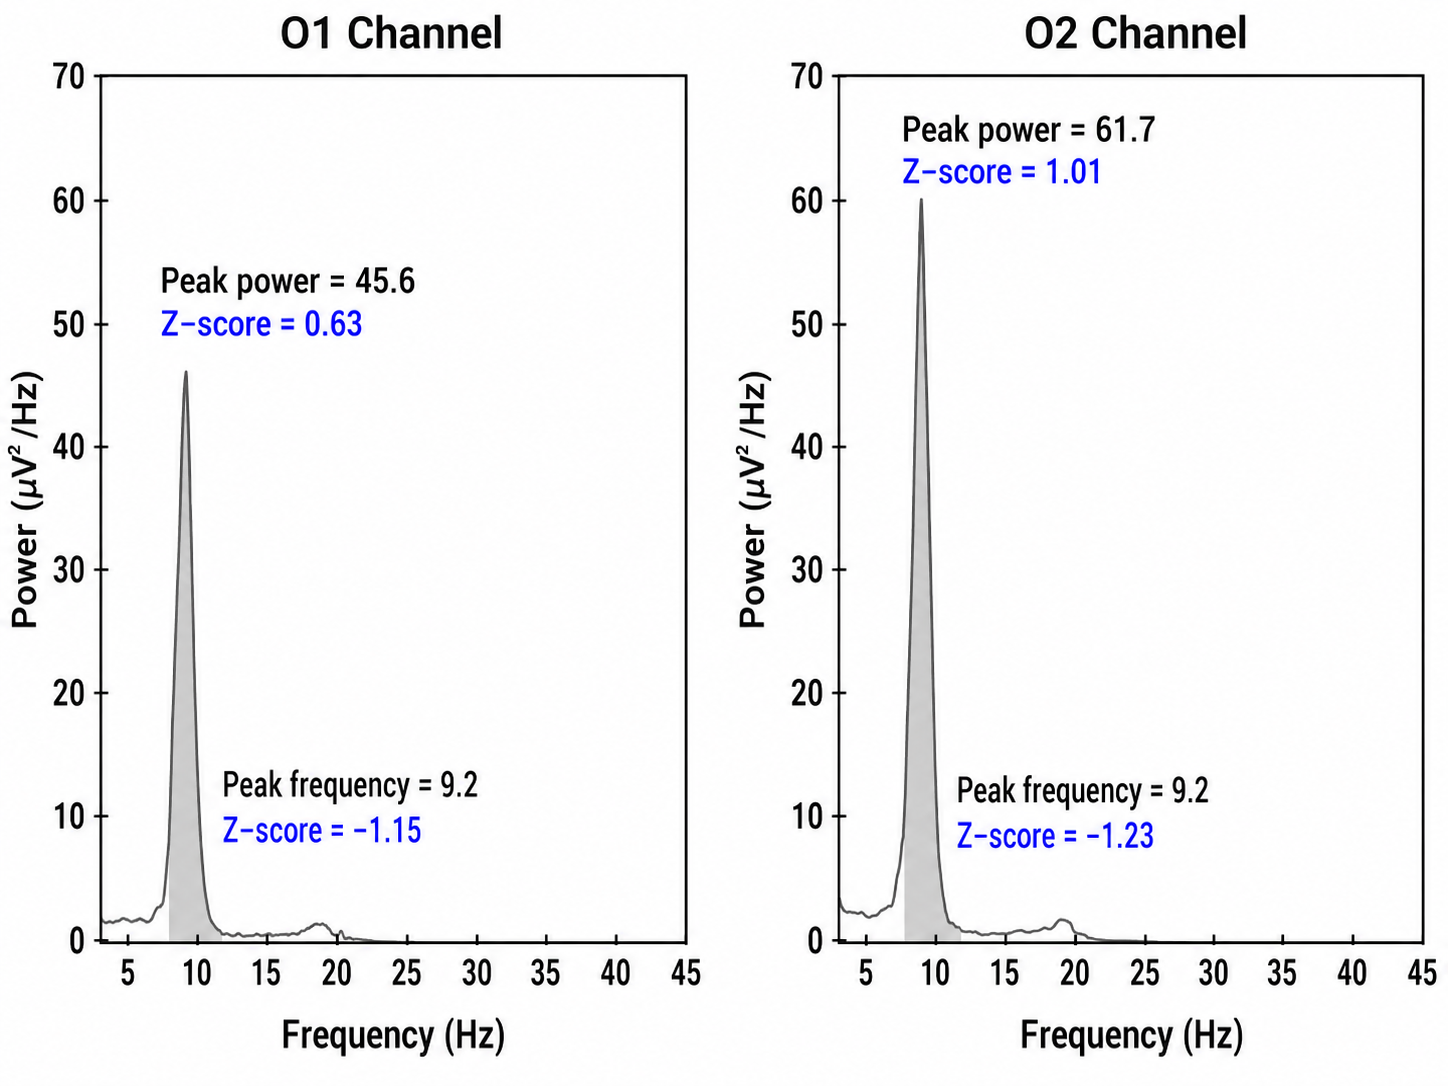
Peak frequency power and frequency comparisons at O1 and O2 show a slow peak frequency at 9.2 Hz bilaterally, resulting in z-scores of -1.15 and -1.23, respectively. Voltage (power) on the left is 0.63 SD, and on the right is 1.01 SD, showing slightly elevated values. This database provides single-Hz calculations for frequency and amplitude rather than using an arbitrary band to define alpha.
The alpha peak frequency is age-dependent, though not called "alpha" until the frequency reaches 8 Hz. It is designated as the posterior basic rhythm or posterior dominant rhythm (PDR) in early infancy. It appears around 4 months with a frequency of about 4 cycles per second (c/s) or Hz (Schomer & Lopes da Silva, 2017). The PDR increases (speeds up) during maturation and is approximately 6 c/s at 1 year and up to 8 c/s at around 3 years of age. This is when it can be called the alpha rhythm.
The frequency reaches approximately 10 Hz between about 10 and 15 years of age (Petersén & Eeg-Olofsson, 1971, a study of children aged 1-15), and remains near that value in healthy young adults, with reported means of about 9.9-10.2 Hz. The previous example shows why a peak frequency between 8-9 Hz is slow for a 15-year-old.
The Alpha Frequency's Meaning and Importance
The speed or frequency of the alpha peak frequency is not often mentioned, even in a neurologist’s report. For the neurofeedback practitioner, it is helpful to understand the factors associated with different alpha frequencies. The alpha peak frequency measures the frequency of the rhythmic pattern of the posterior rhythm (generally called alpha). This has traditionally been an important measure. Although it has recently been somewhat de-emphasized in some EEG circles, it remains an interesting measure. A great deal of research supports it as a useful metric for assessment.
Researchers such as Klimesch and others (Haegens et al., 2014; Hanslmayr et al., 2005; Mierau et al., 2017) have found it important to first assess the individual peak alpha frequency for normal subjects before investigating the cognitive effects of alpha neurofeedback.
The speed of the alpha frequency is also dynamic and reflects the type of activity. Increased cognitive load, particularly related to complex memory tasks, will briefly speed up the alpha frequency. Metabolic and gender factors also affect the speed of the alpha frequency.
During the menstrual cycle, women experience hormonal fluctuations, which directly affect this measure, alternately speeding and slowing the peak alpha frequency.
A slow peak alpha frequency has been associated with some forms of cognitive decline and memory impairment (López-Sanz et al., 2016), as well as with head injury, an association Williams (1941) described in the earliest years of clinical electroencephalography. A fast peak alpha frequency has been associated with improved scores on timed IQ tests. It has also been associated with enhanced memory and cognitive performance in various age groups (Grandy et al., 2013a, 2013b). A faster peak alpha frequency is associated with advanced reading skills in precocious children (Suldo et al., 2002).
Negative correlations of a peak alpha frequency faster than 10.5 Hz, possibly associated with an overly activated central nervous system, may include sleep initiation problems, anxiety, intrusive thoughts, and difficulty with self-soothing and self-calming skills.
The peak alpha frequency changes throughout the lifespan. Therefore, age-normed values for the peak alpha frequency are important for assessment purposes. The normal adult peak alpha frequency centers near 10 Hz, with reported means of about 9.9-10.2 Hz and a standard deviation of roughly 1 Hz, so individual values across the 8-13 Hz band can be normal. Scholarly literature states that the peak alpha frequency is not abnormal until it is below 8 Hz (Schomer & Lopes da Silva, 2017). However, it is commonly thought to be potentially meaningful when the frequency is below 9 Hz for an adult.
Angelakis et al. (2004) reported that group mean peak alpha frequency is reduced by roughly 1 Hz in clinical groups such as traumatic brain injury, and noted comparable reductions in stroke, dementia, and schizophrenia. Because normal peak alpha frequency varies substantially between individuals (SD ≈ 1 Hz), a 1 Hz departure in a single client is not by itself diagnostic. A slow alpha frequency can be associated with fatigue, cognitive decline, and memory impairment. Slowing of the background alpha rhythm is also a sign of generalized cerebral dysfunction (Nayak & Anilkumar, 2025). Rathee and colleagues (2020) related the speed of the peak alpha frequency to reading comprehension. They found that a slower peak alpha frequency is associated with poor comprehension.
Asymmetries in the posterior rhythm are common, and some are expected. Typically, the posterior rhythm has a higher voltage over the right, nondominant hemisphere. Surprisingly, a complete absence of the posterior rhythm can occur in a small percentage of otherwise normal individuals. While the absence of the posterior rhythm can also be seen in individuals with brain injuries or other abnormalities, such cases usually exhibit additional EEG abnormalities. Therefore, an EEG that only shows the absence of the posterior rhythm without other abnormalities should be considered normal (Libenson, 2024).
However, other sources correlate the absence of the posterior alpha rhythm with a variety of other indicators, even when additional abnormal EEG patterns are not present.
Niedermeyer (1997) discusses the absence of the posterior alpha rhythm and points out correlations between chronic alcoholism and vertebrobasilar artery insufficiency. He suggests that a lack of posterior alpha may be associated with dysfunctional synchronization mechanisms and states:
The crucial factor in these considerations might be the question: is absence of the alpha rhythms in the scalp EEG (and even in recordings from deeper structures) synonymous with alpha absence in the microstructure? In other words: is alpha rhythm a truly universal phenomenon in healthy persons regardless of EEG-alpha-absence caused by lack of synchronizing mechanisms? Accordingly, persons with an inherited low voltage fast pattern do have a posterior alpha but are unable to show it in their EEG records.
Other conditions that show an absence of the posterior alpha rhythm include seizure disorders. Aich (2014) and colleagues found a significant correlation (<0.01) between the presence of seizure activity and the absence of the alpha rhythm. This study identified 48.3% of their identified seizure disorder participants as having no visible alpha rhythm.
Fast Alpha and Alpha Harmonics
The discussion so far has treated the peak alpha frequency largely as a single number that is either normal, fast, or slow, and its absence as a separate question. In practice, the rhythm at both ends of that range behaves in ways the number alone does not capture, and two patterns are regularly misread. The first is fast alpha, activity at the upper end of, or beyond, the conventional alpha range. Two distinct phenomena travel under this name, and separating them is the first analytic step.
The first is a dominant posterior peak in the 11-13 Hz range. This is a normal variant of the posterior dominant rhythm and reflects individual differences in peak alpha frequency (PAF), the frequency at which alpha activity is strongest in a given person. Fast alpha in this range is common in individuals with efficient information processing and strong attentional control, and faster peak frequencies have been associated with working memory performance and with general cognitive ability (Clark et al., 2004; Grandy et al., 2013a; Klimesch, 1999). Posthuma and colleagues (2001) found that alpha peak frequency and IQ are each highly heritable (66-83%) but reported no genetic correlation between them, concluding that "smarter brains do not seem to run faster." Phenotypic correlations ranged from -0.04 to 0.15. John S. Anderson notes that where a relationship between fast alpha and achievement is observed clinically, it need not be heritable: children often emulate parental behavior, so parenting style, expectations, and early cognitive stimulation may contribute. He also notes clinically that clients with fast alpha frequently report sleep problems and "driven" behavior, and that a rhythm associated with achievement may carry health vulnerabilities later in life. One small study reported higher peak alpha frequency in veterans with PTSD (Wahbeh & Oken, 2013). There is no established threshold at which peak alpha frequency becomes clinically "too fast," and PAF has not been shown to predict insomnia, anxiety, or intrusive thoughts.
The second phenomenon is different in kind. A smaller subset of recordings shows activity in the 18-19 Hz range that is an exact multiple of a lower primary alpha generator, most often one near 9-9.5 Hz. These alpha harmonics are not a second rhythm with its own generator but a byproduct of waveform asymmetry and resonance within the thalamocortical loop. Most brain oscillations deviate from an ideal sine wave because the depolarizing and repolarizing phases of neuronal firing are not symmetrical, and that asymmetry generates harmonic distortion, producing multiples of the fundamental frequency that appear as smaller peaks in spectral analysis. The effect is most pronounced when the underlying alpha is well formed and highly synchronized, so a visible second harmonic is a signature of a strong, stable alpha generator rather than a sign of instability.
The two forms also look different in the raw record. Fast alpha at 11-13 Hz retains the surface features of classical alpha: it is sinusoidal, waxes and wanes, is typically low to moderate in amplitude, is symmetrical across hemispheres, and is maximal over parieto-occipital regions. It has a sharper peak and shorter cycle length than slower alpha but keeps the smooth contour of physiologic alpha, and it remains reactive to eye opening and alerting stimuli. The 18-19 Hz harmonic, by contrast, has a flatter amplitude profile and is less sustained, arriving in trains of several hundred milliseconds or as transient events rather than a continuous rhythm. Harmonics of this kind are common: in a large open dataset, a beta peak at exactly twice the alpha frequency was present in 65.6% of participants with eyes closed and 47.9% with eyes open (Schaworonkow, 2023). Harmonics are most reliably detected in frequency-domain displays, where they appear as secondary peaks at precisely double the main alpha frequency, and unlike epileptiform discharges or sleep spindles they neither propagate across electrode sites nor evolve in morphology over time.
A clinician reviewing a qEEG sees a spectral peak near 18.5 Hz over O1 and O2 and wonders whether the client has excess beta. Three checks resolve the question. First, frequency: 18.5 Hz is almost exactly twice the client's 9.3 Hz posterior peak, the relationship expected of a second harmonic. Second, distribution: drug-induced beta spindling is frontocentral, whereas this activity is posterior and symmetric. Third, reactivity: benzodiazepine-related beta is non-reactive to eye opening, while this activity appears after eye closure and vanishes on eye opening. The finding is a benign harmonic of a well-formed alpha generator, and reporting it as "excess beta" would invite an unnecessary medication review.
The most pressing clinical risk with fast alpha is exactly this misclassification. Beta spindling, the sustained rhythmic 18-30 Hz activity commonly seen in clients taking benzodiazepines, barbiturates, or certain antiepileptic drugs, is typically frontal or frontocentral in distribution, often asymmetric, and non-reactive to eye opening. Alpha harmonics are brief, symmetric, posterior, and reactive. Confusing the two can lead to an erroneous attribution of drug effect or cortical irritability. A second confusion arises during drowsiness, when a harmonic may be mistaken for a sleep spindle; sleep spindles occur at 12-15 Hz, are maximal at central sites, and show a waxing and waning envelope quite unlike the parieto-occipital topography of a harmonic. Fast alpha must also be distinguished from the pathologic beta excess of metabolic encephalopathies, which is diffuse, higher in amplitude, and lacks both spatial anchoring and reactivity.
Reporting should be correspondingly precise. For a fast posterior dominant rhythm, a clinician might write that the background consists of a posterior dominant rhythm at 12.5 Hz, symmetric and reactive to eye opening, with no pathological features. When harmonics are present, the report should name them as physiologic extensions of the alpha generator rather than independent rhythms: following eye closure, a brief 18-19 Hz harmonic of the posterior dominant rhythm is noted over occipital leads, symmetric, reactive, and consistent with a normal variant, with no epileptiform activity or pathological beta observed. Explicitly identifying harmonics is especially valuable in qEEG contexts, where an 18-19 Hz peak may otherwise be flagged as excess beta.
Slow Alpha and Subharmonic Expression
Slow alpha refers to posterior dominant activity below the conventional 8-12 Hz range, most often between 6 and 8 Hz and occasionally as low as 5 Hz. Historically, any dominant posterior rhythm below 8 Hz in an adult was treated as evidence of cortical dysfunction, particularly in the setting of metabolic encephalopathy, structural disease, or cognitive decline. That reading is sometimes correct, but it does not account for the full dynamical behavior of thalamocortical oscillators.
It has been suggested that a subset of these slow rhythms represents a subharmonic of the posterior dominant rhythm, a lower-frequency component produced by the same resonant thalamocortical loop oscillating at a whole-number division, most commonly half, of the fundamental frequency. Subharmonics are a recognized property of nonlinear systems, which resonate not only at their fundamental frequency but at lower-order integer divisions of it (Breakspear, 2017). Note the asymmetry with the harmonics discussed above: waveform asymmetry generates integer multiples of the fundamental, whereas a subharmonic requires period doubling, a stronger nonlinear claim. This account is therefore speculative. It has support from computational corticothalamic modeling but has not been demonstrated in human scalp EEG, and slow posterior activity in the 6-8 Hz range is more safely described simply as a slowed alpha peak rather than as a mode-shifted PDR.
Morphology supports this reading. Slow alpha keeps the regular sinusoidal shape, the waxing and waning envelope, and the posterior distribution that define alpha, but its slower evolution makes the oscillations look broader and more widely spaced, with an envelope that takes longer to build and decay. A distinctive feature in many recordings is notched alpha, in which brief segments of faster activity appear embedded within the slower waveform. Where slow alpha is a subharmonic of a 10 Hz generator, these embedded 10 Hz cycles emerge as brief local bursts that enrich rather than disrupt the overall structure, and they reflect moments when the generator transiently returns to its fundamental frequency. Crucially, the rhythm remains reactive: it attenuates within about a second of eye opening and returns with eye closure. That reactivity, together with its posterior anchoring, is what distinguishes it from pathologic theta or delta, which are usually non-reactive and poorly localized.
Several mechanisms produce slow alpha. The most developmentally grounded is neurophysiological immaturity. The posterior rhythm appears around 3 to 4 years of age and speeds up with maturation, stabilizing in the 9-11 Hz range by late adolescence, so a 6-7 Hz posterior rhythm in a 6-year-old is entirely normal (Johnstone et al., 2005; Whitford et al., 2007). Pediatric interpretation must therefore rest on age-based normative data, a point already made in the discussion of the posterior dominant rhythm and single-hertz bins. In adults over 60, mild slowing may re-emerge with reductions in white matter integrity, synaptic density, and cholinergic tone, and where reactivity, symmetry, and posterior localization are preserved, that slowing is a non-pathological correlate of aging (Grandy et al., 2013b). When slowing accompanies cognitive symptoms, however, it may reflect early neurodegenerative or vascular disease, which reduce oscillatory synchronization and shift the dominant frequency downward (Babiloni et al., 2004; Moretti et al., 2004). The third mechanism is the nonlinear resonance already described, in which the generator enters a divided-frequency mode transiently during drowsiness or relaxation, or more persistently in individuals with unusual alpha architecture.
John S. Anderson emphasizes that the clinically consequential finding is more often a slow peak in the 8-9 Hz range than a rare subharmonic near 5 Hz, which returns us to the point Angelakis et al. (2004) made above about slowing of more than 1 Hz. Atypical slowing may reflect sleep deprivation, toxic exposures, or nutritional deficiencies. Boonstra and colleagues (2007) documented that prolonged sleep deprivation shifts alpha activity into the theta band, which a normative database may score as excess theta rather than as displaced alpha. Such clients can appear intact on interview yet show slowed cognitive response times, including increased P300 latency and reduced amplitude (Morris et al., 1992).
Several supporting features argue for pathology rather than benign variation: increased alpha amplitude during eyes-open wakefulness, reduced alpha reactivity to eye opening, and frequent or premature transitions into Stage 1 sleep during the eyes-closed condition. A continuous performance test can detect the impairments in sustained attention and reaction-time variability that clients with chronic sleep restriction rarely self-report, and overnight audio recordings, sleep journals, or wearable trackers offer accessible alternatives to polysomnography.
Three misinterpretations must be ruled out. The first is theta slowing. Pathologic theta is persistent, unreactive, and generalized, and in encephalopathy it lacks spatial anchoring and appears polymorphic or irregular. Slow alpha, even below 8 Hz, is well formed, posteriorly distributed, and highly reactive. The danger lies in equating frequency alone with dysfunction. The second is epileptiform activity. The faster cycles embedded in notched alpha are harmonics, not spikes or sharp waves: they do not violate the baseline, are not followed by slow waves, and are not stereotyped. The third is occipital intermittent rhythmic delta activity (OIRDA), a sharply contoured 2-4 Hz rhythm seen in children with generalized epilepsy syndromes. OIRDA lacks the sinusoidal shape of alpha, is often maximal over midline occipital electrodes, and does not represent an extension of the alpha generator (Watemberg et al., 2007).
As with fast alpha, the wording of the report matters. Writing only that "alpha is slowed" invites the reader to treat a normal variant as an abnormality. A more useful formulation states that the posterior dominant rhythm is 5-6 Hz, sinusoidal and symmetric, reactive to eye opening, and maximal over parietal and occipital regions, with occasional embedded 10 Hz activity suggesting subharmonic expression of the posterior dominant rhythm and no epileptiform or focal abnormalities identified. Pediatric reports should anchor the finding to developmental age, and reports on older adults or clients with cognitive symptoms should preserve uncertainty without pathologizing prematurely, for example by noting that the posterior rhythm sits at the lower limit of normal, that symmetry and reactivity are preserved, and that clinical correlation with cognitive function is advised.
What unites fast and slow alpha is that neither can be classified by frequency alone. Morphology, topography, and above all reactivity decide whether a rhythm outside the textbook band is a variant or a sign of dysfunction. Reactivity is measured by the change in amplitude between the eyes-closed and eyes-open conditions, which is the subject of the next two sections.
Eyes-Closed Alpha Response Voltage Meaning and Importance
The amplitude of the activity can also be meaningful in addition to the peak frequency within the 8-12 or 8-13 Hz alpha band. Anxiety and TBI can reduce alpha activity during baselines. Since concentration and thinking can suppress alpha, instruct clients to refrain from these activities during recording (Demos, 2019).
The alpha voltage will be partially affected by the montage that is used. For example, considering the discussion of differential amplifiers in the Instrumentation and Electronics section, the closer two electrodes are to each other, the more the rhythmic, synchronous patterns will be attenuated. Common-mode rejection (CMR) is most sensitive to frequency synchronization, so waves that are the same frequency and also synchronous (e.g., 10 Hz waves, waving up and down at the same time at the two sensor locations + and – [also commonly called “active” and “ reference”]) will be rejected. Comparing the O1 and O2 occipital electrodes to each other will result in a lower apparent alpha voltage if the two waveforms are synchronous, which is quite likely.
Conversely, comparing either O1 or O2 to an ear reference or possibly to a forehead reference would result in almost no rejection of alpha activity. Therefore, the rhythmic patterns are unlikely to be similar at these distant locations and will be retained. When viewing standard voltage information in an atlas, a research paper, or a textbook, try to identify the montage used when those standards were developed.
Simonová et al. (1967) found amplitudes between 20 and 60 μV in 66% of their subjects, while values below 20 μV were found in 28% and above 60 μV in only 6%. Schomer and Lopes da Silva (2017) suggest that values between 10 and 60 μV are typical. However, other sources such as the Johns Hopkins Atlas of Digital EEG (2011) and Libenson’s (2024) Practical Approach to Electroencephalography (2nd ed.) cite 20 μV as the minimum voltage for adults. These differences may seem insignificant but can represent the difference between a low voltage fast EEG finding and a typical assessment.
Rhythmic alpha activity represents the synchronization of the EEG. It represents part of the excitation/inhibition cycle. When either large or small groups of neurons perform tasks, this results in the desynchronization of the EEG during work, as each group of neurons performs its function locally and independently. This is followed by a resting or inhibitory phase that results in the synchronization of the EEG and, hence, an increase in alpha amplitude as many neurons fire synchronously. This is seen in the shift from active visual processing when the eyes are open to a synchronous pattern of oscillatory activity when neurons do not have incoming visual input to process and can rest. This measure of alpha voltage change from eyes open to eyes closed, known as the alpha response, and the decrease of alpha with eyes opening, called alpha blocking, helps identify if the work/rest cycle is occurring correctly.
Someone with an eyes-closed posterior dominant rhythm voltage below 20 μV suggests to the neurofeedback assessor that the person does not easily shift to a state of decreased arousal/alertness necessary for the alpha amplitude to increase. The disconnection from the outside world upon eyes closing should result in decreased sensory processing of vision and other senses and decreased cognitive activity, leading to an increase in 8-12 Hz amplitude or power.
Typically, alpha activity voltage should increase as more neurons fire synchronously in this frequency. As a clinical heuristic rather than a published criterion, when this increase is less than about 50% above the resting baseline eyes-open alpha voltage, it may indicate some difficulty turning off the mind, meaning that neurons remain activated and working and thus prevent them from entering a resting state. The lack of a typical alpha increase may be associated with heightened states of alertness and vigilance, meaning that these clients maintain their external perceptive focus and/or cognitive activity, even when the eyes are closed, likely inhibiting the ability to achieve global synchronous activity. Resulting behavioral consequences can include fatigue, as the neurons are constantly engaged and are not allowed to rest. This pattern may be associated with a history of trauma and/or a history of hypervigilance for various reasons.
Example of a typical alpha response upon eyes closing.
This is a 19-channel recording of the transition from eyes-open to eyes-closed conditions. It is a longitudinal bipolar montage, and the scale is 50 μV. Note that the eyes close at minute 2:40 (indicated by the eye movement), and the immediate response of the alpha rhythm appears.
The movie below is a 19-channel BioTrace+ /NeXus-32 display of alpha activity under eyes-closed and eyes-open conditions © John S. Anderson.
Alpha-Blocking Response Meaning and Importance
Conversely, the continued presence of alpha once the eyes are open suggests a lack of appropriate alpha blocking. This appears to result from a lack of inhibition of synchronous generator mechanisms. Hartoyo and colleagues (2020) showed a simple mechanism: excitatory input to inhibitory cortical neurons. This differs from the excitatory cortical neurons that typically reduce synchronous cortical firing in favor of local responses to incoming stimuli when the eyes are opened.
Note that activation of inhibitory mechanisms results in increased inhibition, even though the function is initially excitatory. Conversely, activation of excitatory mechanisms results in greater activation. This can seem confusing, and it may help to focus on the result, whether excitatory or inhibitory, rather than the initial behavior.
There should be a dynamic balance between excitation and inhibition in the human neocortex (Dehghani et al., 2016). When this balance is disrupted, we see the behavioral effects noted here. Alpha blocking represents the re-activation of visual processing neurons when visual input returns. Typically, as these neurons are no longer in a common or general resting state but are involved in task-oriented behaviors that are more localized, synchronous activity should decrease (be inhibited). Therefore, the overall voltage will decrease because of less synchronization. This does not imply that more neurons are firing when the alpha amplitude is higher; it means less synchronization and, hence, lower voltage.
Imagine an auditorium where everyone claps in unison (eyes-closed alpha rhythm). The noise is loud because the claps are synchronized (higher amplitude), with silence in between. Now, picture everyone clapping independently, perhaps in sync with immediate neighbors but not the whole audience. This resembles the eyes-open condition when recording the alpha rhythm: there is continuous noise because someone is always clapping, resulting in a faster frequency of claps. However, it’s never as loud as synchronized clapping, leading to lower overall voltage despite the higher frequency. Thus, alpha amplitude decreases quickly when eyes open, within 1-2 seconds, and certainly within 10-15 seconds. Delays in alpha blocking suggest difficulty returning to the task. Desynchronization occurs in posterior areas as visual processing begins when the eyes are opened.
The most common reasons for the lack of appropriate alpha blocking (meaning alpha activity persists after eyes are opened) are:
1. Fatigue, including sleep deprivation
2. Long-term meditation practice, particularly mantra meditation
3. Marijuana use and abuse, generally long-term, chronic
4. Cerebral dysfunction due to disease, injury, or possibly chemical exposure
Below is an example of alpha-blocking following the eyes opening.
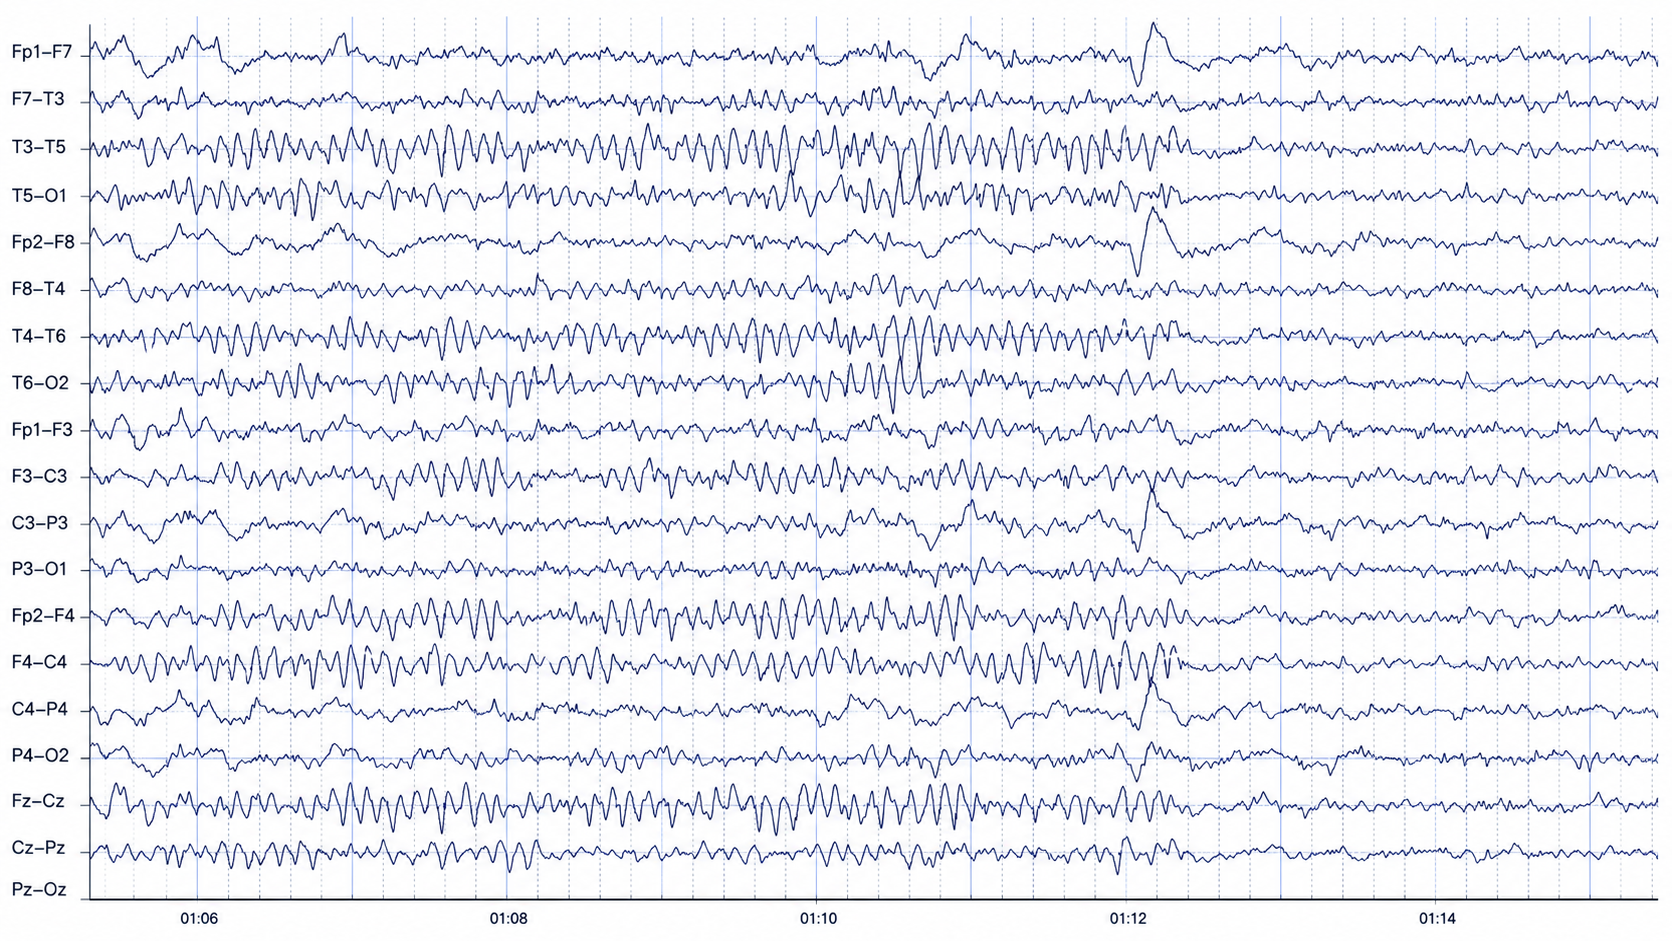
This is a 19-channel recording of the transition from eyes-closed to eyes-open conditions. This is a longitudinal bipolar montage, and the scale is 50 μV. Note the eyes opening at minute 1:12 (indicated by the eye movement) and the immediate blocking of the alpha rhythm.
Clearly, the response of 8-12 Hz EEG activity can be quite revealing and provides the clinician with helpful information about the client. However, it is important to note that other factors can affect the EEG recording. We have already noted the effects of artifacts on the EEG in general. Additionally, the client’s state of mind, level of anxiety, comfort with the application of sensors to the scalp, level of trust of the practitioner conducting the recording, amount of sleep, the use of caffeine and other stimulants and common medications can all affect the results of the recording.
Once an assessment is made of excess or deficient alpha activity, lack of an alpha response or persistent alpha following the eyes opening, or a slow or fast peak alpha frequency, the clinician can proceed with training to address these findings.
In neurofeedback training, alpha waves are a primary target for interventions aimed at improving relaxation, focus, and emotional regulation. Alpha neurofeedback involves training individuals to enhance or suppress alpha activity in specific brain regions based on their unique needs. For example, increasing posterior alpha activity is commonly used to promote relaxation and reduce stress, while suppressing excessive frontal alpha may help alleviate symptoms of depression and improve motivation. The speed of the peak alpha frequency can be trained as well, increasing a slow frequency to improve cognitive performance or slowing an excessively fast frequency to reduce anxiety and hypervigilance.
There are multiple approaches to training the 8-12 Hz frequency band, including training specific segments of that band to achieve training goals. For example, if a lack of an alpha response to eyes closing is associated with anxiety and possibly insomnia, training for an increase in the 8-10 Hz portion of the posterior alpha rhythm in the eyes-closed condition may be an effective intervention. If the peak alpha frequency is slow, training for increases in the 10-12 Hz portion may help speed up this frequency. If there is persistent alpha in the eyes-open condition, inhibiting or downtraining 8-12 Hz generally may be helpful.
Of course, with any intervention, other causal factors must be addressed as well. Persistent alpha and/or frontal alpha can signify fatigue secondary to a sleep disorder such as sleep apnea. Therefore, a referral to a physician for a sleep study may be helpful. Over-arousal patterns that correspond to a lack of alpha response can be associated with a history of emotional, psychological, physical, or sexual trauma. The neurofeedback clinician may need to address these issues or refer the client to an appropriate therapist.
Summary
The alpha rhythm is characterized by a frequency range of 8-12 Hz or 8-13 Hz, with the discrepancy arising from variations in historical definitions, regional practices, and scientific standards. Traditionally, the 8-12 Hz range is used in older literature and clinical contexts. However, more recent standards extend this to 8-13 Hz to include a broader spectrum of alpha activity.
The alpha rhythm is primarily observed when a person is awake, relaxed, and with their eyes closed. This activity involves the thalamic-cortical relay (TCR) system together with intracortical generators. When visual input ceases (e.g., eyes closed), rhythmic signaling involving the reticular nucleus of the thalamus (TRN) reaches the visual processing neurons, contributing to the alpha waves detected in EEG recordings.
Clinically, the alpha rhythm is crucial for diagnosing sleep disorders, cognitive function, and various neurological conditions. A slow peak alpha frequency is linked to cognitive decline and memory impairment, while a faster peak frequency has been associated with better performance on some cognitive measures. Note that although peak alpha frequency and IQ are each highly heritable, no genetic correlation between them has been demonstrated (Posthuma et al., 2001). Neurofeedback protocols often use individual peak alpha frequencies to enhance cognitive functions. Deviations from the normal alpha frequency range can indicate neurological or psychiatric conditions, such as generalized cerebral dysfunction or persistent alpha activity with eyes open.
Not every deviation is a deviation, however. Fast alpha at 11-13 Hz is a normal posterior dominant rhythm associated with efficient processing, and 18-19 Hz alpha harmonics are nonlinear byproducts of a strong 9-9.5 Hz generator rather than independent rhythms or excess beta. At the other end, slow alpha below 8 Hz may reflect developmental norms, healthy aging, neurodegenerative change, or subharmonic expression of the same thalamocortical oscillator. Because frequency alone cannot separate these variants from pathology, clinicians should weigh morphology, topography, and reactivity, and should name harmonics and subharmonics explicitly in their reports so that other readers do not mistake them for pathological beta or theta slowing.
The analysis of alpha rhythms in EEG is essential for clinical and research purposes, aiding in diagnosing and understanding various conditions and developing targeted treatments. The amplitude and frequency of alpha activity provide insights into a patient's cognitive and emotional state, supporting personalized therapeutic interventions. The importance of alpha rhythms underscores their role in cognitive neuroscience and clinical neurophysiology.
SENSORIMOTOR RHYTHM (12 or 13-15 HZ)
Sensorimotor rhythm (SMR) activity falls within the frequency range of 12 to 15 Hz, overlapping with the beta band's lower and alpha bands' higher ends. SMR waves are defined by their frequency and location, and are distinct from other EEG rhythms due to their association with a calm, alert state.
SMR is typically recorded over the sensorimotor cortex and characterized by rhythmic oscillations distinct from the higher-frequency beta and lower-frequency alpha waves (Sterman, 1996). Activity within this 12-15 Hz frequency band occurring in regions other than the sensory motor cortex is considered low beta or beta1 and is not defined as the sensorimotor rhythm.
The SMR rhythm is generated by thalamic ventrobasal relay cells and reentrant thalamocortical loops (Thompson & Thompson, 2015). These circuits involve the thalamus sending sensory information to the cortex, where it is processed and sent back to the thalamus, creating rhythmic oscillations (Lopes da Silva, 1991). The sensorimotor cortex, particularly the primary motor cortex (M1) and the primary somatosensory cortex (S1), contains neurons that contribute to the generation of SMR. The synchronized activity of these neurons results in the rhythmic patterns observed in SMR (Pfurtscheller & Lopes da Silva, 1999).
The movie below is a 19-channel BioTrace+ /NeXus-32 display of SMR activity © John S. Anderson. Brighter colors represent higher SMR amplitudes. Frequency histograms are displayed for each channel. Notice the runs of high-amplitude SMR activity.
The Meaning of the Sensorimotor Rhythm
SMR activity is associated with a state of relaxed wakefulness and motor inhibition.
The sensorimotor rhythm may signal an internal focus (Demos, 2019). It is believed to reflect the brain's ability to maintain a calm, focused state without engaging in motor activity. SMR is often considered a marker of optimal sensorimotor integration linked to several cognitive and motor functions.
SMR is related to the suppression of motor activity, indicating a state where the brain is inhibiting unnecessary movements. This is important for stillness and precision tasks (Sterman, 1996). Increased SMR activity is associated with improved motor performance and reduced motor activity (Sazgar & Young, 2019; see also Corsi-Cabrera et al., 2001, a principal-components study of EEG bands across sleep-wake states in the rat).
Increased SMR activity is associated with improved attention and focus, as it reflects a state where the brain is not distracted by extraneous motor activity and instead concentrates on sensory input and cognitive tasks (Egner & Gruzelier, 2001).
Psychological and Medical Disorders
Attention-Deficit Hyperactivity Disorder (ADHD)
Individuals with ADHD often exhibit reduced SMR activity. Neurofeedback training to increase SMR can improve attention and behavioral control (Lubar, 1991). Based on six RCTs, Stefanie Enriquez-Geppert and colleagues (2023) rated neurofeedback for ADHD as efficacious and specific in Evidence-Based Practice in Biofeedback and Neurofeedback(4th ed.).
Generalized Seizures
Abnormal SMR activity can be indicative of dysfunctional thalamocortical circuits, which are often implicated in the generation of epileptic seizures. Modulating SMR activity through neurofeedback or other interventions has been explored as a potential therapeutic approach for reducing seizure frequency and severity (Moffett et al., 2017).
Frey (2023) rated SMR-based and slow cortical potential (SCP)-based neurofeedback as efficacious for seizures, SMR-based NFB as probably efficacious for non-seizure manifestations of epilepsy, and connectivity-based NFB as not empirically supported for seizures.
Tan et al. (2009) meta-analyzed EEG biofeedback for epilepsy and found SMR- and SCP-based treatments associated with fewer seizures. A later meta-analysis of 15 trials (Soroush-Vala et al., 2023) also reported benefit, but its pooled outcome was built from cognitive and attention instruments rather than seizure frequency, so it should not be read as independent evidence of seizure reduction. In an exploratory sham-controlled RCT of 44 children with controlled focal epilepsy, SMR neurofeedback improved cognition (reaction time), while quality of life improved in all three arms including sham — which the authors attribute to a placebo effect — and no seizure benefit was demonstrated (Morales-Quezada et al., 2019).
Anxiety and Depression
SMR neurofeedback has also been explored as a treatment for anxiety and depression, on the rationale that increasing SMR promotes a state of calm and reduces hyperarousal. Note that Hammond (2005) reviews neurofeedback for depression and anxiety broadly, with the depression protocols centered on frontal alpha asymmetry rather than SMR, so it should not be read as direct evidence for SMR in these conditions.
Sleep
During sleep, particularly in non-rapid eye movement (NREM) sleep, SMR activity is less prominent than during wakefulness. However, the broader beta band, which includes SMR frequencies, shows distinct patterns across different sleep stages. For instance, beta activity is generally reduced during NREM sleep but can show transient increases during sleep spindles, which are bursts of oscillatory brain activity during stage 2 NREM sleep (Krystal et al., 2002; Merica & Fortune, 2005).
SMR activity plays a role in sleep regulation and quality. Higher levels of SMR activity are associated with better sleep onset and maintenance. Individuals with higher SMR activity tend to fall asleep more easily and have more stable sleep patterns (Hoedlmoser et al., 2008). SMR neurofeedback training has been shown to improve sleep quality by increasing SMR activity, leading to deeper and more restorative sleep (Cortoos et al., 2010).
Performance
Enhancing SMR activity through neurofeedback training has been shown to improve cognitive performance, including memory, attention, and executive function. This is likely due to the increased focus and reduced distractibility associated with higher SMR levels (Vernon et al., 2003).
Increased SMR activity is associated with improved motor performance, particularly in tasks requiring fine motor control and precision. This is because SMR reflects a state of motor inhibition, allowing for more controlled and deliberate movements (Gruzelier et al., 2010).
The Sensorimotor Rhythm and Sleep Spindles
Sleep spindles and sensory-motor rhythm (SMR) share several characteristics and underlying mechanisms, highlighting their interconnected roles in brain function, particularly in relation to sleep. The sleep spindle graphic © eegatlas-online.com.
We adapted this graphic from © eegatlas-online.com. This is a teaching-style EEG in the longitudinal montage, and the header tells you the state up front: this is a page of Stage 2 sleep, laid out to introduce the handful of signature waveforms that define it. The chains run in the usual way with an EKG in orange along the bottom and a 100 microvolt, 1-second marker for scale, but the real content is the set of labeled boxes scattered across the page, each one framing and naming a different hallmark of light sleep.
The beginner's temptation is to read the page as one continuous rhythm and try to grade the background. The move that unlocks it is to treat the page as a labeled catalog, letting each box teach you one distinct graphoelement by its shape and its location, then recognizing that the whole collection is what stamps the record as Stage 2 sleep.
Start at the lower left, where the box marks POSTS, the positive occipital sharp transients of sleep. Down in the occipital rows (T6-O2 and its neighbors) you see a little run of crisp, sharp, repeating transients riding in the back of the head, checkmark-like deflections that cluster during drowsy sleep. Move to the center of the page and the tall vertical box labels the vertex wave: a single sharp, pointed deflection that is biggest right over the top of the head in the central and midline channels (the Fz-Cz and Cz-Pz region), a lone spike of sleep. Just to its right, the sleep-spindle box catches a brief, beautiful burst of fast rhythmic activity that waxes and wanes like a spindle of thread, again maximal over the central regions.
Then the largest box on the right frames the K complex: a big, slow, biphasic wave with a sharp component and a broad following swing, dominant over the front-central head and towering above everything around it. Together these are the classic furniture of light sleep, each with its own shape and its own preferred spot on the scalp.
The orange EKG ticking steadily along the bottom rounds things out, giving a heartbeat reference so the sleep transients above stay cleanly separated from the pulse.
Put it together and what this display shows is a guided tour of Stage 2 sleep through its defining waveforms: occipital POSTS in the back, a central vertex wave, a central sleep spindle, and a frontocentral K complex, each boxed and named. The insight comes from reading the page as a labeled field guide, learning each transient by its form and location, and recognizing that the presence of this particular cast of characters together is exactly what identifies the tracing as light, Stage 2 sleep.
Similarities and Overlapping Features
Both SMR and sleep spindles operate within overlapping frequency ranges. SMR typically ranges from 12 to 15 Hz, while sleep spindles are generally observed in the 12 to 16 Hz range. This overlap suggests a possible functional and mechanistic connection between the two types of brain activity (De Gennaro & Ferrara, 2003; Sterman, 1996).
Thalamocortical circuits generate both SMR and sleep spindles. The thalamus, particularly the thalamic reticular nucleus, is crucial in generating sleep spindles by interacting with the cortex to produce rhythmic bursts of activity. Similarly, the thalamocortical loops involved in SMR generation facilitate synchronized oscillations in the sensorimotor cortex (Steriade, McCormick, & Sejnowski, 1993; Lopes da Silva, 1991).
SMR is associated with relaxed wakefulness and motor inhibition, which can facilitate the transition to sleep. Sleep spindles occur during stage 2 of non-REM sleep and are associated with maintaining sleep, particularly by protecting the sleeper from external stimuli and aiding sleep consolidation (De Gennaro & Ferrara, 2003; Hammond, 2005).
Functional Roles
Sleep spindles play a critical role in maintaining sleep stability by reducing the brain’s responsiveness to external stimuli. SMR, by promoting a calm and relaxed state, may facilitate the onset of sleep and enhance the stability of the sleep cycle, thereby supporting the generation of sleep spindles (Hoedlmoser et al., 2008).
SMR and sleep spindles are implicated in memory consolidation processes. Sleep spindles are known to be involved in consolidating declarative and procedural memories during sleep. SMR, by supporting focused attention and cognitive control during wakefulness, may indirectly enhance memory processes by optimizing brain function before sleep (Marshall & Born, 2007; Vernon et al., 2003).
Neurofeedback training targeting SMR has been shown to improve sleep quality and cognitive performance. Similarly, interventions aimed at enhancing sleep spindle activity have been explored for their potential to improve memory and cognitive function. The shared thalamocortical mechanisms suggest that training in one of these rhythms could potentially influence the other, offering combined benefits for sleep and cognitive health (Cortoos et al., 2010; Hoedlmoser et al., 2008).
Summary
SMR EEG activity, occurring in the frequency range of 12 to 15 Hz, is primarily generated by neurons in the sensorimotor cortex, particularly those involved in motor control and sensory processing. Thalamic ventrobasal relay cells and reentrant thalamocortical loops are crucial in generating SMR. The thalamus sends sensory information to the cortex, which processes it and sends it back to the thalamus, creating rhythmic oscillations. The synchronized activity of neurons in the primary motor cortex (M1) and primary somatosensory cortex (S1) results in the rhythmic patterns observed in SMR.
SMR activity is associated with relaxed wakefulness and motor inhibition, reflecting the brain's ability to maintain a calm, focused state without engaging in motor activity. It is considered a marker of optimal sensorimotor integration linked to several cognitive and motor functions, such as improved attention, focus, and motor performance.
In psychological and medical disorders, SMR activity is often reduced in individuals with ADHD, but neurofeedback training can improve attention and behavioral control. Abnormal SMR activity is also implicated in generalized seizures, anxiety, and depression, with neurofeedback training showing potential therapeutic benefits.
SMR plays a role in sleep regulation and quality. Higher SMR levels are associated with better sleep onset and maintenance, and SMR neurofeedback training has been shown to improve sleep quality, leading to deeper and more restorative sleep.
Enhancing SMR activity through neurofeedback training improves cognitive performance, including memory, attention, and executive function, as well as motor performance, particularly in tasks requiring fine motor control and precision.
SMR and sleep spindles share several characteristics and underlying mechanisms, particularly their generation by thalamocortical circuits. Both play critical roles in maintaining sleep stability and are involved in memory consolidation processes. Neurofeedback training targeting SMR can improve sleep quality and cognitive performance, and interventions to enhance sleep spindle activity show similar benefits.
BETA (over 12 HZ)
The beta rhythm exceeds 12 Hz with 2-20 microvolts asynchronous waves. Asynchronous means the neurons depolarize and hyperpolarize independently.
The beta rhythm in EEG is typically defined within the frequency range of 13-30 Hz. However, some sources may use slightly different ranges. The variation in definitions can be attributed to differences in historical research, regional practices, and specific research contexts (Jadeja, 2021).
The beta rhythm is distributed across the scalp, with the highest amplitude in the frontal and precentral areas.
Beta Rhythm Generators
Whereas the sensorimotor cortex generates the sensorimotor rhythm, beta is generated cortically, with brainstem ascending arousal systems modulating the cortical state in which it appears. Ascending sensory traffic from the brainstem can override thalamic pacemakers (Andreassi, 2000), and specific cortical regions can produce localized beta activity beneath active electrodes (Thompson & Thompson, 2015). Reticular activating system graphic redrawn by minaanandag.
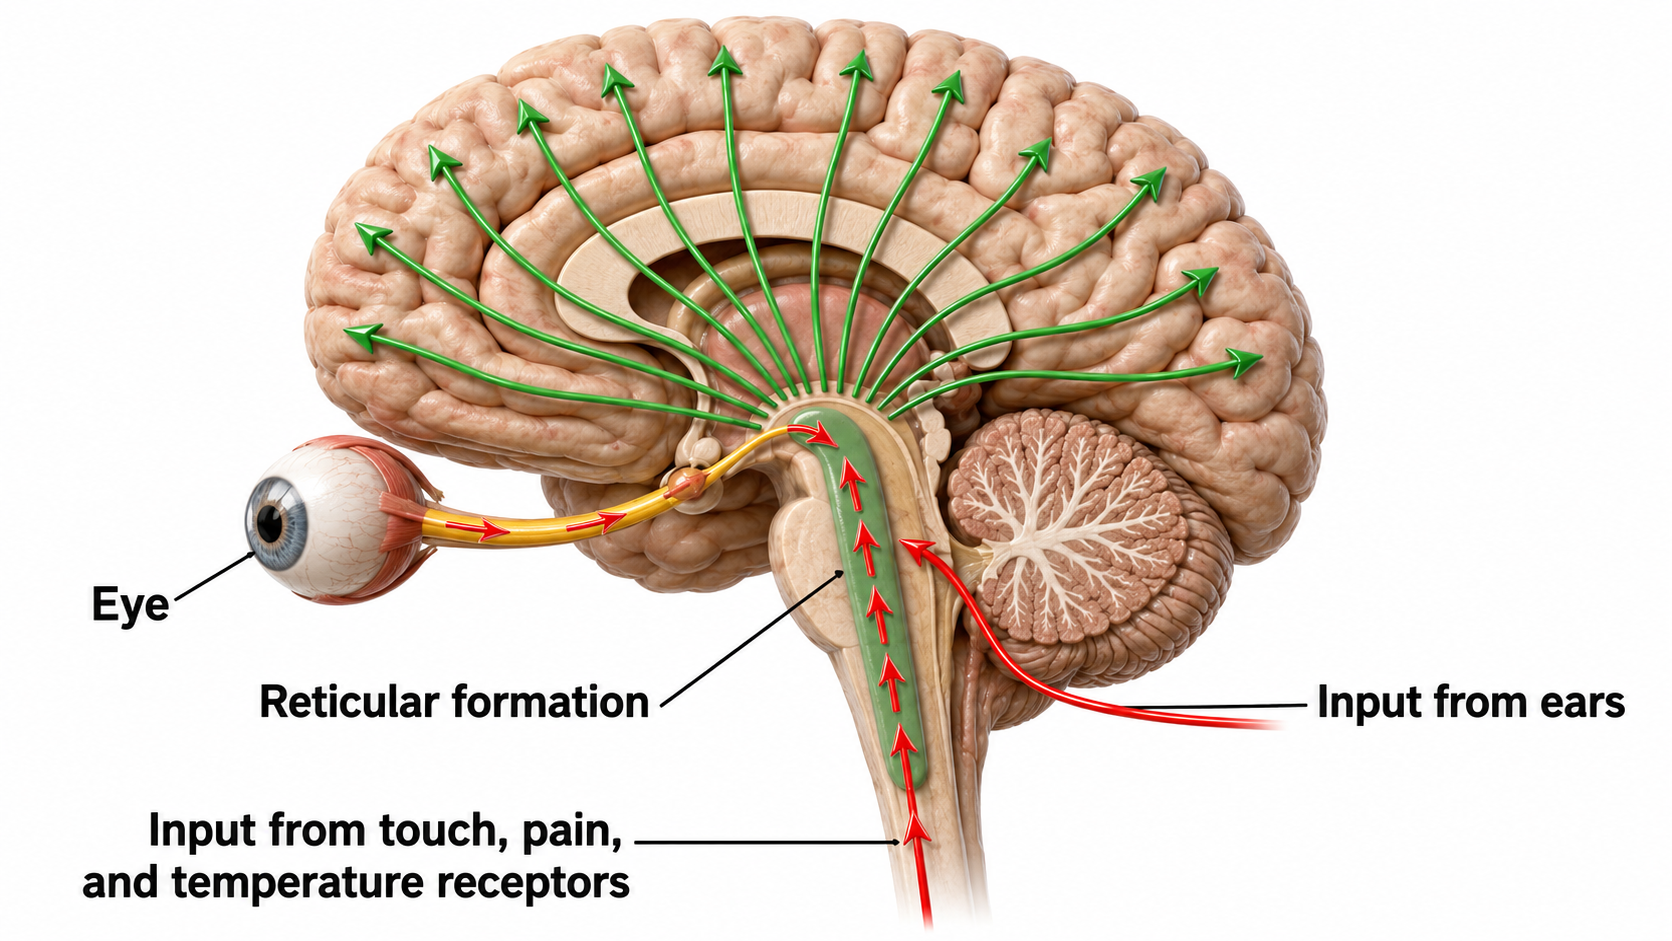
Kane and colleagues (2017) offered the following revised definition:
Any EEG rhythm between 14 and 30 Hz (wave duration 33–72 ms). Most characteristically recorded over the fronto-central regions of the head during wakefulness. Amplitude of fronto-central beta rhythm varies but is mostly below 30 µV. Blocking or attenuation of the beta rhythm by contralateral movement or tactile stimulation is especially obvious in electrocorticograms. Other beta rhythms are most prominent in other locations or are diffuse, and may be drug-induced (for example alcohol, barbiturates, benzodiazepines and intravenous anaesthetic agents).
Beta is also associated with the negative shift of the DC gradient (Speckmann et al., 2011). As the discussion of slow cortical potentials explained, this negative shift reflects increased cortical excitability. The DC gradient, only measurable by a DC-coupled EEG amplifier, measures the overall electrical gradient of cortical areas under the recording sensors. This gradient oscillates slowly, usually in the 0.1-0.2 Hz range, corresponding to a period of roughly 5 to 10 seconds. A shift of the gradient from its current state, becoming more electrically positive or negative, occurs every 5-10 seconds and sometimes quite a bit less often.
Buzsáki (2006) states that there is a progression of frequencies whose bandwidths overlap and interact with each other, from frequencies that take 15-40 seconds to complete each cycle up to those that oscillate at 200-600 cycles per second. Jay Gunkelman has called beta and gamma activity “emergent properties of bound networks” (J. Gunkelman, personal communication, 2005). This means that, as slower frequencies of EEG synchronize across networks, beta and gamma emerge in bursts of activity in coordination with that synchrony.
Beta activity is associated with "work" and reflects the ongoing excitatory/inhibitory cycles occurring on multiple time scales. While the work/rest cycle mentioned in relation to the alpha response and alpha blocking is one type of excitatory/inhibitory cycle on a broader scale, beta activity reflects actions that occur millisecond by millisecond and appear to be more locally generated.
Below is an example of eyes-open beta activity.
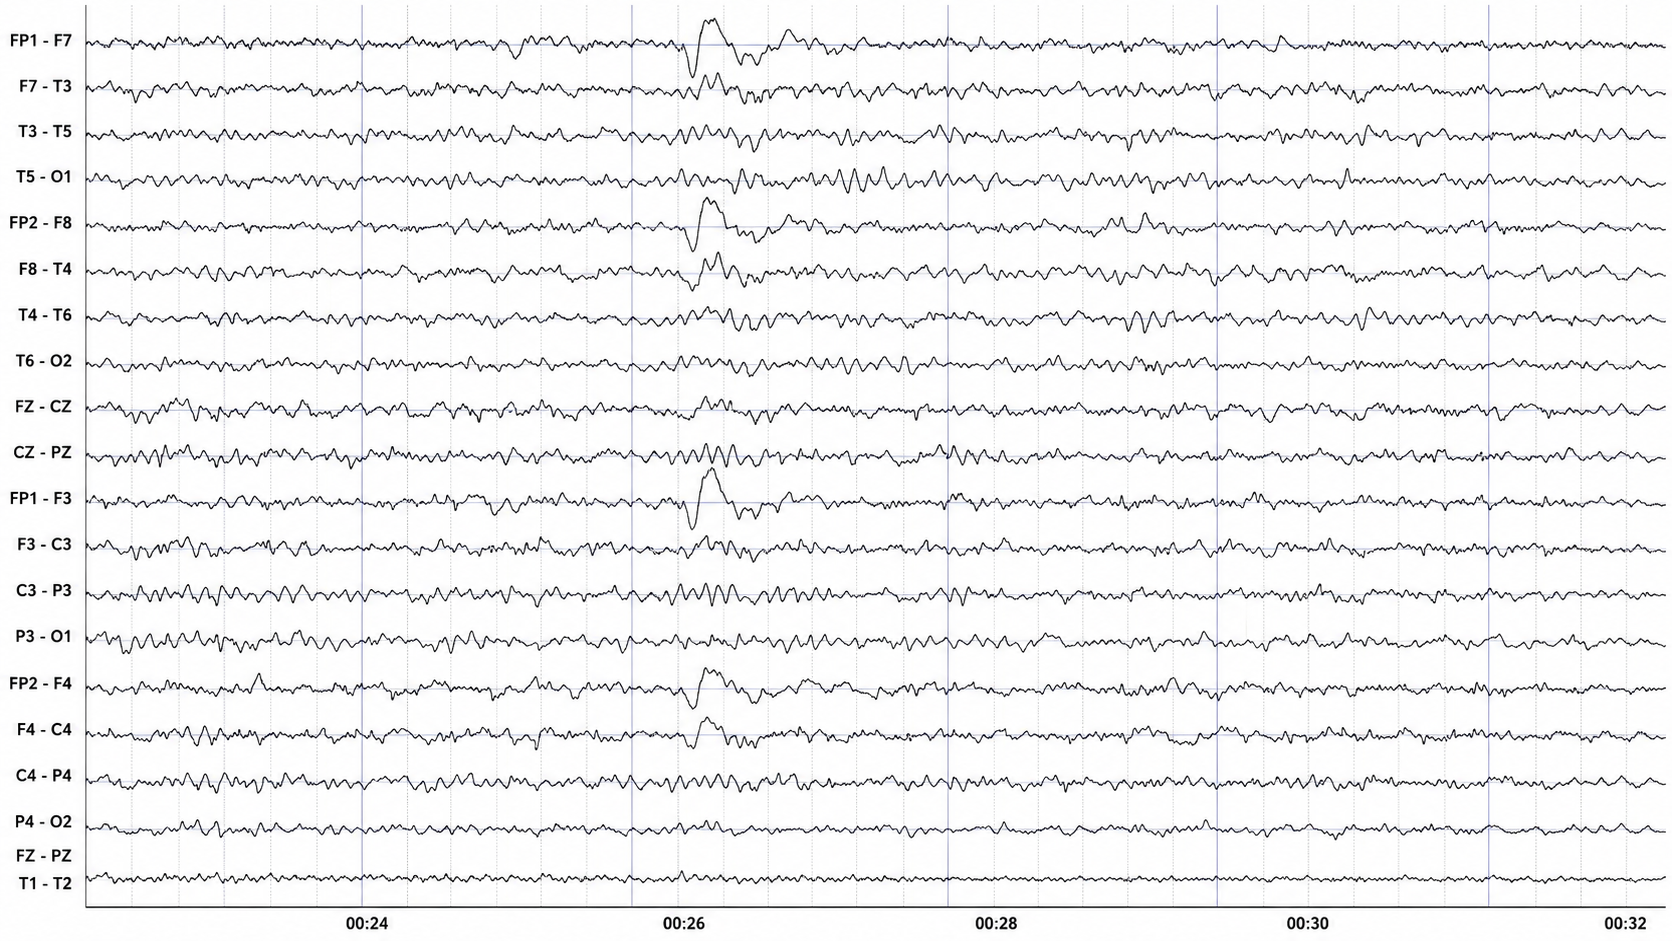
This is a 19-channel EEG recording in the eyes-open condition. This is a longitudinal bipolar montage, and the scale is 50 μV. Observe the alpha activity continuing at a much lower voltage in parietal and occipital derivations, compared to the previous eyes-closed examples, resulting from the attenuation of alpha with the opening of the eyes. There is beta activity in the 20-30 Hz range at less than 10 μV, seen mostly in frontal, central, parietal, and temporal derivations (comparisons between adjacent sensors) and somewhat slower 15-20 Hz patterns.
Kropotov (2016) describes the existence of several beta rhythms with different frequencies, various locations, and distinct functions. From this information, he states there is likely no single neuronal mechanism for generating localized beta activity. This fits the understanding that beta activity is associated with local tasks and, therefore, is mediated more by local mechanisms, with overall coordination from network systems and other rhythmic activity.
Beta is divided into narrower bands associated with cortical performance and subjective experience. These bands include low beta, high beta, and gamma. Demos (2019) advises that you should specify the actual range of interest.
Low Beta (16-20 Hz, also known as beta2)
The cortex produces low beta when we solve problems like multiplication. When a child correctly answers a math problem, the 17-Hz amplitude may increase while theta and 8-10 Hz alpha amplitude simultaneously decrease. Activity of this kind is less often seen above 20 Hz (Thompson & Thompson, 2015).
High Beta (20-35 Hz, also known as beta3 or fast beta)
High beta is correlated with multi-tasking and optimal performance and anxiety, migraine, obsessive-compulsive disorder (OCD), rumination, and worrying. While elevations may indicate a range of disorders, they may represent the brain's compensation for elevated theta. Clinicians rarely reinforce high beta. Instead, they may inhibit high beta and theta (Demos, 2019).
Beta Spindles
Beta spindles are trains of spindle-like waveforms, most often frontocentral. In the largest published sample their mean frequency was 20.6 Hz (SD = 4.1 Hz), spanning roughly 14-30 Hz. Beta spindles may signal ADHD, especially with tantrums, anxiety, autism spectrum disorders (ASD), epilepsy, and insomnia (Arns et al., 2015; Demos, 2019; Thompson & Thompson, 2015).
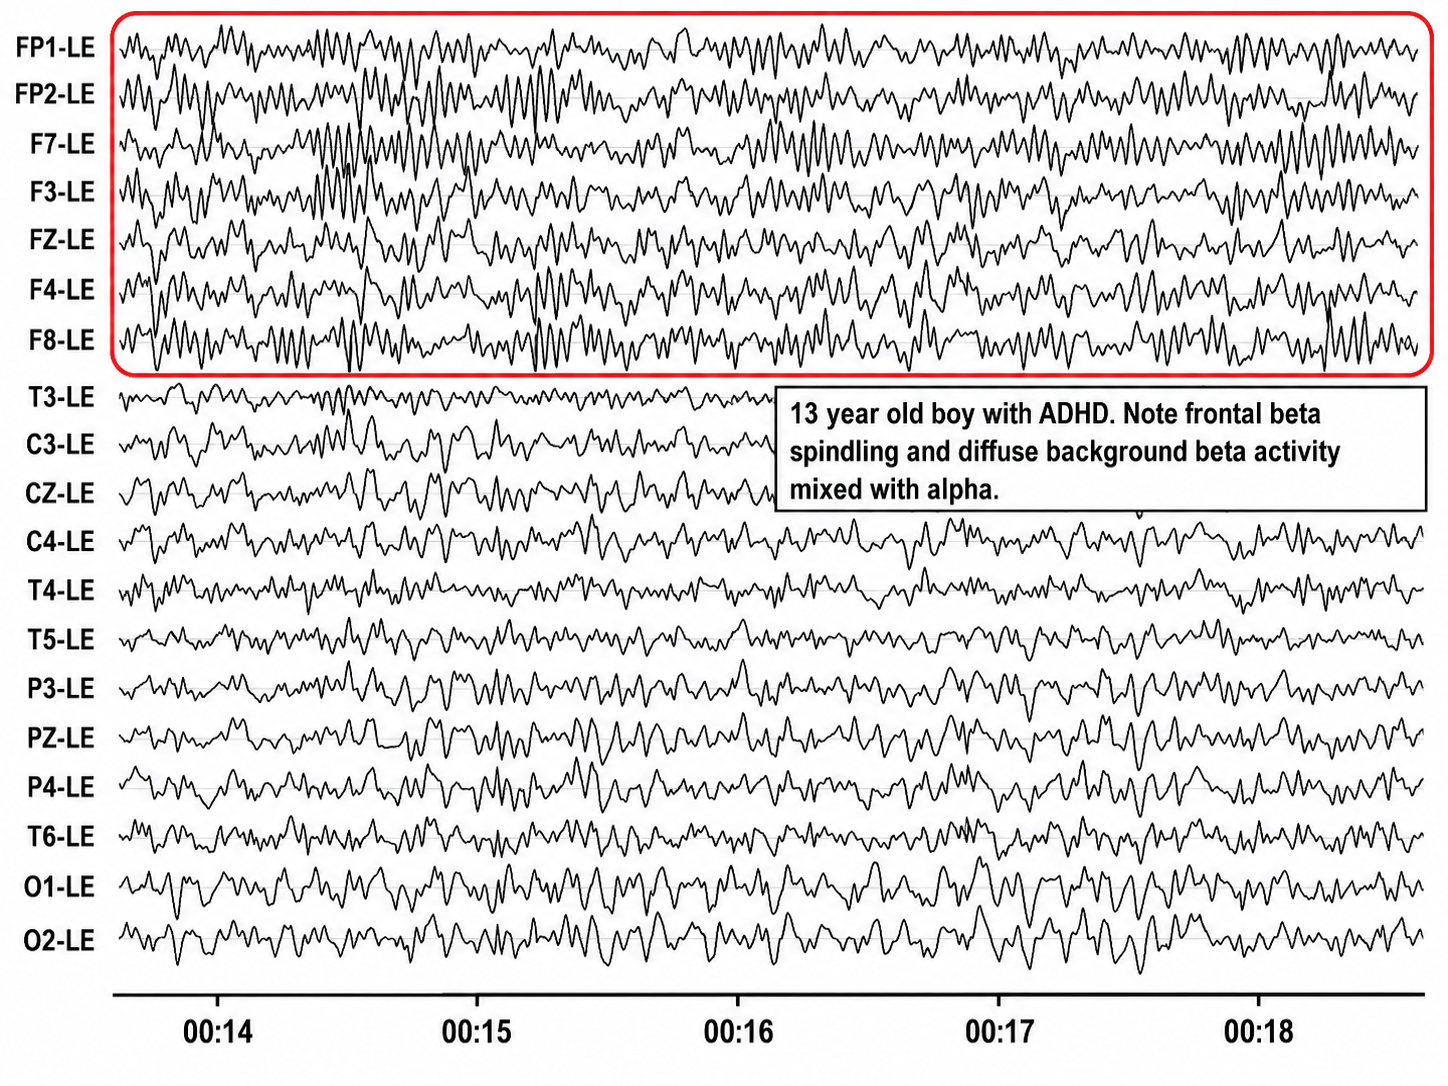
This is a referential EEG, every channel tied to a linked-ear reference (the LE label), laid out with the frontal electrodes grouped at the top inside a red box and the central, temporal, parietal, and occipital rows filling out the rest of the page, with a timeline ticking in seconds along the bottom. A note in the corner names the pattern and the patient. The whole page is dense and busy, but the busyness has a particular character, and reading that character is the task.
The beginner's temptation is to see a wall of tight squiggle and either dismiss it as noise or reach for something slow and dramatic. The move that unlocks the page is to attend to the speed of the waves, because the story here is written in fast rhythms, and then to let the red box tell you where those fast rhythms are most striking.
Start inside the box. Across the frontal channels (FP1, FP2, F7, F3, Fz, F4, F8) runs a prominent, fast, low-amplitude activity in the beta range, and it does not just hum steadily, it gathers into spindle-like bursts, brief runs of quick waves that swell and fade like little spindles of thread over the front of the head. That frontal beta spindling is the boxed headline, the fast rhythm at its most organized and most obvious.
Now read the rest of the head below the box and notice that the fast activity does not stay confined to the front. The central, temporal, parietal, and occipital rows carry their own diffuse beta, spread broadly across the scalp, and woven through it is a slower alpha rhythm, so the background reads as a blend of the two speeds layered together rather than either one alone.
Put it together and what this display shows is a referential recording dominated by fast activity: frontal beta spindling standing out in the boxed frontal channels, riding on top of a diffuse background of beta mixed with alpha spread across the whole head. The insight comes from reading for frequency first, catching the quick beta rhythm and its frontal spindle-like bursts, and then recognizing that the same fast activity, blended with slower alpha, fills the background everywhere, rather than searching the page for a slow wave that is not the point here.
19-21 Hz or 20-23 Hz
Clients diagnosed with anxiety disorder frequently show increased power in the 19-21 Hz or 20-23 Hz range compared with 16-18 Hz. Elevations in these ranges may be associated with emotional intensity. The Thompsons (2015) advise clinicians to use open-ended questions to question clients about their mental activity and emotional state when these bands are elevated without telegraphing their expectations.
24-36 Hz
Clients who are distressed, hypervigilant, and who overthink, worry, and ruminate may show marked elevations in this range. A peak in this range may be associated with family or personal substance use disorder and may indicate the instrumental use of drugs to control anxiety. High-amplitude beta in this range is not always a negative indicator since it is also observed when highly intelligent individuals multi-task (Thompson & Thompson, 2015).
The movie below is a 19-channel BioTrace+ /NeXus-32 display of low beta (13-21 Hz) and high beta (22-34 Hz) activity © John S. Anderson. Brighter colors represent higher beta amplitudes. Frequency histograms are displayed for each channel.
Beta Rhythm Abnormalities
High voltage or abundant beta activity is the most common fast activity abnormality in EEGs due to pharmacologic effects. Benzodiazepines (e.g., diazepam, lorazepam) and barbiturates (e.g., phenobarbital) often cause this increase, as they are used for seizure management. This drug-induced beta activity is usually diffuse or frontally predominant and can also appear transiently during drowsiness, subsiding with deeper sleep (Libenson, 2024).
When beta activity is typical for the client based on age, state (eyes-open, eyes-closed, under task, etc.), and location, it suggests those areas are functioning as expected. If beta activity is deficient, that may mean that the site is under-functioning or under-activated for some reason. Reasons may include damage of some sort, metabolic deficits, fatigue, or other factors. An area that is consistently over-functioning may, in time, because of overuse and fatigue, end up with a lower level of functioning and, hence, less beta activity.
Higher-than-typical beta amplitude at a given location may mean the area is over-functioning or overly activated. Whether the beta amplitude is higher or lower than average, the clinician will want to understand the underlying functional neuroanatomy of the area to aid in the assessment process. For example, suppose the right posterior temporal/parietal junction that roughly underlies the area between T4 and T6 (TP8 in the 10-10 system) shows excess beta amplitude. In that case, it may be associated with heightened sensitivity to or attention to non-verbal communication, such as tone of voice, facial expression, and body language associated with angry outbursts or that may signal danger. If this area is under-activated, it may represent a self-protective “disconnection” from these same signals (J. Gunkelman, personal communication, 2021).
Individuals who typically show excess beta activity at sleep onset and during sleep stages have a higher incidence of insomnia (Perlis et al., 2001). Meier and colleagues (2014) found a correlation between excess beta power in frontal, central, and temporal areas with delinquent behavior in adult men with concurrent ADHD symptomatology. In Rowan’s Primer of EEG (2nd ed.), Marcuse and colleagues (2016) identify excess interhemispheric beta asymmetry as an important diagnostic tool. The side with reduced relative beta power points to the pathological hemisphere. They identify brain abscesses, stroke, tumors, vascular malformations, and cortical dysplasia as associated with a focal decrease or enhancement of beta activity.
A reference to a normative database can be useful when assessing beta activity, particularly if a traumatic brain injury is suspected. Comparison with other EEG frequencies is also important, as an excess or lack of beta activity often accompanies differences from expected values for other frequencies.
Significant cerebral dysgenesis, like lissencephaly, can cause increased beta activity, typically accompanied by other EEG abnormalities and intellectual disability. In such cases, the beta activity is often slower. Increased beta activity can also appear in normal EEGs without explanation, potentially due to incomplete medication lists or residual drug effects.
Reductions in beta activity frequency (18-30 Hz) often indicate diffuse cortical injury, such as post-anoxic episodes, or the effects of sedative medications. Severe cortical injuries may show an absence of beta activity, though some patients naturally exhibit less beta activity as a normal variant. Low amplifier gains can obscure normal fast activity in EEG traces with high-voltage slow activity.
A true asymmetry in fast activity between brain regions is a significant abnormality, suggesting potential cortical damage. Fast waves are generated at the cortical level, reflecting the activity of circuits near the scalp surface rather than deeper or more medial regions of the brain. Asymmetry in fast activity often indicates cortical damage, with the area of lower voltage marking the abnormality, such as in the case of a cortical stroke where beta activity is reduced. Rarely, an abnormal cortical area may show increased fast activity.
Spindling Excessive Beta (SEB)
Spindling excessive beta (SEB) refers to a specific pattern observed in electroencephalogram (EEG) recordings characterized by fast beta activity with a spindle-like appearance and an anterior emphasis. In the largest published sample its mean frequency was 20.6 Hz (SD = 4.1 Hz), spanning roughly 14-30 Hz, and it was maximal frontally (Fz). SEB is distinguished from typical beta activity by its spindling morphology (Arns et al., 2015; Krepel et al., 2021).
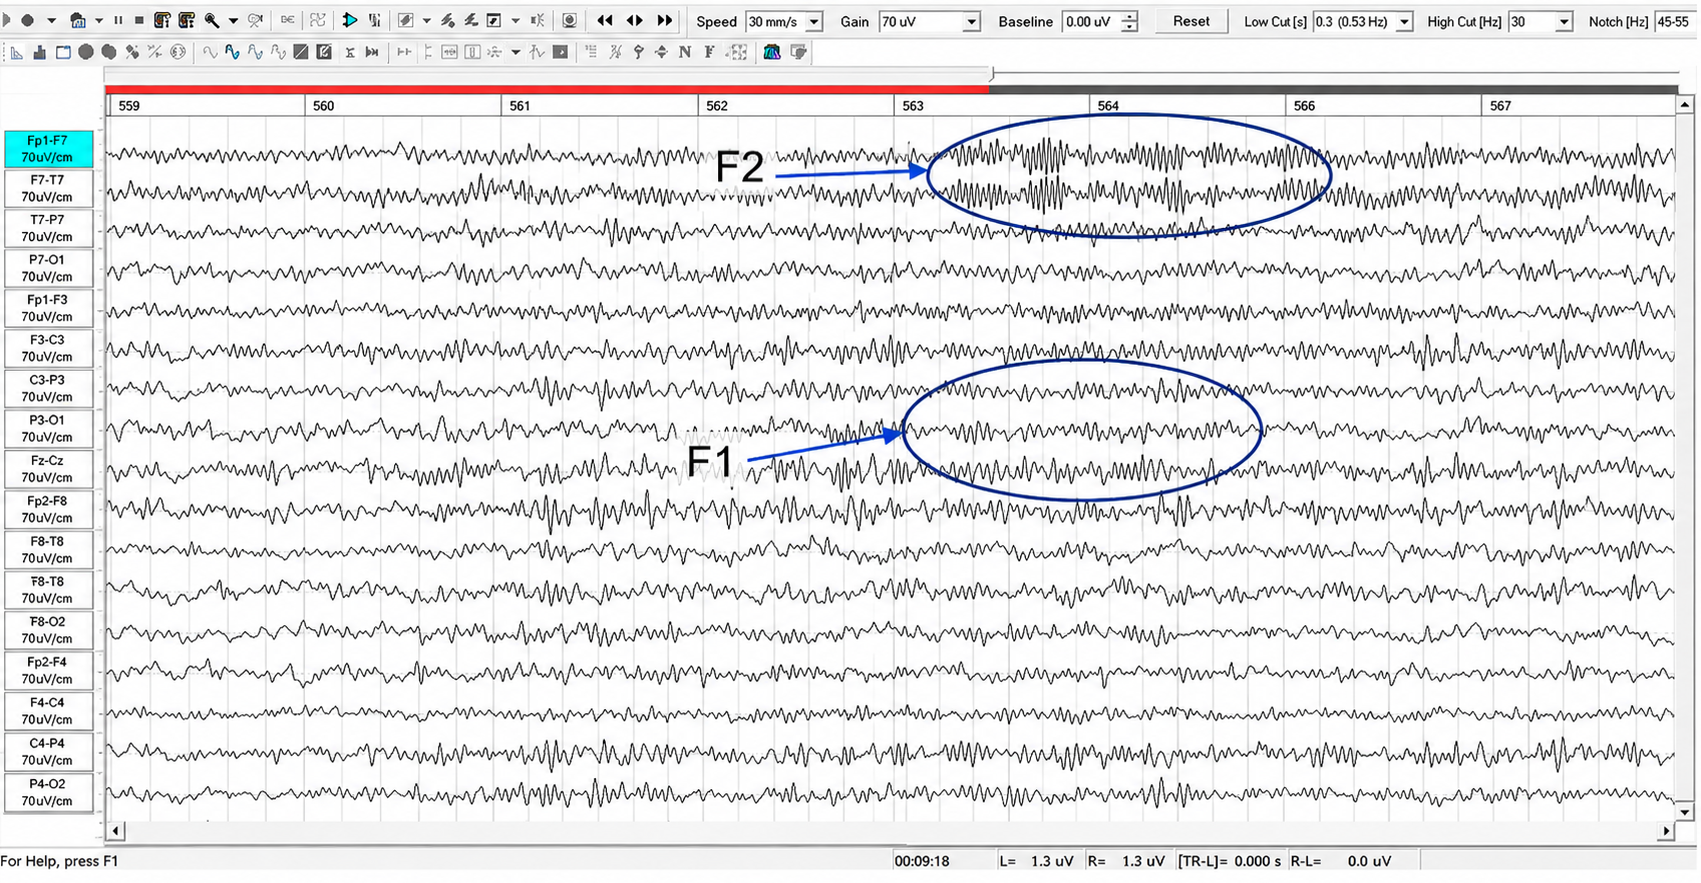
This is an EEG shown inside review software, its toolbar and settings framing the tracing: a display speed of 30 millimeters per second, a gain around 70 microvolts, standard filters, and a timeline running in seconds near the nine-minute mark. The montage stacks the familiar temporal and parasagittal chains down the left margin, each labeled with its own scale. The page is busy with a mixed, fast-textured background, and someone has drawn two blue ovals with arrows onto it, labeling them F2 up top and F1 lower down. Those two marks are the reading guide.
The beginner's mistake is to take in the dense, active background and let everything blur into one uniform mass of squiggle, missing the discrete events hiding inside it. The move that unlocks the page is to follow the arrows to the two ovals and then look closely at what makes the circled activity different from the busy tracing all around it.
Do that and the character of the marked events comes through. Inside each oval sits a burst of fast, rhythmic, spindle-like activity, a run of quick, regular waves that gathers, swells, and fades, standing out as more organized and more sharply rhythmic than the mixed background it rises from. The upper oval (F2) catches such a burst in the anterior, left-temporal region, while the lower oval (F1) catches a companion burst lower down over the left central-parietal chains, the two events labeled and framed as distinct, nameable fast-frequency runs.
Notice their timing too. Both circled bursts occur in the same slice of the window, roughly the same few seconds of the timeline, so the display is inviting you to see two separate fast rhythmic events captured together, one anterior and one more posterior, each earning its own label and arrow.
Put it together and what this display shows is a busy, mixed-frequency background out of which two discrete, spindle-like bursts of fast rhythmic activity are singled out and labeled, F2 over the anterior left-temporal region and F1 over the left central-parietal region, arising in the same time window and marked with ovals and arrows for the eye to find. The insight comes from letting the arrows pull you past the uniform busyness to the two organized fast runs, recognizing them by their waxing-and-waning, rhythmic quality as the events the display was built to highlight.
SEB appears to be a transdiagnostic EEG feature, meaning it is observed across various psychiatric disorders and is not limited to a single diagnosis (Arns et al., 2015; Krepel et al., 2021). SEB has been associated with a range of psychiatric and neurological conditions, making it a critical biomarker in clinical neurophysiology. Its clinical importance is primarily seen in sleep disorders, Attention-Deficit Hyperactivity Disorder, medication resistance, and epilepsy.
Sleep Disorders
SEB is often linked with sleep disturbances, particularly insomnia. Insomnia complaints are more prevalent in individuals with frontal SEB patterns (Arns et al., 2015). Studies indicate that individuals with SEB may experience difficulties in maintaining sleep, leading to chronic insomnia (Swatzyna et al., 2022). A replication study of 79 patients confirmed the association between SEB and impulse-control problems but did not replicate the sleep association (Krepel et al., 2021), so the sleep link should be treated as provisional. SEB may be a marker of hypoarousal or sub-vigil states.
Autism Spectrum Disorder (ASD)
In ASD, SEB can reflect dysregulation in the mirror neuron system that subsequently fails to modulate this bursting pattern.
Attention-Deficit/Hyperactivity Disorder (ADHD)
There is a notable association between SEB and ADHD. Patients exhibiting SEB often report symptoms of inattention, hyperactivity, and impulsivity. Children with excess beta activity in their EEGs are a small subset of ADHD children, similar to other ADHD children but more prone to temper tantrums and moodiness (Clarke et al., 2001). This association suggests that SEB can be used as an objective marker for ADHD diagnosis and management (Swatzyna et al., 2022).
Medication Resistance
SEB is frequently observed in patients who have failed multiple medication trials for various psychiatric conditions. This resistance to medication highlights the need for alternative therapeutic approaches for individuals exhibiting SEB (Swatzyna et al., 2022).
Epilepsy
Beta spindles can co-occur with seizure disorders, although patients with a history of seizures were excluded from some SEB studies to isolate its effects in other conditions. The presence of SEB in epilepsy patients can complicate the clinical picture, necessitating careful EEG interpretation (Swatzyna et al., 2022).
Mechanisms and Hypotheses
SEB might reflect a sub-vigil state, which is an intermediate state between wakefulness and sleep. This state can lead to cognitive impairments and behavioral disturbances observed in conditions like ADHD and insomnia (Swatzyna et al., 2022). Benzodiazepines and other substances affecting GABAergic transmission can induce SEB, suggesting a neurochemical basis for its occurrence. This insight provides avenues for pharmacological interventions targeting the GABA system (Swatzyna et al., 2022).
Treatment Implications
Recognizing SEB in patients can influence treatment strategies. For instance, behavioral interventions targeting sleep hygiene may benefit those with SEB-related insomnia. Similarly, neurofeedback and other non-pharmacological treatments might offer alternative approaches for ADHD patients exhibiting SEB, especially those resistant to conventional medications (Swatzyna et al., 2022).
Conclusion
SEB is a distinctive EEG pattern with significant clinical implications across various psychiatric and neurological disorders. Its presence can aid in the diagnosis, understanding, and treatment of conditions such as insomnia, ADHD, and medication-resistant psychiatric disorders. Continued research into SEB will further elucidate its mechanisms and optimize therapeutic strategies.
Summary
The beta rhythm, typically defined within the 13-30 Hz range, is characterized by asynchronous waves with amplitudes between 2-20 microvolts. Asynchronous in this context means that neurons depolarize and hyperpolarize independently. The brainstem and cortex generate the beta rhythm, with the highest amplitude in the frontal and precentral areas. Beta activity reflects ongoing excitatory and inhibitory cycles, correlates with tasks and states such as attention, problem-solving, and anxiety, and is sensitive to pharmacological influences. Beta abnormalities can indicate various clinical conditions, including insomnia, ADHD, and epilepsy.
Spindling Excessive Beta (SEB) is a distinct EEG pattern of fast beta activity with a spindle-like appearance and an anterior emphasis, with a reported mean frequency of 20.6 Hz (SD = 4.1 Hz) spanning roughly 14-30 Hz. SEB is a transdiagnostic feature associated with psychiatric and neurological conditions such as insomnia, ADHD, medication resistance, and epilepsy. SEB is thought to reflect sub-vigil states, which are intermediate between wakefulness and sleep, potentially leading to cognitive impairments and behavioral disturbances. Recognizing SEB can influence treatment strategies, including behavioral interventions for sleep and neurofeedback for ADHD. Continued research is essential to further elucidate the mechanisms and therapeutic approaches for SEB.
GAMMA (30-100 Hz)
Gamma ranges from 30-100 Hz and includes the Sheer rhythm, which extends from 38-42 Hz (Buzsáki & Wang, 2012; Fries, 2015; Jensen et al., 2007). The difference in reported gamma frequency bands may reflect methodological differences and biological variability.

Methodological Differences
Different EEG systems and setups can have varying sensitivities and resolutions, affecting the frequency range they can accurately capture. High-density EEG systems may detect higher frequencies more reliably than standard setups (Hari & Puce, 2017; Nunez & Srinivasan, 2006).
Data processing variations, such as filters, window lengths, and analytical algorithms, can influence the detection and categorization of gamma frequencies. High-frequency oscillations can be more susceptible to noise and artifacts, such as muscle activity (EMG) or electrical interference. Different studies may apply varying degrees of filtering and artifact rejection, affecting the upper limit of detectable gamma frequencies (Niedermeyer & da Silva, 2004).
For these reasons, different studies might use different criteria for identifying gamma oscillations.
Biological Variability
Due to genetic, developmental, and health-related factors, the EEG patterns of different individuals can be significantly variable. This can lead to different observed upper limits for gamma oscillations (Başar, 2013; Uhlhaas & Singer, 2010).
The cognitive or sensory task during EEG recording can affect the frequency and power of gamma oscillations. Different tasks may induce gamma activity in different frequency ranges.
Gamma oscillations can vary across different regions of the brain. For instance, the gamma frequency range observed in the visual cortex during visual processing tasks may differ from that observed in the hippocampus during memory tasks.
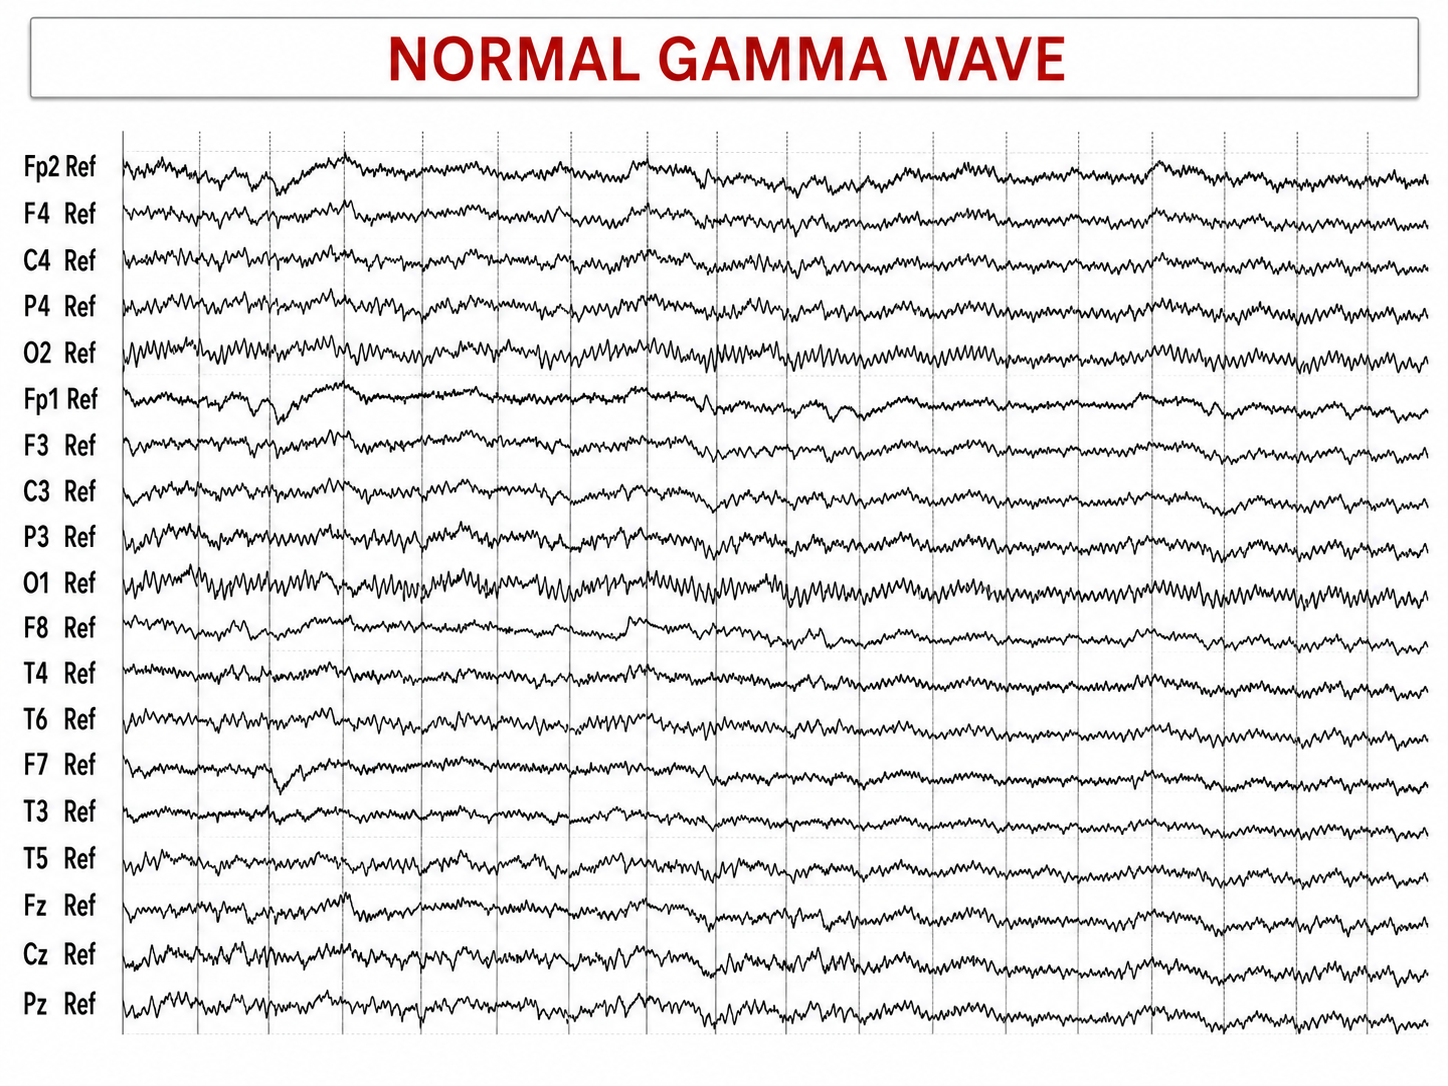
This is a referential EEG, every channel tied to a common reference (the "Ref" label), with the electrodes stepping through the frontal, central, parietal, occipital, and temporal positions down the page and finishing on the midline trio. The title up top names the pattern outright, and the whole page carries a single, consistent texture: fine, quick, tightly-packed ripple running edge to edge in every row. That uniform fast texture is the thing to register first.
The beginner's temptation is to glance at the fine fuzz filling every line and wave it off as meaningless noise or muscle crackle. The move that unlocks the page is to attend to the frequency of the oscillation, because the story here is speed, and to notice that this quick ripple behaves like an organized rhythm woven through the whole recording rather than random static.
Look closely and the character comes through. The waves are very fast and very fine, oscillating quickly with small amplitude, the quickest rhythm the brain produces. This is gamma-band activity, the high-frequency end of the spectrum, and it appears as a delicate, rapid shimmer riding along each channel, distinct from the taller, slower waves that dominate most other recordings.
Now take in its distribution. Read up and down the montage and the fast rhythm is spread broadly and fairly evenly across the head, present in the frontal, central, parietal, occipital, temporal, and midline rows alike, without piling up in one corner or favoring one side. It is a diffuse, whole-head phenomenon, low in voltage and uniform in its quick pace throughout.
Put it together and what this display shows is a referential recording dominated by continuous, very fast, fine, low-amplitude gamma activity spread uniformly across the entire scalp, the quickest of the brain's rhythms shimmering through every channel. The insight comes from reading for frequency first, recognizing the rapid, small ripple as an organized gamma rhythm rather than incidental fuzz, and appreciating that its defining feature is the sheer speed of the oscillation carried evenly across the whole head.
The overlap between gamma (30-100 Hz) and surface EMG (SEMG) (13-200 Hz) requires that clinicians examine the raw EEG to ensure that training does not reward muscle contraction. The movie below is a 19-channel BioTrace+ /NeXus-32 display of gamma activity © John S. Anderson. . Brighter colors represent higher gamma amplitudes. Frequency histograms are displayed for each channel. Notice that the mean frequency falls between 38 and 39 Hz.
This section delves into the generators of gamma activity, its meaning in the context of brain function, and recent findings in the field. Research has linked gamma activity to cortical activation, cognitive processes, attention, emotion, and motor functions, with implications for conditions like ADHD, generalized anxiety disorder (GAD), and epilepsy.
Gamma Rhythm Generators
Gamma oscillations are primarily generated by the synchronized activity of excitatory and inhibitory neurons in the brain, particularly within the cortical regions. The interplay between pyramidal neurons and interneurons, especially those expressing parvalbumin, is crucial for generating these high-frequency oscillations. These interneurons provide rhythmic inhibitory input to pyramidal cells, creating a network capable of producing gamma waves (Buzsáki & Wang, 2012).
Thalamocortical interactions also play a role in gamma generation. The thalamus, acting as a relay station for sensory information, can influence cortical gamma activity through its connections with the cortex. This interaction is particularly evident in sensory processing areas, where gamma oscillations are modulated by sensory input (Fries, 2015).
Furthermore, gamma activity is not uniformly distributed across the brain. Still, it is particularly prominent in regions involved in higher-order cognitive functions, such as the prefrontal cortex, hippocampus, and visual cortex. These areas utilize gamma oscillations for attention, memory encoding, and sensory perception (Bosman et al., 2014).
The Meaning of Gamma EEG Activity
Gamma oscillations have been implicated in various cognitive, perceptual, and motor functions, emotions, epilepsy, schizophrenia, Alzheimer's disease, and ADHD.
Binding Sensory Information
One of the primary roles of gamma activity is in binding sensory information. This concept, known as the binding problem, refers to how the brain integrates information from different sensory modalities to create a coherent perceptual experience. Gamma synchrony is thought to facilitate this process by providing a temporal framework that binds disparate neural signals (Singer, 2013).
The synchronization that supports this binding is neuronal in origin, produced by the reciprocal interaction of pyramidal cells and fast-spiking, parvalbumin-expressing interneurons within and across cortical networks (Buzsáki & Wang, 2012). Astrocytes are coupled to one another by gap junctions and can modulate the amplitude and coherence of gamma through gliotransmitter release (Lee et al., 2014), but astrocytic calcium signaling unfolds over hundreds of milliseconds to seconds — far too slowly to synchronize neurons on the 12- to 50-ms timescale of a gamma cycle — and astrocytic gap junctions couple astrocytes to other astrocytes rather than to neurons.
Attention
In the context of attention, gamma oscillations have been shown to enhance the processing of relevant stimuli while suppressing irrelevant information. This selective attention mechanism is believed to be mediated by synchronizing gamma activity between different brain regions, thereby enhancing communication and processing efficiency (Jensen et al., 2007). Enhanced gamma activity is associated with better performance on cognitive tasks (Hasib & Vengadasalam, 2023).
Working and Long-Term Memory
Gamma activity is crucial for working memory and long-term memory encoding. Studies have demonstrated that gamma oscillations in the hippocampus and prefrontal cortex are involved in maintaining and manipulating information in working memory and encoding and retrieving long-term memories (Colgin, 2016).
Motor Performance
Gamma event-related synchronization (ERS) is linked to motor performance, with distinct low (35-50 Hz) and high (75-100 Hz) gamma bands showing different temporal and spatial characteristics during motor tasks (Amo et al., 2016, 2017; Crone et al., 1998). Enhanced gamma activity is observed during voluntary movements (Amo et al., 2016).
The Sheer rhythm is also associated with peak performance (Spydell, Ford, & Sheer, 1979). For example, 40-Hz activity is generated when athletes correct their balance after leaning forward on a balance board. Athletes who have sustained a concussion and suffer impaired balance do not increase 40-Hz power (Demos, 2019; Thompson & Thompson, 2015).
Emotions
Gamma fluctuations are associated with emotional experiences, with higher gamma activity linked to difficult emotions during worry inductions in GAD patients (Oathes, 2008).
Epilepsy
Increased gamma activity is noted in patients with primary generalized epilepsy, potentially serving as a marker for underlying dysfunctions and a prerequisite for seizures (Willoughby et al., 2003).
Schizophrenia
In schizophrenia, for example, deficits in gamma oscillations are thought to contribute to the cognitive impairments and sensory processing anomalies observed in patients (Uhlhaas & Singer, 2010).
Alzheimer's Disease
Recent studies have suggested that gamma oscillations might play a role in clearing amyloid-beta plaques, a hallmark of the disease. Optogenetic stimulation of gamma oscillations in mouse models has reduced amyloid-beta levels, pointing to potential therapeutic avenues (Iaccarino et al., 2016).
ADHD
Reduced gamma activity is observed in adults with ADHD, particularly in the right centroparietal region, correlating with symptom severity and suggesting altered network function (Tombor et al., 2019).
Recent Findings
Advancements in neuroimaging and electrophysiological techniques have allowed for more precise mapping of gamma activity and its sources. Magnetoencephalography (MEG) and high-density EEG have provided more detailed spatial and temporal resolution, enhancing our understanding of gamma oscillations in health and disease (Hari & Puce, 2017).
Conclusion
Gamma oscillations in EEG, ranging from 30-100 Hz, are critical for numerous brain functions, including cognitive processes, attention, memory, motor functions, and emotional experiences. This range includes the Sheer rhythm (38-42 Hz). Variations in reported gamma frequency bands stem from differences in EEG methodologies, such as system sensitivity and data processing techniques, and biological variability among individuals. High-density EEG systems can capture higher frequencies more reliably than standard setups. Gamma oscillations are generated by the synchronized activity of excitatory and inhibitory neurons, particularly in cortical regions, and their interplay is essential for producing these high-frequency waves.
Gamma oscillations play a vital role in binding sensory information, a process known as the binding problem, which integrates information from different sensory modalities to create a coherent perceptual experience. In the context of attention, gamma oscillations enhance the processing of relevant stimuli while suppressing irrelevant information, thereby improving cognitive task performance. Gamma activity is crucial for both working memory and long-term memory encoding, particularly in the hippocampus and prefrontal cortex.
Motor performance is also linked to gamma oscillations, with distinct low (35-50 Hz) and high (75-100 Hz) gamma bands showing different characteristics during motor tasks. The Sheer rhythm is associated with peak performance, such as athletes correcting their balance, where increased 40-Hz activity is observed. Emotional experiences are also linked to gamma fluctuations, with higher gamma activity correlating with difficult emotions in conditions like generalized anxiety disorder (GAD).
Gamma oscillations are implicated in several neurological and psychiatric conditions. In epilepsy, increased gamma activity is observed and may serve as a marker for underlying dysfunctions. In schizophrenia, deficits in gamma oscillations contribute to cognitive impairments and sensory processing anomalies. Alzheimer's disease research suggests that gamma oscillations might help clear amyloid-beta plaques, pointing to potential therapeutic avenues. In ADHD, reduced gamma activity is noted, particularly in the right centroparietal region, correlating with symptom severity.
Recent advancements in neuroimaging, such as magnetoencephalography (MEG) and high-density EEG, have improved the spatial and temporal resolution of gamma activity mapping, enhancing the understanding of gamma oscillations in both healthy and diseased states. These technologies allow for more precise identification of gamma rhythm sources and their roles in brain function.
Gamma oscillations' importance in various brain functions and their implications in several conditions highlight the need for continued research to fully elucidate their mechanisms and therapeutic potential.
Most EEG power falls below 20 Hz, and each band carries characteristic correlates: slow cortical potentials with shifts in cortical excitability, delta with deep sleep and restoration, theta with drowsiness, memory, and frontal-midline attention, alpha with relaxed wakefulness, the sensorimotor rhythm with calm alert stillness, beta with active processing, and gamma with feature binding and cognitive effort. Higher frequencies reflect desynchronized, actively processing states, while lower frequencies reflect synchronized activity. The functional meaning of a rhythm depends on where it is recorded, so the same frequency can signal different processes at frontal, temporal, and posterior sites. Deviations from age-referenced normal values carry clinical weight, as with the elevated theta-to-beta ratio in attention disorders and spindling excessive beta in arousal and impulse-control problems. Because authors define band boundaries differently, clinicians should confirm the bandpass a source uses before comparing values across studies or systems.
Waveform Morphology
A wave is a change in the potential difference between two EEG electrodes. Waveform and morphology refer to the shape of the signal generated by oscillating potential differences. Neurofeedback professionals examine the raw waveform's morphology before considering the filtered and quantified EEG (Demos, 2019). EEG activity means a single wave or series of waves (Fisch,1999).
We can distinguish between regular and irregular activity. A regular or monomorphic series of waves are rhythmic with the same frequency and morphology. Rhythmic waves that resemble sine waves are called sinusoidal.
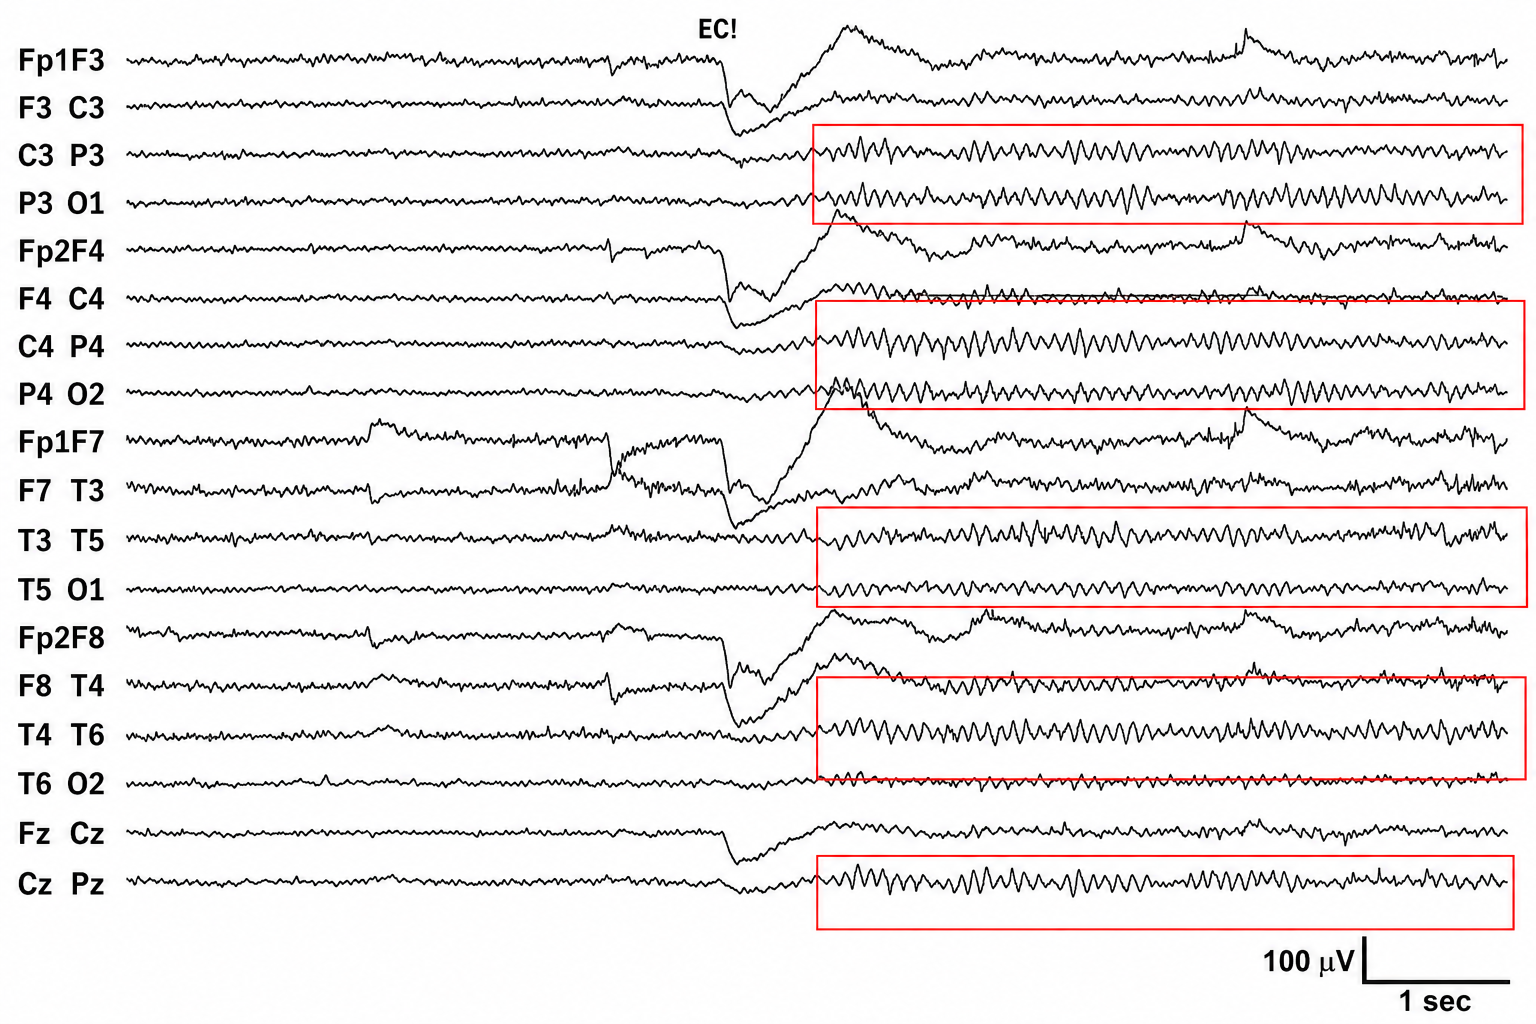
This display captures one of the most reliable events in all of human electrophysiology: the moment the eyes close and the brain's posterior alpha rhythm blooms into view. The tracing runs left to right in time, with the eyes-closed marker sitting near the middle of the page. To its left the channels are low in amplitude and busy with small mixed-frequency activity, the signature of an alert brain taking in visual information. Just after the marker, a large slow swing sweeps through nearly every channel, and out of it rises a train of smooth, evenly spaced waves. Those waves cycling at roughly ten per second are the alpha rhythm, and the highlighted regions are showing you exactly where they live.
What a beginner tends to do is stare at any single squiggle and try to read meaning into its wiggles. The story lives in the arrangement of the whole page. The vertical stack of labels is a longitudinal bipolar montage, often called the double banana, and it walks front to back down the left hemisphere, then front to back down the right, then out along each temporal edge, finishing with the midline. Read that way, the red boxes are not scattered at random. Every one of them sits over a posterior link, the parietal, occipital, and posterior temporal derivations, which is precisely where healthy alpha is supposed to be strongest.
That posterior emphasis is the feature to internalize. Alpha here is not merely present, it is sinusoidal, rhythmic, and close to mirror-image symmetric between the left boxes and the right boxes. The frontal channels at the top of each chain carry the eye-movement and eye-blink deflections that dominate the pre-closure segment, while the back of the head answers eye closure with clean rhythm. Reading the tracing as a map rather than a set of separate lines lets you see a single coordinated response rippling across the scalp.
The calibration marks in the corner give you the two rulers you need. The vertical bar spans 100 microvolts, so you can gauge that this alpha reaches respectable amplitude, and the horizontal bar spans one second, letting you count cycles and confirm the frequency by eye.
Put those together with the front-to-back layout and the posterior highlighting, and the display resolves into a clear demonstration of eyes-closed posterior dominant alpha, the resting baseline against which so much of neurofeedback assessment is measured.
Regular waves may be arch-shaped and resemble wickets. We adapted this graphic from © eegatlas-online.com.
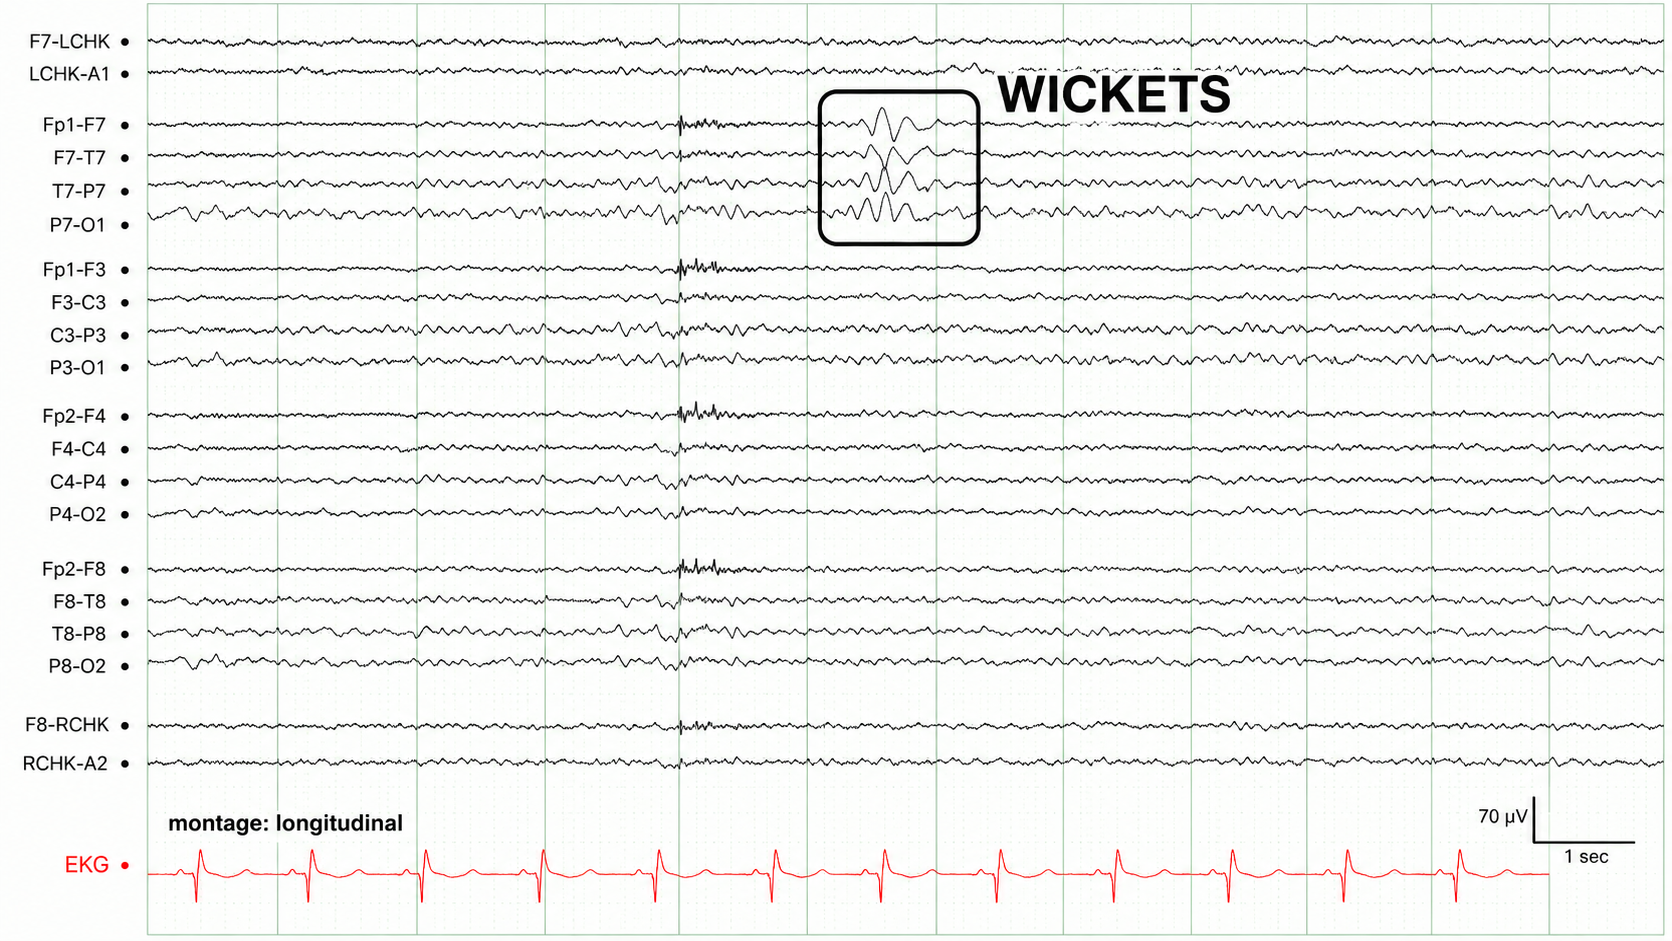
We adapted this graphic from © eegatlas-online.com. This is a full scalp EEG in the longitudinal montage, laid out with the left temporal chain at the top (Fp1-F7 through P7-O1), then the left parasagittal chain, the midline chain, the right parasagittal chain, and the right temporal chain, with a red ECG beneath and a running vitals strip showing oxygen saturation in the low 90s and a heart rate in the mid-70s. A blue oval has been drawn around one spot near the top of the page, in the left temporal rows, and that circle is your signpost for wicket waves. The background elsewhere is fairly low in voltage and busy with fine, fast squiggles.
The beginner's mistake is to take in the uniform, fast-textured page and see it as one indistinct blur of activity. The move that unlocks it is to let the oval focus your eye on the one region that behaves differently, then to test that difference by asking whether the same thing is happening anywhere else on the head at that moment.
Do that and the event stands out. Inside the oval, in the left temporal chain (Fp1-F7, F7-T7, T7-P7), a discrete burst of rhythmic, sharper, more organized waves runs for a couple of seconds, tighter and more patterned than the loose background around it, rising up and then subsiding back into the ordinary trace. It has the look of a real, self-contained rhythmic run rather than random fuzz.
Now do the crucial second step and check the rest of the head at that same instant. Drop your eye down through the parasagittal chains, the midline, and especially the right temporal chain, and the rhythmic burst is not there; those regions carry on with their usual low-voltage activity, unbothered. That confinement is the whole point: the event belongs to the left temporal region alone and does not spread across the scalp.
The red ECG ticks along in a steady, regular beat matching the heart rate in the vitals strip, giving you a reference to keep the pulse mentally separate from the brain rhythm above.
Put it together and what this display shows is a focal, left-temporal burst of rhythmic activity, circled for emphasis, standing out from an otherwise low-voltage, fast background and staying confined to that one region rather than involving the rest of the head. The insight comes from letting the oval point you to the odd-one-out region and then confirming its localization by scanning everywhere else, so the discrete left-temporal rhythmic run declares itself as a focal event rather than getting lost in the surrounding sameness.
Saw-toothed waves resemble asymmetrical triangles.
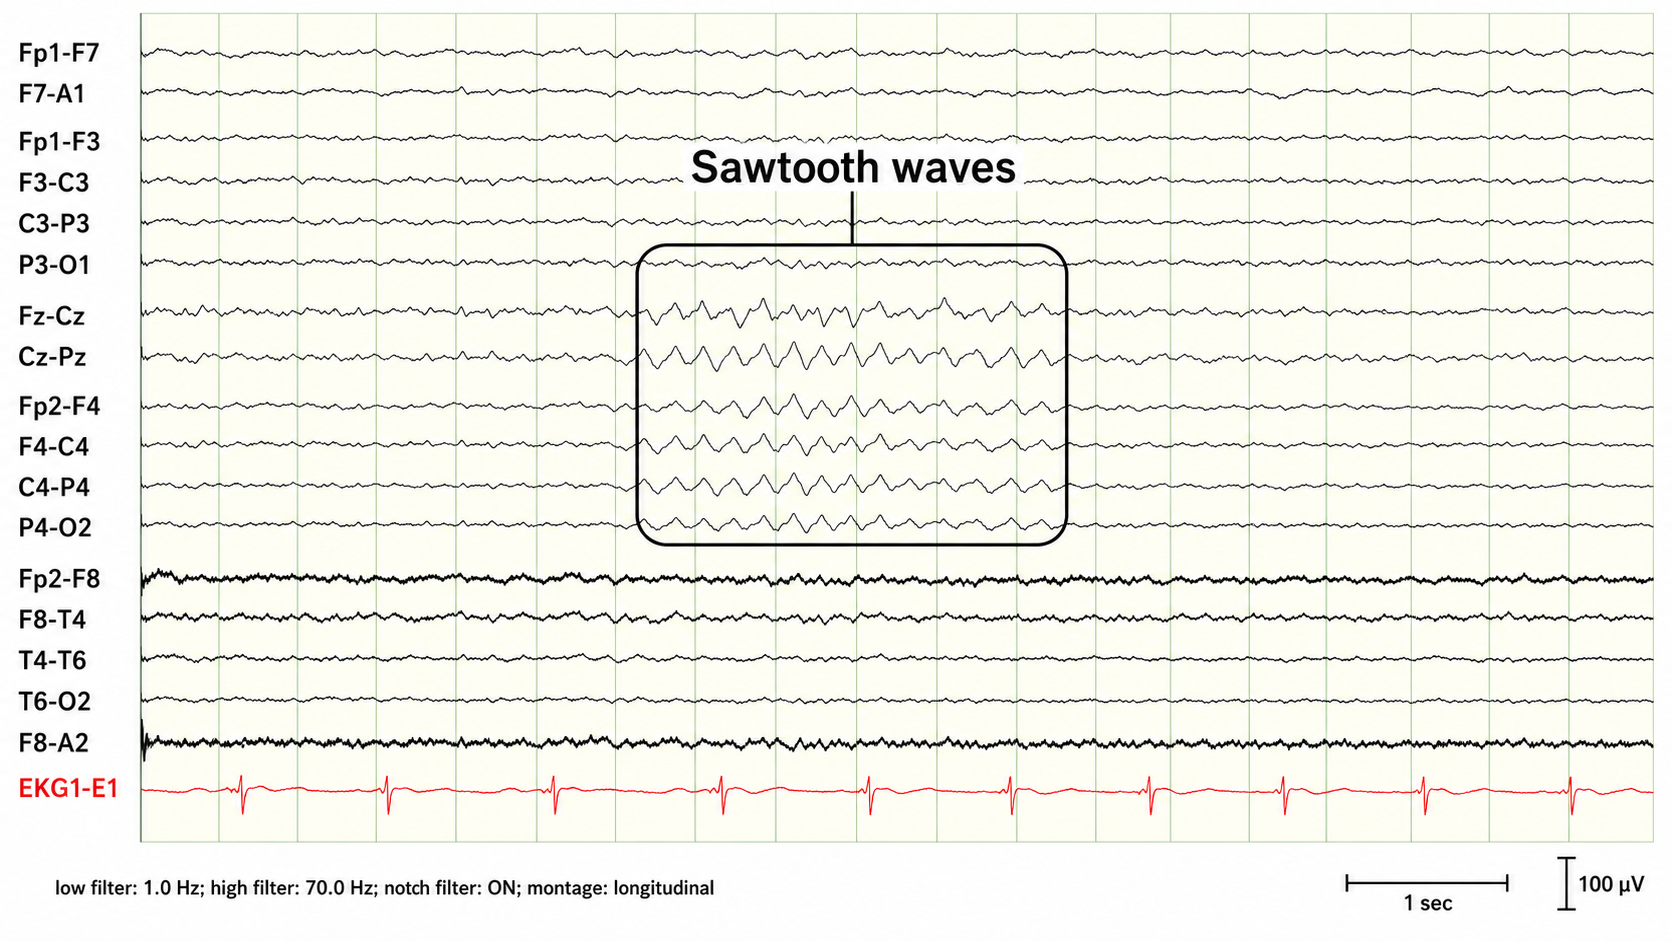
We adapted this graphic from © eegatlas-online.com. This display captures a signature of dreaming sleep. The tracing runs left to right in time, and the outlined region over the central and midline channels holds a run of notched, triangular waves that rise and fall with a slightly jagged front edge. These are sawtooth waves, and their presence stamps this segment as REM sleep, the stage where vivid dreaming occurs and the brain is nearly as active as it is in waking. They cluster over the vertex, strongest through the midline and central derivations, which is exactly where this pattern announces itself.
What a beginner tends to do is fixate on the labeled box and treat everything else as background. The whole page is telling one coordinated story, and the surrounding channels are part of it. Read the electrode stack as a montage that walks front to back down each hemisphere and along the midline, and you can see that the sawtooth run is regional rather than universal, blooming across the central and posterior midline links while the frontal and temporal chains stay comparatively quiet. That regional distribution is a feature to internalize, because it is how the pattern earns its identity.
The bottom two lines are where the big picture snaps into focus. Above the tracings, the notch filter is on and the bandpass runs from one to seventy hertz, so the mains interference is suppressed and the display shows genuine physiology. The red channel at the very bottom is the electrocardiogram, and its steady, evenly spaced complexes give you a heartbeat metronome, a calm rhythm that anchors the recording and confirms this is a quiet, stable state rather than an aroused one. The channels just above it carry the muscle and movement texture that helps distinguish sleep stages, running low and even here.
The calibration marks in the corner supply the two rulers you need. The horizontal bar spans one second, letting you count the sawtooth cycles and confirm their frequency by eye, and the vertical bar spans 100 microvolts, letting you gauge that these waves reach modest, believable amplitude rather than the towering deflections of an artifact.
Put the notched central waveforms together with the quiet frontal and temporal chains, the settled heart rhythm, and the filter settings, and the display resolves into a clean demonstration of REM-sleep sawtooth waves, the electrographic marker of the dreaming brain.
Irregular waves continuously change shape and duration. The graphic below shows runs of irregular high-amplitude delta waves.
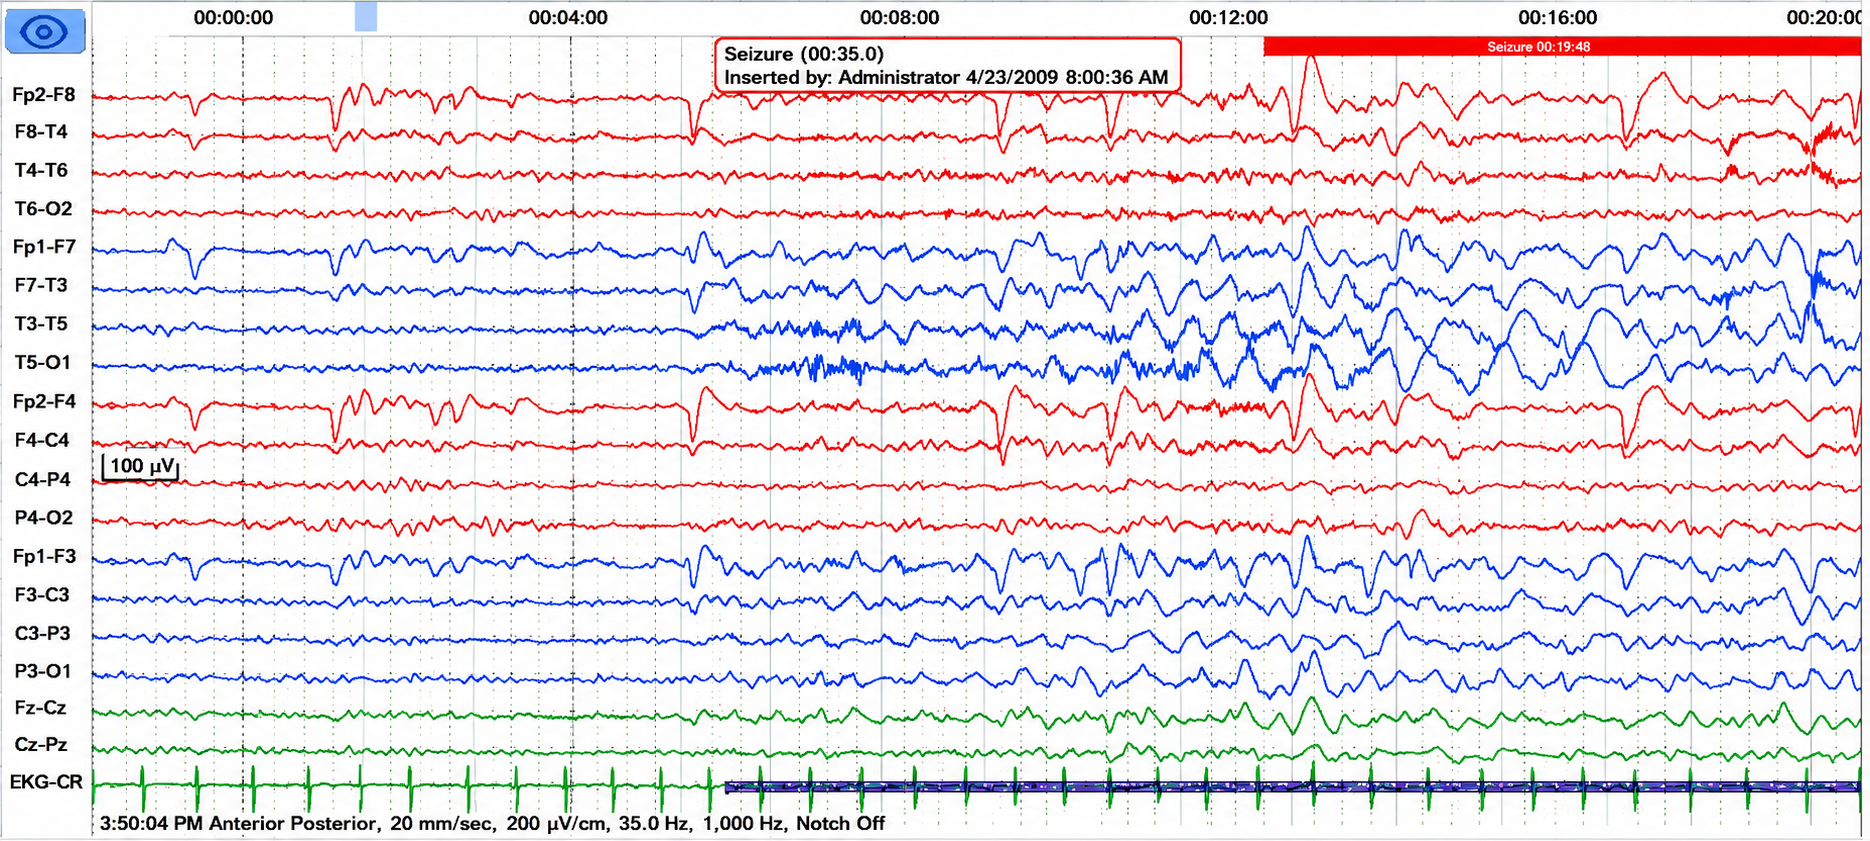
This display captures a seizure unfolding over time. Notice the ruler along the top: it counts in minutes, not seconds, so the entire twenty-minute stretch is compressed onto a single page. That compression is the key to reading it. At this scale you are not meant to trace individual waves. You are meant to watch the texture of the tracing change, and it changes dramatically from left to right. The annotation near the top marks a seizure, and the long red bar in the upper corner brands the final stretch as ictal, the period when the electrical storm is fully underway.
What a beginner tends to do is hunt for a single dramatic spike. The story here lives in the evolution across the page. On the left, the channels are relatively low and quiet, carrying scattered slow deflections. Move rightward and the rhythms build, growing taller and more organized, the waveforms crowding closer together and swelling in amplitude until, beneath the red bar, the tracing becomes a dense, high-voltage tangle. That progressive buildup, quiet to loud, sparse to saturated, is the electrographic signature of a seizure recruiting more and more cortex as it develops.
Reading the electrode stack as a map rather than a set of separate lines lets you see where the activity is concentrated. The channels are grouped and color-coded, walking down the right hemisphere, then the left, then the midline, and the largest, most rhythmic swings ride through the mid and posterior temporal and parietal links. The green channel at the very bottom is the electrocardiogram, and its steady, evenly spaced complexes give you a heartbeat reference running underneath the whole record, a fixed rhythm against which the escalating brain activity stands out.
The settings printed along the bottom tell you how to trust what you see. The display runs at twenty millimeters per second with a sensitivity of two hundred microvolts per centimeter, and the calibration bar in the corner spans 100 microvolts, so the towering deflections on the right are genuine high-voltage physiology rather than an artifact of the scaling. Put the minute-scale timeline together with the front-to-back color-coded montage, the steady cardiac trace, and that unmistakable crescendo of rhythmic activity, and the display resolves into a clear demonstration of a seizure evolving over time, captured in the compressed panoramic view clinicians use to see the whole event at a glance.
EEG waves may be monophasic or polyphasic. Monophasic waves possess a single upward or downward deflection. Two polyphasic waveforms containing waveforms with two or more elements are diphasic and triphasic waves. Diphasic waves have two elements--one positive and one negative. Triphasic waveforms contain three elements with alternating directions.
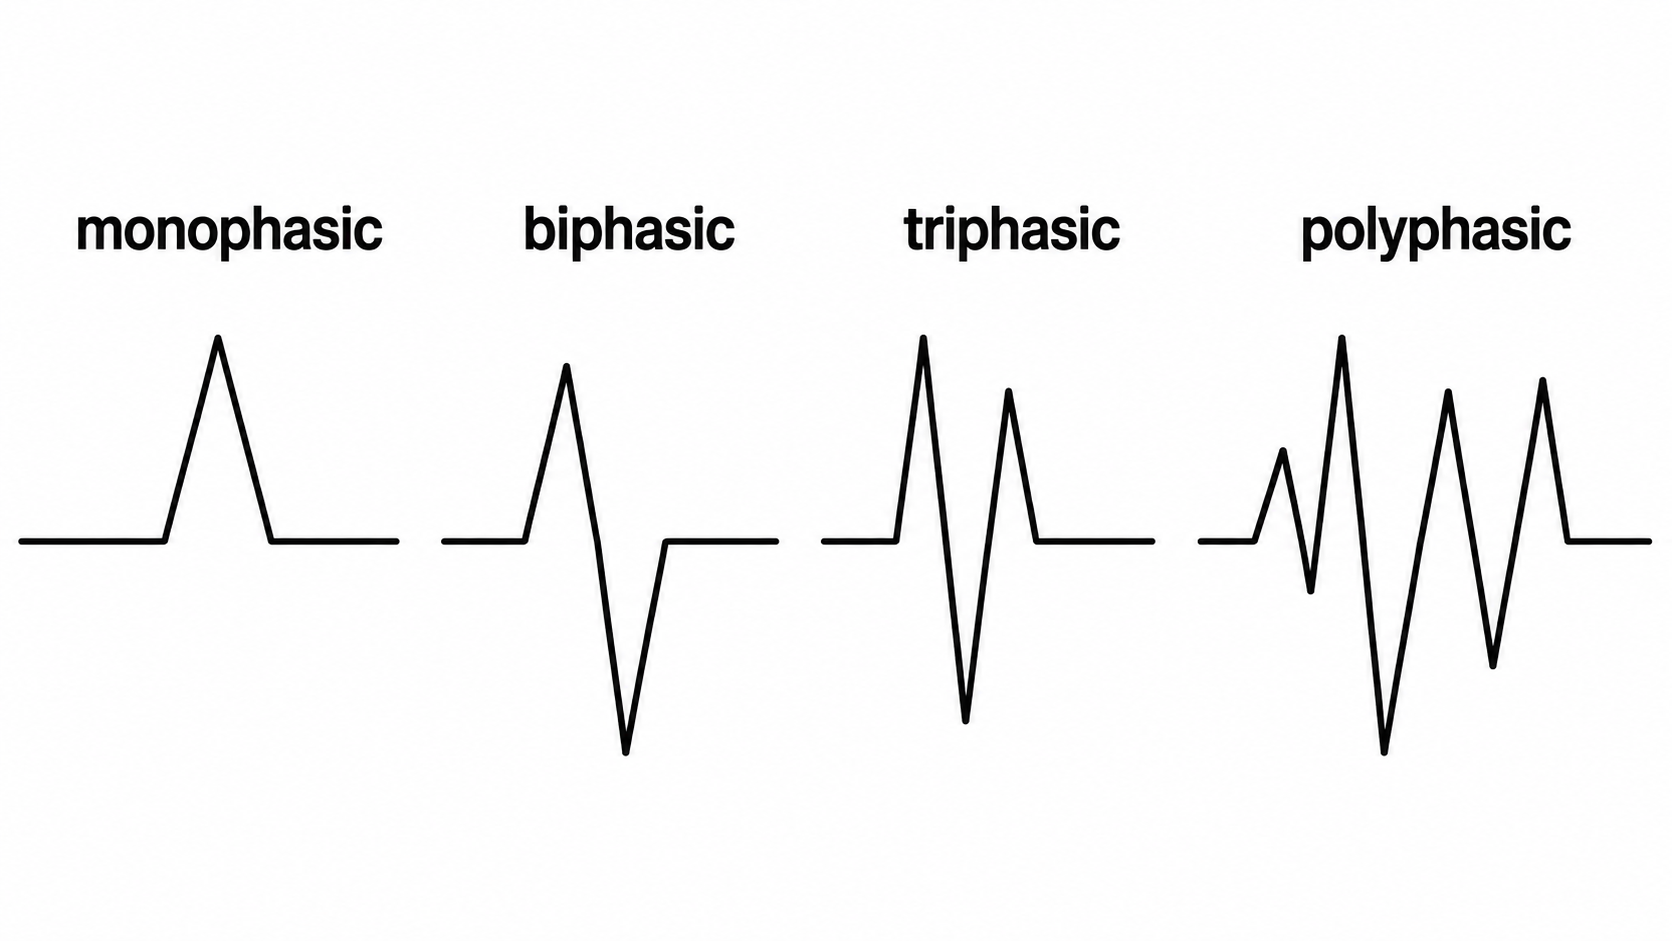
A transient is a single wave or series of waves distinct from background EEG activity.
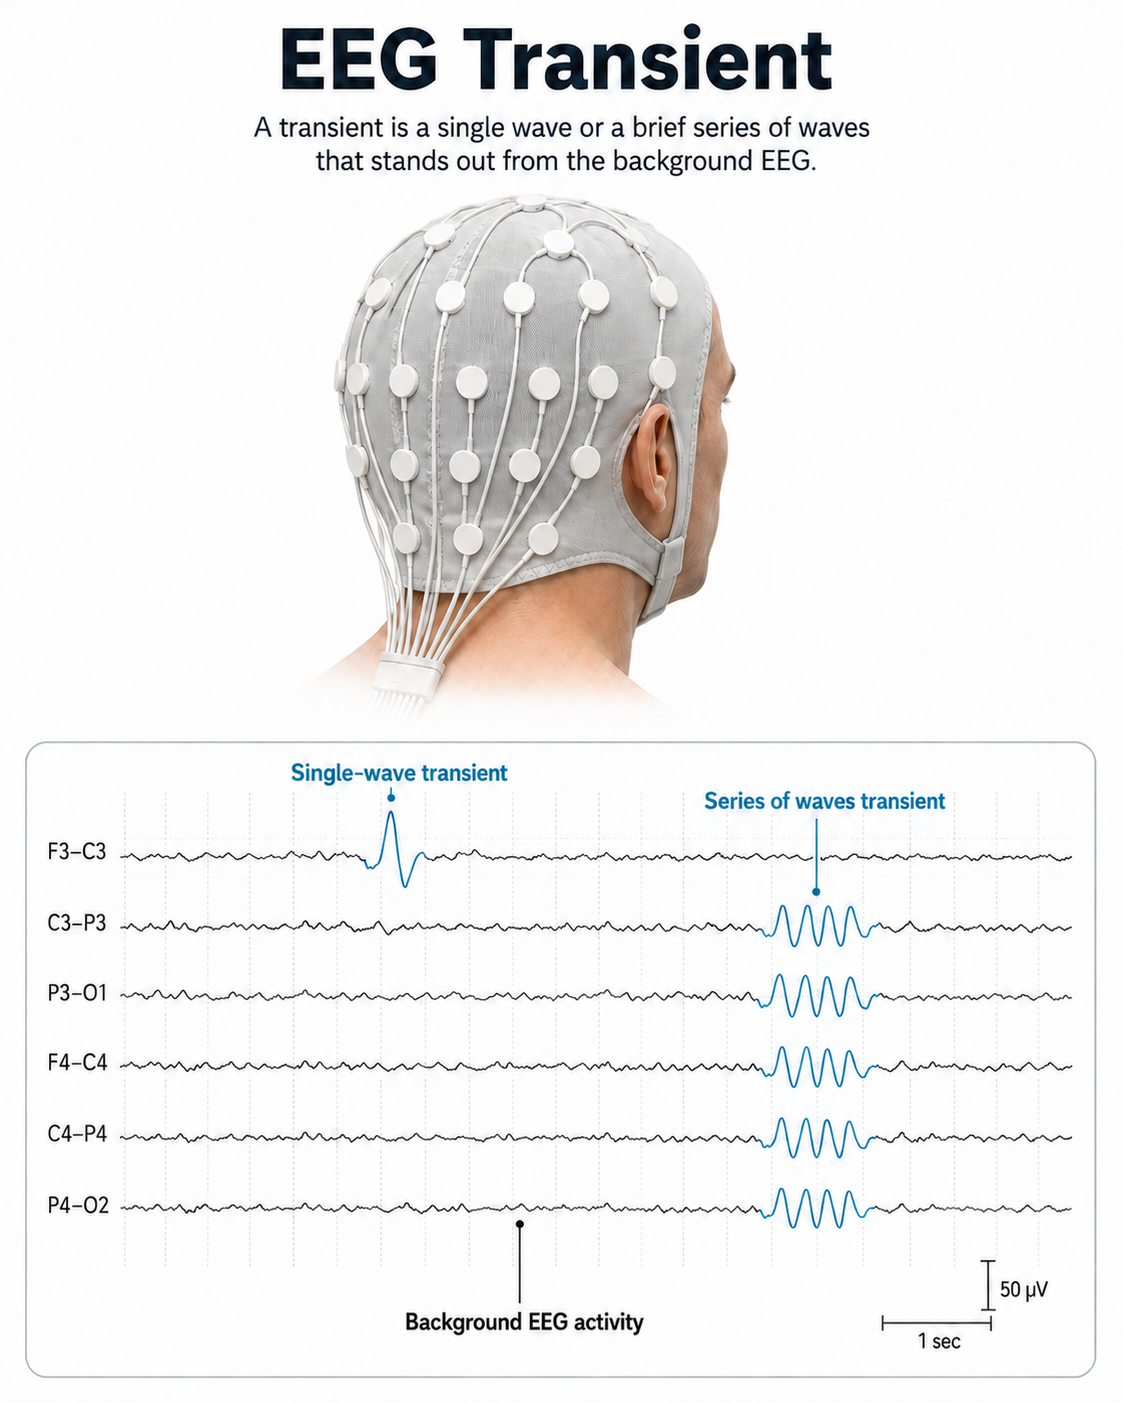
Sharp transients are steeply contoured waves standing out from the background. Benign variants are not epileptiform and must be distinguished from spikes and sharp waves by duration, field, and the presence of an after-going slow wave.
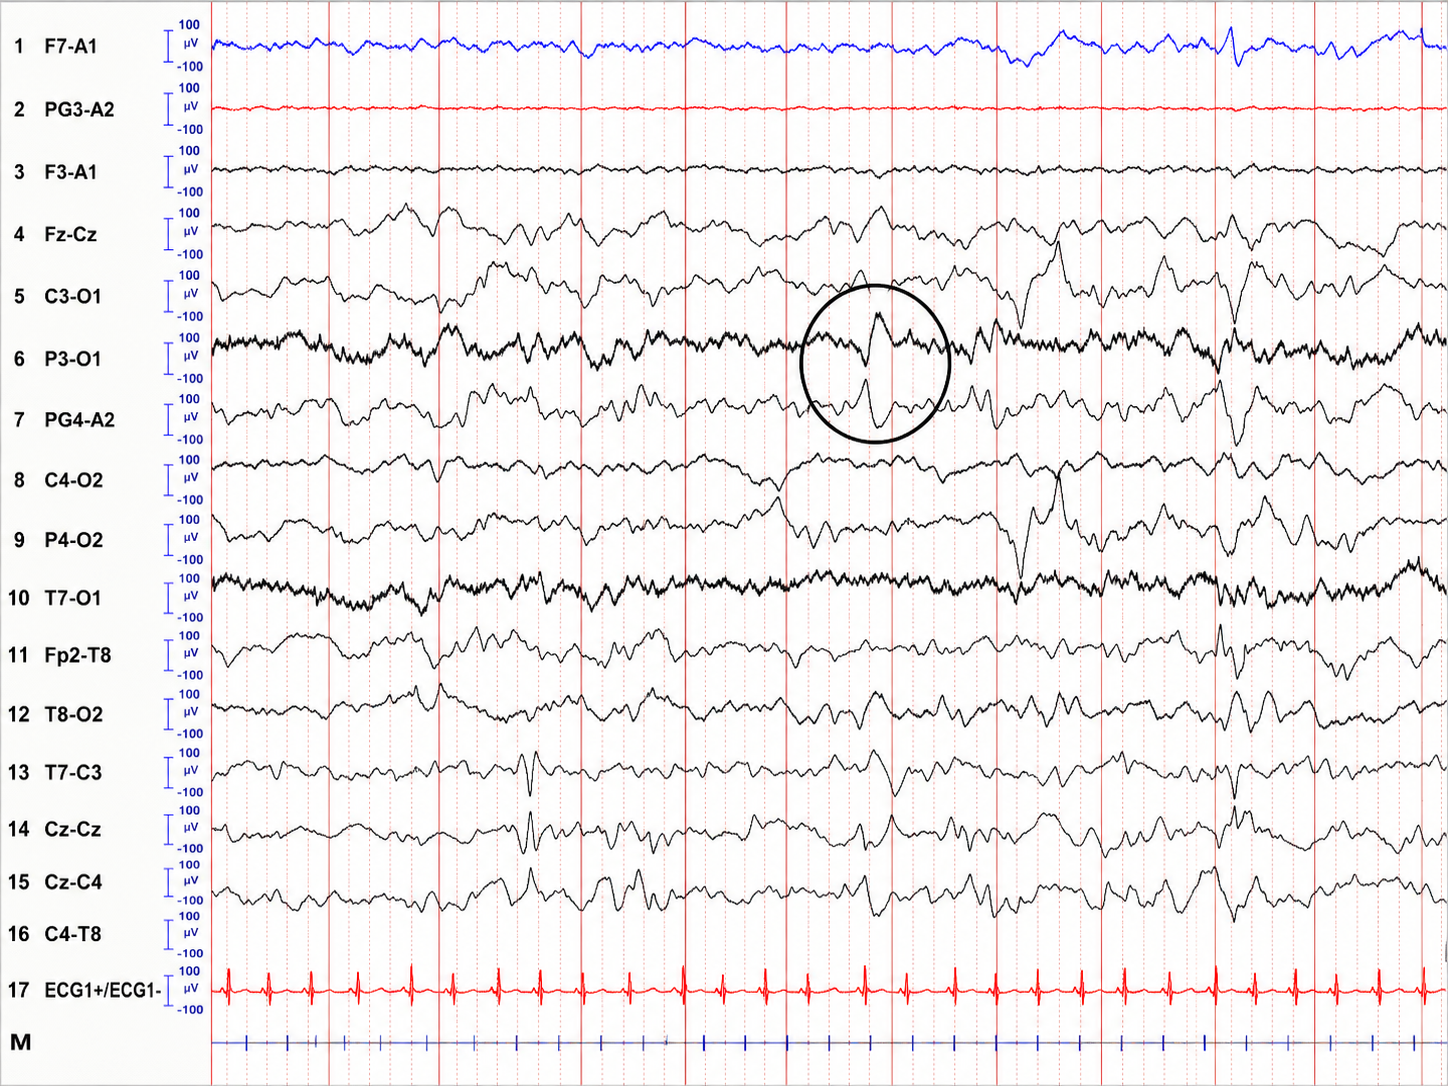
This display captures a single fleeting event standing out from a busy background. The circled waveform over the posterior channels is the star: a sharp transient, a fast, pointed deflection that pierces up from the surrounding rhythm and settles just as quickly. It stands apart from its neighbors because it is briefer and steeper than the slow waves rolling through the rest of the page, and that abruptness is exactly what makes it worth circling. The tracing runs left to right in time, and this one event lasts only a fraction of a second.
What a beginner tends to do is scan for the biggest wave on the page, and there are plenty of tall, slow undulations competing for attention. The thing to internalize is that amplitude is not the point here, shape and speed are. A sharp transient earns its name from its pointed morphology and quick rise and fall, not from towering height. Reading the electrode stack as a map lets you localize it: each line is numbered and labeled, walking across frontal, central, temporal, and posterior derivations, and the circled event lives in the posterior links, where it emerges from the ongoing activity and then folds back into it.
The calibration cues sit right beside every channel, and this is where the display teaches you to be precise. Each trace carries its own little vertical scale bracketed at 100 microvolts above and below the baseline, so you can gauge the height of the transient against a fixed ruler on its own line rather than eyeballing it across the whole page. The red channel near the bottom is the electrocardiogram, and its steady, evenly spaced complexes give you a heartbeat reference, a metronome confirming this is a calm, stable recording in which a single brief event stands out rather than an aroused one.
Put those pieces together and the story resolves. Read the page as a coordinated map, use the per-channel rulers to judge shape over size, and let the steady cardiac trace anchor the timing, and the circled deflection reveals itself for what it is: a sharp transient, the kind of brief, pointed waveform that pulls the eye precisely because it interrupts an otherwise slow and rhythmic background. Learning to spot that contrast, the quick pointed event against the rolling backdrop, is the whole skill this display is built to demonstrate.
In contrast, epileptiform activity consists of spikes and sharp waves. An epileptiform spike has a sharp appearance and lasts 20-70 ms. Watch the Blausen Epilepsy and Seizure animations. We adapted this graphic from © eegatlas-online.com.
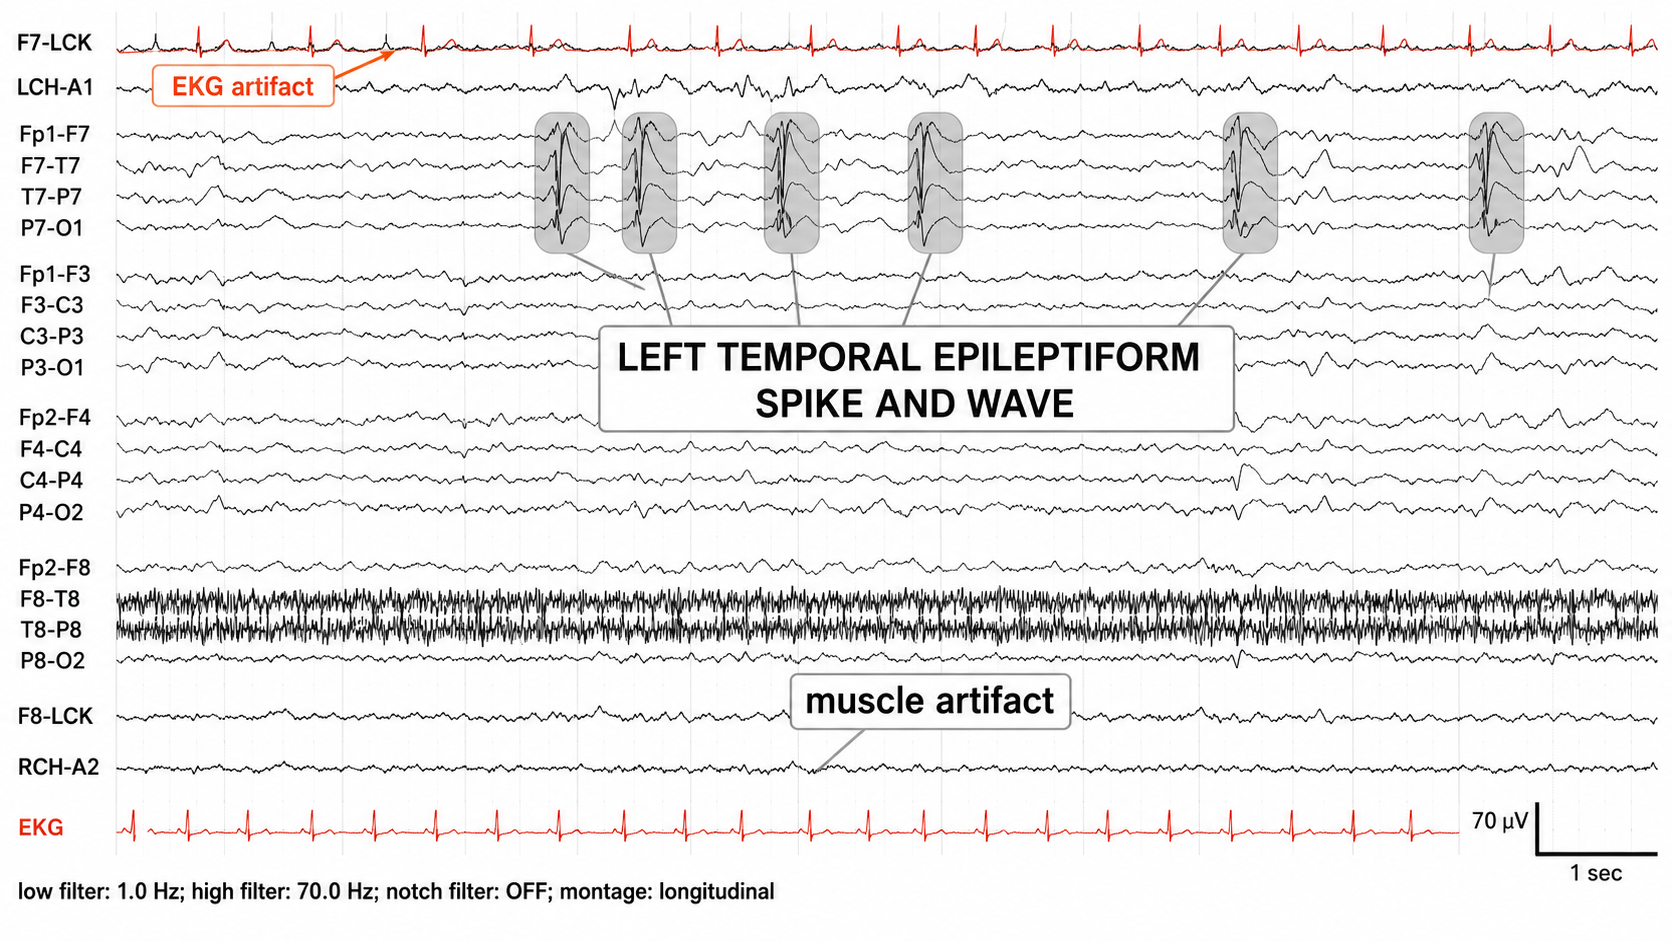
This display captures a repeating epileptiform discharge and, just as importantly, teaches you to separate it from the noise that surrounds it. The shaded ovals march across the upper channels, each one wrapping a two-part event: a fast, pointed spike followed immediately by a slower wave. That spike-and-wave couplet is the signature of cortical hyperexcitability, and here it recurs at intervals along the tracing, which runs left to right in time. The shading sits over the left temporal chain, and that placement is the point, marking these as left temporal epileptiform spike-and-wave discharges.
What a beginner most needs from this page is the discipline to read location. The discharges do not appear everywhere. Follow the electrode stack as a montage walking front to back down the left side, then the right, then out along the temporal edges, and you can see the shaded events light up the left temporal derivations while the corresponding right-sided and midline chains stay quiet. That regional confinement is what earns the finding its name and its clinical weight. A spike is only meaningful once you know where on the scalp it lives.
The rest of the page is a lesson in what genuine brain activity is not. Two intruders are called out by name. The top red channel carries an electrocardiogram artifact, sharp blips that line up perfectly with the heartbeat on the dedicated cardiac trace at the bottom, betraying their origin in the heart rather than the brain. A band of dense, buzzing, high-frequency scribble runs through the right temporal channels, and that is muscle artifact, the tension of scalp musculature rather than any cerebral rhythm. Learning to recognize and set both aside is exactly what lets the true epileptiform events stand out cleanly.
The settings anchor your confidence in all of this. Printed along the bottom, the bandpass runs from one to seventy hertz with the notch filter switched off, which is why the muscle and cardiac interference show through so vividly rather than being scrubbed away. The calibration marks in the corner give you two rulers, a vertical bar spanning 70 microvolts to gauge amplitude and a horizontal bar spanning one second to time the recurrence of the discharges.
Put the localized spike-and-wave couplets together with the labeled artifacts, the steady cardiac reference, and the filter settings, and the display resolves into a clear demonstration of left temporal epileptiform spike-and-wave activity, read correctly by first clearing away the noise that would otherwise disguise it.
Less steeply shaped sharp waves last 70-200 ms. Complex denotes a series of waves that share a similar shape. See the K-complex in the EEG record below.
We adapted this graphic from © eegatlas-online.com. This is a teaching-style EEG in the longitudinal montage, and the header tells you the state up front: this is a page of Stage 2 sleep, laid out to introduce the handful of signature waveforms that define it. The chains run in the usual way with an EKG in orange along the bottom and a 100 microvolt, 1-second marker for scale, but the real content is the set of labeled boxes scattered across the page, each one framing and naming a different hallmark of light sleep.
The beginner's temptation is to read the page as one continuous rhythm and try to grade the background. The move that unlocks it is to treat the page as a labeled catalog, letting each box teach you one distinct graphoelement by its shape and its location, then recognizing that the whole collection is what stamps the record as Stage 2 sleep.
Start at the lower left, where the box marks POSTS, the positive occipital sharp transients of sleep. Down in the occipital rows (T6-O2 and its neighbors) you see a little run of crisp, sharp, repeating transients riding in the back of the head, checkmark-like deflections that cluster during drowsy sleep. Move to the center of the page and the tall vertical box labels the vertex wave: a single sharp, pointed deflection that is biggest right over the top of the head in the central and midline channels (the Fz-Cz and Cz-Pz region), a lone spike of sleep. Just to its right, the sleep-spindle box catches a brief, beautiful burst of fast rhythmic activity that waxes and wanes like a spindle of thread, again maximal over the central regions.
Then the largest box on the right frames the K complex: a big, slow, biphasic wave with a sharp component and a broad following swing, dominant over the front-central head and towering above everything around it. Together these are the classic furniture of light sleep, each with its own shape and its own preferred spot on the scalp.
Source Localization
Source localization addresses the EEG inverse problem, the challenge of estimating which cortical generators produced a recorded pattern of scalp voltages, because many different source configurations can produce the same surface recording (Thompson & Thompson, 2015).
LORETA, sLORETA, eLORETA, and swLORETA
Low resolution electromagnetic tomography (LORETA) is Pascual-Marqui, Michel, and Lehmann's (1994) mathematical inverse solution to identify the cortical sources of 19-electrode quantitative data acquired from the scalp. In this context, tomography refers to two-dimensional coronal, horizontal, and sagittal brain slices. LORETA's solution space is restricted to cortical gray matter, plus hippocampus in the original implementation. Structures outside that space — thalamus, amygdala, basal ganglia, brainstem, and cerebellum — contain no voxels and therefore cannot be identified as sources (Thompson & Thompson, 2015).
LORETA represents cortical sites using three-dimensional voxels, which are volumetric units. While its original voxels had a 7-mm spatial resolution (7 mm x 7 mm x 7 mm), the spatial resolution has increased to 5 mm (5 mm x 5 mm x 5 mm). LORETA values are expressed as current density in amperes per square meter (A/m², equivalently µA/mm²).
LORETA assigns each voxel x, y, and z Talairach coordinates referencing the original Talairach atlas and subsequent atlases like the Montreal Neurological Institute (MNI) atlas. Talairach coordinates form a three-axis Cartesian system whose origin is the anterior commissure. The y-axis runs posterior-to-anterior along the line joining the posterior and anterior commissures (the AC-PC line), the z-axis runs inferior-to-superior, and the x-axis runs left-to-right; coordinates are given in millimeters as (x, y, z). An individual brain is fitted to the atlas by piecewise linear proportional scaling. Talairach coordinates (46, 33, 40), for example, fall in the right middle frontal gyrus near the border of Brodmann areas 8 and 9. Because MNI and Talairach coordinates differ by several millimeters, the coordinate space should always be specified.
These stereotaxic coordinates are primarily independent of brain shape and volume, which has permitted their use in other imaging methods (e.g., positron emission tomography (PET) and magnetic resonance imaging (MRI). Graphic courtesy of BrainMaster Technologies.
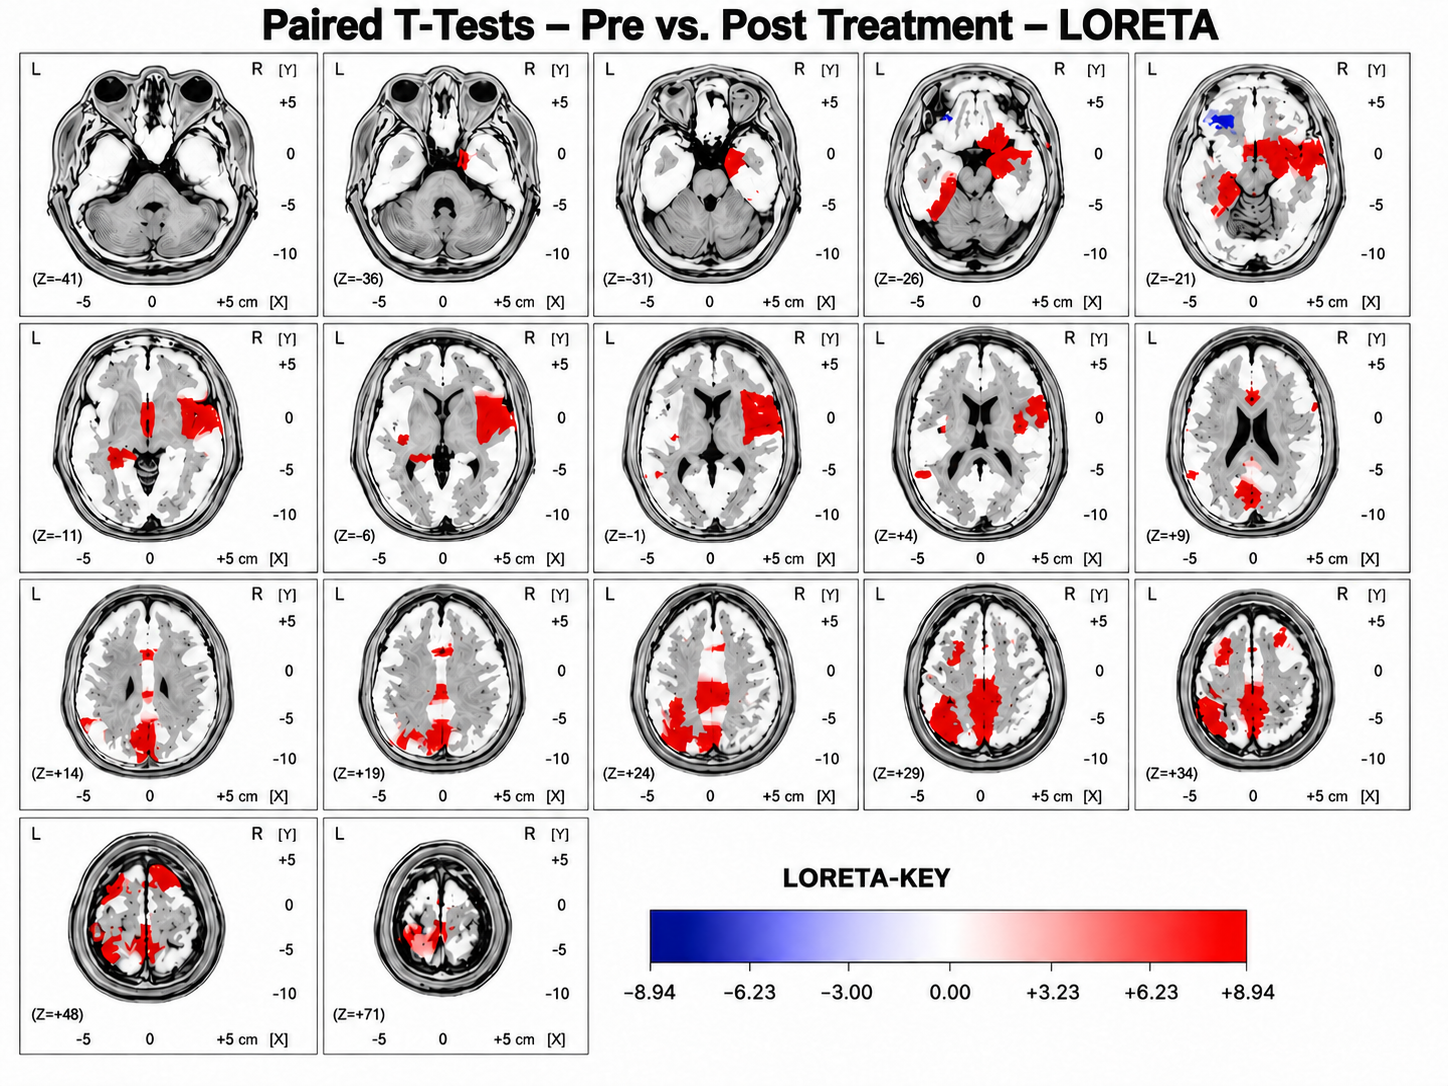
This display captures where treatment changed the brain. Unlike the squiggling traces of a raw recording, this is a source-localized statistical map, LORETA estimating the three-dimensional location inside the brain from which electrical activity arises, then testing where it shifted from before to after treatment. The title names the comparison as a paired t-test, pre versus post, and the colored blobs painted onto the gray brain slices mark the regions where that change reached statistical significance. Each panel is a horizontal slice through the head, stacked from the bottom of the brain to the top.
What a beginner most needs to grasp is how to read the stack as a single three-dimensional volume rather than a gallery of separate pictures. Each panel is labeled with a Z coordinate, the height of that slice, climbing from the deep, eye-level cuts in the upper rows to the crown of the head in the last panels. The X and Y rulers around each frame place features in the other two dimensions, and a small orientation cue marks left and right. Walk through the panels in order and the scattered patches assemble into connected clouds of change occupying real anatomical territory, most prominently through the central and posterior regions as you climb toward the top of the head.
The color key is the interpretive heart of the display, and it carries direction, not just intensity. The scale runs from deep blue through white to vivid red, with a signed number beneath each end. Red marks where activity increased from pre to post, blue where it decreased, and white marks the null middle where nothing significant happened. The overwhelming dominance of red across these slices tells the story at a glance: the treatment was associated with widespread increases in localized activity, with only a few small blue flecks of decrease in the frontal region. The numbers flanking the bar are t-values, so stronger color means a more robust statistical effect, not simply a bigger blob.
Put those reading tools together and the picture resolves. Stack the Z-labeled slices into a volume, use the left-right and coordinate cues to locate each cluster, and let the signed color scale tell you the direction and strength of each effect, and the display becomes a clear map of how the brain's electrical sources reorganized across a course of treatment. This is the panoramic, whole-brain view that turns a before-and-after comparison into an anatomically grounded statement about which regions responded and in which direction they moved.
Standardized LORETA (sLORETA) and eLORETA partition the intracerebral volume into 6,239 voxels at 5 mm resolution, refining the original LORETA's 2,394 voxels at 7 mm. Note that voxel size is not the same as spatial resolution: all LORETA-family solutions produce blurred images whose point-spread is on the order of centimeters. sLORETA estimates individual voxel's electrical potentials without regard to their frequency. sLORETA values are expressed in normalized F values. This refinement of LORETA trades absolute units of current density for reduced noise and more precise source localization. This is important because LORETA's "three-sphere model," which assumes different cortex, skull, and skin conductivity, suffers from artifacts ("ghost images") and limited source localization (Thompson & Thompson, 2015). Graphic courtesy of BrainMaster Technologies.
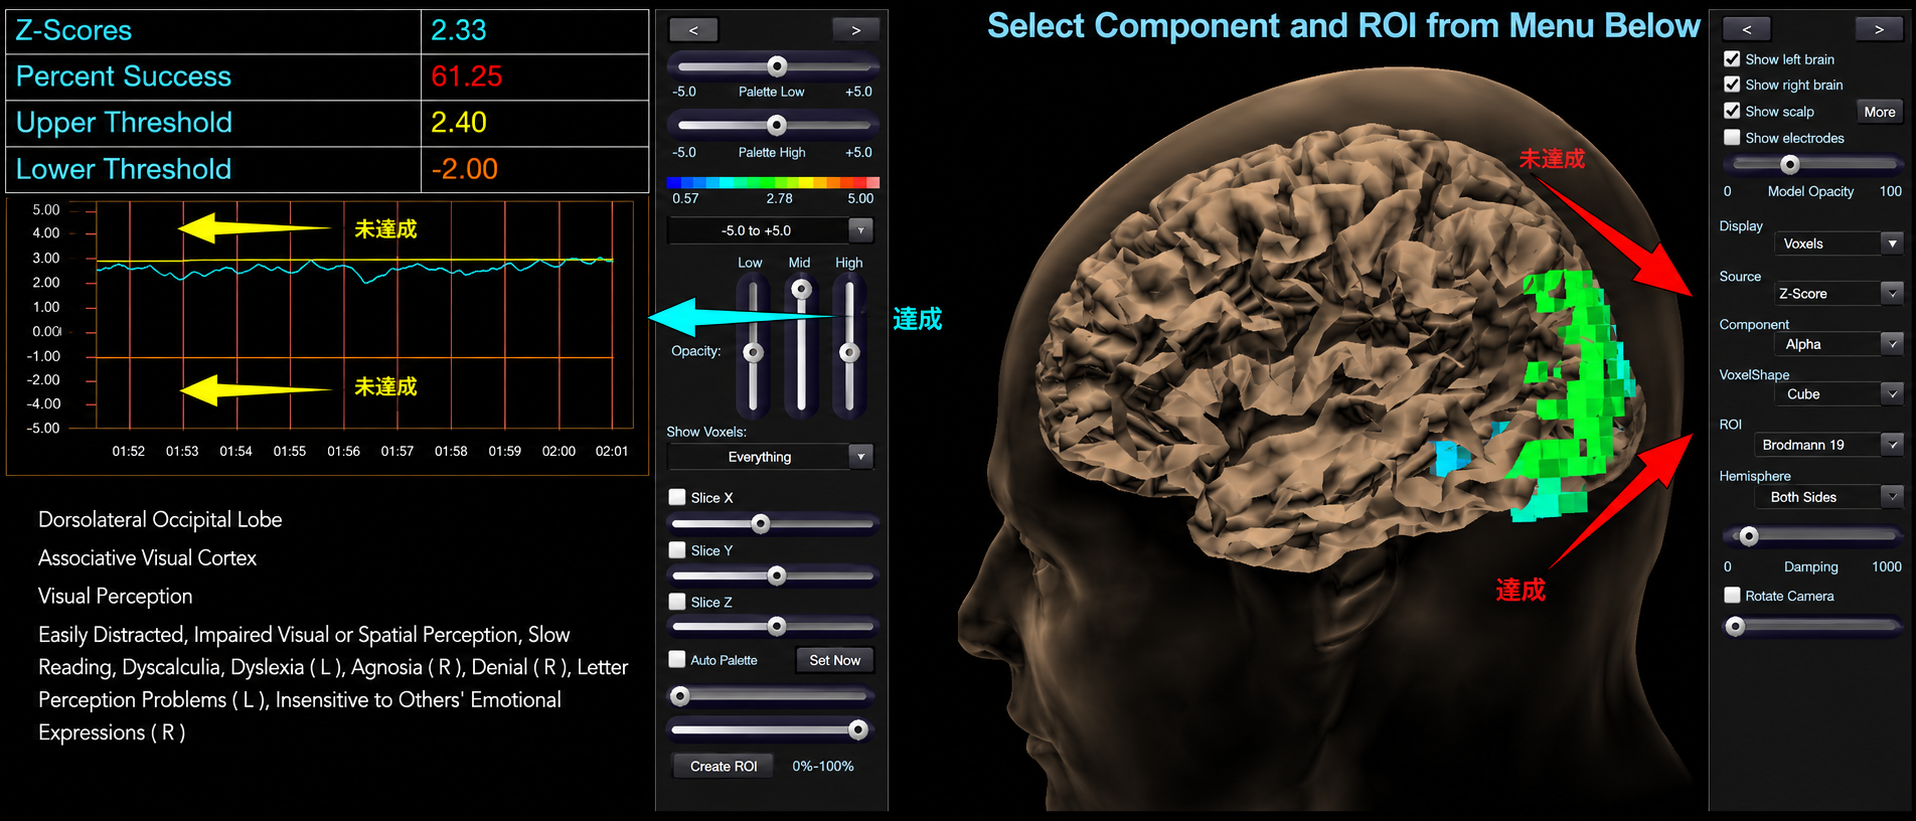
eLORETA, exact low resolution brain electromagnetic tomography, has the property of exact, zero-error localization for a single point source, and retains zero localization bias under specific noise assumptions (Pascual-Marqui, 2007). This does not mean it localizes multiple or spatially distributed sources without error, and the reconstruction remains blurred (Thompson & Thompson, 2015).
swLORETA stands for standardized, weighted LORETA, indicating the algorithms weigh the distances involved when assigning values to each region. Also, this method utilizes the information from a normative database to provide values reflecting statistical differences in standard deviations between the client and a typical population of age matched individuals.
Laplacian Analysis
Surface Laplacian (SL) analysis, which is also called current source density (CSD) and scalp current density (SCD), is a family of mathematical algorithms that provide two-dimensional images of radial current flow from cortical dipoles to the scalp. Positive values represent the current flow from the cortex to the scalp (sources). Negative values represent the current flow from the scalp to the brain (sinks).
Unlike the LORETA family of inverse solutions, SL analysis is independent of reference recording procedures--all reference schemes will yield the same current flow estimates and polarity. SL analysis better localizes the EEG signal than surface potentials because it minimizes scalp EEG blurring produced by volume conduction. Unlike inverse solutions, SL requires no model of the sources and is relatively insensitive to the volume conductor model. It is not, however, assumption-free: the standard spherical spline implementation assumes an idealized head geometry onto which electrode positions are projected, requires the analyst to choose a spline flexibility parameter and a regularization constant, and depends on adequate spatial sampling — dense arrays of 64 or more electrodes give substantially better estimates than a 19-channel montage (Kayser & Tenke, 2015). This figure was uploaded by Zoltan Juhasz to ResearchGate.
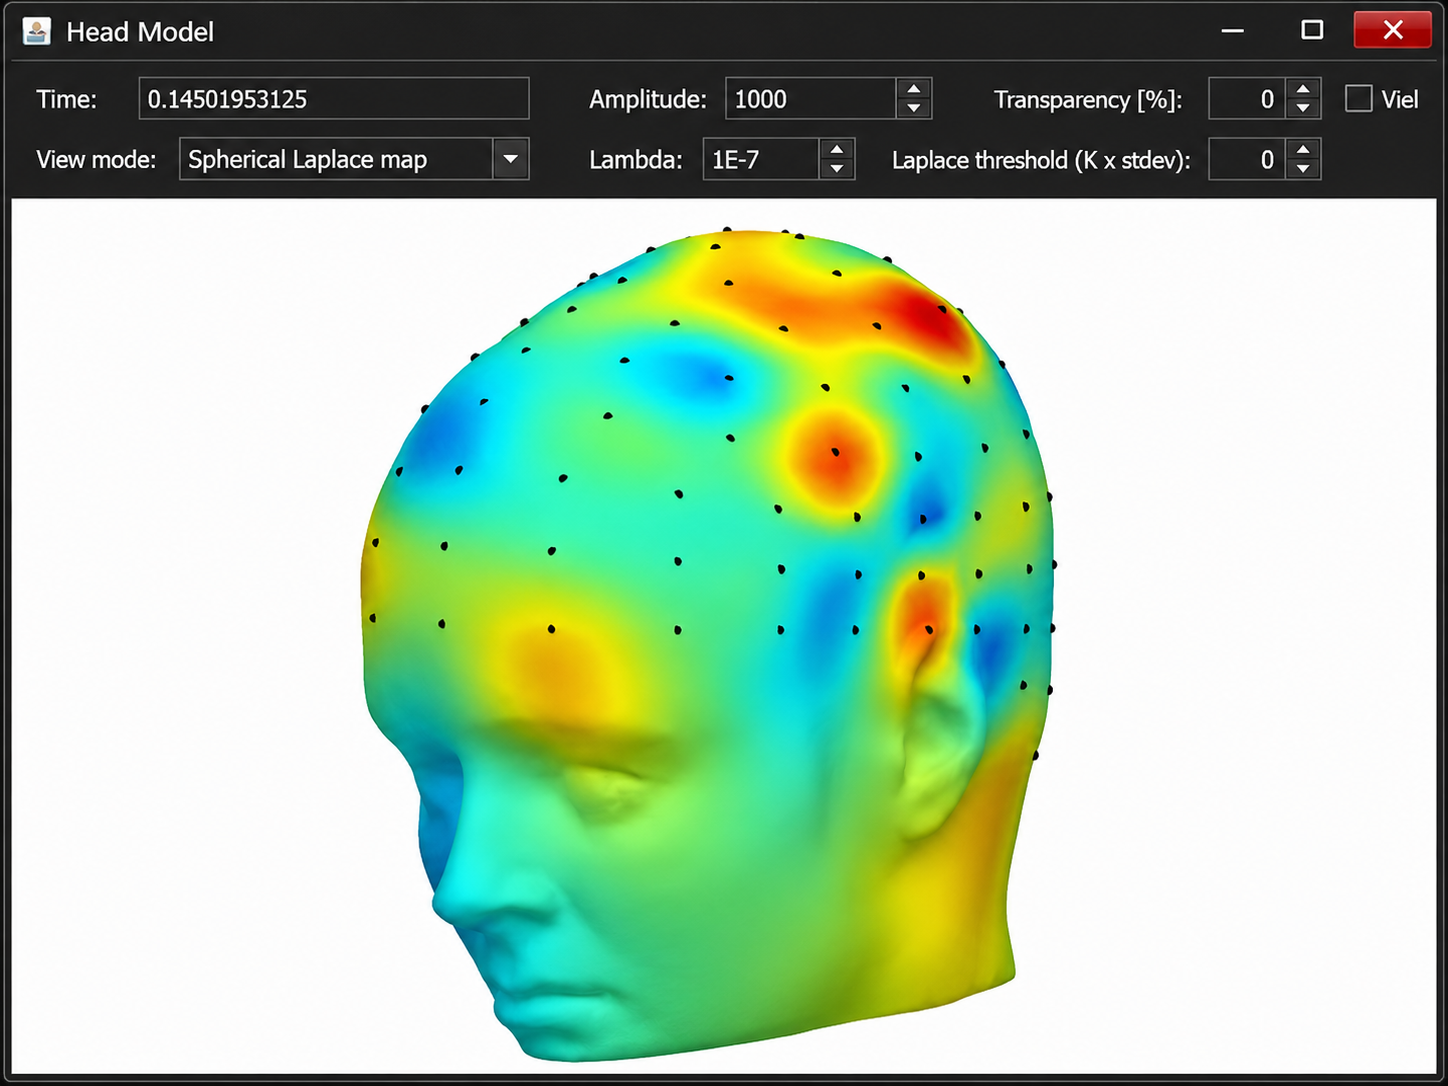
This display captures the brain's electrical landscape at a single instant, painted directly onto a three-dimensional model of the head. Where a raw recording gives you rows of wiggling lines, this view collapses one frozen moment into a color map draped over the scalp, letting you see at a glance where activity is peaking and dipping across the whole surface at once. The little black dots scattered over the head are the electrode positions, and the smooth wash of color between them is interpolated from what those sensors picked up. The view mode names the method: a spherical Laplace map, which sharpens each site by emphasizing how it differs from its immediate neighbors.
That last point is the big idea a beginner most needs to internalize. The Laplacian is a spatial filter that plays up local contrast, so the map deliberately highlights focal, circumscribed hot and cold spots rather than broad smears. The payoff is that each colored patch reflects activity close to the electrode beneath it rather than distant sources smeared across the scalp, which is why the display resolves into discrete, well-defined blobs. Warm reds mark local peaks, cool blues mark local troughs, and the green midground is the neutral baseline, so the eye is drawn straight to the sharp, sensor-anchored features scattered across the top and sides of the head.
Reading it as a map rather than a decoration is what makes it useful. The three-dimensional rendering, complete with face, ear, and the curve of the skull, gives you anatomical bearings that a flat circle cannot, so a red patch is not just bright, it sits over a knowable stretch of cortex. Rotating such a head model lets you follow a feature around the curve of the scalp, and here you can see distinct peaks riding over the frontal and central regions with cooler zones tucked between them, a spatial pattern that would be invisible in a stack of separate line tracings.
The control strip along the top is where the display tells you how to trust and tune what you see. A precise time value fixes exactly which instant is frozen, a reminder that this is one snapshot pulled from a flowing record. The amplitude setting scales how vividly the colors respond, while lambda governs the smoothing that keeps the interpolation stable, and the Laplacian threshold sets how strong a local difference must be before it earns its color.
Put the sensor-anchored color patches together with the anatomical rendering and those tuning controls, and the display resolves into a clear, spatially sharpened portrait of the brain's surface activity captured at one precise moment in time.
Source localization tackles the inverse problem, the fact that many arrangements of cortical generators can produce the same pattern of scalp voltages. The LORETA family estimates cortical sources within three-dimensional voxels tied to Talairach coordinates, and successive refinements have built on the original: sLORETA trades absolute current units for lower noise, eLORETA achieves exact, zero-error localization for a single point source without thereby resolving multiple or distributed sources, and swLORETA weights source distances and references a normative database. Because the solution space is restricted to cortical gray matter (plus hippocampus in the original implementation), these inverse solutions cannot resolve structures such as the thalamus or amygdala. Surface Laplacian analysis takes a different route, mapping radial current flow between cortex and scalp while making no assumptions about tissue conductivity and remaining independent of the recording reference. Together these methods sharpen the blurred picture that volume conduction imposes on the raw scalp EEG and help clinicians link surface findings to their likely cortical origins.
Clinically Significant Raw Waveforms
Clinically significant raw waveforms include kappa rhythm, lambda waves, vertex sharp transients, mu waves, spike and wave, isolated epileptiform discharges, SMR, sleep spindles, and K-complexes.
Kappa Rhythm
The kappa rhythm consists of very low amplitude activity in the alpha or theta range detected over temporal sites during mental activity. Their source (cortical effort or eyelid flutter) is controversial (Fisch, 1999).
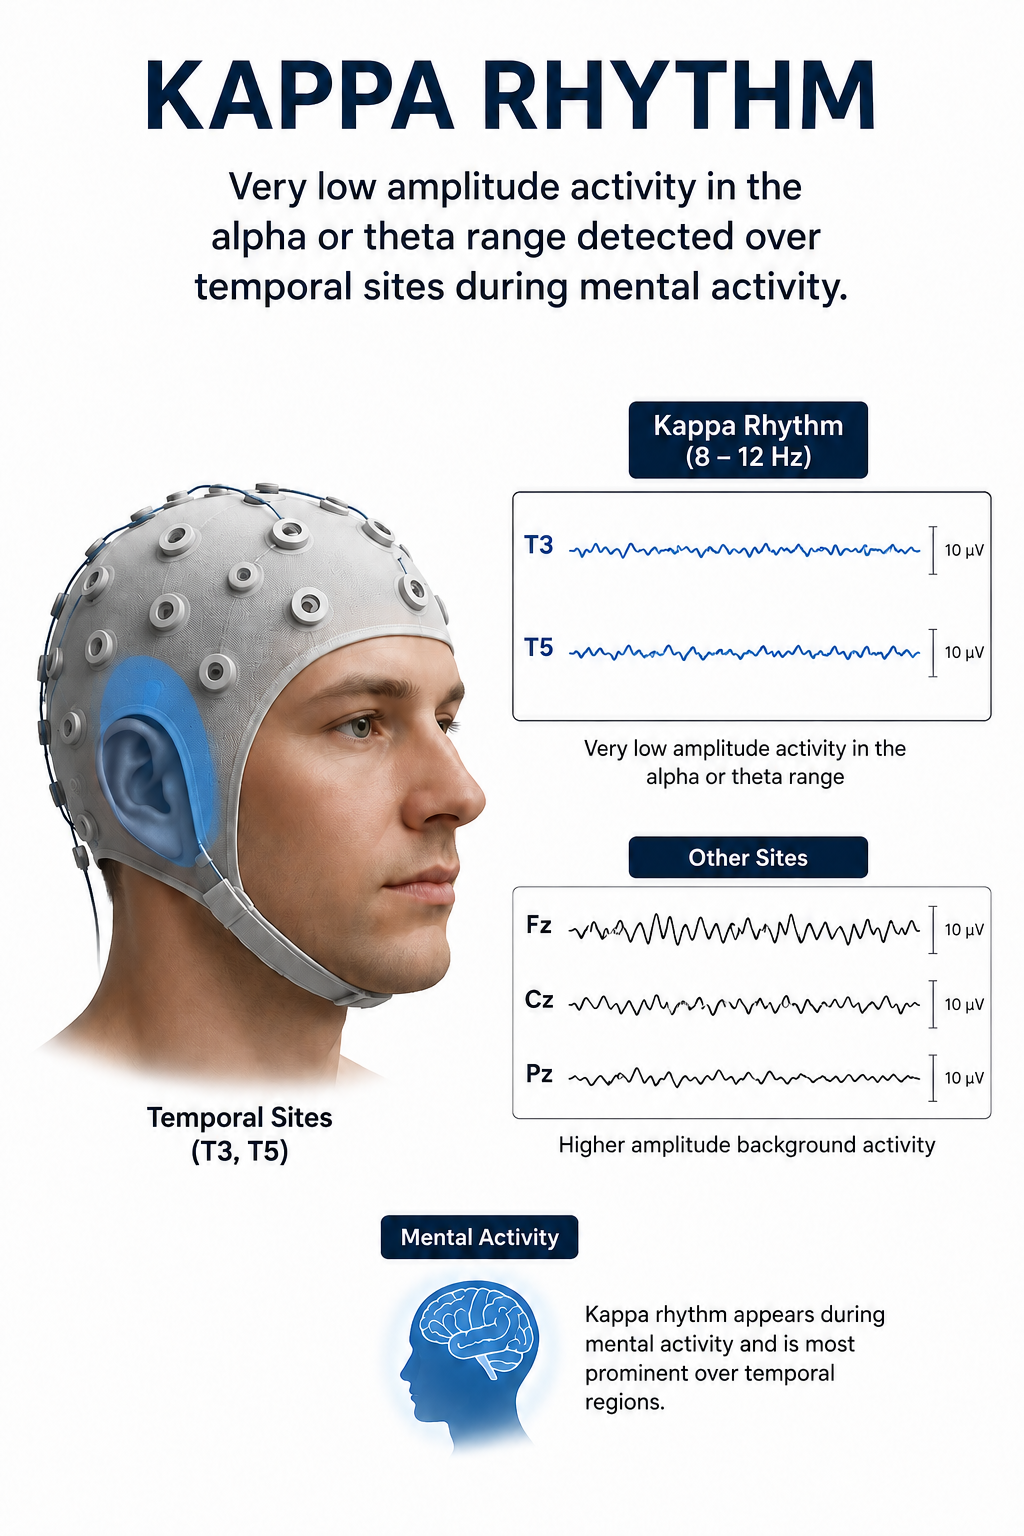
Lambda Waves
Lambda waves are positive sawtooth-shaped sharp transients detected from occipital sites when individuals view detailed images. Lambda waves last about 100-250 ms and are usually below 50 μV. They are morphologically analogous to — but distinct from — positive occipital sharp transients of sleep (POSTs), which arise spontaneously during sleep rather than in response to visual scanning. These waves won't be observed in clinical EEGs unless the assessment includes viewing complex images. While the presence or absence of lambda waves is not abnormal, striking asymmetry may indicate an abnormality located on the lower amplitude side (Fisch, 1999). We adapted this graphic from © eegatlas-online.com.
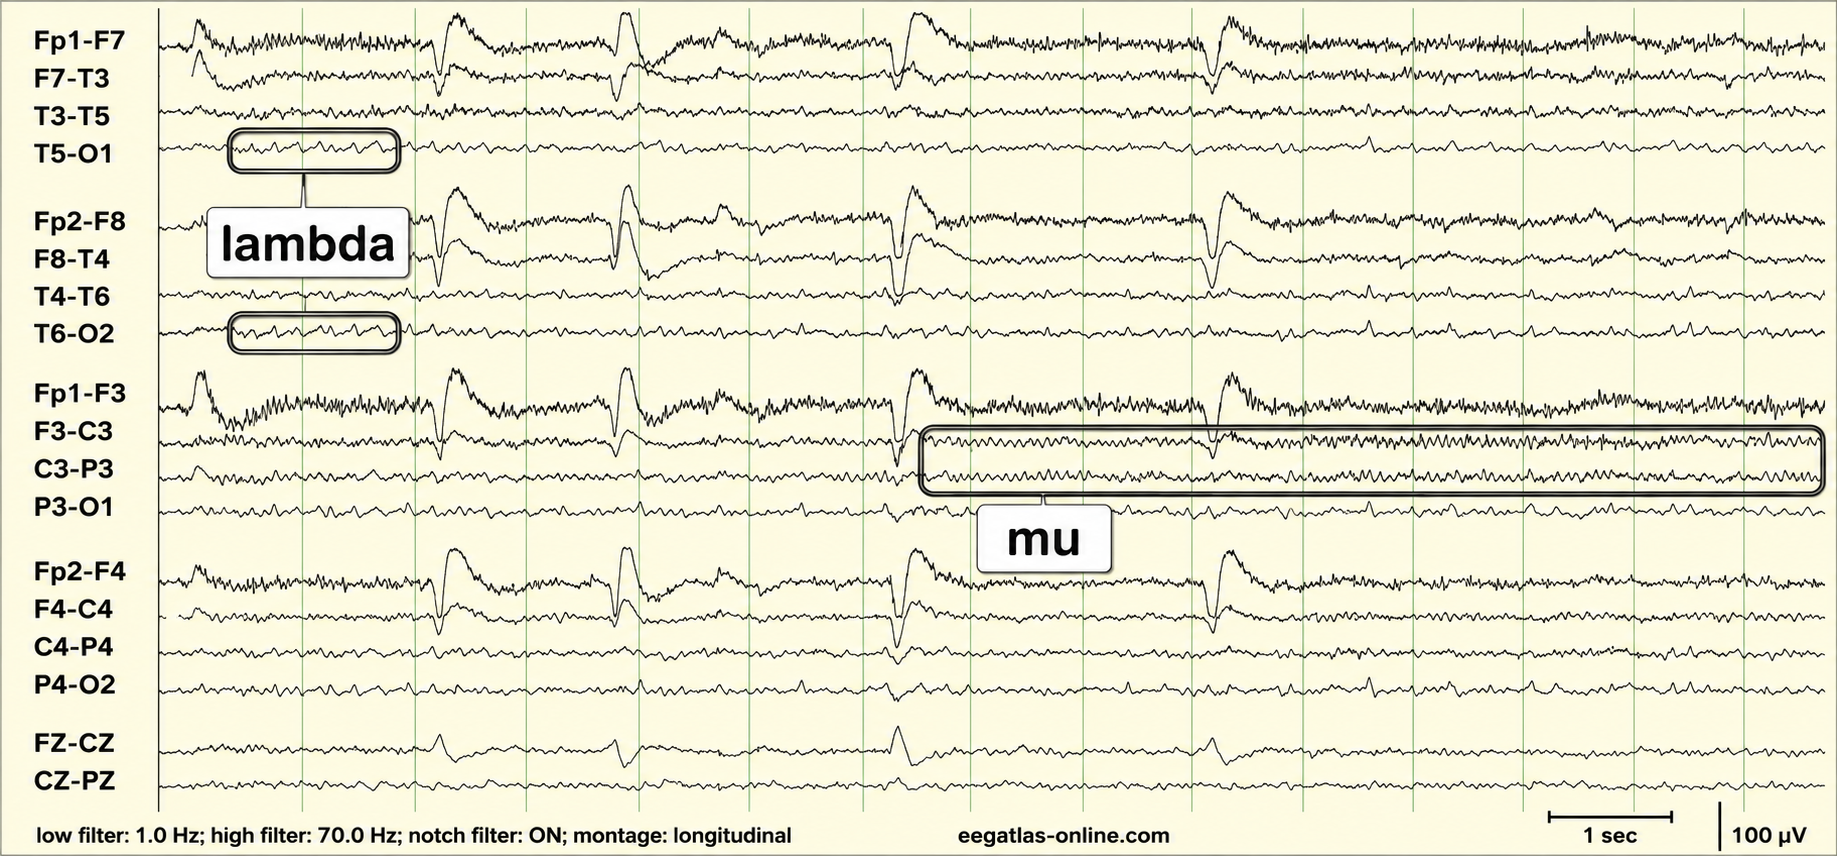
This display captures two benign, physiological rhythms living side by side on the same page, each announcing itself in a different part of the head. The tracing runs left to right in time, and two labels do the teaching. Over the posterior channels, a run of sharp, triangular deflections is marked lambda, the waveform the visual cortex produces as the eyes scan across a visual scene. Over the central channels, a band of smooth, rounded rhythm is marked mu, the resting rhythm of the sensorimotor strip that idles while the body holds still. Both are normal patterns, and the point of the display is to show you where each one belongs.
What a beginner most needs from this page is the discipline to read location and shape together. Lambda is posterior and pointed, riding the occipital derivations at the back of the head, appearing in bursts as the eyes make their scanning movements. Mu is central and rounded, sitting over the motor region and often carrying a comb-like arch. Read the electrode stack as a montage walking front to back down each hemisphere and along the midline, and the two rhythms sort themselves cleanly by address: the triangular events cluster at the occipital end of the chains while the smooth rounded rhythm holds the central links. Two normal patterns, two neighborhoods.
That posterior-versus-central sorting is the feature to internalize, because both patterns are healthy visitors rather than signs of trouble, and confusing either with something pathological is the classic beginner error. Lambda is nothing more than the visual system responding to a busy world, and mu is nothing more than the motor system resting, waiting to be interrupted by the slightest movement or even the intention to move. Recognizing them for the benign rhythms they are, and knowing precisely where on the scalp to expect each, is exactly the skill this display is built to demonstrate.
The settings anchor your confidence in what you see. Printed along the bottom, the bandpass runs from one to seventy hertz with the notch filter switched on, so mains interference is suppressed and the waveforms are genuine physiology. The calibration marks in the corner give you two rulers, a horizontal bar spanning one second to time the rhythms and a vertical bar spanning 100 microvolts to gauge their modest amplitude.
Put the pointed posterior lambda together with the rounded central mu, sorted by their scalp locations and confirmed by the clean filter settings, and the display resolves into a clear side-by-side demonstration of two normal rhythms and the neighborhoods where each one lives.
Vertex Sharp Transients
Negative polarity vertex sharp transients (V waves) are detected at the vertex in sleep records but are not usually observed during wakefulness. Rare in adults and more easily elicited in children, V waves may be evoked by unexpected stimuli like clapping. They may be a late evoked potential component independent of sensory modality and not confined to a specific sensory region. Their amplitude is greater during sleep than wakefulness (Fisch, 1999).
We adapted this graphic from © eegatlas-online.com. This is a teaching-style EEG in the longitudinal montage, and the header tells you the state up front: this is a page of Stage 2 sleep, laid out to introduce the handful of signature waveforms that define it. The chains run in the usual way with an EKG in orange along the bottom and a 100 microvolt, 1-second marker for scale, but the real content is the set of labeled boxes scattered across the page, each one framing and naming a different hallmark of light sleep.
The beginner's temptation is to read the page as one continuous rhythm and try to grade the background. The move that unlocks it is to treat the page as a labeled catalog, letting each box teach you one distinct graphoelement by its shape and its location, then recognizing that the whole collection is what stamps the record as Stage 2 sleep.
Start at the lower left, where the box marks POSTS, the positive occipital sharp transients of sleep. Down in the occipital rows (T6-O2 and its neighbors) you see a little run of crisp, sharp, repeating transients riding in the back of the head, checkmark-like deflections that cluster during drowsy sleep. Move to the center of the page and the tall vertical box labels the vertex wave: a single sharp, pointed deflection that is biggest right over the top of the head in the central and midline channels (the Fz-Cz and Cz-Pz region), a lone spike of sleep. Just to its right, the sleep-spindle box catches a brief, beautiful burst of fast rhythmic activity that waxes and wanes like a spindle of thread, again maximal over the central regions.
Then the largest box on the right frames the K complex: a big, slow, biphasic wave with a sharp component and a broad following swing, dominant over the front-central head and towering above everything around it. Together these are the classic furniture of light sleep, each with its own shape and its own preferred spot on the scalp.
Mu Waves
The mu rhythm is reported in roughly 17-20% of routine EEG records in adolescents and young adults, with higher estimates when it is actively sought using appropriate montages (Kane et al., 2017). These 7- to 11-Hz waves resemble wickets and appear as several-second trains over sensorimotor, and less commonly, parietal sites. View the raw EEG at C3 and C4. Mu attenuates during both self-generated and observed movement, which led to its use as a putative index of mirror-neuron activity, including in autism research. That interpretation is now widely questioned: methodological reviews conclude that mu suppression has not produced robust evidence for mirror-neuron involvement in action understanding, empathy, or autism, and EEG findings do not support the "broken mirror" account of autism spectrum disorder (Hobson & Bishop, 2016, 2017). Clinicians inhibit mu activity during training and do not reinforce mu amplitude (Demos, 2019).
Clinicians must distinguish the mu rhythm from alpha since they share common frequencies. Alpha waves are sinusoidal instead of wicket-shaped. Mu activity increases when clients reduce motor activity. Mainly contralateral mu activity is suppressed by making a fist, while alpha is not. The alpha rhythm is blocked when clients open their eyes; the mu rhythm is unaffected. Waveforms evoked by visual scanning are lambda waves, recorded over the occipital regions, not mu (Demos, 2019; Fisch, 1999). This graphic © J. S. Anderson.
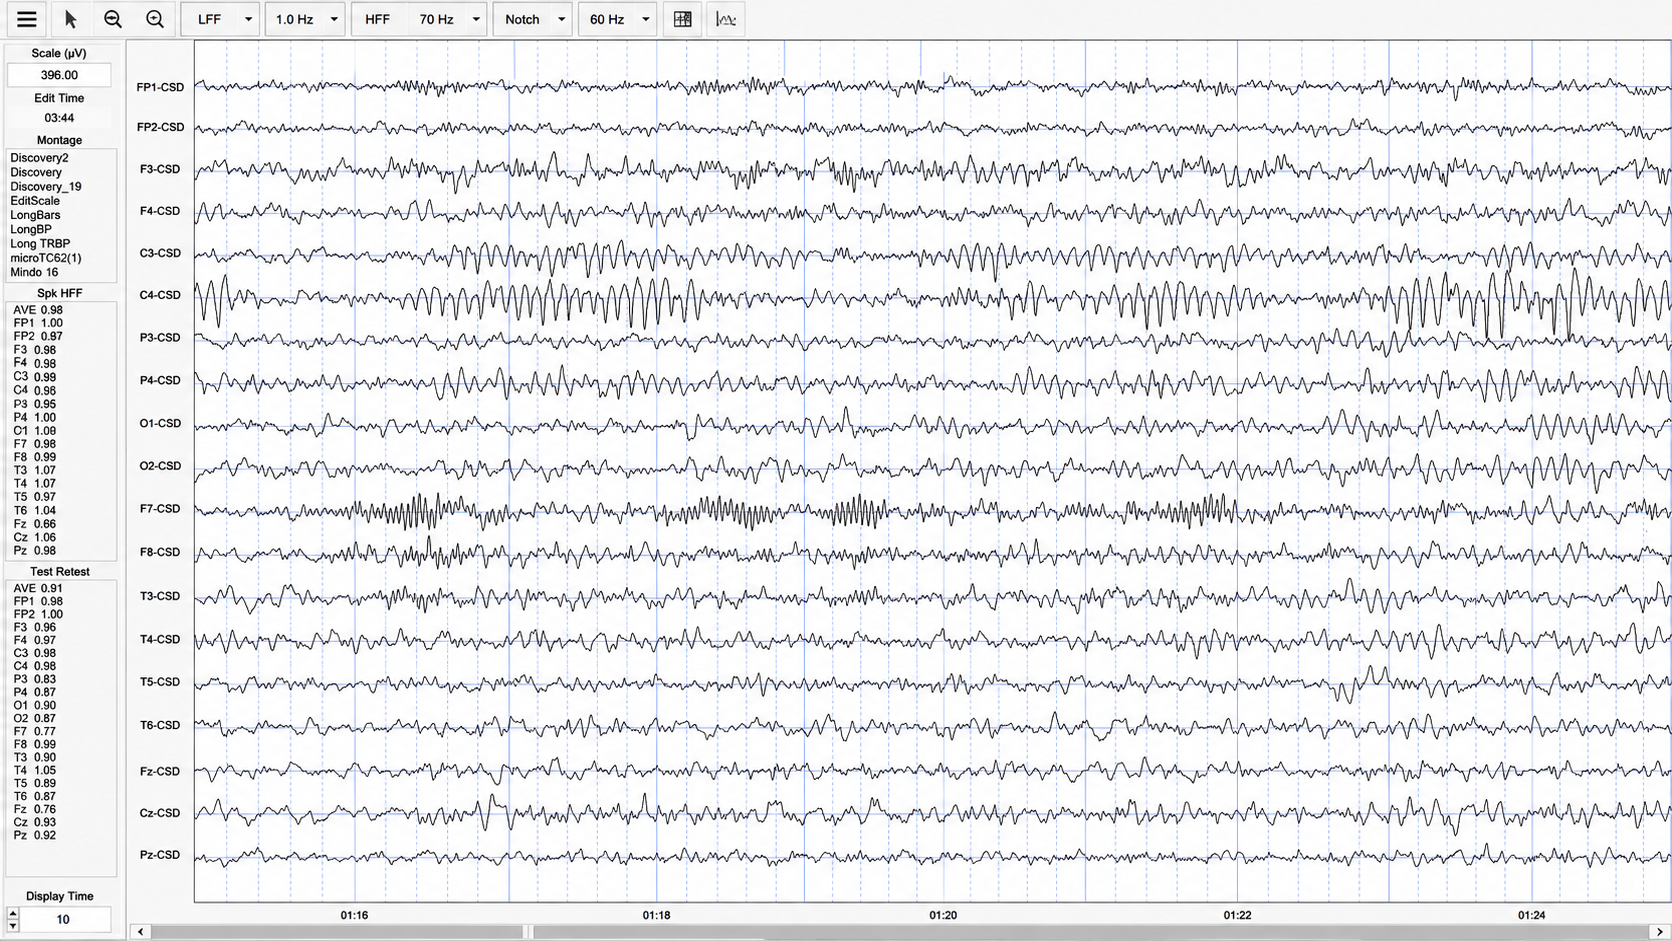
This display captures a live recording rendered through a source-sharpening montage. Every channel label carries the suffix CSD, for current source density, the digital Laplacian that recomputes each site by contrasting it with its neighbors. That single choice governs everything you see. Where a standard montage smears activity across the scalp, this one tightens each trace down to the cortex directly beneath the sensor, so the rhythms marching across the page are local signals rather than distant activity conducted in from elsewhere. The timeline along the bottom ticks in seconds, and the whole head is busy with brisk, well-formed rhythmic waves.
What a beginner most needs to grasp is that the montage is doing interpretive work before you ever read a wave. Because CSD emphasizes focal sources, a rhythm that shows up strongly on one channel and fades on its neighbors is telling you the generator sits right there, not next door. Read the electrode stack as a map walking front to back across the frontal, central, temporal, parietal, and occipital rows, and you can follow where each rhythm lives rather than treating the page as one undifferentiated blur. The activity here is high in amplitude and rhythmic across much of the head, and the Laplacian is precisely what lets you assign it to real scalp neighborhoods.
The panels down the left edge are the part beginners skip and shouldn't, because they are the display's built-in honesty check. Columns of per-channel numbers, most hovering right around one, are reliability coefficients, split-half and test-retest style, reporting how consistently each electrode reproduces its own signal. Values clustered near unity are the display quietly certifying that this is a clean, stable, trustworthy record rather than one riddled with drifting or noisy sensors. Learning to glance at those numbers before interpreting the waveforms is what separates a careful reader from a hopeful one.
The control strip across the top supplies the settings that let you trust the shapes. The low filter sits at one hertz and the high filter at seventy, with the notch engaged at sixty to strip out mains interference, and a sensitivity value scales how tall the waves are drawn.
Put the source-sharpened CSD traces together with the anatomical read of the electrode rows, the near-perfect reliability metrics, and the clean filter settings, and the display resolves into a clear, spatially focused, quality-verified window onto the brain's rhythmic activity as it unfolds second by second.
Suppose a clinician training an ADHD client to increase the sensorimotor rhythm at C3 sees rhythmic activity near 10 Hz and wonders whether alpha is intruding on the reward. Several checks settle the question. Alpha is sinusoidal, whereas mu is arch-shaped like a row of wickets, and the two respond differently to simple maneuvers. Opening the eyes blocks alpha but leaves mu intact, while making a contralateral fist suppresses mu but not alpha. Recognizing mu matters clinically because clinicians typically inhibit it rather than reward its amplitude, so mistaking mu for a trainable rhythm would push the protocol in the wrong direction.
Spike-and-Wave Complexes
Spike-and-wave complexes consist of a spike that is succeeded by a slow wave.
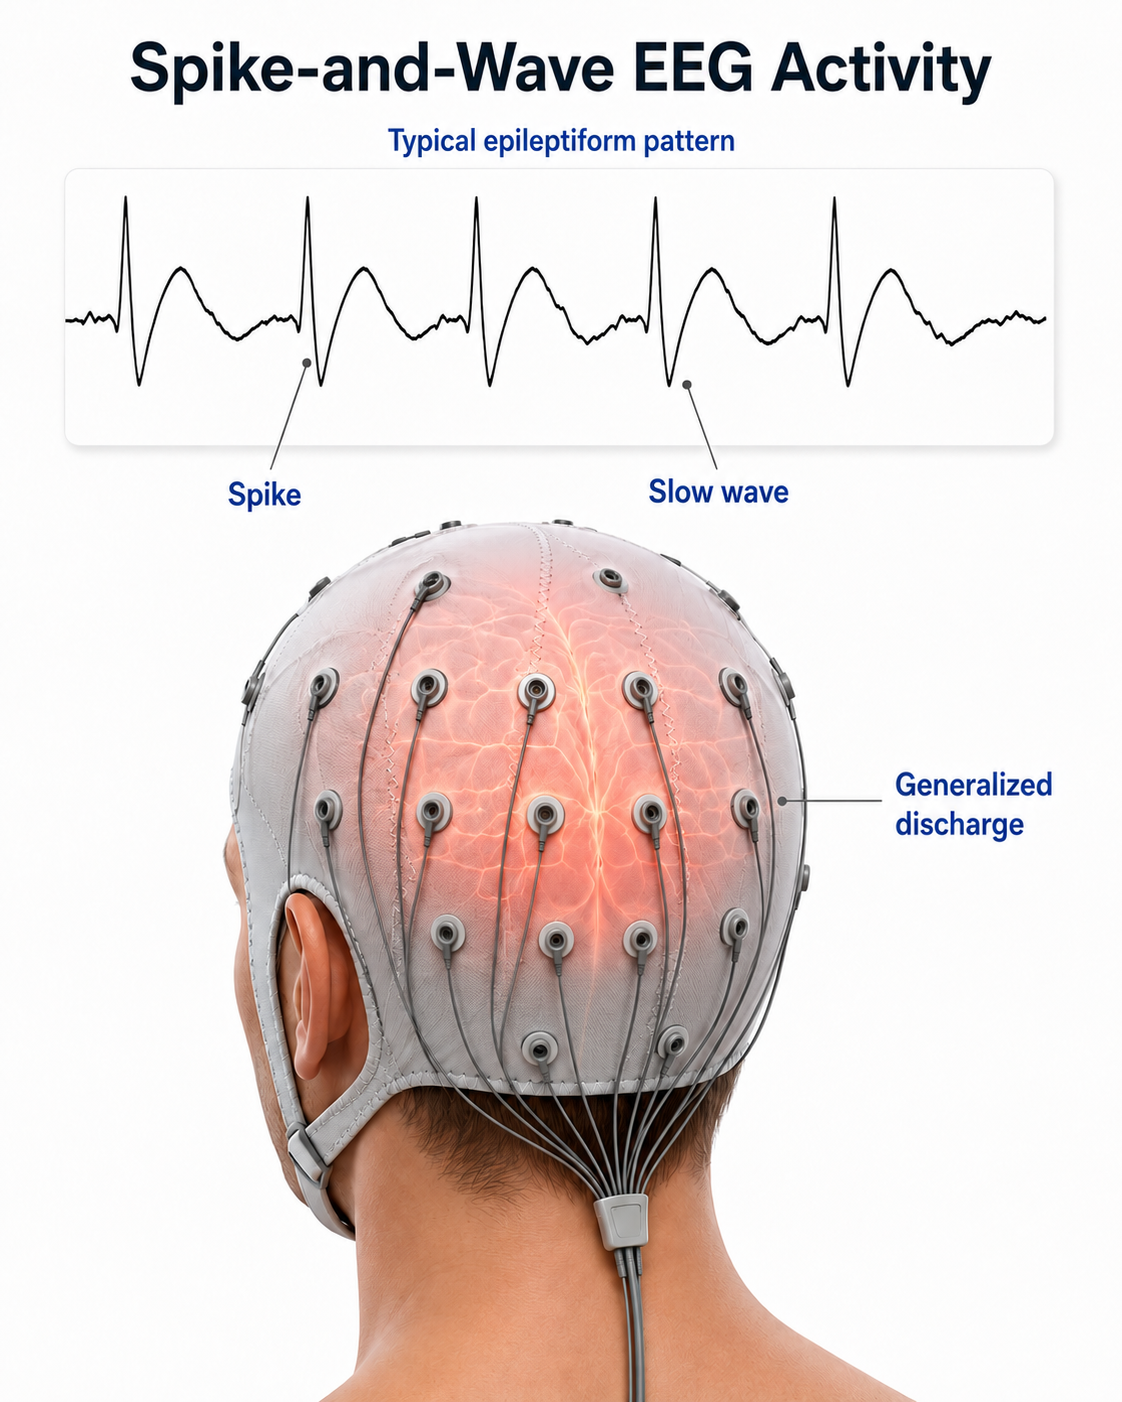
Isolated Epileptiform Discharges
Swatzyna et al. (2022) addresses the prevalence of isolated epileptiform discharges (IEDs) in children and adolescents with psychiatric disorders, emphasizing the potential benefits of EEG in predicting medication response. IEDs are spike and wave or sharp and slow wave patterns observed in EEG recordings of individuals who do not have clinical seizures. These discharges are subclinical, meaning they do not manifest as observable seizure activity but indicate underlying neuronal hyperexcitability. IED graphic © Dr. Ronald Swatzyna.
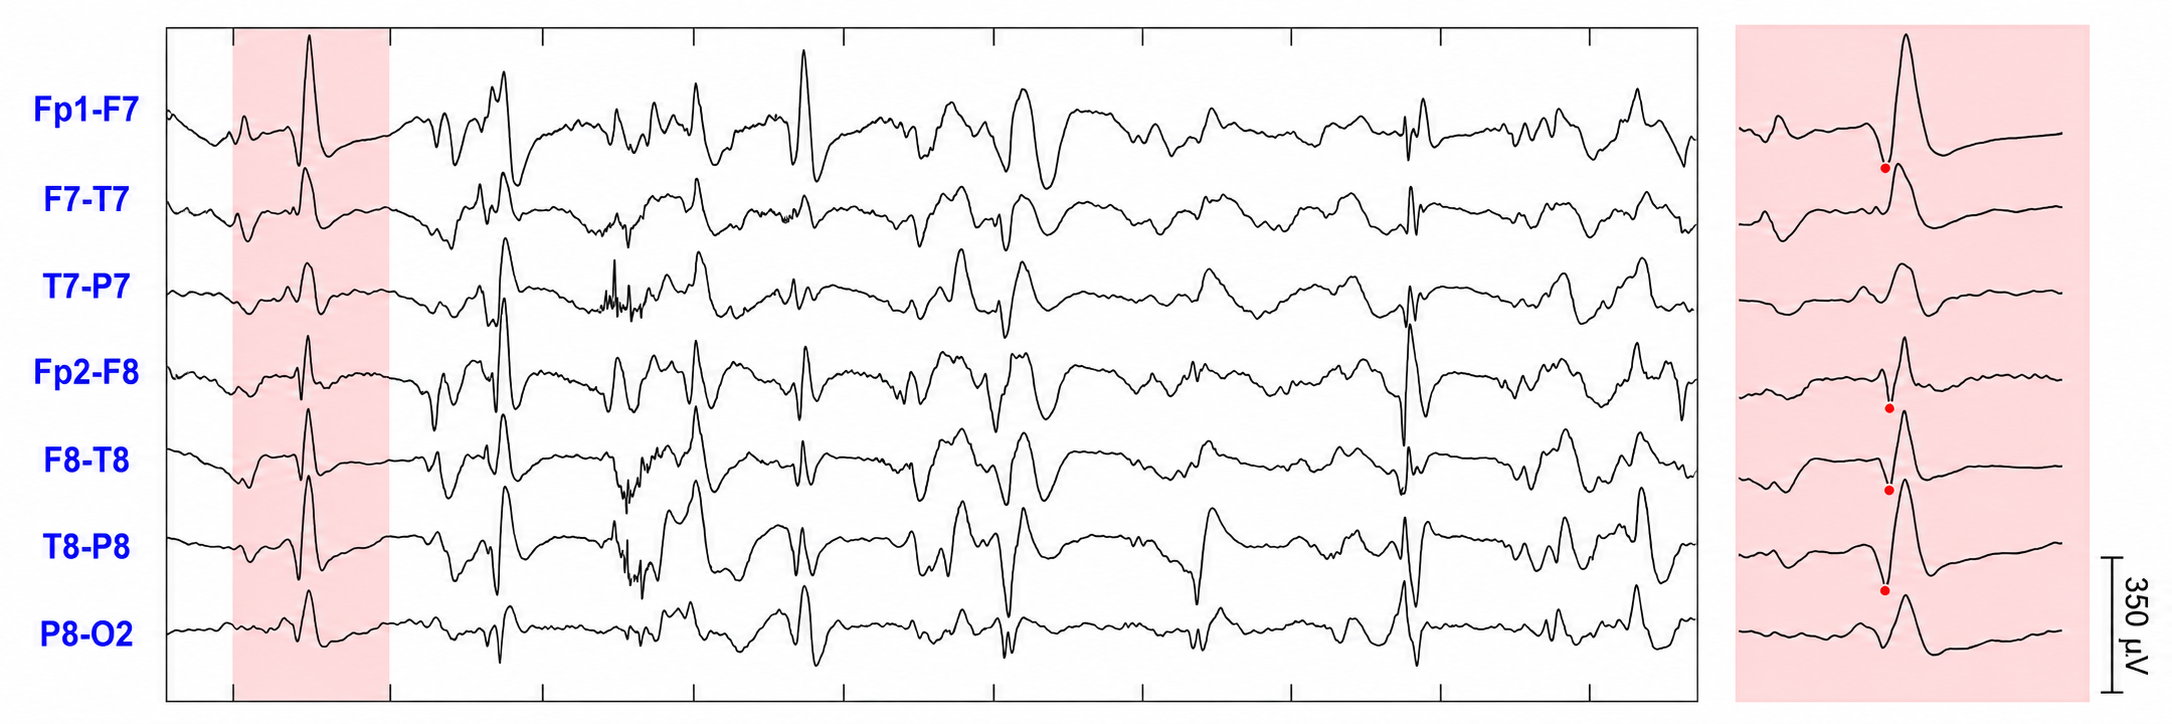
This display captures repeating isolated epileptiform discharges and then hands you a magnifying glass to inspect one of them up close. The main panel on the left runs left to right in time across the temporal chains, crowded with sharp, high-voltage deflections that recur again and again through the record. A single one of those events is tinted and pulled out into the tall panel on the right, blown up so you can study its anatomy in detail. That pairing, the busy overview beside the isolated close-up, is the whole design: see that the discharges repeat, then see exactly what one is made of.
What a beginner most needs from this page is to read the enlarged event as a map of timing, not just a picture of a spike. The red dots stepping down the zoomed panel are the key. They mark the peak of the discharge on each successive channel, and their staggered positions trace a small march from one derivation to the next. Follow that diagonal of dots and you are watching the discharge propagate, spreading across the temporal region in a definite direction rather than erupting everywhere at once. That sense of a traveling event, seen because the peaks do not line up vertically, is the feature the close-up exists to reveal.
Reading the electrode stack as a map is what makes the propagation legible. The channels walk down the temporal chains of both hemispheres, so the ordered descent of the red markers corresponds to real movement across the scalp, letting you infer where the discharge begins and where it heads. In the left panel the same waveforms recur without those markers, establishing that this is a repeating pattern; on the right, the annotation turns one instance into a lesson in sequence and spread. Overview for frequency, close-up for direction.
The calibration mark anchors your read of magnitude. The vertical bar in the corner spans 350 microvolts, a tall ruler that tells you these are genuinely high-voltage discharges, their prominence a matter of real amplitude rather than a trick of scaling.
Put the recurring events in the wide panel together with the peak-tracking red dots in the magnified one, read across the temporal montage, and gauge the height against that 350-microvolt scale, and the display resolves into a clear demonstration of interictal epileptiform discharges caught both in their repetition and in the moment-to-moment sequence of their spread.
A systematic literature review was conducted using the PubMed/Medline database, focusing on publications from 1994 onwards, which align with DSM-IV criteria. The search included terms related to epileptiform discharges and various psychiatric disorders, excluding studies not in English, those with non-human subjects, and those involving epilepsy. Additionally, a cross-sectional data review was performed using an IRB-approved archive from a psychiatric practice in Houston, Texas, encompassing EEG data from 722 children and adolescents aged 4-18.
Their systematic review identified 18 studies, revealing varying prevalence rates of IEDs across psychiatric disorders. For ADHD, the prevalence ranged from 16.1% to 34.8%, with a weighted mean prevalence of 25.2%. For ASD, prevalence rates were consistently high, ranging from 23.5% to 85.8%, with a weighted mean of 63.3%. Mood disorders had a lower prevalence, approximately 3% for non-psychotic mood disorders. The cross-sectional analysis showed similar prevalence rates for ADHD (36.9%) and ASD (34.8%), but higher rates for mood (38.9%) and anxiety disorders (39.1%), likely due to selection bias in the clinical sample.
The high prevalence of IEDs in ADHD and ASD suggests the need for more research to understand their role in these disorders' pathophysiology and treatment. The identification of IEDs could help in avoiding inappropriate medications that might exacerbate symptoms. The study highlights the importance of using EEG to guide medication selection, particularly in refractory psychiatric cases, to improve treatment outcomes and reduce the trial-and-error approach.
Research has also explored the implications of isolated epileptiform discharges in non-epileptic conditions. For example, these discharges have been observed in individuals with cognitive impairments, such as those with Alzheimer’s disease or developmental disorders. Understanding the broader impact of these discharges on brain function remains an active area of investigation, with potential implications for both diagnosis and intervention. An example is the use of EEG characteristics to predict the driving safety of individuals with isolated spike-wave discharges, as these transients can be associated with slow response times and/or missed responses.
Sensorimotor Rhythm (SMR)
The 12-15 Hz spindle-shaped sensorimotor rhythm (SMR) is detected from the sensorimotor strip when individuals reduce attention to sensory input and reduce motor activity. Where we observe these frequencies at other scalp locations, they appear as desynchronized beta without spindling. Since SMR is associated with mental calm and thinking before acting, clinicians may uptrain this rhythm in clients diagnosed with ADHD (Thompson & Thompson, 2015). Graphic created by Siyang Yin.
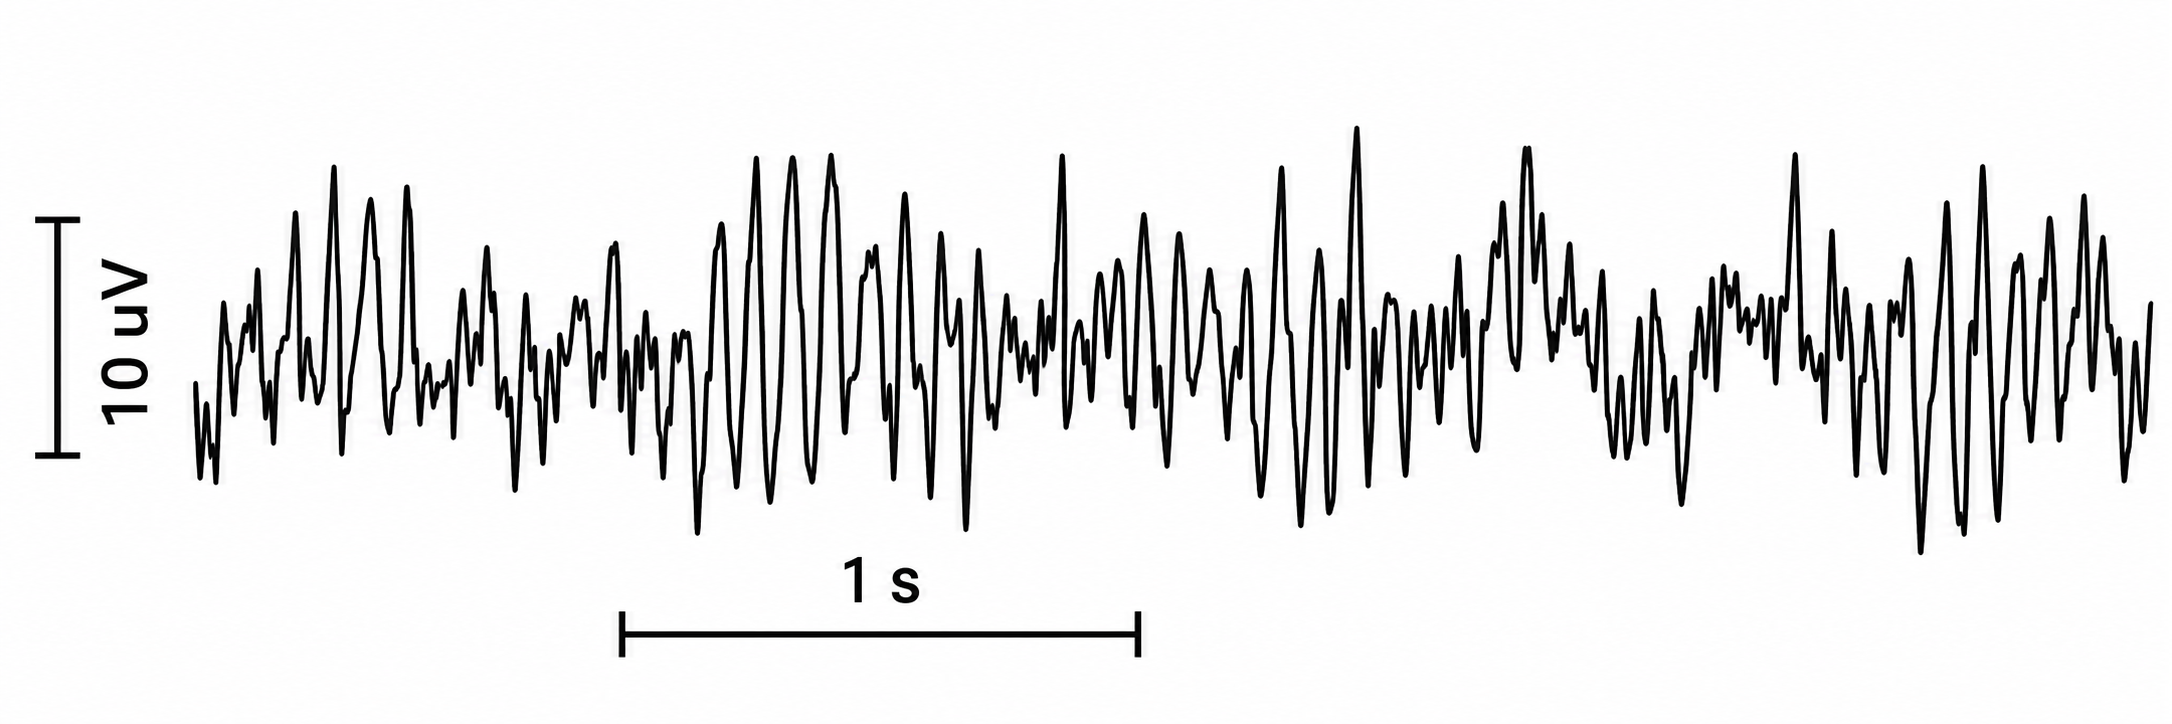
Sleep Spindles
Sleep spindles are trains of 11-16 Hz waves, most commonly 12-14 Hz, lasting at least 0.5 seconds. They resemble SMR spindles, overlap them in frequency, and like SMR are maximal over the central derivations — the reason C3 and C4 are the standard detection sites. They define Stage 2 sleep and may persist into Stage 3 (American Academy of Sleep Medicine scoring criteria; Thompson & Thompson, 2015). we adapted this graphic from © eegatlas-online.com.
We adapted this graphic from © eegatlas-online.com. This is a teaching-style EEG in the longitudinal montage, and the header tells you the state up front: this is a page of Stage 2 sleep, laid out to introduce the handful of signature waveforms that define it. The chains run in the usual way with an EKG in orange along the bottom and a 100 microvolt, 1-second marker for scale, but the real content is the set of labeled boxes scattered across the page, each one framing and naming a different hallmark of light sleep.
The beginner's temptation is to read the page as one continuous rhythm and try to grade the background. The move that unlocks it is to treat the page as a labeled catalog, letting each box teach you one distinct graphoelement by its shape and its location, then recognizing that the whole collection is what stamps the record as Stage 2 sleep.
Start at the lower left, where the box marks POSTS, the positive occipital sharp transients of sleep. Down in the occipital rows (T6-O2 and its neighbors) you see a little run of crisp, sharp, repeating transients riding in the back of the head, checkmark-like deflections that cluster during drowsy sleep. Move to the center of the page and the tall vertical box labels the vertex wave: a single sharp, pointed deflection that is biggest right over the top of the head in the central and midline channels (the Fz-Cz and Cz-Pz region), a lone spike of sleep. Just to its right, the sleep-spindle box catches a brief, beautiful burst of fast rhythmic activity that waxes and wanes like a spindle of thread, again maximal over the central regions.
Then the largest box on the right frames the K complex: a big, slow, biphasic wave with a sharp component and a broad following swing, dominant over the front-central head and towering above everything around it. Together these are the classic furniture of light sleep, each with its own shape and its own preferred spot on the scalp.
K-Complexes
K-complexes are also observed in Stage 2 sleep. These well-delineated sharp negative waveforms, succeeded by a more prolonged positive component, stand out from the background and have a total duration of at least 0.5 seconds, with maximal amplitude in frontal derivations. The AASM sets no minimum amplitude for a K-complex, though K-complexes are typically the highest-amplitude waveform in the NREM record. (The ≥75 µV peak-to-peak criterion that is sometimes applied here belongs to a different definition — slow wave activity, 0.5-2 Hz over frontal derivations, used to score stage N3.)
We adapted this graphic from © eegatlas-online.com. This is a teaching-style EEG in the longitudinal montage, and the header tells you the state up front: this is a page of Stage 2 sleep, laid out to introduce the handful of signature waveforms that define it. The chains run in the usual way with an EKG in orange along the bottom and a 100 microvolt, 1-second marker for scale, but the real content is the set of labeled boxes scattered across the page, each one framing and naming a different hallmark of light sleep.
The beginner's temptation is to read the page as one continuous rhythm and try to grade the background. The move that unlocks it is to treat the page as a labeled catalog, letting each box teach you one distinct graphoelement by its shape and its location, then recognizing that the whole collection is what stamps the record as Stage 2 sleep.
Start at the lower left, where the box marks POSTS, the positive occipital sharp transients of sleep. Down in the occipital rows (T6-O2 and its neighbors) you see a little run of crisp, sharp, repeating transients riding in the back of the head, checkmark-like deflections that cluster during drowsy sleep. Move to the center of the page and the tall vertical box labels the vertex wave: a single sharp, pointed deflection that is biggest right over the top of the head in the central and midline channels (the Fz-Cz and Cz-Pz region), a lone spike of sleep. Just to its right, the sleep-spindle box catches a brief, beautiful burst of fast rhythmic activity that waxes and wanes like a spindle of thread, again maximal over the central regions.
Then the largest box on the right frames the K complex: a big, slow, biphasic wave with a sharp component and a broad following swing, dominant over the front-central head and towering above everything around it. Together these are the classic furniture of light sleep, each with its own shape and its own preferred spot on the scalp.
How Do The Mu and SMR Rhythms Differ?
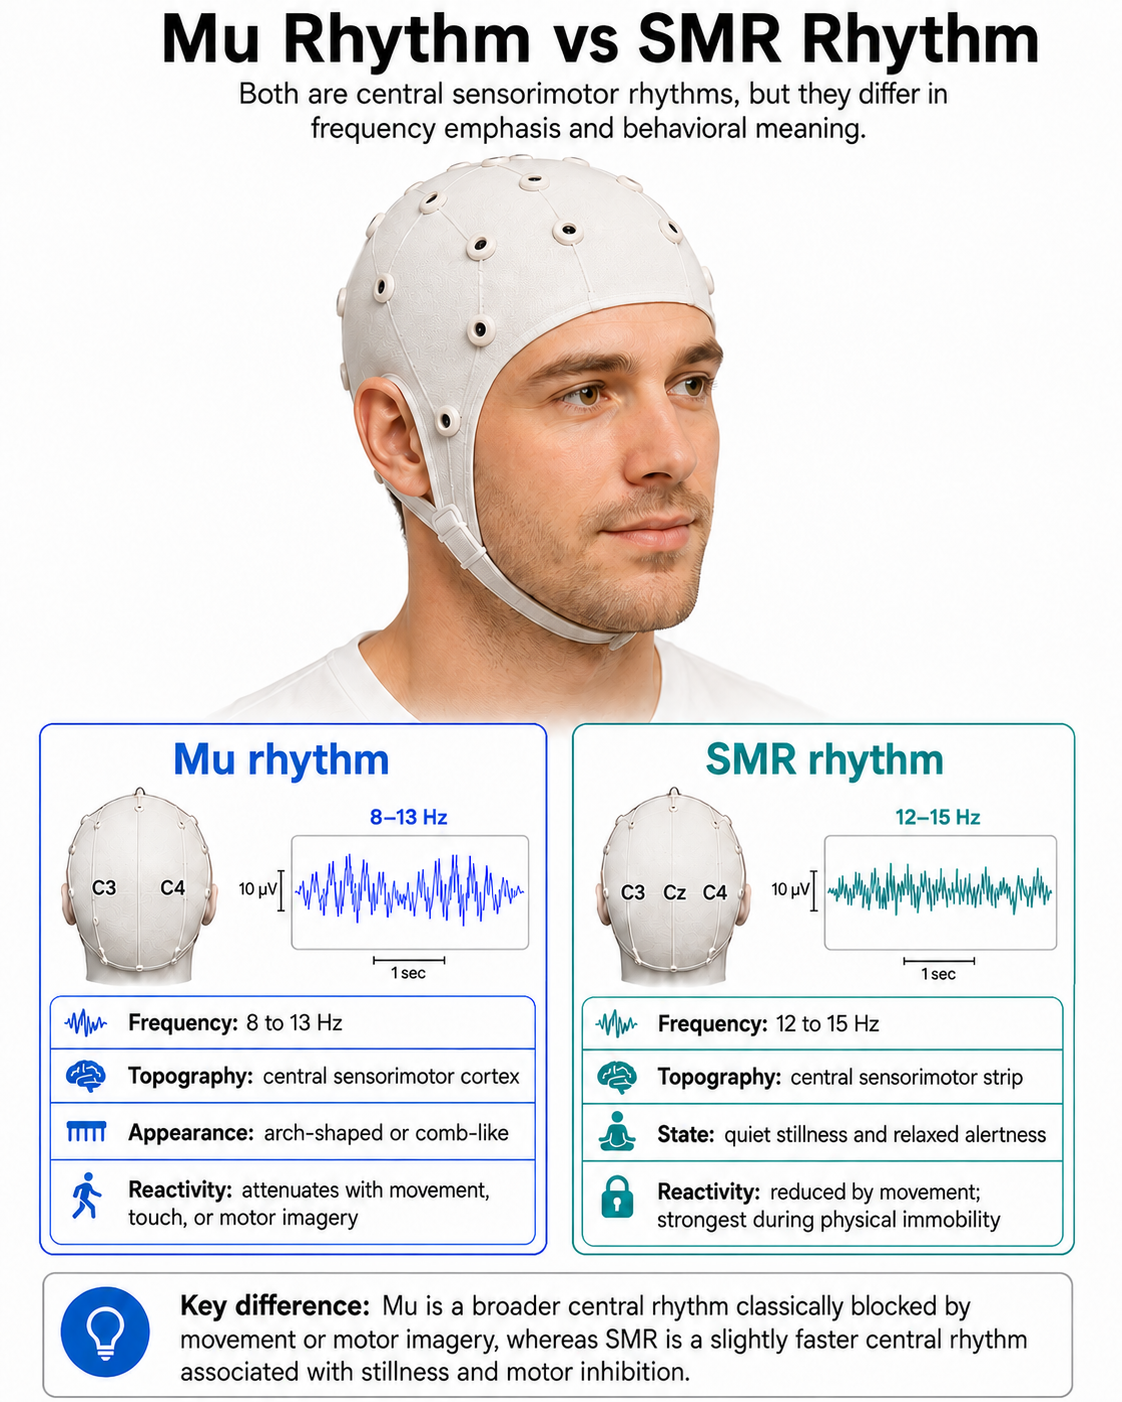
Glossary
aliasing: a sampling error in which a frequency above half the sampling rate is misrepresented as a lower frequency in the digitized signal.
alpha blocking: the replacement of the alpha rhythm by low-amplitude desynchronized beta activity during movement, attention, mental effort like complex problem-solving, and visual processing. alpha blocking normally occurs when eyes have just been opened. Arousal and specific forms of cognitive activity may reduce alpha amplitude or eliminate it while increasing EEG power in the beta range.
alpha harmonics: rhythmic activity appearing at an exact multiple of the primary alpha frequency, typically near 18-19 Hz, that arises from nonlinear waveform distortion rather than from a separate neural generator.
alpha response: increased alpha amplitude.
alpha rhythm: 8-12-Hz activity that depends on the interaction between rhythmic burst firing by a subset of thalamocortical (TC) neurons linked by gap junctions and rhythmic inhibition by widely distributed reticular nucleus neurons. Researchers have correlated the alpha rhythm with relaxed wakefulness. Alpha is the dominant rhythm in adults and is located posteriorly. The alpha rhythm may be divided into alpha 1 (8-10 Hz) and alpha 2 (10-12 Hz).
alpha spindles: trains of alpha waves that are visible in the raw EEG and are observed during drowsiness, fatigue, and meditative practice
amplitude: the height of a wave, indicating the strength or intensity of a signal.
amyloid-beta: a protein fragment that accumulates in the brains of individuals with Alzheimer's disease, forming plaques.
analog: the representation of a signal by a continuously variable physical property like voltage.
analog filter: analog circuits designed using components like capacitors, resistors, and operational amplifiers designed to remove or enhance signal components.
analog-to-digital (A/D) converter: an electronic device that converts continuous signals to discrete digital values.
astrocytes: a type of glial cell that supports neuronal function and modulates the extracellular environment, and that contributes to the generation of slow cortical potentials.
asynchronous waves: EEG activity where neurons depolarize and hyperpolarize independently.
attention: the cognitive process of selectively concentrating on one aspect of the environment while ignoring others.
attention-deficit hyperactivity disorder (ADHD): a neurodevelopmental disorder characterized by symptoms of inattention, hyperactivity, and impulsivity.
Bereitschaftspotential (BP): the readiness potential; a slow negative cortical potential that precedes a self-paced voluntary movement and reflects the planning and initiation of motor action.
beta asymmetry: an uneven distribution of beta activity between the two hemispheres, observed as a difference in the amplitude or power of beta recorded over corresponding regions. The side with reduced relative beta power points to the pathological hemisphere.
beta rhythm: 13-30-Hz activity (definitions vary; some authors extend the band to 12-38 Hz) associated with arousal and attention generated by brainstem mesencephalic reticular stimulation that depolarizes neurons in both the thalamus and cortex. The beta rhythm can be divided into multiple ranges: beta 1 (12-15 Hz), beta 2 (15-18 Hz), beta 3 (18-25 Hz), and beta 4 (25-38 Hz).
beta spindles: trains of spindle-like waveforms, most often frontocentral, with a reported mean frequency of 20.6 Hz (SD = 4.1 Hz) spanning roughly 14-30 Hz. They may signal ADHD, especially with tantrums, anxiety, autistic spectrum disorders (ASD), epilepsy, and insomnia.
beta spindling: sustained, rhythmic 18-30 Hz activity, usually frontal or frontocentral in distribution and non-reactive to eye opening, commonly associated with benzodiazepine or barbiturate use. It must be distinguished from posterior, reactive alpha harmonics.
binding problem: the question of how the brain integrates information from different sensory modalities to create a coherent perceptual experience.
bit: binary digit: the smallest measurement unit for quantifying information that assumes a value of 0 or 1.
bit number: the number of voltage levels that an A/D converter can discern. A resolution of 16 bits means that the converter can discriminate among 65,536 voltage levels.
brain lesions: abnormal tissue in the brain resulting from injury or disease, such as strokes, tumors, or trauma.
bursts of rhythmic temporal theta (BORTTs): transient periods of rhythmic theta activity observed in the temporal regions of the brain during EEG recording. These bursts typically manifest as short-lived increases in theta oscillations and are often associated with cognitive processes such as memory encoding and retrieval.
cerebral dysgenesis: brain malformation caused by abnormal development before birth, including defective formation of the cerebral cortex and improper organization of neural connections. It can produce neurological deficits, intellectual disability, and epilepsy, and it may increase beta activity in the EEG.
cognitive performance: the ability to use mental processes to perform tasks, including memory, attention, and executive function.
cognitive processes: mental activities involved in acquiring, storing, and using knowledge.
cognitive restoration: the process during sleep where the brain undergoes various activities that help improve mental functions, including memory consolidation and the clearance of metabolic waste.
complex: a series of waves that share a similar shape.
contingent negative variation (CNV): a slow cortical potential shift that develops between a warning stimulus and an imperative stimulus requiring a motor response. It reflects anticipation and motor preparation and involves regions such as the prefrontal cortex and supplementary motor area.
cortical negativity: a state in which the cortical surface carries a negative electrical potential, associated with depolarization and increased excitability.
cortical neurons: neurons located in the brain's cortex that play a key role in various brain functions, including the generation of delta waves.
cortical positivity: a state in which the cortical surface carries a positive electrical potential, associated with hyperpolarization and decreased excitability.
declarative memory: a type of long-term memory involving facts and information that can be consciously recalled.
deep brain stimulation (DBS): a neurosurgical procedure in which electrodes implanted in specific brain areas modulate neuronal activity, used in conditions such as Parkinson's disease.
delta waves: low-frequency brain oscillations ranging from 0.5 to 4 Hz, typically observed during deep stages of non-REM sleep.
depolarization: a reduction in membrane potential that makes the inside of a cell less negative relative to the outside, increasing the likelihood of firing.
desynchrony: pools of neurons fire independently due to stimulation of specific sensory pathways up to the midbrain and high-frequency stimulation of the reticular formation and nonspecific thalamic projection nuclei.
digital: representation of a signal property like voltage using a series of the digits 0 and 1.
digital filter: a circuit that uses digital processors, like a digital signal processing (DSP) chip, to remove or enhance signal components.
digitization: encoding analog information like continuously changing voltage into a series of the digits 0 and 1.
diphasic waves: waves that possess two elements--one positive and one negative.
dominant frequency: the frequency with the greatest amplitude; in awake adults it lies in the alpha band, 8-13 Hz and typically 9-11 Hz.
dynamic range: the ability to sample a wide range of signal voltages.
EEG activity: a single wave or series of waves.
electrophysiological techniques: methods used to study the electrical properties of biological cells and tissues.
encephalopathy: a broad term for any diffuse disease of the brain that alters brain function or structure, often characterized by altered mental states and various neurological symptoms.
epileptiform activity: abnormal, paroxysmal EEG patterns that resemble those seen in epilepsy, often indicating a predisposition to seizures.
epoch: signal sampling period; commonly, a 1-s sample of EEG activity.
exact low resolution brain electromagnetic tomography (eLORETA): a version of LORETA with exact, zero-error localization for a single point source and zero localization bias under specific noise assumptions; it does not localize multiple or distributed sources without error.
excitability: the readiness of neurons to respond to stimuli and generate action potentials; slow cortical potentials index this property directly.
excitatory neurons: neurons that increase the likelihood of a firing action potential in the recipient neuron.
fast alpha: EEG activity at the upper end of or beyond the conventional alpha band, comprising both a normal 11-13 Hz posterior dominant rhythm and harmonics near 18-19 Hz that are nonlinear extensions of a slower primary alpha generator.
Fast Fourier Transform (FFT): a mathematical transformation that converts a complex signal into component sine waves whose amplitude can be calculated.
FFT filter: a filter that uses Fast Fourier transforms to calculate the average voltage of an EEG signal's component frequencies for a specified period.
filter: an electronic circuit that removes or enhances signal components.
fine motor control: the ability to make small, precise movements, often involving the coordination of muscles and nerves.
FIR filter: a filter that continuously updates its averaging of EEG voltage with new data points.
frequency: the number of complete cycles that an AC signal completes in a second, usually expressed in hertz.
gamma: 30-100 Hz rhythm that includes the 38-42 Hz Sheer rhythm and is associated with learning and problem-solving, meditation, mental acuity, and peak brain function in children and adults.
gamma event-related synchronization (ERS): a phenomenon where gamma oscillations (30-100 Hz) in the brain become more synchronized in response to a specific event or stimulus, often associated with increased neural processing and cognitive functions such as attention and memory encoding.
gamma oscillations: brain waves in the frequency range of approximately 30 to 100 Hz, associated with various cognitive functions.
glial cells: non-neuronal cells of the central nervous system that support and protect neurons, communicate chemically with one another and with neurons, and contribute to the generation of slow cortical potentials.
glymphatic clearance system: a system in the brain responsible for removing waste products, which is more active during sleep.
harmonic distortion: a consequence of waveform asymmetry in which an oscillator generates multiples of its fundamental frequency, producing features such as alpha harmonics.
hertz (Hz): unit of frequency measured in cycles per second.
high beta: 20-35 Hz rhythm correlated with multi-tasking and optimal performance and anxiety, migraine, obsessive-compulsive disorder (OCD), rumination, and worry.
high-frequency filter (HFF; low-pass filter): a filter that attenuates frequencies above a cutoff frequency.
hippocampal-neocortical transfer: the process during sleep where information is transferred from the hippocampus to the neocortex for long-term storage.
hippocampus: a brain region involved in the formation and retrieval of memories.
homeostatic sleep regulation: the process by which the body balances sleep and wakefulness to maintain overall health, often indicated by the amount of delta activity.
hyperarousal: a state of increased psychological and physiological tension, often associated with anxiety and stress.
hyperpolarization: an increase in membrane potential that makes the inside of a cell more negative relative to the outside, decreasing the likelihood of firing.
IIR filter: a recursive filter that uses part of its output as input. IIR filters attenuate frequencies outside the bandpass more sharply than FIR filters with the same order, have greater time delay (that depends on frequency) due to greater filter sharpness, achieve faster computation due to their lower order, and are less stable than FIR filters.
infra-low frequency (ILF) neurofeedback: training that targets slow gradient shifts below the conventional EEG bands, also called infraslow neurofeedback, typically by rewarding gradual directional change in the cortical gradient with proportional feedback.
inhibitory neurons: neurons that decrease the likelihood of a firing action potential in the recipient neuron.
inverse problem: in EEG, the challenge of estimating which cortical sources produced a recorded pattern of scalp voltages, given that many source configurations can produce the same surface recording.
irregular waves: EEG waves that continuously change shape and duration.
isolated epileptiform discharges (IEDs): spike and wave or sharp and slow wave patterns observed in EEG recordings of individuals who do not have clinical seizures. These discharges are subclinical, meaning they do not manifest as observable seizure activity but indicate underlying neuronal hyperexcitability.
Joint time-frequency analysis (JTFA): an algorithm that computes values on each data point at rates up to 256 times per second without using a fixed epoch length. Where FFT simultaneously calculates amplitudes for all frequency bands, JTFA analyzes preselected bands.
kappa rhythm: very low amplitude activity in the alpha or theta range detected over temporal sites during mental activity.
K-complex: a well-delineated sharp negative waveform succeeded by a longer positive component, standing out from the background, with a total duration of at least 0.5 seconds and maximal amplitude in frontal derivations; observed in Stage 2 sleep. The AASM sets no minimum amplitude criterion.
lissencephaly: literally "smooth brain," a rare malformation marked by absent or underdeveloped gyri and sulci resulting from defective neuronal migration. It is typically accompanied by intellectual disability, seizures, and increased, often slower, beta activity.
long-term memory: the storage of information over an extended period.
low beta: 16-20 Hz rhythm associated with successful problem-solving.
low resolution electromagnetic tomography (LORETA): Pascual-Marqui's (1994) mathematical inverse solution to identify the cortical sources of 19-electrode quantitative data acquired from the scalp.
low-frequency filter (high-pass filter): a circuit that filters out low-frequency activity and passes only the frequencies above a set value (e.g., 1.6 Hz).
magnetoencephalography (MEG): a neuroimaging technique for mapping brain activity by recording magnetic fields produced by electrical currents occurring naturally in the brain.
magnitude: the average amplitude over a unit of time using quantification methods like peak-to-peak (P-P) and root mean square (RMS).
memory consolidation: the process by which short-term memories are transformed into long-term memories during sleep.
microvolt: one-millionth of a volt.
mild cognitive impairment (MCI): a condition involving noticeable cognitive decline, greater than expected for a person's age, but not severe enough to interfere significantly with daily life or independent function.
mode-shifted posterior dominant rhythm: a posterior dominant rhythm expressed at an atypical frequency, such as a subharmonic, because of changes in arousal or network modulation, while retaining alpha morphology, symmetry, and reactivity.
monomorphic waves: series of waves that are rhythmic with the same frequency and morphology.
morphology: the shape of the signal generated by oscillating potential differences.
motor inhibition: suppressing motor activity, allowing for stillness and precision in movements.
mu rhythm: 7-11-Hz waves resemble wickets and appear as several-second trains over central or centroparietal sites (C3 and C4).
neocortex: the part of the brain involved in higher-order brain functions, including sensory perception, cognition, and generation of delta waves.
neural oscillations: rhythmic or repetitive neural activity in the central nervous system.
neurodegenerative diseases: disorders characterized by the progressive degeneration of neurons, often associated with disrupted delta activity.
non-rapid eye movement (NREM) sleep: a phase of sleep that includes stages 1-3, with delta waves being most prominent in stage 3, also known as slow-wave sleep.
notch filter: a circuit that suppresses a narrow band of frequencies, such as those produced by line current at 50/60Hz.
notched alpha: alpha activity containing brief embedded cycles of a different frequency, usually indicating harmonic or subharmonic modulation of the same generator rather than epileptiform activity.
Nyquist theorem: the principle that a signal must be sampled at more than twice its highest frequency component to be reconstructed without distortion.
occipital intermittent rhythmic delta activity (OIRDA): a sharply contoured 2-4 Hz rhythm seen over occipital regions in children with generalized epilepsy syndromes; it lacks the sinusoidal shape of alpha and is not an extension of the alpha generator.
optogenetic stimulation: a technique that uses light to control neurons genetically modified to express light-sensitive ion channels. This method allows precise control over the activity of specific neurons in the brain, enabling researchers to study the functions of neural circuits and their roles in behavior and neurological conditions.
order: the maximum delay in samples used in creating each output sample.
paradoxical negativity: the surface-negative EEG shift recorded when neurons depolarize, produced by volume conduction of the negative extracellular potential from the cortex to the scalp.
paradoxical positivity: the surface-positive EEG shift recorded when neurons hyperpolarize, produced by volume conduction of the positive extracellular potential from the cortex to the scalp.
Parkinson's disease (PD): a progressive neurodegenerative disorder characterized primarily by motor symptoms such as tremor, rigidity, bradykinesia, and postural instability.
parvalbumin: a protein expressed in certain inhibitory interneurons.
peak alpha frequency (PAF): the individual-specific frequency at which alpha activity is strongest; a relatively stable trait used as a marker of neural efficiency and cognitive performance.
peak-to-peak (p-p): a signal quantification method that measures waveform "height" from peak to trough.
percent power: the expression of power within a frequency band as a percentage of total EEG power.
physical restoration: the process during sleep where the body repairs tissues, grows muscles, and releases growth hormones.
polyphasic waves: waveforms with two or more elements; diphasic and triphasic waves.
posterior dominant rhythm (PDR): the highest-amplitude frequency detected at the posterior scalp when eyes are closed.
power: amplitude squared, conventionally expressed in microvolts squared (µV²) for band power or microvolts squared per hertz (µV²/Hz) for power spectral density.
prefrontal cortex: a part of the brain involved in complex cognitive behavior, decision-making, and moderating social behavior.
primary motor cortex (M1): a brain region involved in planning, controlling, and executing voluntary movements.
primary somatosensory cortex (S1): a brain region responsible for processing sensory information from the body.
Quantitative EEG (qEEG): digitized statistical brain mapping using at least a 19-channel montage to measure EEG amplitude within specific frequency bins.
raw EEG signal: oscillating electrical potential differences detected from the scalp.
reactivity: the responsiveness of an EEG rhythm to physiological or environmental change, such as the attenuation of alpha with eye opening; a key feature distinguishing normal variants from pathological slowing.
readiness potential: see Bereitschaftspotential.
reference electrode: an electrode that is placed on the scalp, earlobe, or mastoid.
regular waves: rhythmic waves with the same frequency and morphology.
relaxed wakefulness: a state of being awake but calm and free from active motor activity.
Research Domain Criteria (RDoC): The Research Domain Criteria (RDoC) is a research framework developed by the National Institute of Mental Health (NIMH) that aims to integrate various domains of information (including genetics, neuroscience, and behavioral science) to understand mental disorders. It moves beyond traditional diagnostic categories to focus on fundamental biological and psychological processes that cut across different disorders.
reticular nucleus of the thalamus (TRN): GABAergic thalamic neurons that modulate signals from other thalamic nuclei and do not project to the cortex. Also called the nucleus reticularis of the thalamus (NRT).
root mean square (RMS): a signal quantification method that squares each sample, averages the squares over the epoch, and takes the square root; it represents the equivalent steady voltage that would deliver the same power. For a sine wave, RMS = 0.707 × peak amplitude.
sampling rate: the number of times per second that an ADC samples the EEG signal.
sampling resolution: the number of digital bits used to represent a signal; higher resolutions (for example, 24 bits) capture a wider dynamic range.
saw-toothed waves: waves that resemble asymmetrical triangles.
schizophrenia: a chronic brain disorder characterized by symptoms such as hallucinations, delusions, and cognitive impairments.
sensorimotor cortex: a region of the brain that processes and integrates sensory inputs and motor outputs.
sensorimotor rhythm (SMR): 12 to 15 Hz oscillations associated with motor inhibition and focused attention.
sensory perception: the process of recognizing and interpreting sensory stimuli.
sharp transients: steeply contoured waves standing out from the background; benign variants are not epileptiform and are distinguished from spikes and sharp waves by duration, field, and the presence of an after-going slow wave.
sharp waves: steeply-shaped waves with 70-200 ms duration.
Sheer rhythm: a brain oscillation characterized by high-frequency activity (38-42 Hz) that occurs in short, transient bursts. These bursts are typically synchronized across large neural populations and are thought to play a role in the timing and coordination of neuronal activity, particularly in relation to cognitive processes and sensory perception.
sinusoidal: rhythmic waves that resemble sine waves.
sleep pressure: the body's need for sleep, which increases with prolonged wakefulness and is reflected by the amount of delta activity during sleep.
sleep spindle: a train of 11-16 Hz waves, most commonly 12-14 Hz, lasting at least 0.5 seconds and maximal over the central derivations; defines Stage 2 sleep and may persist into Stage 3.
slow alpha: posterior dominant activity below 8 Hz, most often 5-7 Hz, which may reflect developmental norms, healthy aging, pathological slowing, or subharmonic expression of the alpha generator.
slow cortical potentials (SCPs): gradual voltage changes in the EEG, typically below 1 Hz and often near 0.3 Hz, that reflect changes in cortical excitability and are associated with various cognitive and motor processes. Recording them requires a DC-coupled amplifier.
slow-wave sleep (SWS): the deepest phase of non-REM sleep characterized by high amplitude, low-frequency delta waves.
spike: a waveform with a sharp appearance that lasts 20-70 ms.
spike-and-wave complexes: spikes that are succeeded by slow waves.
spindling excessive beta (SEB): an EEG pattern of fast beta activity with a spindle-like appearance and an anterior emphasis, with a reported mean frequency of 20.6 Hz (SD = 4.1 Hz) spanning roughly 14-30 Hz. It is associated with various psychiatric and neurological conditions, including ADHD, insomnia, and medication-resistant psychiatric disorders.
standardized LORETA (sLORETA): a refinement of LORETA that estimates each voxel's electrical potentials without regard to their frequency, expresses normalized F-values, and uses 6,239 voxels at 5 mm resolution. Voxel size is not the same as spatial resolution; the reconstruction remains blurred.
stimulus-preceding negativity (SPN): a slow negative potential shift observed before a stimulus that carries important information, such as feedback about the accuracy of a movement. It reflects anticipatory attention and affective processing.
subharmonic: a lower-frequency component produced when an oscillator divides its fundamental frequency by a whole number, most commonly two; in EEG, a 5-6 Hz subharmonic may be generated by a 10-12 Hz alpha oscillator.
sub-vigil states: intermediate states between wakefulness and sleep, characterized by reduced sensory and cognitive activity. These states can lead to cognitive impairments and behavioral disturbances, often observed in conditions like ADHD and insomnia.
surface EMG (SEMG): a non-invasive technique used to measure and record the electrical activity produced by skeletal muscles. Sensors placed on the skin's surface detect the electrical potentials muscle fibers generate during contraction, providing information about muscle function, activation patterns, and fatigue.
surface Laplacian (SL) analysis: a family of mathematical algorithms that provide two-dimensional images of radial current flow from cortical dipoles to the scalp.
surface-negative: a negative slow cortical potential shift, associated with synchronized depolarization, increased cortical excitability, and readiness to respond.
surface-positive: a positive slow cortical potential shift, associated with hyperpolarization, decreased cortical excitability, and relaxation.
synaptic downscaling: the proportional weakening of synaptic strength during sleep proposed by the synaptic homeostasis hypothesis, associated with slow-wave activity. Distinct from developmental synaptic pruning, the physical elimination of synapses.
synchrony: the simultaneous occurrence of events or processes, in this context, the coordinated activity of neurons.
Talairach coordinate: a three-axis Cartesian coordinate whose origin is the anterior commissure, with the y-axis along the AC-PC line, the z-axis inferior-to-superior, and the x-axis left-to-right; expressed in millimeters as (x, y, z) and referenced to the Talairach or Montreal atlases.
temporal framework: the timing structure that allows for the coordination of neural activity.
thalamic pacemaker neurons: neurons in the thalamus that generate rhythmic burst firing patterns, contributing to the synchronization of delta waves.
thalamic-cortical relay (TCR) system: the primary pathway for determining which cortical areas receive each type of sensory input.
thalamocortical circuits: neural pathways that connect the thalamus with the cortex, which generate rhythmic brain activity.
thalamocortical interactions: the connections and communications between the thalamus and the cerebral cortex.
theta/beta ratio: the ratio between theta and beta power. Monastra et al. (1999) and the FDA-cleared NEBA device both use 4-8 Hz theta and 13-21 Hz beta recorded at the vertex, Cz; other literature uses frontal midline sites.
theta rhythm: 4-8-Hz rhythms generated a cholinergic septohippocampal system that receives input from the ascending reticular formation and a noncholinergic system that originates in the entorhinal cortex, which corresponds to Brodmann areas 28 and 34 at the caudal region of the temporal lobe.
transfer trials: trials in a slow cortical potential training protocol that ask the client to produce a shift without providing visual or auditory feedback, used to test whether the self-regulation skill has been acquired.
transient: a single wave or series of waves distinct from background EEG activity.
triphasic wave: a wave that consists of three elements with alternating directions.
vertex (Cz): the intersection of imaginary lines drawn from the nasion to inion and between the two preauricular points in the International 10-10 and 10-20 systems.
vertex sharp transient (V wave): a negative-polarity waveform detected at the vertex in sleep records but are not usually observed during wakefulness.
voxel: a volumetric unit.
wave: a plot of voltage using a bipolar (positive/negative) scale with zero in the middle; the analog form of the signal in which voltage continuously varies.
waveform: the shape of the signal that is generated by oscillating potential differences between two electrodes.
working memory: a cognitive system responsible for temporarily holding information available for processing.
Test Yourself on ClassMarker
Click on the ClassMarker logo below to take a 10-question exam over this entire unit.

Review Flashcards on Quizlet
Click on the Quizlet logo to review our chapter flashcards.

Visit the BioSource Software Website
BioSource Software offers Physiological Psychology, which satisfies BCIA's Neuroanatomy requirement, and the Neurofeedback100 Testing Service, which provides extensive multiple-choice testing over the Neurofeedback Blueprint.

Assignment
Now that you have completed this module, write down the frequency bands you uptrain and downtrain in clinical or peak performance practice and explain the rationale for these choices.
References
Achermann, P., & Borbély, A. A. (2003). Mathematical models of sleep regulation. Frontiers in Bioscience, 8, s683-s693. https://doi.org/10.2741/1074
Aich T. K. (2014). Absent posterior alpha rhythm: An indirect indicator of seizure disorder? Indian Journal of Psychiatry, 56(1), 61–66. https://doi.org/10.4103/0019-5545.124715
American Academy of Neurology. (2016). Practice advisory: The utility of EEG theta/beta power ratio in ADHD diagnosis. Neurology, 87(22), 2375–2379. https://doi.org/10.1212/WNL.0000000000003265
Amo, C., Castillo, M., Barea, R., Santiago, L., Martínez-Arribas, A., Amo-López, P., & Boquete, L. (2016). Induced gamma-band activity during voluntary movement: EEG analysis for clinical purposes. Motor Control, 20(4), 409-28. https://doi.org/10.1123/mc.2015-0010
Amo, C., Santiago, L., Barea, R., López-Dorado, A., & Boquete, L. (2017). Analysis of Ggamma-band activity from human EEG using empirical mode decomposition. Sensors (Basel, Switzerland), 17. https://doi.org/10.3390/s17050989
Amzica, F., & Lopes da Silva, F. H. (2018). Cellular substrates of brain rhythms. In D. L. Schomer & F. H. Lopes da Silva (Eds.), Niedermeyer’s electroencephalography: Basic principles, clinical applications and related fields (7th ed., pp. 20–62). Oxford University Press.
Amzica, F., & Steriade, M. (2000). Neuronal and glial membrane potentials during sleep and paroxysmal oscillations in the neocortex. The Journal of Neuroscience, 20(17), 6648–6665. https://doi.org/10.1523/JNEUROSCI.20-17-06648.2000
Amzica, F., & Steriade, M. (1998). Electrophysiological correlates of sleep delta waves. Electroencephalography and Clinical Neurophysiology, 107(2), 69–83. https://doi.org/10.1016/S0013-4694(98)00051-0
Amzica, F., & Steriade, M. (2002). The functional significance of K-complexes. Sleep Medicine Reviews, 6(2), 139–149. https://doi.org/10.1053/smrv.2001.0181
Anderson, C., & Horne, J. (2003). Prefrontal cortex: links between low frequency delta EEG in sleep and neuropsychological performance in healthy, older people. Psychophysiology, 40(3), 349-57. https://doi.org/10.1111/1469-8986.00038
Andreassi, J. L. (2000). Psychophysiology: Human behavior and physiological response (4th ed.). Lawrence Erlbaum Associates.
Angelakis, E., Lubar, J. F., Frederick, J., & Stathopoulou, S. (2001). The role of slow-wave electroencephalographic activity in reading. Journal of Neurotherapy, 5(3), 5–25. https://doi.org/10.1300/J184v05n03_03
Angelakis, E., Lubar, J. F., Stathopoulou, S., & Kounios, J. (2004). Peak alpha frequency: an electroencephalographic measure of cognitive preparedness. Clinical Neurophysiology: Official Journal of the International Federation of Clinical Neurophysiology, 115(4), 887–897. https://doi.org/10.1016/j.clinph.2003.11.034
Anjum, M. F., Smyth, C., Zuzuárregui, R., Dijk, D.-J., Starr, P. A., Denison, T., & Little, S. (2024). Multi-night cortico-basal recordings reveal mechanisms of NREM slow-wave suppression and spontaneous awakenings in Parkinson’s disease. Nature Communications, 15(1), Article 1793. https://doi.org/10.1038/s41467-024-46002-7
Arns, M., Conners, C. K., & Kraemer, H. C. (2013). A decade of EEG theta/beta ratio research in ADHD: A meta-analysis. Journal of Attention Disorders, 17(5), 374–383. https://doi.org/10.1177/1087054712460087
Arns, M., Swatzyna, R., Gunkelman, J., & Olbrich, S. (2015). Sleep maintenance, spindling excessive beta and impulse control: an RDoC arousal and regulatory systems approach? Neuropsychiatric Electrophysiology, 1, 1-11. https://doi.org/10.1186/S40810-015-0005-9
Arnolds, D. E., Lopes da Silva, F. H., Aitink, J. W., Kamp, A., & Boeijinga, P. (1980). The spectral properties of hippocampal EEG related to behaviour in man. Electroencephalography and Clinical Neurophysiology, 50(3-4), 324–328. https://doi.org/10.1016/0013-4694(80)90160-1
Babiloni, C., Ferri, R., Binetti, G., Cassarino, A., Dal Forno, G., Ercolani, M., Ferreri, F., Frisoni, G. B., Lanuzza, B., Miniussi, C., Nobili, F., Rodriguez, G., Rundo, F., Stam, C. J., Musha, T., Vecchio, F., & Rossini, P. M. (2004). Abnormal fronto-parietal coupling of brain rhythms in mild Alzheimer's disease: A multicentric EEG study. European Journal of Neuroscience, 19(9), 2583–2590. https://doi.org/10.1111/j.0953-816X.2004.03333.x
Babiloni, C., Noce, G., Bonaventura, C., Lizio, R., Pascarelli, M., Tucci, F., Soricelli, A., Ferri, R., Nobili, F., Famà, F., Palma, E., Cifelli, P., Marizzoni, M., Stocchi, F., Frisoni, G., & Percio, C. (2020). Abnormalities of cortical sources of resting state delta electroencephalographic rhythms are related to epileptiform activity in patients with amnesic mild cognitive impairment not due to Alzheimer's disease. Frontiers in Neurology, 11. https://doi.org/10.3389/fneur.2020.514136
Başar, E. (2013). A review of gamma oscillations in healthy subjects and in cognitive impairment. International Journal of Psychophysiology, 90(2), 99–117. https://doi.org/10.1016/j.ijpsycho.2013.07.005
Birbaumer, N. (1999). Slow cortical potentials: Plasticity, operant control, and behavioral effects. The Neuroscientist, 5(2), 74–78. https://doi.org/10.1177/107385849900500211
Birbaumer, N., Elbert, T., Canavan, A. G. M., & Rockstroh, B. (1990). Slow potentials of the cerebral cortex and behavior. Physiological Reviews, 70(1), 1–41. https://doi.org/10.1152/physrev.1990.70.1.1
Boxum, S., Voetterl, H., van Dijk, H., Gordon, E., DeBeus, R., Arnold, L. E., & Arns, M. (2024). Theta/beta ratio and behavioral traits in ADHD: A replication study. Applied Psychophysiology and Biofeedback, 50(4), 655–666. https://doi.org/10.1007/s10484-024-09649-y
Boonstra, T. W., Stins, J. F., Daffertshofer, A., & Beek, P. J. (2007). Effects of sleep deprivation on neural functioning: An integrative review. Cellular and Molecular Life Sciences, 64(7-8), 934–946. https://doi.org/10.1007/s00018-007-6457-8
Bosman, C. A., Lansink, C. S., & Pennartz, C. M. (2014). Functions of gamma-band synchronization in cognition: From single circuits to functional diversity across cortical and subcortical systems. European Journal of Neuroscience, 39(11), 1982-1999. https://doi.org/10.1111/ejn.12606
Breakspear, M. (2017). Dynamic models of large-scale brain activity. Nature Neuroscience, 20(3), 340–352. https://doi.org/10.1038/nn.4497
Brienza, M., & Mecarelli, O. (2019). Neurophysiological basis of EEG. In O. Mecarelli (Ed.), Clinical electroencephalography (pp. 9–21). Springer. https://doi.org/10.1007/978-3-030-04573-9_2
Brunia, C. H. M., van Boxtel, G. J. M., & Böcker, K. B. E. (2012). Negative slow waves as indices of anticipation: The Bereitschaftspotential, the contingent negative variation, and the stimulus-preceding negativity. In S. J. Luck & E. S. Kappenman (Eds.), The Oxford handbook of event-related potential components (pp. 189–207). Oxford University Press. https://doi.org/10.1093/oxfordhb/9780195374148.013.0108
Buzsáki, G. (2006). Rhythms of the brain. Oxford University Press. https://doi.org/10.1093/acprof:oso/9780195301069.001.0001
Buzsáki, G., & Wang, X. J. (2012). Mechanisms of gamma oscillations. Annual Review of Neuroscience, 35, 203–225. https://doi.org/10.1146/annurev-neuro-062111-150444
Caton, R. (1875). The electric currents of the brain. British Medical Journal, 2, 278.
Chang, L. Y., Wang, M. Y., & Tsai, P. S. (2016). Diagnostic accuracy of rating scales for Attention-Deficit/Hyperactivity Disorder: A meta-analysis. Pediatrics, 137(3), e20152749. https://doi.org/10.1542/peds.2015-2749
Chokroverty, S. (Ed.). (2017). Sleep disorders medicine: Basic science, technical considerations and clinical aspects (4th ed.). Springer. https://doi.org/10.1007/978-1-4939-6578-6
Chuang, C.-H., Chang, K.-Y., Huang, C.-S., & Jung, T.-P. (2022). IC-U-Net: A U-Net-based denoising autoencoder using mixtures of independent components for automatic EEG artifact removal. NeuroImage, 263, 119586. https://doi.org/10.1016/j.neuroimage.2022.119586
Clark, C. R., Veltmeyer, M. D., Hamilton, R. J., Simms, E., Paul, R., Hermens, D., & Gordon, E. (2004). Spontaneous alpha peak frequency predicts working memory performance across the age span. International Journal of Psychophysiology, 53(1), 1–9. https://doi.org/10.1016/j.ijpsycho.2003.12.011
Clarke, A., Barry, R., McCarthy, R., & Selikowitz, M. (2001). Excess beta activity in children with attention-deficit/hyperactivity disorder: an atypical electrophysiological group. Psychiatry Research, 103, 205-218. https://doi.org/10.1016/S0165-1781(01)00277-3
Colgin, L. L. (2016). Rhythms of the hippocampal network. Nature Reviews Neuroscience, 17(4), 239-249.
Collura, T. F. (2014). Technical foundations of neurofeedback. Taylor & Francis.
Corsi-Cabrera, M., Pérez-Garci, E., Río-Portilla, Y., Ugalde, E., & Guevara, M. (2001). EEG bands during wakefulness, slow-wave, and paradoxical sleep as a result of principal component analysis in the rat. Sleep, 24(4), 374-80. https://doi.org/10.1093/sleep/23.6.1a.
Cortoos, A., De Valck, E., Arns, M., Breteler, M. H., & Cluydts, R. (2010). An exploratory study on the effects of tele-neurofeedback and tele-biofeedback on objective and subjective sleep in patients with primary insomnia. Applied Psychophysiology and Biofeedback, 35(2), 125-134. https://doi.org/10.1007/s10484-009-9116-z
Crabtree J. W. (2018). Functional diversity of thalamic reticular subnetworks. Frontiers in Systems Neuroscience, 12, 41. https://doi.org/10.3389/fnsys.2018.00041
Crone, N., Miglioretti, D., Gordon, B., & Lesser, R. (1998). Functional mapping of human sensorimotor cortex with electrocorticographic spectral analysis. II. Event-related synchronization in the gamma band. Brain: A Journal of Neurology, 121( Pt 12), 2301-15. https://doi.org/10.1093/BRAIN/121.12.2301
De Gennaro, L., & Ferrara, M. (2003). Sleep spindles: An overview. Sleep Medicine Reviews, 7(5), 423-440. https://doi.org/10.1053/smrv.2002.0252
Dehghani, N., Peyrache, A., Telenczuk, B., Le Van Quyen, M., Halgren, E., Cash, S. S., Hatsopoulos, N. G., & Destexhe, A. (2016). Dynamic balance of excitation and inhibition in human and monkey neocortex. Scientific Reports, 6, 23176. https://doi.org/10.1038/srep23176
Demos, J. N. (2019). Getting started with neurofeedback (2nd ed.). W. W. Norton & Company.
Destexhe, A., Contreras, D., & Steriade, M. (1999). Spatiotemporal analysis of local field potentials and unit discharges in cat cerebral cortex during natural wake and sleep states. The Journal of Neuroscience, 19(11), 4595–4608. https://doi.org/10.1523/JNEUROSCI.19-11-04595.1999
Donoghue, T., Dominguez, J., & Voytek, B. (2020). Electrophysiological frequency band ratio measures conflate periodic and aperiodic neural activity. eNeuro, 7(6), ENEURO.0192-20.2020. https://doi.org/10.1523/ENEURO.0192-20.2020
Donoghue, T., Haller, M., Peterson, E. J., Varma, P., Sebastian, P., Gao, R., Noto, T., Lara, A. H., Wallis, J. D., Knight, R. T., Shestyuk, A., & Voytek, B. (2020). Parameterizing neural power spectra into periodic and aperiodic components. Nature Neuroscience, 23(12), 1655–1665. https://doi.org/10.1038/s41593-020-00744-x
Egner, T., & Gruzelier, J. H. (2001). Learned self-regulation of EEG frequency components affects attention and event-related brain potentials in humans. NeuroReport, 12(18), 4155-4159. https://doi.org/10.1097/00001756-200112210-00058
Ekstrom, A. D., Caplan, J. B., Ho, E., Shattuck, K., Fried, I., & Kahana, M. J. (2005). Human hippocampal theta activity during virtual navigation. Hippocampus, 15(7), 881–889. https://doi.org/10.1002/hipo.20109
Elbert, T., Rockstroh, B., Lutzenberger, W., & Birbaumer, N. (1980). Biofeedback of slow cortical potentials. I. Electroencephalography and Clinical Neurophysiology, 48(3), 293–301. https://doi.org/10.1016/0013-4694(80)90265-5
Enriquez-Geppert, S., Brown, T., Henrich, H., Arns, M., & Pimenta, M. G. (2023). Attention Deficit Hyperactivity Disorder. In I. Khazan, F. Shaffer, D. Moss, R. Lyle, & S. Rosenthal (Eds). Evidence-based practice in biofeedback and neurofeedback (4th ed.). Association for Applied Psychophysiology and Biofeedback.
Erickson-Davis, C. R., Anderson, J. S., Wielinski, C. L., Richter, S. A., & Parashos, S. A. (2012). Evaluation of neurofeedback training in the treatment of Parkinson’s disease: A pilot study. Journal of Neurotherapy, 16(1), 4–11. https://doi.org/10.1080/10874208.2012.650109
Fisch, B. J. (1999). Fisch and Spehlmann's EEG primer (3rd ed.). Elsevier.
Frey, L. (2023). Epilepsy. In I. Khazan, F. Shaffer, D. Moss, R. Lyle, & S. Rosenthal (Eds.), Evidence-based practice in biofeedback and neurofeedback (4th ed.). Association for Applied Psychophysiology and Biofeedback.
Fries P. (2015). Rhythms for cognition: Communication through coherence. Neuron, 88(1), 220–235. https://doi.org/10.1016/j.neuron.2015.09.034
Gardner, R. J., Kersanté, F., Jones, M. W., & Bartsch, U. (2014). Neural oscillations during non-rapid eye movement sleep as biomarkers of circuit dysfunction in schizophrenia. European Journal of Neuroscience, 39(7), 1091–1106. https://doi.org/10.1111/ejn.12533
Gilmore, P., & Brenner, R. (1981). Correlation of EEG, computerized tomography, and clinical findings. Study of 100 patients with focal delta activity. Archives of Neurology, 38(6), 371-372. https://doi.org/10.1001/ARCHNEUR.1981.00510060073013.
Goldstein, A. N., & Walker, M. P. (2014). The role of sleep in emotional brain function. Annual Review of Clinical Psychology, 10, 679-708. https://doi.org/10.1146/annurev-clinpsy-032813-153716
Gouw, A., Alsema, A., Tijms, B., Borta, A., Scheltens, P., Stam, C., & Flier, W. (2017). EEG spectral analysis as a putative early prognostic biomarker in nondemented, amyloid positive subjects. Neurobiology of Aging, 57, 133-142. https://doi.org/10.1016/j.neurobiolaging.2017.05.017
Grandy, T. H., Werkle-Bergner, M., Chicherio, C., Lövdén, M., Schmiedek, F., & Lindenberger, U. (2013a). Individual alpha peak frequency is related to latent factors of general cognitive abilities. NeuroImage, 79, 10–18. https://doi.org/10.1016/j.neuroimage.2013.04.059
Grandy, T. H., Werkle-Bergner, M., Chicherio, C., Schmiedek, F., Lövdén, M., & Lindenberger, U. (2013b). Peak individual alpha frequency qualifies as a stable neurophysiological trait marker in healthy younger and older adults. Psychophysiology, 50(6), 570–582. https://doi.org/10.1111/psyp.12043
Gruzelier, J., Inoue, A., Smart, R., Steed, A., & Steffert, T. (2010). Acting performance and flow state enhanced with sensory-motor rhythm neurofeedback comparing ecologically valid immersive VR and training screen scenarios. Neuroscience Letters, 480(2), 112–116. https://doi.org/10.1016/j.neulet.2010.06.019
Haegens, S., Cousijnc, H., Wallis, G., Harrison, P. J., & Nobre, A. C. (2014). Inter- and intra-individual variability in alpha peak frequency. NeuroImage, 92, 46-55. doi.org/10.1016/j.neuroimage.2014.01.049
Hammond, D. C. (2005). Neurofeedback with anxiety and affective disorders. Child and Adolescent Psychiatric Clinics of North America, 14(1), 105-123. https://doi.org/10.1016/j.chc.2004.07.008
Hanslmayr, S., Sauseng, P., Doppelmayr, M., Schabus, M., & Klimesch, W. (2005). Increasing individual upper alpha power by neurofeedback improves cognitive performance in human subjects. Applied Psychophysiology and Biofeedback, 30(1), 1–10. https://doi.org/10.1007/s10484-005-2169-8
Hari, R., & Puce, A. (2017). MEG-EEG primer. Oxford University Press.
Harmony, T., Fernández, T., Silva, J., Bernal, J., Díaz-Comas, L., Reyes, A., Marosi, E., Rodriguez, M., & Rodríguez, M. (1996). EEG delta activity: An indicator of attention to internal processing during performance of mental tasks. International Journal of Psychophysiology: Official Journal of the International Organization of Psychophysiology, 24(1-2), 161-71. https://doi.org/10.1016/S0167-8760(96)00053-0
Hartoyo, A., Cadusch, P. J., Liley, D. T. J., & Hicks, D. G. (2020). Inferring a simple mechanism for alpha-blocking by fitting a neural population model to EEG spectra. PLoS Computational Biology, 16(4), e1007662. https://doi.org/10.1371/journal.pcbi.1007662
Hasib, T., & Vengadasalam, V. (2023). Analysing gamma frequency components in EEG signals: A comprehensive extraction approach. Journal of Informatics and Web Engineering. https://doi.org/10.33093/jiwe.2023.2.2.11
Heinrich, H., Gevensleben, H., Freisleder, F. J., Moll, G. H., & Rothenberger, A. (2004). Training of slow cortical potentials in attention-deficit/hyperactivity disorder: Evidence for positive behavioral and neurophysiological effects. Biological Psychiatry, 55(7), 772–775. https://doi.org/10.1016/j.biopsych.2003.11.013
Hinterberger, T., Veit, R., Wilhelm, B., Weiskopf, N., Vatine, J. J., & Birbaumer, N. (2005). Neuronal mechanisms underlying control of a brain-computer interface. The European Journal of Neuroscience, 21(11), 3169–3181. https://doi.org/10.1111/j.1460-9568.2005.04092.x
Hoedlmoser, K., Pecherstorfer, T., Gruber, G., Anderer, P., Doppelmayr, M., Klimesch, W., & Schabus, M. (2008). Instrumental conditioning of human sensorimotor rhythm (12-15 Hz) and its impact on sleep as well as declarative learning. Sleep, 31(10), 1401–1408.
Howells, F., Temmingh, H., Hsieh, J., Dijen, A., Baldwin, D., & Stein, D. (2018). Electroencephalographic delta/alpha frequency activity differentiates psychotic disorders: A study of schizophrenia, bipolar disorder and methamphetamine-induced psychotic disorder. Translational Psychiatry, 8. https://doi.org/10.1038/s41398-018-0105-y
Hobson, H. M., & Bishop, D. V. M. (2016). Mu suppression — A good measure of the human mirror neuron system? Cortex, 82, 290–310. https://doi.org/10.1016/j.cortex.2016.03.019
Hobson, H. M., & Bishop, D. V. M. (2017). The interpretation of mu suppression as an index of mirror neuron activity: Past, present and future. Royal Society Open Science, 4(3), 160662. https://doi.org/10.1098/rsos.160662
Hugdahl, K. (1995). Psychophysiology: The mind-body perspective. Harvard University Press.
Iaccarino, H. F., Singer, A. C., Martorell, A. J., Rudenko, A., Gao, F., Gillingham, T. Z., Mathys, H., Seo, J., Kritskiy, O., Abdurrob, F., Adaikkan, C., Canter, R. G., Rueda, R., Brown, E. N., Boyden, E. S., & Tsai, L. H. (2016). Gamma frequency entrainment attenuates amyloid load and modifies microglia. Nature, 540(7632), 230–235. https://doi.org/10.1038/nature20587
Jadeja, N. M. (2021). Frequencies and rhythms. In How to read an EEG. Cambridge University Press. https://doi.org/10.1017/9781108918923.008
Jensen, O., Kaiser, J., & Lachaux, J. P. (2007). Human gamma-frequency oscillations associated with attention and memory. Trends in Neurosciences, 30(7), 317–324. https://doi.org/10.1016/j.tins.2007.05.001
Johnstone, S. J., Barry, R. J., & Clarke, A. R. (2005). Age-related changes in child and adolescent EEG: A comparison of spectral and principal components analysis. Clinical Neurophysiology, 116(3), 646–657. https://doi.org/10.1016/j.clinph.2004.10.002
Kane, N., Acharya, J., Benickzy, S., Caboclo, L., Finnigan, S., Kaplan, P. W., Shibasaki, H., Pressler, R., & van Putten, M. J. A. M. (2017). A revised glossary of terms most commonly used by clinical electroencephalographers and updated proposal for the report format of the EEG findings. Revision 2017. Clinical Neurophysiology Practice, 2, 170–185. https://doi.org/10.1016/j.cnp.2017.07.002
Kayser, J., & Tenke, C. E. (2015). On the benefits of using surface Laplacian (current source density) methodology in electrophysiology. Int J Psychophysiol, 97(3), 171-173. https://dx.doi.org/10.1016%2Fj.ijpsycho.2015.06.001
Klimesch, W. (1999). EEG alpha and theta oscillations reflect cognitive and memory performance: A review and analysis. Brain Research Reviews, 29(2-3), 169–195. https://doi.org/10.1016/S0165-0173(98)00056-3
Klimesch, W., Sauseng, P., & Hanslmayr, S. (2007). EEG alpha oscillations: The inhibition-timing hypothesis. Brain Research Reviews, 53(1), 63–88. https://doi.org/10.1016/j.brainresrev.2006.06.003
Kołodziej, A., Magnuski, M., Ruban, A., & Brzezicka, A. (2021). No relationship between frontal alpha asymmetry and depressive disorders in a multiverse analysis of five studies. eLife, 10, e60595. https://doi.org/10.7554/eLife.60595
Krepel, N., van Dijk, H., Sack, A. T., Swatzyna, R. J., & Arns, M. (2021). To spindle or not to spindle: A replication study into spindling excessive beta as a transdiagnostic EEG feature associated with impulse control. Biological Psychology, 165, 108188. https://doi.org/10.1016/j.biopsycho.2021.108188
Kropotov, J. D. (2016). Functional neuromarkers for psychiatry: Applications for diagnosis and treatment. Academic Press.
Krystal, A. D., Edinger, J. D., Wohlgemuth, W. K., & Marsh, G. R. (2002). NREM sleep EEG frequency spectral correlates of sleep complaints in primary insomnia subtypes. Sleep, 25(6), 630–640.
Libenson, M. H. (2024). Practical approach to electroencephalography (2nd ed.). Saunders Elsevier.
Lopes da Silva, F. H. (1991). Neural mechanisms underlying brain waves: from neural membranes to networks. Electroencephalography and Clinical Neurophysiology, 79(2), 81-93. https://doi.org/10.1016/0013-4694(91)90044-5
López-Sanz, D., Bruña, R., Garcés, P., Cámara, C., Serrano, N., Rodríguez-Rojo, I., Delgado, M., Montenegro, M., López-Higes, R., Yus, M., & Maestú, F. (2016). Alpha band disruption in the AD-continuum starts in the Subjective Cognitive Decline stage: A MEG study.Scientific Reports, 6. https://doi.org/10.1038/srep37685.
Lubar, J. F. (1991). Discourse on the development of EEG diagnostics and biofeedback for attention-deficit/hyperactivity disorders. Biofeedback and Self-regulation, 16(3), 201–225. https://doi.org/10.1007/BF01000016
Lubar, J. F. (2001). Rationale for choosing bipolar versus referential training. Journal of Neurotherapy, 4(3), 94–97.
Marcuse, L. V., Fields, M. C., & Yoo, J. J. (2016). Rowan’s primer of EEG (2nd ed.). Elsevier.
Marshall, L., & Born, J. (2007). The contribution of sleep to hippocampus-dependent memory consolidation. Trends in Cognitive Sciences, 11(10), 442-450. https://doi.org/10.1016/j.tics.2007.09.001
Meier, N. M., Perrig, W., & Koenig, T. (2014). Is excessive electroencephalography beta activity associated with delinquent behavior in men with attention-deficit hyperactivity disorder symptomatology? Neuropsychobiology, 70(4), 210–219. https://doi.org/10.1159/000366487
Merica, H., & Fortune, R. (2005). Spectral power time-courses of human sleep EEG reveal a striking discontinuity at approximately 18 Hz marking the division between NREM-specific and wake/REM-specific fast frequency activity. Cerebral Cortex, 15(7), 877-884.
Mierau, M., Klimesch, W., & Lefebvre, J. (2017). State-dependent alpha peak frequency shifts: Experimental evidence, potential mechanisms and functional implications. Neuroscience, 360, 146-154. doi.org/10.1016/j.neuroscience.2017.07.037
Min, B. K., & Park, H. J. (2010). Task-related modulation of anterior theta and posterior alpha EEG reflects top-down preparation. BMC Neuroscience, 11, 79. https://doi.org/10.1186/1471-2202-11-79
Moffett, S., O’Malley, S., Man, S., Hong, D., & Martin, J. (2017). Dynamics of high frequency brain activity. Scientific Reports, 7. https://doi.org/10.1038/s41598-017-15966-6.
Mölle, M., Marshall, L., Gais, S., & Born, J. (2002). Grouping of spindle activity during slow oscillations in human non-rapid eye movement sleep. The Journal of Neuroscience, 22(24), 10941–10947. https://doi.org/10.1523/JNEUROSCI.22-24-10941.2002
Monastra, V. J., Lubar, J. F., & Linden, M. (2001). The development of a quantitative electroencephalographic scanning process for attention deficit-hyperactivity disorder: Reliability and validity studies. Neuropsychology, 15(1), 136–144. https://doi.org/10.1037//0894-4105.15.1.136
Monastra, V. J., Lubar, J. F., Linden, M., VanDeusen, P., Green, G., Wing, W., Phillips, A., & Fenger, T. N. (1999). Assessing attention deficit hyperactivity disorder via quantitative electroencephalography: an initial validation study. Neuropsychology, 13(3), 424–433. https://doi.org/10.1037/0894-4105.13.3.424
Morales-Quezada, L., Martinez, D., El-Hagrassy, M. M., Kaptchuk, T. J., Sterman, M. B., & Yeh, G. Y. (2019). Neurofeedback impacts cognition and quality of life in pediatric focal epilepsy: An exploratory randomized double-blinded sham-controlled trial. Epilepsy & Behavior: E&B, 101(Pt A), 106570. https://doi.org/10.1016/j.yebeh.2019.106570
Moretti, D. V., Babiloni, C., Carducci, F., Cincotti, F., Remondini, E., Rossini, P. M., & Babiloni, F. (2004). Computerized processing of EEG-EOG-EMG artifacts for multi-centric studies in EEG oscillations and event-related potentials. Clinical Neurophysiology, 115(6), 1447–1454. https://doi.org/10.1016/j.clinph.2004.01.019
Morris, A. M., So, Y., Lee, K. A., Lash, A. A., & Becker, C. E. (1992). The P300 event-related potential: The effects of sleep deprivation. Journal of Occupational Medicine, 34(12), 1143–1152.
Nayak, C. S., & Anilkumar, A. C. (2025). Normal EEG waveforms. In StatPearls. StatPearls Publishing. https://www.ncbi.nlm.nih.gov/books/NBK539805/
Nazish, S. (2020). Clinical and radiological correlates of different electroencephalographic patterns in hospitalized patients. Clinical EEG and Neuroscience, 52(4), 280-286. https://doi.org/10.1177/1550059420910559
Neurophysiological parameters influencing sleep–wake discrepancy in insomnia disorder: A preliminary analysis on alpha rhythm during sleep onset. (2023). Brain Sciences. MDPI. https://www.mdpi.com/2076-3425/13/2/260
Niedermeyer E. (1997). Alpha rhythms as physiological and abnormal phenomena. International Journal of Psychophysiology: Official Journal of the International Organization of Psychophysiology, 26(1-3), 31–49. https://doi.org/10.1016/s0167-8760(97)00754-x
Niedermeyer, E., & da Silva, F. L. (2004). Electroencephalography: Basic principles, clinical applications, and related fields. Lippincott Williams & Wilkins.
Nunez, P. L., & Srinivasan, R. (2006). Electric fields of the brain: The neurophysics of EEG (2nd ed.). Oxford University Press. https://doi.org/10.1093/acprof:oso/9780195050387.001.0001
Oathes, D., Ray, W., Yamasaki, A., Borkovec, T., Castonguay, L., Newman, M., & Nitschke, J. (2008). Worry, generalized anxiety disorder, and emotion: Evidence from the EEG gamma band. Biological Psychology, 79, 165-170. https://doi.org/10.1016/j.biopsycho.2008.04.005
Othmer S. ( 2007). Progress in neurofeedback for the autism spectrum. Paper presented at the 38th Annual Meeting of the Association for Applied Psychophysiology & Biofeedback Monterey, Canada, 15–18 February 2007.
Othmer, S., & Othmer, S. F. (2020). Toward a theory of infra-low frequency neurofeedback. In H. W. Kirk (Ed.), Restoring the brain: Neurofeedback as an integrative approach to health (2nd ed., pp. 56–79). Routledge. https://doi.org/10.4324/9780429275760-3
Lee, H. S., Ghetti, A., Pinto-Duarte, A., Wang, X., Dziewczapolski, G., Galimi, F., Huitron-Resendiz, S., Piña-Crespo, J. C., Roberts, A. J., Verma, I. M., Sejnowski, T. J., & Heinemann, S. F. (2014). Astrocytes contribute to gamma oscillations and recognition memory. Proceedings of the National Academy of Sciences, 111(32), E3343–E3352. https://doi.org/10.1073/pnas.1410893111
Pascual-Marqui, R. D. (2007). Discrete, 3D distributed, linear imaging methods of electric neuronal activity. Part 1: Exact, zero error localization. arXiv:0710.3341 [math-ph]. https://arxiv.org/abs/0710.3341
Pascual-Marqui, R. D., Michel, C. M., & Lehmann, D. (1994). Low resolution electromagnetic tomography: A new method for localizing electrical activity in the brain. International Journal of Psychophysiology, 18(1), 49–65. https://doi.org/10.1016/0167-8760(84)90014-X
Perlis, M. L., Smith, M. T., Andrews, P. J., Orff, H., & Giles, D. E. (2001). Beta/gamma EEG activity in patients with primary and secondary insomnia and good sleeper controls. Sleep, 24(1), 110–117. https://doi.org/10.1093/sleep/24.1.110
Petersén, I., & Eeg-Olofsson, O. (1971). The development of the electroencephalogram in normal children from the age of 1 through 15 years. Non-paroxysmal activity. Neuropadiatrie, 2(3), 247–304. https://doi.org/10.1055/s-0028-1091786
Pfurtscheller, G., & Lopes da Silva, F. H. (1999). Event-related EEG/MEG synchronization and desynchronization: Basic principles. Clinical Neurophysiology, 110(11), 1842-1857. https://doi.org/10.1016/S1388-2457(99)00141-8
Pion-Tonachini, L., Kreutz-Delgado, K., & Makeig, S. (2019). ICLabel: An automated electroencephalographic independent component classifier, dataset, and website. NeuroImage, 198, 181–197. https://doi.org/10.1016/j.neuroimage.2019.05.026
Posthuma, D., Neale, M. C., Boomsma, D. I., & de Geus, E. J. C. (2001). Are smarter brains running faster? Heritability of alpha peak frequency, IQ, and their interrelation. Behavior Genetics, 31(6), 567–579. https://doi.org/10.1023/A:1013345411773
Putman, P. (2011). Resting state EEG delta-beta coherence in relation to anxiety, behavioral inhibition, and selective attentional processing of threatening stimuli. International Journal of Psychophysiology, 80(1), 63–68. https://doi.org/10.1016/j.ijpsycho.2011.01.011
Rathee, S., Bhatia, D., Punia, V., & Singh, R. (2020). Peak alpha frequency in relation to cognitive performance. Journal of Neurosciences in Rural Practice, 11(3), 416–419. https://doi.org/10.1055/s-0040-1712585
Rockstroh, B., Elbert, T., Birbaumer, N., Wolf, P., Düchting-Röth, A., Reker, M., Daum, I., Lutzenberger, W., & Dichgans, J. (1993). Cortical self-regulation in patients with epilepsies. Epilepsy Research, 14(1), 63–72. https://doi.org/10.1016/0920-1211(93)90075-I
Rowan, A. J., & Tolunsky, E. (2003). Primer of EEG with a mini-atlas. Butterworth-Heinemann.
Sazgar, M., & Young, M. (2019). Normal EEG awake and sleep. Absolute Epilepsy and EEG Rotation Review. https://doi.org/10.1007/978-3-030-03511-2_6
Schomer, D. L., & Lopes da Silva, F. H. (Eds.). (2017). Niedermeyer's electroencephalography: Basic principles, clinical applications, and related fields (7th ed.). Oxford Academic. https://doi.org/10.1093/med/9780190228484.001.0001
Schaworonkow, N. (2023). Overcoming harmonic hurdles: Genuine beta-band rhythms vs. contributions of alpha-band waveform shape. Imaging Neuroscience, 1, 1–17. https://doi.org/10.1162/imag_a_00018
Shibasaki, H., & Hallett, M. (2006). What is the Bereitschaftspotential? Clinical Neurophysiology, 117(11), 2341–2356. https://doi.org/10.1016/j.clinph.2006.04.025
Simon, M., Schmidt, E. A., Kincses, W. E., Fritzsche, M., Bruns, A., Aufmuth, C., Bogdan, M., Rosenstiel, W., & Schrauf, M. (2011). EEG alpha spindle measures as indicators of driver fatigue under real traffic conditions. Clinical Neurophysiology, 122(6), 1168–1178. https://doi.org/10.1016/j.clinph.2010.10.044
Simonová, O., Roth, B., & Stein, J. (1967). EEG studies of healthy population--Normal rhythms of resting recording. Acta Universitatis Carolinae. Medica, 13(7), 543–551. PMID: 5620888
Singer W. (2013). Cortical dynamics revisited. Trends in Cognitive Sciences, 17(12), 616–626. https://doi.org/10.1016/j.tics.2013.09.006
Sirin, T., Şirinocak, P., Arkalı, B., Akıncı, T., & Yeni, S. (2019). Electroencephalographic features associated with intermittent rhythmic delta activity. Neurophysiologie Clinique, 49, 227-234. https://doi.org/10.1016/j.neucli.2019.01.036
Smith, M. L. (2013, Fall). Infra-slow fluctuation training: On the down-low in neuromodulation. NeuroConnections, 38–46.
Snyder, S. M., Quintana, H., Sexson, S. B., Knott, P., Haque, A. F., & Reynolds, D. A. (2008). Blinded, multi-center validation of EEG and rating scales in identifying ADHD within a clinical sample. Psychiatry Research, 159(3), 346–358. https://doi.org/10.1016/j.psychres.2007.05.006
Soroush-Vala, A., Rahmanian, M., Jadid, M., & Hassanvandi, S. (2023). Application of neurofeedback in treating epilepsy: A systematic review and meta-analysis. International Journal of Body, Mind and Culture, 10, 143-157. https://doi.org/10.22122/ijbmc.v10i2.506
Speckmann, E.-J., Elger, C. E., & Gorji, A. (2011). Neurophysiologic basis of EEG and DC potentials. In D. L. Schomer & F. H. Lopes da Silva (Eds.), Niedermeyer’s electroencephalography: Basic principles, clinical applications, and related fields (6th ed., pp. 17–31). Lippincott Williams & Wilkins.
Spiesshoefer, J., Linz, D., Skobel, E., Arzt, M., Stadler, S., Schoebel, C., Fietze, I., Penzel, T., Sinha, A. M., Fox, H., Oldenburg, O., & German Cardiac Society Working Group on Sleep Disordered Breathing (AG 35-Deutsche Gesellschaft für Kardiologie Herz und Kreislaufforschung e.V.) (2021). Sleep - the yet underappreciated player in cardiovascular diseases: A clinical review from the German Cardiac Society Working Group on Sleep Disordered Breathing. European Journal of Preventive Cardiology, 28(2), 189–200. https://doi.org/10.1177/2047487319879526
Spydell, J. D., Ford, M. R., & Sheer, D. E. (1979). Task dependent cerebral lateralization of the 40 Hertz EEG rhythm. Psychophysiology, 16(4), 347–350. https://doi.org/10.1111/j.1469-8986.1979.tb01474.x
Steriade, M., McCormick, D. A., & Sejnowski, T. J. (1993). Thalamocortical oscillations in the sleeping and aroused brain. Science, 262(5134), 679-685. https://doi.org/10.1126/science.8235588
Steriade, M., Nuñez, A., & Amzica, F. (1993). Intracellular analysis of relations between the slow (< 1 Hz) neocortical oscillation and other sleep rhythms of the electroencephalogram. The Journal of Neuroscience, 13(8), 3266–3283. https://doi.org/10.1523/JNEUROSCI.13-08-03266.1993
Sterman, M. B. (1996). Physiological origins and functional correlates of EEG rhythmic activities: implications for self-regulation. Biofeedback and Self-regulation, 21(1), 3-33. https://doi.org/10.1007/BF02214146
Sterman, M. B. (2000). Basic concepts and clinical findings in the treatment of seizure disorders with EEG operant conditioning. Clinical Electroencephalography, 31(1), 45-55. https://doi.org/10.1177/155005940003100111
Strehl, U. (2009). Slow cortical potentials neurofeedback. Journal of Neurotherapy, 13(2), 117–126. https://doi.org/10.1080/10874200902885936
Strehl, U., Aggensteiner, P., Wachtlin, D., Brandeis, D., Albrecht, B., Arana, M., Bach, C., Banaschewski, T., Bogen, T., Flaig-Röhr, A., Freitag, C. M., Fuchsenberger, Y., Gest, S., Gevensleben, H., Herde, L., Hohmann, S., Legenbauer, T., Marx, A. M., Millenet, S., … Holtmann, M. (2017). Neurofeedback of slow cortical potentials in children with attention-deficit/hyperactivity disorder: A multicenter randomized trial controlling for unspecific effects. Frontiers in Human Neuroscience, 11, Article 135. https://doi.org/10.3389/fnhum.2017.00135
Suldo, S. M., Olson, L. A., & Evans, J. R. (2002). Quantitative EEG evidence of increased alpha peak frequency in children with precocious reading ability. Journal of Neurotherapy, 5(3), 39–50. https://doi.org/10.1300/J184v05n03_05
Sutter, R., Stevens, R., & Kaplan, P. (2012). Clinical and imaging correlates of EEG patterns in hospitalized patients with encephalopathy. Journal of Neurology, 260, 1087-1098. https://doi.org/10.1007/s00415-012-6766-1
Swatzyna, R. J., Arns, M., Tarnow, J. D., Turner, R. P., Barr, E., MacInerney, E. K., Hoffman, A. M., & Boutros, N. N. (2022). Isolated epileptiform activity in children and adolescents: Prevalence, relevance, and implications for treatment. European Child & Adolescent Psychiatry, 31(4), 545–552. https://doi.org/10.1007/s00787-020-01597-2
Tan, G., Thornby, J., Hammond, D. C., Strehl, U., Canady, B., Arnemann, K., & Kaiser, D. A. (2009). Meta-analysis of EEG biofeedback in treating epilepsy. Clinical EEG and Neuroscience, 40(3), 173–179. https://doi.org/10.1177/155005940904000310
The Johns Hopkins atlas of digital EEG: An interactive training guide. (2011). Johns Hopkins University Press.
Thatcher, R. W. (1999). EEG database-guided neurotherapy. In J. R. Evans & A. Abarbanel (Eds.), Introduction to quantitative EEG and neurofeedback (pp. 29–64). Academic Press.
Thompson, M., & Thompson, L. (2015). The neurofeedback book: An introduction to basic concepts in applied psychophysiology (2nd ed.). Association for Applied Psychophysiology and Biofeedback.
Tombor, L., Kakuszi, B., Papp, S., Réthelyi, J., Bitter, I., & Czobor, P. (2019). Decreased resting gamma activity in adult attention deficit/hyperactivity disorder. The World Journal of Biological Psychiatry, 20, 691 - 702. https://doi.org/10.1080/15622975.2018.1441547
Tononi, G., & Cirelli, C. (2014). Sleep and the price of plasticity: From synaptic and cellular homeostasis to memory consolidation and integration. Neuron, 81(1), 12-34. https://doi.org/10.1016/j.neuron.2013.12.025
Uhlhaas, P. J., & Singer, W. (2010). Abnormal neural oscillations and synchrony in schizophrenia. Nature Reviews. Neuroscience, 11(2), 100–113. https://doi.org/10.1038/nrn2774
van Son, D., de Rover, M., De Blasio, F. M., van der Does, W., Barry, R. J., & Putman, P. (2019). Electroencephalography theta/beta ratio covaries with mind wandering and functional connectivity in the executive control network. Annals of the New York Academy of Sciences, 1452(1), 52–64. https://doi.org/10.1111/nyas.14180
van der Vinne, N., Vollebregt, M. A., van Putten, M. J. A. M., & Arns, M. (2017). Frontal alpha asymmetry as a diagnostic marker in depression: Fact or fiction? A meta-analysis. NeuroImage: Clinical, 16, 79–87. https://doi.org/10.1016/j.nicl.2017.07.006
Varga, A. W., Kishi, A., Mantua, J., Lim, J., Koushyk, V., Leiberg, S., Heintz, C., Naik, S., Rapoport, D. M., & Ayappa, I. (2016). Abnormal sleep spindles and slow waves in sleep apnea and Alzheimer disease. Sleep, 39(4), 775-787. https://doi.org/10.5665/sleep.5634
Vernon, D., Egner, T., Cooper, N., Compton, T., Neilands, C., Sheri, A., & Gruzelier, J. (2003). The effect of training distinct neurofeedback protocols on aspects of cognitive performance. International Journal of Psychophysiology, 47(1), 75-85. https://doi.org/10.1016/S0167-8760(02)00091-0
Wahbeh, H., & Oken, B. S. (2013). Peak high-frequency HRV and peak alpha frequency higher in PTSD. Applied Psychophysiology and Biofeedback, 38(1), 57–69. https://doi.org/10.1007/s10484-012-9208-z
Watemberg, N., Linder, I., Dabby, R., Blumkin, L., & Lerman-Sagie, T. (2007). Clinical correlates of occipital intermittent rhythmic delta activity (OIRDA) in children. Epilepsia, 48(2), 330–334. https://doi.org/10.1111/j.1528-1167.2006.00937.x
Whitford, T. J., Rennie, C. J., Grieve, S. M., Clark, C. R., Gordon, E., & Williams, L. M. (2007). Brain maturation in adolescence: Concurrent changes in neuroanatomy and neurophysiology. Human Brain Mapping, 28(3), 228–237. https://doi.org/10.1002/hbm.20275
Williams D. (1941). The electro-encephalogram in acute injuries. Journal of Neurology and Psychiatry, 4(2), 107–130. https://doi.org/10.1136/jnnp.4.2.107
Willoughby, J., Fitzgibbon, S., Pope, K., Mackenzie, L., Medvedev, A., Clark, C., Davey, M., & Wilcox, R. (2003). Persistent abnormality detected in the non-ictal electroencephalogram in primary generalised epilepsy. Journal of Neurology, Neurosurgery & Psychiatry, 74, 51 - 55. https://doi.org/10.1136/jnnp.74.1.51.
Xie, L., Kang, H., Xu, Q., Chen, M. J., Liao, Y., Thiyagarajan, M., O'Donnell, J., Christensen, D. J., Nicholson, C., Iliff, J. J., Takano, T., Deane, R., & Nedergaard, M. (2013). Sleep drives metabolite clearance from the adult brain. Science, 342(6156), 373-377. https://doi.org/10.1126/science.1241224