Essential Terms and Concepts
What You Will Learn in This Chapter
Electricity is the foundation of nearly every biofeedback application. The biological signals you monitor—from skeletal muscle voltages to cortical EEG rhythms—travel through the body as currents of charged atoms and molecules called ions. The hardware that detects these signals runs on batteries or wall outlets that supply currents of electrons. Without a working knowledge of electricity and the circuits inside biofeedback instruments, you risk accepting readings produced by equipment misuse or malfunction—a classic case of "garbage in, garbage out."
This unit covers three interconnected topics: Basic Terms and Metrics, EEG Recording, and Safety Precautions.
BCIA Blueprint Coverage: This unit addresses III. Instrumentation and Electronics - A. Essential Terms and Concepts.

▶ Listen to the Full-Length Lecture
Basic Terms and Metrics
Building Blocks of Matter
This section introduces the atomic building blocks relevant to biofeedback, from the structure of atoms to the ions that carry biological signals. These concepts may seem far removed from clinical practice, but they explain why the EEG, SEMG, and electrodermal signals you monitor behave the way they do.
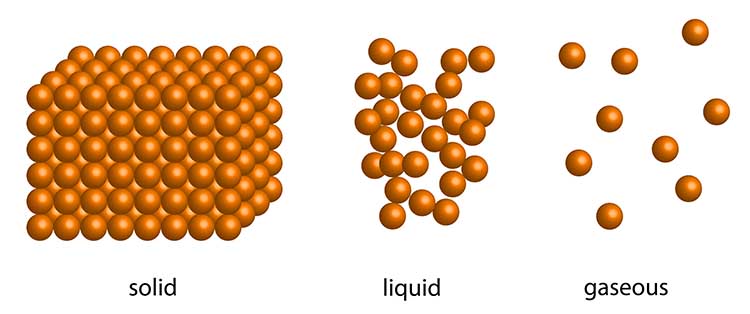
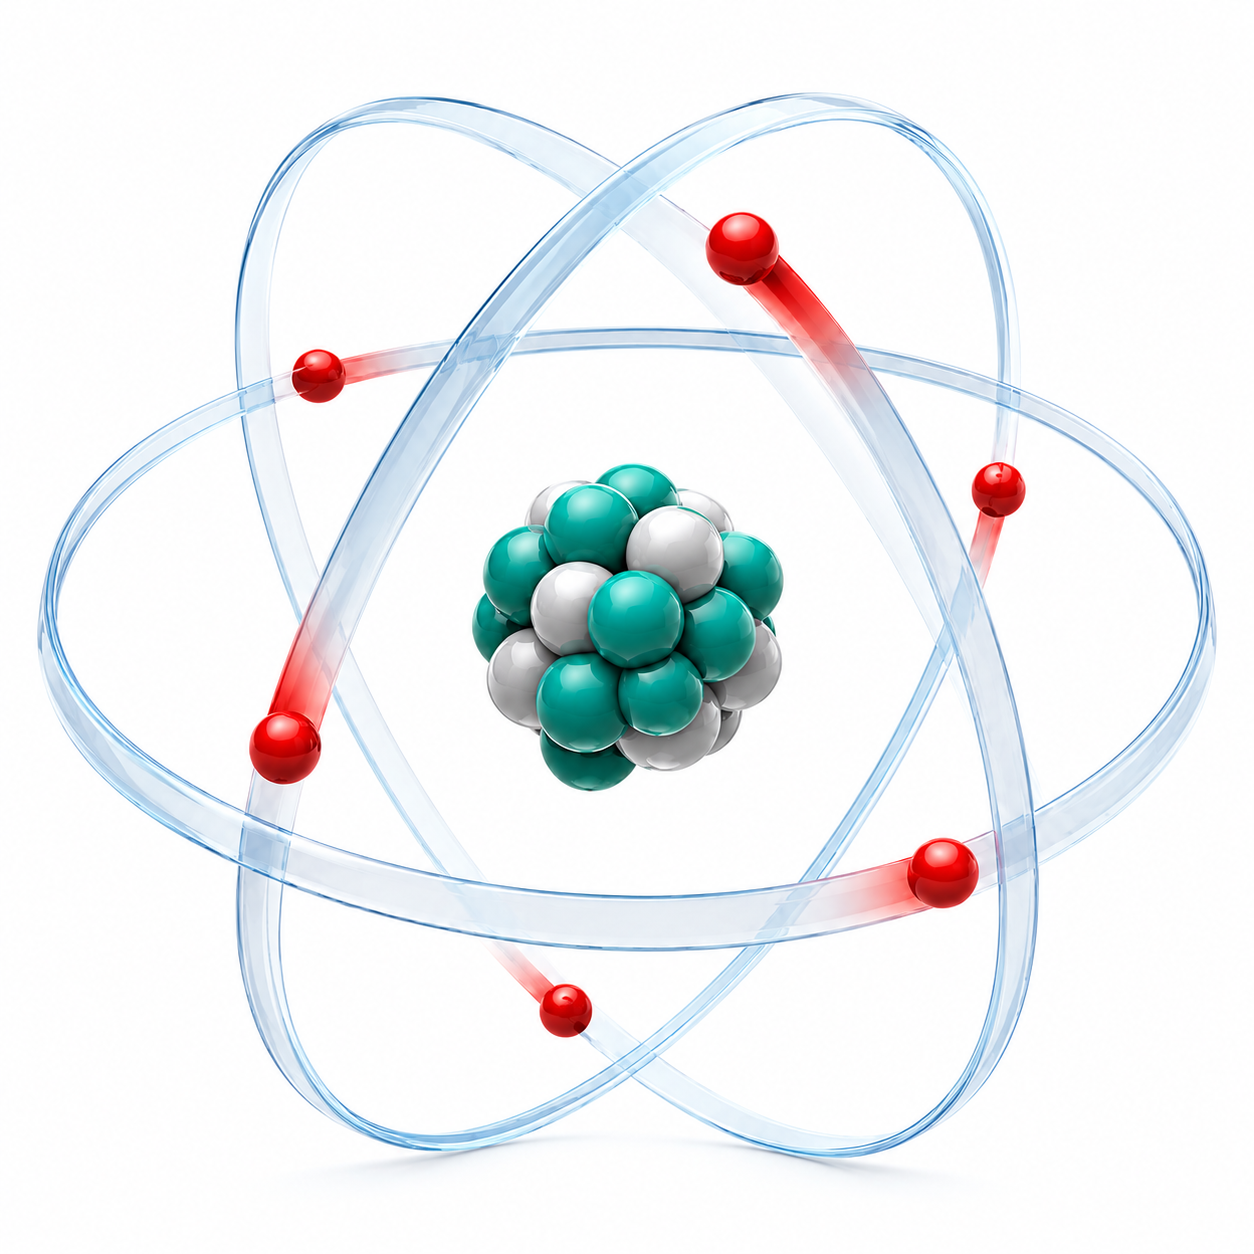
The matter comprising our universe occupies space and possesses mass, and it can assume solid, liquid, gaseous, and plasma states. Matter is built from atoms, the basic units consisting of a central nucleus surrounded by orbiting electrons. Graphic © magnetix/Shutterstock.com.
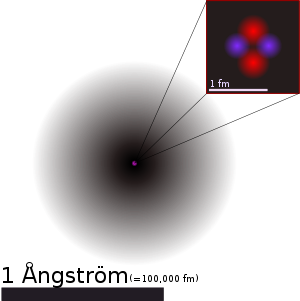
The positively charged nucleus contains most of an atom's mass in the form of positively charged protons and uncharged neutrons. Negatively charged electrons occupy regions of probability called orbitals at varying distances from the nucleus and participate in chemical reactions. The familiar image of electrons circling the nucleus like planets is a convenient simplification rather than a literal description. In a neutral atom, the number of electrons equals the number of protons, so the positive and negative charges cancel out and the atom's net charge is zero.
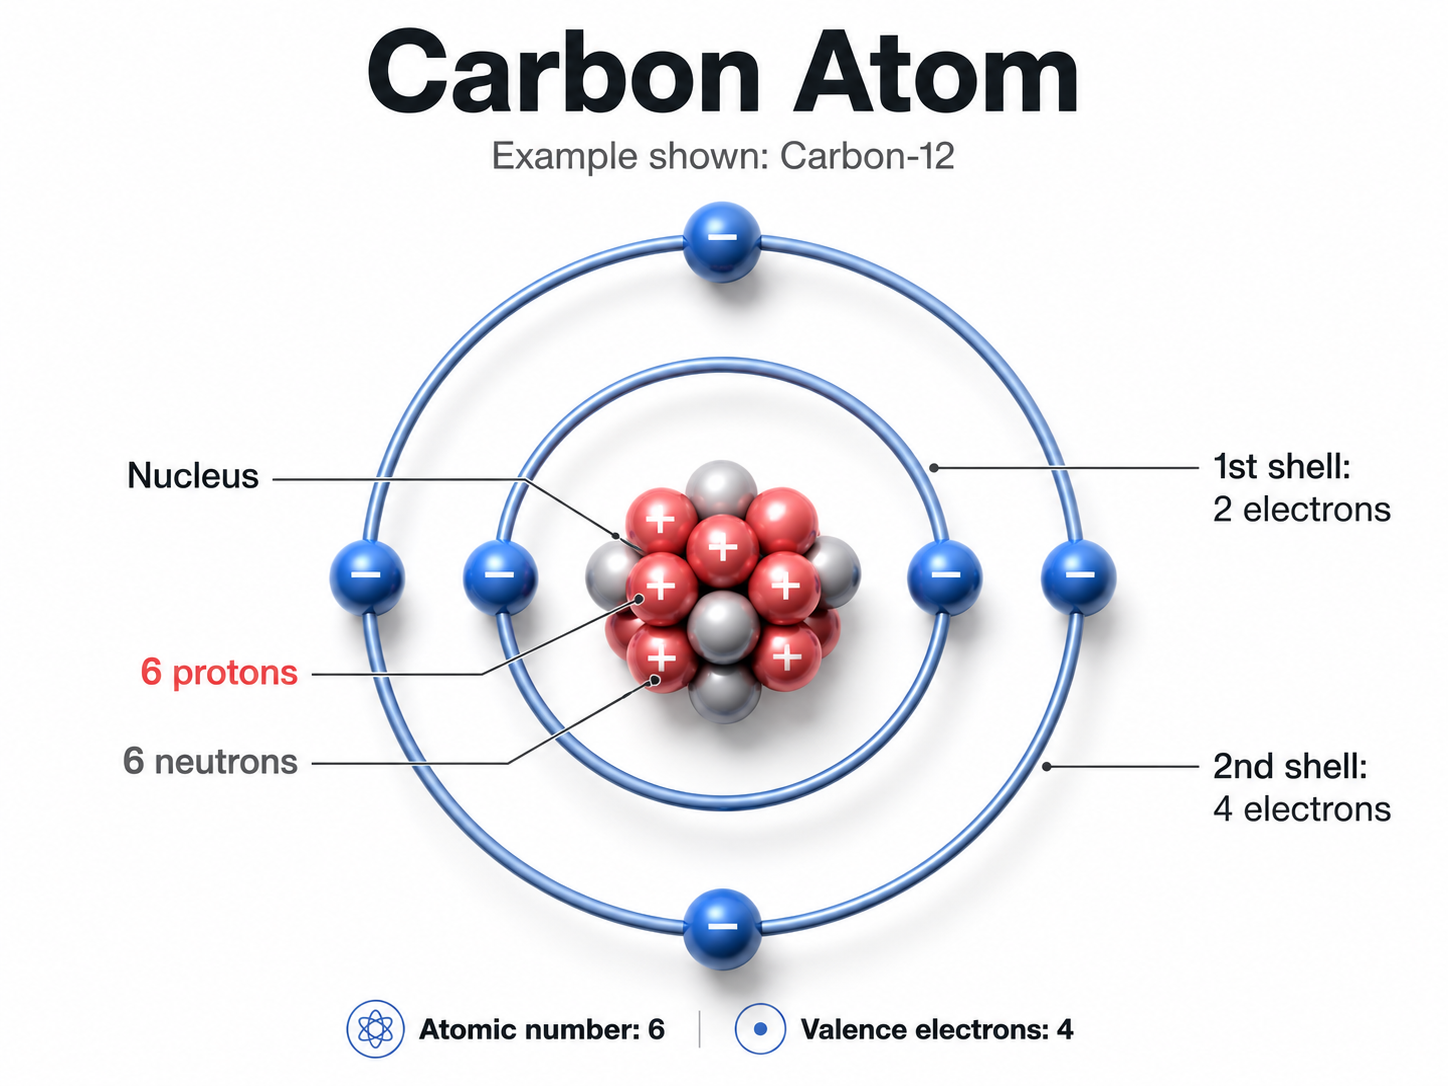
Elements are substances whose atoms all share the same atomic number and that cannot be broken down by ordinary chemical reactions. The periodic table currently contains 118 named elements (Grant, 2015). Six of them—carbon (C), hydrogen (H), nitrogen (N), oxygen (O), phosphorus (P), and sulfur (S), often abbreviated CHNOPS—account for the great majority of the body's mass, and calcium (Ca) is the most abundant mineral element. For biofeedback practitioners, four elements are especially relevant: calcium (Ca), chlorine (Cl), potassium (K), and sodium (Na) supply the ions that generate the physiological potentials—like the EEG—that you monitor in every session.

How does a carbon atom differ from a sodium atom? The difference lies in the number of protons in the nucleus. Carbon has 6 protons while sodium has 11, and this total defines an element's atomic number. The combined number of protons and neutrons is the mass number, which approximates but does not equal the atomic weight—the weighted average mass of an element's naturally occurring isotopes.
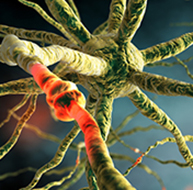
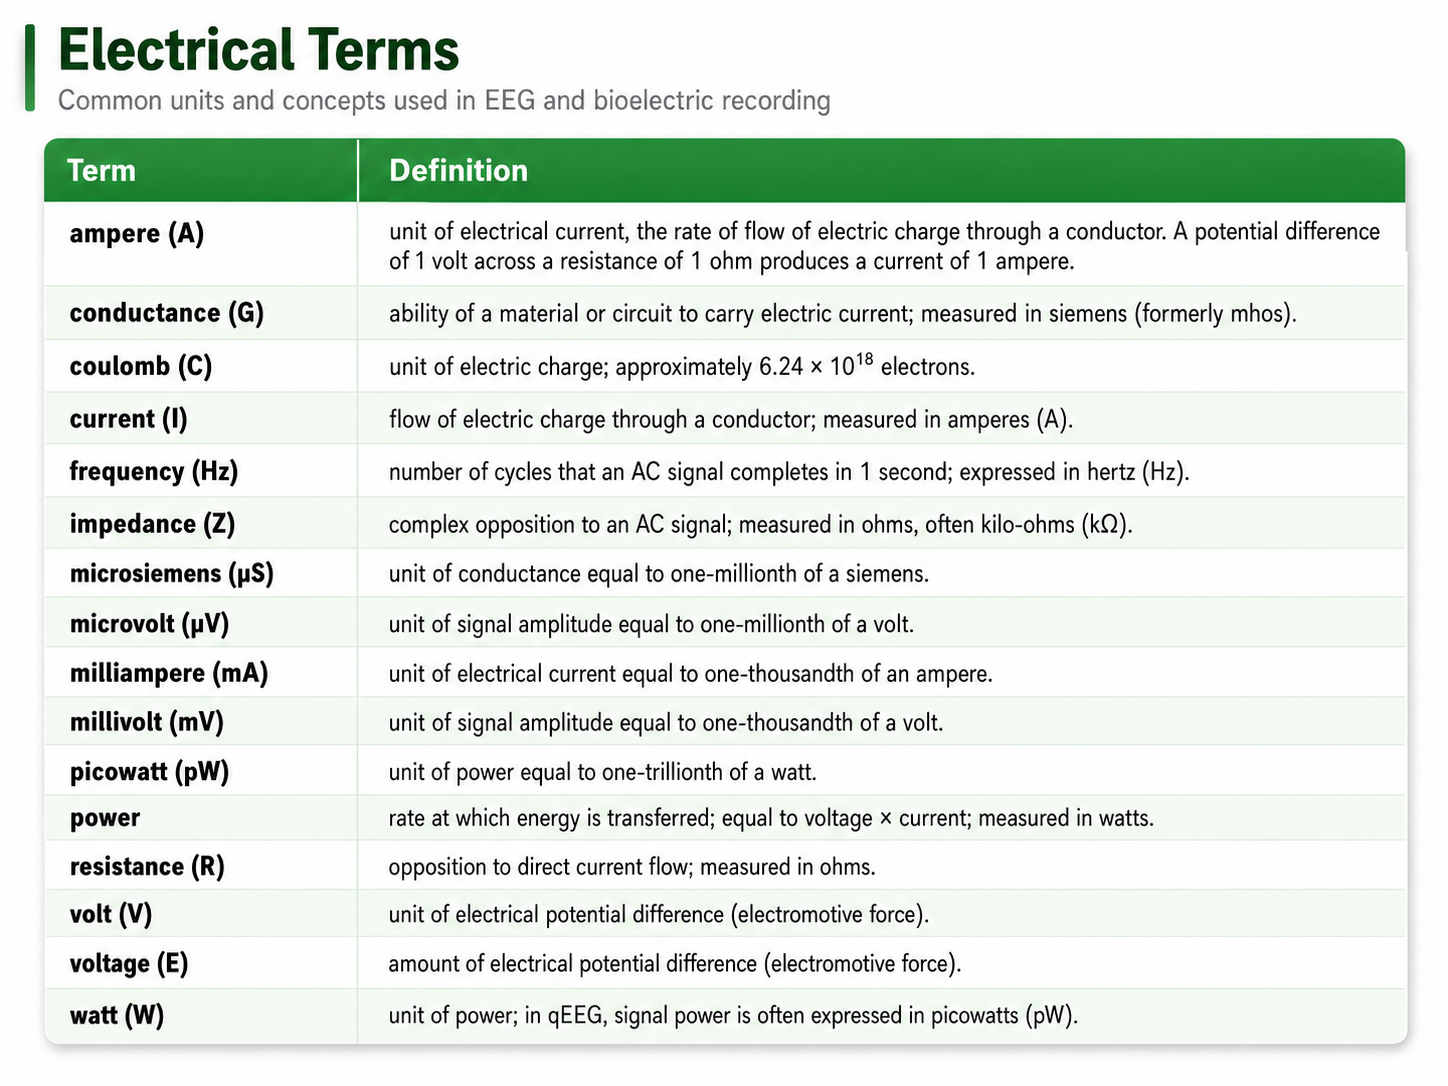
Ions are atoms or molecules that carry an electrical charge because they have gained or lost electrons. The biological potentials produced by cortical neurons (EEG), eccrine sweat glands (EDA), and skeletal muscles (SEMG) are all currents of ions—specifically chloride (Cl-), potassium (K+), and sodium (Na+). Understanding ions is essential because they are the currency of every biological signal you will record.
Electric Current
This section explains how electric current works, why it flows, and how the materials in its path influence its movement. These principles apply directly to both the ionic currents inside your clients' bodies and the electronic currents inside your instruments.
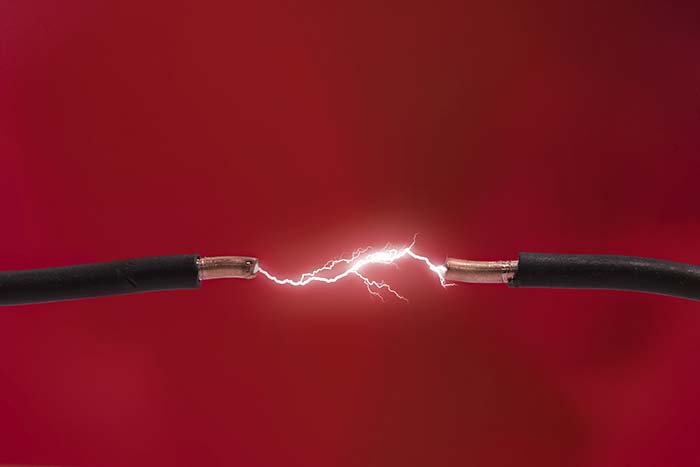
Charge (Q) indicates the imbalance between positively and negatively charged particles in a given place or between two locations, and it is measured in coulombs. When there is a charge imbalance between two points—say, between the two ends of a wire—negatively charged electrons flow toward the positively charged end, creating an electric current (I). This flow occurs because opposite charges attract while identical charges repel. This unit follows the electron-flow convention, describing movement from negative to positive. Most engineering texts and circuit diagrams instead use conventional current, drawn in the opposite direction from positive to negative; the underlying physics is identical and only the bookkeeping differs (Nilsson & Riedel, 2008).
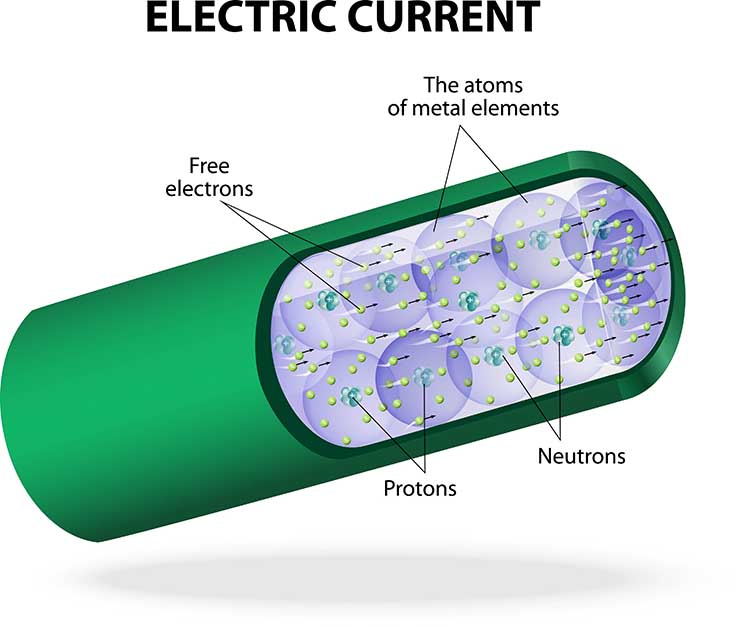
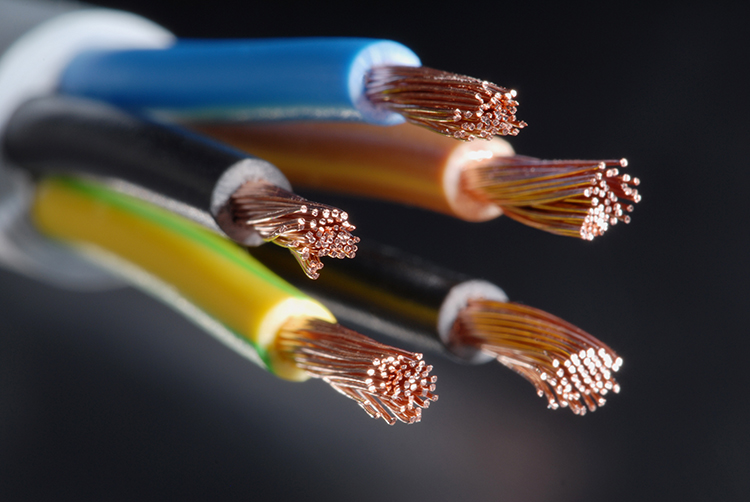
Electrons are also affected by the materials in their path. Conductors like copper allow electron movement freely, while insulators enclosing the wires—such as rubber or glass—oppose their movement. This conductor-insulator distinction matters in biofeedback: your electrode cables are conductors wrapped in insulation, and the biological signals you record must traverse both conducting and insulating tissues.
Volume Conduction and Biological Insulators
This section explains how biological signals travel through the body to reach your electrodes, and why the body's own insulating tissues can attenuate those signals. These principles directly affect the quality of recordings in every biofeedback modality.
Biological signals like the EEG do not travel through wires inside the body—they travel through interstitial fluid, the fluid between cells. Signals bump their way through body fluids as a current of colliding ions (not electrons) until they reach the skin. This process, called volume conduction, is what allows clinicians to eavesdrop on cortical potentials from the scalp instead of inserting electrodes directly into the brain.
Electrodes are specialized conductors that convert these ionic biological signals into currents of electrons. Surface EEG electrodes loosely resemble an antenna, detecting the signals produced by macrocolumns of cortical neurons, but the comparison should not be taken literally.
A radio antenna captures electromagnetic waves that radiate through space, whereas an EEG electrode senses voltage changes produced by ions conducting through the adjacent tissue. The comparison to an FM radio broadcast is likewise loose, describing only the spread of a signal from a source to a distant receiver.
The brain does not transmit radio waves, and volume conduction is a near-field process, meaning the signal spreads through nearby conductive tissue rather than radiating across space (Stern et al., 2001).
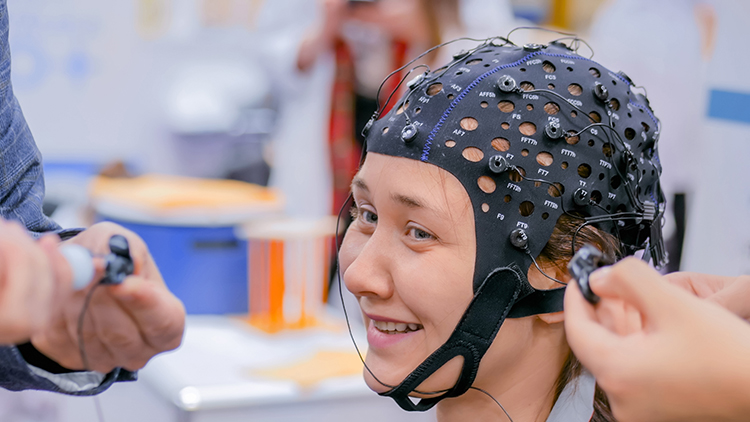
However, insulation from body fat, connective tissue, and the epidermis (the outermost skin layer) interferes with ion current flow and can significantly reduce surface EMG readings. Like the rubber covering muscle electrode wiring, biological insulators block the flow of electric currents.
The difference between a conductor and an insulator comes down to how tightly an atom holds the electrons in its valence shell, the outermost energy level that takes part in conduction. Conductors such as copper hold only one or two loosely bound valence electrons that break free easily and drift as current, whereas insulators such as rubber and glass keep their valence electrons in nearly full, tightly bound shells that resist this loss (Nilsson & Riedel, 2008).
Measuring Current
The "amount" of electric current is measured in amperes (A). A current of 1 ampere flows when 1 coulomb of charge—the charge carried by roughly 6.24 x 10¹⁸, or about 6 billion billion, electrons—passes a point in 1 second (Kubala, 2009). In biofeedback practice, the currents you encounter are far smaller—typically measured in milliamperes (mA) or even microamperes (µA).
DC and AC
This section covers the two fundamental forms of electricity—direct current and alternating current—and explains which biological signals belong to each category. Knowing the difference is essential because your instruments process DC and AC signals differently.
Direct current (DC) is the flow of electricity in one direction, driven by a difference in electrical potential. Electrons travel from the negative end of a wire, which repels them, toward the positive end, which attracts them, producing a steady one-way flow. Several biofeedback modalities—peripheral blood flow (blood volume pulse and skin temperature), respiration, and electrodermal activity—produce slowly varying signals that are recorded through DC-coupled channels because their clinically meaningful information lies at or near 0 Hz. Two qualifications are worth noting: skin temperature is a thermal quantity converted to a voltage by a transducer rather than a current in its own right, and the blood volume pulse has a pulsatile component near 1 Hz that many systems display AC-coupled. "DC" here describes how a channel is coupled, not a signal that literally never changes direction.
The electroencephalogram (EEG) contains both DC components (slow cortical potentials) and AC waveforms (delta through 40-Hz activity). BioGraph ® Infiniti blood volume pulse (BVP) display.
In contrast, an alternating current (AC) regularly reverses direction (e.g., line current completes 50 or 60 cycles per second and, because direction reverses twice per cycle, changes direction 100 or 120 times each second). The frequency of an alternating current is the number of cycles completed per second, measured in hertz (Hz). Electrical potentials detected from the cerebral cortex (EEG), heart (ECG), and skeletal muscles (SEMG) all contain AC waveforms (Kubala, 2009). Check out the YouTube video AC and DC Differences.
BioGraph ® Infiniti 60-Hz artifact display. The software uses an auto-scale feature to keep the fluctuating signal on the screen.
The movie below is a single-channel BioTrace+ /NeXus-32 display of EEG activity from 1-64 Hz broken into component delta, theta, alpha, and beta frequency bands by digital filters © John S. Anderson.
Electromotive Force (EMF)
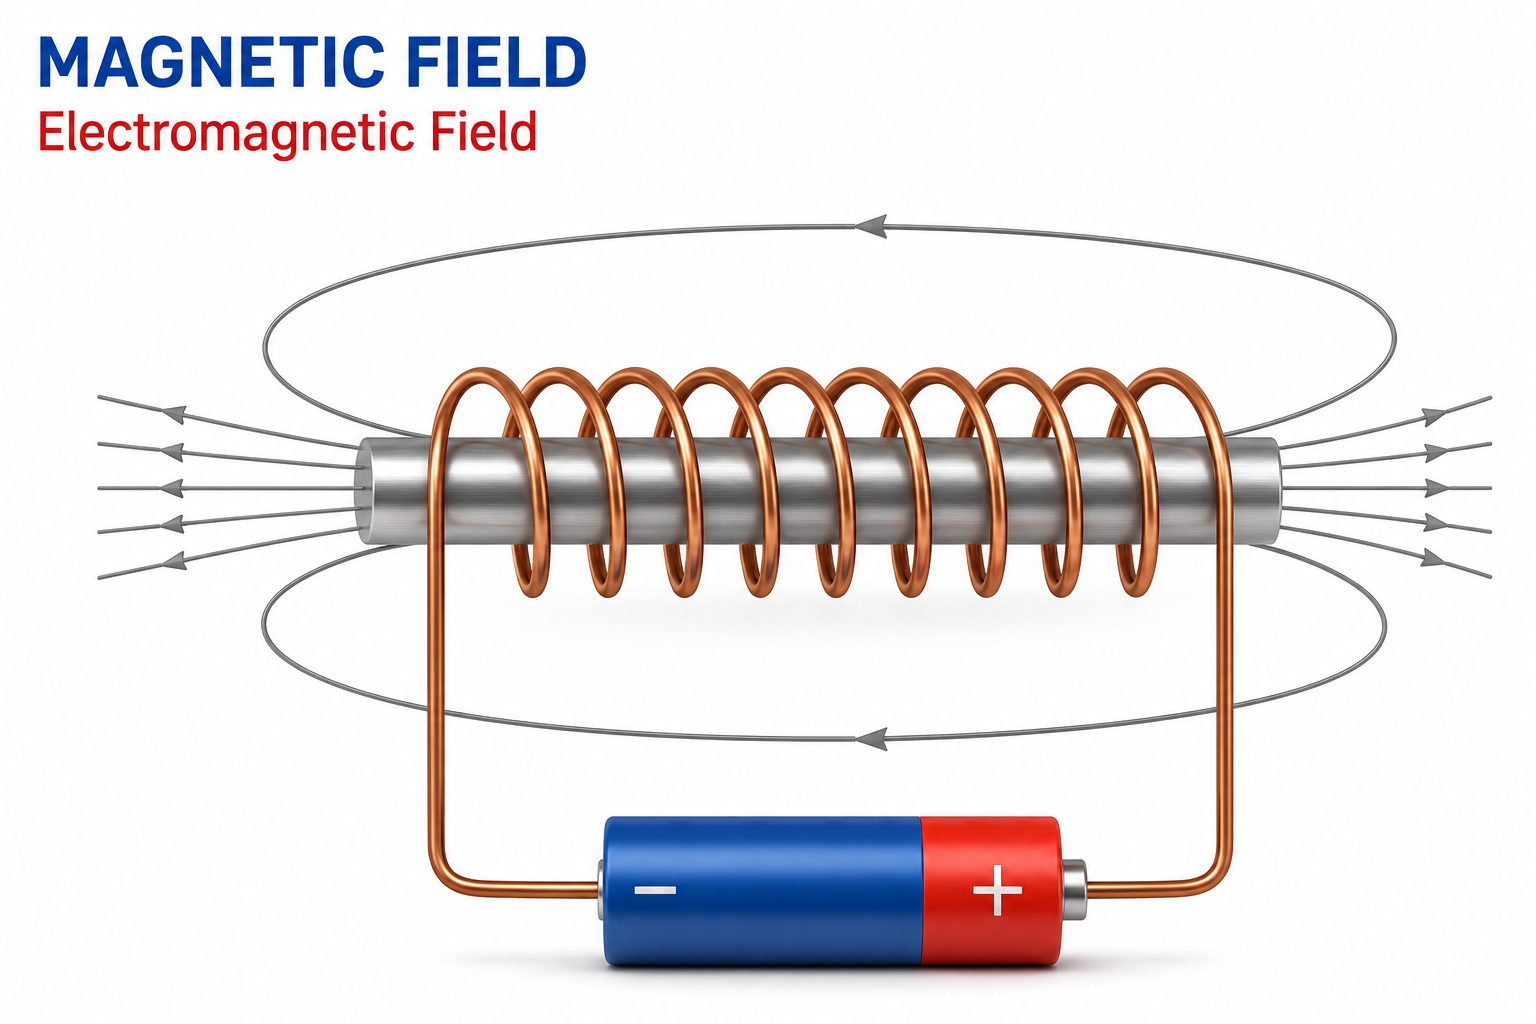
What forces electrons to move through a circuit? Electrons flow when there is a difference in electrical potential or charge. Consider a flashlight: its battery contains negative and positive poles, and these two regions of opposite charge produce an electrical potential difference called the electromotive force (EMF) that drives the current forward.
The battery's negative pole repels electrons while its positive pole attracts them, resulting in current flow. If both poles had identical charges, electrons would stay put—no potential difference means no current and no light (Nilsson & Riedel, 2008). This same principle operates in your clients' nervous systems: differences in ion concentration across neuronal membranes create the potential differences that drive the EEG signals you record.
Electrons Drift While Electromagnetic Fields Carry the Energy
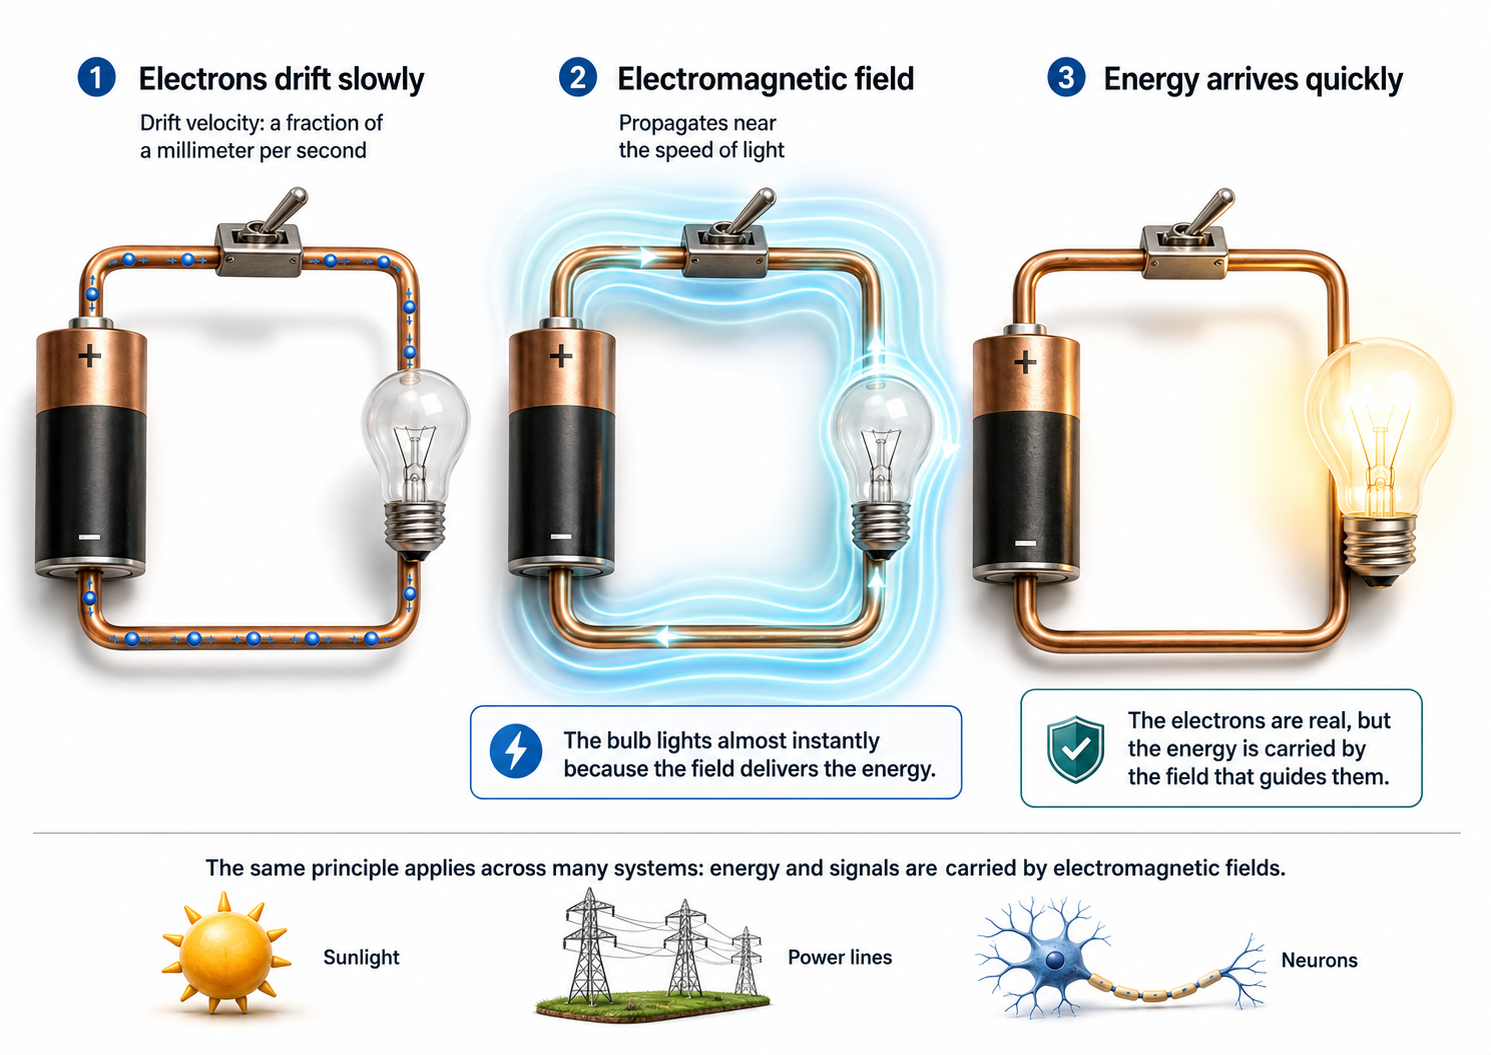
The electron-flow model used throughout this unit is a useful and largely accurate picture, but it needs one refinement. Electrons do move through a conductor, yet they travel remarkably slowly, a sluggish motion called drift velocity that amounts to only a fraction of a millimeter per second.
The bulb still lights almost instantly because the electromagnetic field, the region of electric and magnetic influence surrounding the circuit, propagates near the speed of light and delivers the energy to the bulb.
In other words, the drifting electrons are real, but the energy that powers your equipment is carried by the field that guides them, and the same principle holds for sunlight, power lines, and neurons.
Watch the YouTube video, The Big Misconception About Electricity, for a fuller treatment.
Voltage
The pressure a battery exerts on electrons flowing through a flashlight is the voltage, measured in volts (V). A typical flashlight battery is rated at 1.5 volts, where one volt is the potential difference that gives each coulomb of charge (6.24 x 10¹⁸ electrons) one joule of energy, the joule being the standard unit of energy and work. Voltage is closely tied to a signal's strength, and the next sections trace how voltage, current, and power relate (Nilsson & Riedel, 2008).
When monitoring biological signals, you will encounter amplitudes ranging from microvolts (μV)—millionths of a volt—to millivolts (mV)—thousandths of a volt. EEG and SEMG amplitudes are measured in microvolts and are usually less than 100 μV, which underscores why sensitive amplification is so critical in clinical practice.
Some neurofeedback software expresses quantitative EEG (qEEG) signal strength in picowatts (trillionths of a watt). Be precise about what that label means. EEG power is computed as amplitude squared and therefore carries units of microvolts squared (μV2); the picowatt label follows from dividing by a reference resistance of 1 ohm, since 1 μV2 across 1 ohm equals 1 pW. The numerical value is unchanged, so picowatts here is a labeling convention rather than a measurement of true electrical power delivered by the scalp. The qEEG is a form of digitized statistical brain mapping that typically uses a montage of at least 19 channels, the number required by most normative databases, to measure EEG amplitude and power within specific frequency bins.
Watts
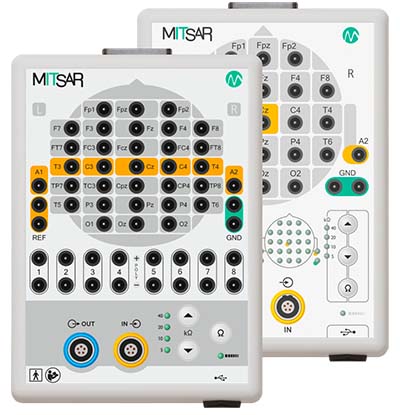
An electric current's overall power depends on both the amount of current flowing through a circuit (measured in amperes) and the electric potential driving it (measured in volts). Electric power is measured in watts (W), where one watt equals one ampere flowing across a potential difference of one volt. For example, an appliance that draws 10 amperes at 115 volts consumes 1,150 watts (Kubala, 2009). Below are 21- and 32-channel Mitsar amplifier systems featured on the NovaTech EEG website.
This relationship explains why EEG signal strength can be reported in two different ways. The signal's voltage, or amplitude, can be stated directly in microvolts, or the same signal can be described by its power, the rate at which energy is delivered, expressed in μV2 or, under the 1-ohm convention described earlier, in picowatts.
These are not interchangeable units for one quantity, because power rises with the square of amplitude, so doubling a signal's microvolt amplitude quadruples its power. Knowing which measure your software displays prevents you from misreading a fourfold change in power as a fourfold change in amplitude.
Resistance
This section covers resistance and conductance—two sides of the same coin—and explains why they matter for every biofeedback recording you perform. Understanding these concepts will help you troubleshoot signal quality problems and appreciate why skin preparation is not just a formality.
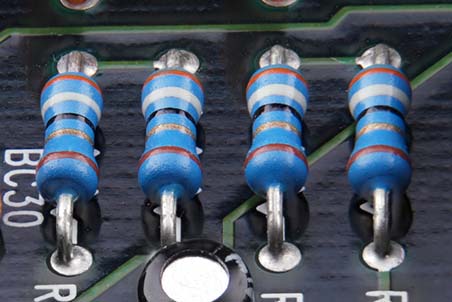
Electrons moving through a conductor encounter opposition that reduces current flow. This opposition is called resistance (R) in DC circuits and impedance (Z) in AC circuits, and both are measured in ohms (Ω). A material's resistance reflects how tightly its atoms hold their valence electrons: tightly bound electrons in nearly full outer shells leave few carriers free to move, raising resistance, whereas loosely bound valence electrons travel readily and lower it. A given conductor's resistance also rises with its length and falls as its cross-sectional area increases. In metals such as copper, resistance rises with temperature as well, but this relationship is reversed in semiconductors and in many electrolytes, including the conductive gels and pastes used in EEG recording.
▶ Mini-Lecture on Resistance and Conductance
Resistance is a practical concern in every biofeedback session, because weak biological signals must be distinguished from stronger competing signals (artifacts). Clinicians clean, abrade, and apply conductive gel to the skin when monitoring the brain (EEG) and skeletal muscles (SEMG) because dead skin, oil, and dirt behave as insulators that raise skin-electrode impedance. High and unequal impedances cost only a little signal amplitude with a modern high-impedance amplifier, but they markedly increase susceptibility to power line interference and movement artifact, which is the principal reason skin preparation matters (Kappenman & Luck, 2010).

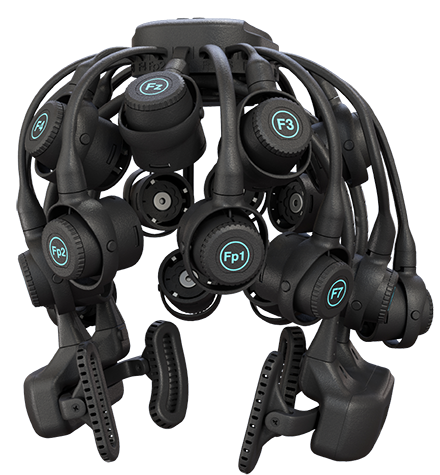
Dry electrodes, like BrainMaster's Freedom 20R, eliminate the need for time-consuming skin preparation and conductive paste application. These electrodes trade some signal quality for convenience, making them attractive for certain clinical and training applications.
Skin resistance is also a biological signal in its own right, reflecting emotional and cognitive processes. Clinicians measure skin resistance level (SRL) by passing a small alternating or direct current across the inner surface of the fingers or palm. SRL is expressed in kilohms and, when normalized for electrode contact area, in kilohm-centimeters squared (KΩ·cm2). Reported values vary widely with electrode size, recording site, and instrument; figures spanning roughly 10 to 500 KΩ are commonly cited, and any value must be interpreted against the norms supplied with your own equipment. Lower values reflect more intense sweat gland activity since the moisture and minerals in sweat reduce resistance—a principle that makes electrodermal monitoring possible.
Conductance
Resistance and conductance are mirror images of each other: resistance is the reciprocal of conductance. Where resistance measures the opposition free electrons encounter, conductance (G) indexes how easily they travel through a conductor like copper or silver. Resistance is expressed in ohms (Ω), while conductance is measured in siemens (S), the unit that replaced the older mho—ohm spelled backwards. Because the two are reciprocals, a resistance of 100 KΩ corresponds to a conductance of 10 μS. Skin conductance is one index of eccrine sweat gland activity, making it a widely used measure in biofeedback and psychophysiological research.
Ohm's Law
This section introduces Ohm's law, the fundamental equation governing the relationship between voltage, current, and resistance. This relationship explains why skin preparation improves recordings and why amplifier design matters for signal quality.
Ohm's law states that the "amount" of current (I) flowing through a conductor equals the voltage (E)—the "push"—divided by the resistance (R). These values are measured in amperes, volts, and ohms, respectively (Nilsson & Riedel, 2008). The law can be restated to find any value in a DC circuit: Voltage (E) = current (I) x resistance (R). For example, 10 volts = 2 amperes x 5 ohms. Check out the YouTube video MAKE Presents: Ohms Law.
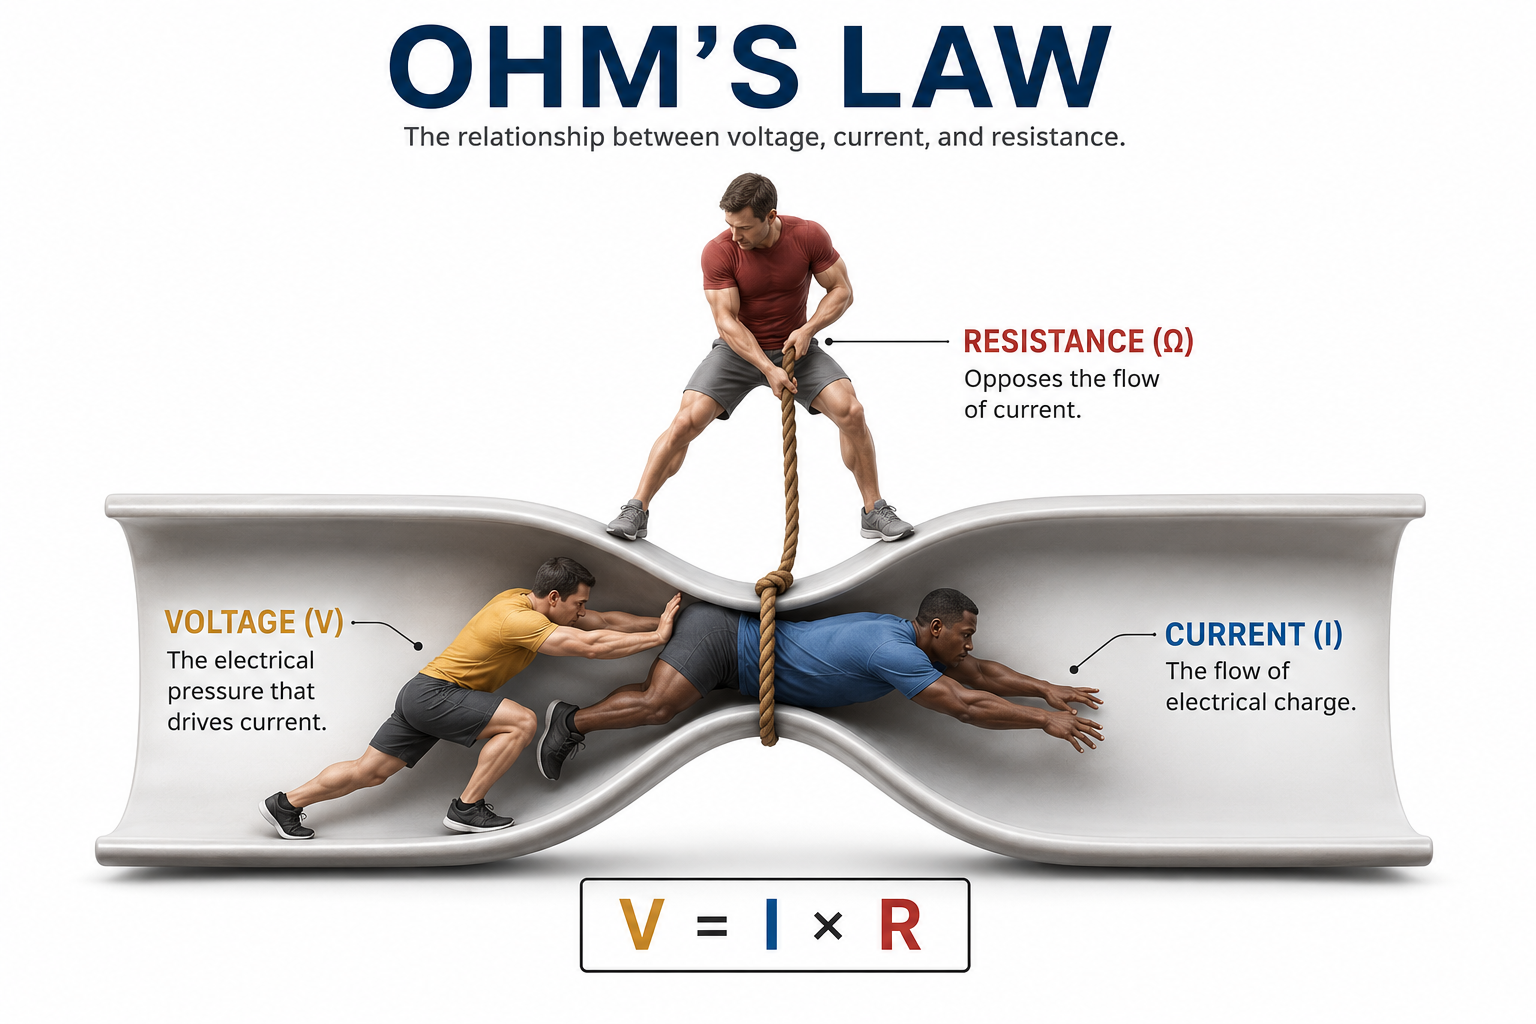
Ohm's law is valuable because it explains two strategies that help biofeedback instruments recover adequate voltages. First, since voltage (E) = current (I) x resistance (R), the voltage developed across any element of a circuit grows with that element's resistance. Hardware designers exploit this relationship: the skin-electrode interface and the amplifier input together form a voltage divider, so when the amplifier's differential input impedance is very large compared with the skin-electrode impedance, nearly the entire EEG voltage is dropped across the amplifier input instead of being lost at the electrode. Note the distinction: a high input impedance does not create additional voltage, it preserves the voltage the brain already generated, and that preserved amplitude is what allows genuine EEG activity to be separated from artifacts.
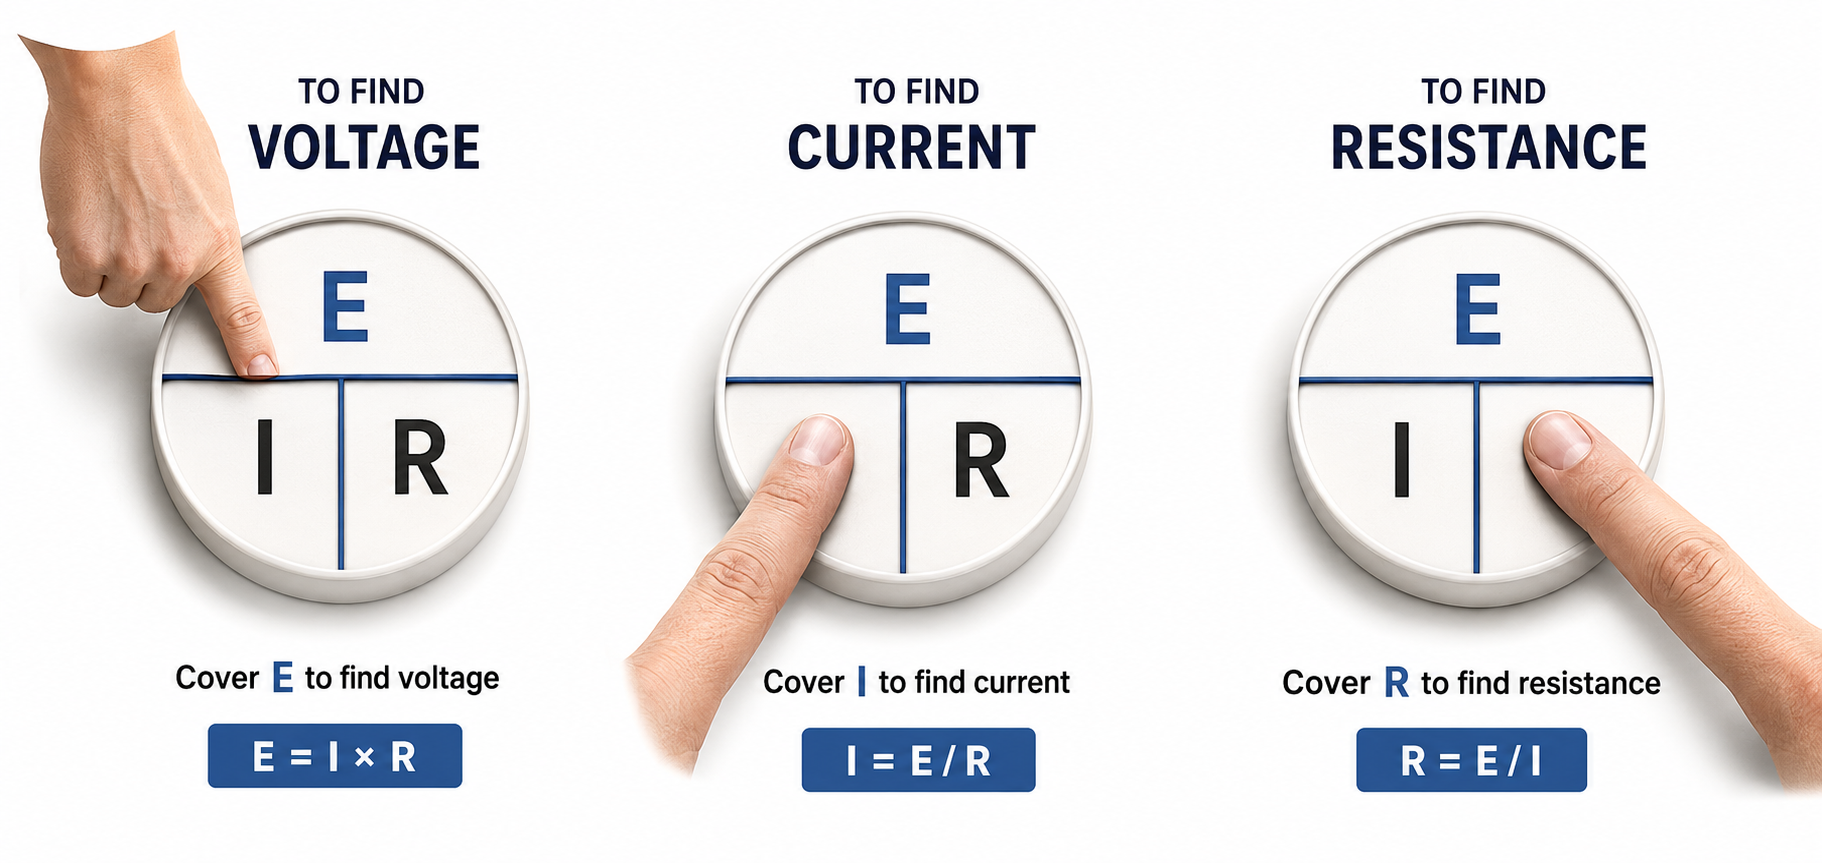
Second, we can restate Ohm's law from the standpoint of current: if current (I) = voltage (E) / resistance (R), then lowering resistance increases the current a given voltage can drive. Skin abrasion and conductive gel or paste lower the resistance and impedance of the skin-electrode interface. It is worth being precise about why this helps. Modern EEG amplifiers present such high input impedance that they draw almost no current from the client, so the benefit of skin preparation is not that more current reaches the amplifier. Rather, lower and better matched impedances reduce the voltage lost at the interface, preserve common-mode rejection, and lower the recording's susceptibility to power line and movement artifact (Kappenman & Luck, 2010).
Impedance
This section addresses impedance—the AC counterpart to resistance—and explains why impedance testing is one of the most important quality-control steps in every biofeedback session. Poor impedance management is among the most common causes of inaccurate recordings.
In AC circuits, current periodically reverses direction, and the rate of this reversal is the signal's frequency, the number of cycles completed each second, measured in hertz (Hz). When an AC signal travels through a circuit at a given frequency, it encounters a complex form of opposition called impedance (Z), measured in ohms (Ω). In EEG recording, the skin-electrode interface presents an impedance in series with the amplifier input. High impedance costs a modest amount of signal amplitude, but its more serious effect is to degrade common-mode rejection and invite interference, so artifact typically grows faster than signal is lost (Kappenman & Luck, 2010).
Why is impedance called "complex" rather than simply resistance? A DC circuit experiences resistance as a single fixed value, but an AC circuit adds a second, frequency-dependent component called reactance, the opposition that appears when a circuit stores and then releases energy as the current alternates. Impedance is the combination of resistance and reactance.
Most of the reactance at the skin-electrode interface comes from capacitance, the ability of two conductive regions separated by a thin insulator to store electrical charge, which occurs naturally where electrode metal, electrolyte gel, and skin layers sit close together.
Because reactance changes with frequency, the same electrode site can oppose a slow signal more than a fast one, which is one reason low-frequency and infra-slow recordings are so demanding.
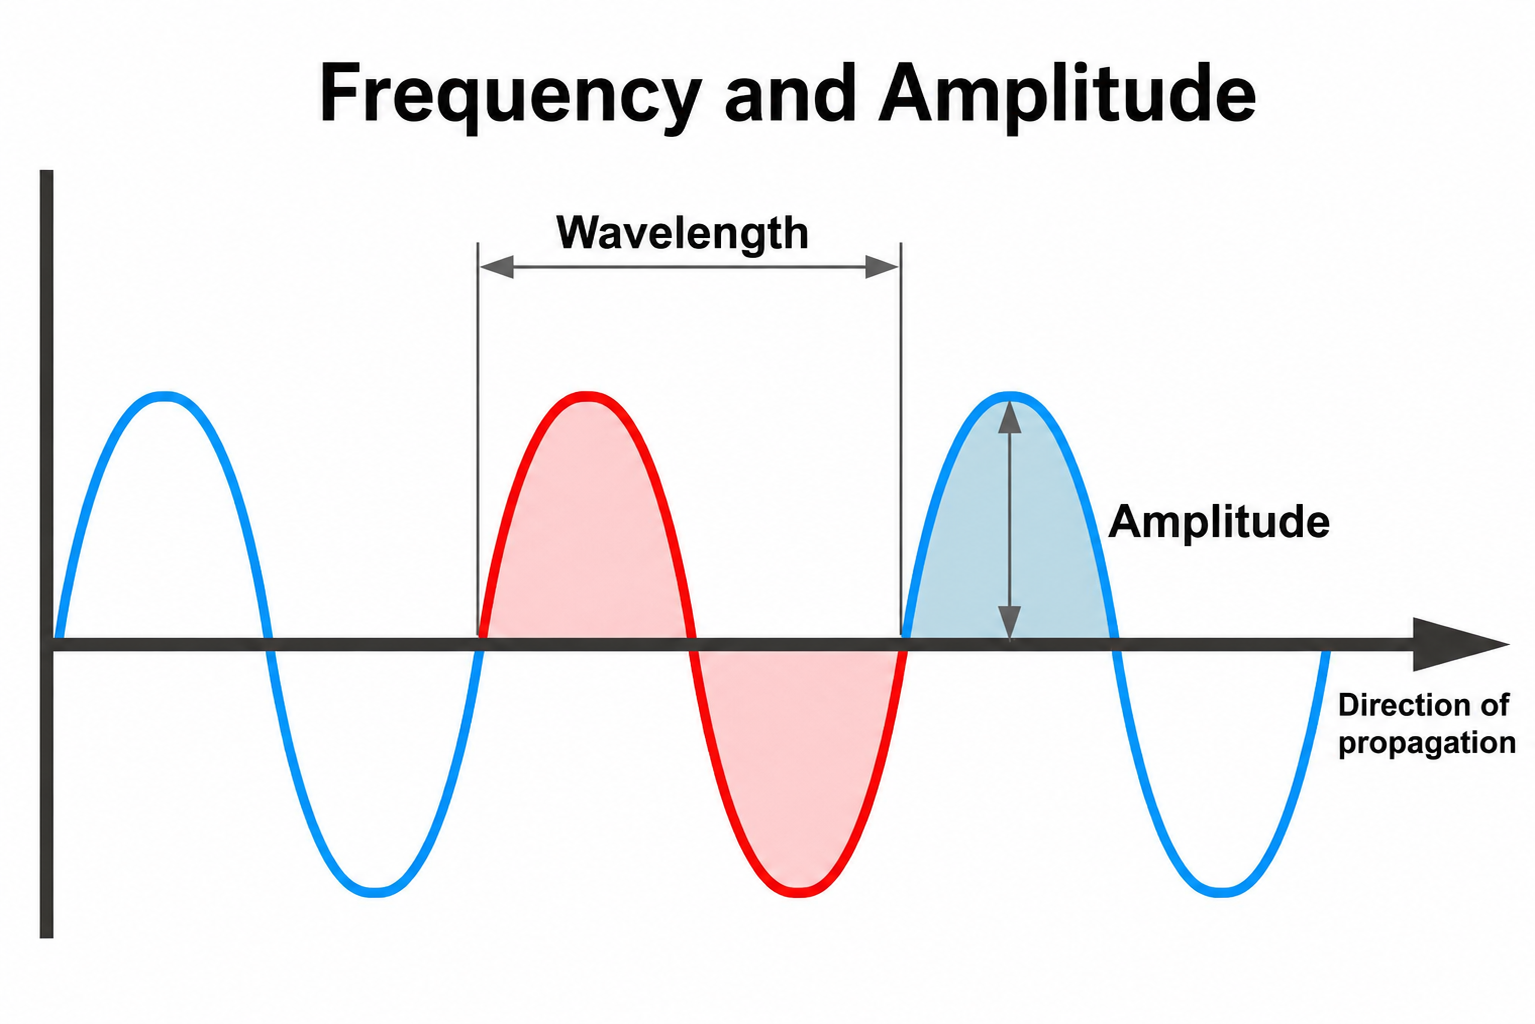
Wavelength and frequency share an inverse relationship. Frequency refers to the number of complete wave cycles that pass a given point per unit of time, typically measured in hertz. Because wave speed remains constant for a given medium, a longer wavelength means fewer cycles can pass a fixed point each second, resulting in a lower frequency. Conversely, a shorter wavelength allows more cycles to pass in the same amount of time, producing a higher frequency. This relationship is expressed mathematically as speed equals frequency multiplied by wavelength, so if speed is held constant, frequency and wavelength must change in opposite directions.
Clinicians perform an impedance test to verify that they have correctly cleaned and abraded the skin and applied electrodes with sufficient gel or paste (Andreassi, 2007). Excessive impedance means that a weak biological signal must compete at a disadvantage with false electrical signals like power line artifacts. In severe cases, the electroencephalograph may display power line fluctuations instead of cortical activity—rendering the session clinically useless.
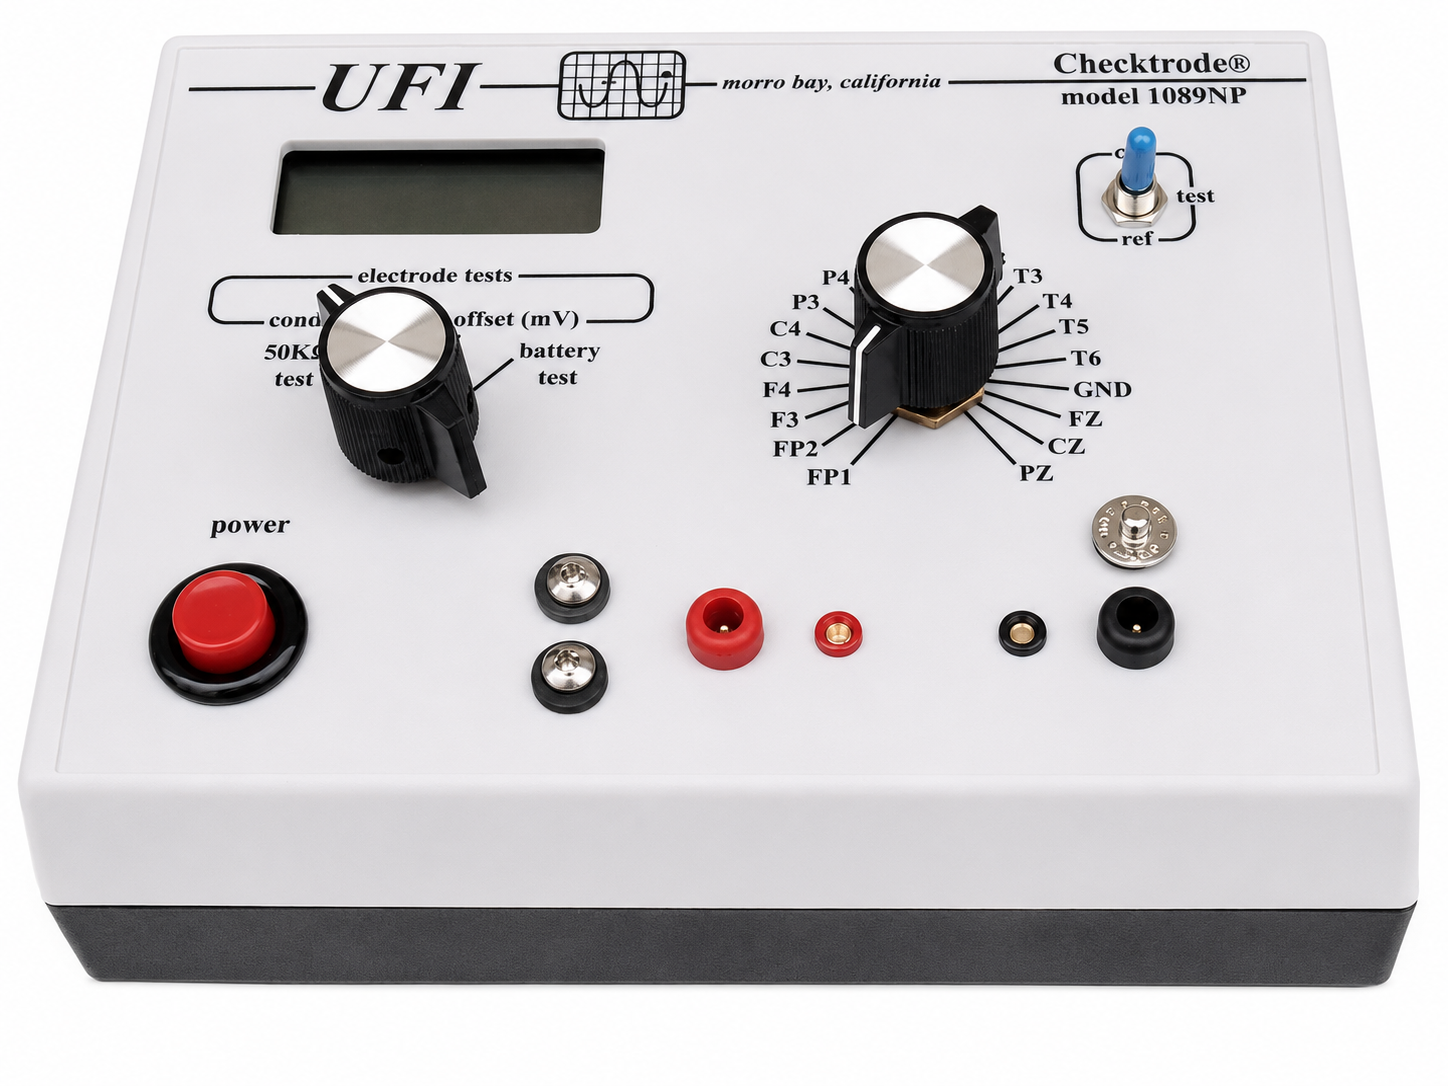
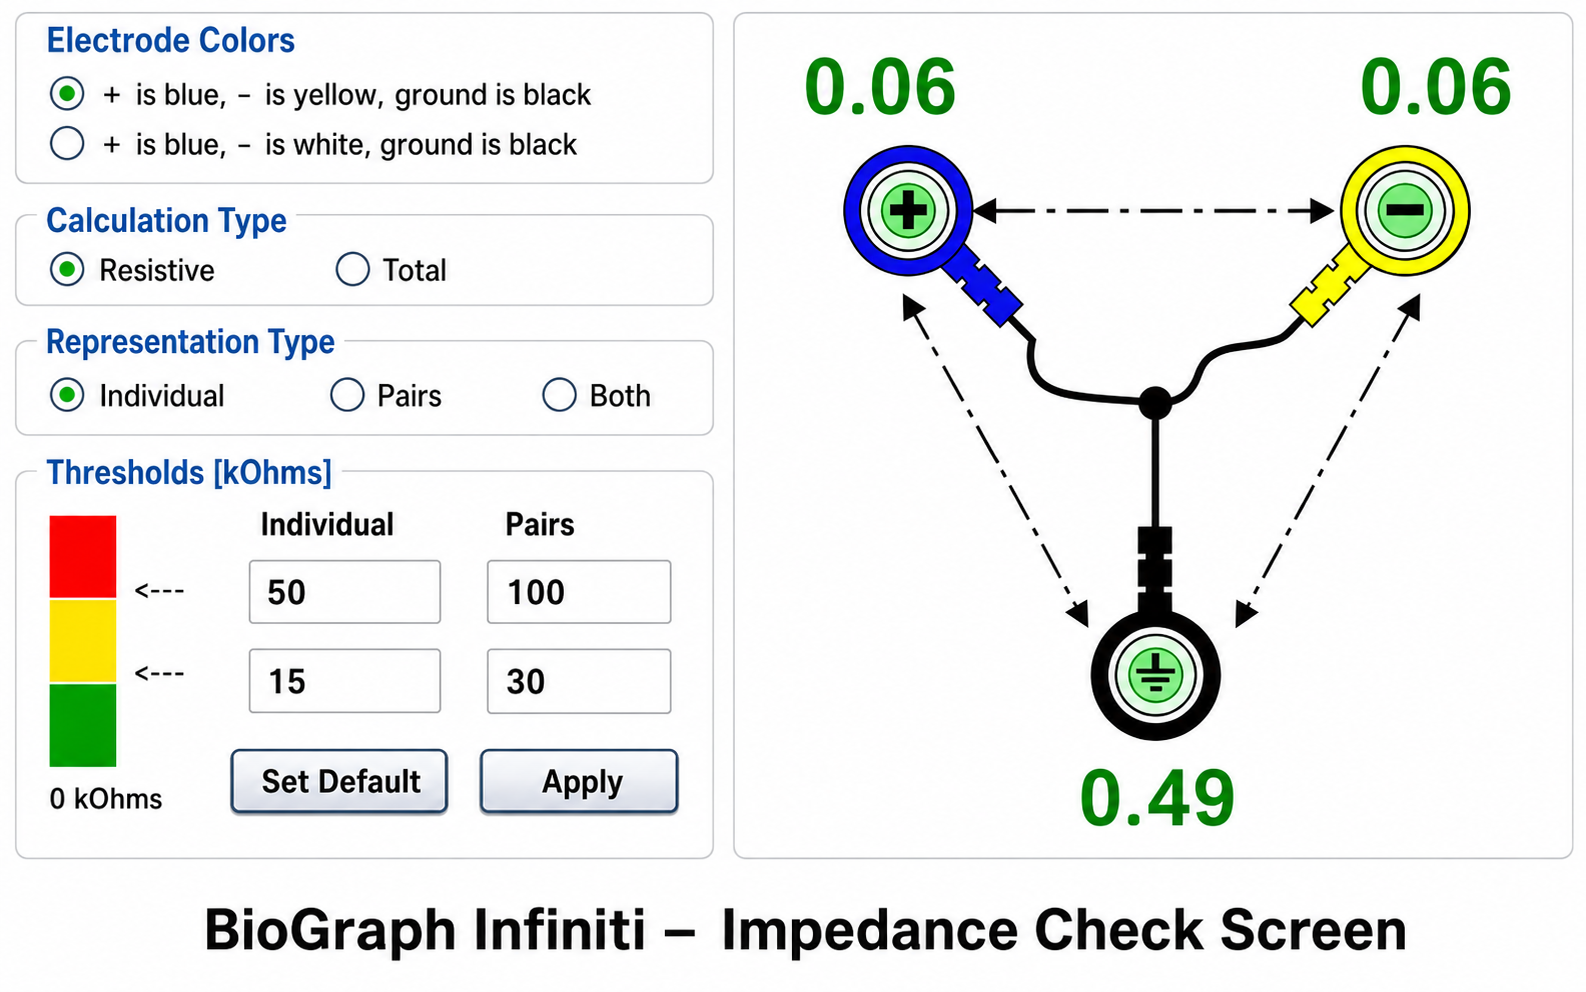
Impedance can be measured by passing a very small alternating current through pairs of electrodes using a separate impedance meter or through software integrated with the data acquisition system. After positioning all electrodes, clinicians should check impedances or offsets using methods appropriate for their equipment. Electrodes that show excessive values should be reapplied after re-preparing the site.
Unless skin-electrode impedance is low (under 5 KΩ for research and 20 KΩ for training) and balanced (within 1-3 KΩ between sites), diverse artifacts—including 50/60 Hz noise and movement artifact—can contaminate the EEG signal, as seen in the P3 and Pz electrodes in the recording below.
When impedances at two sites are unequal, the resulting signals will appear to have different amplitudes when they reach the amplifier, regardless of actual values, and unbalanced impedance will also increase DC offset values through the battery effect, in which each electrode-electrolyte junction acts like a small battery and adds a standing voltage to the recording.
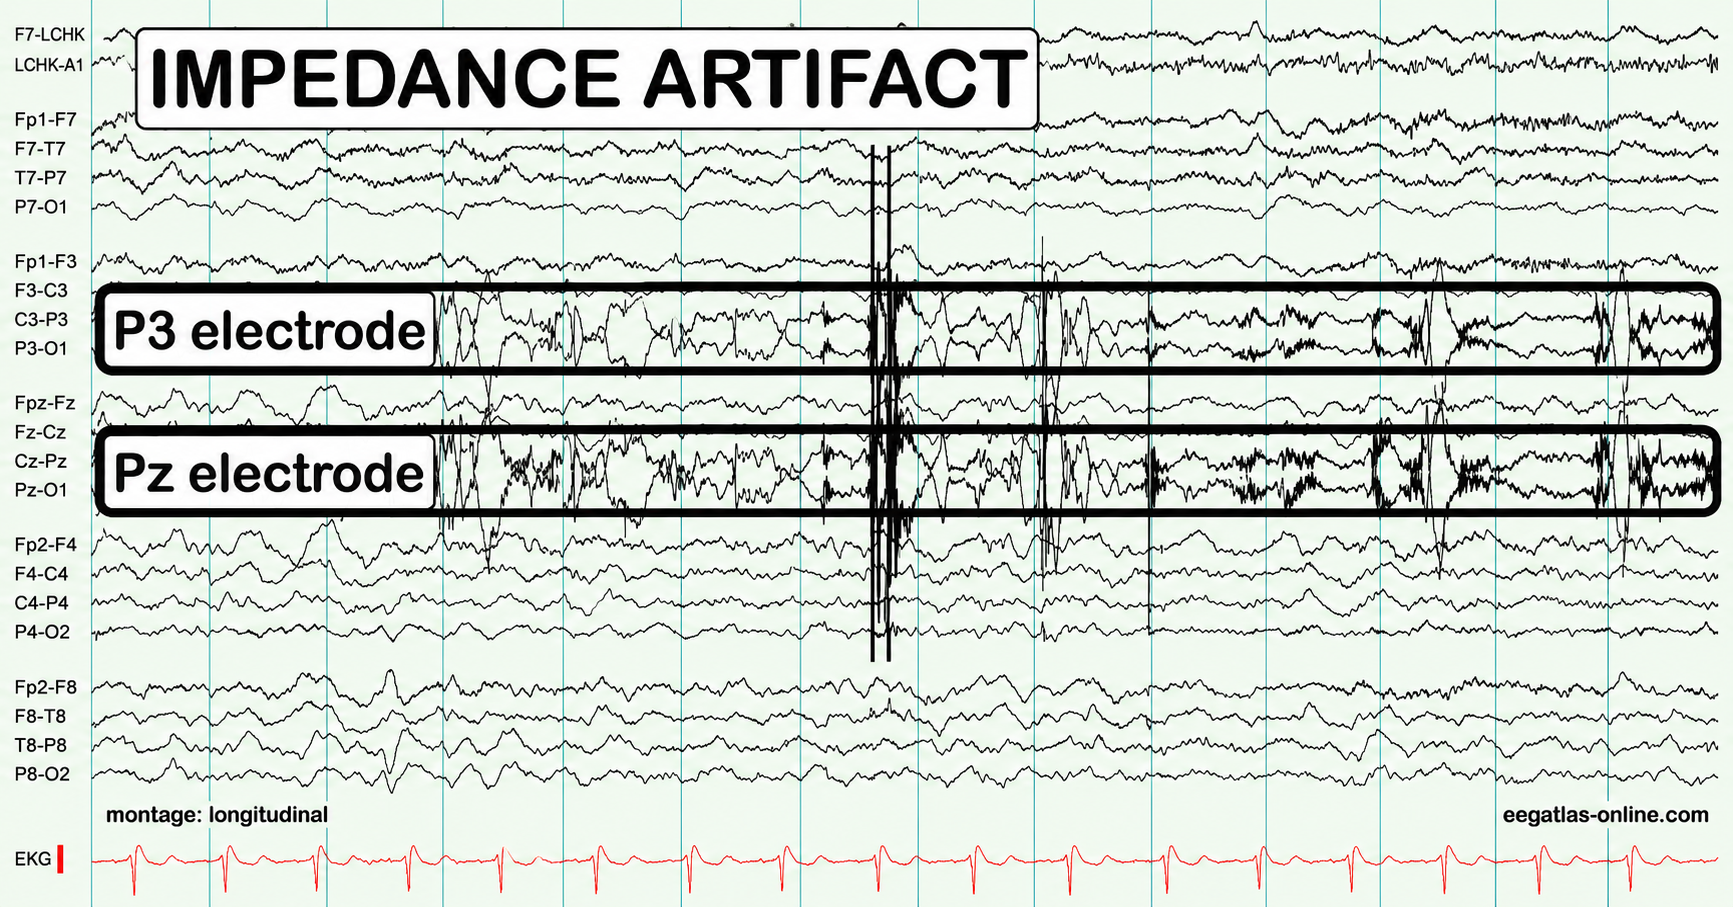
When a clinician fails to ensure low and balanced impedances at the start or during a training session, feedback regarding signal amplitude within specific frequency bands will be inaccurate, and the wrong thresholds may be selected. This can undermine an entire course of treatment.
Michael and Lynda Thompson provided an example of an impedance problem that developed during a session because a hyperactive child scratched his ears, resulting in high and imbalanced impedances. Following corrective action that restored acceptable impedance values, high-beta activity (24-32 Hz) declined from 10-15 to 4 μV, gamma activity (45-58 Hz) declined below 2 μV, and SMR and beta activity returned to previous session values (Thompson & Thompson, 2015, p. 66).
DC Offset
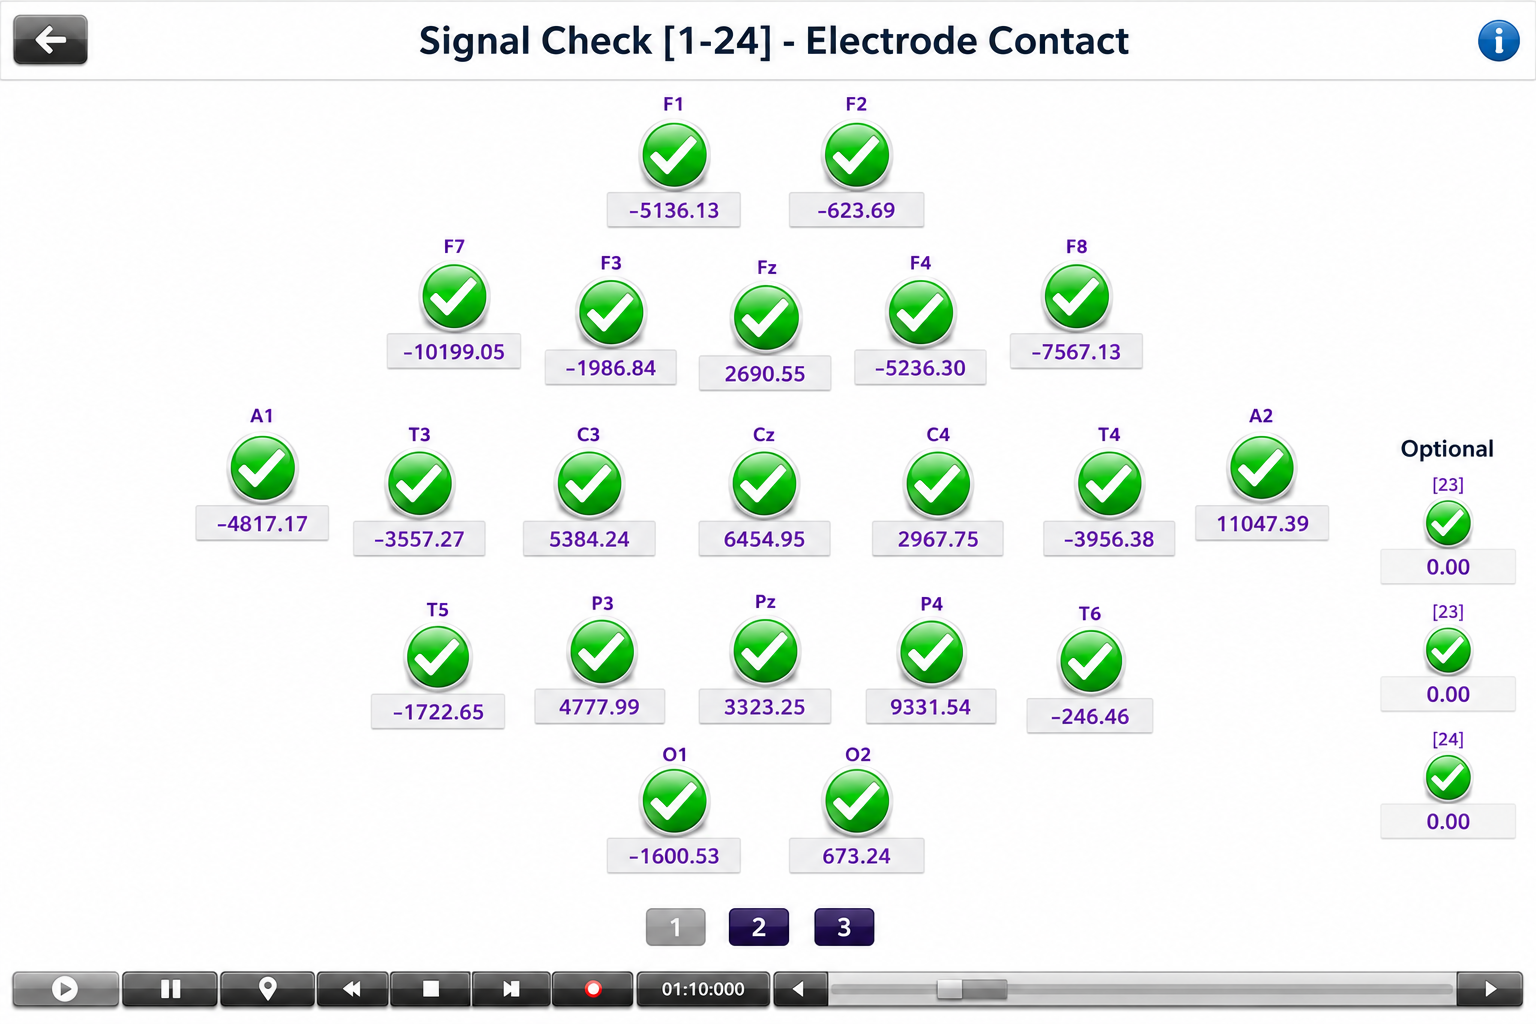
DC offset is a standing voltage measured at an electrode before any biological signal is considered. It arises mainly at the junction between the electrode metal and the electrolyte gel, where ions cross the interface and create a small voltage called a half-cell potential, the potential difference produced at a single electrode-electrolyte contact. This is the same phenomenon described above as the battery effect, since each junction behaves like a weak battery.
Several other factors add to the measured offset, including the electrode and gel materials, interactions with the skin, environmental conditions such as humidity and temperature, and sweat gland activity related to stress level.
Acceptable DC offset limits are set by the equipment manufacturer rather than by a universal standard, so consult your own system's documentation. As one representative example, some systems specify that offsets be consistent across all sensors and below 25,000 μV (25 mV), ideally below 10,000 μV (10 mV). In every system, inconsistent offsets across channels signal poor electrode contact or mismatched materials and should be corrected before proceeding.
Ohm's Law for AC Circuits
We can extend Ohm's law to AC circuits by substituting impedance (Z) for resistance. The revised expression is voltage = current x impedance (E = I x Z), meaning that voltage is the product of a current flowing across an impedance. In actual units, 50 volts = 10 amperes x 5 ohms. One qualification matters: impedance is a complex quantity with both a magnitude and a phase angle, so this simple multiplication applies to magnitudes, and a complete AC analysis must also account for the phase shift the reactive component introduces. This AC version of Ohm's law governs the relationship between the EEG signal and the impedance it encounters at every point between cortex and computer.
Open and Closed Circuits
This section covers circuit integrity—the difference between open and closed circuits—and explains the practical tests clinicians use to verify that their equipment is functioning correctly.
Broken electrode cables are a significant cause of equipment malfunction since they prevent electron movement. Clinicians perform a continuity test to check whether a cable is damaged by sending an AC signal down the cable with an impedance meter to measure opposition to current flow. If there is a break, there is no continuity, and the circuit is described as open—impedance will be effectively infinite since current cannot flow across the gap.
A Blown Fuse Illustrates an Open Circuit
A fuse contains a filament designed to melt and create an open circuit when the current exceeds safe values, protecting downstream components from damage.
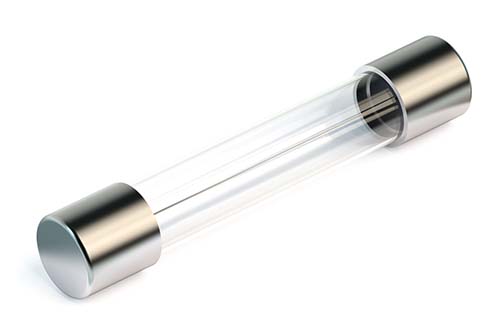
If the cable is free of breaks (continuous), the circuit is described as closed instead, and impedance will approach 0 Kohms since the current can easily travel through the circuit.
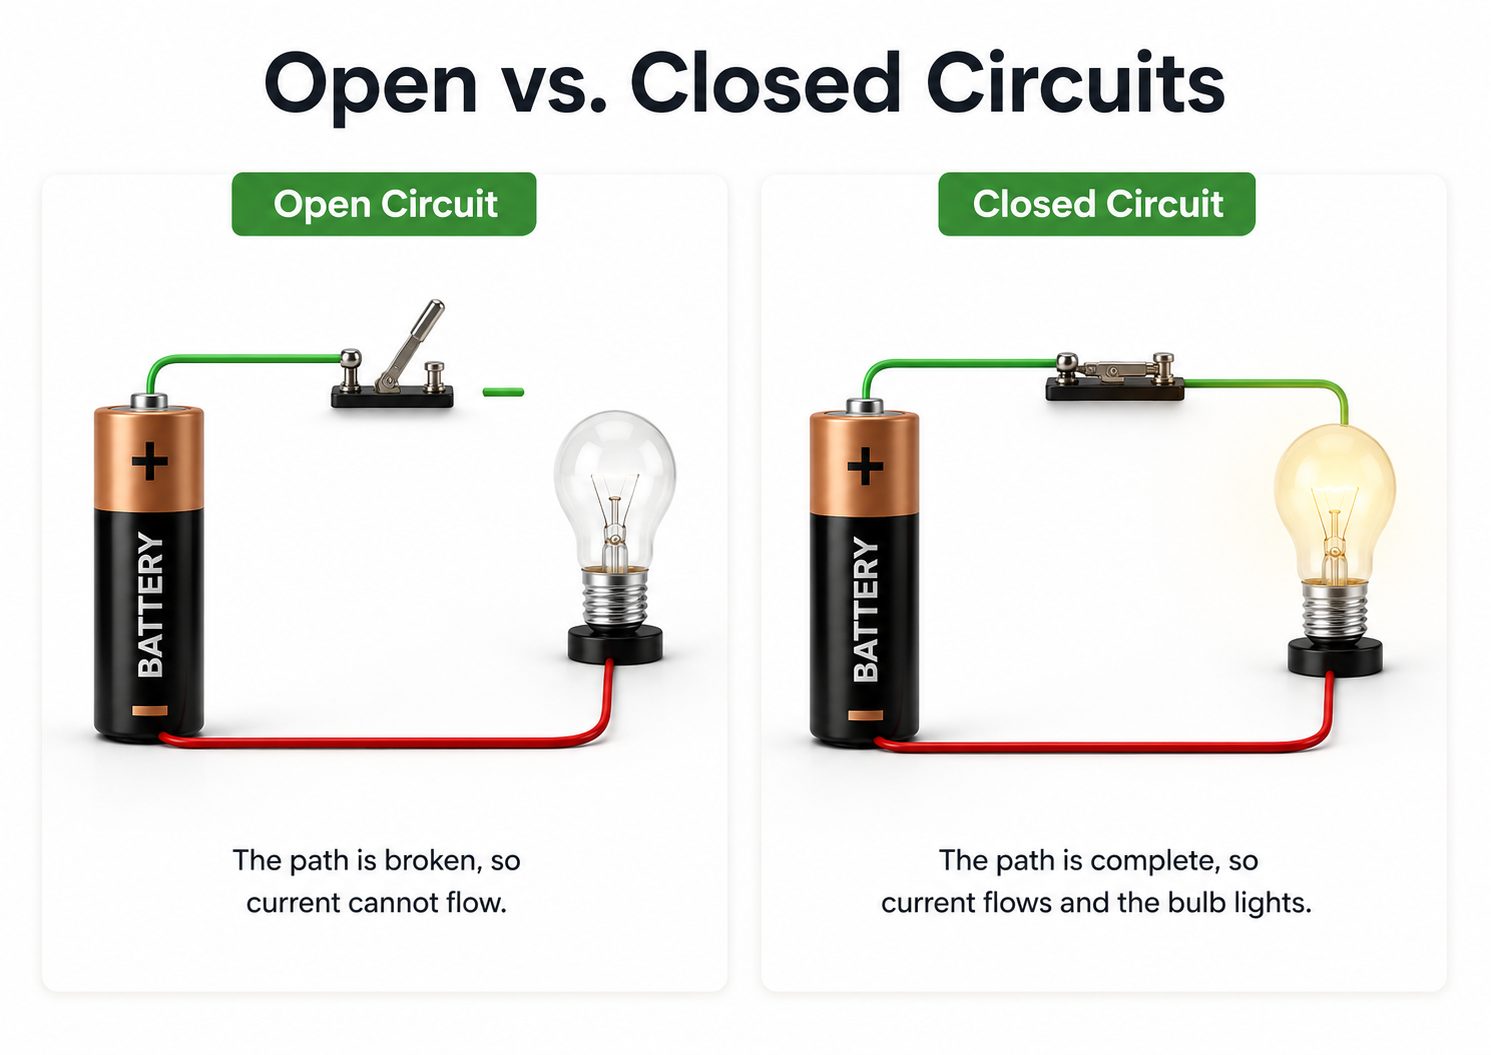
Behavioral Tests Check Circuit Performance
Behavioral tests, also called tracking tests, go beyond continuity testing to evaluate the performance of the entire data acquisition system. For example, when monitoring EEG activity, a clinician can test the complete signal chain—EEG sensor, differential amplifier, gain amplifier, cable, encoder, and computer—by asking a client to close and then open the eyes. If the computer display mirrors these actions (showing alpha blocking when the eyes open and alpha return when they close), the behavioral test is passed, confirming the system is working end to end.
Short Circuit
A short circuit results when an unintended connection is made between two points of a circuit, creating a new path with lower resistance than the original. This path should measure close to 0 Kohms on an impedance meter, and the reduced resistance draws electrons through the short, potentially increasing current flow to levels that can melt circuitry and injure clients (Nilsson & Riedel, 2008).
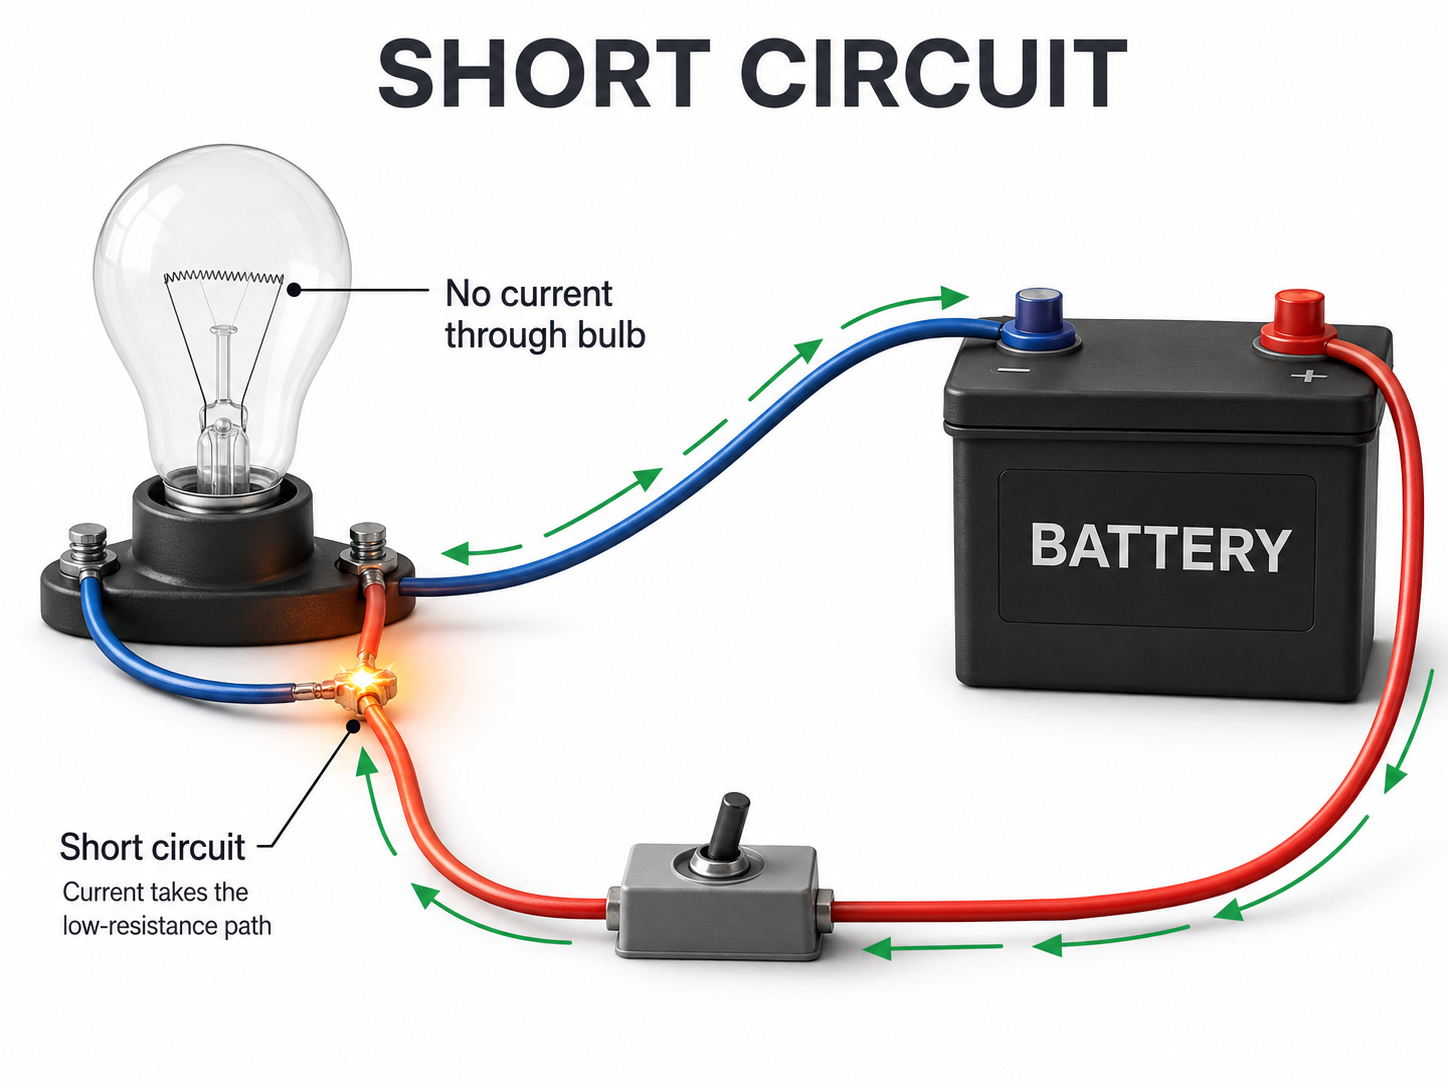
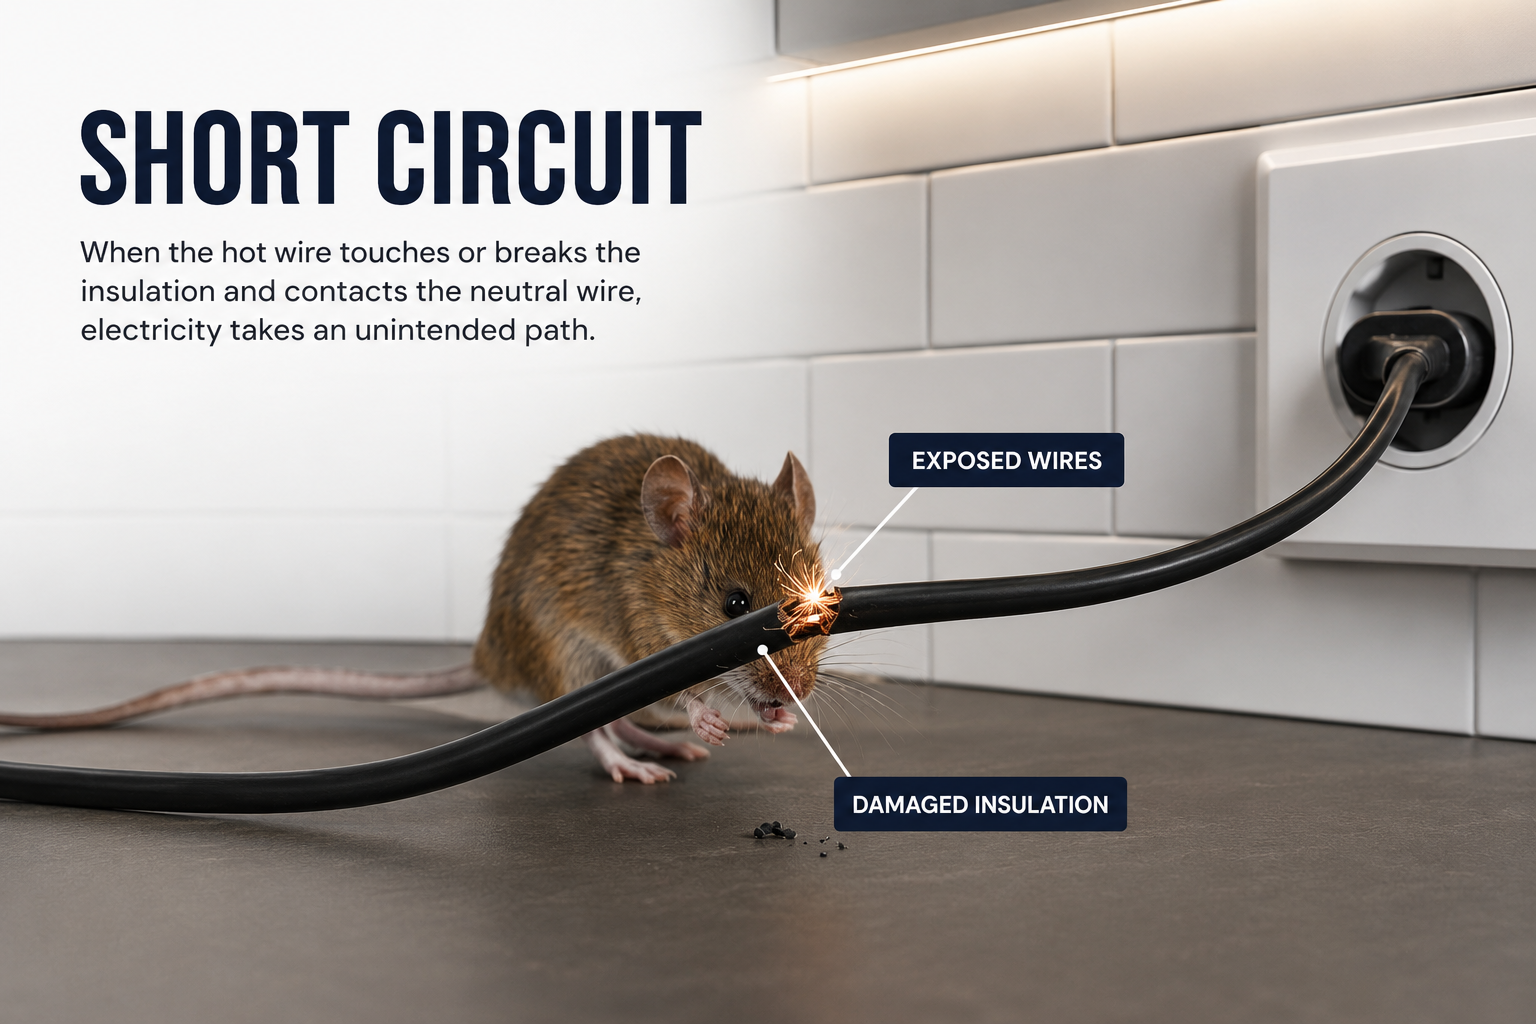
Visualize a bare wire inside an electroencephalograph touching its metal case. The AC powering this equipment could leak through the metal case and injure anyone touching the surface—a scenario that underscores why the safety precautions discussed later in this unit are not optional.
Preventing Signal Contamination
Physiological signals are remarkably small compared to surrounding electromagnetic "noise," and they must be amplified before they can be distinguished from background interference. The quality of the connections between your client and the recording device—including the skin surface, conductive gel or paste, sensors, and connecting wires—determines the quality of the signal you gather. Poor-quality connections, regardless of the cause, produce contaminated information that compromises clinical decision-making.
Matter is composed of atoms containing protons, neutrons, and electrons; ions are charged atoms that carry biological signals through the body via volume conduction. Current is the movement of electrons (or ions) through a conductor, voltage provides the "push" that moves current, and resistance/impedance opposes current flow. Ohm's law (E = I x R) describes the relationship between these three quantities and explains both amplifier design and skin preparation practices. Clinicians must ensure low and balanced skin-electrode impedance to obtain accurate recordings, and must verify circuit integrity through continuity and behavioral tests to rule out equipment malfunction.
Check Your Understanding
- What is the relationship between voltage, current, and resistance as described by Ohm's law?
- Why must clinicians ensure low and balanced skin-electrode impedances before starting a neurofeedback session?
- How does volume conduction allow us to record brain electrical activity from the scalp?
- What is the difference between resistance in DC circuits and impedance in AC circuits?
- How does a continuity test help identify equipment problems?
EEG Recording
Electrodes
This section covers the electrodes, amplifiers, and signal processing stages that make up an EEG recording system. Understanding how each component works—and how they work together—will help you troubleshoot recording problems and optimize signal quality in your clinical practice.
Electrodes detect biological signals and serve as transducers—devices that convert energy from one form to another. In EEG recording, electrodes convert the ionic currents produced by cortical neurons into electronic currents your equipment can measure. Four common types of EEG electrodes are shown below: gold cup, gold flat, silver cup, and silver/silver-chloride ring.
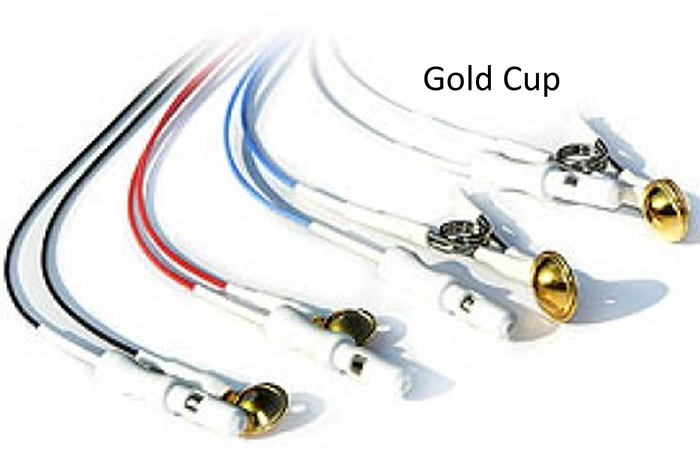
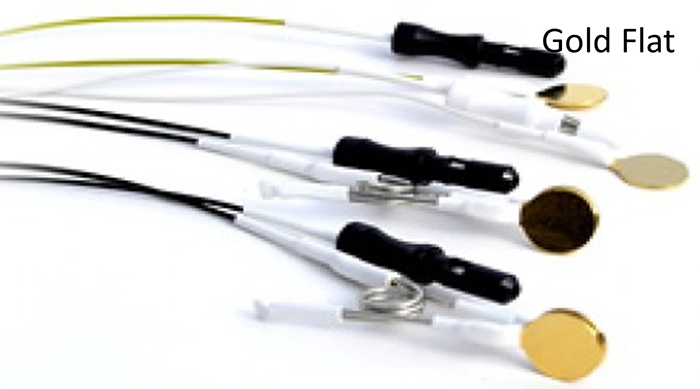
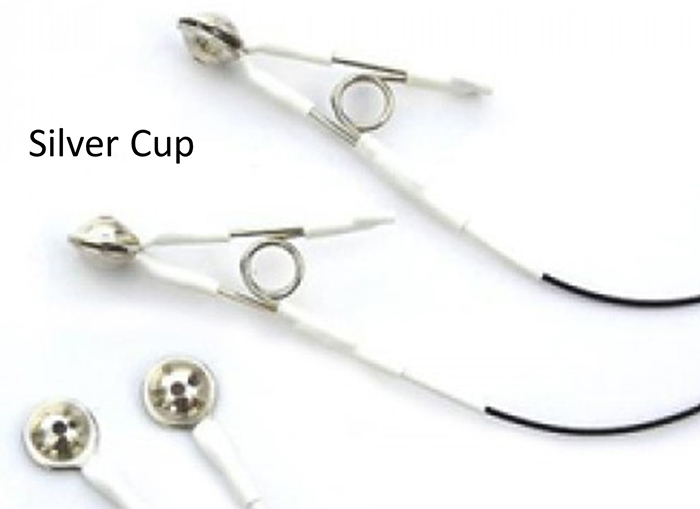
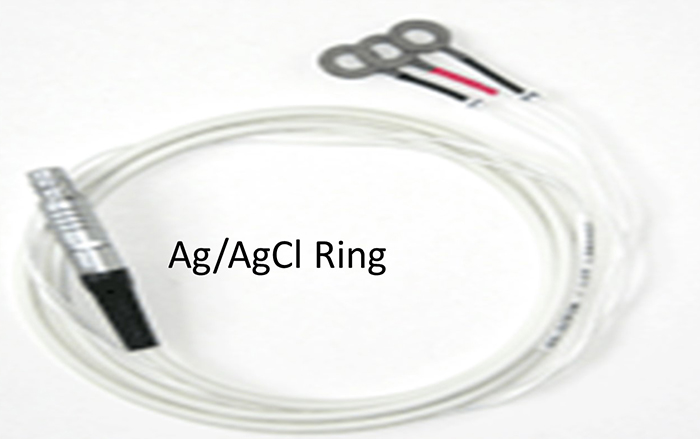
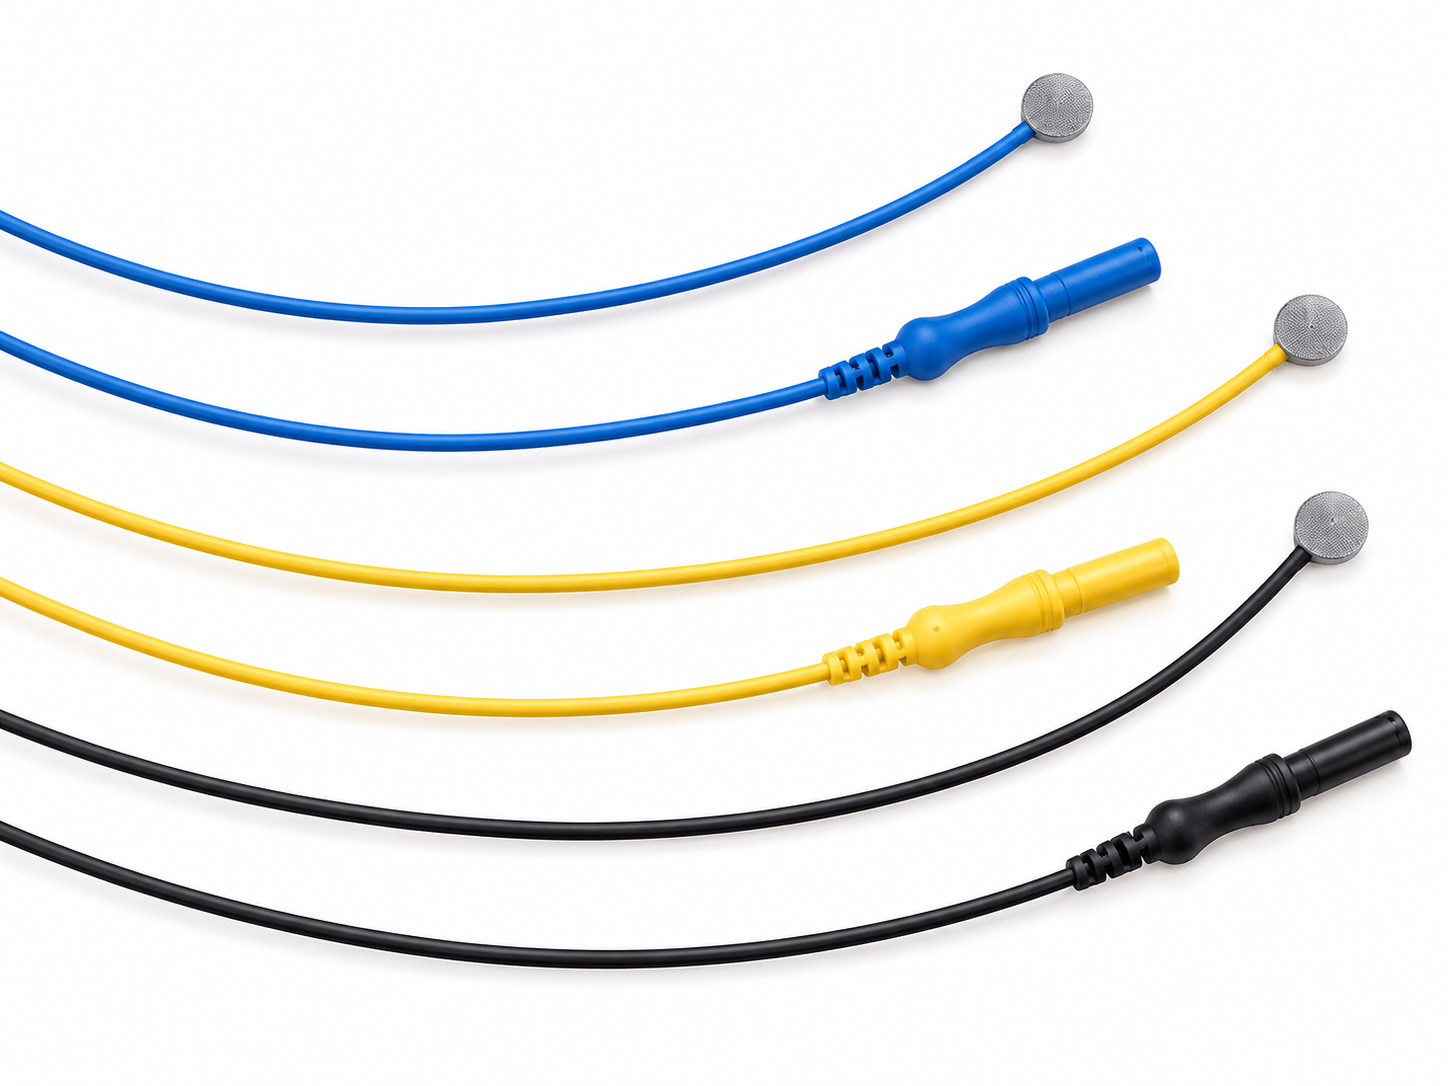
Common electrode materials for EEG recording include gold-plated, silver, silver/silver-chloride, and tin. Sintered silver/silver-chloride electrodes are used for recording slow cortical potentials. All electrodes in a single EEG recording must be made of the same material (e.g., all tin, all silver, all gold, all silver/silver-chloride, or all sintered silver/silver-chloride).
Sintered means the silver and silver-chloride particles are fused together under heat and pressure into a solid electrode material, rather than being plated or coated onto a base metal. This produces a more stable, lower-noise electrode surface, which is why sintered silver/silver-chloride is preferred for recording slow cortical potentials.
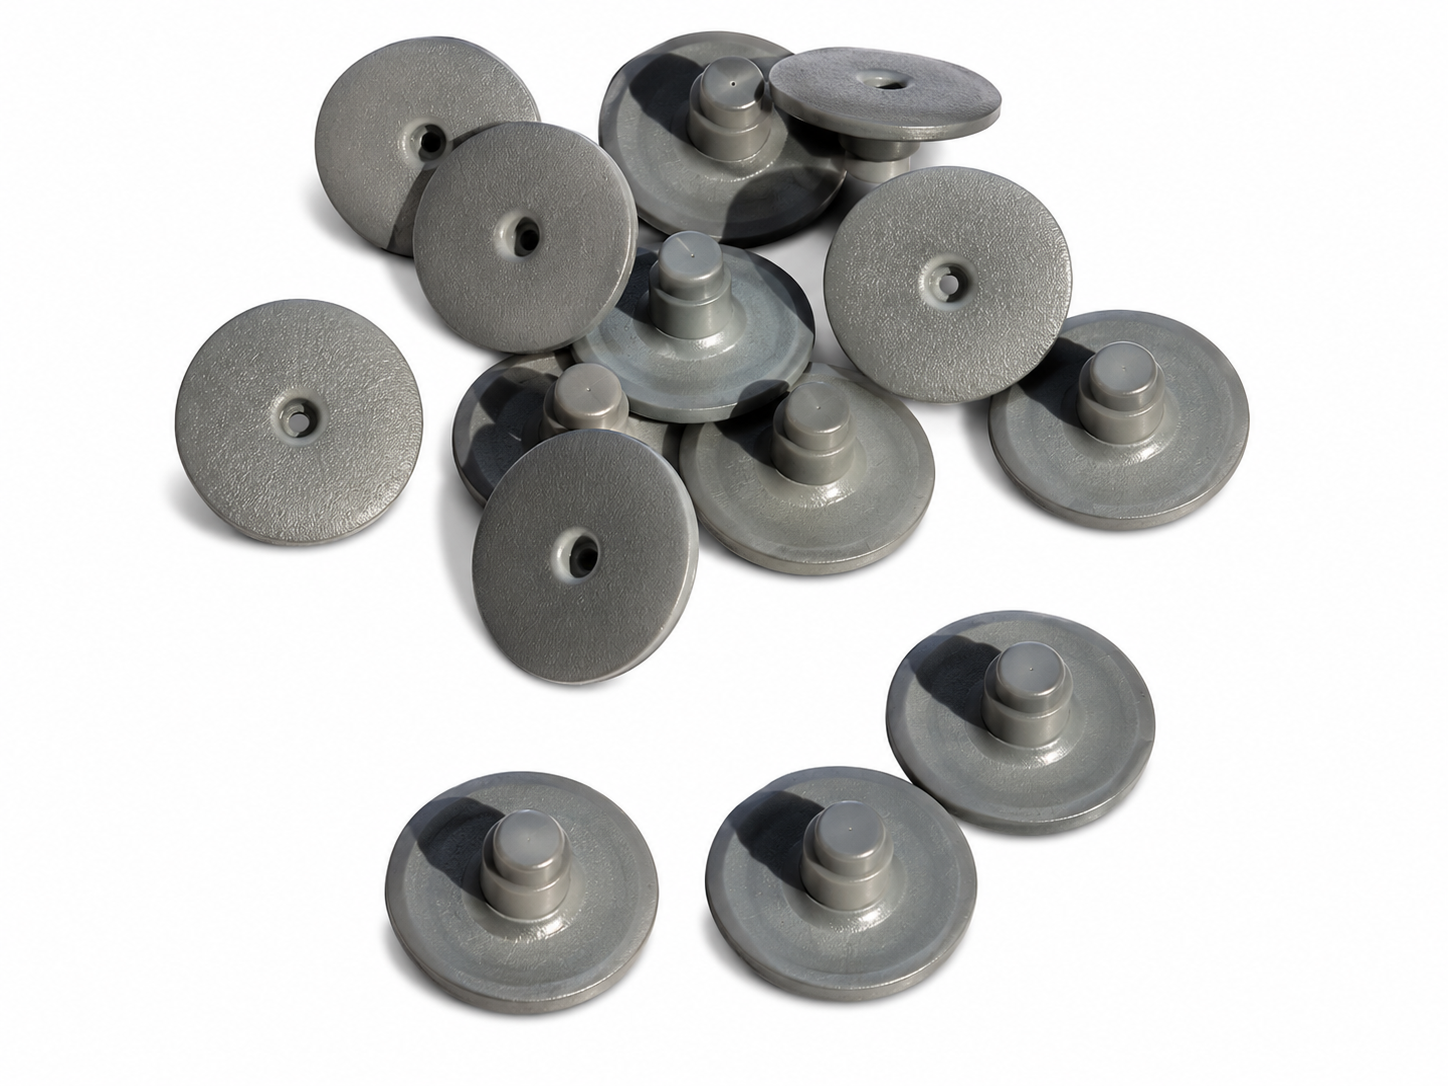
Electrode materials may be flat or formed into rings or cups, some of which have holes at the top. Electrodes are sometimes formed into disposable pellets, with or without a housing, onto which a cable can be snapped. When the earlobe is used as a reference or ground site, electrodes are mounted in a snap or spring-loaded clip.
Here are examples of tin and silver/silver-chloride electrodes. Tin cup electrodes and tin earclip electrodes are shown below.
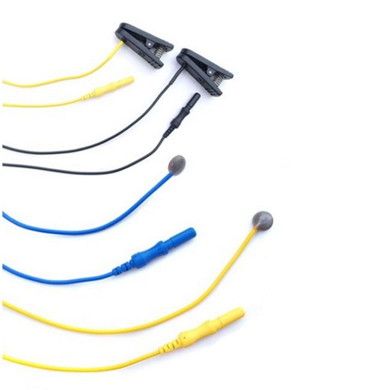
Silver/silver-chloride electrodes are shown below.
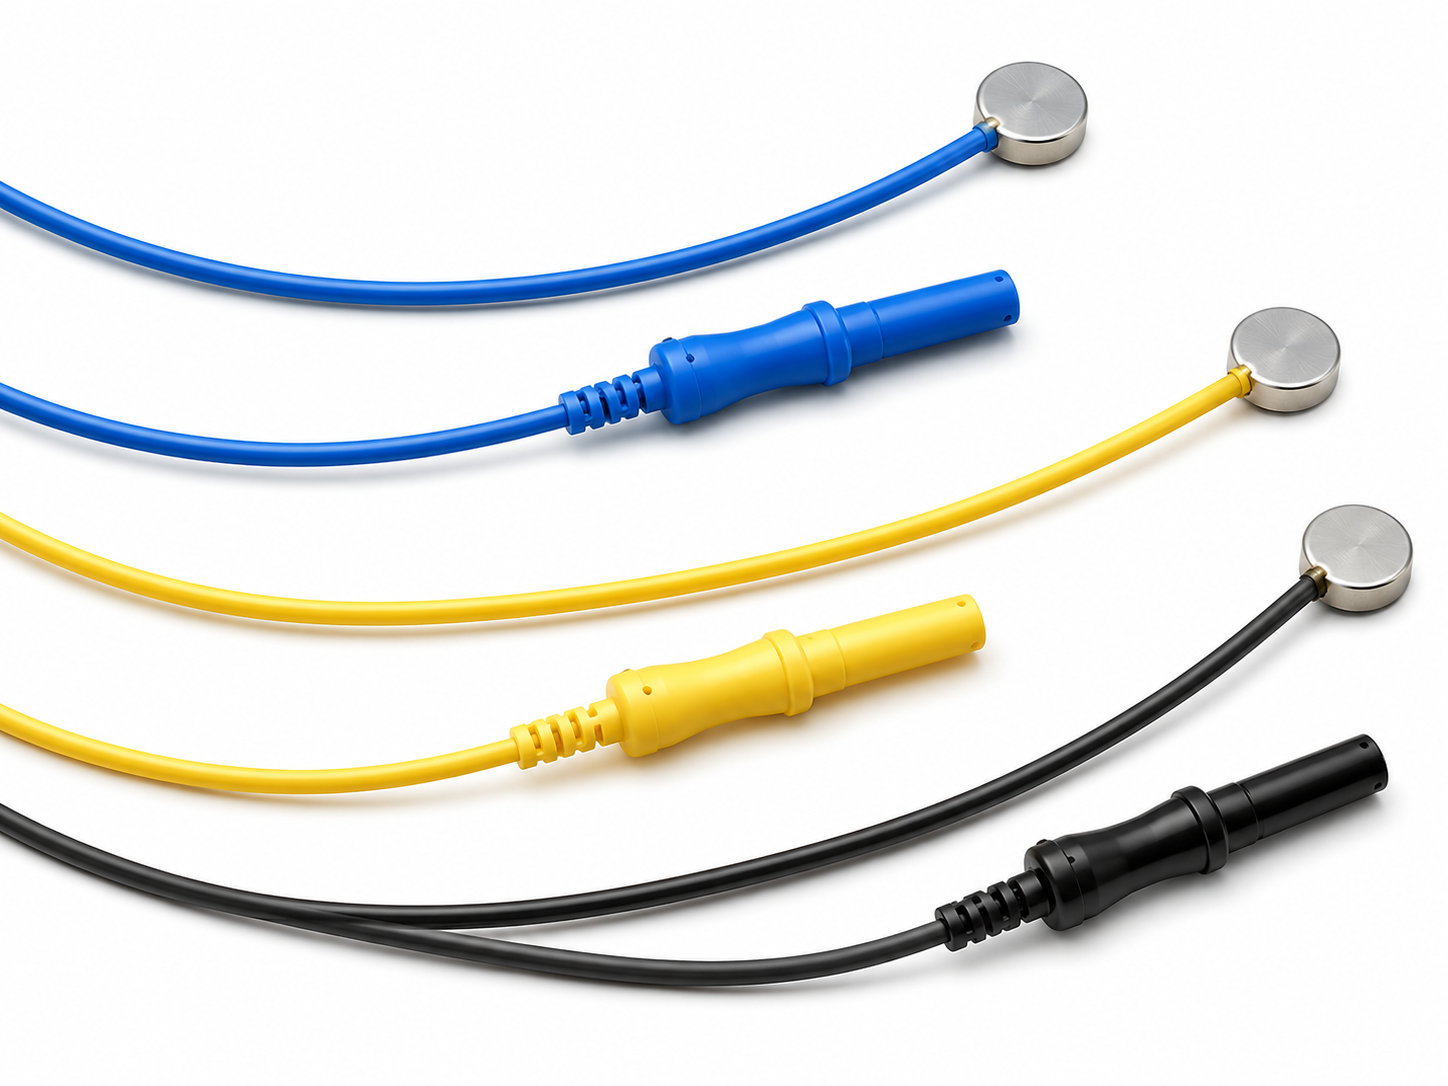
Sintered silver/silver-chloride electrodes are shown below.
Tin disposable pellet electrodes.
Electrode Caps
Rather than positioning individual electrodes one at a time, most multichannel recordings use an electrode cap. Caps come in two broad designs, wet and dry, and the choice between them shapes preparation time, client comfort, and signal quality.
Wet Cap Design
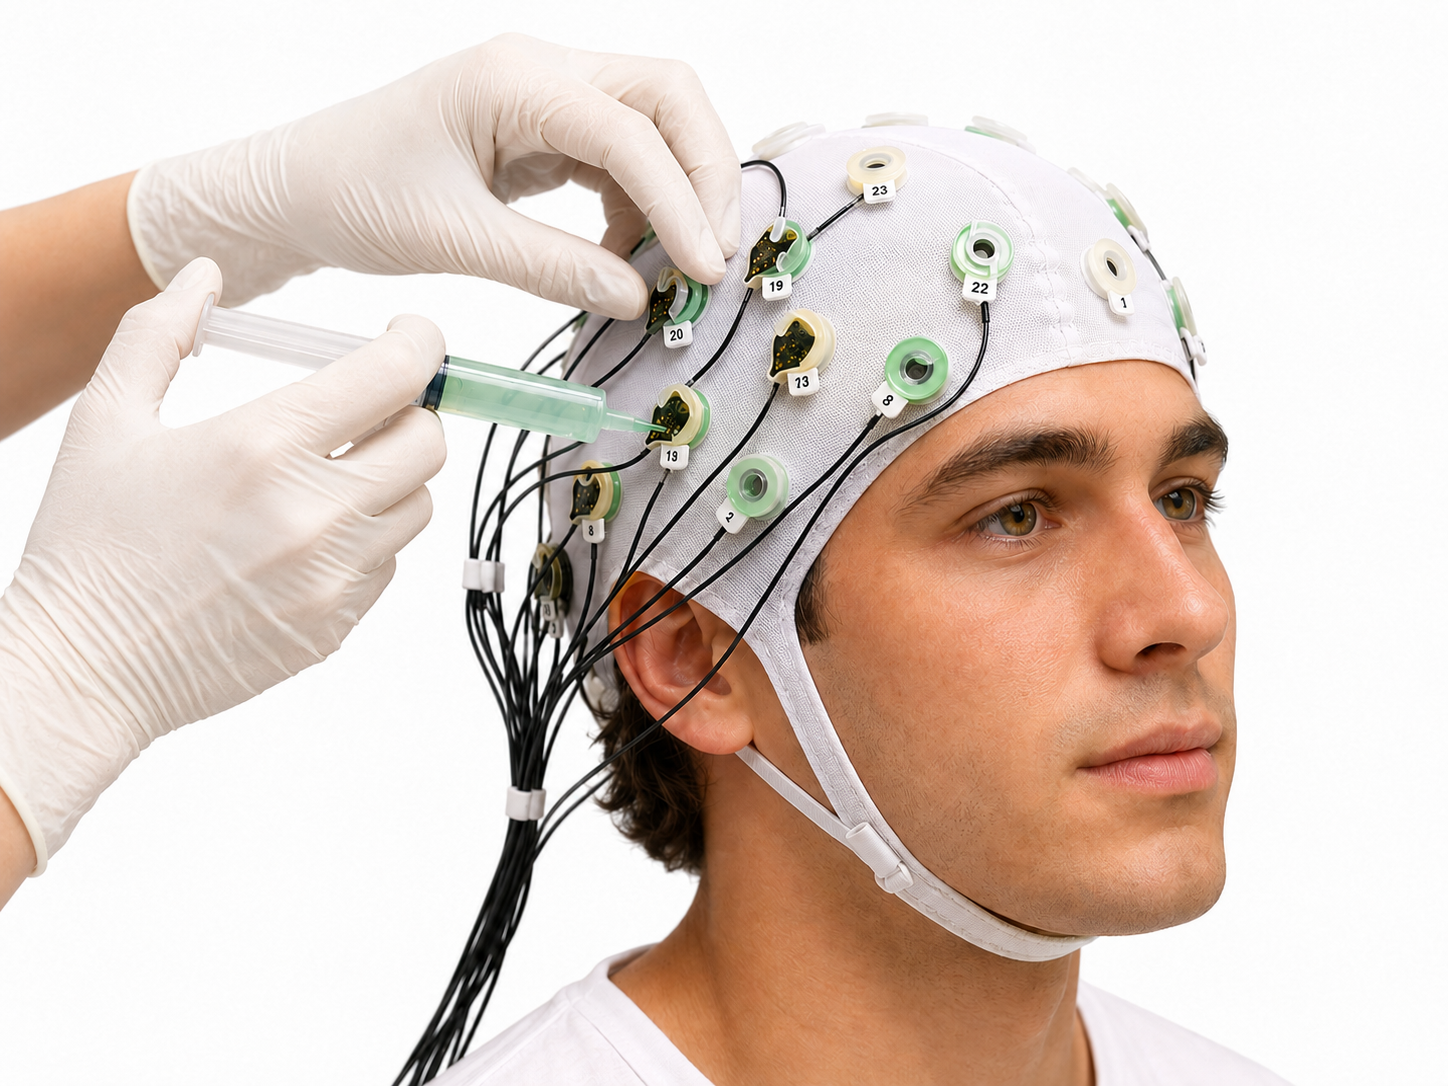
An electrode cap is a stretchable garment, usually made of an elastic spandex or Lycra fabric, that holds recording sensors at fixed scalp locations. Manufacturers position the electrode holders according to the international 10-20 system, so that once you fit the cap to your client's head, every sensor lands at a standardized site. In a wet cap, each holder seats a silver/silver chloride (Ag/AgCl) electrode or a tin electrode, and you fill the small well with a conductive gel or paste using a blunt-tipped syringe. That gel bridges the gap between the scalp and the metal, carrying the brain's ionic signals to the amplifier while you gently abrade the skin to lower resistance. Technicians typically aim for an impedance below 5 to 10 kΩ before recording begins (Bayat et al., 2025).
Advantages and Disadvantages of Wet Caps
Wet caps remain the gold standard for a good reason. The gel forms a stable electrochemical bridge that produces low, uniform impedance and an excellent signal-to-noise ratio, which is why clinical and research laboratories have trusted them for decades (Hinrichs et al., 2020). When Kam and colleagues (2019) compared a wet system against a dry alternative, the wet electrodes held a small advantage in single-trial classification, reflecting their cleaner signal. The gel also flows around hair and conforms to the scalp, so it reaches skin that rigid contacts struggle to touch. For long clinical montages where data fidelity is paramount, this reliability is hard to beat.
The costs of that fidelity show up in time and comfort. Preparing a full wet montage is slow and messy, requires a trained technician, and involves scrubbing each site, injecting gel, and rechecking impedance one electrode at a time (Kam et al., 2019). Your client leaves with gel in their hair and must wash it out, which discourages repeated or at-home sessions. Over long recordings the gel slowly dries, so impedance climbs and signal quality degrades after several hours unless someone refreshes each site (Hinrichs et al., 2020). Tight chin straps and the weight of a gelled cap can also become uncomfortable, which many clients find limiting during multi-hour sessions.
Dry Cap Systems
Dry caps were engineered to remove the gel from the equation. Instead of a gel-filled well, each site carries a dry electrode built as a cluster of fingers or pins, often coated with gold, silver, or Ag/AgCl, that push through hair to touch the scalp directly. Many designs are spring-loaded, so the pins retract and adjust as they slide past hair to reach skin (Kam et al., 2019).
Dry electrodes rely on the scalp's natural moisture to establish an adequate electrical connection. Some time may pass before scalp impedance falls to acceptable levels.
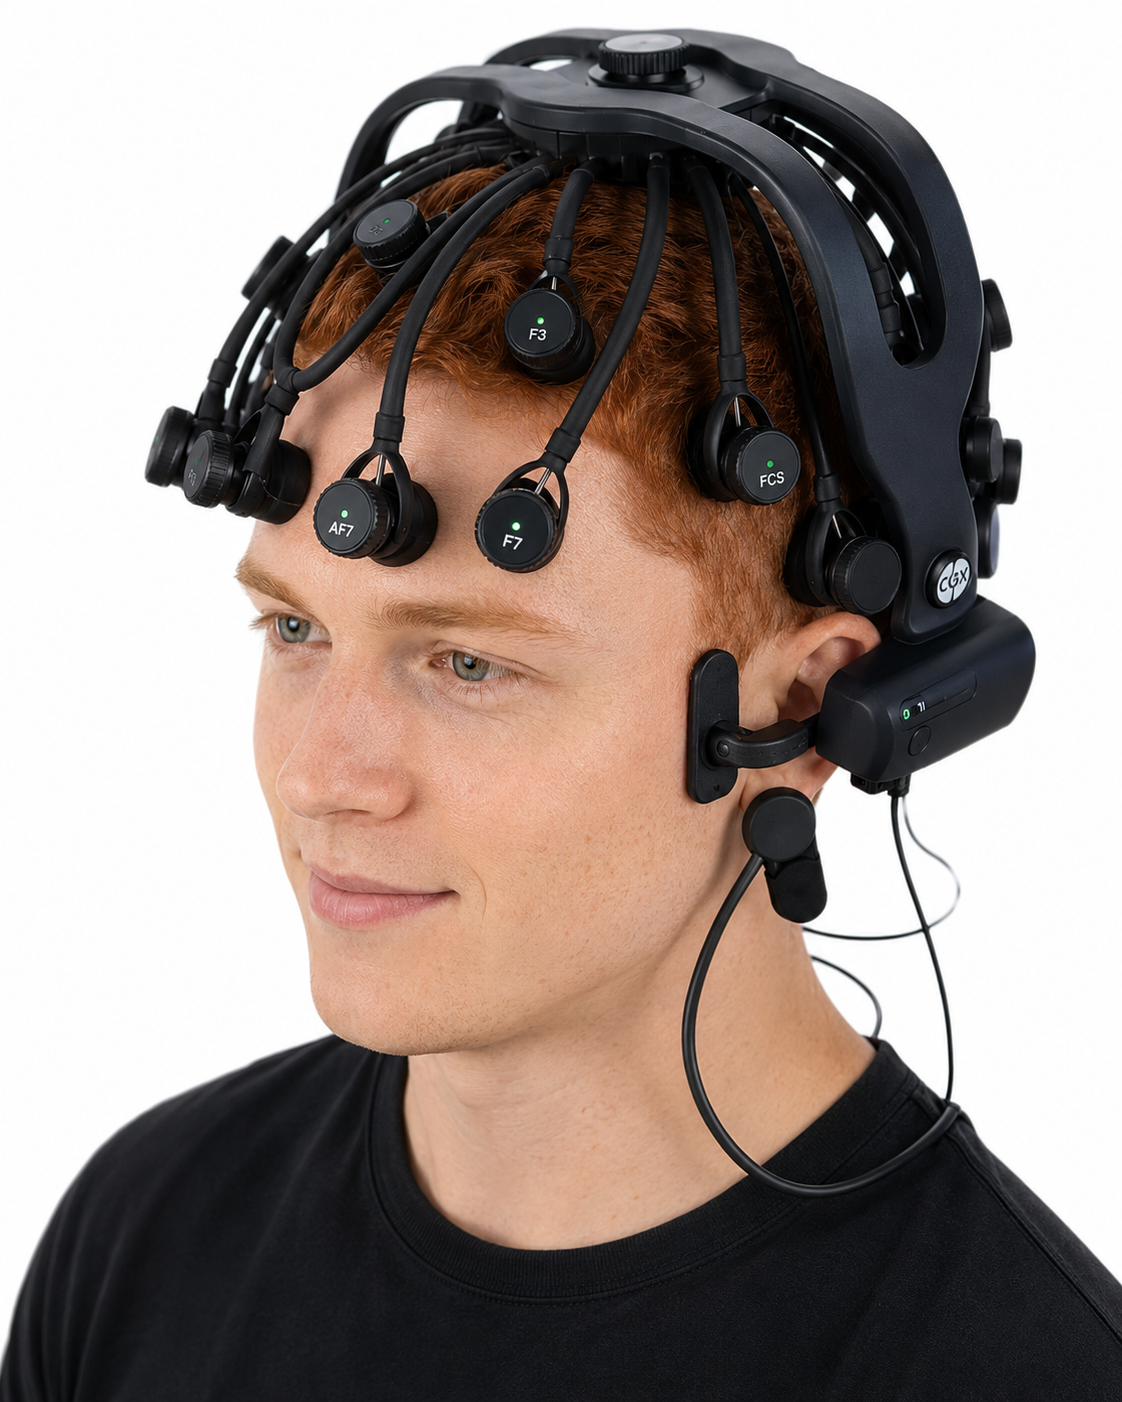
Some are passive electrodes that send the raw signal down a wire, while others are active electrodes with a tiny pre-amplifier at the site that buffers the high-impedance contact before noise can creep in (Di Flumeri et al., 2019). Because they need no gel, no abrasion, and no trained technician, dry caps set up in a fraction of the time and suit home monitoring, ambulatory recording, and real-world settings such as sports and military field use.
The tradeoff is a noisier interface. Without gel, dry contacts show higher and more variable impedance, which makes them more susceptible to motion artifact from head movement, cable sway, and shifting pins (Bayat et al., 2025). Sharp or firmly sprung pins can also press uncomfortably on the scalp during longer wear.
In addition, the scalp is richly supplied with superficial arteries—including branches of the supraorbital, superficial temporal, and occipital vessels—that run in the subcutaneous layer close to the skin surface. When the pins or fingers of a dry electrode press firmly over one of these vessels, the electrode can move slightly with each arterial pulsation and introduce pulse artifact at that site. Practitioners report this most often at frontal and temporal locations, though the risk follows an individual client's vascular anatomy rather than any fixed electrode label.
Even so, controlled comparisons are encouraging, because Kam and colleagues (2019) found that dry and wet systems produced comparable resting spectra and P3b responses, with metrics correlating strongly across the two (r = 0.54 to 0.89), and Hinrichs and colleagues (2020) reached similar conclusions in a clinical sample. The practical lesson for your practice is to match the tool to the task, reaching for a wet cap when you need maximum fidelity for a diagnostic or research montage, and a dry cap when speed, comfort, and mobility matter more than the last decibel of signal.
Imagine a veteran at a VA clinic who needs weekly neurofeedback but dreads the gel and the post-session hair wash. Switching this client to a dry cap can cut preparation to a few minutes and remove the cleanup that made him skip appointments, provided you watch impedance and motion artifact and accept slightly noisier data. For his baseline qEEG assessment, though, you would still choose a wet cap to secure the cleanest possible recording.
EEG electrode caps position sensors at 10-20 sites and come in wet and dry designs. Wet caps use gel-filled Ag/AgCl electrodes for low impedance and gold-standard signal quality, at the cost of slow, messy setup and gel that dries over time. Dry caps use coated pins that need no gel, enabling fast setup and mobile use, but with higher impedance and more motion artifact. Research shows the two produce comparable data for many applications, so the best choice depends on whether fidelity or convenience matters most for the session.
EEG Electrode Operation
Consider how EEG electrodes work in practice. In response to chemical and electrical synaptic messages, the dendrites of cortical pyramidal neurons develop excitatory postsynaptic potentials (EPSPs) and inhibitory postsynaptic potentials (IPSPs). These potentials travel a short distance, on the order of 1 to 2 centimeters, as a current of ions through the cortex, interstitial and cerebrospinal fluid, glial cells, meninges, skull, and scalp to electrodes on the surface—a process called volume conduction. The electrodes then transform this ionic current into an electronic current that flows through the cable into the electroencephalograph's input jack.
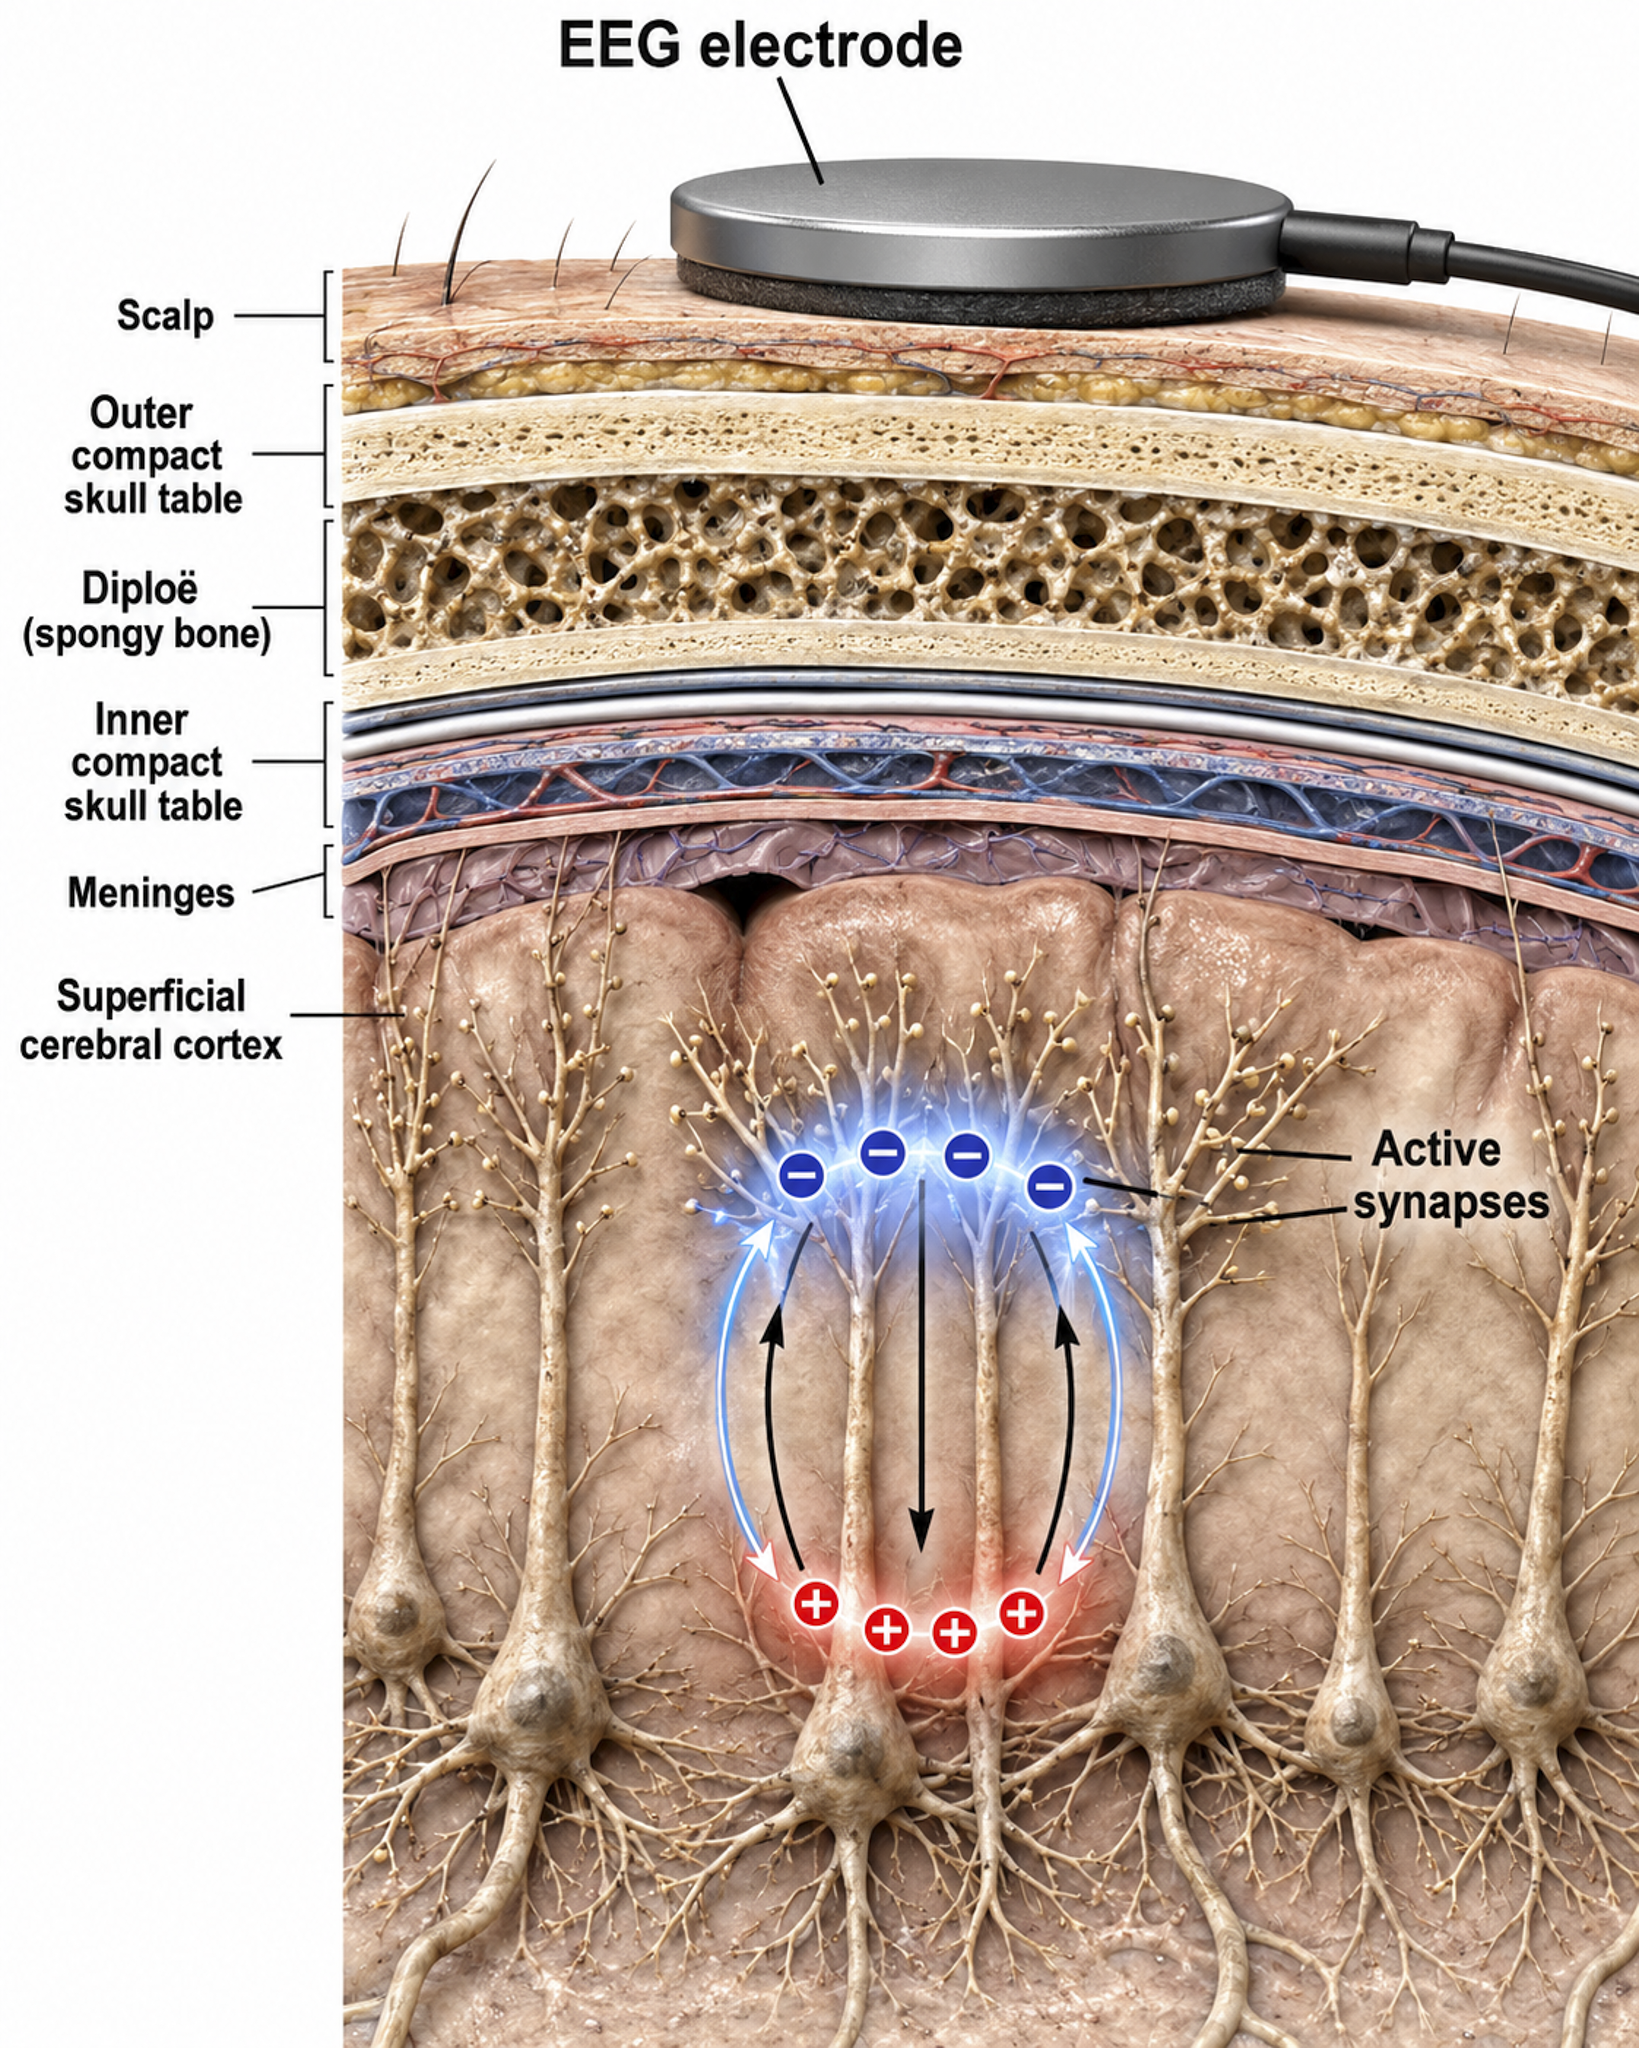
The EEG signal is substantially attenuated during volume conduction, which is why the signal that reaches scalp electrodes is measured in microvolts—millionths of a volt. When an EEG electrode is filled with conductive gel or paste, the electrode metal donates ions to the electrolyte while the electrolyte contributes ions to the metal surface. This creates a DC voltage between the electrode metal and the gel or paste, and signal conduction succeeds as long as electrode and electrolyte ions are freely exchanged.
Recording Problems
Two key problems can degrade electrode performance: polarization and bias potentials. Both stem from the half-cell potentials introduced earlier, which stay stable and cancel out only when the two electrodes are made of the same material and remain in good condition.
Polarization disturbs a half-cell potential over time, whereas a bias potential reflects a mismatch between two electrodes, and either one adds a false voltage to the recording. Understanding these issues helps clinicians choose the right electrode materials and recognize when electrodes need replacement.
Conduction breaks down during polarization, which occurs when chemical reactions produce separate regions of positive and negative charge at the junction between electrode and gel. DC flows across this connection, carrying positive ions to the more negative region and negative ions to the more positive region.
This ion buildup polarizes the electrode, favoring current flow in one direction and resisting it in the other—reducing ion exchange, increasing impedance, and weakening the signal. Electrode manufacturers control this problem by using silver/silver-chloride or gold electrodes that resist polarization.
Bias potentials are a second recording problem, resulting from the exchange of metal ions between electrodes and electrolytes in the absence of a biological current. These spurious voltages can be prevented by using electrodes with intact surfaces and identical materials—for example, all gold or all silver—so that no artificial voltage difference exists between recording sites.
Recording the EEG with Three Leads
When recording a single EEG channel (montage or derivation), three electrodes are used. Understanding the role of each electrode is essential for accurate recordings and effective troubleshooting.
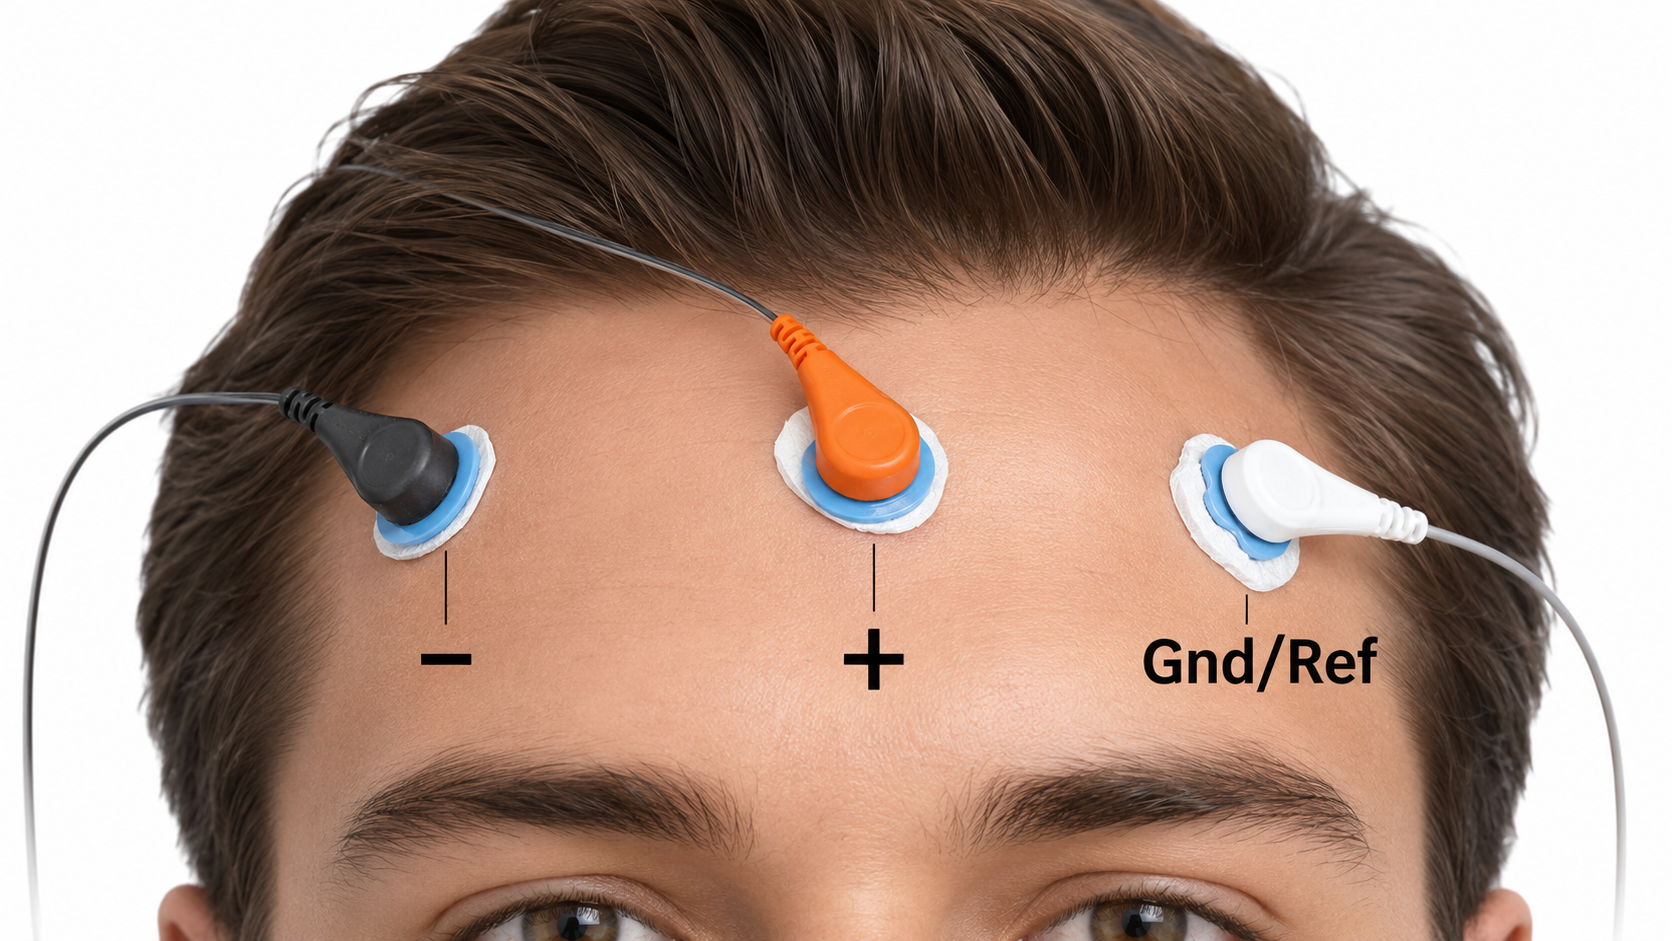
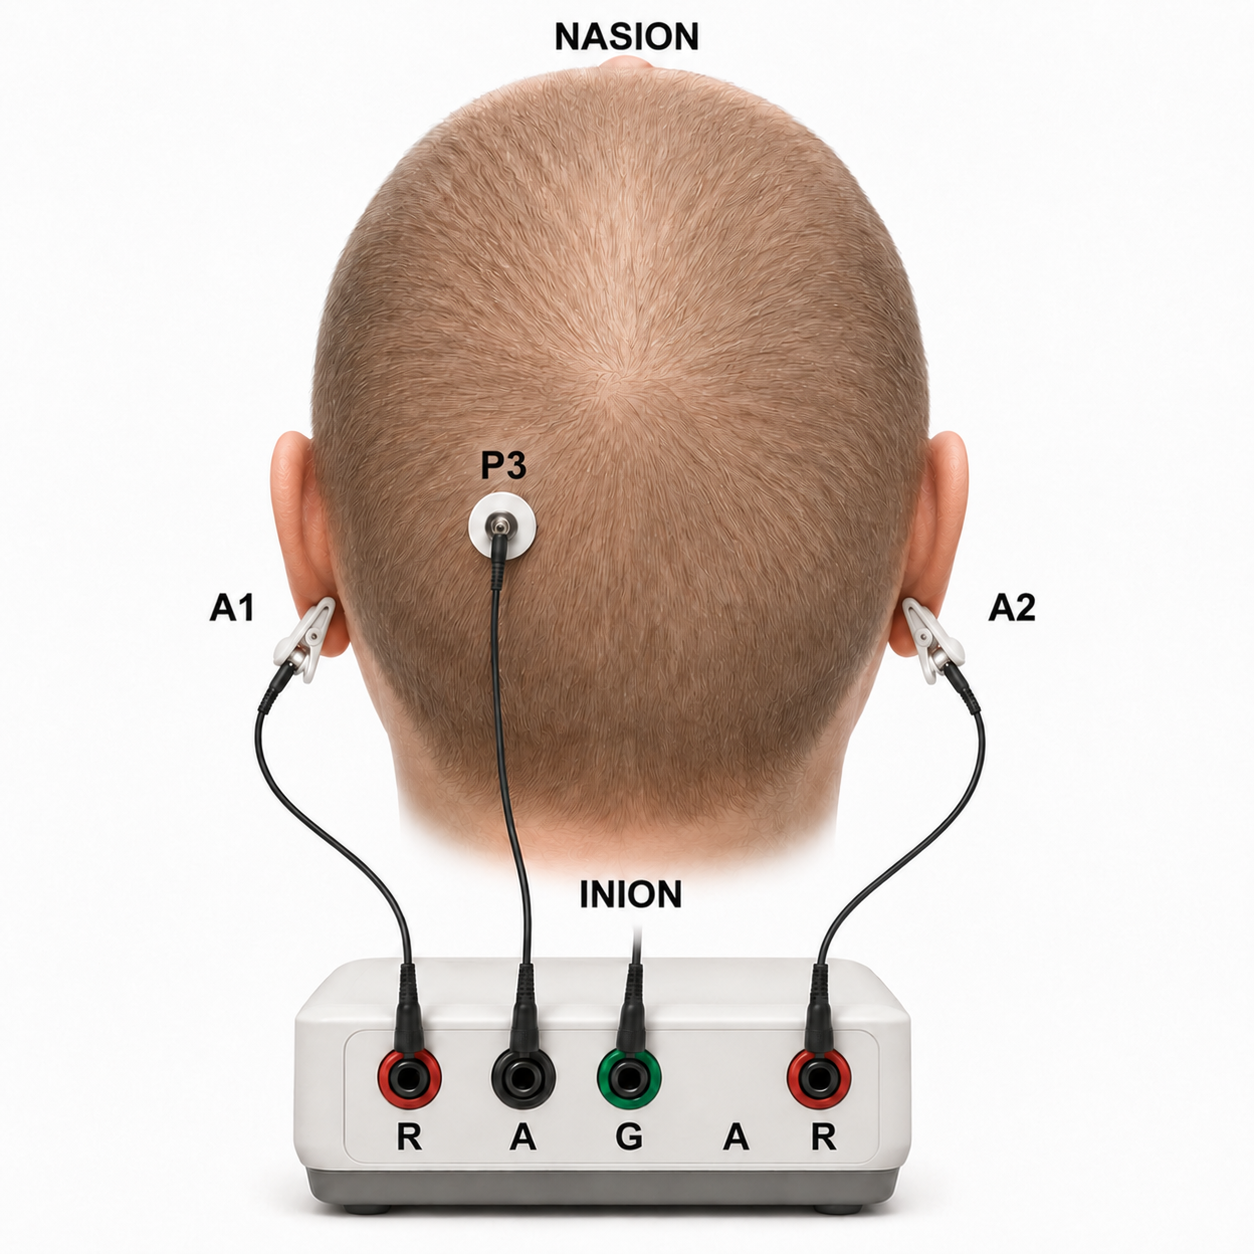
Scalp electrical activity is recorded using three electrodes: active, reference, and ground. In the so-called monopolar (referential) montage, the active electrode is placed over a scalp site that is a known EEG voltage source. The reference electrode is located at a neutral site (minimally active electrically) like the earlobe. The ground electrode can be placed anywhere, but is commonly placed on an earlobe or mastoid process (Demos, 2019).
Active and reference sensors are identical in construction and serve as balanced inputs—they are interchangeable. However, some technologies require that you designate a specific sensor as the reference, for example, in a linked-ears reference configuration.
In the so-called bipolar, or sequential, montage, two electrodes are placed on the scalp.
In both montage types, the recording measures the difference in electrical activity between two electrodes, excluding the ground electrode. The monopolar montage therefore provides a measure of the electrical activity beneath the active electrode, whereas the bipolar montage provides a measure that represents the difference between the two scalp electrodes.
In the graphic below, which shows a bipolar montage, the active (+) is red, the reference (-) is black, and the ground electrode (Gnd/Ref) is white. The voltages of the active and reference inputs are measured relative to the ground.
The graphic below of a monopolar montage shows two earlobe references and an active electrode at P3. A ground electrode is not shown.
EEG Apparatus
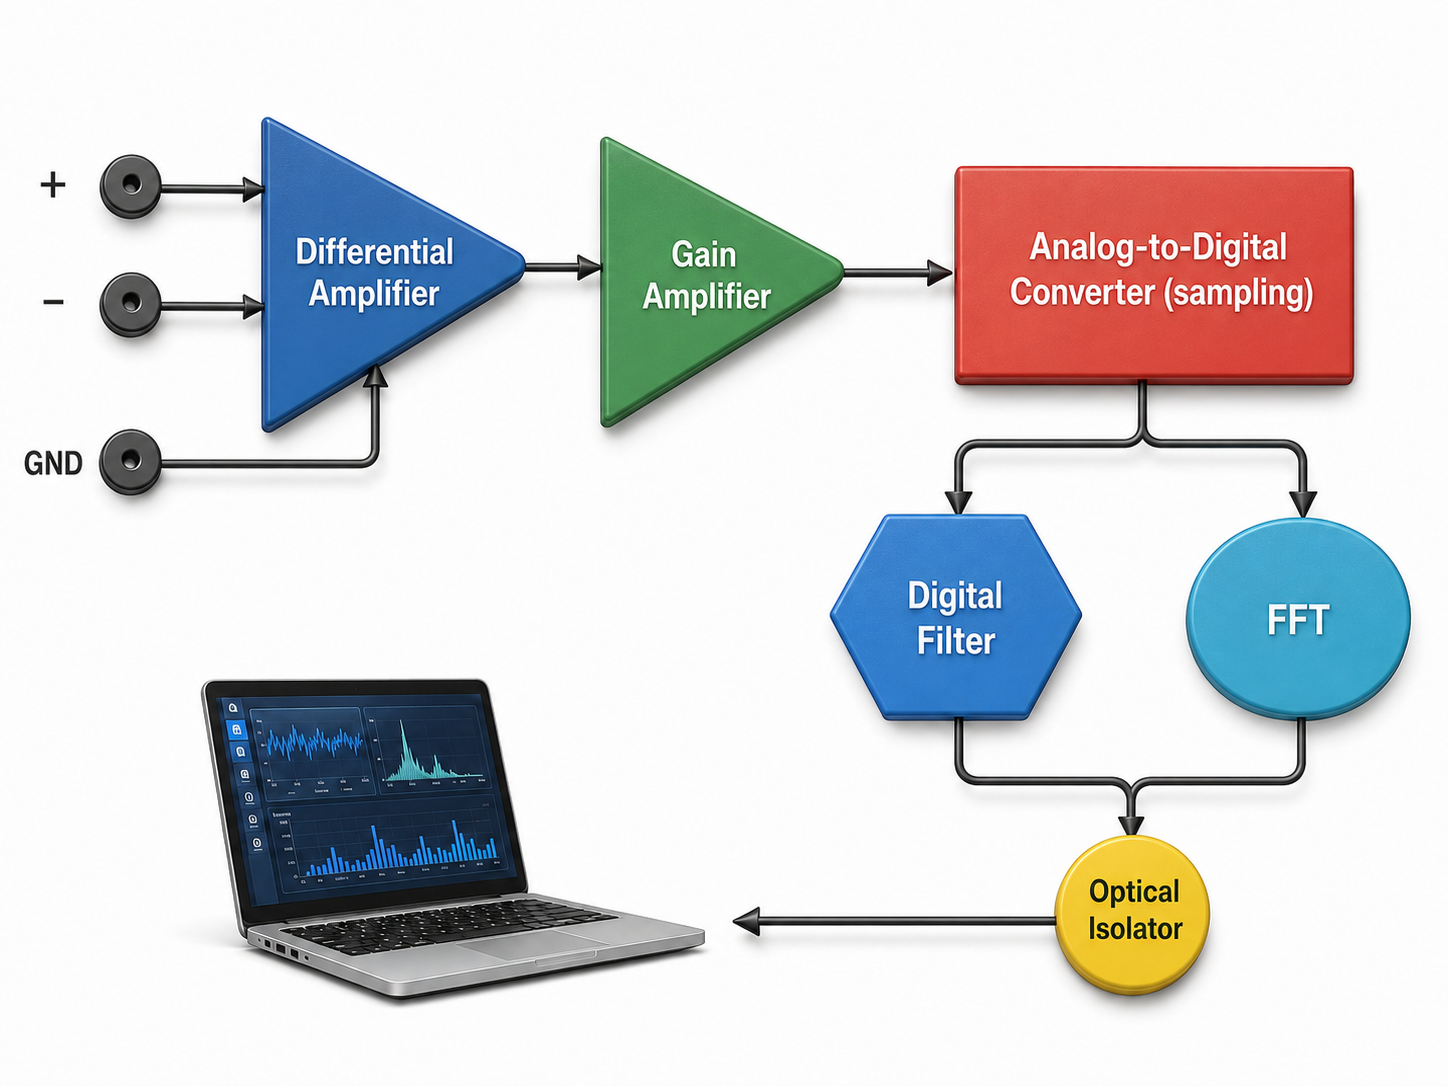
An electroencephalograph consists of several stages that work in sequence: a differential amplifier, gain amplifier, analog-to-digital converter, digital and FFT filters, and optical isolator. Each stage performs a specific function in the signal chain, and a problem at any stage can compromise the quality of your recording.
Signal Amplification
The biological signals monitored in biofeedback are extremely weak—EEG signals, for example, are measured in microvolts (millionths of a volt). These signals must be amplified over several stages to isolate the signal of interest and then drive visual or auditory displays. Think of a stereo amplifier that boosts an audio signal above the noise floor to levels that can power loudspeakers—your EEG amplifier performs essentially the same task.
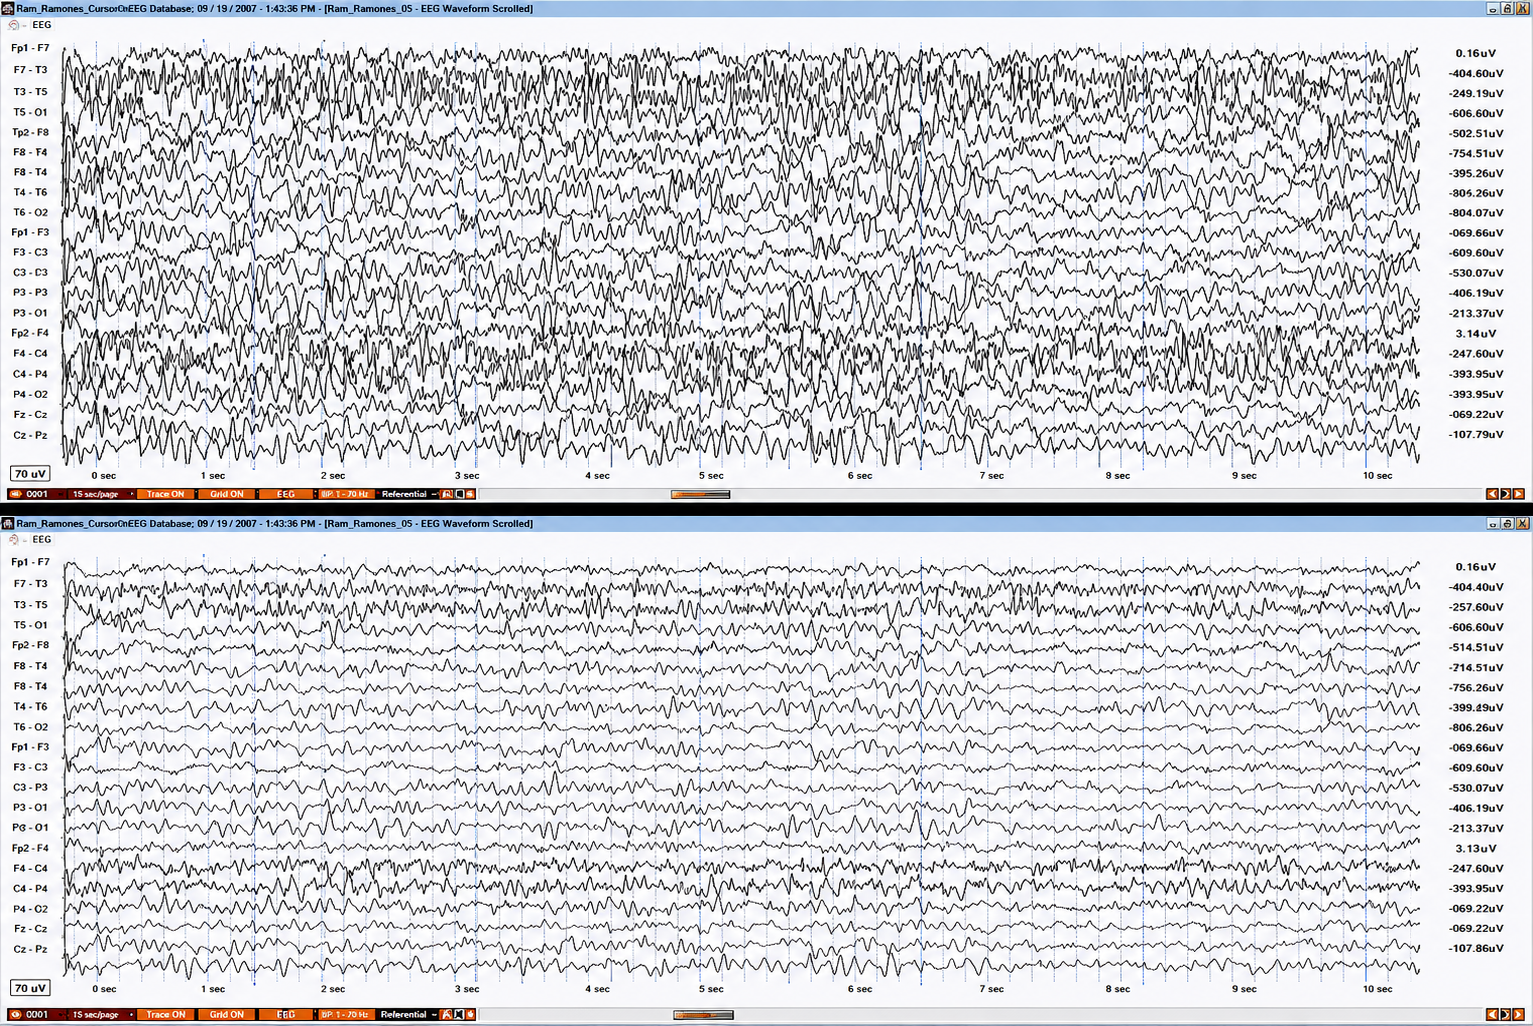
The display of the EEG waveform is affected by the amplifier's input sensitivity setting. Sensitivity is measured as microvolts of amplitude per millimeter of deflection (µV/mm). A lower sensitivity setting, such as 3 µV/mm, produces larger-appearing EEG waves than a higher setting, such as 10 µV/mm.
In the graphic below, the top frame shows the lower setting, in which fewer microvolts of amplitude are needed to move the tracing 1 mm. The bottom frame shows the higher setting, in which more microvolts of amplitude are required to move the tracing the same distance, so the waveform appears smaller. Do not confuse this display sensitivity, expressed in µV/mm, with an amplifier's input voltage range, which is the largest input the amplifier can accept without clipping; some manufacturers use the word sensitivity for that specification as well.
Gain is an amplifier's ability to increase the magnitude of an input signal, expressed as the ratio of output to input. An amplifier that produces a 1-mV output from a 1-μV input has a gain of 1,000.
Differential Amplifiers
Differential amplifiers help to separate genuine EEG signals from artifacts—one of the most critical functions in the entire recording chain. The concepts of common-mode rejection and differential input impedance directly affect the accuracy of every neurofeedback session.
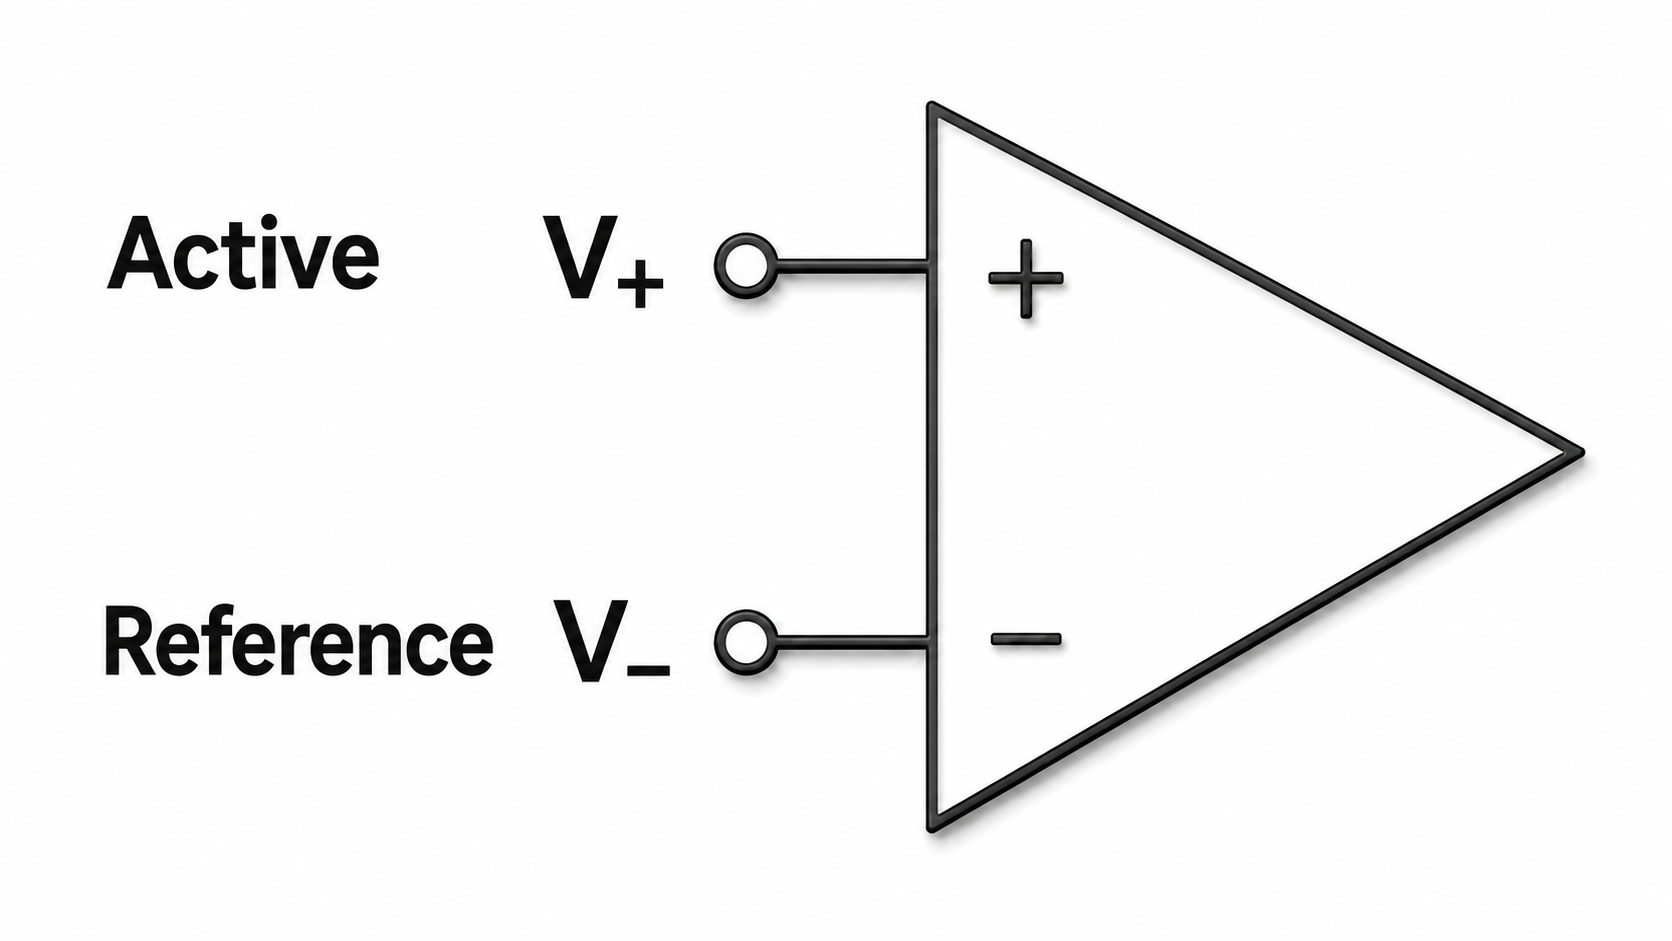
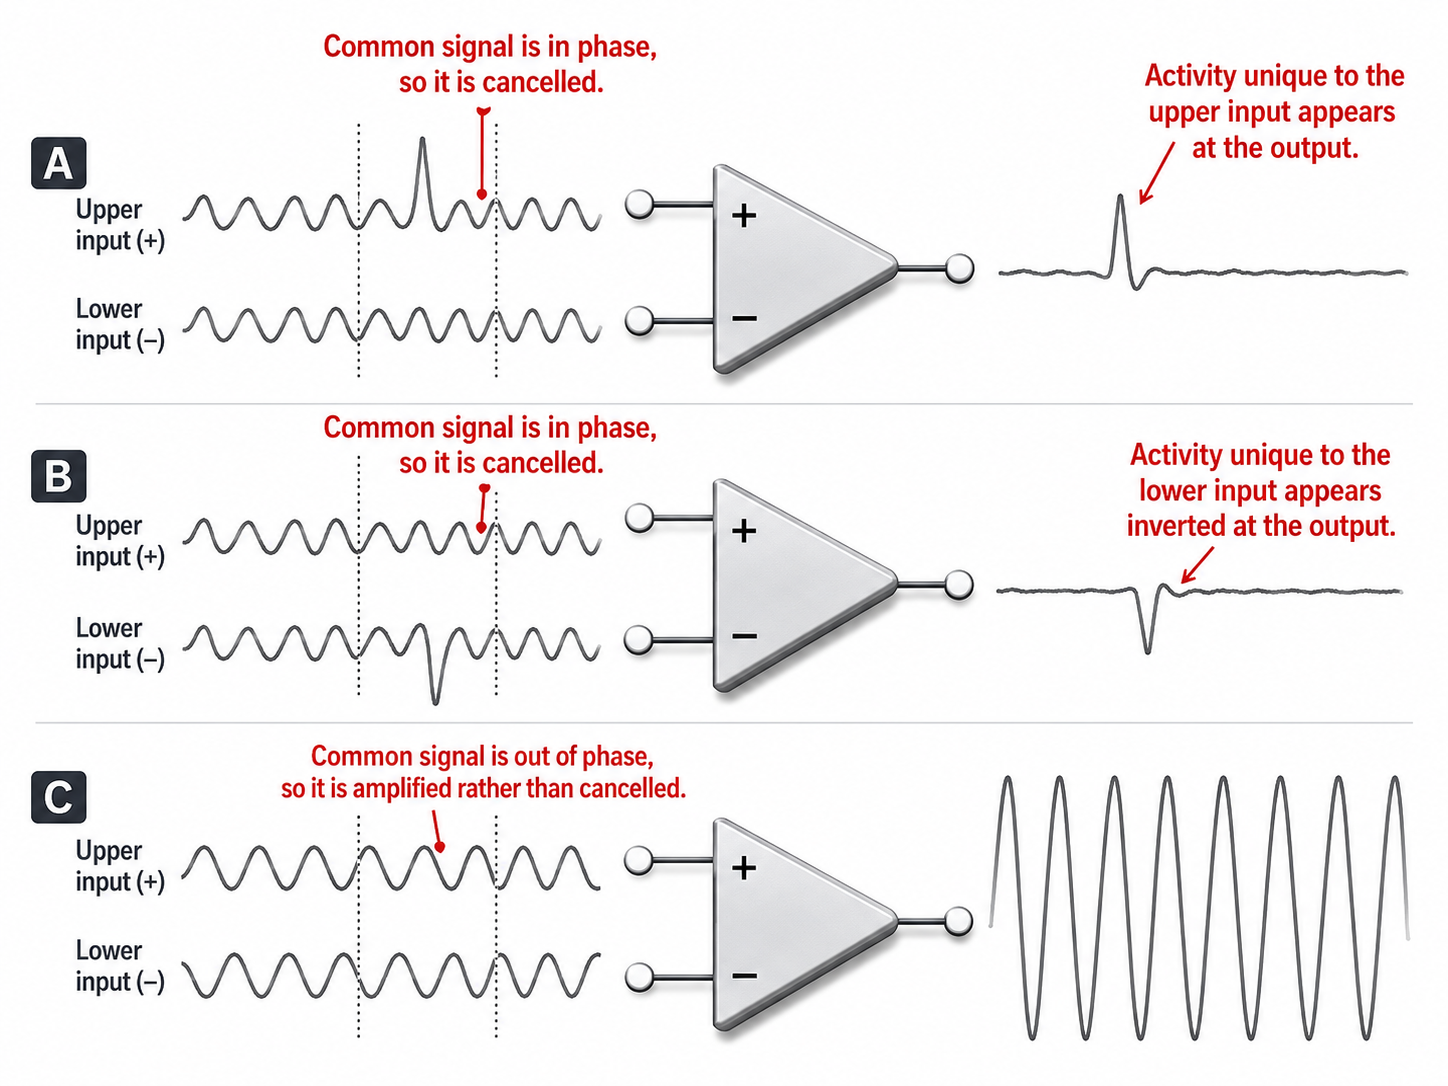
The EEG signal is first boosted by a differential amplifier (also called a balanced amplifier) and then by a gain amplifier. The differential amplifier amplifies the difference between its two inputs: the active (input 1) and reference (input 2).
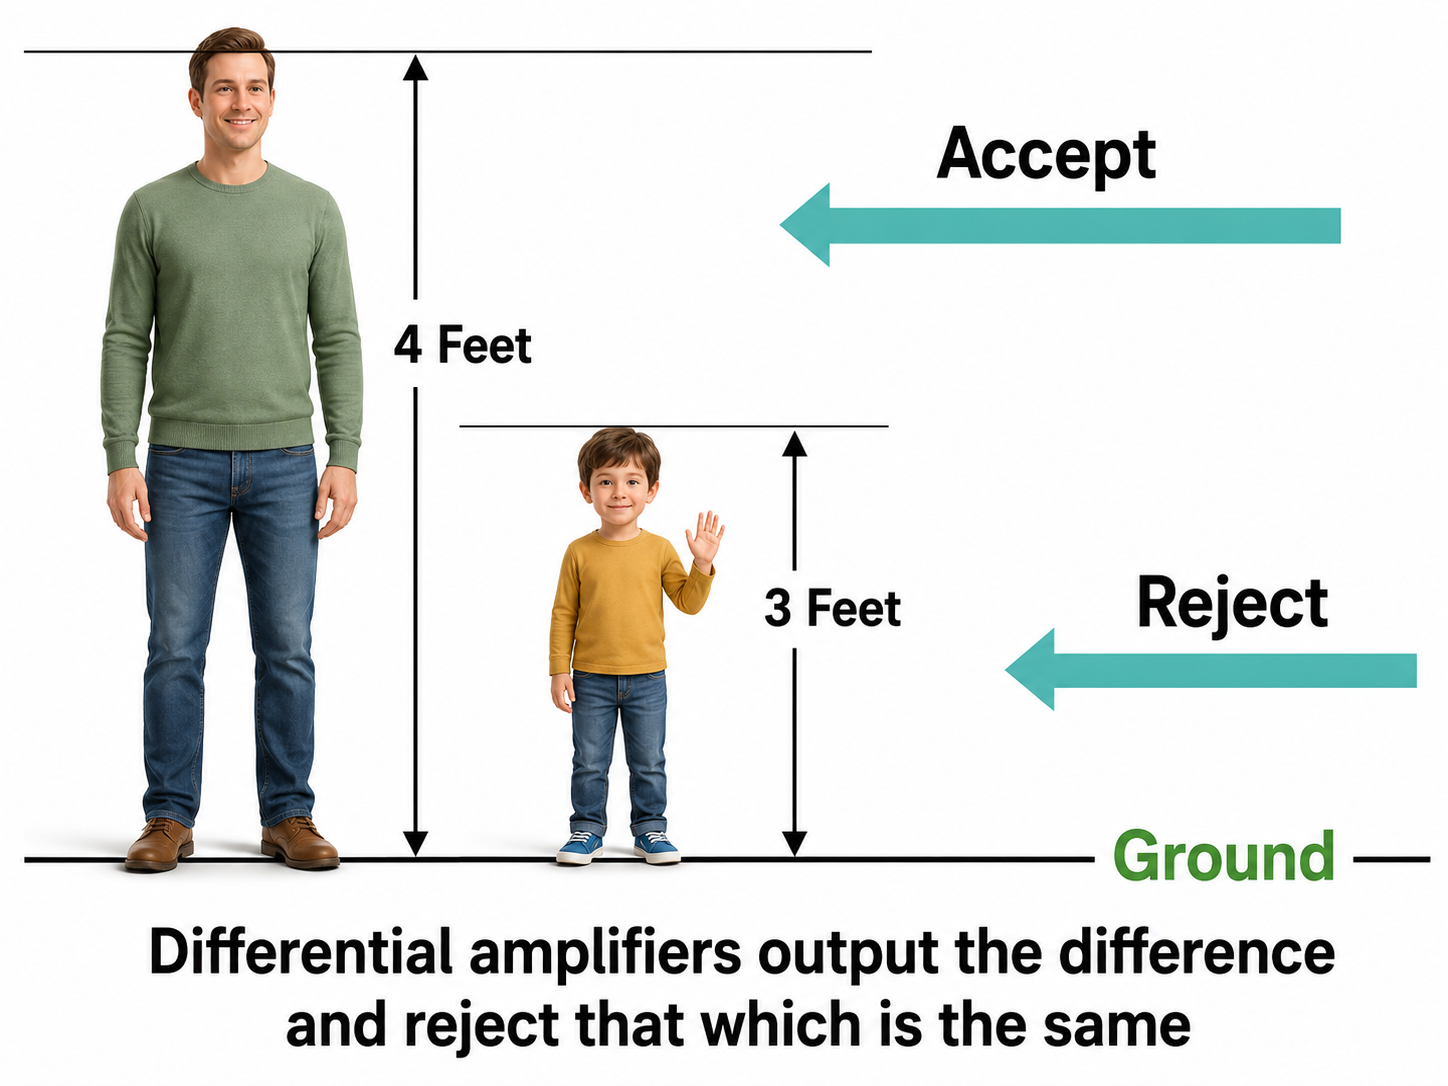
One input is non-inverting and the other is inverting, so a voltage common to both inputs is subtracted away while a voltage that differs between them is preserved and amplified.
The portion of the signal that appears with the same amplitude and timing at both inputs is the common-mode signal, typically shared artifact such as power line noise, and the portion that differs between the inputs is the differential-mode signal, which carries the genuine EEG of interest.
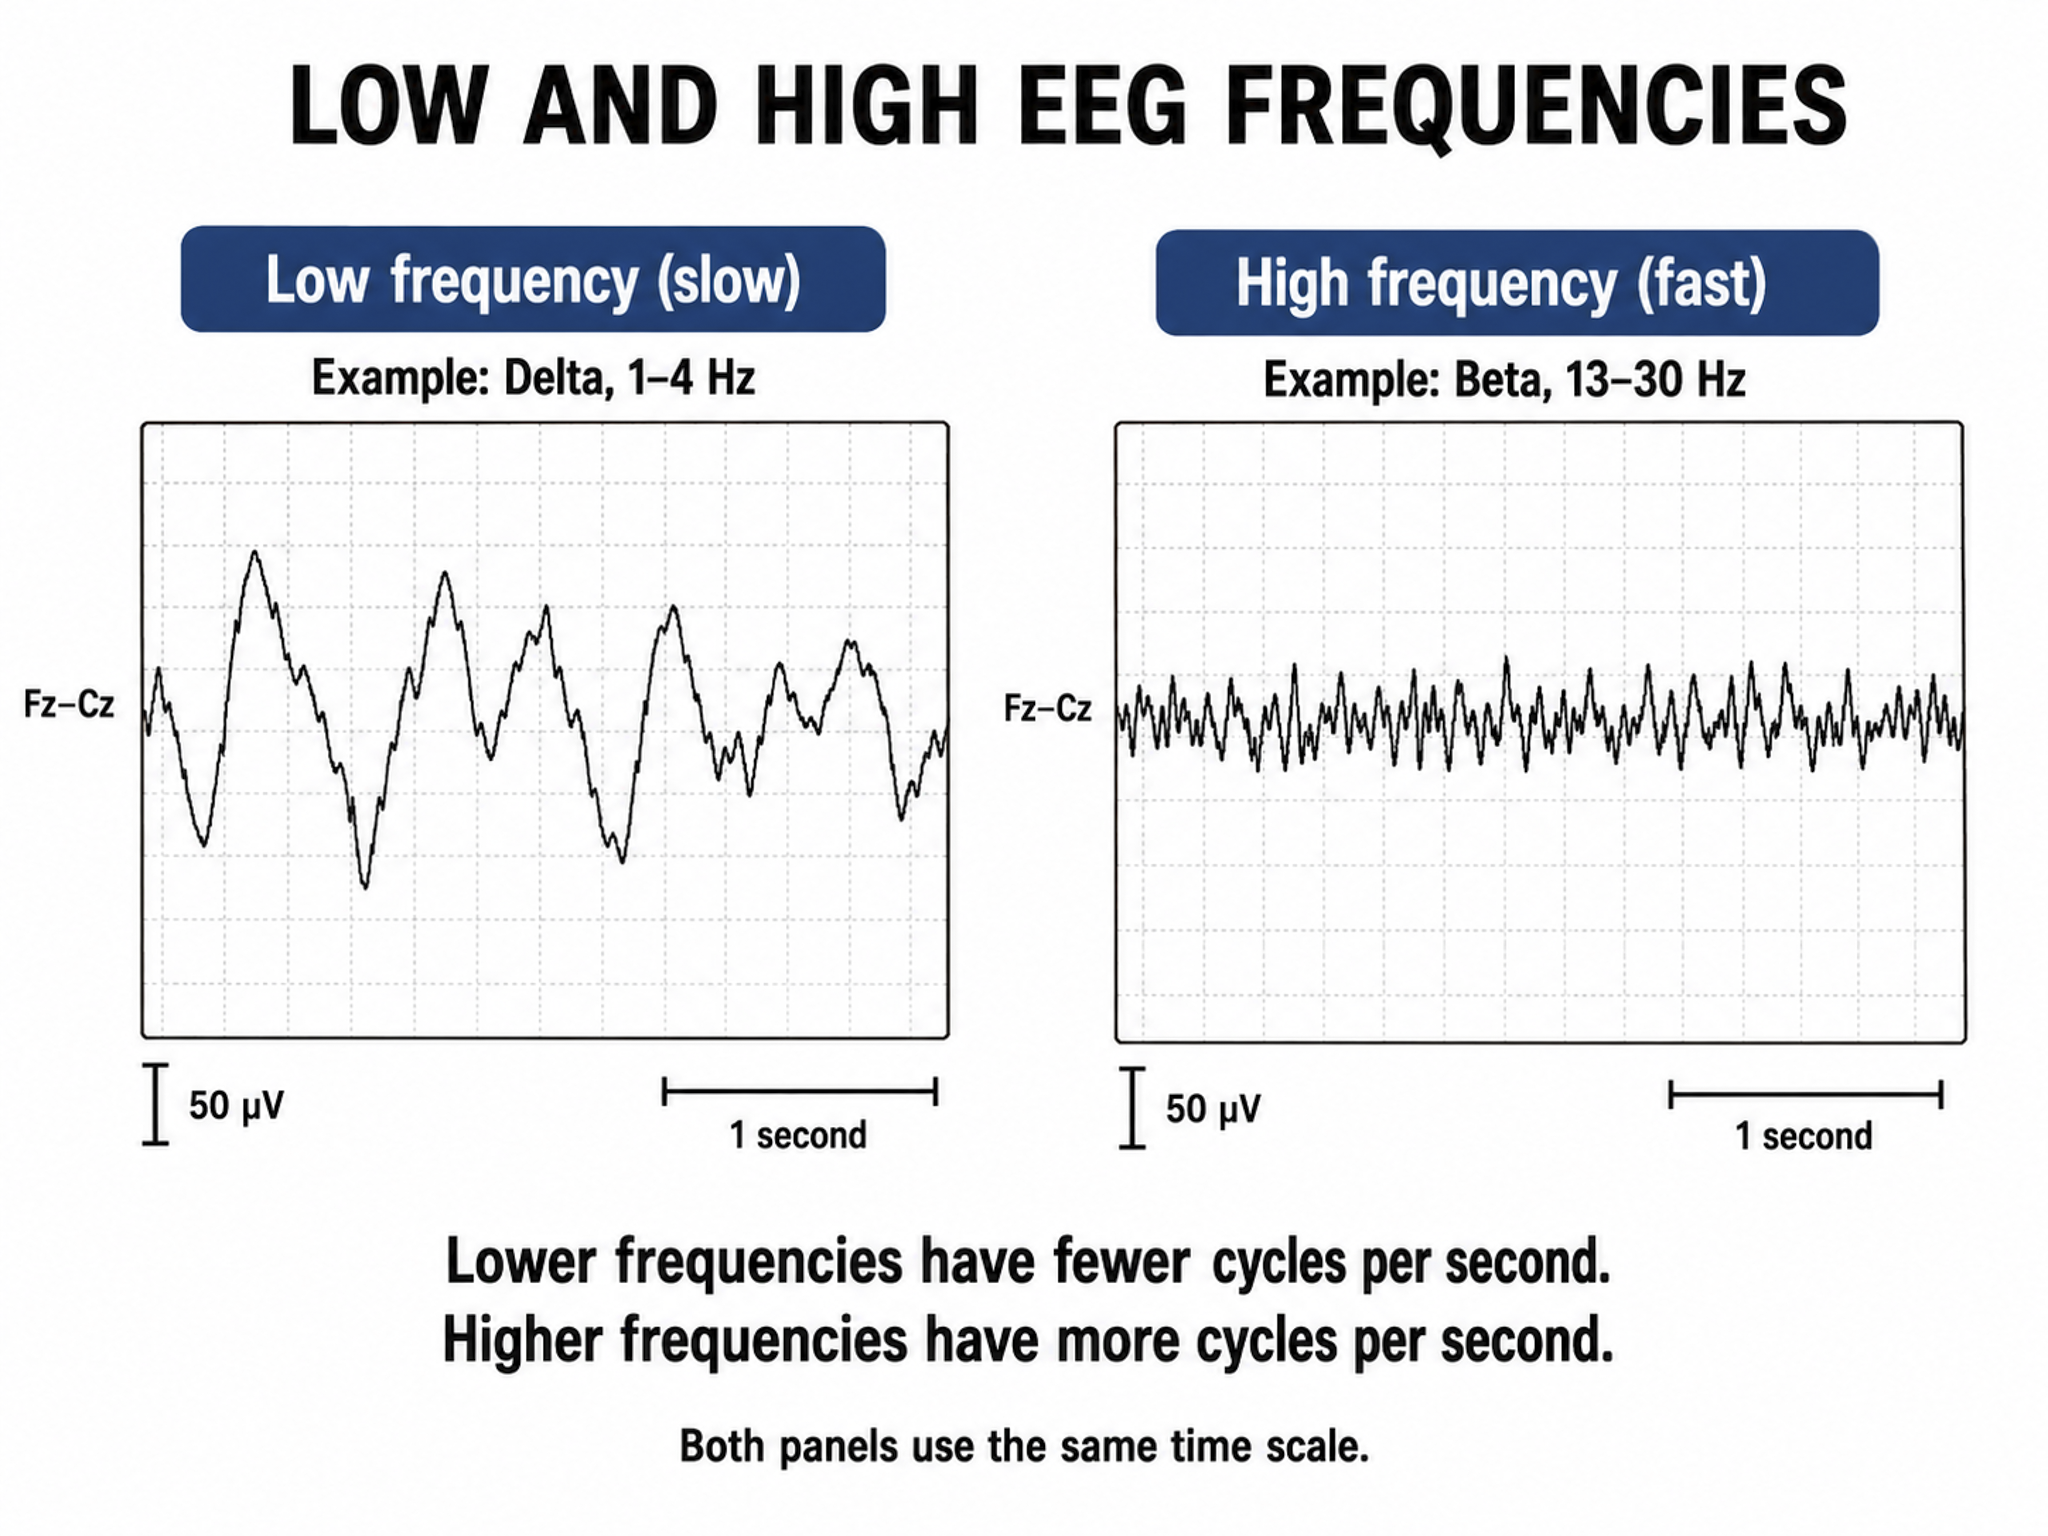
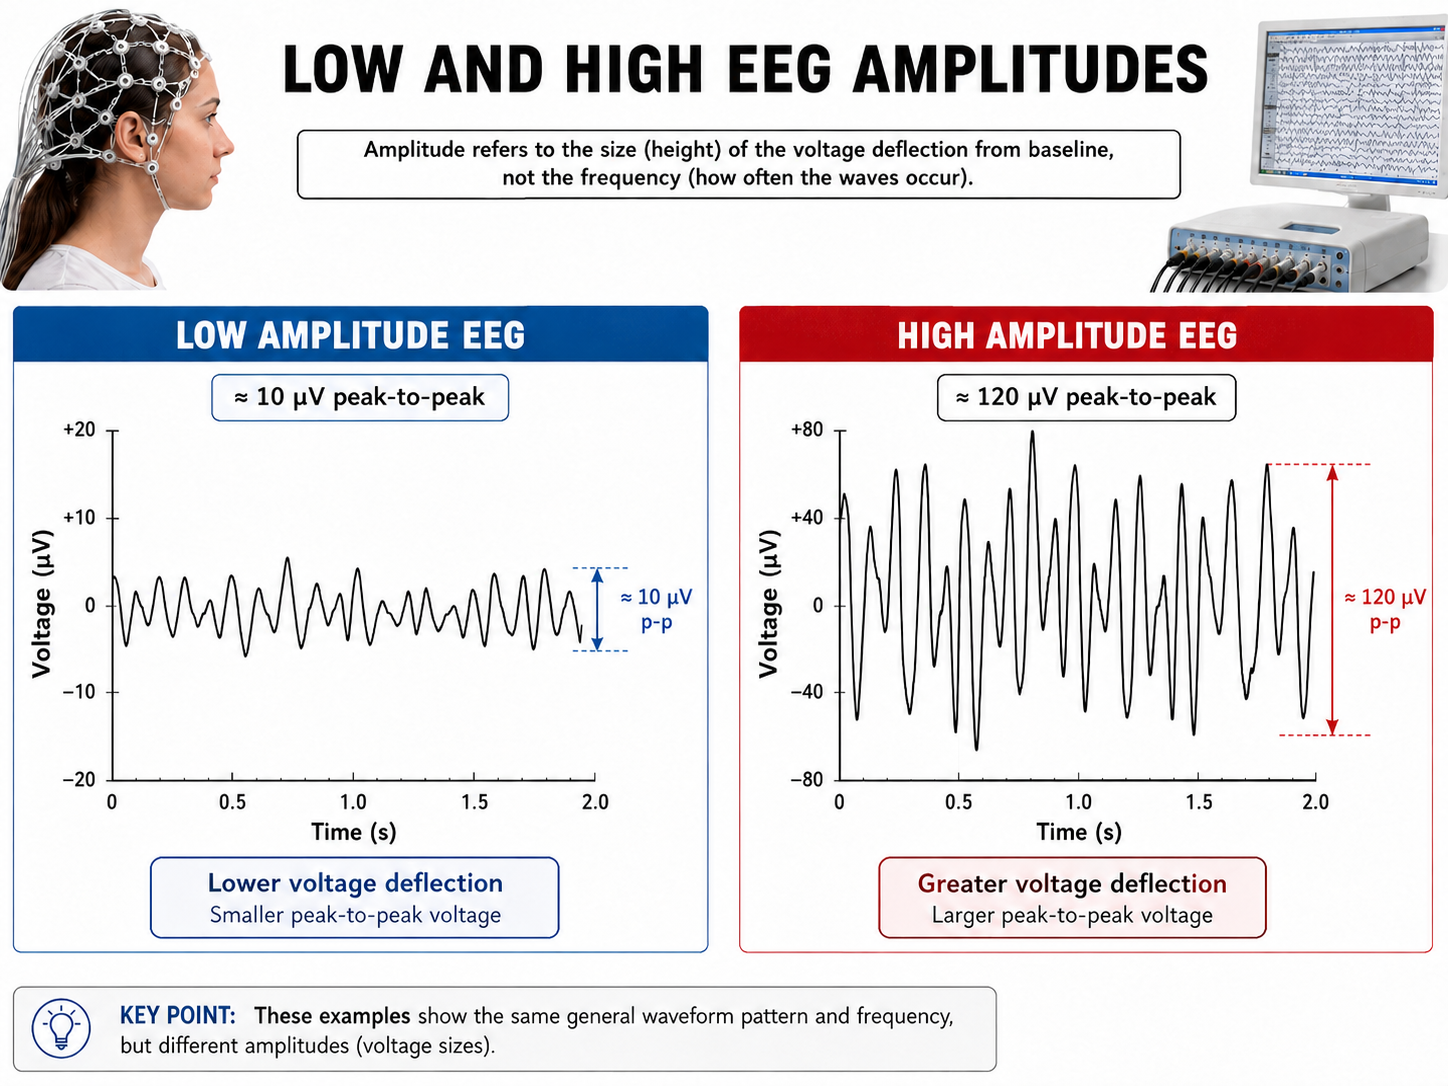
Three signal properties determine what a differential amplifier retains or rejects. Frequency is the number of cycles per second (Hz). Amplitude is the signal voltage or power, measured in microvolts or picowatts. Phase is the similarity in timing of the waves at two locations—signals that are 180° out of phase peak when the other reaches its trough.
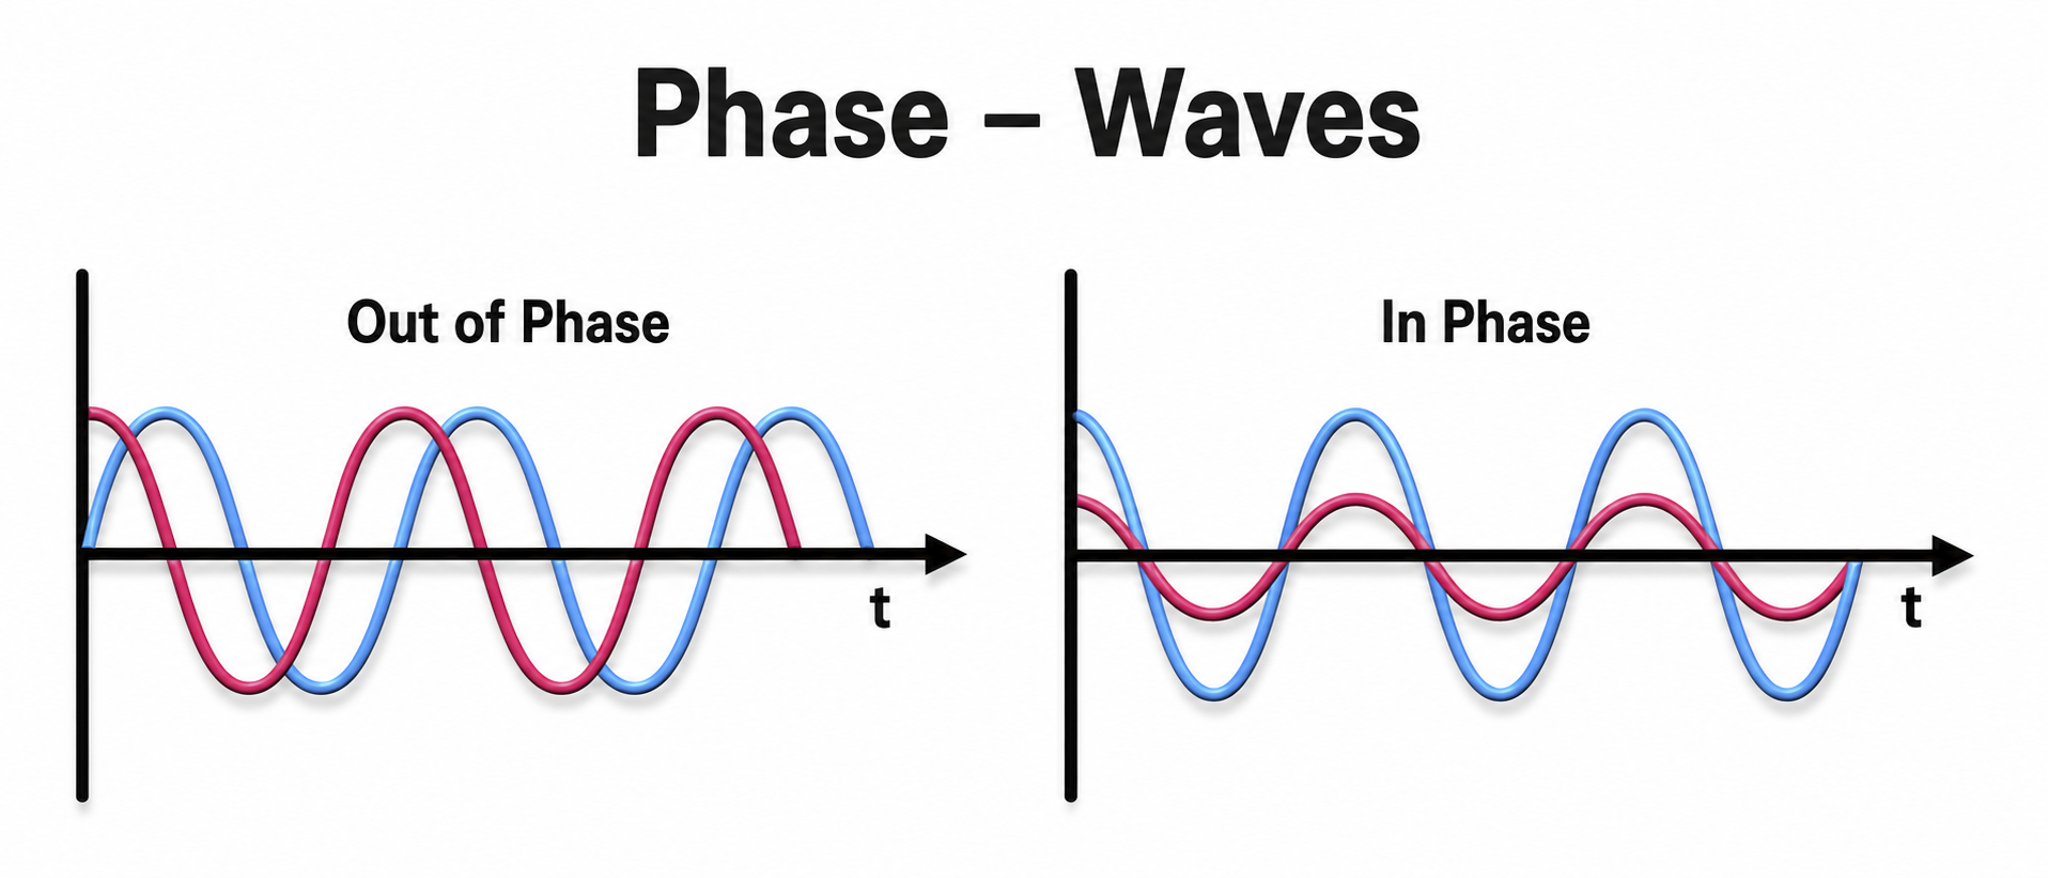
How does a differential amplifier use these EEG features to reduce artifact? When no EEG activity is present, identical noise signals reach each amplifier input. The differential amplifier subtracts these signals, canceling out the artifact—the output of a perfect differential amplifier would be zero.
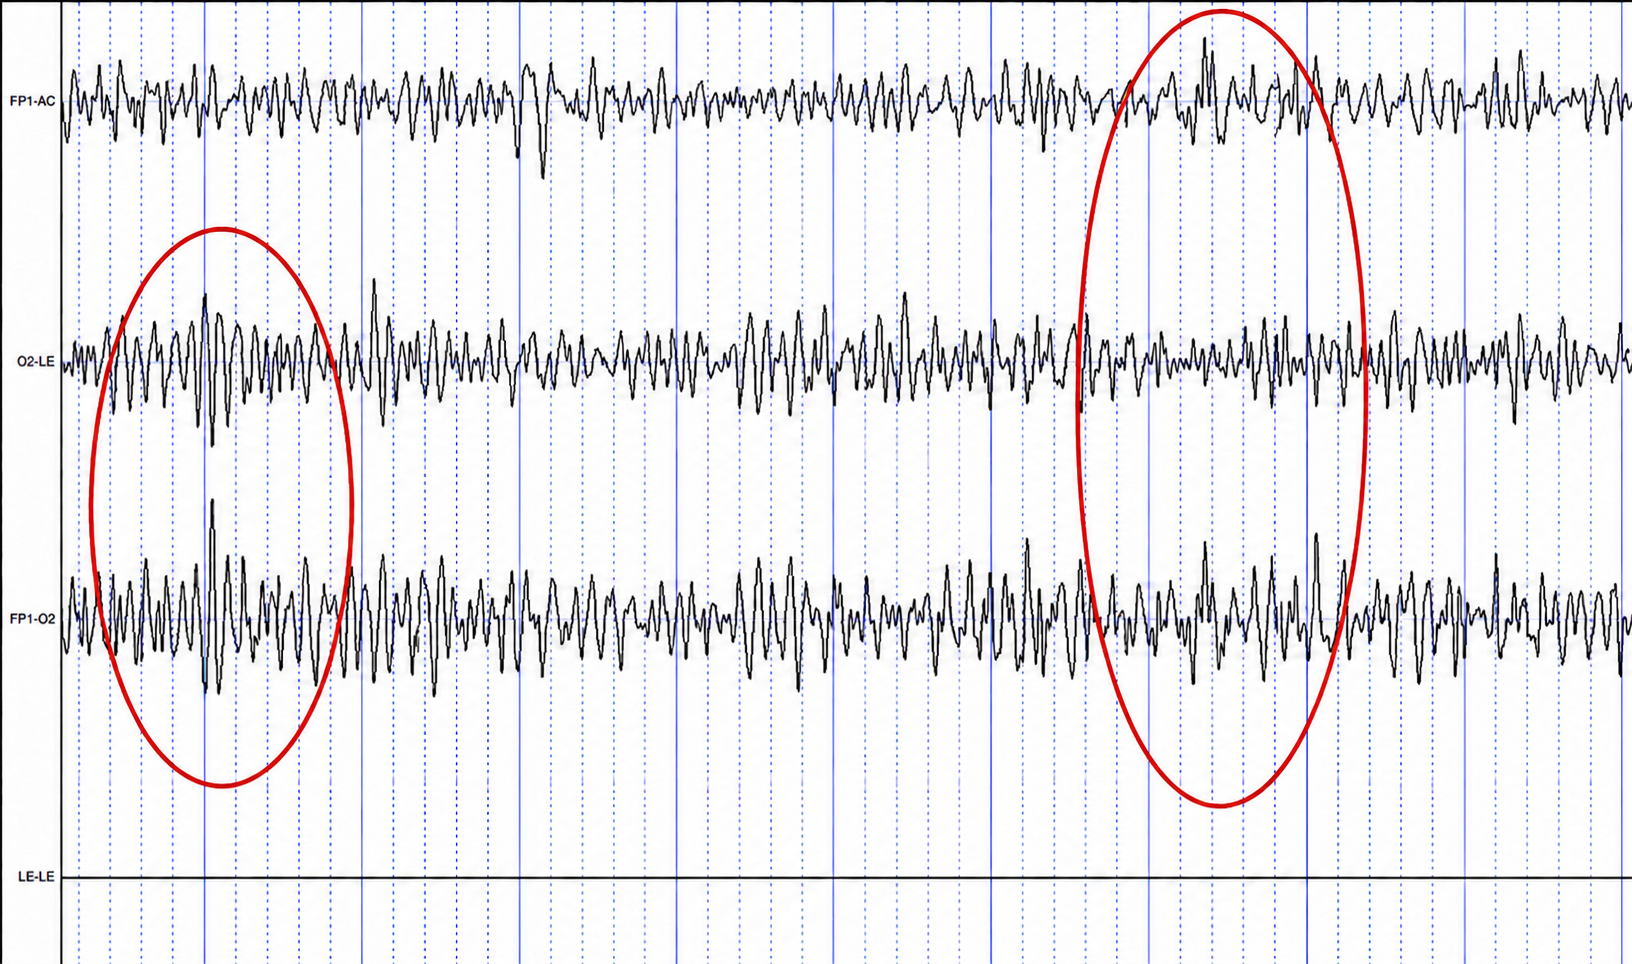
All four tracings below occur simultaneously. On the left portion of the top three traces, the first trace shows low amplitude activity at Fp1 (referenced to linked ears), the second shows high amplitude activity at O2 (also referenced to linked ears), and the third shows the difference between Fp1 and O2 when they are referenced to each other, so that shared activity is subtracted out. Toward the right side of the tracings, the third trace again shows the difference between Fp1 and O2.
The first tracing (Fp1-LE) shows the Fp1 electrode referenced to linked ears with an event circled in red. The second tracing (O2-LE) shows the O2 electrode, also referenced to linked ears, with a distinct EEG event. In the third tracing (Fp1-O2), in which these two electrodes are referenced to each other, the differences are retained—demonstrating common-mode rejection. Last, the fourth tracing (LE-LE) shows linked ears compared to each other, resulting in complete rejection of the identical signals.
The Effect of Electrode Location on Common Mode Rejection
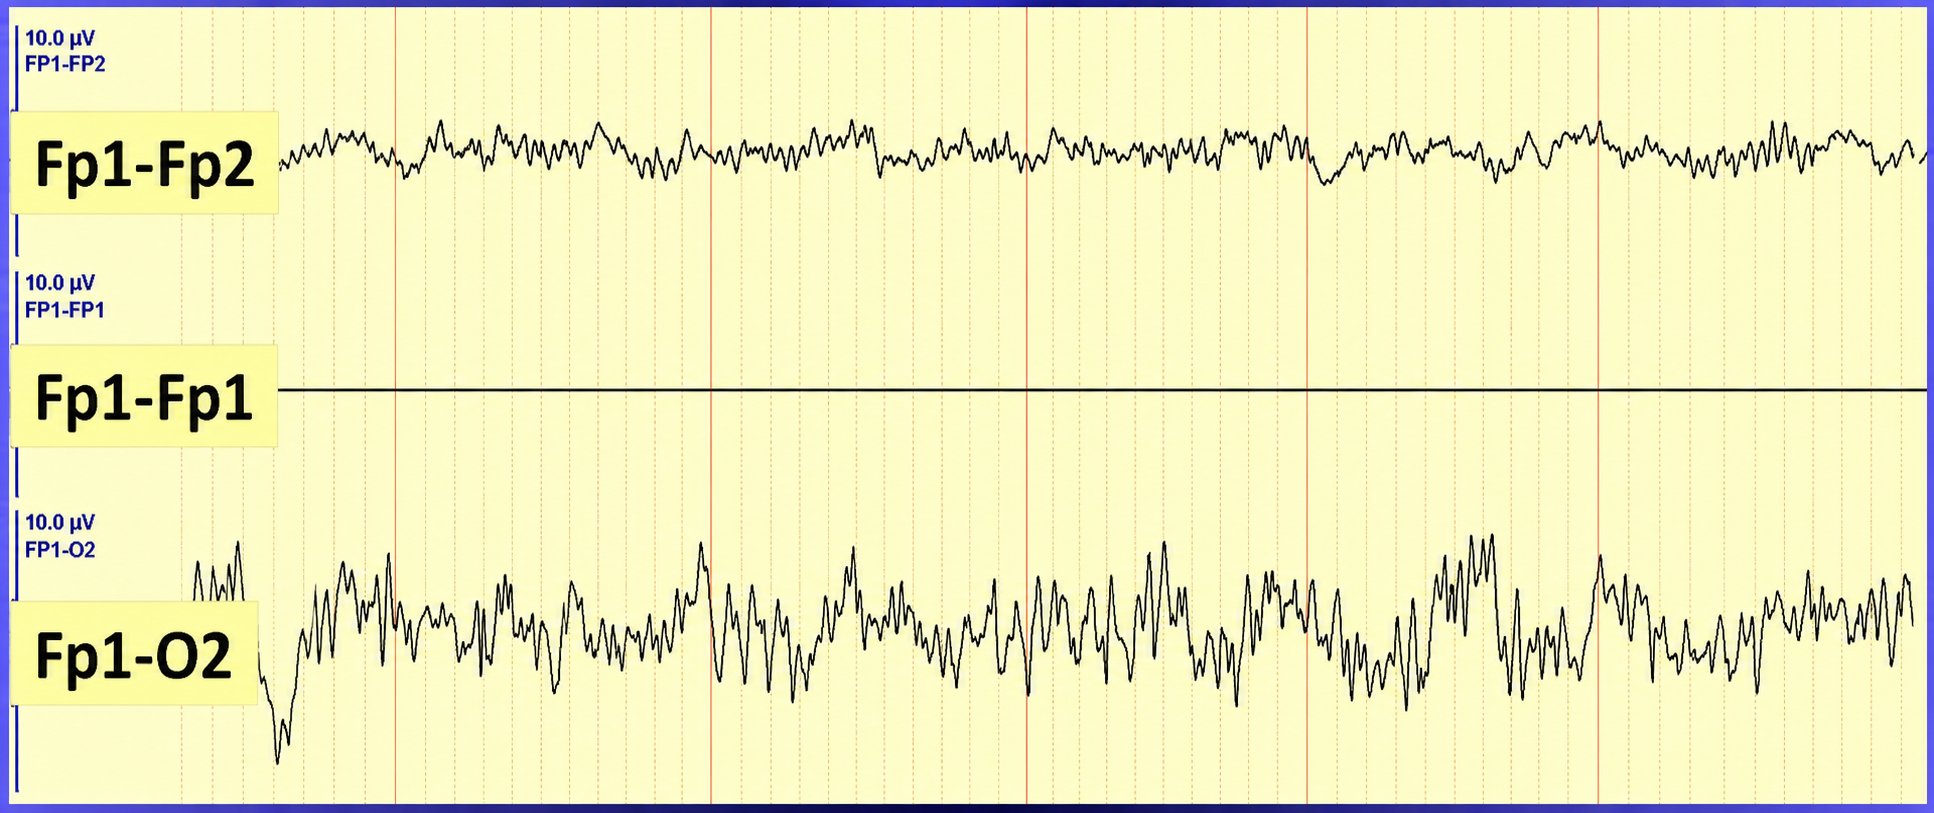
Brain activity is more similar when electrodes are placed close together and less similar when they are farther apart. This means that a differential amplifier may inadvertently reject actual EEG voltages detected by adjacent electrodes—a clinical pitfall worth remembering when choosing montages. In the recording below, sensors were placed at essentially the same anatomical location (labeled Fp1-Fp1) so that both inputs saw nearly identical activity, producing the near-flat line that demonstrates almost complete signal subtraction.
Differential Input Impedance
An amplifier's differential input impedance further reduces the effect of unequal impedances at the skin-electrode interface. As EEG signals enter the amplifier, they are dropped across a network of resistors presenting a differential input impedance in the Gohm (billion ohms) range, with state-of-the-art instruments now exceeding 10 Gohms. The differential input impedance must be at least 100 times the skin-electrode impedance so that 99% or more of the signal reaches the electroencephalograph.
Why is this important? Stronger signals help the amplifier differentiate genuine EEG activity from noise, producing more accurate feedback—which is the entire point of your recording system.
The Challenges of Recording Infra-Slow EEG Activity
Recording infra-slow (0-1 Hz) EEG activity pushes amplifier technology to its limits and introduces unique artifact challenges that clinicians must understand before attempting this type of recording.
AC amplifiers have severe limitations when recording infra-slow signals because client movement, eye movement, sweat, and transient field artifacts produce significant voltage changes that the amplifier cannot distinguish from genuine cortical activity. Long time constants over 80 seconds are recommended to integrate artifact-induced voltages over 2-4-minute periods, but persistent artifacts like eye movement will consistently degrade the signal-to-noise ratio.
Infra-slow recording requires DC-coupled amplifiers with a large dynamic range produced by 24-bit A/D converters to prevent saturation by slow drifts in baseline voltage. Standard EEG electrodes made of gold, steel, or tin are poor choices because they are comparatively polarizable: charge accumulates at the metal-electrolyte junction so the interface behaves like a capacitor, blocking the lowest frequencies and producing unstable baseline drift. Sintered silver/silver-chloride electrodes are preferred because they are only minimally polarizable, passing near-DC potentials with a comparatively stable half-cell potential. No electrode is entirely nonpolarizable.
The clinician must also distinguish slow artifacts from genuine infra-slow signals. Eccrine sweat glands produce standing millivolt-range potentials, and while partial skin puncturing can eliminate these, this practice risks infection transmission. Eye blink and eye movement artifacts can be identified by their characteristic location, while body tilt, cough and strain, hyperventilation, and tongue movements produce high-amplitude diffuse very slow potentials (Miller et al., 2007).
Common-Mode Rejection
A differential amplifier's effectiveness at separating signal from artifact is quantified by the common-mode rejection ratio (CMRR). Since differential amplifiers cancel noise imperfectly, both signal and some noise will be boosted. The CMRR compares how much a differential amplifier boosts the signal (differential gain) versus artifact (common-mode gain): CMRR = differential gain / common-mode gain.
CMRR should be measured at 50/60 Hz, where the strongest artifacts (like power line noise) are found. CMRR is usually expressed in decibels (dB), a logarithmic unit for comparing two amplitude values in which each 20-dB step represents a tenfold difference in voltage.
A widely cited floor for biosignal amplifiers is 80 dB, a 10,000:1 ratio, and neurofeedback sources commonly recommend at least 100 dB, which equals a 100,000:1 ratio and means the signal is boosted 100,000 times more than competing noise. Contemporary commercial EEG amplifiers typically specify roughly 100 to 120 dB at 50/60 Hz, and the best instrumentation-amplifier designs reach about 130 dB. Treat far larger published figures with caution, because the ratio actually achieved in a recording is limited by impedance mismatch between electrodes rather than by the amplifier alone, so a superb amplifier specification cannot rescue a poorly prepared montage.
You can take nine practical steps to maximize common-mode rejection: (1) ensure that skin-electrode impedances are balanced within 1-3 Kohm, since imbalance will make the signals look different and prevent complete subtraction of noise; (2) active electrodes should be equidistant from the artifact source; (3) active, reference, and ground sensors should be the same distance from each other; (4) when using two or more channels, the ground and each active should be the same distance apart; (5) ensure that there is a good ground connection, since a deficient ground lets the common-mode voltage appear unequally at the two inputs, so shared noise is no longer identical and can no longer be subtracted away; (6) identify artifact sources by using a portable electroencephalograph or electromyograph as you would a Geiger counter, moving the unit around the room with EEG sensors connected but held in your hand; (7) remove the artifact sources you find, for example, fluorescent lights can be replaced with fixtures that produce less 50/60 Hz noise; (8) remove unused sensor cables from the encoder so they do not function as an antenna for 50/60 Hz artifact; (9) position the electroencephalograph and electrode cable to reduce artifact reception, using the location and angle that yield the lowest readings when not attached to a patient (Thompson & Thompson, 2015).
Sampling the EEG Signal
This section covers the conversion of analog EEG signals into digital data. Sampling rate and resolution determine how faithfully your digital recording represents the actual brain activity, and choosing the wrong settings can introduce errors that are invisible but clinically significant.
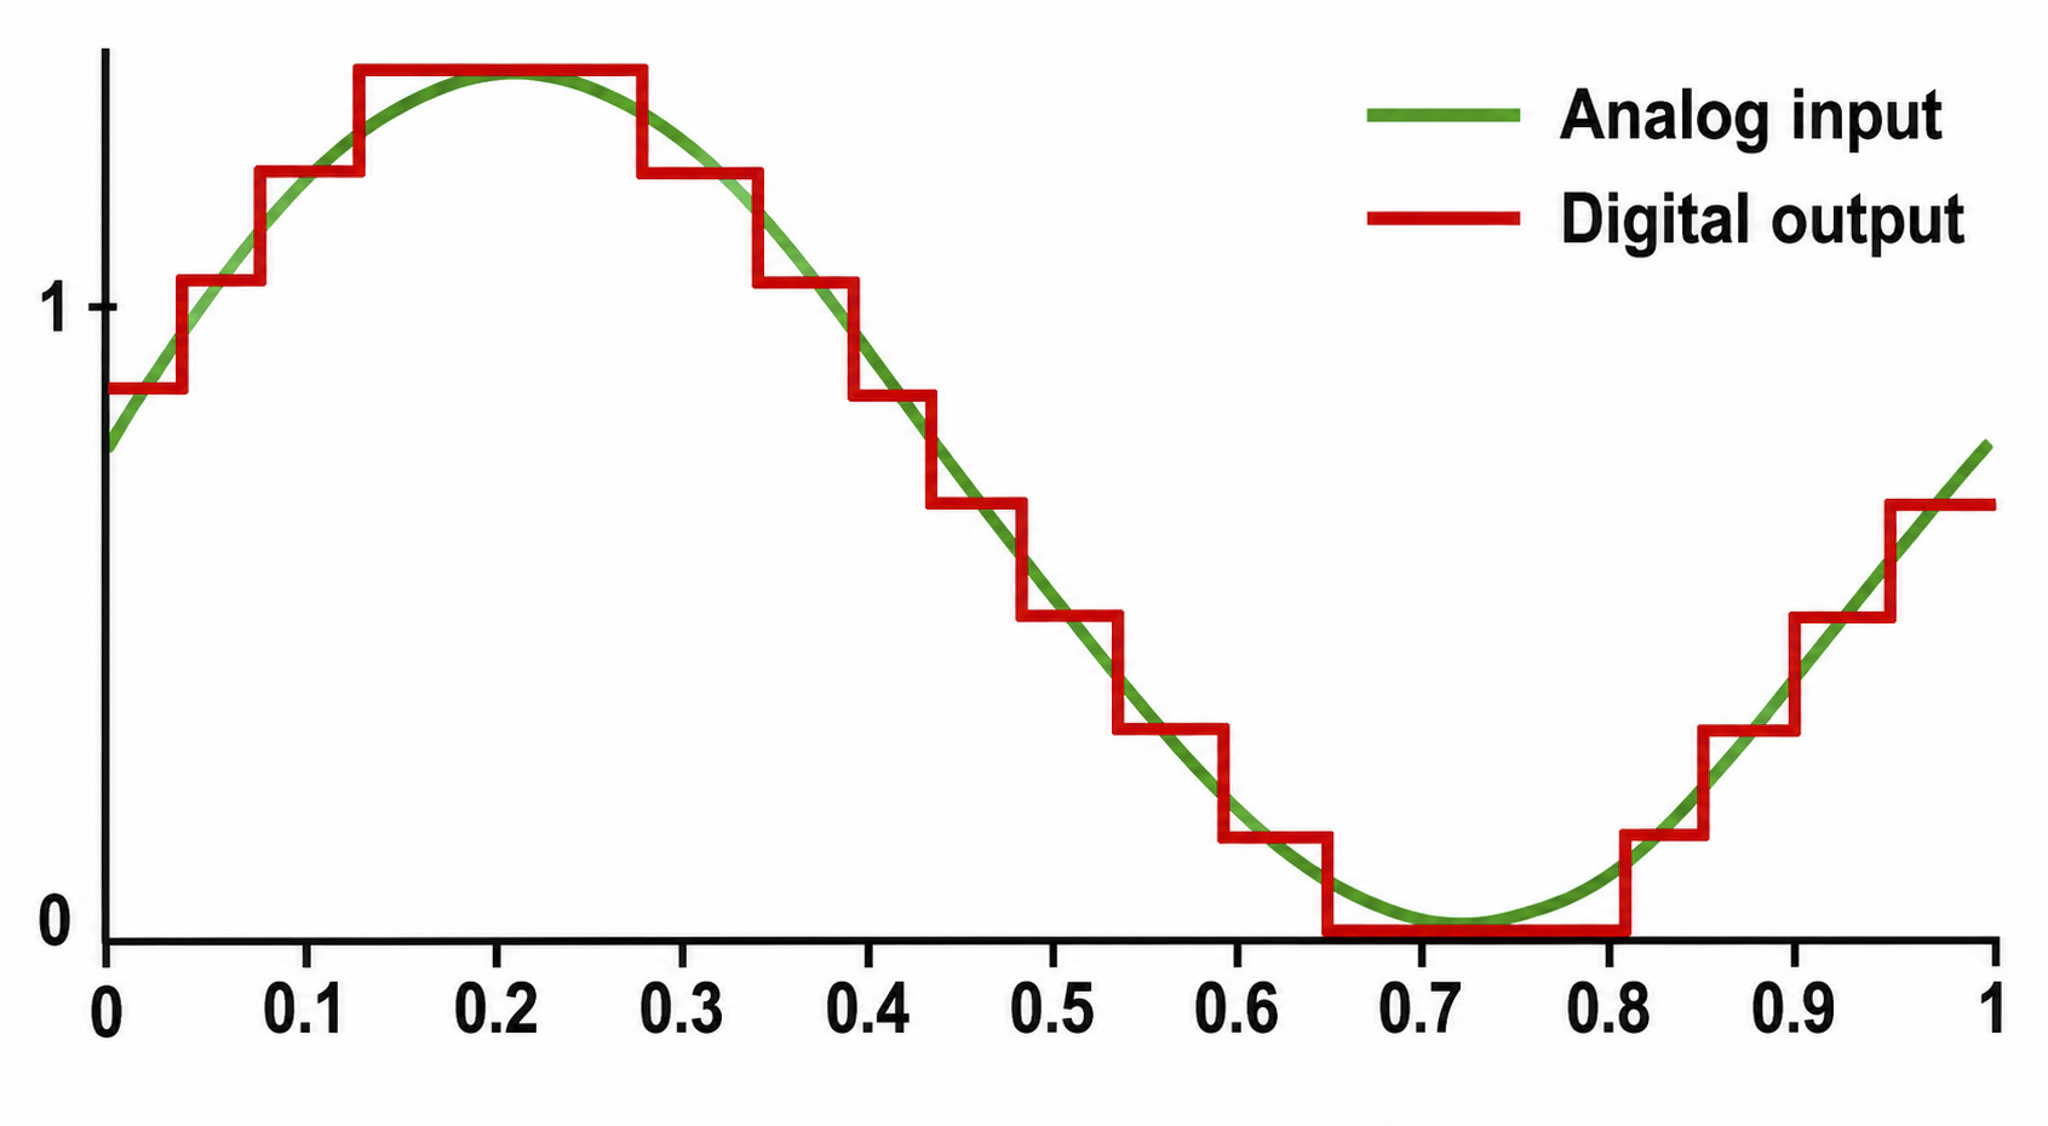
An analog-to-digital (A/D) converter samples the EEG signal at a fixed interval, and the sampling rate—the number of measurements taken per second—must be high enough to represent the signal accurately. According to the Nyquist-Shannon sampling theorem, an A/D converter's sampling rate should be at least twice the highest frequency component you intend to sample.
The theorem sets a floor, not a practical target. An anti-aliasing filter, the low-pass filter that removes frequencies too high to be sampled correctly, does not cut off perfectly at its stated frequency but rolls off gradually, and sampling only slightly above the minimum can leave waveform peaks poorly defined. Guidelines therefore call for an extra margin.
The American Clinical Neurophysiology Society (ACNS) recommends a sampling rate of more than three times the high-frequency filter setting. Assuming a typical 70-Hz high-frequency filter, this yields a minimum of 256 samples per second (sps), with 512 sps preferable (Halford et al., 2016). In practice, 256 sps is the common clinical baseline, and rates of 500-1,000 sps or higher are preferred for detailed analysis of fast activity.
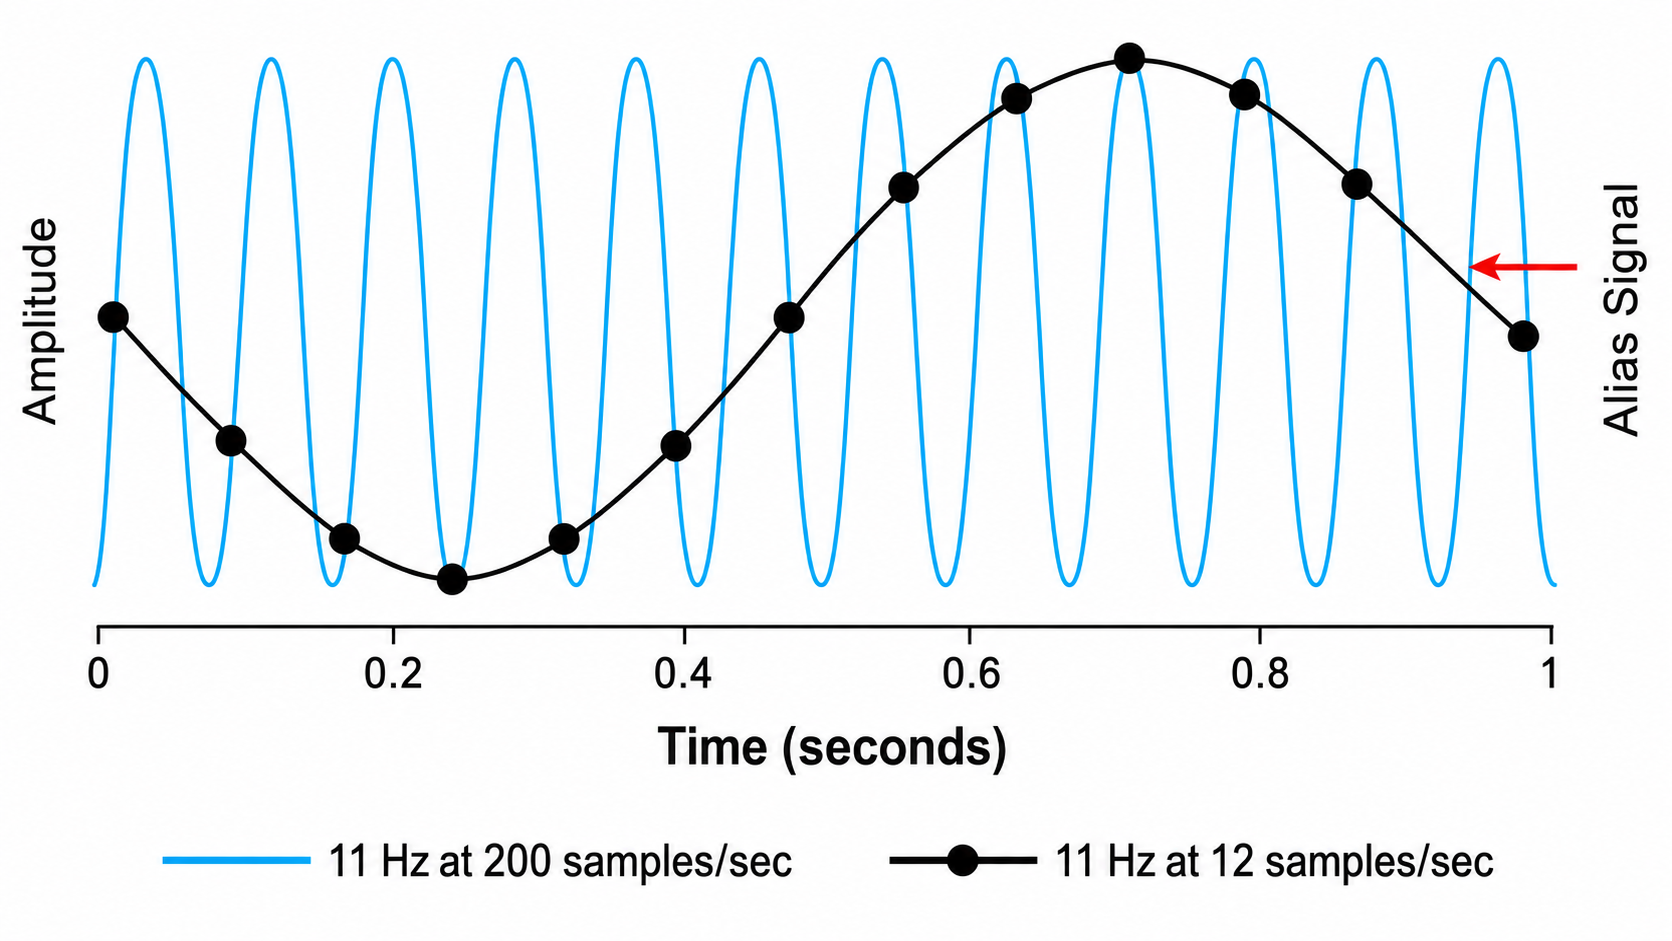
Sampling at rates that are too slow results in aliasing, where an analog signal appears to have a lower frequency than it actually does—producing "phantom" slow activity from too few samples per second. The graphic below illustrates this problem: an 11-Hz signal sampled at 12 sps produces the aliasing signal shown in black, while the same signal sampled at 200 sps is accurately reproduced.
Resolution Depends on Bit Depth
An A/D converter's resolution is limited by the smallest amplitude difference it can represent. The bit number refers to the number of voltage levels an A/D converter can discern. The ACNS (Halford et al., 2016) recommends a resolution of at least 16 bits per sample, which discriminates among 65,536 voltage levels; 24-bit converters are common in modern amplifiers. How fine a resolution this yields in microvolts depends on the amplifier's input range, since the available levels are divided across that range, and 16 bits permits fine amplitude resolution while still recording potentials of several millivolts without clipping. Lower resolutions coarsen the voltage steps, so small genuine changes may be lost or exaggerated by quantization, distorting the clinical picture.
Signal Properties
EEG signals are described by their frequency and amplitude. A/D conversion utilizes digital filters to decompose the complex EEG into its component frequencies—much like a prism separating white light into its constituent colors.
.jpg)
The movie below repeats the BioTrace+ /NeXus-32 display of EEG activity from 1-64 Hz broken into component delta, theta, alpha, and beta frequency bands by digital filters © John S. Anderson.
Recall that frequency is the number of cycles completed each second (Hz)—the longer the wavelength, the slower the frequency. The delta, theta, alpha, and beta bands can be defined by wave frequency, wave shape (morphology), and context. Amplitude, meanwhile, represents signal voltage or power and is measured in microvolts or picowatts.
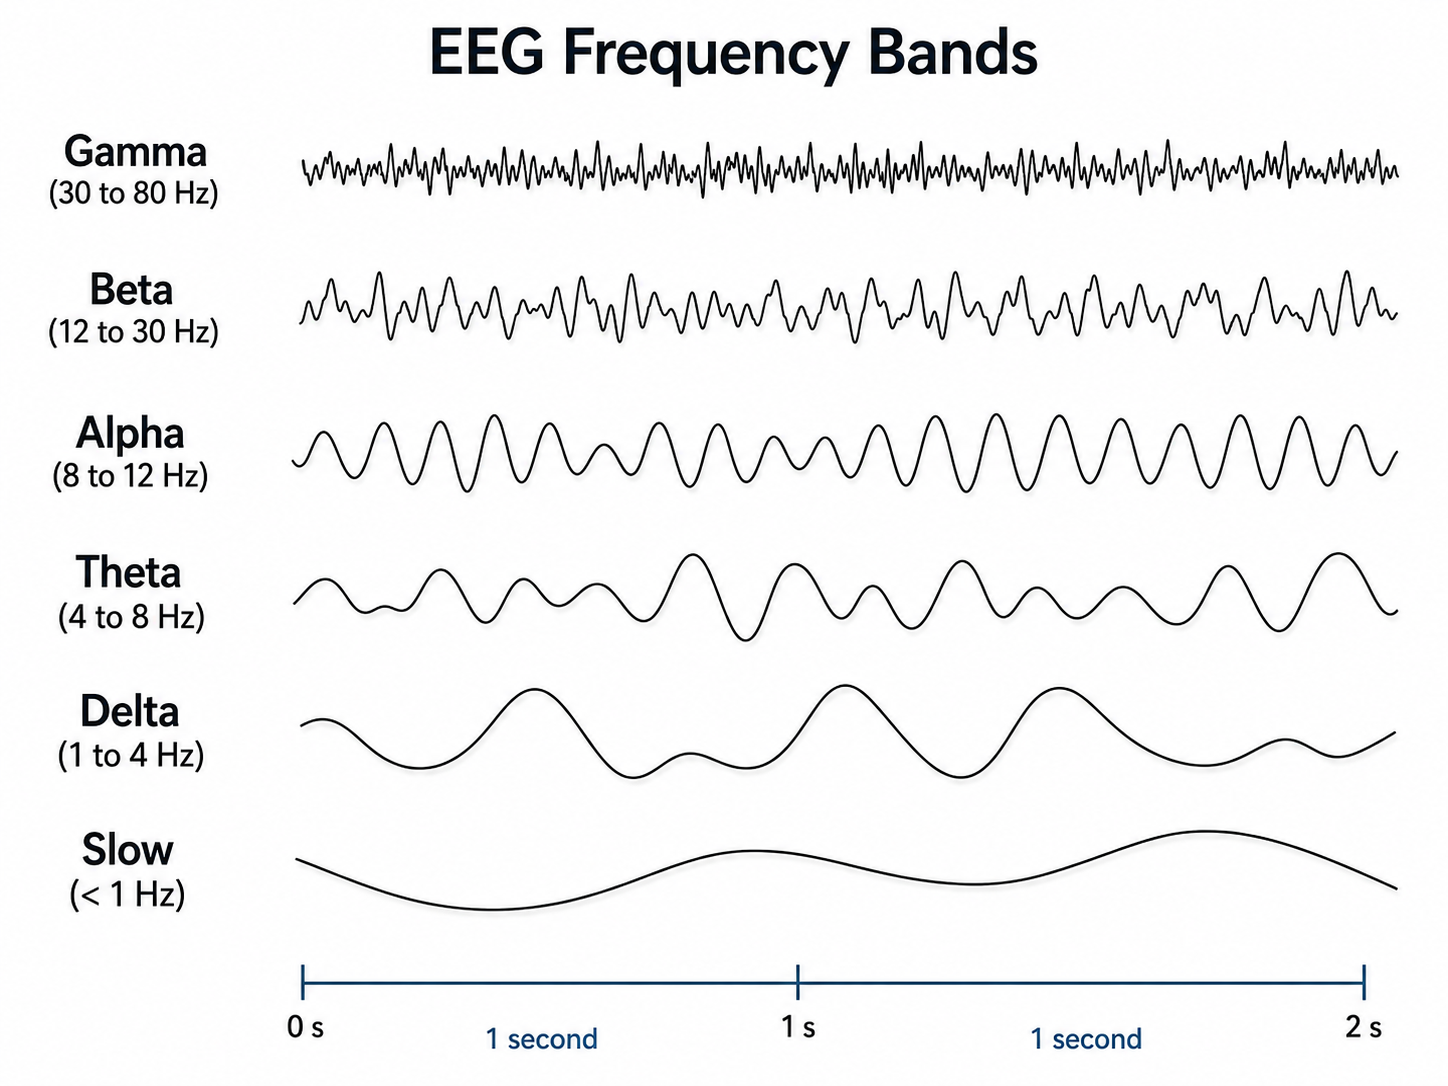
The next graphic illustrates the inverse relationship between wavelength and frequency. The time scale on the horizontal axis is in milliseconds, and the amplitude scales differ for the two tracings.
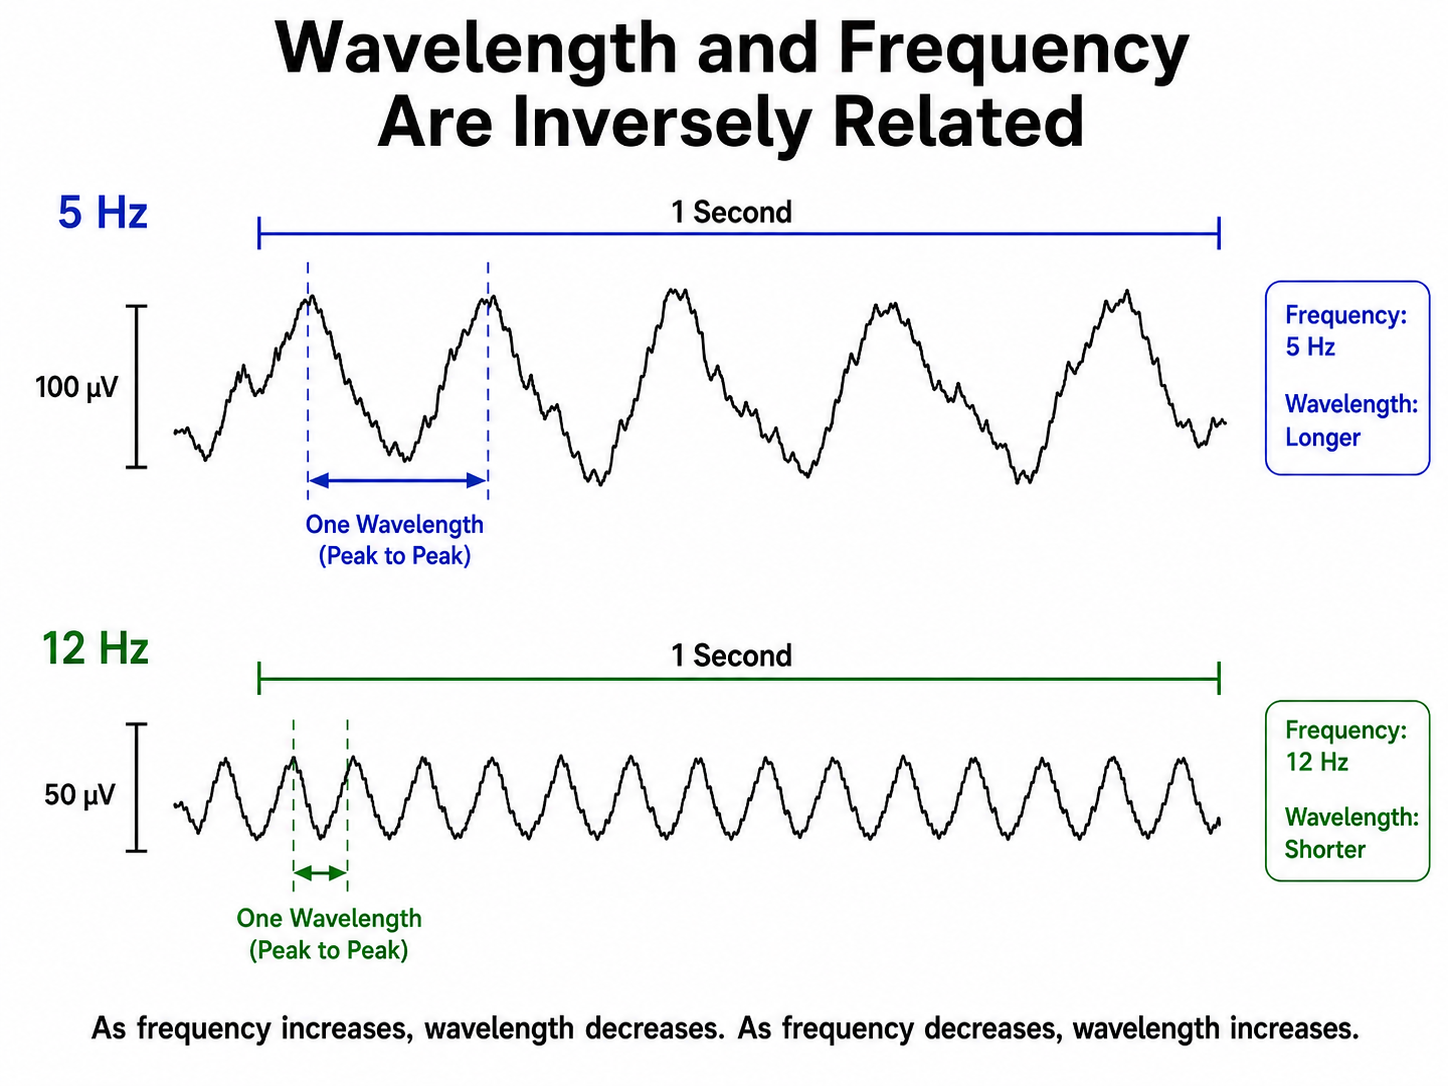
EEG frequency is measured in cycles per second or Hz, and you can verify it by hand from any tracing on your screen. The zero-crossing method counts how many times the waveform crosses the zero-voltage line within a 1-second interval and divides that count by 2, since every complete cycle crosses zero twice—once ascending and once descending (Anderson, 2025). Counting the peaks that rise above the zero line during the same second yields the same value. Both procedures take only a few seconds and are worth performing whenever a display, a threshold, or an assessment value looks implausible, because they let you confirm the frequency of the activity you are rewarding independently of what the software reports.
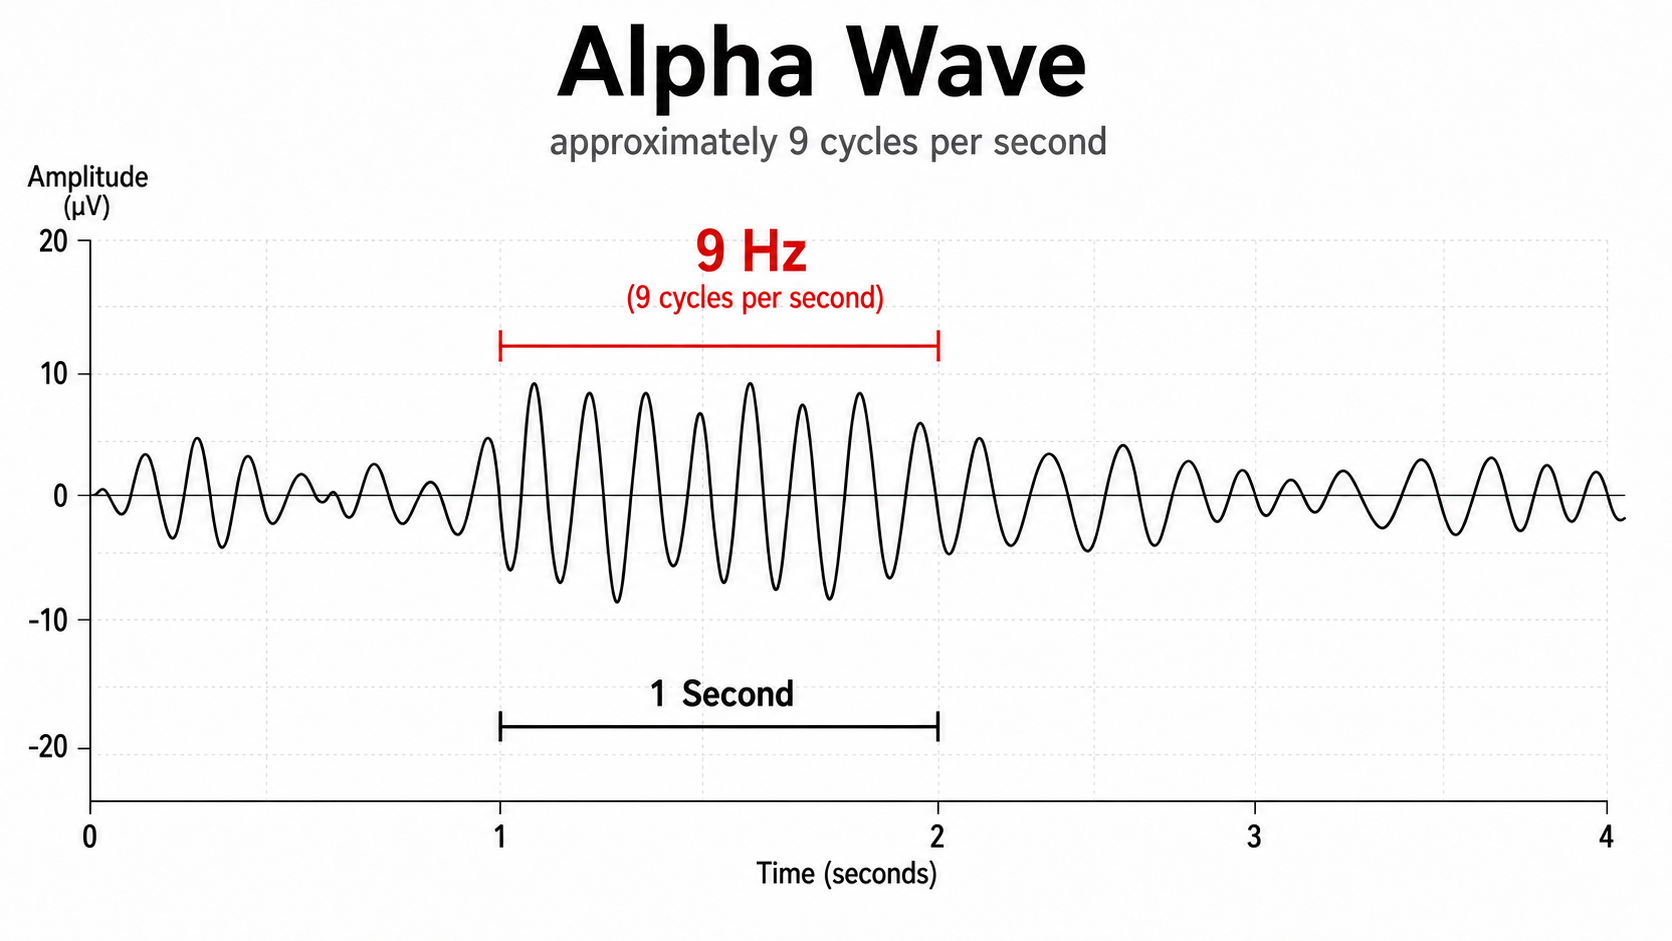
The slower the waves, the lower the EEG frequency.
The EEG signal is sent to an integrator to measure signal amplitude in microvolts (μV) or picowatts, and integrators use four methods to calculate the voltage. The peak-to-peak method provides the largest estimate—the voltage difference between the positive and negative maximum values of the original AC waveform, which is 2 times the peak value. Peak voltage is 0.5 of the peak-to-peak value, root mean square (RMS) voltage is 0.707 of the peak value, and average voltage is 0.637 of the peak value.
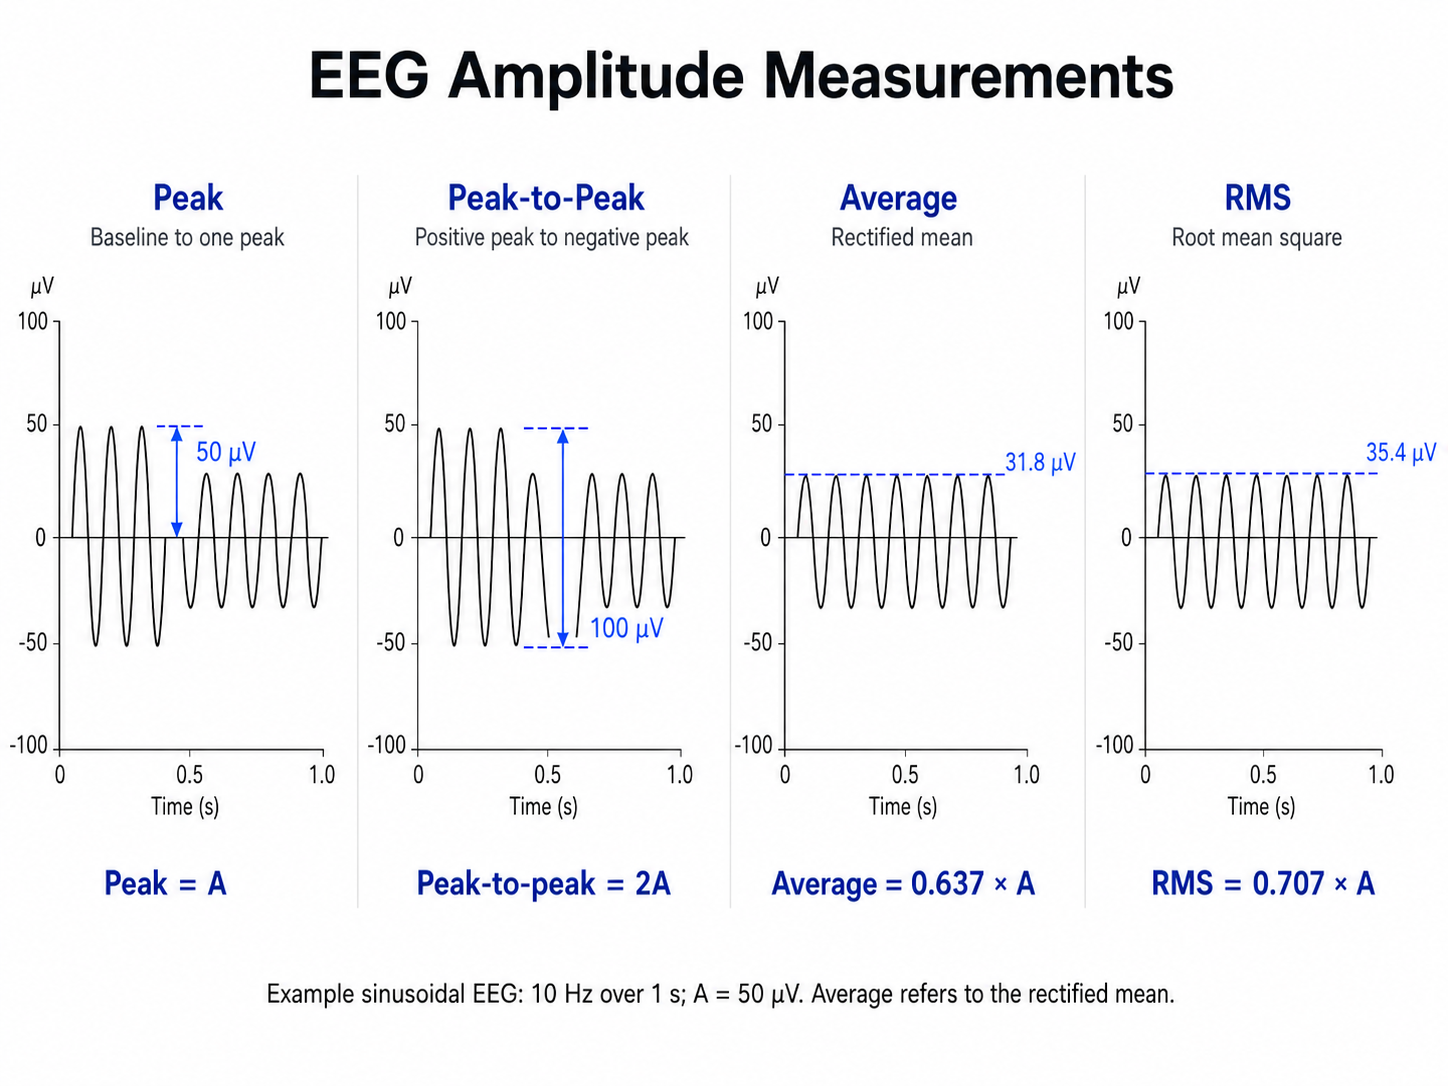
Conversion among these methods is straightforward. If the peak-to-peak voltage is 20 μV, peak voltage is 10 μV, root mean square voltage is 7.07 μV, and average voltage is 6.37 μV. Knowing which method your equipment uses is essential when comparing readings across different systems.
Two cautions apply to these conversions. First, the factors 0.707 (which equals 1 divided by the square root of 2) and 0.637 hold exactly only for a pure sine wave, so they are approximations for the complex, multi-frequency EEG rather than precise values. Second, the RMS value is the measure tied to power, because it represents the steady DC voltage that would deliver the same average power into the same resistance as the alternating signal, which is why RMS is preferred when amplitude is later converted to power.
Keeping Frequency and Amplitude Straight at the Keyboard
Practitioners who grasp frequency and amplitude in the abstract still stumble when they must apply them while a client waits, partly because our field describes one signal with a bewildering number of overlapping terms (Anderson, 2025). A working formulation keeps the two dimensions separate and independent of each other: frequency is how often the wave repeats within 1 second, and amplitude is the amount of electrical activity within that frequency band during that same period (Anderson, 2025). Every other value your software reports—magnitude, power, relative power, ratios, z-scores—is a transformation of one or both of these two measurements, so when a number confuses you, the first question to ask is which of the two it describes and what was done to it.
Frequency answers how fast. Amplitude answers how much. A client whose 8-12 Hz amplitude rises from 8 to 12 μV has not changed frequency at all, and a client whose peak alpha shifts from 9 to 10 Hz may show no amplitude change whatsoever. Protocols, thresholds, and progress notes that blur the two dimensions produce training decisions that cannot be evaluated.
Reading Raw and Filtered Displays
A filtered signal display shows only a selected frequency range, such as 8-12 Hz, and excludes everything else. Filtered views are pleasant to work from because the surviving activity looks smooth and nearly sinusoidal, which makes it easy to demonstrate a rhythm to a client or to count cycles yourself. That clarity is purchased at a price: the filtered view does not show the true complexity of the signal, and the same alpha activity displayed in a raw 1-45 Hz tracing from the identical recording site is far harder to pick out among all the other frequencies occurring simultaneously (Anderson, 2025). Isolating frequencies so they can be examined individually is precisely why filters and spectral methods exist, but the practitioner should remember that the tidy rhythm on the feedback screen is a selected slice of a much busier signal.
Two habits protect you when comparing displays. The first is to read the vertical scale before drawing any conclusion about amplitude. A filtered 8-12 Hz view may be scaled from -20 to +20 μV, while the raw signal from that same recording needs -40 to +40 μV for the whole waveform to fit inside the graph (Anderson, 2025). A client whose activity appears to have doubled between two screens may simply be displayed on a different scale. The second habit is to confirm the polarity convention. Electroencephalography traditionally plots negative voltage upward, but systems differ, and many modern displays plot positive up and negative down (Anderson, 2025). Deciding which convention your equipment uses before you describe a deflection as positive or negative prevents an error that propagates into every note and report you write.
What Scalp Feedback Actually Rewards
The EEG recorded at the scalp results from activity that has already occurred within the brain, which means training scalp EEG rewards the brain for making internal changes that show up as measurable changes in that scalp signal (Anderson, 2025). The distinction matters clinically because it reverses a causal story that practitioners and clients both find tempting. Raising a client's alpha amplitude does not itself make that client more relaxed. Becoming more relaxed may increase alpha activity, so the increased alpha is better understood as a physiological correlate of relaxing than as its cause, and the feedback about that increase functions as a reinforcer of a multifaceted relaxation experience, so that as relaxation deepens the alpha activity follows (Anderson, 2025).
Two practical consequences follow. When you explain training to a client, describe the display as a signal that their brain has found a productive internal state rather than as a lever that produces calm when pulled, because clients who chase the number tend to strain and suppress the very state you are trying to shape. When you review a session in which amplitude rose but the client reports no subjective change, or in which the client describes a clear shift that the numbers barely register, treat the mismatch as information about the coupling between the scalp measure and the experience rather than as a training failure, and coach the client to notice the internal state that preceded each reward.
EEG Filters Define the Signal
EEG filters select signals of interest and minimize artifacts. This section reviews high-pass, low-pass, bandpass, and notch filters—the tools your equipment uses to isolate the frequency bands that matter for clinical decision-making.
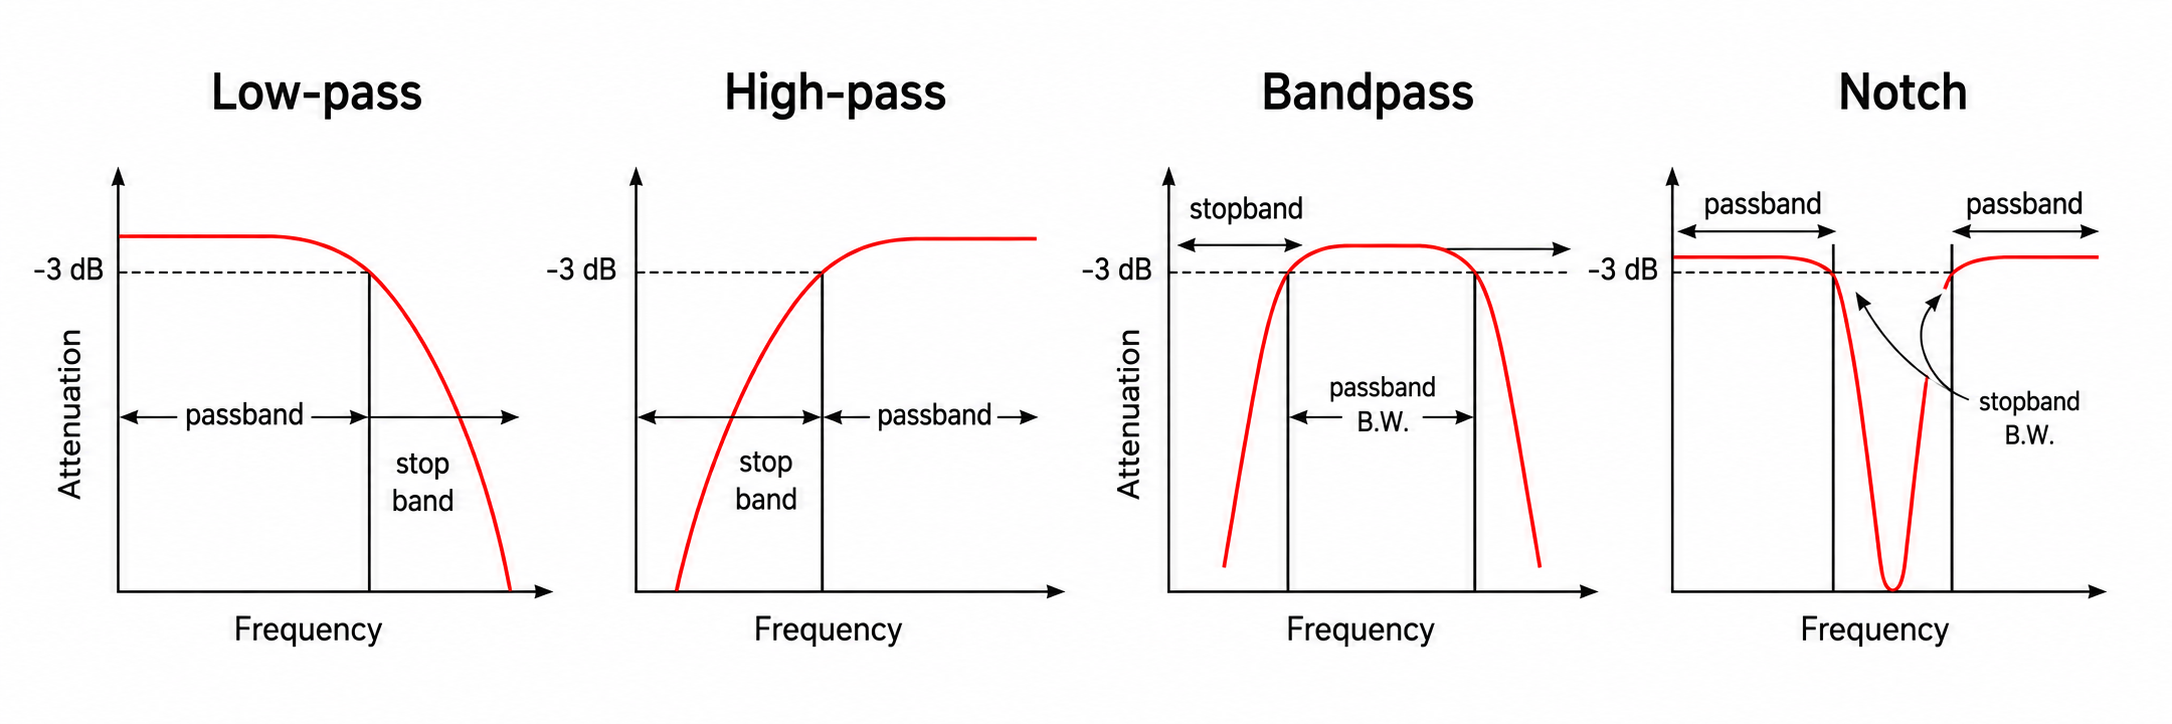
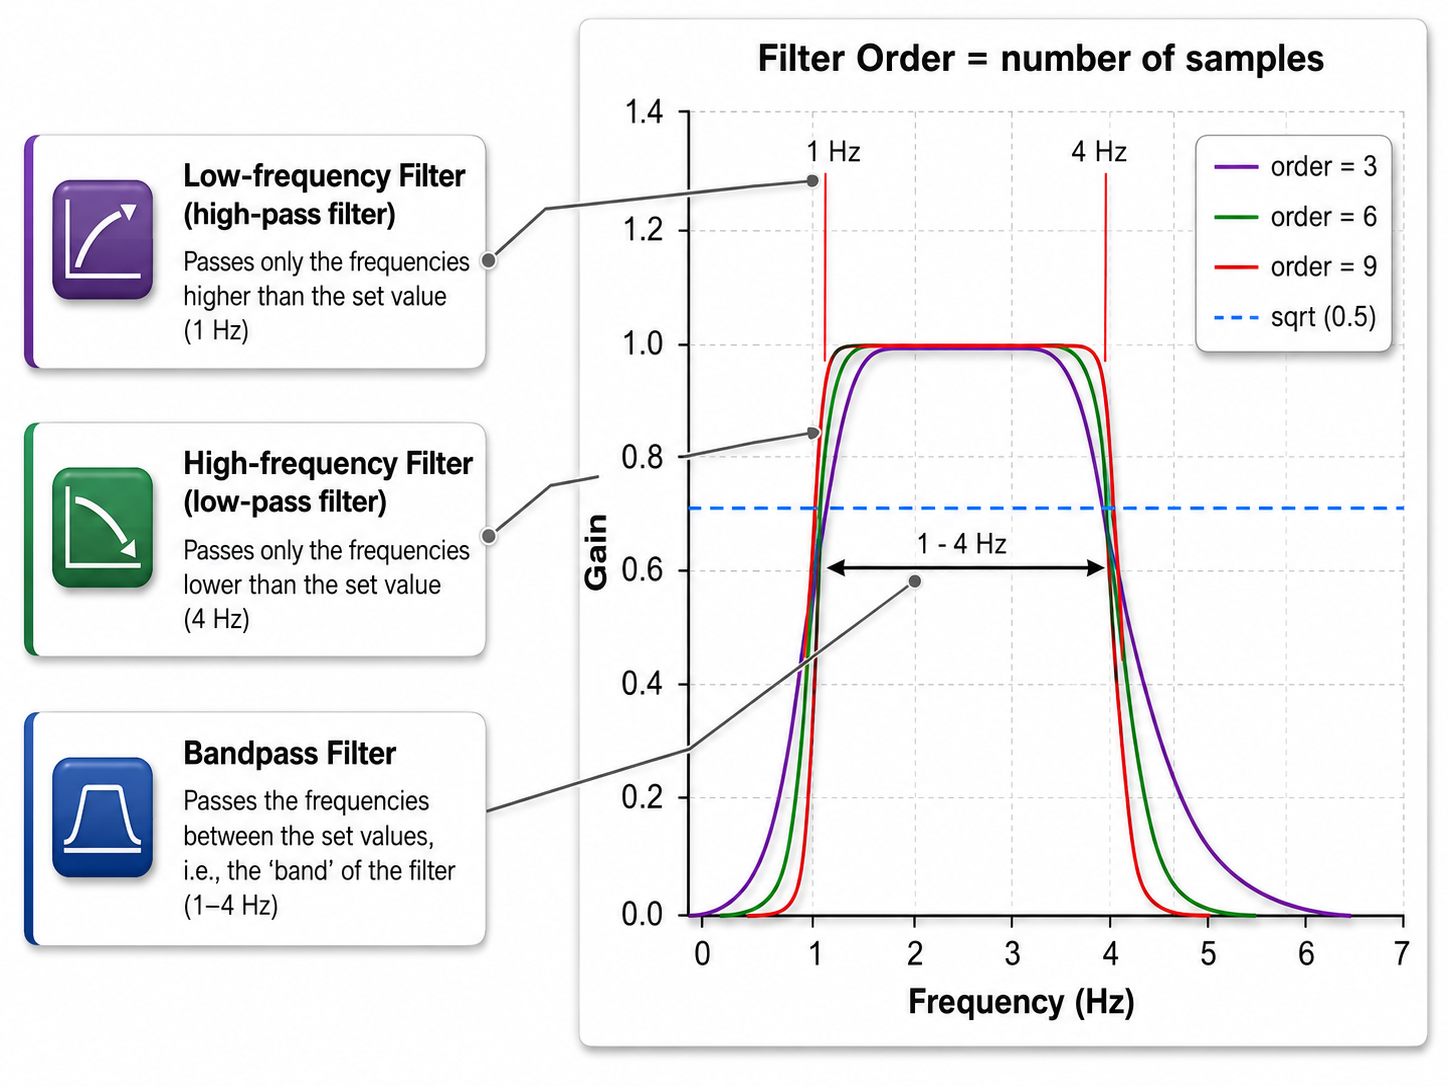
The range of frequencies passed through a filter is called the passband, and the range sharply attenuated is called the stopband. A high-pass filter only passes frequencies above a set value (e.g., 1 Hz), while a low-pass filter only passes frequencies below a specified value (e.g., 40 Hz). A bandpass filter combines both, passing only the frequencies between the set values—the "band" of the filter (e.g., 1-40 Hz).
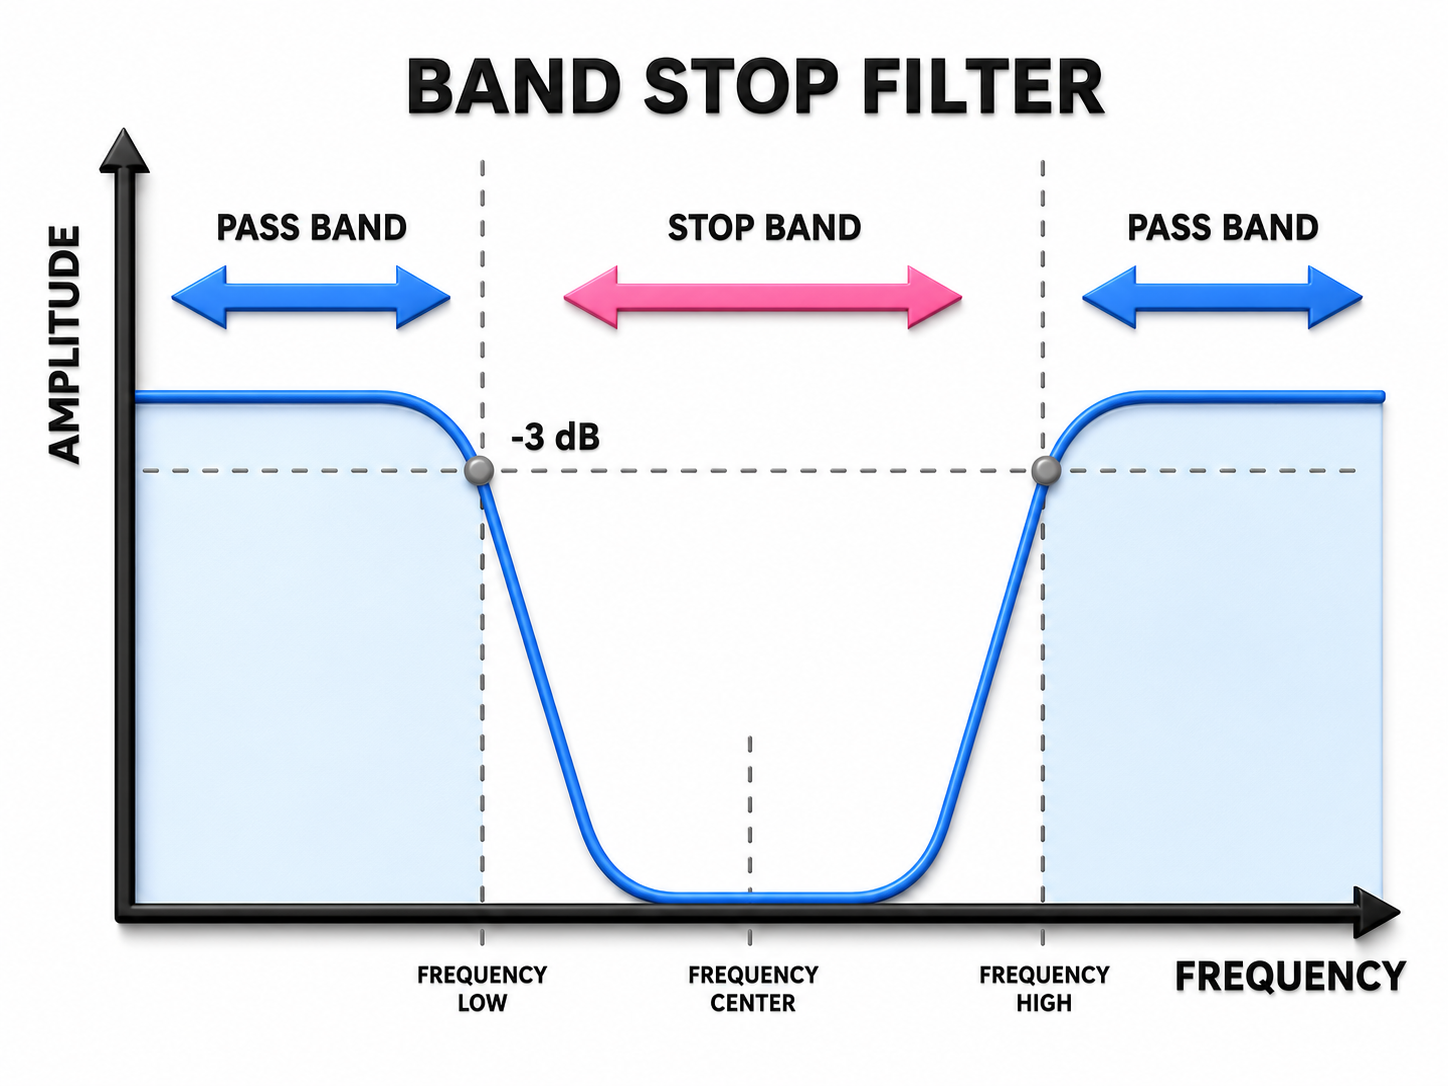
A notch filter reverses the arrangement of passbands and stopbands found in a bandpass filter. Instead of passing a narrow band of frequencies, it attenuates a narrow window, or "notch," while allowing frequencies above and below it to pass. Notch filters commonly target mains interference at 60 Hz in North America and 50 Hz in most other regions. (See the discussion of notch filters below.)
Filter Order
A filter's precision depends on how many data points it uses to define the boundary between the signal it passes and the signal it blocks. Lower-order filters use fewer data points, define that boundary less sharply, and roll off gradually between the frequencies they stop and the frequencies they pass. Higher-order filters use more data points and produce a more sharply defined boundary. That added sharpness comes at a cost, because processing more data points delays the filter's output. Neurofeedback providers therefore typically use filter orders between 3 and 6, balancing a well-defined boundary against acceptable delay.
The following movies demonstrate the effects of low-pass and high-pass filters at various settings.
10-Hz Low-Pass Filter
The movie below shows the output of a 10-Hz low-pass filter with a vertical scale of 0-50 μV © John S. Anderson.
20-Hz Low-Pass Filter
The movie below shows the output of a 20-Hz low-pass filter with a vertical scale of 0-50 μV © John S. Anderson.
30-Hz Low-Pass Filter
The movie below shows the output of a 30-Hz low-pass filter with a vertical scale of 0-50 μV © John S. Anderson.
40-Hz Low-Pass Filter
The movie below shows the output of a 40-Hz low-pass filter with a vertical scale of 0-50 μV © John S. Anderson.
10-Hz High-Pass Filter
The movie below shows the output of a 10-Hz high-pass filter with a vertical scale of 0-50 μV © John S. Anderson.
20-Hz High-Pass Filter
The movie below shows the output of a 20-Hz high-pass filter with a vertical scale of 0-50 μV © John S. Anderson.
30-Hz High-Pass Filter
The movie below shows the output of a 30-Hz high-pass filter with a vertical scale of 0-50 μV © John S. Anderson.
Bandpass Filters
1-40-Hz Bandpass Filter
The movie below shows the output of a 1-40-Hz bandpass filter with a vertical scale of 0-50 μV © John S. Anderson.
8-12-Hz Bandpass Filter
The movie below shows the output of an 8-12-Hz bandpass filter with a vertical scale of 0-50 μV © John S. Anderson.
The movie below shows the output of three bandpass filters for delta, theta, and alpha © John S. Anderson.
The movie below generously provided by John S. Anderson shows a "raw" or "wave" display of oscillating electrical information using a positive/negative scale with 0.0 in the middle with the voltage displayed as peak-to-peak μV.
The movie © John S. Anderson shows the same alpha waveform plotted along two scales. The top display plots the waveform on a scale from -20 to +20 μV, while the bottom "amplitude" display plots the voltage on a scale from 0-50 μV where all values are positive.
The movie © John S. Anderson shows the conversion of the complex EEG signal into its spectral components.
The movie © John S. Anderson shows the spectrum magnitude (average amplitude over a given time) in the top display and power (μV2) in the bottom display.
The movie © John S. Anderson shows the same alpha activity displayed in terms of amplitude (positive voltages), power or amplitude2 (picowatts/resistance), and percent power (signal power as a percentage of total EEG power from 0-100%).
Notch Filter
A notch filter suppresses a narrow band of frequencies produced by line current (e.g., 50/60 Hz artifact). The stopband is the range of frequencies attenuated by the notch filter. Use notch filters as a last resort because they remove all signal energy at the target frequency, not just artifact—meaning genuine EEG activity at 50/60 Hz is also eliminated.
The narrated video below © John S. Anderson displays the same 21-channel recording viewed using different montages with a 60-Hz notch filter on and off.
Digital Filters
Digital filters use digital processors, like a digital signal processing (DSP) chip, to exclude unwanted frequencies. The process has three steps: first, an analog-to-digital converter (ADC) samples and digitizes the analog signal, representing signal voltages as binary numbers; second, a DSP chip performs calculations on those binary numbers; and third, a digital-to-analog converter (DAC) may transform the sampled, digitally-filtered signal back to analog form.
Three main methods of digital filtering are used in EEG systems. FFT (Fast Fourier Transformation) filters convert the EEG signal into a set of sine waves varying in frequency, amplitude, and phase. FIR (finite impulse response) filters have a finite-duration impulse response and calculate a moving weighted average of digitally sampled voltages. IIR (infinite impulse response) filters employ feedback to calculate a moving weighted average of digitally sampled voltages.
All three methods share four advantages over analog filters. First, clinicians can retrospectively adjust filter settings while reviewing the EEG record since digital filters are programmable. Second, digital filters can be designed to minimize phase distortion—the displacement of the EEG waveform in time. Third, they are stable over time and across a range of temperatures. Fourth, they accurately process low-frequency signals.
An important caveat: since these three digital filtering methods can yield different statistical values, they cannot be used interchangeably. Only compare FFT statistics with other FFT statistics—never with FIR or IIR results (Thompson & Thompson, 2015). Mixing methods can lead to misleading comparisons and flawed clinical conclusions.
Below is a BioGraph ® Infiniti EEG three-dimensional FFT display. Frequency is displayed on the X-axis, amplitude on the Y-axis, and time on the Z-axis.
What an FFT Display Shows You
An FFT converts the raw EEG into frequency and magnitude, which is the amplitude of each frequency component averaged over the analyzed interval (Anderson, 2025). Where the raw tracing presents voltage on the y-axis and time on the x-axis as one undifferentiated line, the FFT display places frequency on the x-axis and magnitude on the y-axis, so the single frequencies that make up each band become visible individually. Systems typically color-code these collections as delta (1-4 Hz), theta (4-8 Hz), alpha (8-12 Hz), the sensorimotor rhythm (SMR) at 12-15 Hz, also called beta 1, low beta (15-22 Hz, or beta 2), middle beta (22-36 Hz, or beta 3), and high beta (36-45 Hz, also called beta 4 or gamma), with the caution that these designations vary slightly from one system to another (Anderson, 2025).
This arrangement lets you see at a glance how much activity occupies each band, which is the information you need when selecting a reward bandwidth. It also displays the peak frequency, the frequency carrying the highest voltage within a given band, such as 10 Hz within an 8-12 Hz alpha band, and many displays print the mean, median, and dominant frequency as text alongside the graph (Anderson, 2025). Because reward and inhibit bands are most effective when centered on where a client's activity actually lives rather than on a textbook range, reading the peak frequency before setting bandwidths is a small step that meaningfully improves protocol fit.
Resolution can be finer than whole bands. Depending on software and hardware, the spectrum can be examined in 0.5-Hz segments or smaller, though the more common practice is to inspect 1-Hz frequency bins, meaning narrow frequency slices analyzed one at a time (Anderson, 2025). Bin-level inspection is how distinctive features are found. The mu rhythm, an 8-12 Hz rhythm generated over the sensorimotor cortex that is suppressed by movement and by observing movement, is usually isolated by its location and its frequency bin rather than by band labels alone (Anderson, 2025).
What an FFT Display Hides
The clarity of a spectral display comes at the expense of vital information. Once the data have been processed, it is impossible to know how much of the activity shown is genuine cortical signal and how much is artifact from eye movement or from muscle activity, which enters the recording as electromyography (EMG) (Anderson, 2025). In Anderson's example recording, a substantial eye artifact elevated the low-frequency voltage even though little EMG was present, because eye movements and blinks produce electrical discharges that fall within delta and low theta frequencies. Those discharges do not originate in the brain as EEG, yet they occupy the same frequencies and are plotted into the EEG graph as though they did (Anderson, 2025). The practical rule is that no spectral value, ratio, or z-score deserves your confidence until you have inspected the raw tracing that produced it and removed or excluded the contaminated segments.
Time resolution is the second casualty. A display calculated from 2 seconds of EEG is a composite of those 2 seconds and therefore loses the moment-by-moment detail visible in the raw display (Anderson, 2025). One second is the minimum window an FFT calculation requires, and the same computation can average across many minutes to represent typical activity over a longer period, which is what makes normative databases and topographic maps possible (Anderson, 2025). This trade-off should be a deliberate choice. Short epochs—the discrete time segments into which a recording is divided for analysis—keep feedback responsive enough for the client to perceive a contingency, while long averages give assessment values the stability that protocol decisions require. Values derived from different epoch lengths should not be compared as though they were equivalent.
To summarize Anderson's (2025) formulation, frequency means how frequently the wave occurs within 1 second, and amplitude means the amount of electrical activity within that frequency band during that period. Every spectral display trades away something to show you those two quantities more clearly: the raw tracing's artifact visibility, its moment-by-moment resolution, or both.
From Amplitude to Power
Power means amplitude squared, so an amplitude of 4 μV corresponds to a power of 16 microvolts squared (μV2), which some systems label 16 picowatts because 1 μV2 across a reference resistance of 1 ohm equals 1 pW (Anderson, 2025). Though the number differs from the amplitude value, it still represents the amount of electrical activity in the EEG. Squaring serves two purposes. The first is arithmetic: because the EEG constantly fluctuates between positive and negative values above and below the zero line, averaging the raw signal over time produces a result near zero, whereas squaring converts every value to a positive number so that means, maxima, minima, standard deviations, and other statistics can be calculated at all (Anderson, 2025).
The second purpose is visual differentiation. Squaring widens the apparent distance between bands, since 4 x 4 = 16 while 2 x 2 = 4, so a twofold difference in amplitude becomes a fourfold difference in power and the taller band becomes easier to identify at a glance (Anderson, 2025). The same recording plotted as a magnitude spectrum, which shows amplitude over time corrected for sign, and as a power spectrum, which shows amplitude squared, can carry y-axis scales as different as 0-12 μV and 0-96 pW while representing identical data (Anderson, 2025).
This has a direct and frequently overlooked consequence for ratio-based training. A theta/beta ratio comparing 4-8 Hz to 13-21 Hz reads 4/2, or 2.0, in amplitude terms and 16/4, or 4.0, in power terms for the very same brain (Anderson, 2025). A threshold borrowed from a colleague, a textbook, or a published study is therefore meaningless unless you know which convention produced it, and copying an amplitude-based ratio target into a power-based display will set your client an entirely different task than the one intended. Power values are also what normative databases use when computing z-scores, which express a client's value as a number of standard deviations (SD) from the database mean, with the interval from -1 to +1 SD containing roughly 68% of values in a normal distribution (Anderson, 2025).
Relative Power and the Illusion of Deficits
The other power value in common use travels under several names—relative power, percent power, and normalized EEG—that all refer to the same measurement (Anderson, 2025). Relative power converts the actual power values, known as absolute power, into percentages representing each band's power as a proportion of the power in the entire recorded band, and reports the result as a percentage. If the full 1-45 Hz band has a power value of 100 and 8-12 Hz has a power value of 25, then 8-12 Hz accounts for 25% of total EEG power (Anderson, 2025).
This transformation entered EEG analysis in its early days because the amplifiers of the era produced widely varying voltage values even when recording the same individual on different occasions. Converting to percentages promised to make any recording comparable to any other, which is why the results were called normalized EEG, and the measure remains in extensive use even in recently published research (Anderson, 2025).
The method carries a structural flaw that matters enormously at the point of protocol design. Because percentages must sum to 100, a single very high-amplitude band claims a disproportionately large share of the EEG "pie" and leaves every other frequency representing a smaller percentage than it deserves, which is especially treacherous when relative power values are compared against topographic z-score maps from a normative database (Anderson, 2025). Anderson's illustrative case makes the danger concrete. In the absolute power maps of that recording, 1 Hz and 2 Hz carried far more power than any other bin, and in relative power terms they accounted for 22.9% and 20.7% respectively, together consuming 43.6% of the entire pie. The absolute power z-score maps showed deviations up to +3 SD from 1-5 Hz and, critically, no blue regions anywhere, meaning no frequency bin was deficient at any location. The relative power z-score maps told a different story, showing negative values reaching -3 SD across 6-16 Hz in varying distributions.
A practitioner glancing only at those relative power maps would conclude that the client has too little 6-16 Hz activity and might set about training to increase it. In an absolute sense there are no deficits at all; the apparent shortfalls exist only in relation to the excess at 1 and 2 Hz, and the other values may become more typical on their own once that excess is reduced (Anderson, 2025). The situation is more dangerous still when the excess sits in the higher beta frequencies such as 22-36 Hz, because the lower frequencies in the 1-6 Hz range then appear deficient and the practitioner may decide to train 1-6 Hz upward. Anderson (2025) warns that this can cause serious negative effects and is generally not recommended. The working rule is to consult absolute power before interpreting relative power—a warning that qEEG software often prints directly on the relative power page—to address the largest absolute excess first, and to reassess before concluding that anything is deficient.
Writing Protocols and Reports in Hertz
Terminology surrounding frequency and amplitude is a persistent source of confusion because the EEG is described with categorical terms like fast, slow, high, low, voltage, power, relative power, percent power, and amplitude, often interchangeably (Anderson, 2025). The band labels themselves have never been consistent. Beta frequencies between 24 and 36 Hz may be called high, fast, or beta 3, frequencies between 25 and 45 Hz may be called gamma or beta 4, and bands are further subdivided into alpha 1 and alpha 2 or beta 1 through beta 4 depending on the author. Amplitude adjectives then stack on top of frequency adjectives, producing constructions like high high beta, low high beta, high low alpha, and low low alpha, whose meaning is anyone's guess (Anderson, 2025). These inconsistencies have existed in electroencephalography from the beginning, which is itself the argument for abandoning the labels in favor of numbers.
Imprecision becomes costly at exactly the moment it matters most: when a practitioner reads an assessment report to determine a training protocol for a client (Anderson, 2025). A paper or report stating that there was "an increase in activity in the frontal EEG" leaves the reader unable to tell whether the increase occurred at 8-12 Hz, 15-18 Hz, or 4-8 Hz, and if the statement merely describes a general rise in voltage, its useful information approaches zero (Anderson, 2025). The remedy is to identify the EEG by the frequency under discussion—8-10 Hz rather than alpha 1, 24-36 Hz rather than beta 3, 36-44 Hz rather than beta 4 or gamma—so that everyone knows precisely what is meant (Anderson, 2025).
Consider the difference a precise sentence makes. A report might state that an increase in 4-8 Hz amplitude from 4 μV to 6 μV was noted in the prefrontal cortex, the anterior region of the frontal lobes that supports executive function and cognitive control, during an active memory recall task. Because abnormally high amplitude in that frequency range over prefrontal areas is associated with reduced cognitive performance, this description supports specific inferences: that the person disengaged during the task, or that the prefrontal cortex exerted less-than-normal cognitive control during it, among other possibilities (Anderson, 2025). Combined with behavioral information such as the client's degree of success on the task and findings from other testing, these data identify the specific location and frequency that correlate with the presenting concern and lead directly to a protocol. If elevated 4-8 Hz amplitude over prefrontal cortex accompanies lower memory scores, training to decrease prefrontal 4-8 Hz becomes a defensible candidate for improving memory (Anderson, 2025).
Categorical shorthand will not disappear, and it exists because it makes conversation easier. When a colleague remarks that "that alpha is really high," however, the statement could mean high amplitude, high-frequency alpha, or a high peak alpha frequency, and the best response is simply to ask which (Anderson, 2025). Language is a dynamic function and ambiguity in casual speech is tolerable, but precise terminology is not optional when writing for publication or preparing clinical reports. All of this counsels careful assumptions, precise language, and caution in how we approach a client's training, and it is worth remembering that EEG analysis, whether visual or quantitative, is a process that grows more accurate as our skills develop and our understanding of this elegant and information-rich measure deepens (Anderson, 2025).
EEG recording relies on electrodes as transducers to convert ionic currents into electrical signals through volume conduction. A three-electrode setup (active, reference, ground) feeds into a differential amplifier that rejects common artifacts while preserving the EEG signal through common-mode rejection. Maintaining a high CMRR (minimum 100 dB) and high differential input impedance (at least 100 times skin-electrode impedance) is essential for accurate recording. A/D converters sample the signal at rates governed by the Nyquist-Shannon theorem, and digital filters (FFT, FIR, IIR) separate the EEG into component frequency bands—though these methods cannot be used interchangeably. Frequency describes how often a wave repeats within 1 second and amplitude describes how much electrical activity occupies that band during the same period; every other value, from magnitude and power to relative power and z-scores, is a transformation of those two measurements. Spectral displays buy clarity at the cost of artifact visibility and moment-by-moment resolution, so raw tracings must be inspected before spectral values are trusted. Squaring amplitude to obtain power permits statistical calculation and widens visual differences, which means amplitude-based and power-based ratio thresholds are not interchangeable. Relative power can manufacture apparent deficits wherever one band is genuinely excessive, so absolute power must always be consulted first. Finally, protocols and reports should name frequencies in hertz rather than relying on inconsistent band labels (Anderson, 2025).
Check Your Understanding
- How does a differential amplifier separate EEG signals from artifacts?
- Why is the Nyquist-Shannon sampling theorem important when digitizing the EEG signal?
- What are the four methods used to measure EEG signal amplitude, and how do they relate to each other?
- Why should you use notch filters only as a last resort?
- What are the advantages of digital filters over analog filters?
- How would you use the zero-crossing method to confirm the frequency of activity you are rewarding?
- What information does an FFT display make visible, and what does it conceal that only the raw tracing can show you?
- A colleague gives you a theta/beta threshold of 3.0 without specifying units. Why can you not use that number as given?
- A relative power z-score map shows 6-16 Hz activity at -2 SD across several sites. What must you check before deciding to train those frequencies upward, and why?
- Rewrite the statement "high beta was elevated frontally" so that another clinician could act on it.
Safety Precautions
This section covers the electrical safety hazards inherent in biofeedback practice and the engineering solutions designed to protect both clinicians and clients. Whether you work in a VA hospital, a private clinic, or a military performance center, these precautions are essential for every session involving line-powered or computer-based equipment.
Like computer-based data acquisition systems, line-powered equipment can expose both client and practitioner to shock hazards. Both should avoid contact with metal surfaces, and water spills should be cleaned up immediately. The safety technologies described below exist because the consequences of electrical failure are not merely uncomfortable—they can be fatal.

Exposure to Current Can Injure and Cause Death
The human body is surprisingly vulnerable to electrical current. Published thresholds vary with the current's path through the body, its duration and frequency, and individual physiology, so the following figures are approximate rather than fixed. About 5 mA is generally treated as the upper limit of a harmless shock; currents above it can produce a painful reaction and loss of muscular control. Around 18 mA, sustained muscular contraction can impair breathing. Currents on the order of 50 mA and above can trigger fatal ventricular fibrillation—a medical emergency in which the lower heart chambers contract rapidly and unsynchronized, unable to pump blood (Peek, 2016). Far smaller currents are hazardous when they reach the heart directly, as through an intracardiac catheter. To put this in perspective, 50 mA is a small fraction of the 15 amperes a standard household branch circuit can deliver.
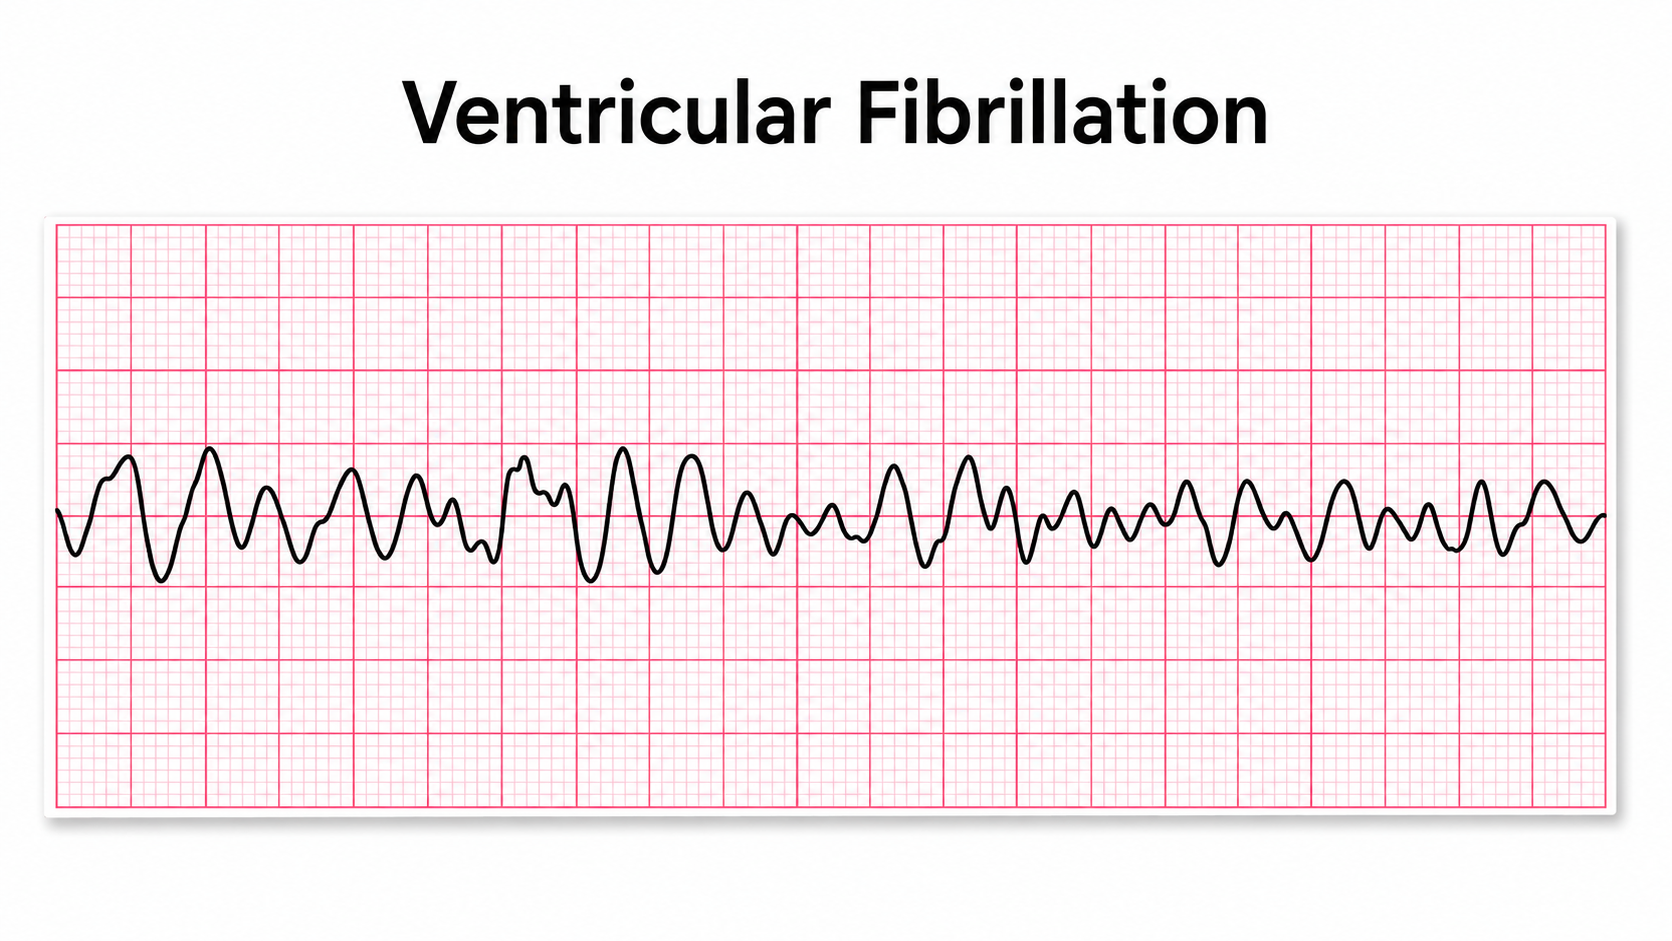
Biomedical engineers prevent shock hazards through four key technologies: ground fault interrupt circuits, optical isolation, fiber optic connections, and telemetry. Each creates a barrier between the dangerous current sources in your equipment and the client.
Ground Fault Interrupt Circuit
A ground fault interrupt circuit is built into certain power outlets to shut down power when current escapes its intended path. It continuously compares the current flowing out on the hot conductor with the current returning on the neutral conductor; any difference means current is leaking to ground, possibly through a person. When that difference exceeds the trip threshold—nominally 5 mA, with devices sold in the United States required to trip between 4 and 6 mA—the device interrupts power within milliseconds, protecting the client, therapist, and hardware. Note that a ground fault interrupter responds to leakage to ground rather than to an ordinary short circuit between conductors, which remains the job of the circuit breaker or fuse.
Montgomery (2004) recommended plugging the entire biofeedback system into the same power outlet to create a common ground. This way, current leakage in any piece of your equipment will trigger the ground fault interrupt circuit, providing comprehensive protection for the entire system.
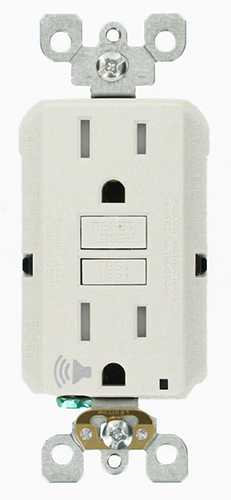
Optical Isolation
Optical isolation protects clients from hardware receiving AC power by breaking the electrical connection entirely. An optical isolator (opto-isolator) converts a biological signal into a beam of light using an LED source. The light crosses a dielectric barrier—a piece of insulation that creates an open circuit—and a phototransistor on the other side reconverts the light back into an electrical signal. Because light carries the signal across the gap instead of electrons, dangerous current cannot reach the client even if the equipment malfunctions.
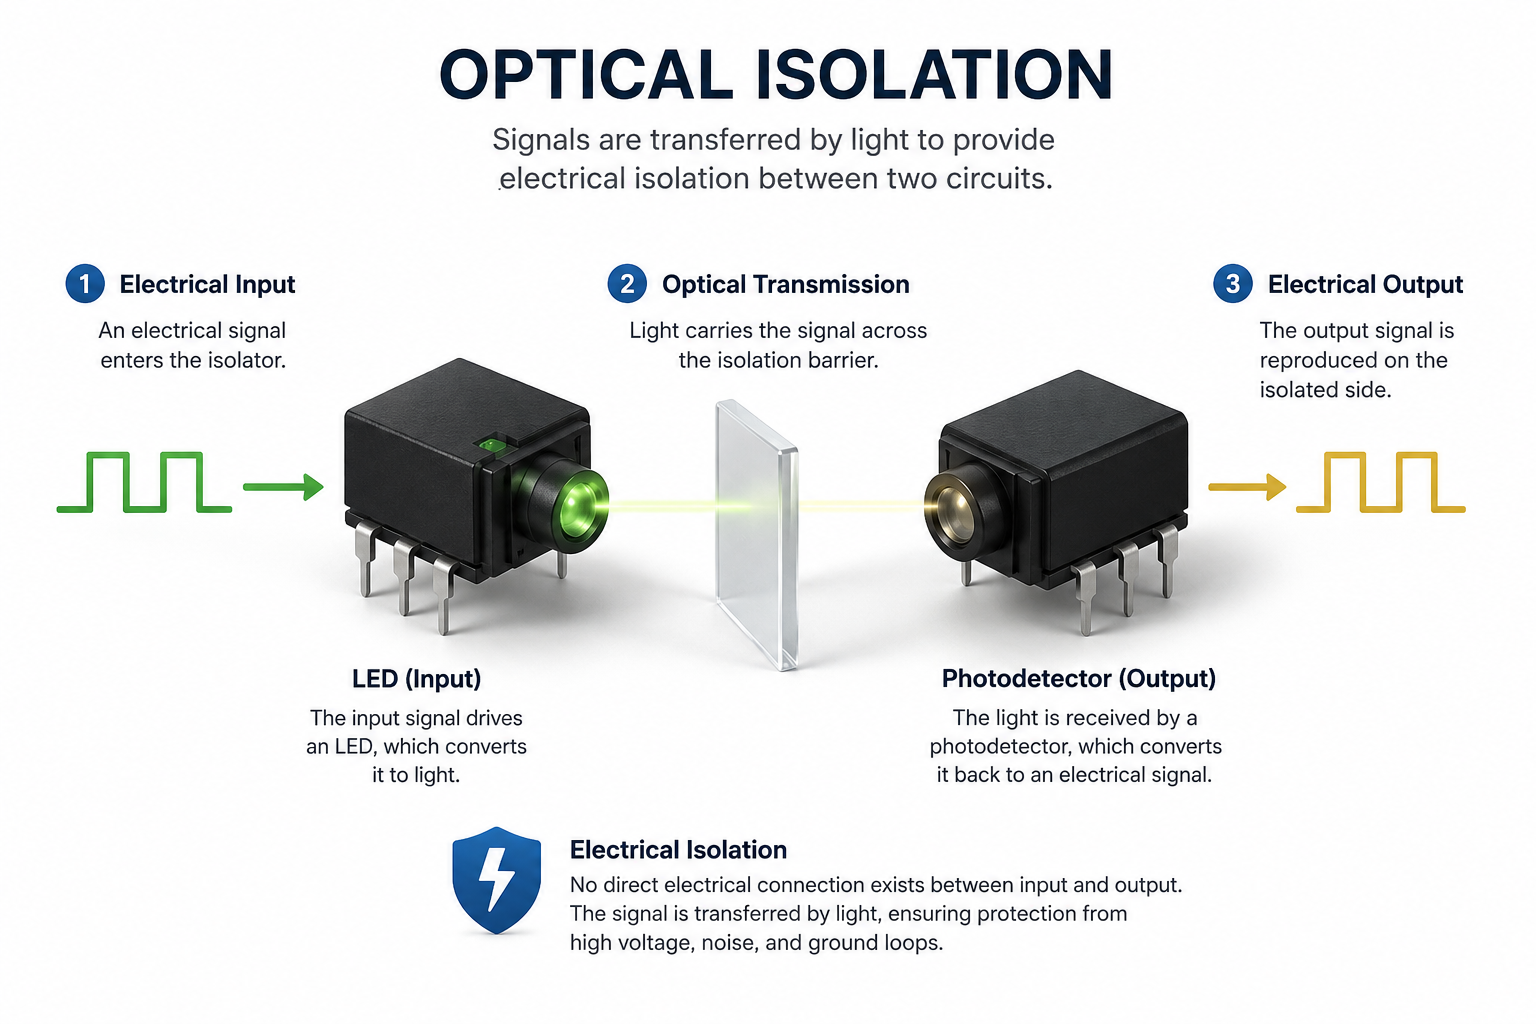
Fiber Optic Connections
Fiber optic connections are thin, flexible cables that transmit digital signals as pulses of light, typically linking the client-side amplifier or encoder to the computer rather than connecting to the electrodes themselves. This design prevents current from leaking from a computer to a client since electrons cannot travel through fiber optic cables. As a bonus, fiber optic cables also reduce contamination by electrical artifacts like power line noise, improving signal quality while enhancing safety.
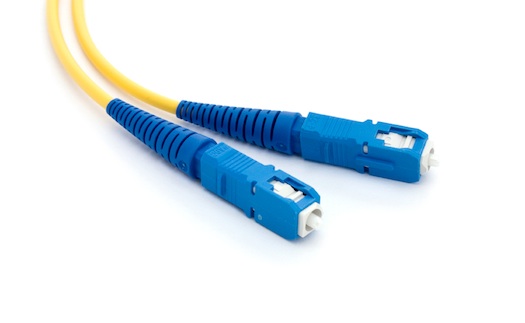
Telemetry
Telemetry can wirelessly transmit physiological data from a battery-powered encoder unit to a computer many meters away. This technology protects clients from shock because current surges cannot travel across a Bluetooth connection (Montgomery, 2004). Telemetry also offers practical advantages in settings like VA rehabilitation clinics and athletic performance centers, where clients may need to move freely during monitoring. MindMedia's NeXus-10, featured below, communicates wirelessly with a computer for data acquisition.
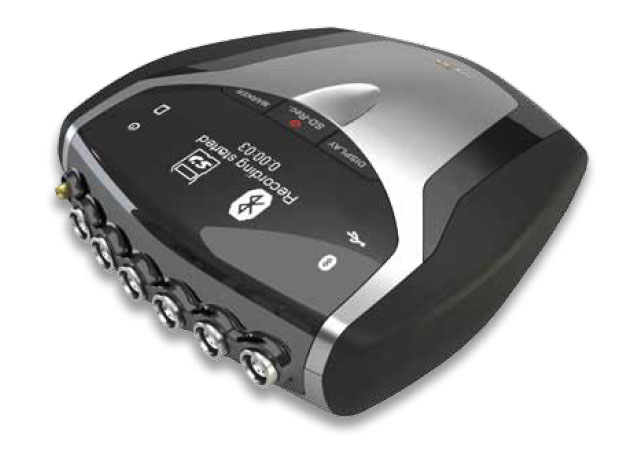
Electrical safety is paramount in biofeedback practice because currents of roughly 5 mA mark the upper limit of a harmless shock and currents on the order of 50 mA can cause fatal ventricular fibrillation. Four key technologies protect clients and clinicians: ground fault interrupt circuits that shut off power when leakage to ground exceeds about 5 mA, optical isolation that converts signals to light across an insulating gap, fiber optic connections that prevent current leakage while also reducing artifact contamination, and telemetry that wirelessly transmits data from battery-powered encoders. Plugging all equipment into the same outlet creates a common ground that maximizes ground fault protection.
Check Your Understanding
- At what current level does exposure become dangerous to humans, and what can a 50-mA current cause?
- How does a ground fault interrupt circuit protect clients during biofeedback sessions?
- Why does optical isolation provide safety even when equipment receives AC power?
- What advantage do fiber optic connections offer over traditional copper wiring in biofeedback?
- Why did Montgomery recommend plugging all biofeedback equipment into the same power outlet?
Glossary
absolute power: the squared amplitude of the EEG within a frequency band, expressed in physical units such as μV2 or picowatts, representing the total electrical energy in that band over a specified time frame. Absolute power must be consulted before relative power is interpreted.
active electrode: the electrode that is placed over a site that is a known EEG generator like Cz. Note that the same phrase is used in a second, unrelated sense to describe an electrode containing a built-in pre-amplifier (see active electrode, pre-amplified).
active electrode (pre-amplified): an electrode with a small amplifier at the recording site that buffers the high-impedance contact before noise is added along the cable; contrasted with a passive electrode.
aliasing: a sampling artifact where an analog signal appears to have a lower frequency than it does due to an insufficient sampling rate.
alpha: the EEG frequency band conventionally spanning 8-12 Hz, associated with relaxed wakefulness and sometimes subdivided into alpha 1 and alpha 2.
alpha blocking: the replacement of the alpha rhythm by low-amplitude desynchronized beta activity during movement, attention, mental effort like complex problem-solving, and visual processing.
alternating current (AC): an electric current that periodically reverses its direction.
ampere (A): the unit of electrical current, equal to one coulomb of charge passing a point per second. One volt across one ohm of resistance produces a current of one ampere.
amplitude: signal strength measured in microvolts or picowatts.
analog-to-digital converter (ADC): an electronic device that converts continuous signals to discrete digital values.
anti-aliasing filter: a low-pass filter that removes frequencies too high to be sampled correctly, preventing aliasing.
artifact: false signals like 50/60 Hz noise produced by line current.
atom: the basic unit of matter consisting of a central nucleus that contains protons and neutrons and orbiting electrons.
atomic number: the number of protons in the nucleus of an atom that defines an element.
atomic weight (relative atomic mass): the weighted average mass of an element's naturally occurring isotopes. It is approximated by, but not identical to, the mass number.
average voltage: 0.637 of the peak voltage for a pure sine wave; an approximation for the complex, multi-frequency EEG.
bandpass filter: the filter that passes frequencies between the set values, the "band" of the filter (e.g., 1-40 Hz).
battery effect: the standing voltage added to a recording when an electrode-electrolyte junction acts like a small battery; increased by unbalanced impedance.
behavioral test (tracking test): a test of the entire signal chain (EEG sensor, differential amplifier, gain amplifier, cable, encoder, and computer) performance by asking a client to act and then observing the effects on the EEG.
beta: a general EEG frequency range above alpha that is typically subdivided into beta 1 (12-15 Hz, also called SMR), beta 2 (15-22 Hz), beta 3 (22-36 Hz), and beta 4 (36-45 Hz); associated with active thinking and focus. Subdivision boundaries and labels vary among systems and authors.
bias potential: spurious voltage produced by the exchange of metal ions donated by the electrodes and electrolytes in the absence of a biological current.
bipolar (sequential) recording: a recording method in which both inputs of the differential amplifier come from scalp electrodes, so the tracing represents the difference in activity between those two scalp sites. A ground electrode is still required but is not one of the two compared inputs.
bit number: the number of voltage levels that an A/D converter can discern. A resolution of 16 bits means that the converter can discriminate among 65,536 voltage levels.
capacitance: the ability of two conductive regions separated by a thin insulator to store electrical charge; the main source of reactance at the skin-electrode interface.
charge (Q): the imbalance between the number of positively and negatively charged particles in a given place or between two locations.
closed circuit: a complete path that allows electrons to travel from the power source, through the conductor and resistance, and back to the source.
common-mode rejection ratio (CMRR): the degree by which a differential amplifier boosts signal (differential gain) and artifact (common-mode gain).
common-mode signal: the portion of a signal that appears with the same amplitude and timing at both inputs of a differential amplifier, typically shared artifact such as power line noise, which the amplifier subtracts away.
conductance (G): the ability of a material like copper or silver to carry an electric current. Conductance is measured in siemens (formerly mhos).
conductor: a material that readily allows electron movement like a copper wire.
continuity test: a procedure to ensure that a circuit is closed. For example, a cable is not broken.
coulomb: the SI unit of electric charge, equal to the charge carried by approximately 6.24 x 10¹⁸ (about 6 billion billion) electrons.
current (I): the movement of charge—electrons in a wire, ions in body fluids—past a point, measured in amperes (A).
DC offset: the voltage that results from combinations of factors including electrode and gel/paste materials, interactions with skin, environment (humidity and temperature), and sweat gland activity due to stress level.
decibel (dB): a logarithmic unit for comparing two values, where each 20-dB step represents a tenfold difference in voltage. A CMRR of 100 dB equals a 100,000:1 ratio.
delta: the lowest EEG frequency band, conventionally 1-4 Hz, associated with deep sleep and, when prominent during wakefulness, with pathology. Eye movements and blinks contaminate this range.
differential amplifier (balanced amplifier): a device that boosts the difference between two inputs: the active (input 1) and reference (input 2).
differential input impedance: the opposition to an AC signal entering a differential amplifier as it is dropped across a resistor network.
differential-mode signal: the portion of a signal that differs between the two inputs of a differential amplifier, which carries the genuine EEG of interest and is preserved and amplified.
digital filter: device that mathematically removes unwanted or extracts valuable aspects of a sampled, discrete-time signal.
direct current (DC): an electric current that flows in only one direction, as in a flashlight.
dominant frequency: the frequency within a band showing the greatest amplitude or power, often reported as text alongside an FFT display.
drift velocity: the slow net motion of electrons through a conductor, only a fraction of a millimeter per second, even though the electromagnetic field that carries the energy propagates near the speed of light.
dry electrodes: electrodes that do not require skin preparation and the application of conductive paste.
electrode: a specialized conductor that converts biological signals like the EEG into currents of electrons.
electrode cap: a stretchable fabric cap that holds EEG electrodes at fixed, standardized scalp positions.
electromagnetic field: the region of electric and magnetic influence surrounding a circuit that propagates near the speed of light and carries the energy delivered to a load.
electromotive force (EMF): a difference in electrical potential that "pushes" electrons to move in a circuit.
electromyography (EMG): the measurement of muscle activity, which appears in EEG recordings as artifact concentrated in the higher frequencies.
electron: a negatively charged particle occupying orbitals at varying distances from the nucleus that participates in chemical reactions and in electrical conduction.
elements: substances whose atoms all share the same atomic number and that cannot be broken down by ordinary chemical reactions. Atoms of one element may differ in neutron number as isotopes.
energy level: one of an electron's possible orbits around a nucleus at a constant distance.
epidermis: the outermost skin layer.
epoch: a discrete time segment into which a recording is divided for analysis. One second is the minimum epoch an FFT calculation requires; values derived from different epoch lengths are not directly comparable.
FFT filters: filters that convert the EEG signal into a set of sine waves that vary in frequency, amplitude, and phase.
fiber optic cable: a thin, flexible cable that transmits digital signals as pulses of light with the advantages of high-speed data transmission, electrical isolation, and resistance to electromagnetic interference.
filter order: a measure of how many data points a digital filter uses to define the boundary between the frequencies it passes and those it blocks. Higher orders produce a sharper boundary at the cost of greater processing delay; neurofeedback systems typically use orders between 3 and 6.
filtered signal: an EEG display that shows only a selected frequency range (e.g., 8-12 Hz) and excludes all others, simplifying analysis at the cost of concealing the signal's true complexity.
finite impulse response (FIR) filter: filter with a finite-duration impulse response.
frequency (Hz): the number of complete cycles that an AC signal completes in a second, usually expressed in hertz.
frequency bin: a narrow frequency slice, commonly 1 Hz wide and sometimes 0.5 Hz or smaller, examined individually within a spectral display.
gain: an amplifier's ability to increase the magnitude of an input signal to create a higher output voltage; the ratio of output/input voltages.
gamma: a high-frequency EEG band generally above 36 Hz, also labeled beta 4, often associated with cognitive and sensory integration.
ground electrode: a sensor placed on an earlobe, mastoid bone, or the scalp that is grounded to the amplifier.
ground fault interrupt circuit: a protective device that compares outgoing and returning current and opens the circuit, shutting down power, when leakage to ground exceeds its trip threshold (nominally 5 mA; 4 to 6 mA for devices sold in the United States).
half-cell potential: the small voltage produced at a single electrode-electrolyte contact as ions cross the junction; the main contributor to DC offset and the basis of the battery effect.
hertz (Hz): the unit of frequency measured in cycles per second.
high-pass filter: a filter that only passes frequencies higher than a set value (e.g., 1 Hz).
impedance (Z): the complex opposition to an alternating current, combining resistance and frequency-dependent reactance. The SI unit is the ohm (Ω); skin-electrode values are conventionally reported in kilohms (KΩ).
impedance meter: device that uses an AC signal to measure impedance in an electric circuit, such as between active and reference electrodes.
impedance test: the automated or manual measurement of skin-electrode impedance.
infinite impulse response (IIR) filter: a filter with an infinite impulse response that employs feedback as it calculates a moving weighted average of digitally sampled voltages.
infra-slow activity: EEG activity below about 1 Hz, including slow cortical potentials. Recording it requires DC-coupled amplifiers, high-resolution A/D conversion, and minimally polarizable electrodes such as sintered silver/silver-chloride.
input sensitivity (display sensitivity): the display scaling of an EEG tracing, expressed as microvolts of amplitude per millimeter of deflection (µV/mm). A lower setting makes waveforms appear larger. Distinguish it from an amplifier's input voltage range, the largest input the amplifier can accept without clipping and distortion, a specification some manufacturers also call sensitivity.
insulator: material that resists the flow of electricity like glass and rubber.
interstitial fluid: fluid between cells through which biological signals travel via volume conduction.
ion: an atom or molecule with a positive or negative electrical charge.
joule: the standard unit of energy and work. One joule is the energy transferred when one coulomb of charge moves through a potential difference of one volt.
low-pass filter: a filter that only passes frequencies lower than a set value (e.g., 40 Hz).
magnitude: in EEG, the amplitude of an individual frequency component averaged over the analyzed interval, plotted on the y-axis of an FFT display.
magnitude spectrum: an FFT display of amplitude over time corrected for sign, so all values are positive; distinguished from the power spectrum, which plots amplitude squared.
mass number: the combined number of protons and neutrons in an atom's nucleus; an approximation of atomic weight.
mastoid bone (or process): bony prominence behind the ear.
matter: anything that occupies space and possesses mass; can assume solid, liquid, gaseous, and plasma states.
mho: the unit of conductance replaced by the siemens.
microsiemens (μS): the unit of conductance equal to one-millionth of a siemens. A resistance of 1 MΩ corresponds to a conductance of 1 μS.
microvolt (μV): the unit of amplitude (signal strength) that is one-millionth of a volt.
microvolt squared (μV2): the unit of EEG power, representing amplitude in microvolts squared. An amplitude of 4 μV corresponds to 16 μV2.
milliampere (mA): unit of electrical current that is one-thousandth of an ampere.
millivolt (mV): unit of amplitude (signal strength) that is one-thousandth of a volt.
monopolar (referential) recording: a recording method that compares one active scalp electrode against a reference placed at a relatively inactive site, plus a separate ground electrode. The term is a convention rather than a literal description, since no reference site is electrically silent.
motor unit: an alpha motor neuron and the skeletal muscle fibers it innervates.
mu rhythm: an 8-12 Hz rhythm generated over the sensorimotor cortex and suppressed by movement or by observing movement; usually identified by location and frequency bin rather than by band label alone.
normalized EEG: another name for relative power, reflecting the historical claim that expressing bands as percentages of total power made recordings from different amplifiers comparable.
notch filter: a filter that suppresses a narrow band of frequencies, such as those produced by line current at 50/60 Hz.
nucleus: central mass of an atom that contains protons and neutrons.
Nyquist-Shannon sampling theorem: faithful reconstruction of a band-limited analog signal requires a sampling rate greater than twice its highest frequency component. A signal whose highest frequency is 1,000 Hz must be sampled more than 2,000 times per second. Because real anti-aliasing filters roll off gradually, practical guidelines call for a further margin above this floor.
ohm (Ω): the unit of impedance or resistance.
Ohm's law: voltage (E) = current (I) x resistance (R). The "amount" of current (I) flowing through a conductor is equal to the voltage (E) or "push" divided by the resistance (R).
open circuit: an incomplete path that prevents electron movement from the power source, through the conductor, and back to the source. For example, a broken sensor cable.
optical isolation: a device in which an LED converts a signal into light, the light crosses a dielectric barrier (an open circuit), and a phototransistor on the far side reconverts the light into an electrical signal, so no conductive path links the two sides.
passband: the range of frequencies that is passed through a filter.
passive electrode: an electrode that transmits the raw scalp signal to the amplifier without on-site amplification.
peak frequency: the frequency within a band carrying the highest voltage or power, such as 10 Hz within an 8-12 Hz alpha band; useful for centering reward bandwidths on a client's actual activity.
peak voltage: 0.5 of the peak-to-peak voltage.
peak-to-peak voltage: the voltage difference between the positive and negative maximum values of the original AC waveform; twice the peak voltage.
phase: the degree to which the peaks and valleys of two waveforms coincide.
phase distortion: the displacement of the EEG waveform in time.
picowatt (pW): one trillionth of a watt (1 pW = 10-12 W). EEG power derived from squared amplitude is sometimes labeled in picowatts because 1 μV2 across a reference resistance of 1 ohm equals 1 pW; the numerical value is identical to the μV2 value, so the label is a convention rather than a measurement of power delivered by the scalp.
polarization: chemical reactions produce separate regions of positive and negative charge where an electrode and electrolyte make contact, reducing ion exchange.
power (W): the rate at which energy is transferred. In a DC circuit power equals the product of current and voltage. Power is measured in watts.
power spectrum: an FFT display of amplitude squared across frequencies. Squaring permits statistical calculation and widens the apparent differences between bands.
prefrontal cortex: the anterior region of the frontal lobes, which supports executive function and cognitive control.
proton: positively charged subatomic particle found in the nucleus of an atom.
quantitative EEG (qEEG): digitized statistical brain mapping that measures EEG amplitude and power within specific frequency bins, typically using a montage of at least 19 channels because that is the number most normative databases require.
reactance: the frequency-dependent component of impedance that arises when a circuit stores and then releases energy as the current alternates. Combined with resistance, it forms impedance.
reference electrode: the electrode placed over a relatively inactive site, such as the mastoid bone behind the ear, that is never truly electrically silent.
relative power (percent power): the percentage of total power that a frequency band contributes (e.g., 8-12 Hz power as a percentage of 1-45 Hz power). Because percentages must total 100, one excessive band makes all others appear deficient.
resistance (R): the opposition to a DC signal by a resistor measured in ohms.
resistor: a component in electric circuits that resists current flow.
resolution: the number of voltage levels an A/D converter can discriminate (16 bits allows 65,536 levels). The corresponding amplitude resolution in microvolts depends on the amplifier's input range, across which those levels are divided.
root mean square (RMS) voltage: 0.707 of the peak voltage for a pure sine wave; the equivalent steady DC voltage that would deliver the same average power into the same resistance. For the complex, multi-frequency EEG the factor is an approximation.
sampling rate: the number of measurements taken within a given period by an analog-to-digital converter.
sensorimotor rhythm (SMR): a sub-band of beta conventionally spanning 12-15 Hz, also labeled beta 1, associated with motor inhibition and relaxed alertness.
short circuit: a lower-resistance electrical circuit created by the unintended contact between components that accidentally diverts the current.
siemens (S): the SI unit of conductance, the reciprocal of the ohm; formerly called the mho.
sintered silver/silver-chloride electrodes: silver and silver-chloride particles are fused together under heat and pressure into a solid electrode material, rather than being plated or coated onto a base metal for a more stable, lower-noise electrode surface required by slow cortical potential recording.
skin conductance level (SCL): a tonic measurement of how easily an AC or DC passes through the skin, expressed in microsiemens.
skin resistance level (SRL): a tonic (resting) measurement of the opposition to an AC or DC as it passes through the skin, expressed in Kohms.
standard deviation (SD): a statistical measure of the spread of a set of values. In EEG, SD expresses how far a client's value falls from a normative database mean, reported as a z-score. In a normal distribution the interval from -1 to +1 SD contains approximately 68% of values.
stopband: the range of frequencies that is sharply attenuated by a filter.
superconductor: a material that conducts electricity without resistance.
telemetry: remote monitoring and transmission of information. An encoder measures physiological activity and transmits these data to a computer for analysis.
theta: the EEG frequency band conventionally spanning 4-8 Hz, associated with drowsiness, inattention, and some memory processes.
theta/beta ratio: a quantitative metric dividing theta (typically 4-8 Hz) by beta (often 13-21 Hz), widely used in attention-related work. The same recording yields different values depending on whether amplitude or power is used, so the convention must always be stated.
topographic map: a spatial representation of EEG activity across the scalp, showing the distribution of amplitude, power, or z-scores within frequency bands or bins.
tracking test (behavioral test): a test of the entire signal chain (EEG sensor, differential amplifier, gain amplifier, cable, encoder, and computer) performance by asking a client to act and then observing the effects on the EEG.
transducer: device that transforms energy from one form to another. Electrodes convert ionic potentials into electrical potentials.
valence electron: an electron in an atom's outermost energy level that takes part in conduction. Conductors hold one or two loosely bound valence electrons, while insulators bind theirs tightly.
valence shell: the outermost energy level of an atom, whose electrons determine whether a material conducts or insulates.
ventricular fibrillation: a medical emergency in which the lower heart chambers contract in a rapid and unsynchronized fashion and cannot pump blood.
volt (V): unit of electrical potential difference (electromotive force) that moves electrons in a circuit.
voltage (E): the amount of electrical potential difference (electromotive force).
voltohmmeter: a device that uses a DC signal to measure resistance in an electric circuit, such as between active and reference electrodes.
volume conduction: the spread of biological potentials as ionic current through the conducting tissues and fluids that separate a generator from a recording electrode. It is a near-field process, not radiation through space.
watt (W): the SI unit of power, equal to one joule per second. EEG software that reports signal strength in picowatts is applying the 1-ohm convention described under picowatt.
wet electrode: an electrode that relies on conductive gel or paste to bridge the scalp and the sensor.
zero-crossing method: a technique for estimating frequency by counting how many times a waveform crosses the zero-voltage line in one second and dividing by two.
z-score: a standardized value indicating how many standard deviations an observed EEG measurement falls from the normative mean; used throughout qEEG analysis.
Test Yourself on ClassMarker
Click on the ClassMarker logo below to take a 10-question exam over this entire unit. There is no password.

Review Flashcards on Quizlet
Click on the Quizlet logo to review our chapter flashcards.

Visit the BioSource Software Website
BioSource Software offers Physiological Psychology, which satisfies BCIA's Neuroanatomy requirement, and the Neurofeedback100 Testing Service, which provides extensive multiple-choice testing over the Neurofeedback Blueprint.

Assignment
Now that you have completed this module, explain why low-and-balanced skin-electrode impedances are important in neurofeedback training. Describe the precautions you take to achieve acceptable impedance values. How do you measure impedance with your neurofeedback system?
References
Anderson, J. S. (2025, April 10). John S. Anderson on frequency vs. amplitude [Blog post]. BioSource Software. https://www.biosourcesoftware.com/post/john-anderson-on-frequency-vs-amplitude
Andreassi, J. L. (2007). Psychophysiology: Human behavior and physiological response (5th ed.). Lawrence Erlbaum Associates.
Basmajian, J. V. (Ed.). (1989). Biofeedback: Principles and practice for clinicians. Williams & Wilkins.
Bayat, M., Safaie, J., Mollazadeh Beidokhti, S., & Wallois, F. (2025). A comprehensive review of EEG electrode technologies: Advancements, applications, and future directions. Sensors and Actuators A: Physical, 399, 117396. https://doi.org/10.1016/j.sna.2025.117396
Cacioppo, J. T., & Tassinary, L. G. (Eds.). (1990). Principles of psychophysiology. Cambridge University Press.
Collura, T. F. (2014). Technical foundations of neurofeedback. Taylor & Francis.
Demos, J. N. (2019). Getting started with EEG neurofeedback (2nd ed.). W. W. Norton & Company.
Di Flumeri, G., Aricò, P., Borghini, G., Sciaraffa, N., Di Florio, A., & Babiloni, F. (2019). The dry revolution: Evaluation of three different EEG dry electrode types in terms of signal spectral features, mental states classification and usability. Sensors, 19(6), 1365. https://doi.org/10.3390/s19061365
Fisch, B. J. (1999). Fisch and Spehlmann's EEG primer (3rd ed.). Elsevier.
Floyd, T. L. (1987). Electronics fundamentals: Circuits, devices, and applications. Merrill Publishing Company.
Grant, A. (2015, December 31). Four elements earn permanent seats on the periodic table. Science News. https://www.sciencenews.org/article/four-elements-earn-permanent-seats-periodic-table
Halford, J. J., Sabau, D., Drislane, F. W., Tsuchida, T. N., & Sinha, S. R. (2016). American Clinical Neurophysiology Society Guideline 4: Recording clinical EEG on digital media. Journal of Clinical Neurophysiology, 33(4), 317-319. https://doi.org/10.1097/WNP.0000000000000318
Hinrichs, H., Scholz, M., Baum, A. K., Kam, J. W. Y., Knight, R. T., & Heinze, H.-J. (2020). Comparison between a wireless dry electrode EEG system with a conventional wired wet electrode EEG system for clinical applications. Scientific Reports, 10, 5218. https://doi.org/10.1038/s41598-020-62154-0
Hughes, J. R. (1994). EEG in clinical practice (2nd ed.). Butterworth-Heinemann.
Kam, J. W. Y., Griffin, S., Shen, A., Patel, S., Hinrichs, H., Heinze, H.-J., Deouell, L. Y., & Knight, R. T. (2019). Systematic comparison between a wireless EEG system with dry electrodes and a wired EEG system with wet electrodes. NeuroImage, 184, 119–129. https://doi.org/10.1016/j.neuroimage.2018.09.012
Kappenman, E. S., & Luck, S. J. (2010). The effects of electrode impedance on data quality and statistical significance in ERP recordings. Psychophysiology, 47(5), 888-904. https://doi.org/10.1111/j.1469-8986.2010.01009.x
Kubala, T. (2009). Electricity 1: Devices, circuits, and materials (9th ed.). Cengage Learning.
Libenson, M. H. (2010). Practical approach to electroencephalography. Saunders Elsevier.
Miller, J. W., Kim, W. S., Holmes, M. D., & Vanhatalo, S. (2007). Ictal localization by source analysis of infraslow activity in DC-coupled scalp EEG recordings. NeuroImage, 35(2), 583-597. https://doi.org/10.1016/j.neuroimage.2006.12.018
Montgomery, D. (2004). Introduction to biofeedback. Module 3: Psychophysiological recording. Association for Applied Psychophysiology and Biofeedback.
Nilsson, J. W., & Riedel, S. A. (2008). Electric circuits (8th ed.). Pearson Prentice-Hall.
Peek, C. J. (2016). A primer of traditional biofeedback instrumentation. In M. S. Schwartz & F. Andrasik (Eds.), Biofeedback: A practitioner's guide (4th ed.). The Guilford Press.
Stern, R. M., Ray, W. J., & Quigley, K. S. (2001). Psychophysiological recording (2nd ed.). Oxford University Press.
Thompson, M., & Thompson, L. (2015). The neurofeedback book: An introduction to basic concepts in applied psychophysiology (2nd ed.). Association for Applied Psychophysiology and Biofeedback.
Wadman, W. J., & Lopes da Silva, F. H. (2011). In D. L. Schomer & F. H. Lopes da Silva (Eds.), Niedermeyer's electroencephalography: Basic principles, clinical applications, and related fields (6th ed.). Lippincott Williams & Wilkins.
Return to Top