Blood Volume Pulse (BVP)
What You Will Learn
Blood volume pulse measurement sits at the heart of consumer HRV biofeedback technology, powering everything from smartphone apps to wearable fitness trackers. Whether you are working with a veteran managing PTSD at a VA hospital, a patient with essential hypertension in a primary care clinic, or an athlete pursuing optimal performance, understanding how photoplethysmograph (PPG) sensors detect blood flow changes will help you deliver more effective HRV biofeedback training. In this chapter, you will discover why pulse rate variability (PRV), the HRV estimate derived from PPG sensors, may differ from ECG-derived HRV under certain conditions. By mastering PPG sensor placement, artifact recognition, and tracking tests, you will be equipped to troubleshoot common recording problems and obtain clean data even when ECG equipment is unavailable.
The electrocardiograph (ECG) and photoplethysmograph (PPG) represent two fundamentally different approaches to detecting heart rate and heart rate variability. The ECG captures the electrical activity that triggers each heartbeat directly from the cardiac muscle. In contrast, the PPG sensor detects the pulse wave as it travels through the vascular tree, arriving at peripheral sites like the fingertip or earlobe moments after the heart contracts. This timing difference, known as pulse transit time, varies with blood pressure and arterial stiffness, which explains why HRV estimates from the two methods sometimes diverge.
This distinction matters clinically. Jan and colleagues (2019) demonstrated that PRV may be a poor ECG surrogate for measuring HRV when participants stand, perform slow-paced breathing, or have low HRV. For practitioners using HRV biofeedback with conditions like anxiety, PTSD, or fibromyalgia, where slow-paced breathing protocols are central to treatment, understanding these limitations helps you select the appropriate measurement method for each client and interpret your findings accurately.
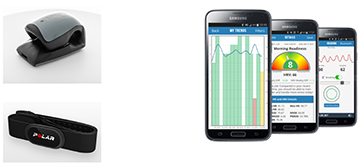
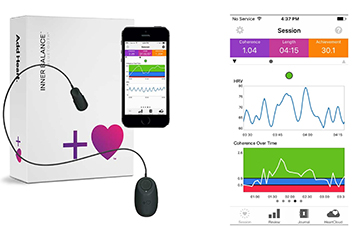
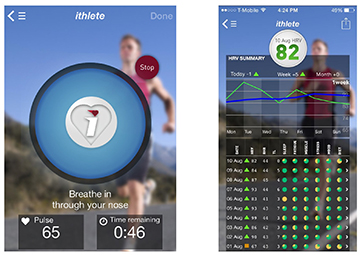
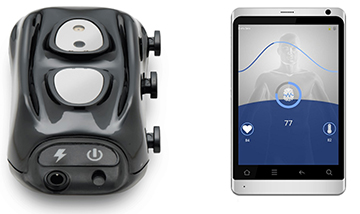
Consumer biofeedback devices incorporating PPG sensors have democratized HRV monitoring. Products by Elite HRV, HeartMath, myithlete, and Thought Technology Ltd. have made this powerful self-regulation tool accessible to millions of users worldwide. Many clients now arrive at sessions already familiar with HRV concepts from their smartphone apps, creating opportunities to build on their existing knowledge while clarifying misconceptions about what their devices actually measure.
 |
 |
 |
 |
BCIA Blueprint Coverage
This unit addresses III. HRV Instrumentation: A. Blood volume pulse (BVP).
Professionals completing this unit will be able to discuss blood volume pulse source, PPG sensors, BVP signal characteristics, sensor placements, tracking tests, and artifacts.
This unit covers the Source of BVP, PPG Sensor, BVP Signal, PPG Sensor Placement, BVP Artifacts, and Tracking Test.
🎧 Listen to the Full Chapter Lecture
Understanding the Source of Blood Volume Pulse
Blood volume refers to the amount of blood contained in an area at any given moment. This measure mainly reflects venous tone, the degree of constriction or dilation in the veins that determines how much blood pools in peripheral tissues. Think of it like the water level in a garden hose: the volume can change moment to moment as the heart pumps and blood vessels constrict or dilate in response to autonomic nervous system activity.
🎧 Mini-Lecture: Blood Volume Pulse (BVP)
Blood volume pulse (BVP) indexes rapid changes in blood flow that occur with each heartbeat. It is calculated as the vertical distance between the minimum value (trough) of one pulse wave and the maximum value (peak) of the next. Unlike blood volume, which reflects relatively stable venous pooling, BVP captures the dynamic surge of oxygenated blood through the arterioles, the tiny arteries that deliver blood to capillary beds. This measure mainly reflects blood flow and arteriolar tone (Peper, Shaffer, & Lin, 2010). When a client's sympathetic nervous system activates during stress, arterioles constrict, reducing BVP amplitude. During relaxation, arterioles dilate, and BVP amplitude increases.
How PPG Sensors Detect the Pulse Wave
Blood volume pulse is detected using a photoplethysmograph (PPG), a device that measures the relative amount of blood flow through tissue using a photoelectric transducer. If you have ever worn a fitness tracker or smartwatch that measures your heart rate from your wrist, you have experienced PPG technology firsthand. The same principle that powers consumer wearables forms the foundation of professional HRV biofeedback systems.
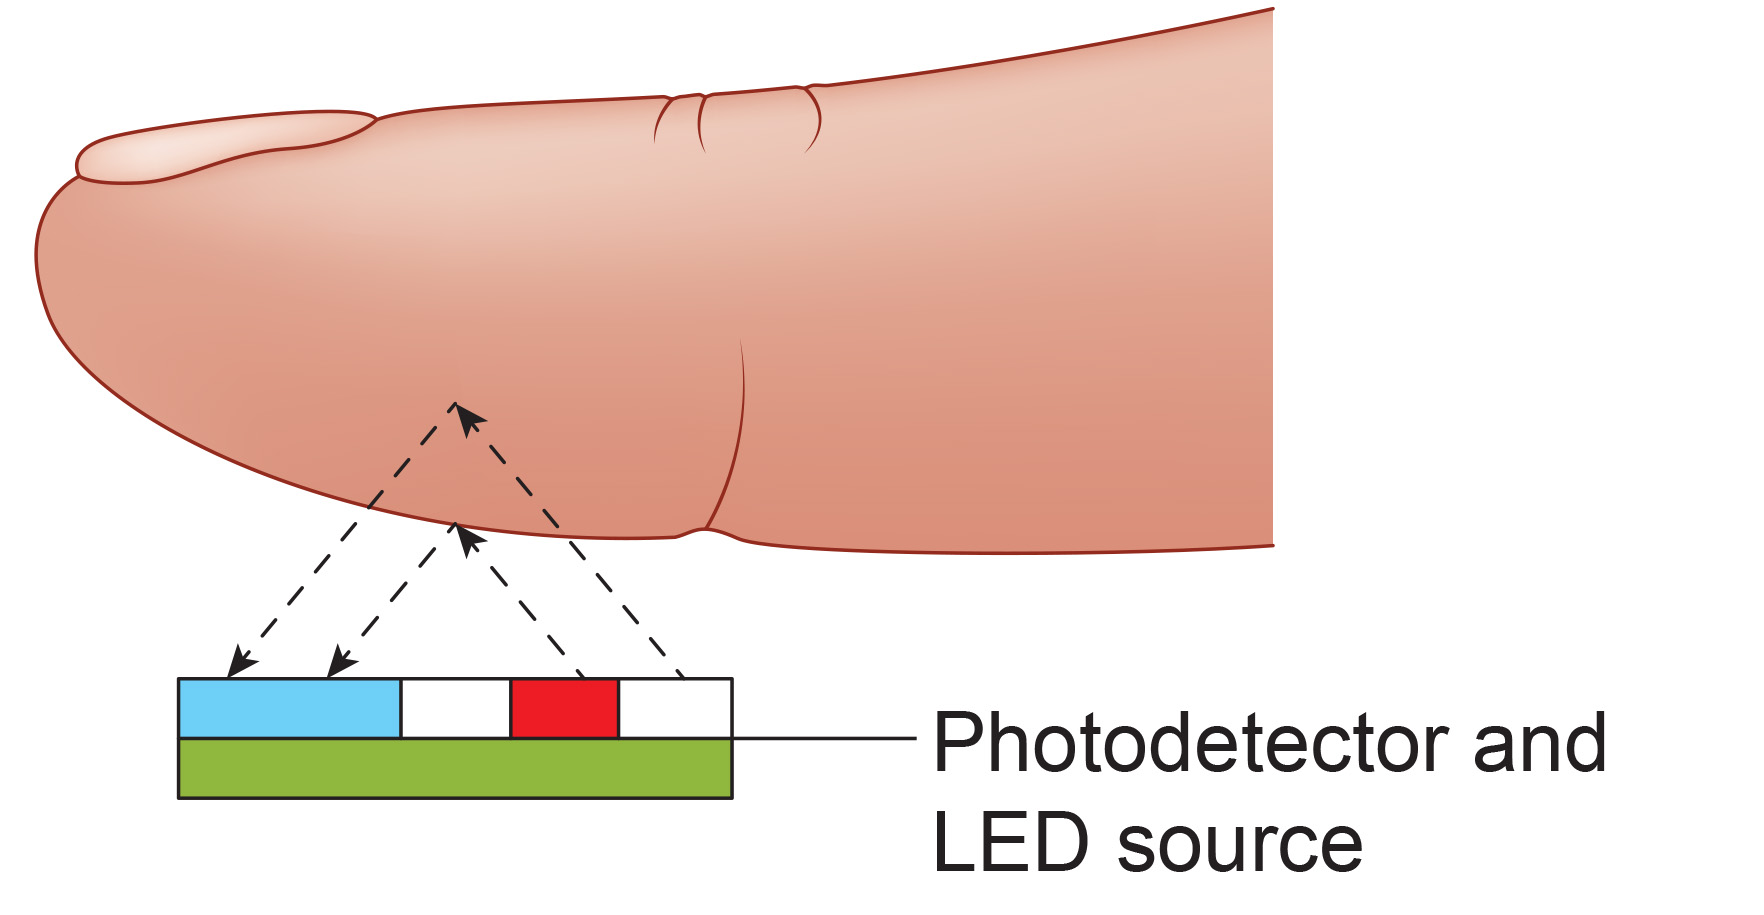
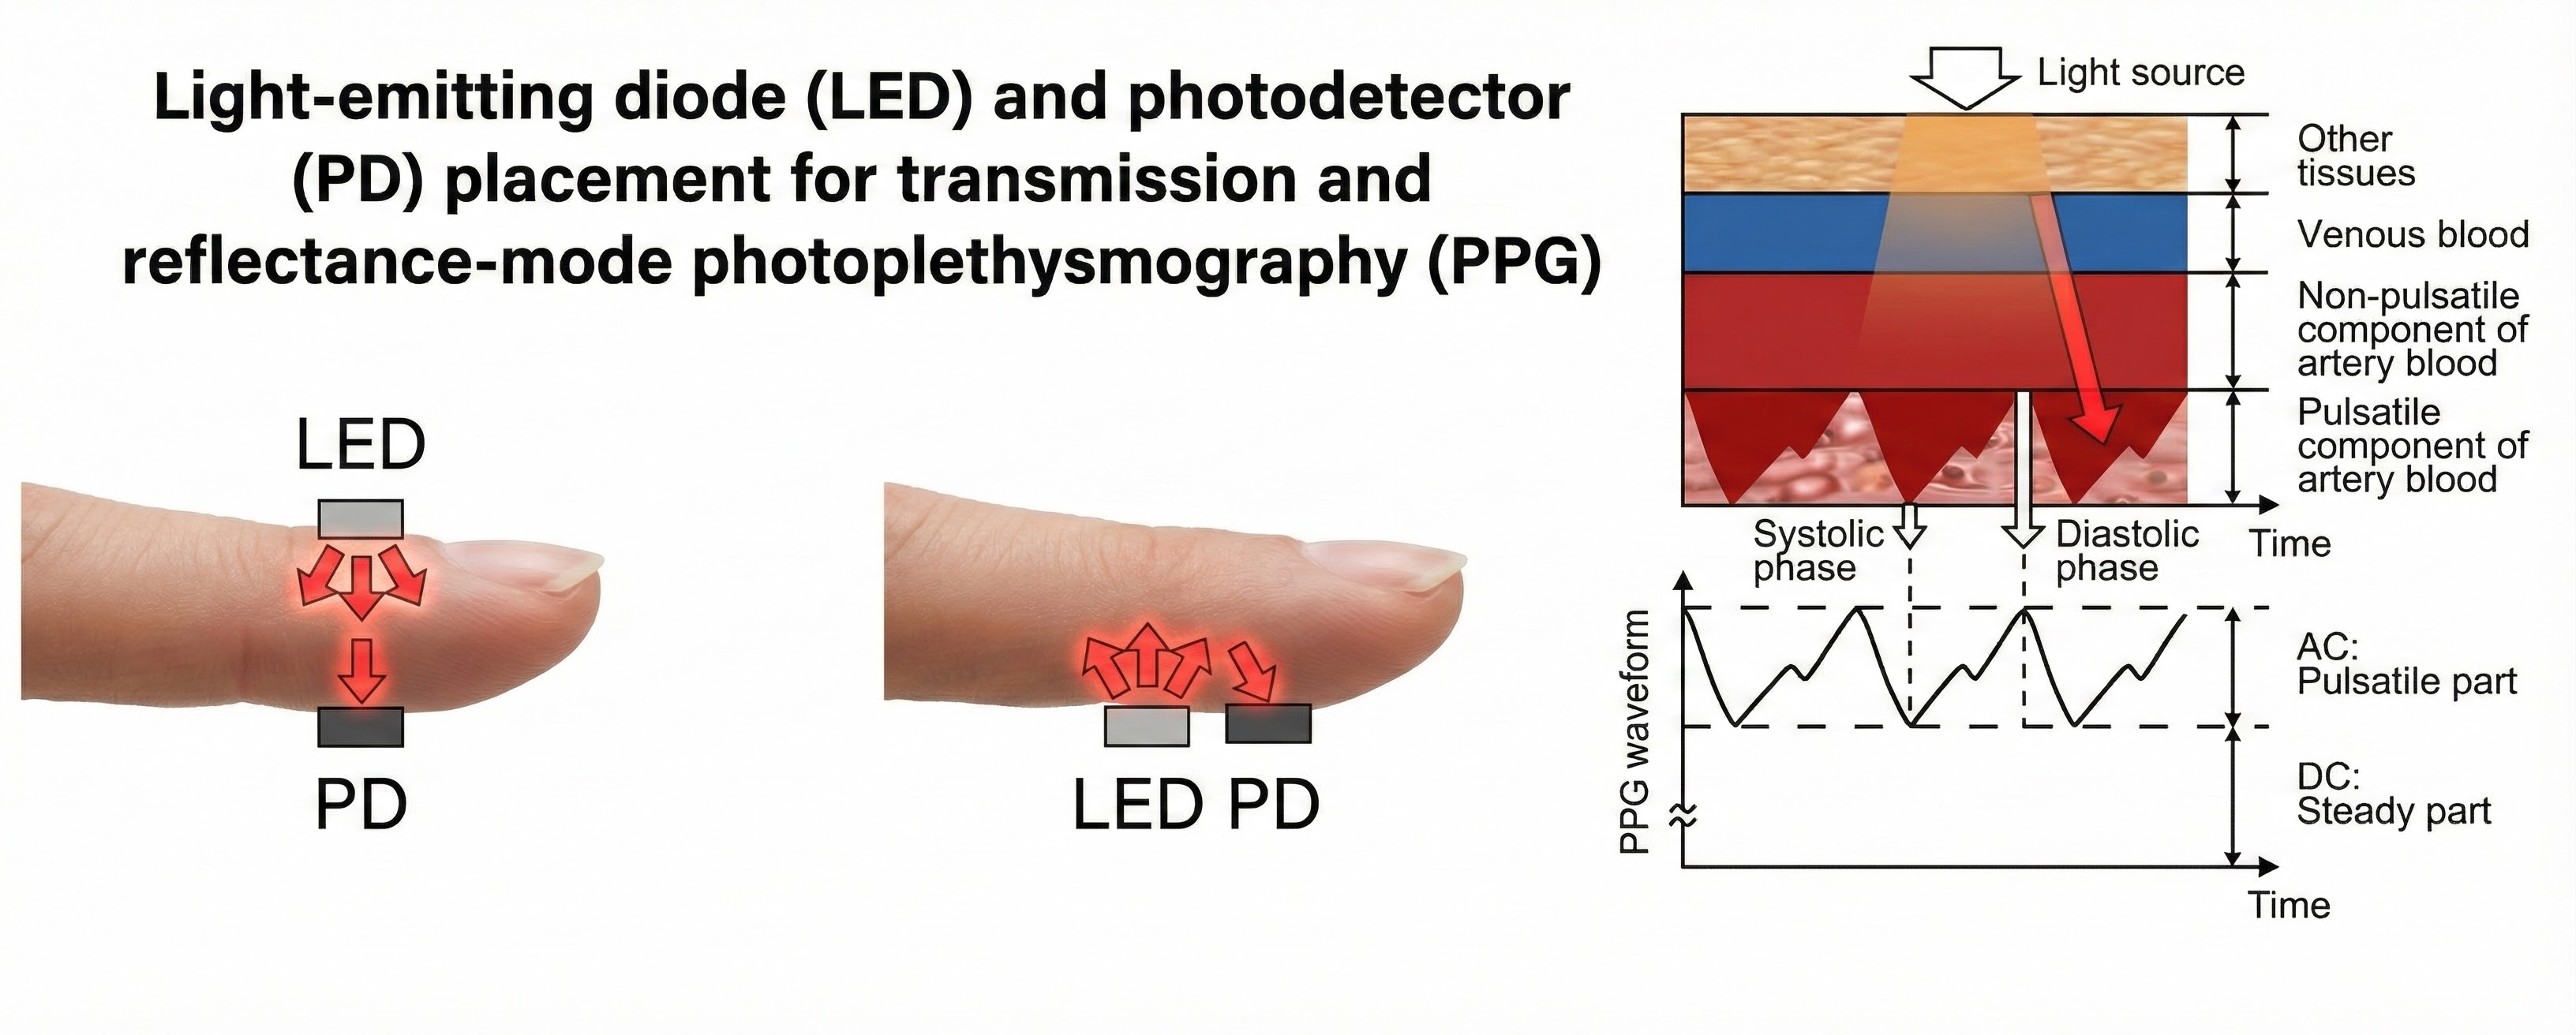
The PPG sensor works by shining infrared light (7000-9000 Angstrom wavelength) through or into tissue. The transmission technique places the light source and photodetector on opposite sides of a digit, with light passing directly through the finger (Allen, 2007). Imagine shining a flashlight through your fingertip in a dark room: the light that passes through varies with the amount of blood present. When your heart contracts and sends a pulse of blood into your finger, the tissue becomes more opaque, and less light reaches the detector.
![]()
The reflection technique places both light source and photodetector on the same side of the tissue. Rather than passing through the finger, light penetrates the tissue and bounces back to the detector. In both methods, the intensity of the light reaching the sensor varies with momentary shifts in blood volume (Shaffer & Combatalade, 2013). Smartwatches typically use the reflection technique because it allows placement on flat surfaces like the wrist, while finger sensors more commonly use transmission.
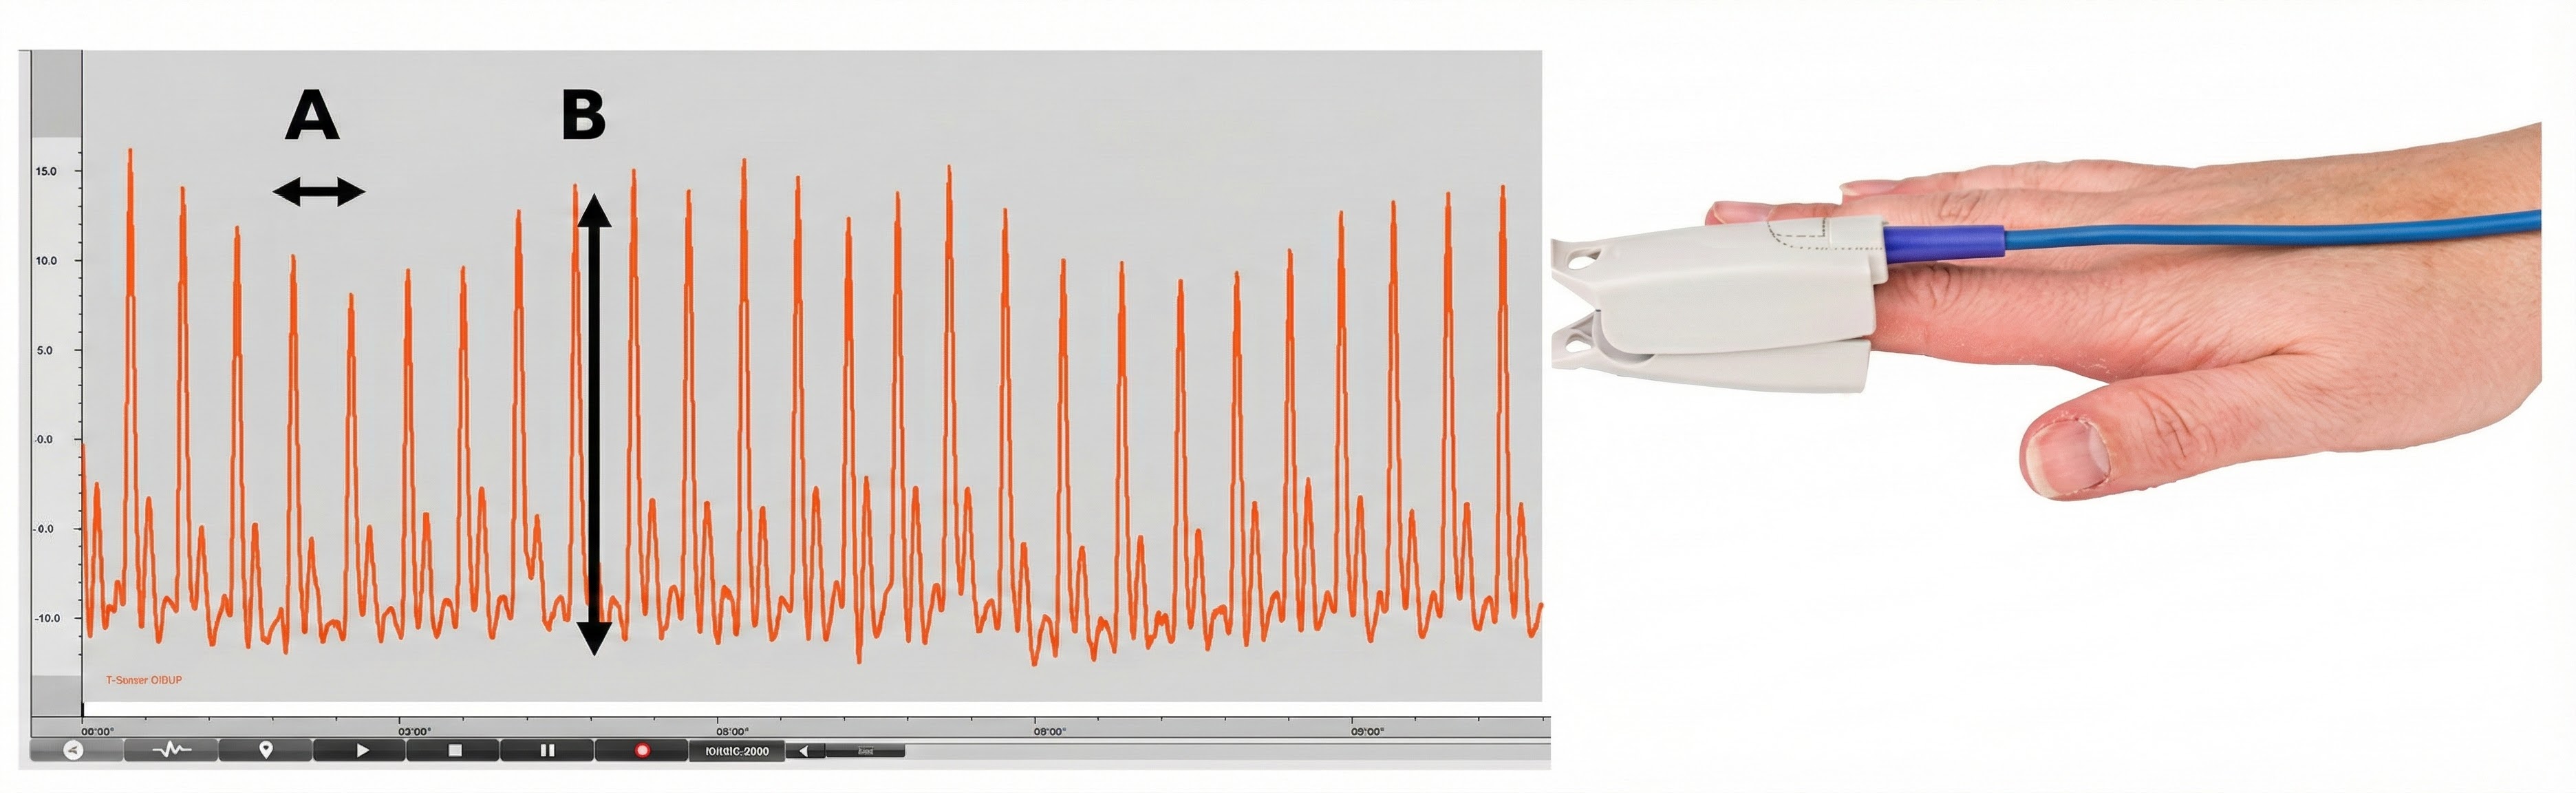
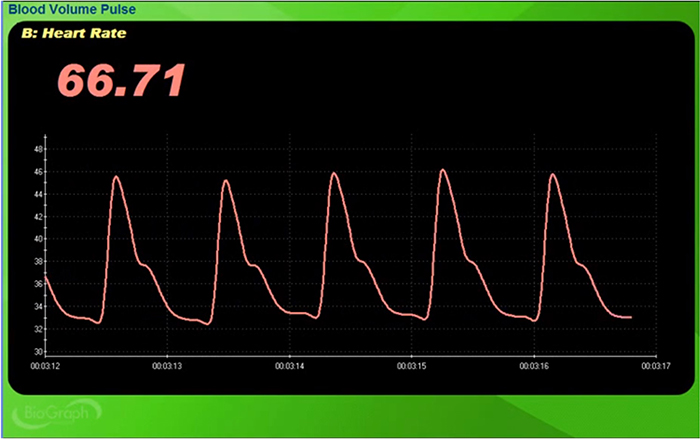
Understanding the two fundamental measurements derived from the BVP signal will help you interpret what your biofeedback display is actually showing. The interval between successive peaks (A) is called the interbeat interval (IBI), measured in milliseconds. This is the foundation for all HRV calculations. The peak-to-trough difference (B) shows the relative blood flow (Elgendi, 2012), which varies with sympathetic activation and vascular tone.
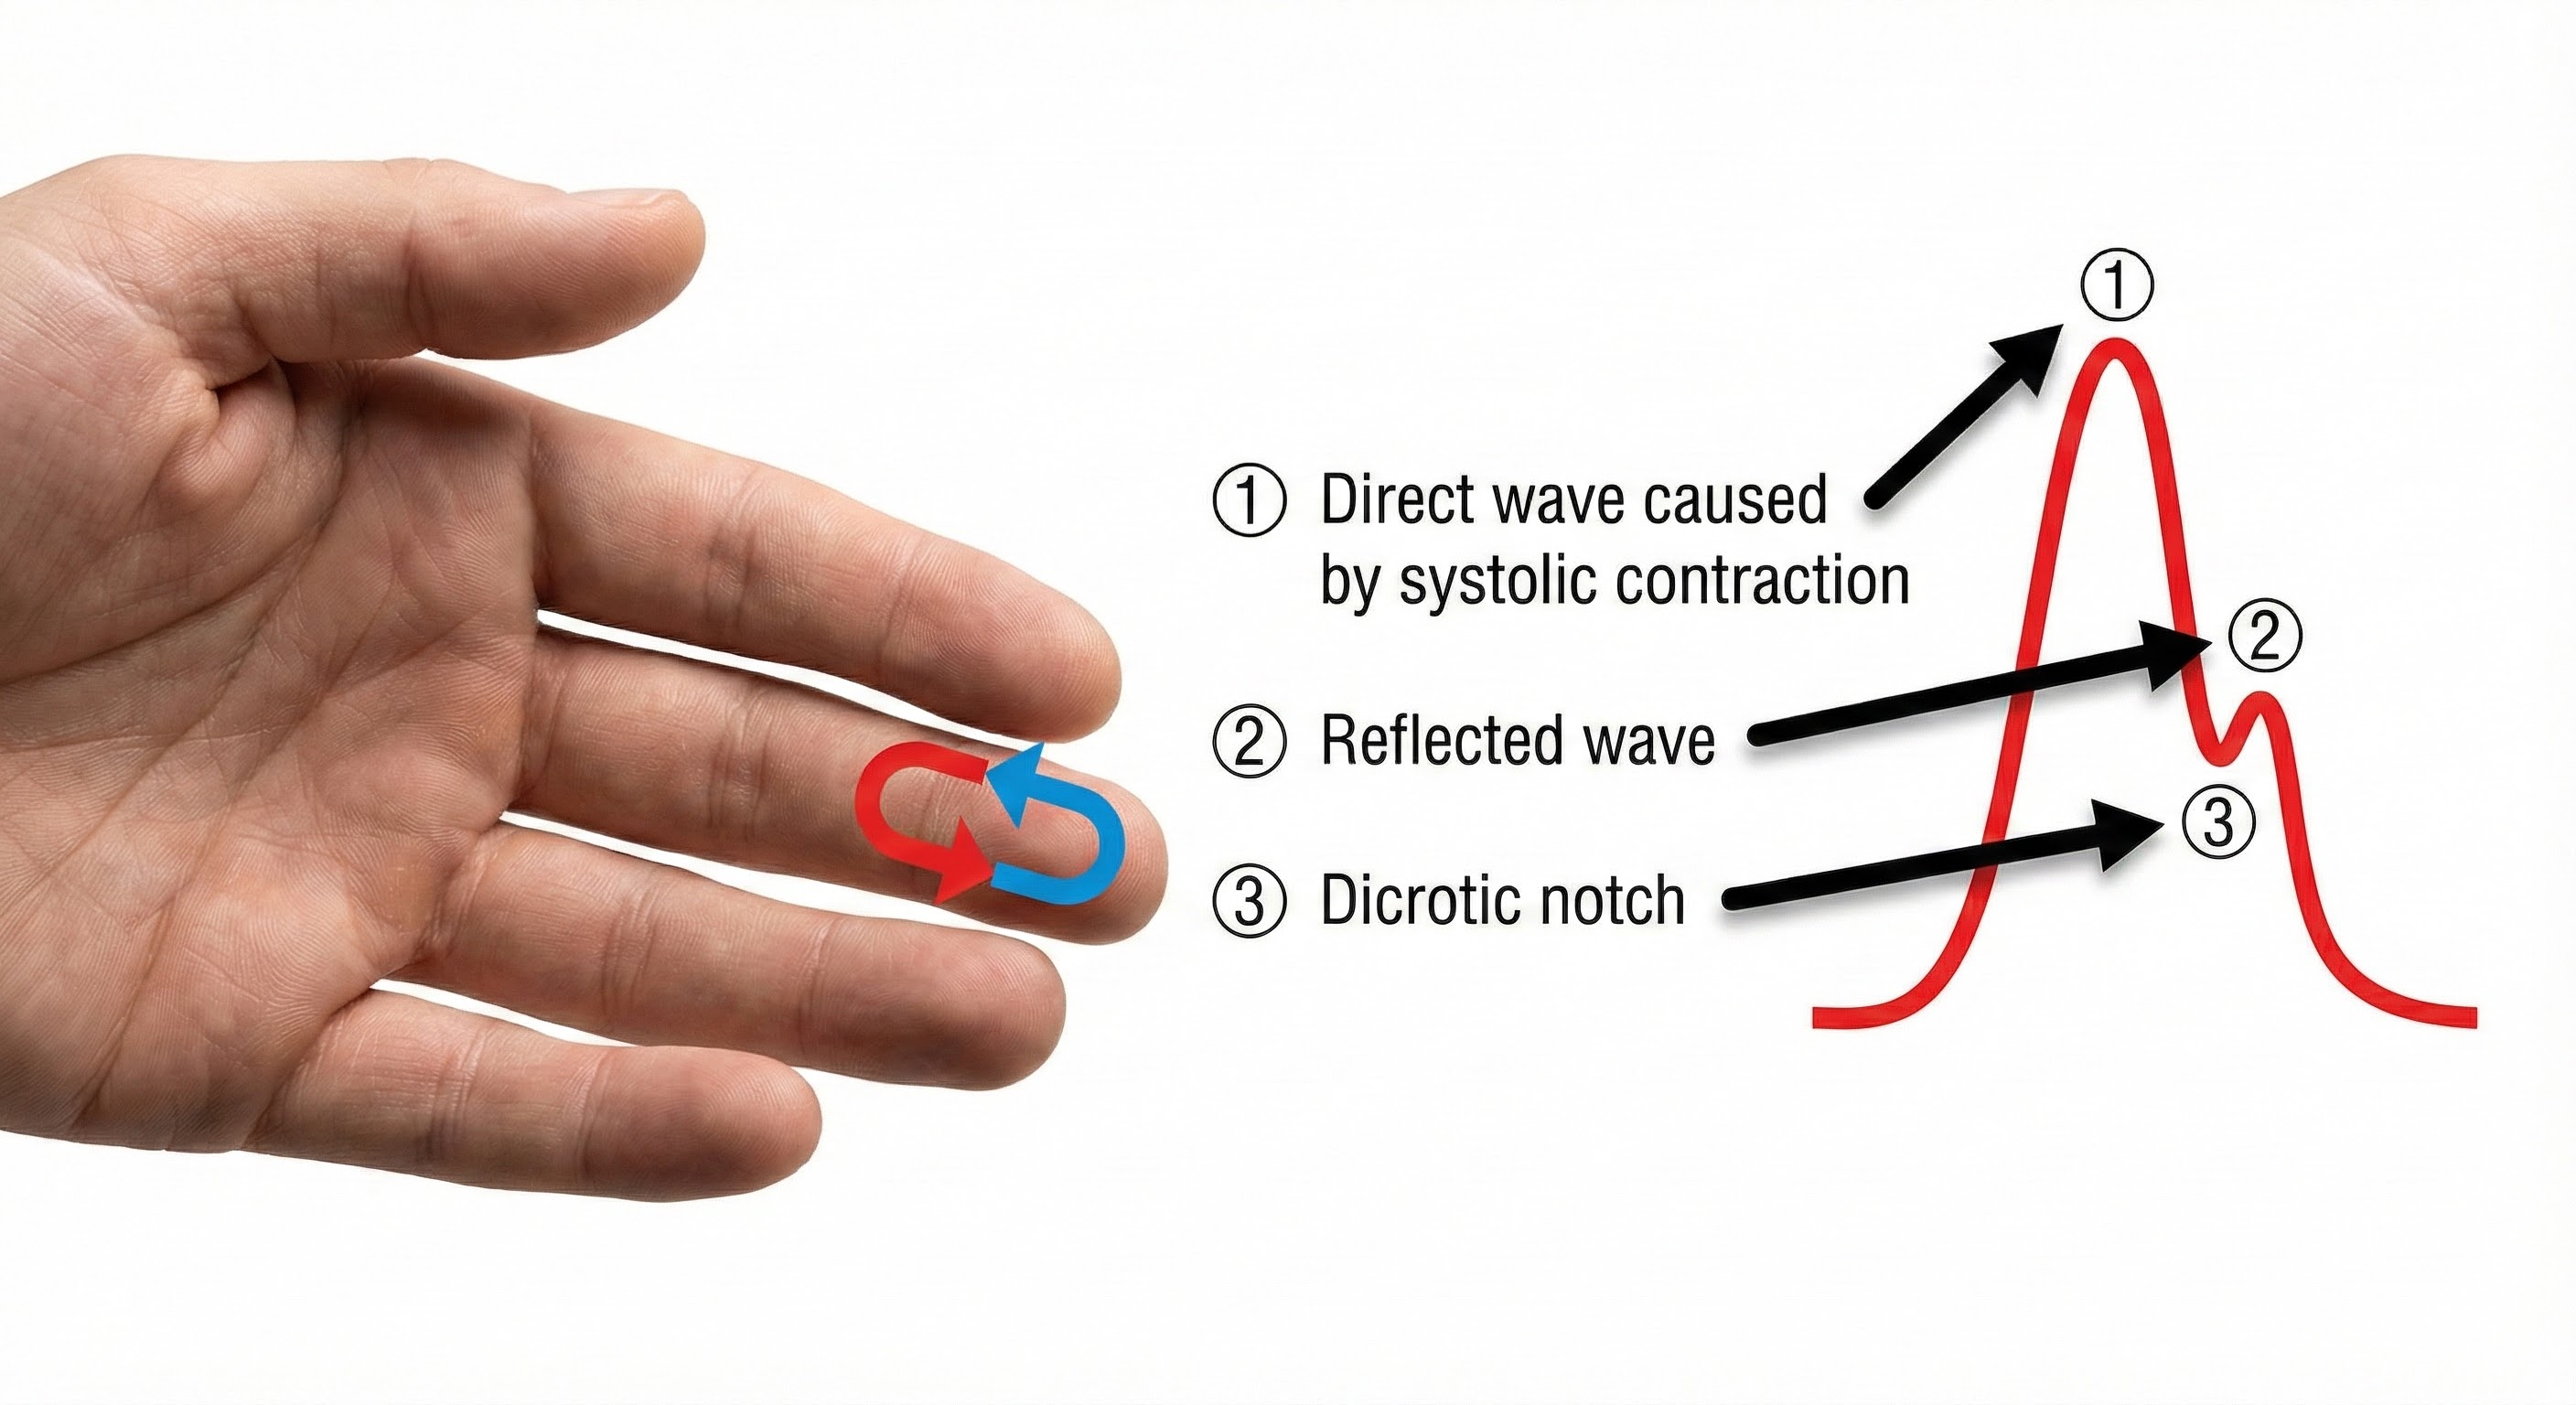
Blood appears red because it reflects red wavelengths. More light is reflected, and the BVP signal increases when the volume of blood increases. (1) As blood surges, more light is reflected, and the BVP signal peaks as the volume of blood increases. (2) As the pulse wave travels through the vascular tree, it is reflected by the lower body and appears as a second smaller peak. (3) The dicrotic notch is the gap between the direct and reflected waves.
The ear is less prone to artifact than the finger due to less movement, stronger signal, and less risk of vasoconstriction due to temperature. Since the ear is closer to the heart than is the finger, there is less opportunity for the vascular tone rhythm to contaminate HRV frequency-domain measurements in the VLF, LF, and HF ranges (Lehrer, 2018b).
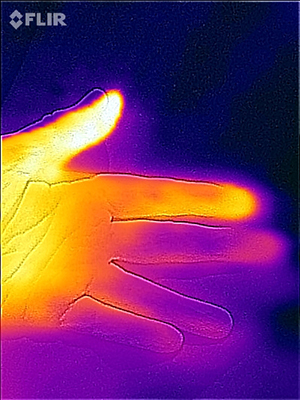
The thumb is an excellent site when a client's fingers are too small or have insufficient blood flow to detect a strong pulse (Peper, Shaffer, & Lin, 2010). In the Flir infrared image below, the thumb is brighter than adjacent digits because of its greater perfusion with blood.
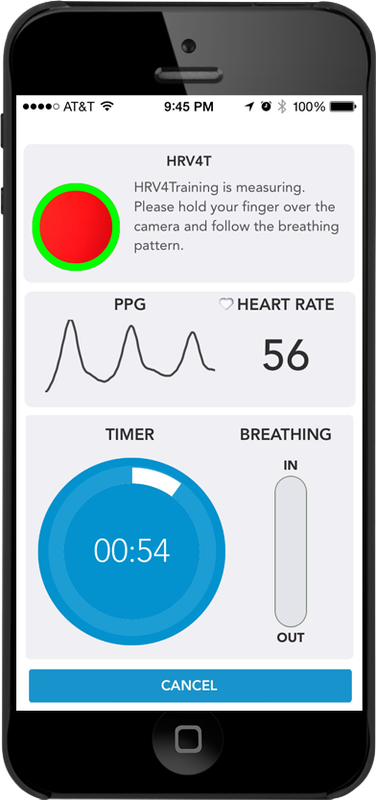
Smartphone cameras can detect instantaneous heart rate by placing a finger over the camera (e.g., HRV4T).
When inspecting the raw blood volume pulse signal, a strong signal is a wave with a "sharp upswing and a longer downswing" (Garber, 1986). The peak should be slightly rounded. Measurement units are arbitrary and proportional to the sensor's voltage output. The sensor's DC output is boosted by an operational amplifier. The DC signal is then routed to an integrator for quantification.
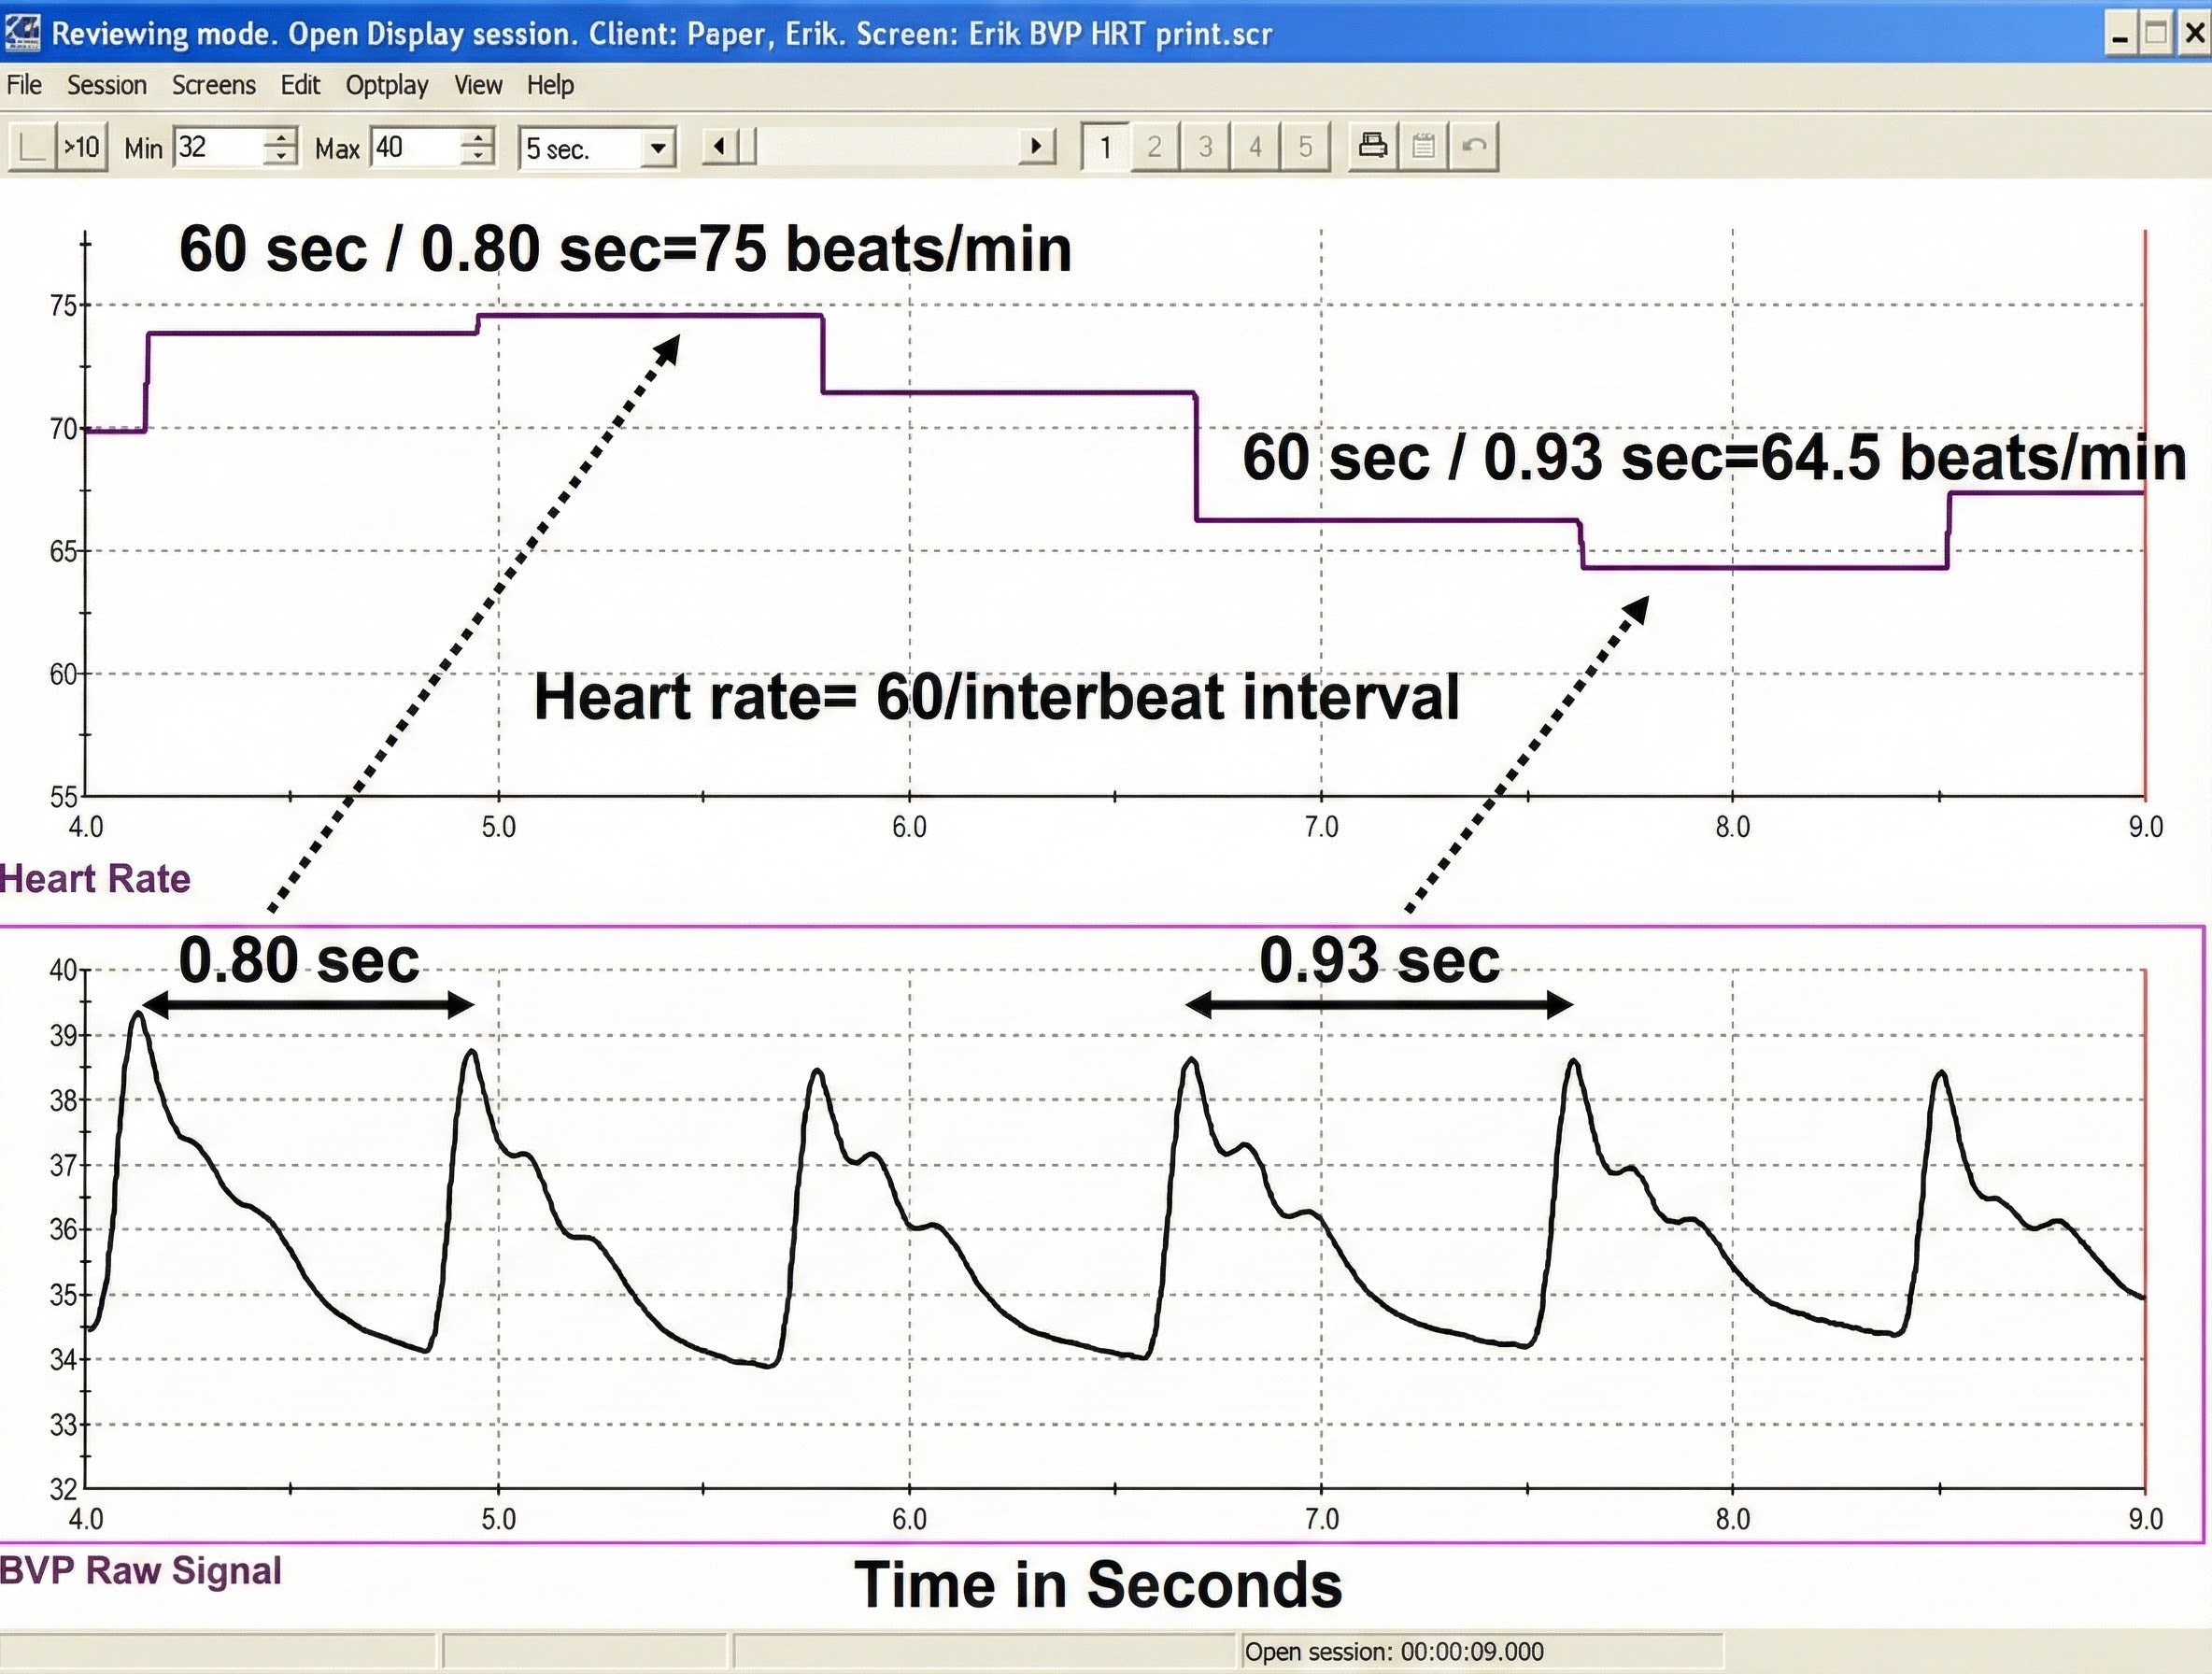
Each heartbeat briefly increases blood volume in the arteries and capillary beds. The blood volume pulse signal can be used to calculate HR (beats per minute) by measuring the interbeat interval (the period between successive heartbeats). Divide the time interval between peaks by 60 seconds to calculate HR (Peper, Harvey, Lin, Tylova, & Moss, 2007).
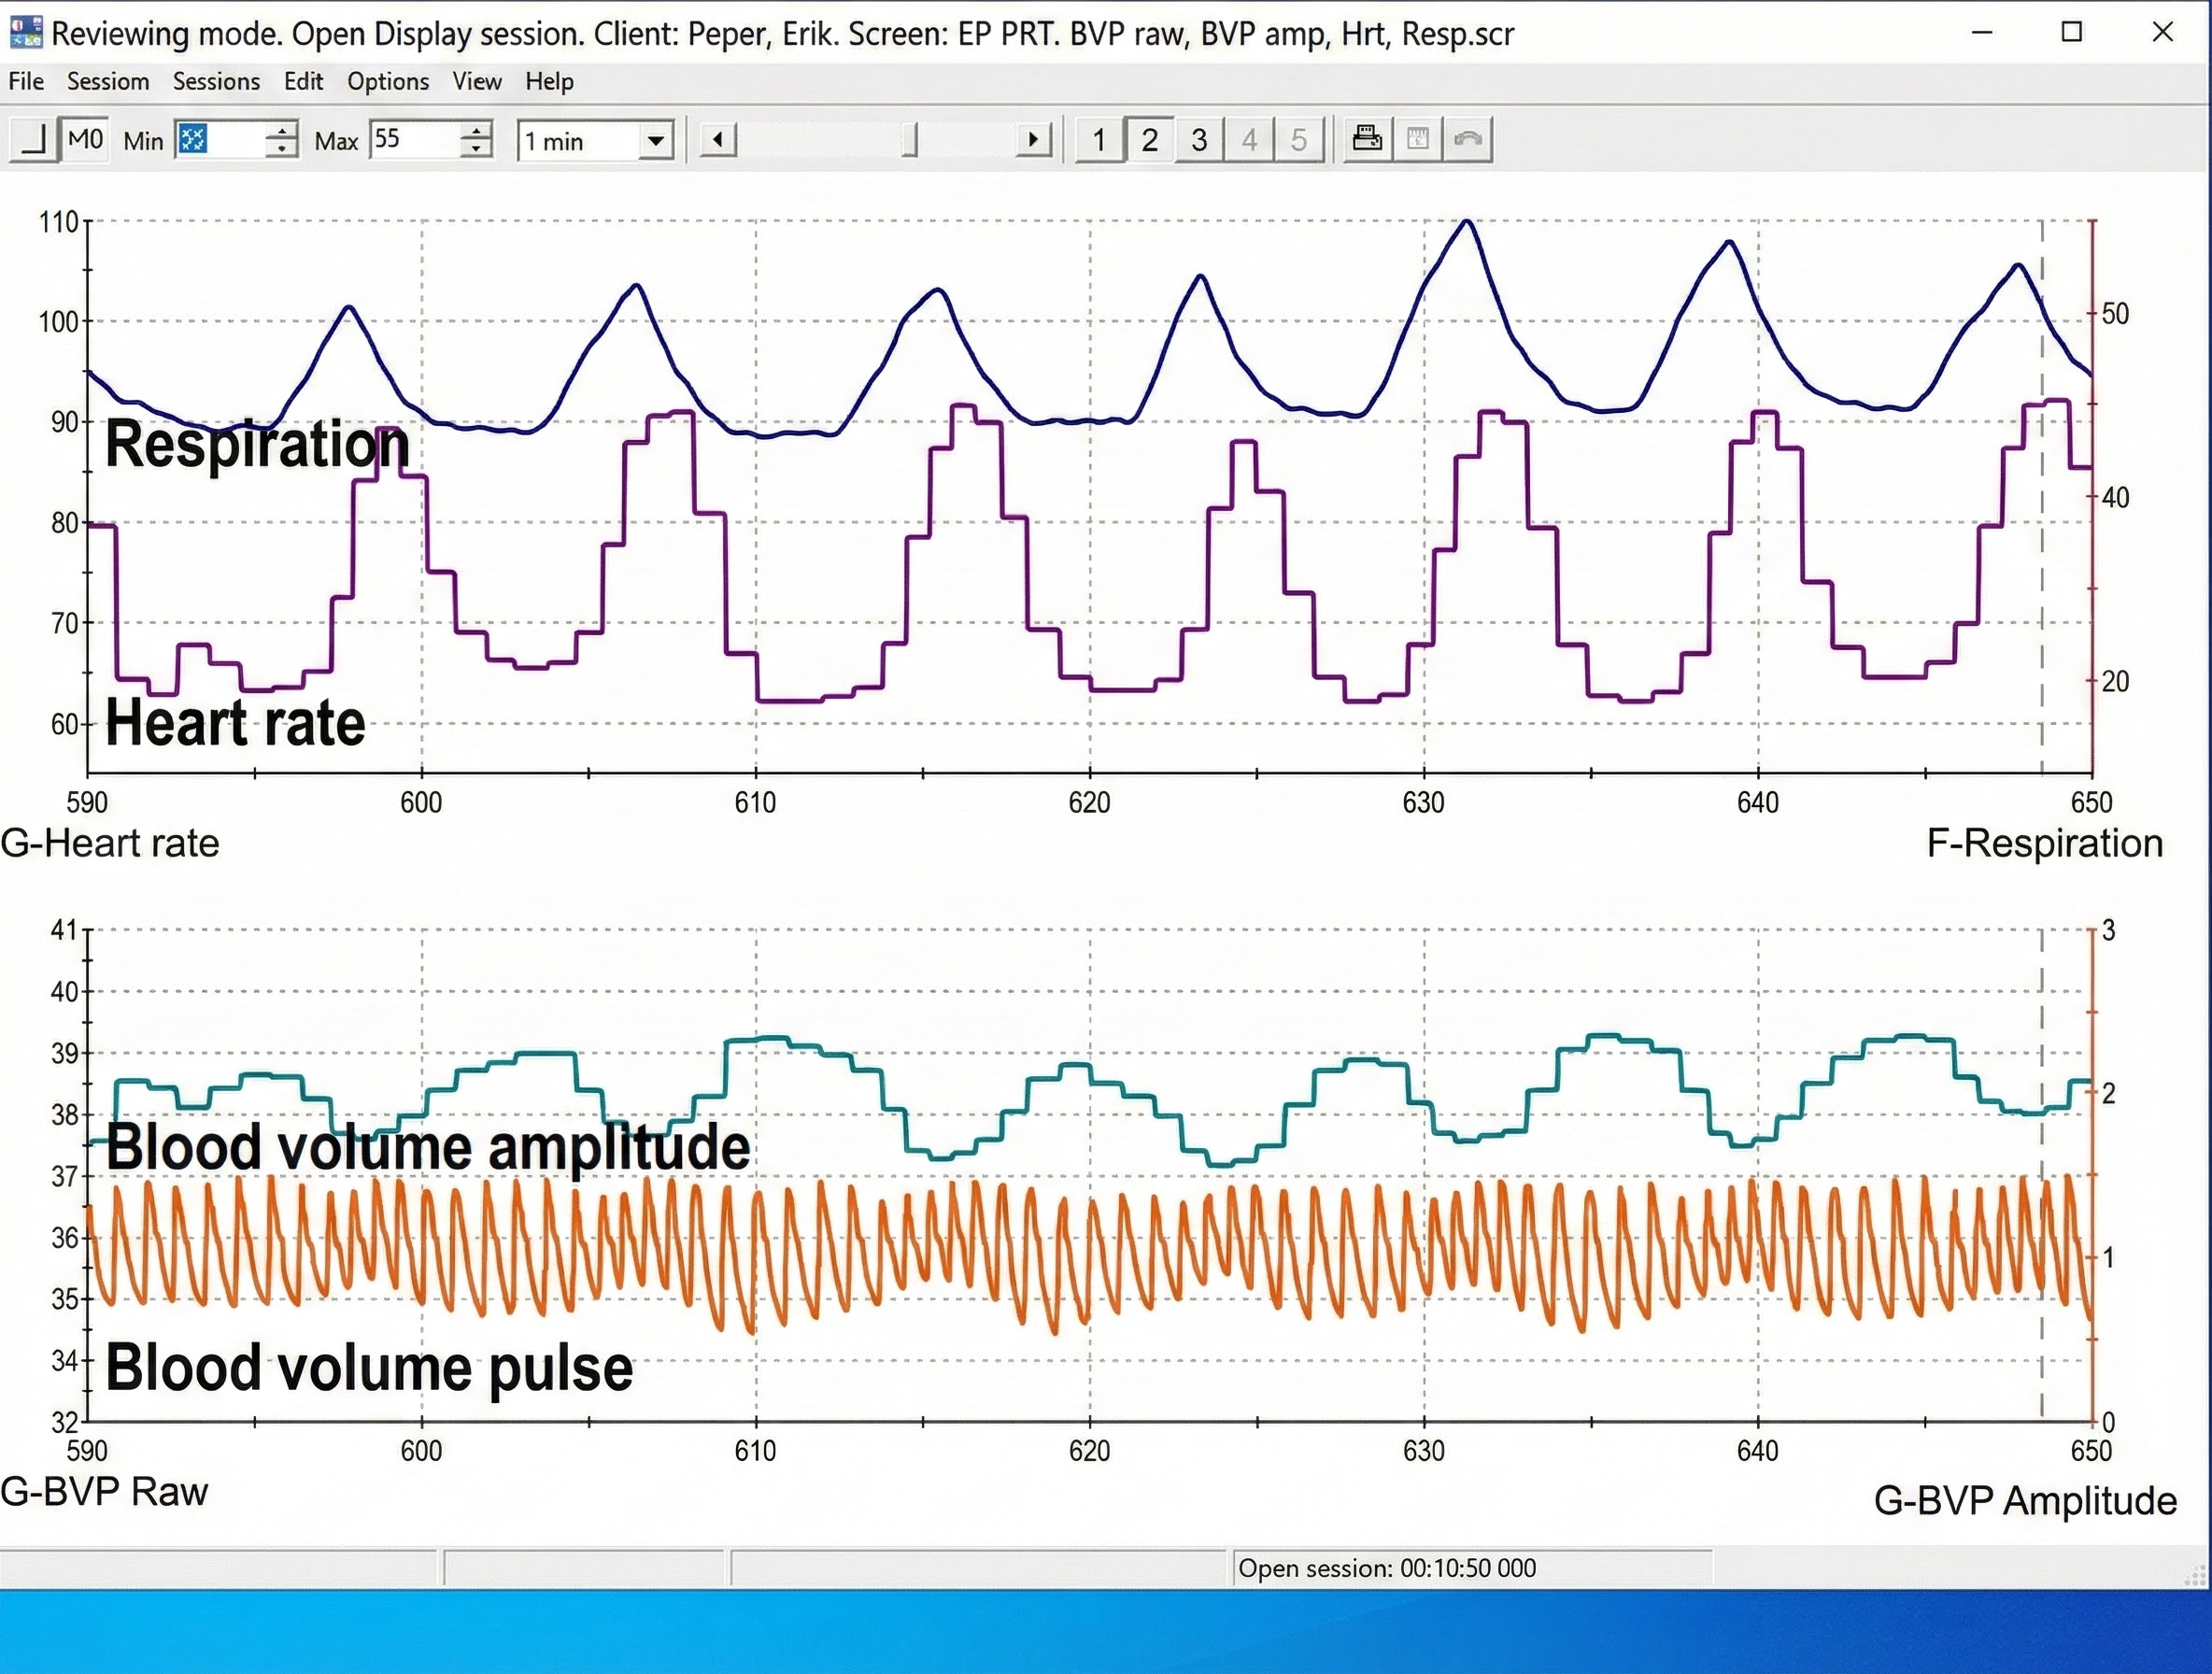
Clinicians may simultaneously monitor blood volume pulse, blood volume amplitude (relative volume of blood), HR, and respiration during training to increase HRV, as shown in the display below from Peper, Harvey, Lin, Tylova, and Moss (2007).
Consider using ear placement when finger readings prove difficult. The ear is less prone to artifact than the finger due to less movement, stronger signal from greater blood flow, and lower risk of vasoconstriction from temperature changes. This makes ear placement particularly valuable for anxious clients whose sympathetic activation causes cold, clammy fingers. Since the ear is closer to the heart than the finger, there is less opportunity for the vascular tone rhythm to contaminate HRV frequency-domain measurements in the VLF, LF, and HF ranges (Lehrer, 2018b). For clients with Raynaud's phenomenon or those receiving beta-blocker medications that reduce peripheral blood flow, ear placement may be the only viable option for PPG recording.
PPG sensors detect heart rate by measuring changes in light absorption or reflection as blood volume fluctuates with each heartbeat. The transmission technique passes infrared light through tissue and is commonly used for finger sensors, while the reflection technique captures light bounced back from tissue and enables placement on flat surfaces like the wrist. The interbeat interval between successive peaks provides the data for HRV calculations, while peak-to-trough amplitude reflects peripheral blood flow and sympathetic tone. Ear and thumb placements offer valuable alternatives when finger readings are difficult to obtain due to cold, anxiety, or medication effects.
Sampling Rate Considerations
How frequently your equipment measures the BVP signal affects the accuracy of your HRV calculations. Higher sampling rates capture more precise timing between heartbeats, which matters because HRV metrics depend on millisecond-level precision. Béres and Hejjel (2021) proposed a minimum 50-Hz PPG sampling rate to measure RMSSD and SDNN in healthy young participants without interpolation. At this rate, the sensor takes 50 measurements per second, providing timing accuracy of 20 milliseconds. However, mathematical interpolation, a technique that estimates values between actual measurements, can reduce the required sampling rate to 10-20 Hz while maintaining acceptable accuracy.
Current professional equipment typically exceeds these minimums by a comfortable margin: the HeartMath Institute's Inner Balance PPG sensor samples the BVP signal at 125 Hz, Mind Media's NeXus-10 MKII samples from 128-256 Hz, and Thought Technology Ltd.'s ProComp Infiniti samples at 256 Hz. These higher sampling rates provide a buffer against signal degradation and support advanced analysis techniques. Consumer smartphone apps and fitness trackers may sample at lower rates, contributing to discrepancies between clinical and home measurements.
Limitations of Photoplethysmography
There are four main limitations to blood volume pulse measurement that you should understand when working with clients. Recognizing these constraints helps you set appropriate expectations and select alternative methods when needed.
First, this blood flow index only describes blood volume under the sensor. The blood volume in one area can be vastly different from another location on the same hand. A client with cold fingers but warm palms will show different readings depending on sensor placement. This localized measurement can be both a limitation and an advantage: it limits generalizability but allows targeted assessment of specific vascular beds.
Second, blood volume pulse measurements are relative rather than absolute. Unlike hand temperature, where 95°F means the same thing regardless of which thermistor you use, absolute BVP values cannot be compared across different individuals or even across sessions with the same client using different equipment. However, relative changes within a single recording session are meaningful, and trends can be compared across individuals (Peper, Shaffer, & Lin, 2010). Focus on the direction and pattern of change rather than absolute numbers.
Third, BVP and ECG methods may yield different HRV values when clients experience marked sympathetic activation. ECG values will be more accurate since electrical conduction is not affected by vasoconstriction. Imagine a first-time client with generalized anxiety disorder who arrives for her initial biofeedback session: her cold, clammy fingers may produce unreliable BVP readings with low amplitude and missed beats, even though her ECG signal remains clear and robust. The discrepancy arises because her sympathetic nervous system is constricting peripheral blood vessels, reducing the signal available for the PPG sensor while having no effect on cardiac electrical activity.
Finally, PRV may inflate HRV values and be a poor surrogate for ECG when participants stand, perform slow-paced breathing, or have low HRV (Constant et al., 1999; Hemon & Phillips, 2016; Jan et al., 2019; Medeiros et al., 2011). This limitation is particularly relevant for HRV biofeedback training, where slow-paced breathing is a core intervention. During slow breathing at 5-7 breaths per minute, the respiratory-induced swings in blood pressure cause the pulse wave to arrive at the finger at varying delays, introducing variability that does not reflect actual changes in the timing of heartbeats. Clinicians should be aware that HRV values obtained during slow-paced breathing with PPG sensors may overestimate the true cardiac variability.
Advantages of Photoplethysmography
Despite these limitations, photoplethysmography offers distinct advantages that make it an essential tool in the biofeedback clinic. A PPG sensor can provide high-resolution feedback when temperature biofeedback shows minimal change. PPG sensors are more sensitive to rapid blood volume changes than thermistors, which respond slowly to temperature shifts due to thermal mass.
Blood volume pulse could easily drop 50-60% in a patient who is a vascular responder, an individual whose fingers cool when challenged by stressors due to sympathetically-mediated vasoconstriction. This sensitivity makes PPG valuable for stress profiling and for clients learning to recognize early signs of sympathetic activation. When a client experiences a plateau in temperature biofeedback and ceases to warm further, a clinician could switch to blood volume pulse biofeedback to continue progress if the monitored hand is not significantly vasoconstricted (Peper, Shaffer, & Lin, 2010). This therapeutic flexibility allows you to maintain client engagement and momentum even when one modality reaches its limits.
Consider Maria, a 45-year-old patient with fibromyalgia and chronic cold hands. During temperature biofeedback, her hand temperature rises from 78°F to 84°F over the first three sessions but then plateaus despite continued practice. Her thermal feedback has reached a ceiling, but she still shows room for improvement in peripheral blood flow. By adding BVP biofeedback, you can continue training vasodilation using a more sensitive measure. Maria can see her blood volume amplitude increase with each breath, reinforcing the same relaxation response even when temperature changes become imperceptible.
Check Your Understanding
- What characteristics distinguish a strong BVP signal from a weak one, and what waveform features should you look for?
- Why might PRV be a poor surrogate for ECG-derived HRV during slow-paced breathing, and how does this affect your interpretation of training outcomes?
- Under what circumstances would you recommend switching from temperature biofeedback to BVP biofeedback?
- What is the minimum recommended sampling rate for PPG sensors, and why does this matter for HRV measurement accuracy?
Preparing for PPG Recording
Skin Preparation
Unlike ECG recording, which requires reducing skin impedance for electrical signal detection, minimal skin preparation is needed for PPG since the sensor detects infrared light instead of an electrical potential. There are no conductive gels to apply or skin surfaces to abrade, making setup faster and more comfortable for clients.
🎧 Mini-Lecture: BVP Skin Preparation
Ask your clients to wash their hands so that dirt will not occlude the sensor's transducer window (Shaffer & Combatalade, 2013). This simple step can make the difference between a clean signal and one contaminated by debris. Oils, lotions, or residue from food can coat the sensor surface and scatter light, reducing signal quality. For clients who have been gardening, painting, or working with their hands, a thorough hand washing is essential.

For PPG sensors that pass infrared light through the finger, instruct clients to avoid dark fingernail polish, which will block light transmission. Clear polish is acceptable, but black, navy, burgundy, or other dark colors can significantly degrade signal quality by absorbing infrared light before it reaches the photodetector. Gel manicures and acrylic nails can also interfere with transmission-mode sensors, making the thumb or earlobe better alternatives for clients who prefer to keep their nail polish intact.

PPG Sensor Placement Techniques
Photoplethysmograph sensor attachment is critical since readings are sensitive to limb position, 50/60Hz electrical interference, ambient light, movement, and pressure. Taking time to achieve proper placement pays dividends throughout the session by reducing artifacts and troubleshooting time. A few extra minutes of careful setup prevents the frustration of chasing artifacts mid-session.
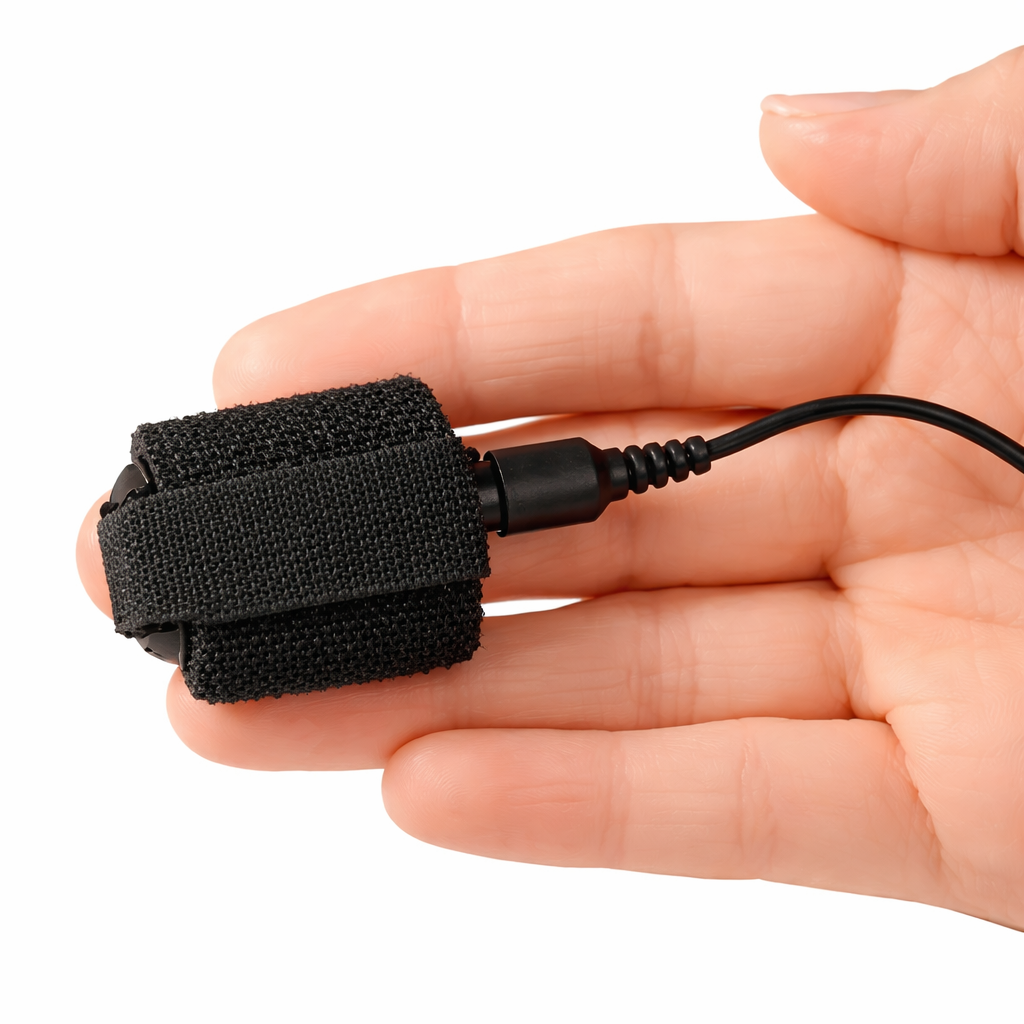
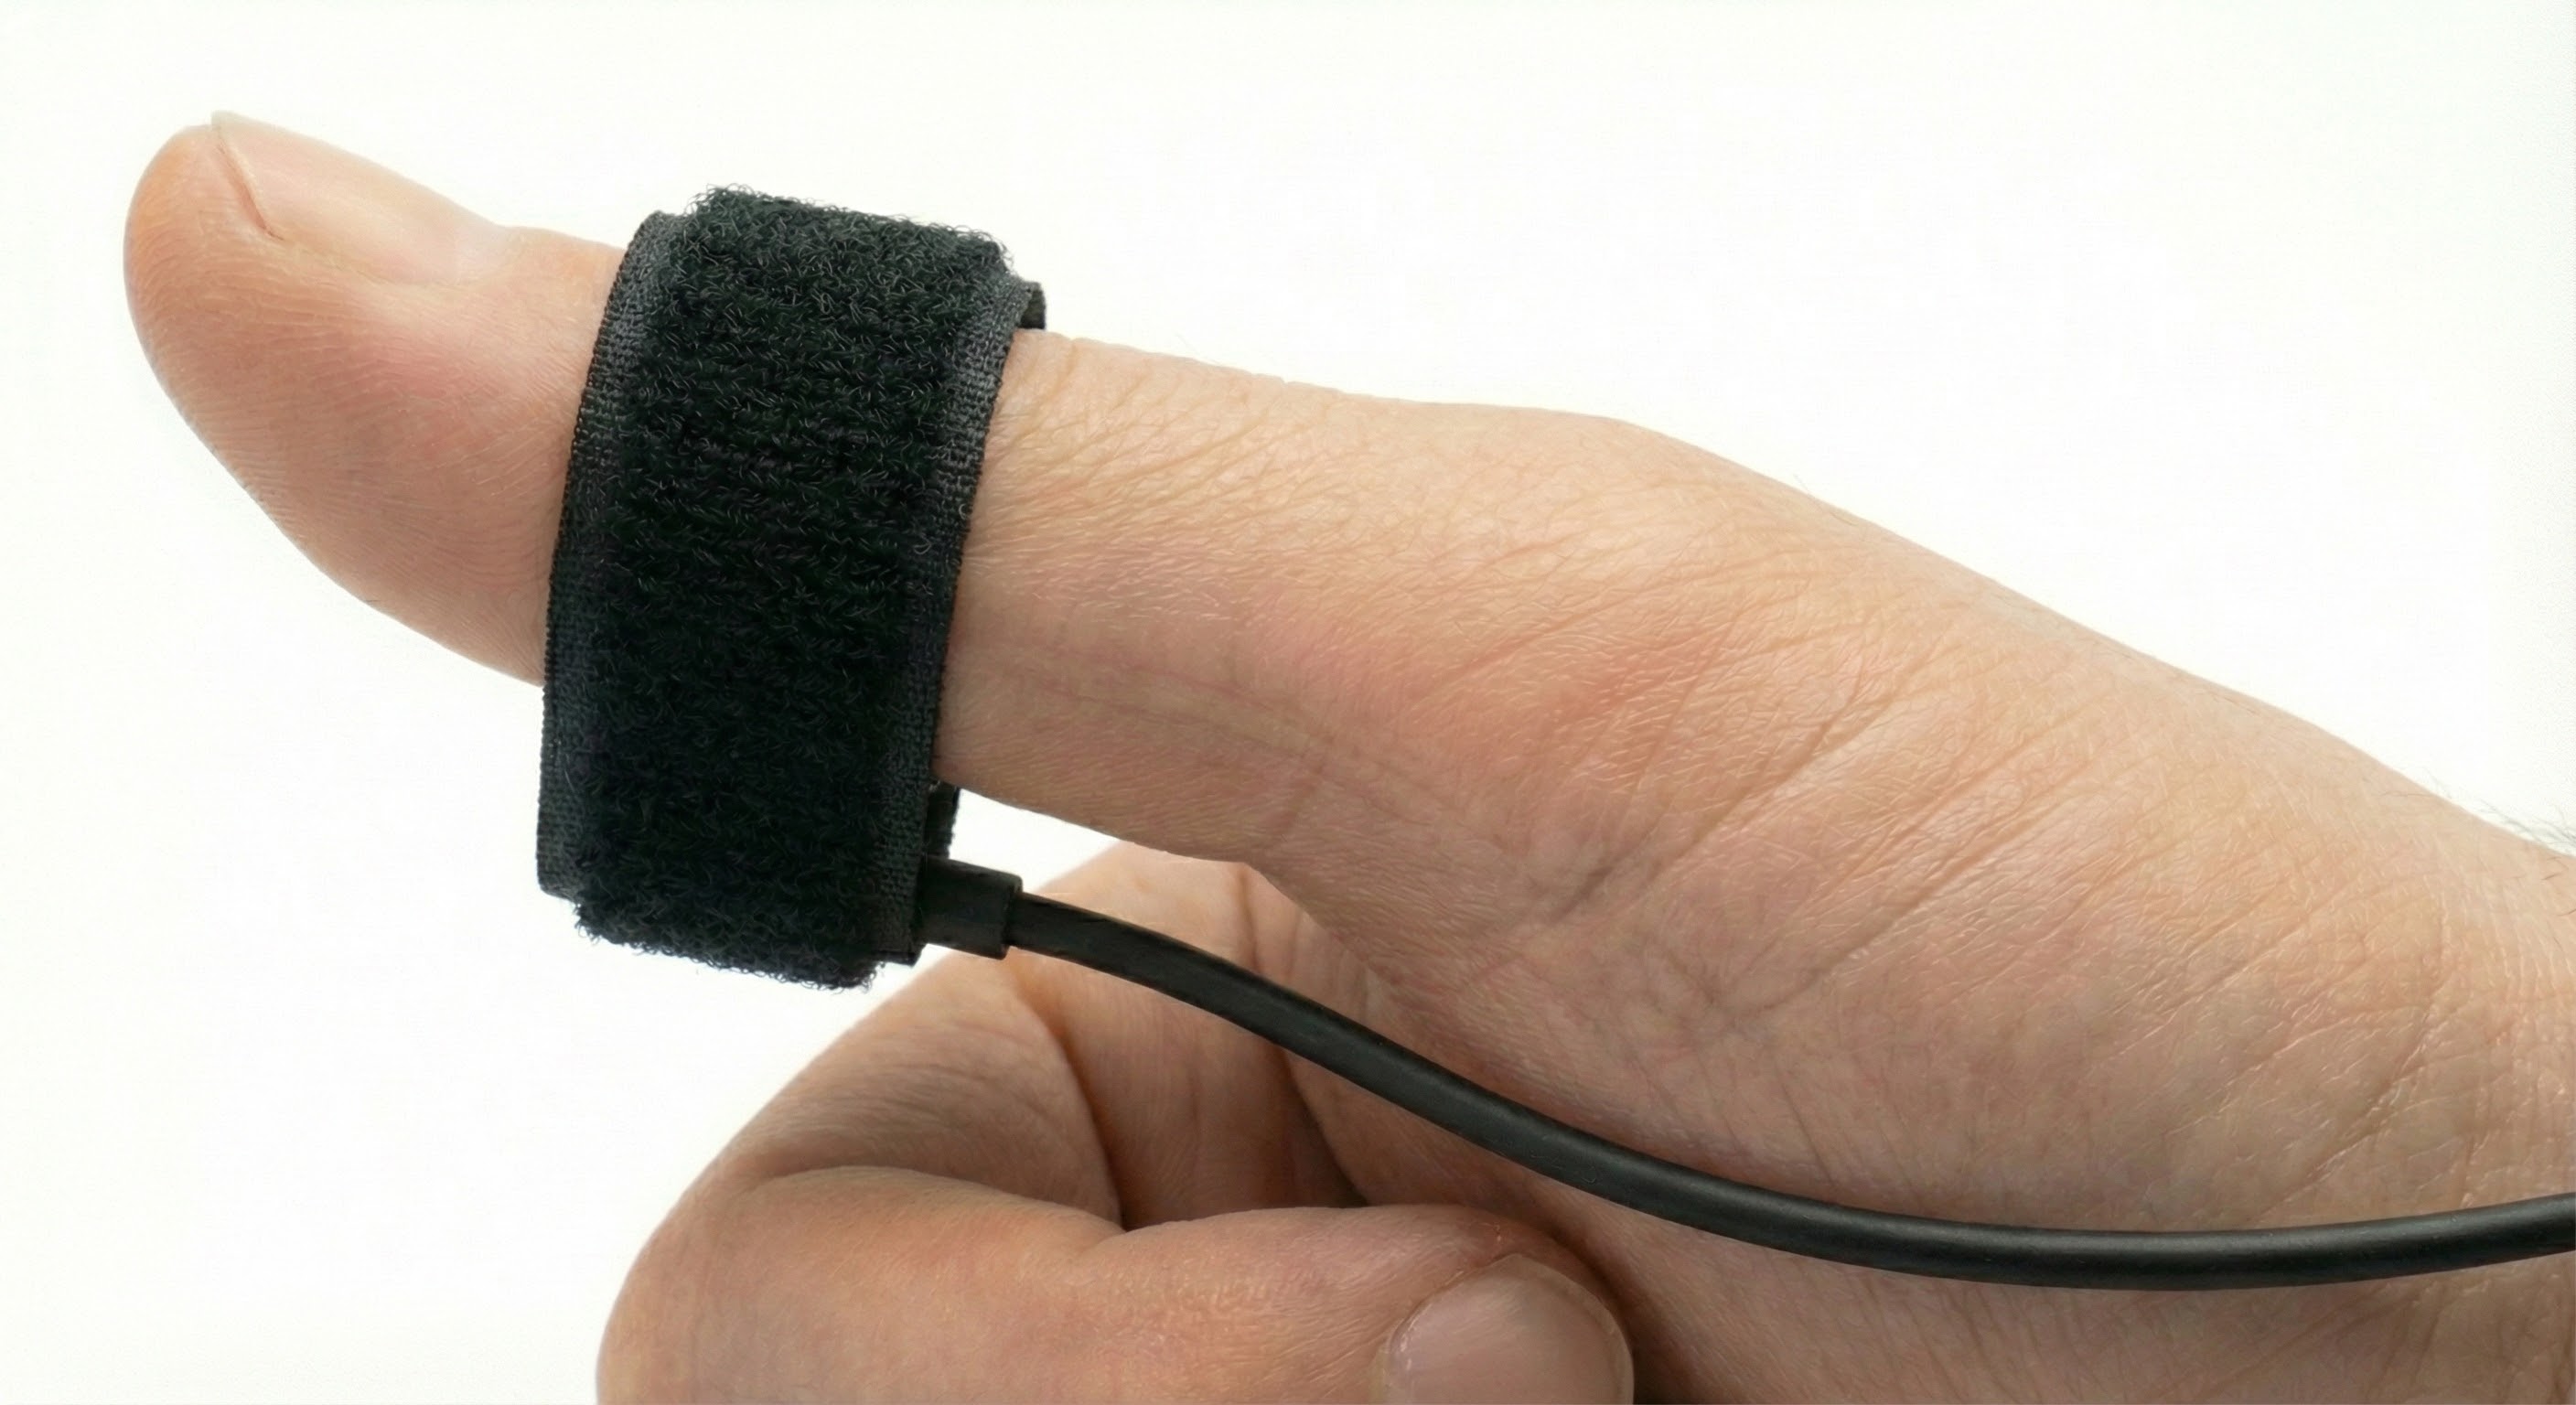
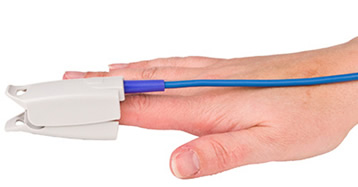
For finger placements, attach the PPG sensor using a Velcro band or Coban tape (a self-adhesive elastic bandage) to the palmar side of a larger finger and confine the sensor to only one finger segment. Avoid placing the sensor across a joint, where movement will cause artifact. Use the thumb when the fingers are small or blood flow is compromised, such as when clients present with cold hands from anxiety, Raynaud's phenomenon, or beta-blocker medications (Peper, Shaffer, & Lin, 2010).
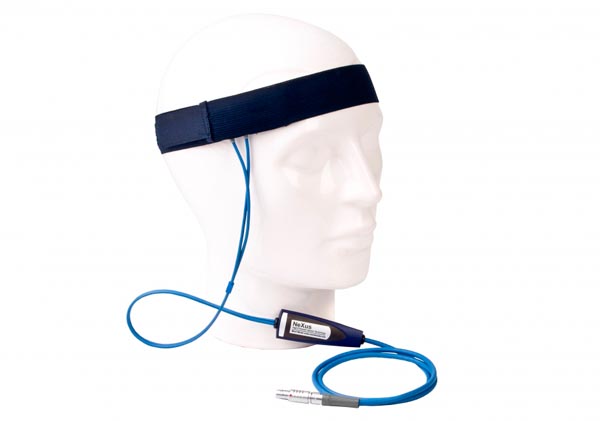
For temporal artery placement, lightly press your first or second finger to detect a pulse between the corner of the eye and eyebrow near the hairline. The temporal artery runs close to the surface here, providing a strong signal that is relatively immune to cold-related vasoconstriction. When displayed on a computer screen, the best location will produce the highest amplitudes and cleanest signals. This placement is particularly useful for clients who need their hands free during training or who have compromised peripheral circulation.
Understanding How Limb Position Affects Readings
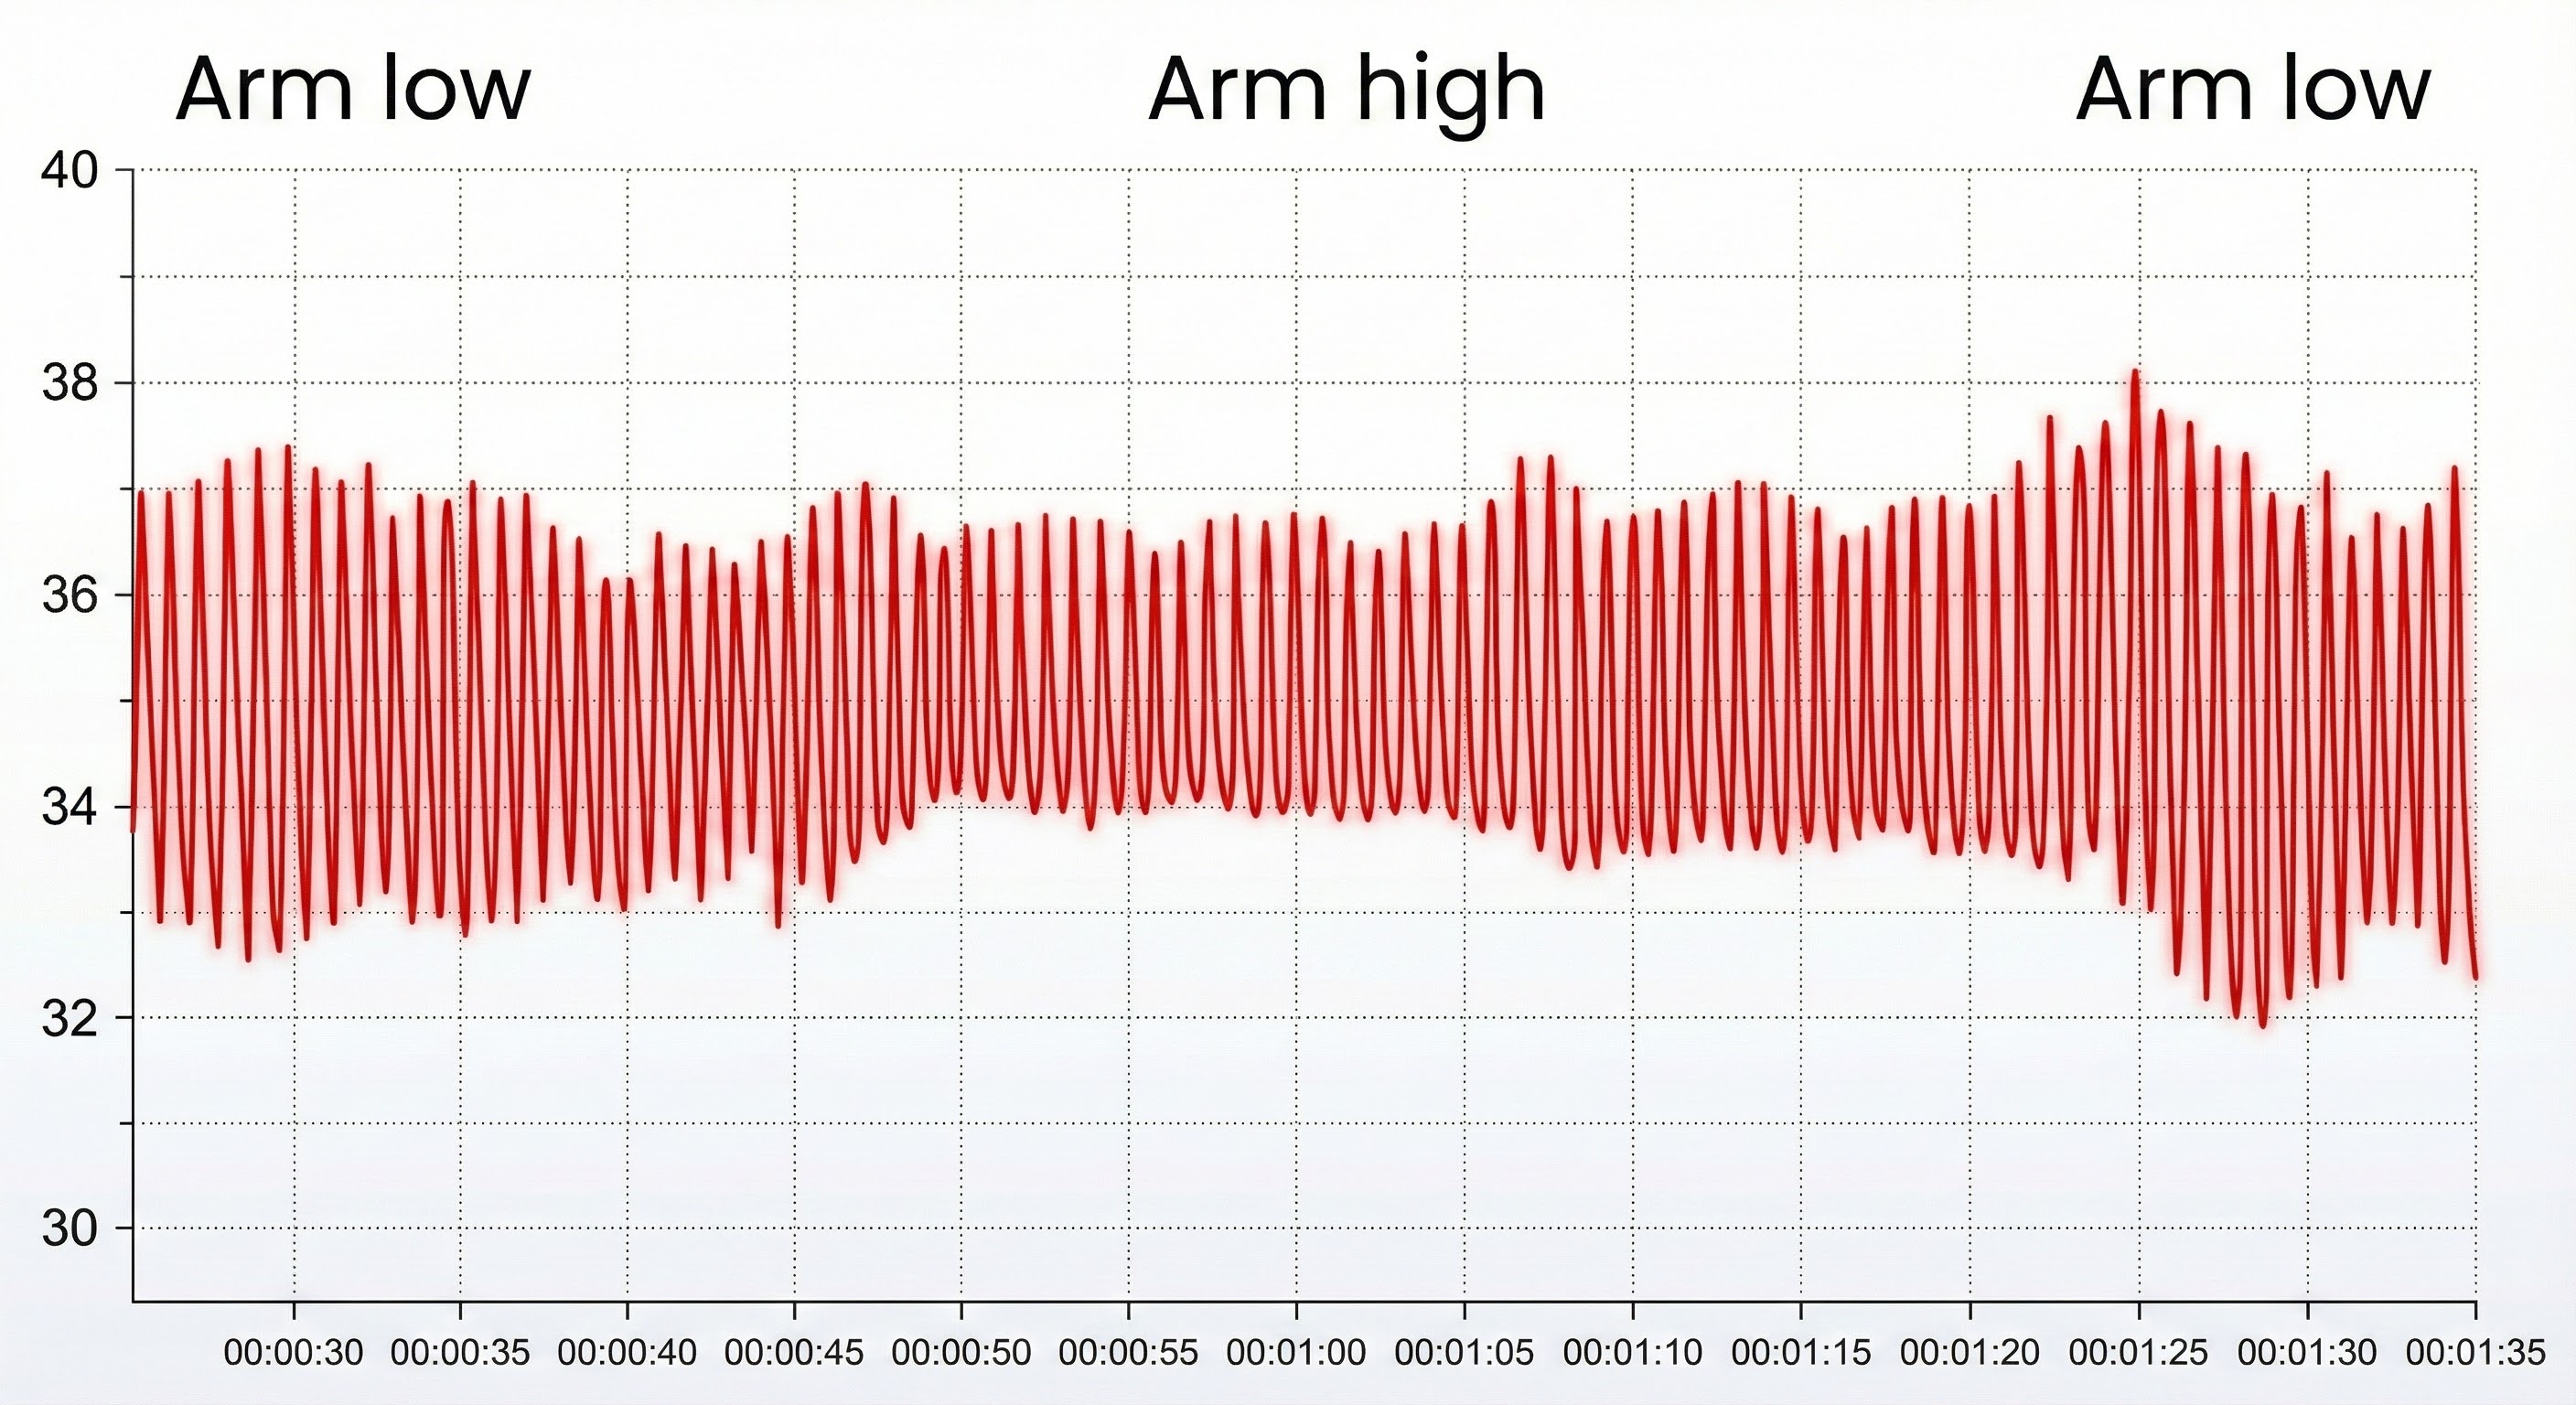
Sensor position relative to the heart strongly affects blood volume pulse due to the effects of gravity on venous return and arterial pressure. If the PPG sensor is placed on a limb below the heart, blood pools in the veins, and BVP signal amplitude increases. You can take advantage of this phenomenon when signal amplitudes are weak (Lehrer, 2018b). Simply lowering the client's hand to their lap or the armrest may dramatically improve signal quality.
Conversely, if the limb is placed above the heart, gravity assists venous return, blood drains from the peripheral tissues, and the signal amplitude decreases. These changes appear to reflect venous filling (Peper, Shaffer, & Lin, 2010). Understanding this relationship helps you troubleshoot weak signals and verify proper sensor function through the tracking test described later in this chapter.
Ryan, a veteran being treated for PTSD at your VA clinic, arrives for his session complaining that his PPG signal looks weak and erratic. Before assuming equipment problems or blaming his anxiety, check his arm position. If he has been resting his hand on a high armrest with his elbow above heart level, simply repositioning his arm to rest on his lap may immediately strengthen the signal. This simple troubleshooting step saves time and demonstrates to Marcus that you understand the technology well enough to solve problems efficiently.
Successful PPG recording requires attention to skin preparation, sensor placement, and limb position. Clean hands and avoiding dark nail polish optimize light transmission. Sensor placement options include fingers (palmar surface avoiding joints), thumb (for cold hands or small fingers), earlobe (for movement reduction and consistent blood flow), and temporal artery (for hands-free training). Positioning the monitored limb below heart level increases signal amplitude through venous pooling, while positioning above the heart decreases amplitude through gravity-assisted venous return. Understanding these principles allows rapid troubleshooting of weak or erratic signals.
Recognizing and Managing BVP Artifacts
Artifacts are false values that contaminate your recordings, potentially invalidating your HRV measurements and misleading clinical interpretation. They originate from the client's body (ectopic beats and arrhythmias), actions (movement and talking), environment (line current and ambient light), and hardware limitations (light leakage and pressure). Learning to recognize and minimize these artifacts is essential for obtaining valid HRV measurements. A beautiful-looking HRV graph means nothing if the underlying data is contaminated with undetected artifacts.

Inspect the raw BVP signal for cardiac conduction, cold, light, line interference, movement, and pressure artifacts before interpreting any derived metrics. Think of artifact inspection as quality control for your biofeedback data. Just as a chef tastes food before serving, you should examine your raw signal before interpreting HRV values. Software-calculated metrics like SDNN and RMSSD cannot distinguish between genuine heart rate variability and artifact-induced distortion.

Use clean BVP recordings as a reference point. Knowing what a good signal looks like makes it easier to spot when something has gone wrong. Study the examples throughout this section until you can recognize artifact patterns at a glance.
Understanding Short-Term HRV Values
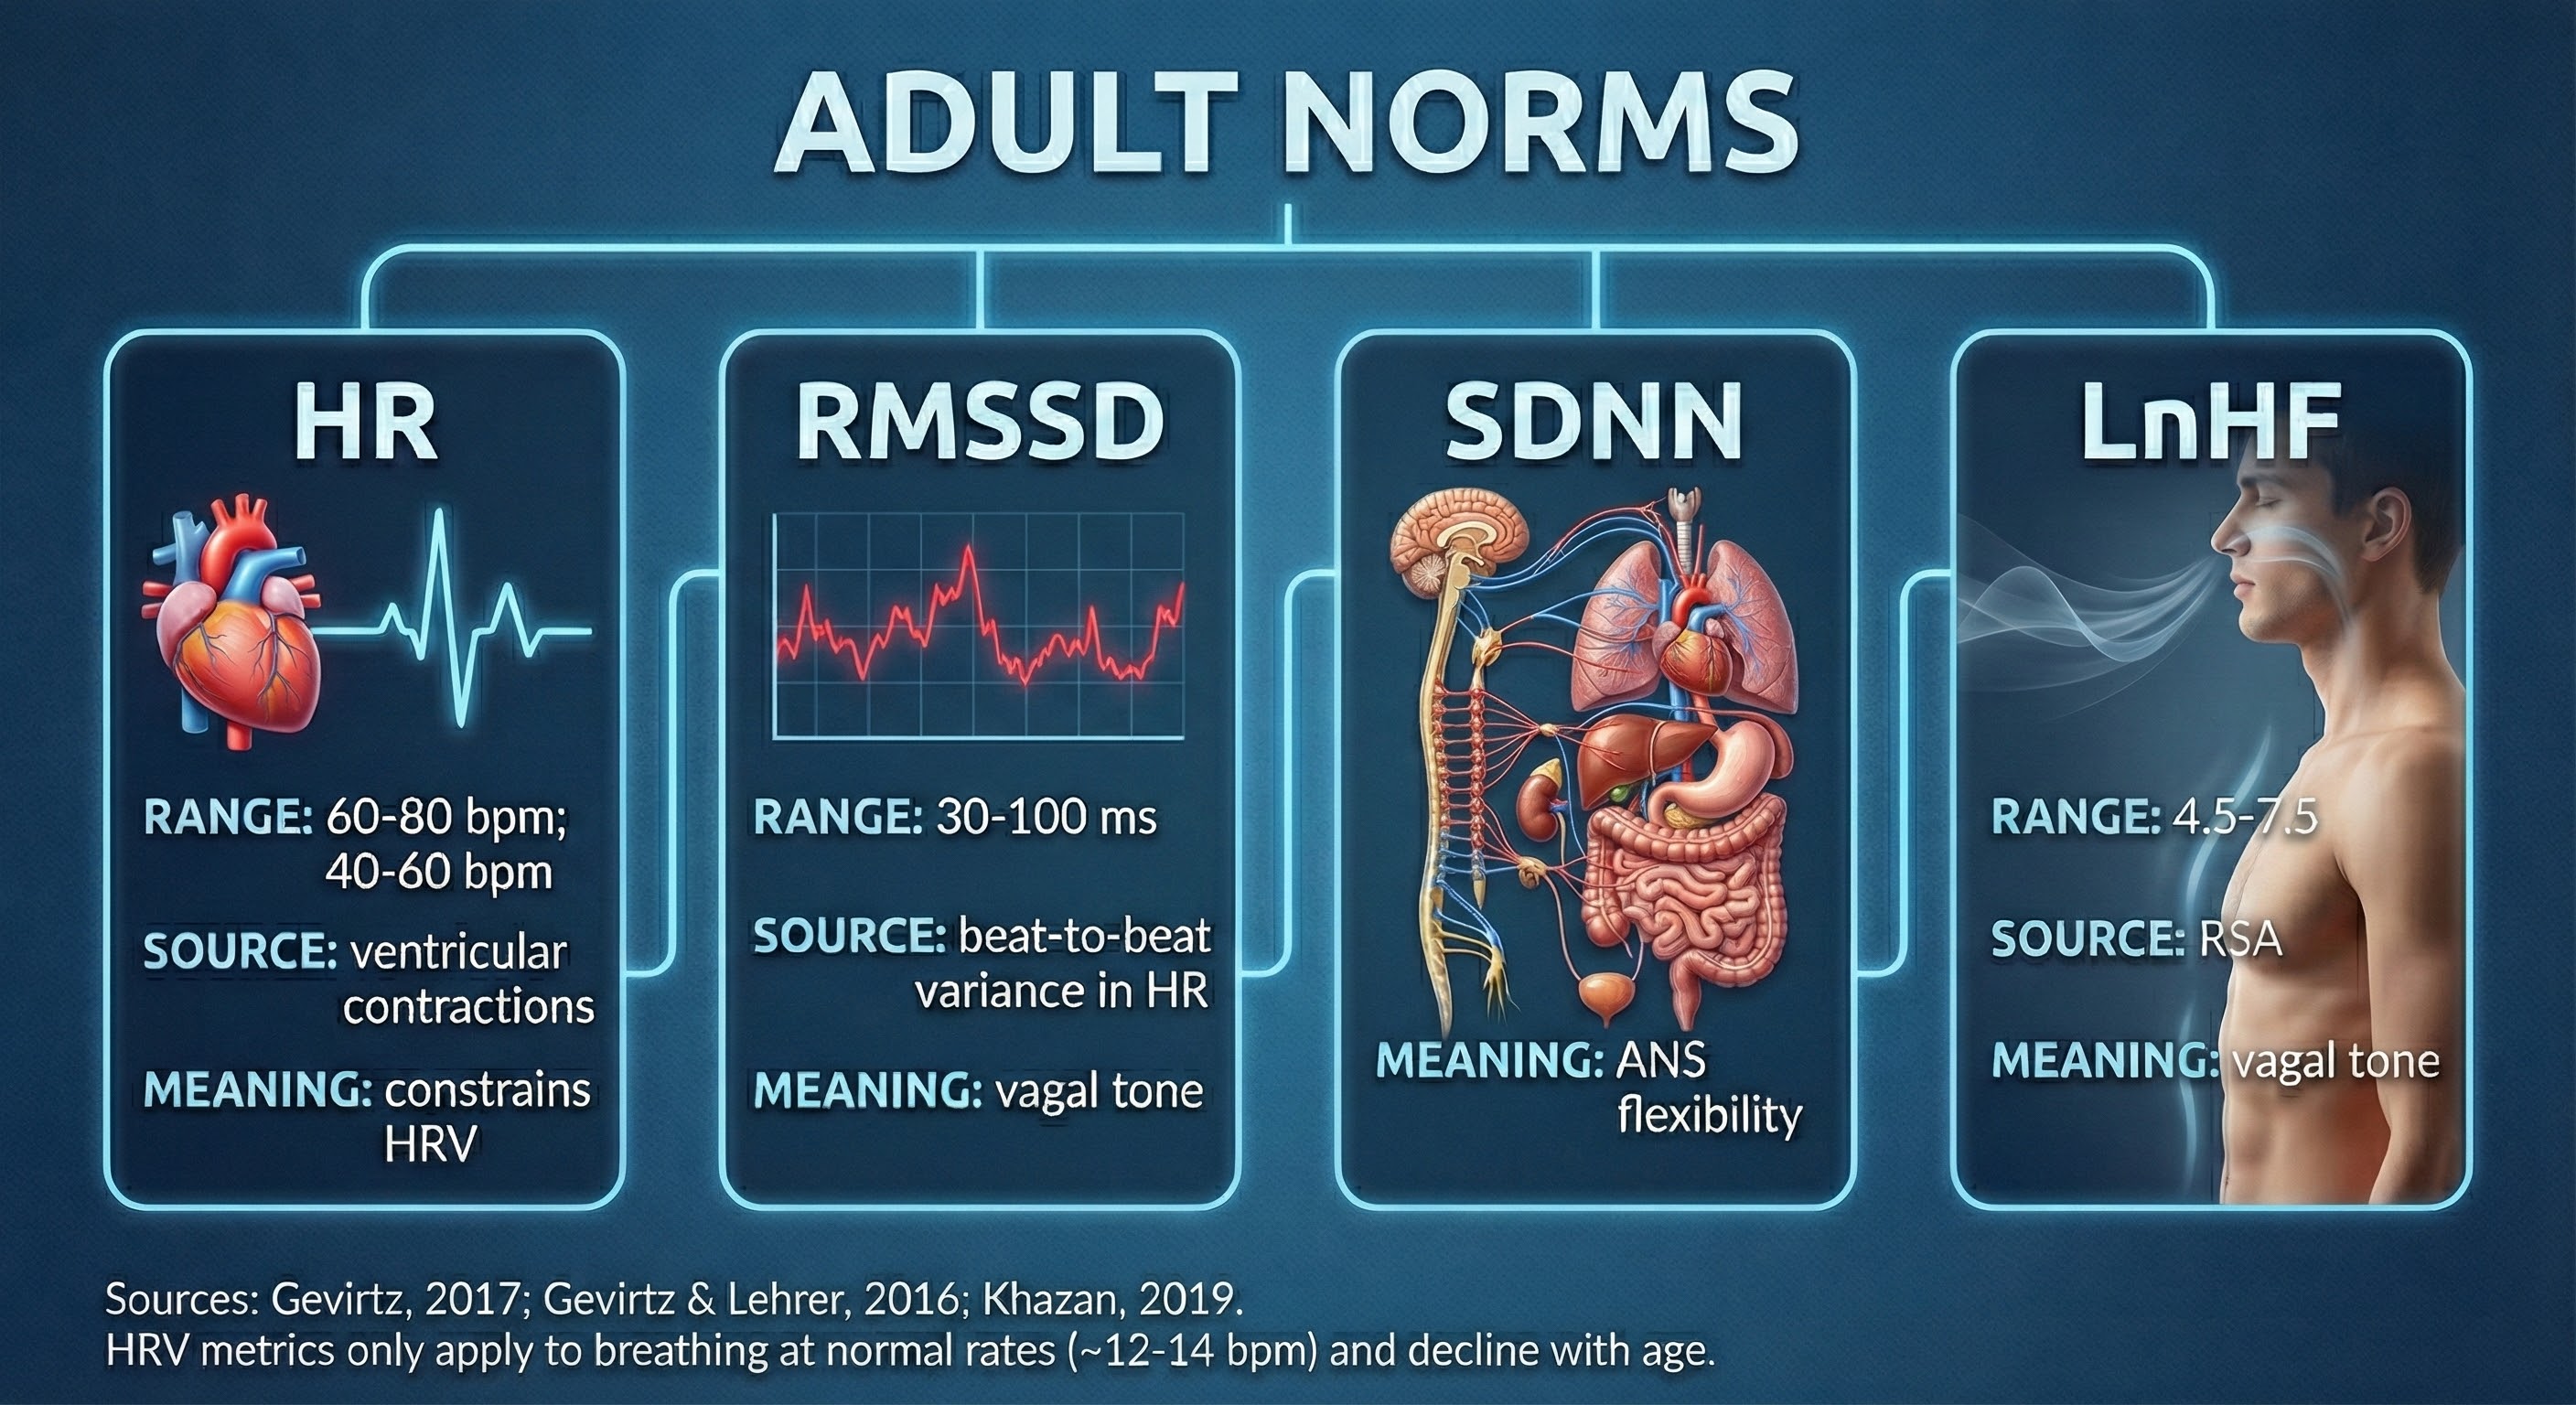
Recognize typical short-term (approximately 5-minute) HR and HRV values to ensure that your readings make sense. If you see values that fall far outside normal ranges, artifact contamination is a likely culprit. An SDNN of 250 ms in a sedentary 60-year-old should raise immediate suspicion, just as a resting heart rate of 150 bpm would in an otherwise healthy client.
🎧 Mini-Lecture: Short-Term HRV Values Are Proxies
Short-term values are proxies of 24-hour values and should never be directly compared with 24-hour norms. This distinction matters clinically because 24-hour values are typically greater in magnitude and can predict morbidity and mortality, while most short-term values cannot (Nunan, Sandercock, & Brodie, 2010). When reading research or consulting reference tables, always verify whether the norms were derived from short-term or 24-hour recordings before applying them to your clients.
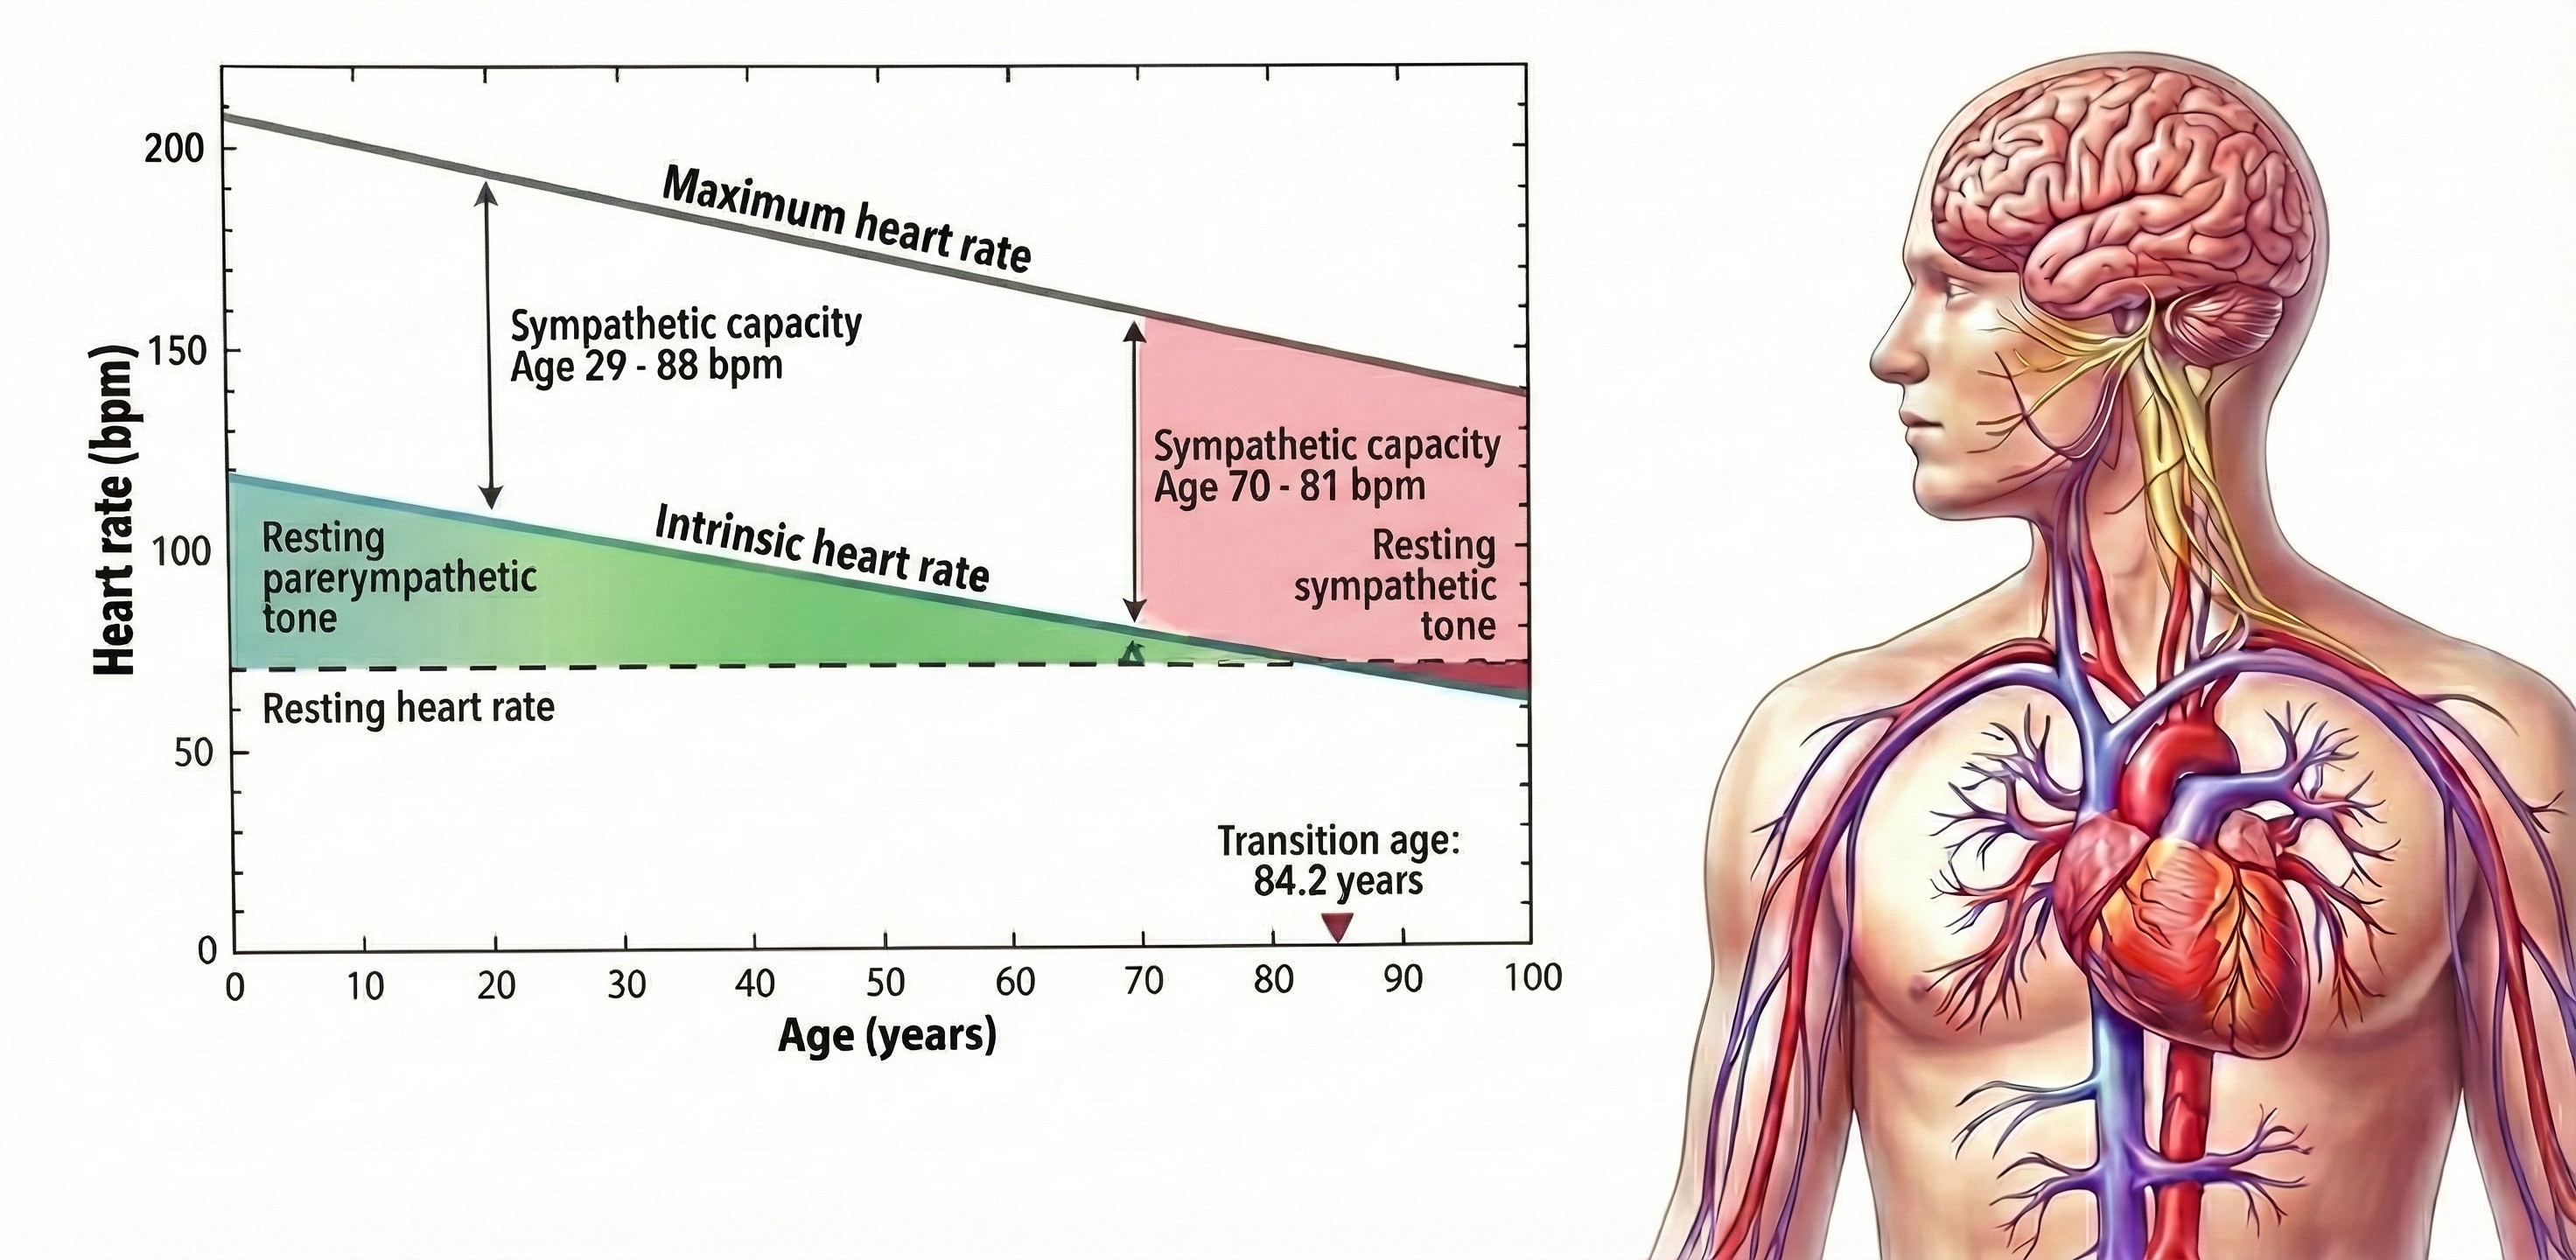
The intrinsic heart rate is higher than the resting heart rate until age 84.
Cardiac Conduction Artifacts
Cardiac conduction artifacts include atrial fibrillation, premature atrial contractions, and premature ventricular contractions.
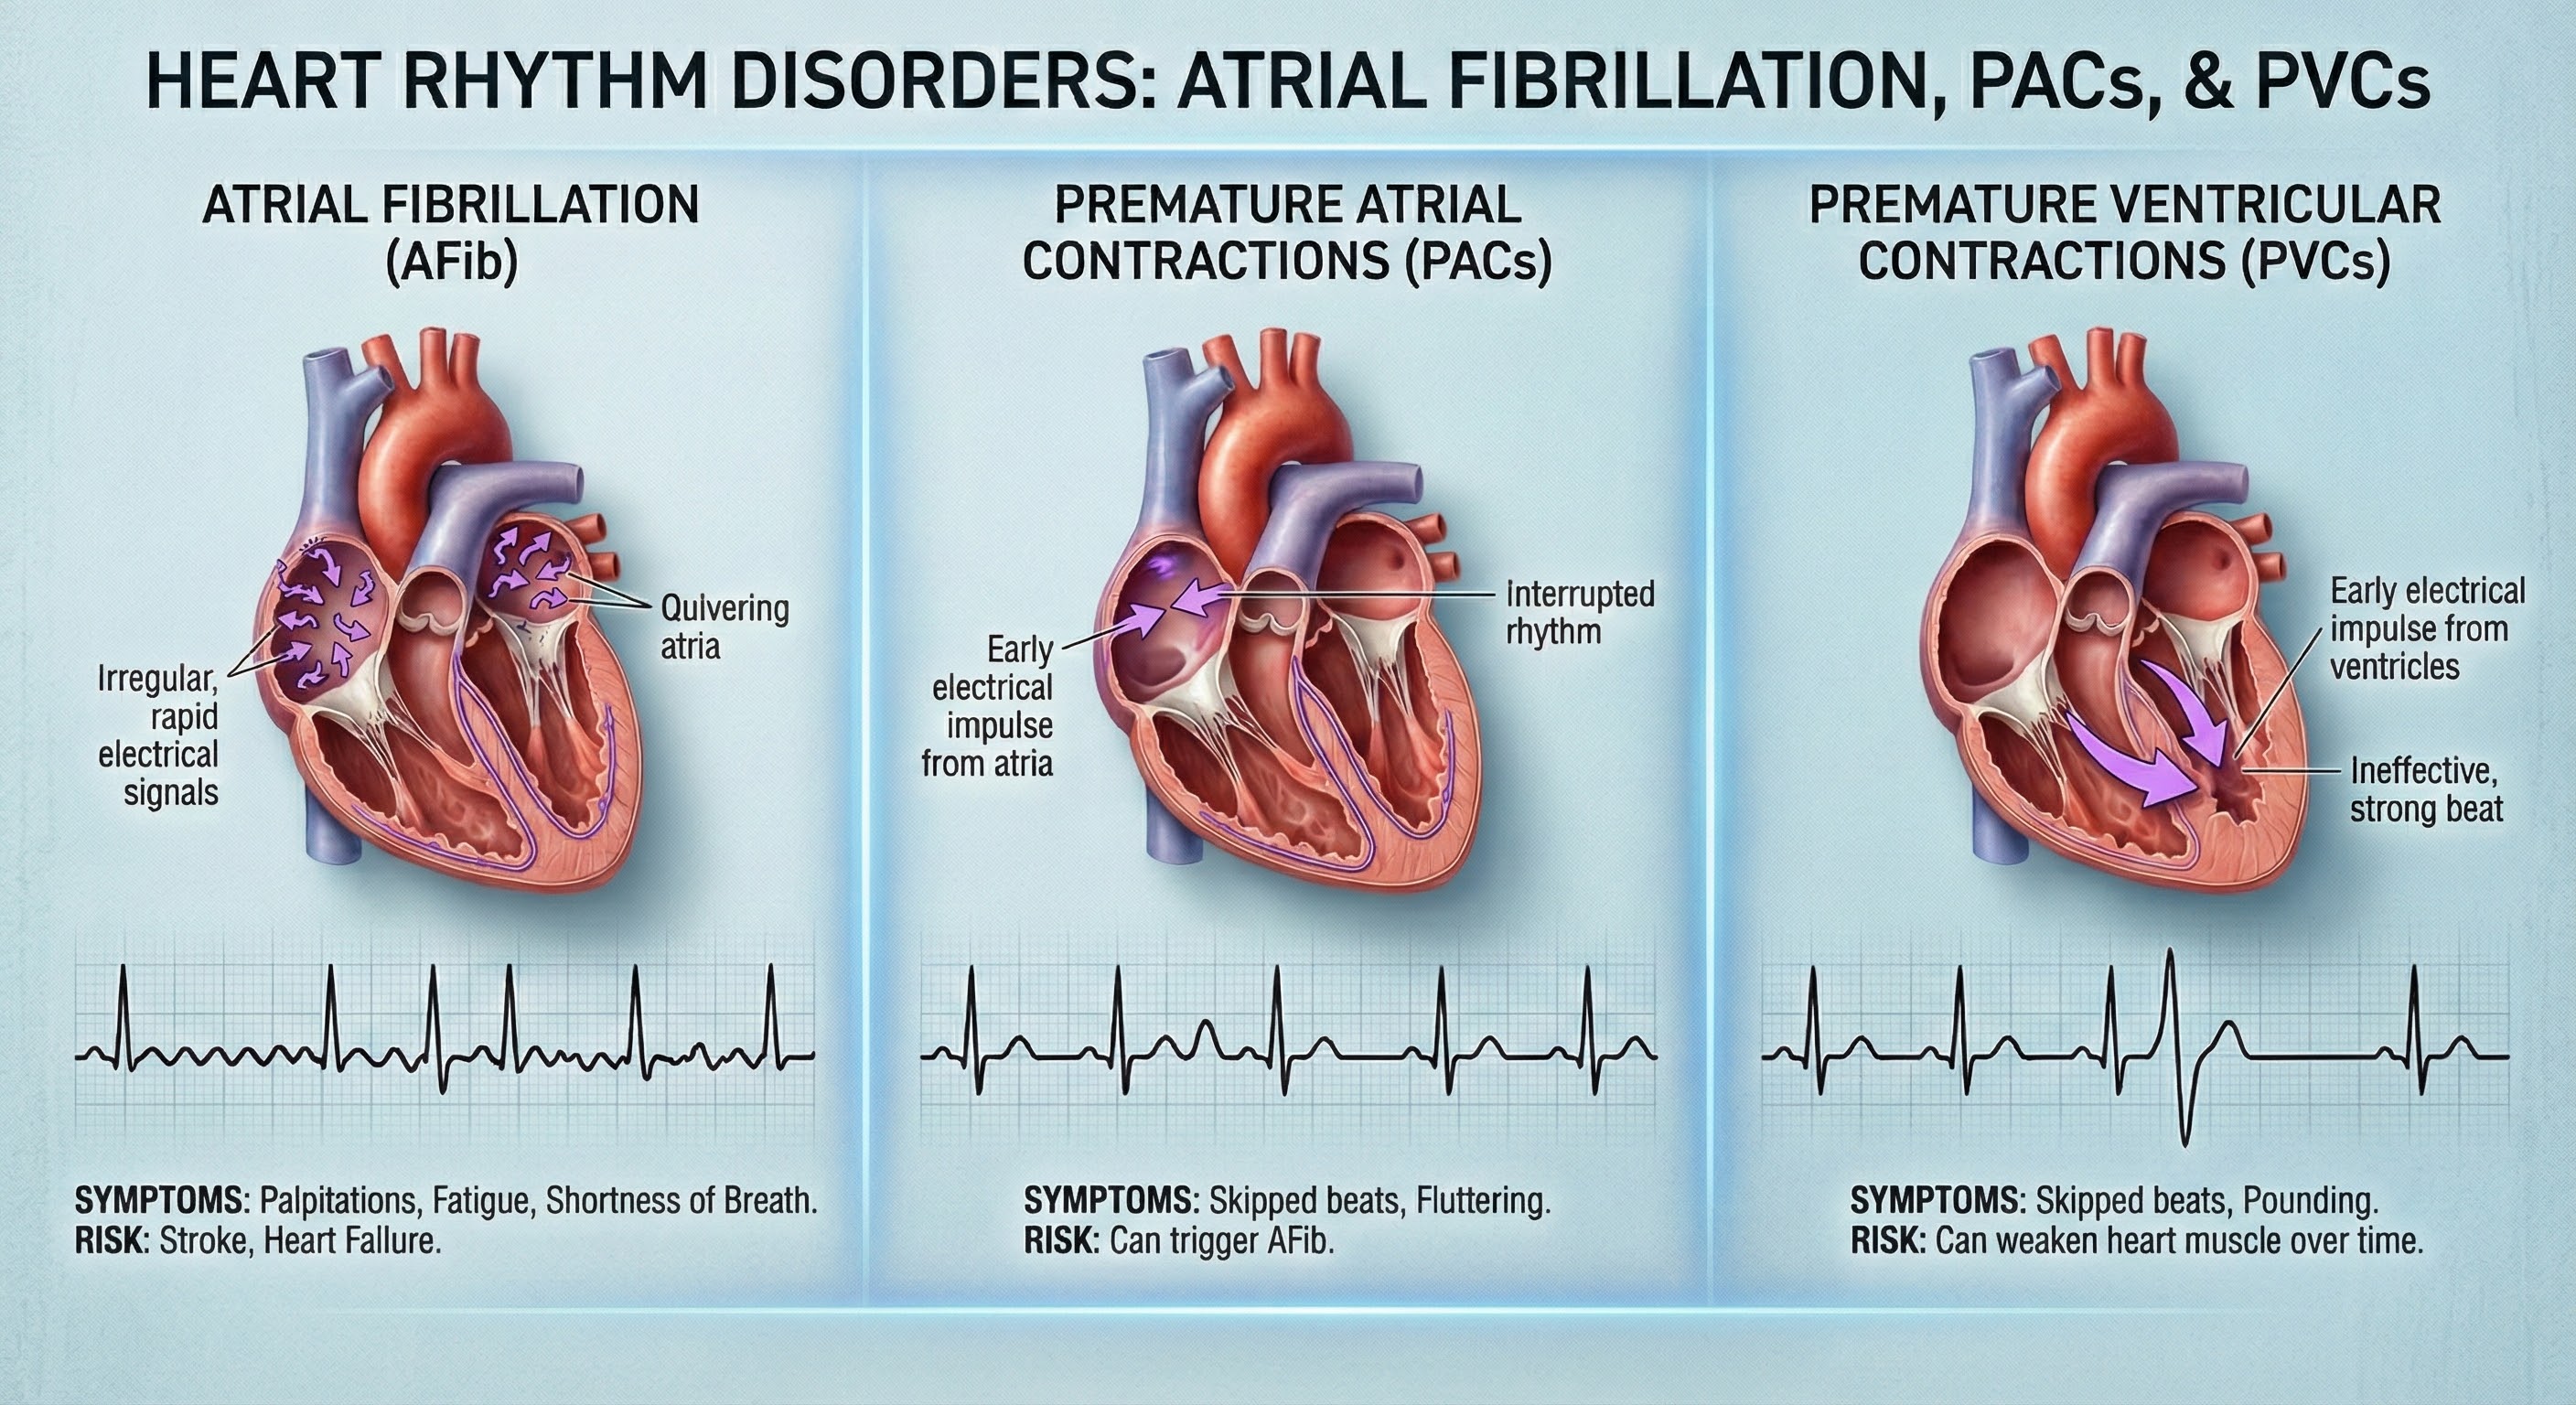
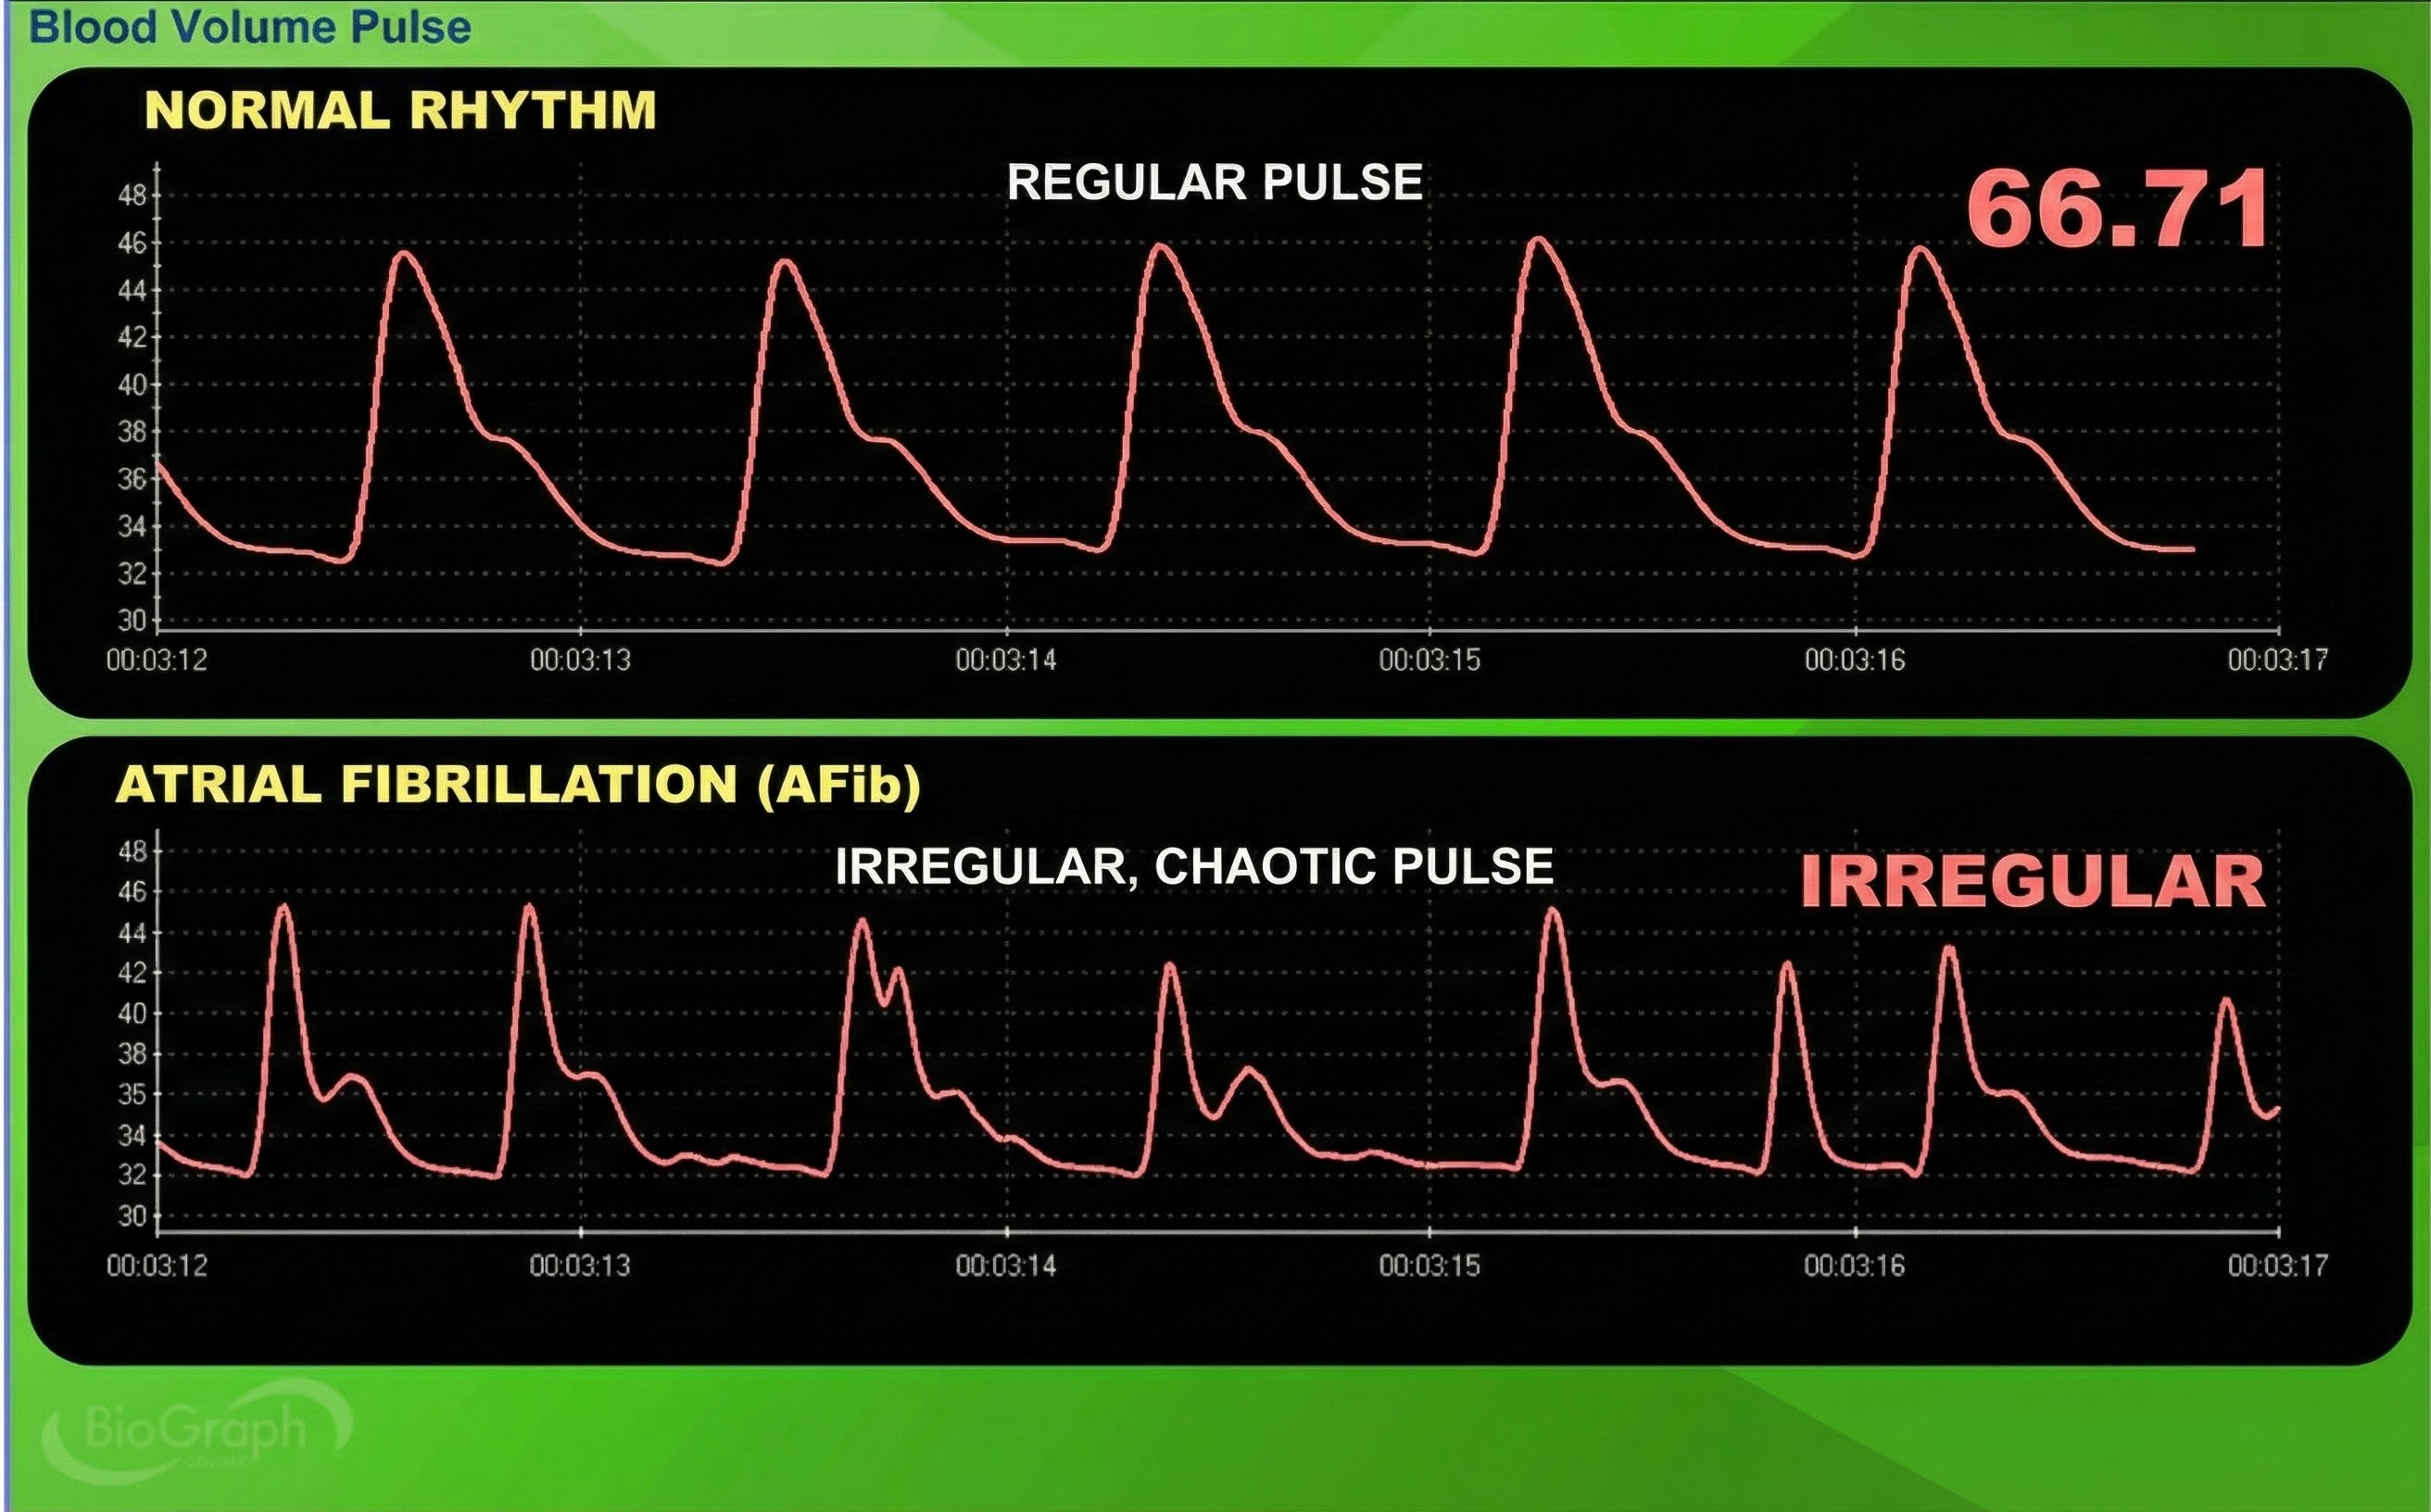
Atrial fibrillation is a form of supraventricular arrhythmia, with HRs reaching 160 beats per minute (Tortora & Derrickson, 2021).
Cardiac conduction is chaotic in clients who experience this disorder.
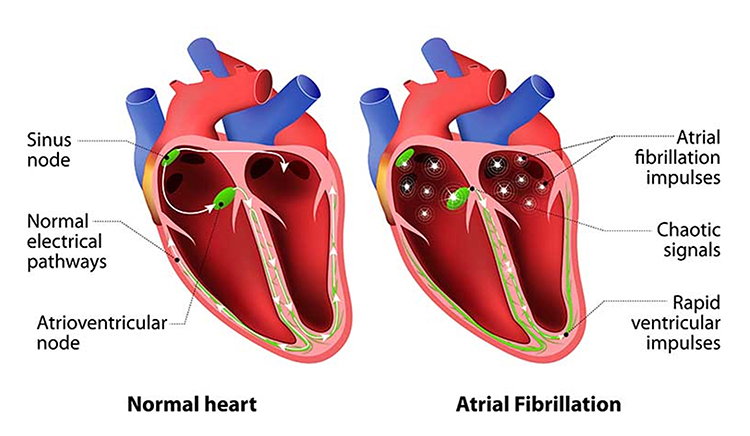
Atrial fibrillation appears chaotic.
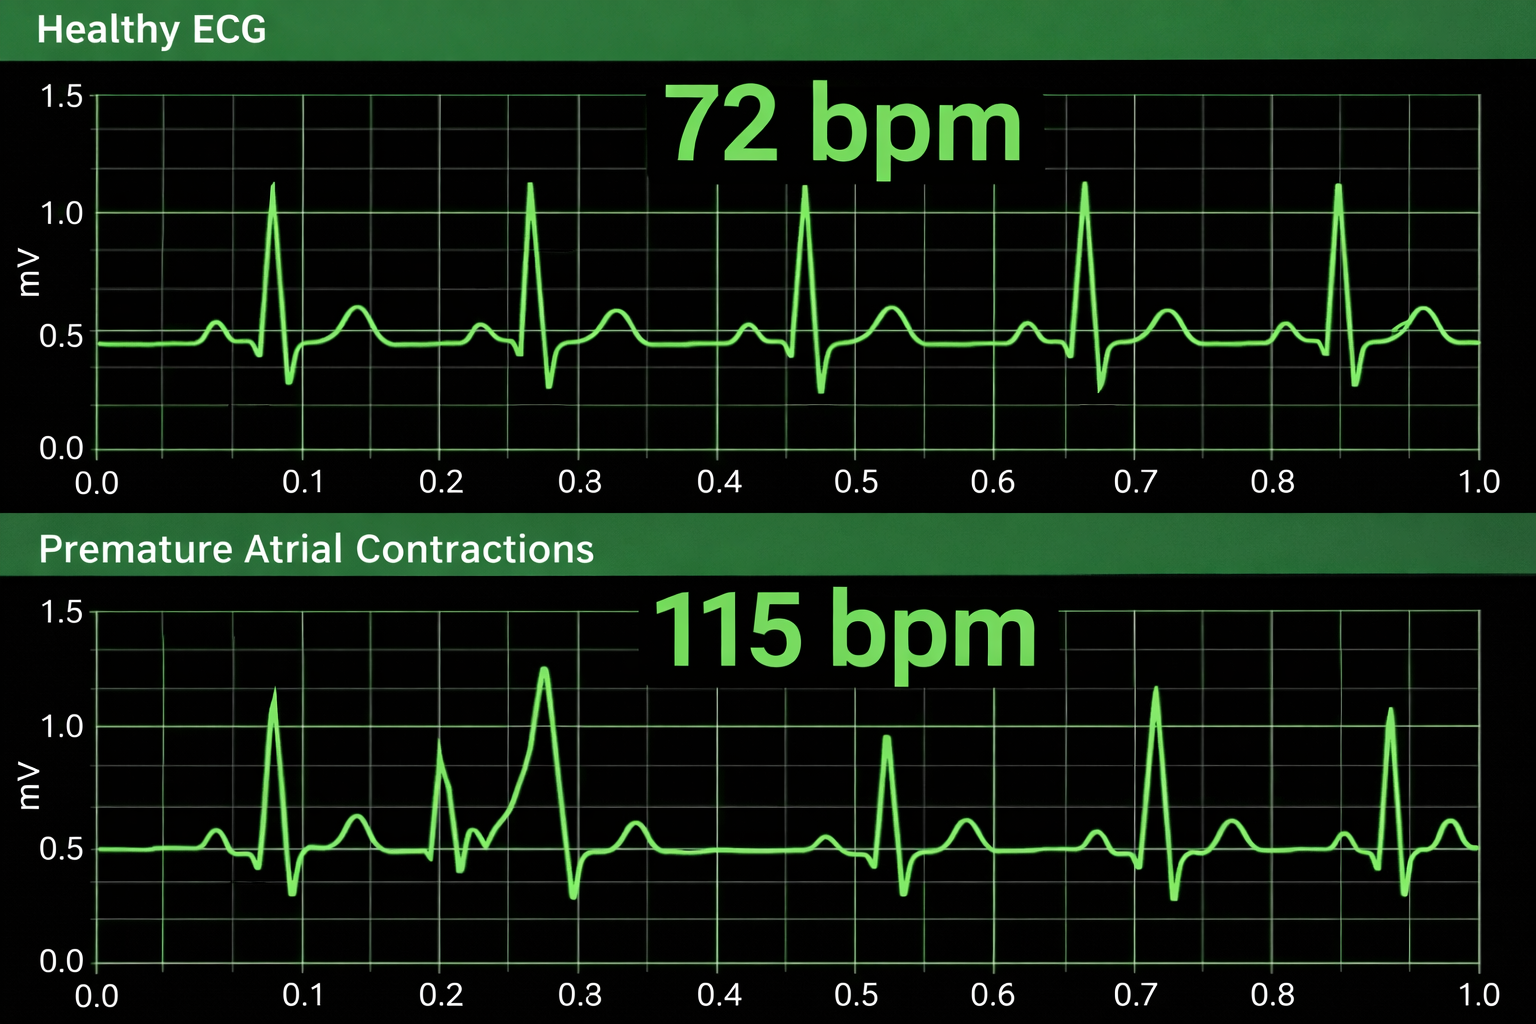
Premature atrial contractions (PACs) involve early atrial contraction and result in calculating extra beats (Lehrer, 2018b).
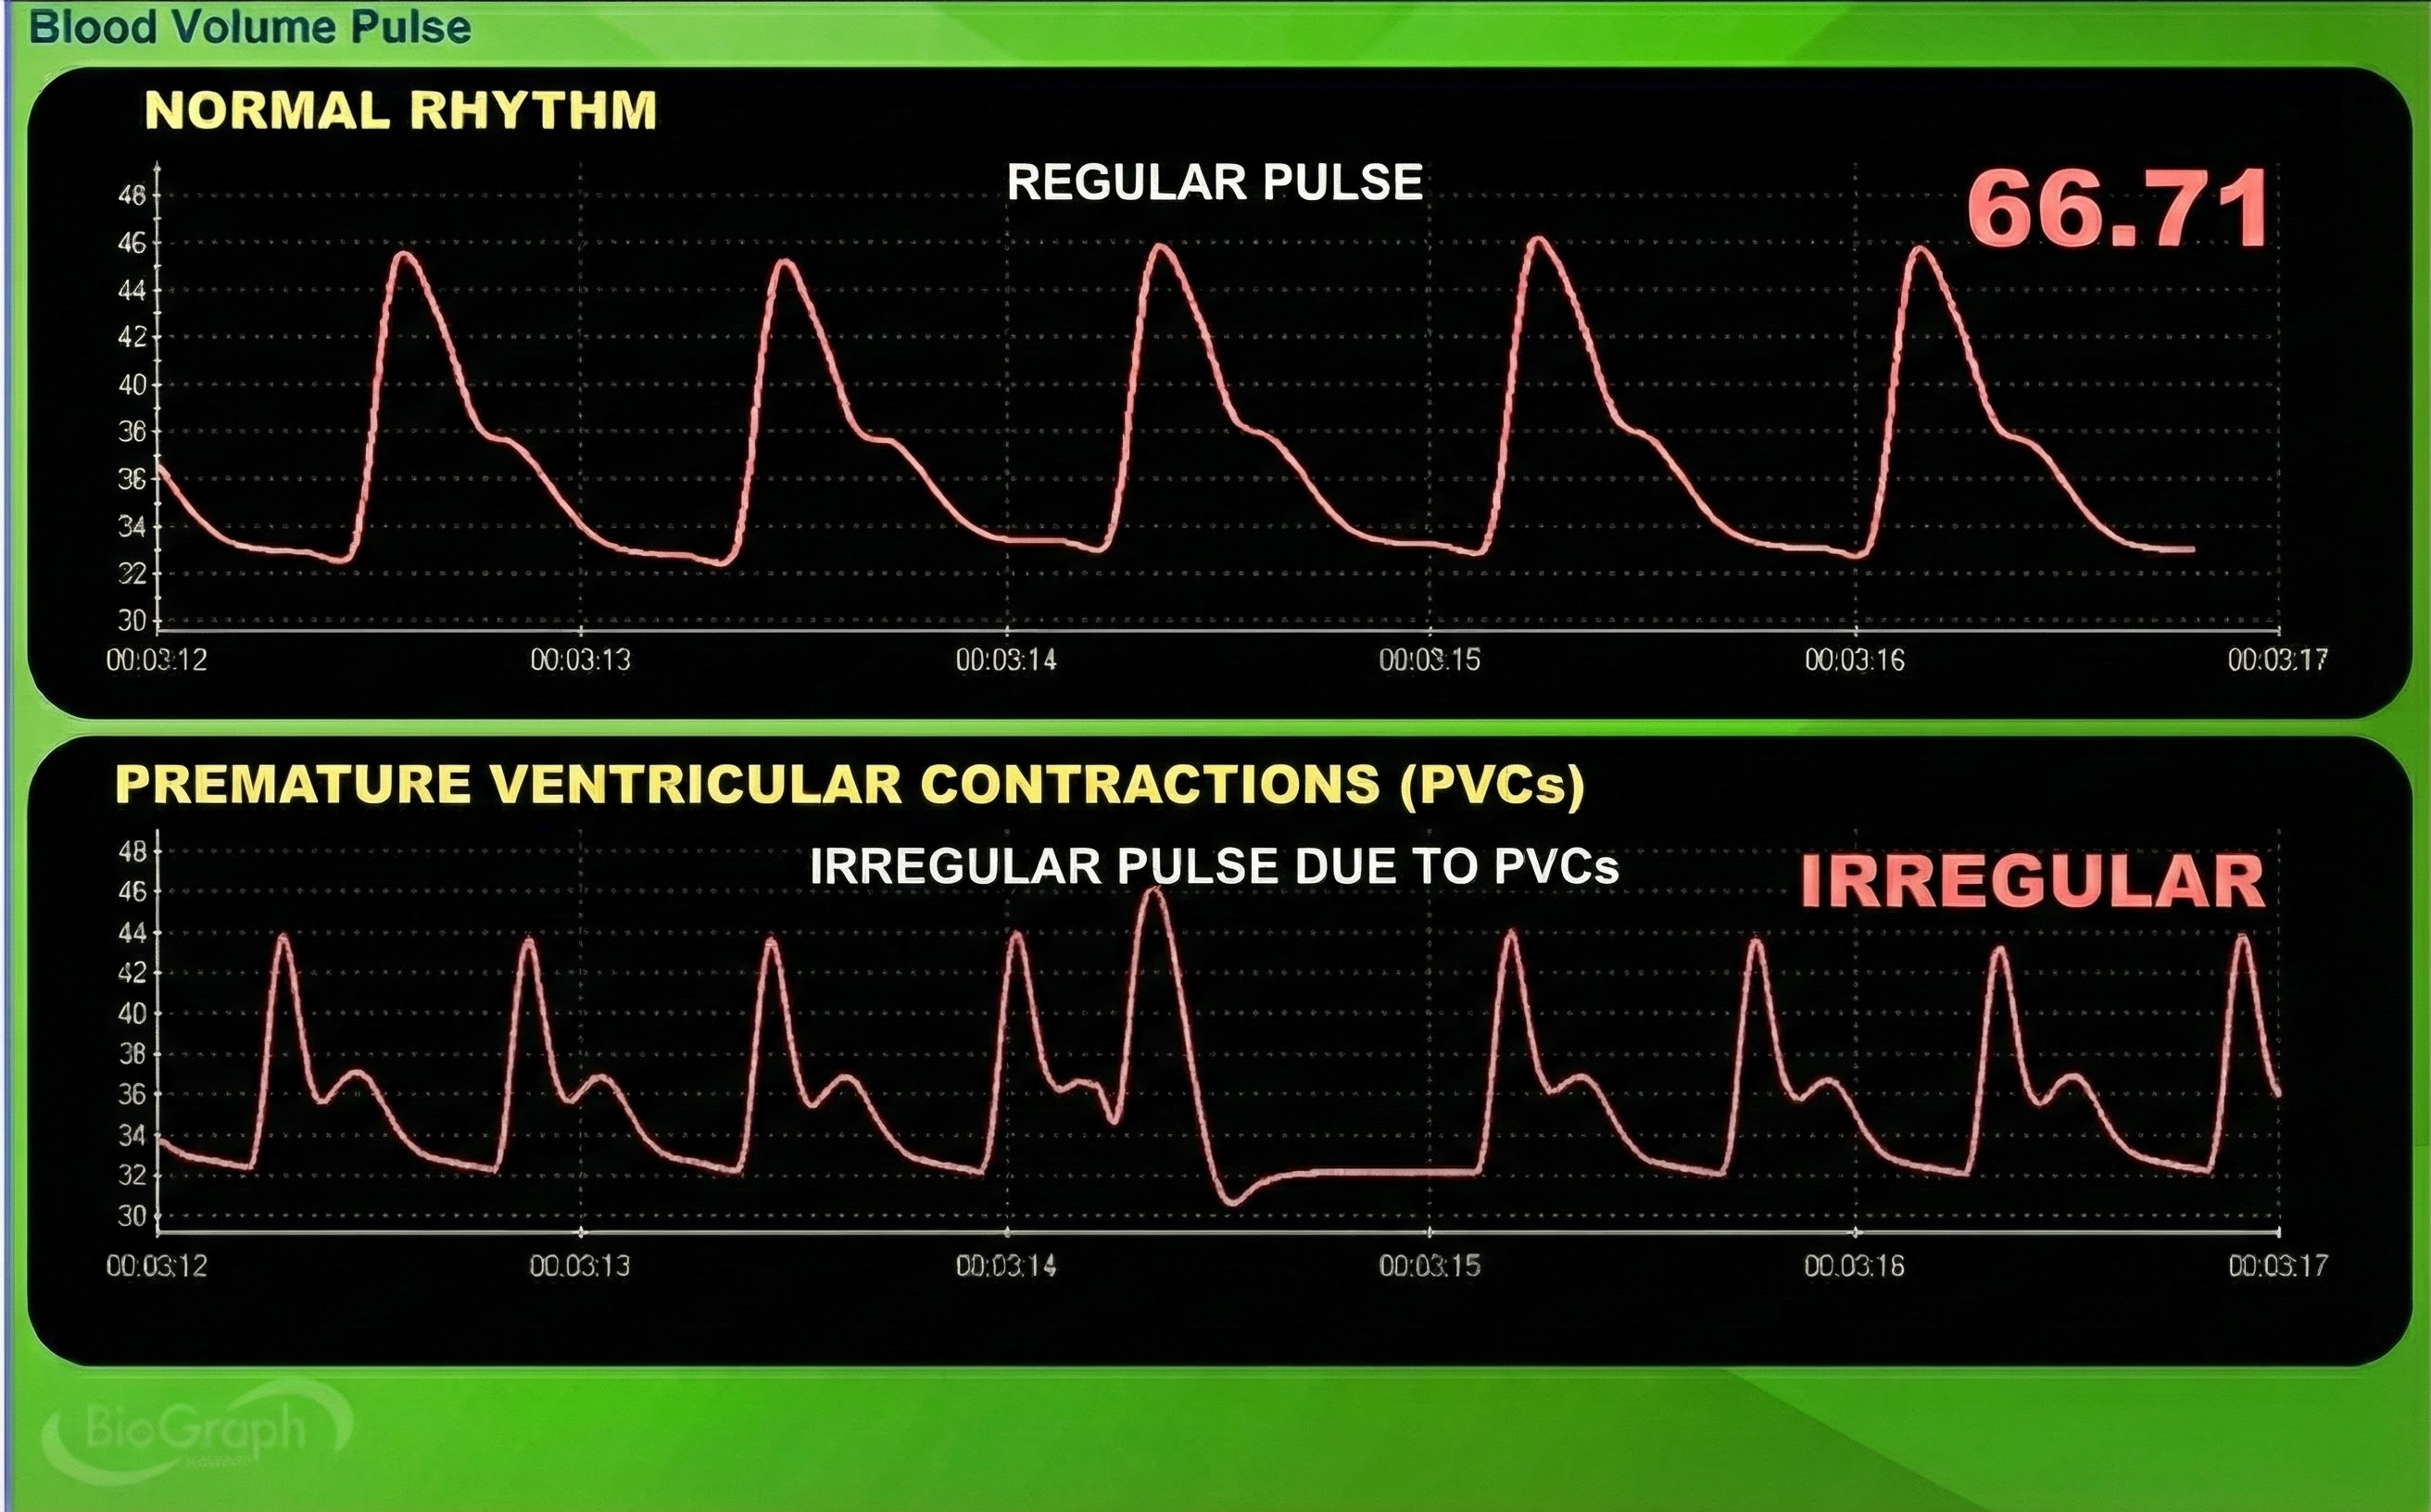
Premature ventricular contractions (PVCs) can result in an extra heartbeat followed by a full compensatory pause (Clinical ECG Interpretation, 2018). PVC artifacts are extra heartbeats that originate in the ventricles instead of the S-A node of the heart and can distort the BVP signal (Elgendi, 2012).
Cold Artifact
Cold artifact, produced by cold exposure or sympathetically-mediated vasoconstriction, can reduce or eliminate a pulse wave entirely. When peripheral blood vessels constrict severely, insufficient blood flow reaches the sensor site to produce a detectable signal. Cold artifact may result in missed beats when the software cannot identify peaks in the attenuated signal, producing artifactually-lengthened interbeat intervals (Shaffer & Combatalade, 2013). The software waits for the next detectable beat, making the interval appear much longer than the actual cardiac cycle.
🎧 Mini-Lecture: BVP Cold Artifact
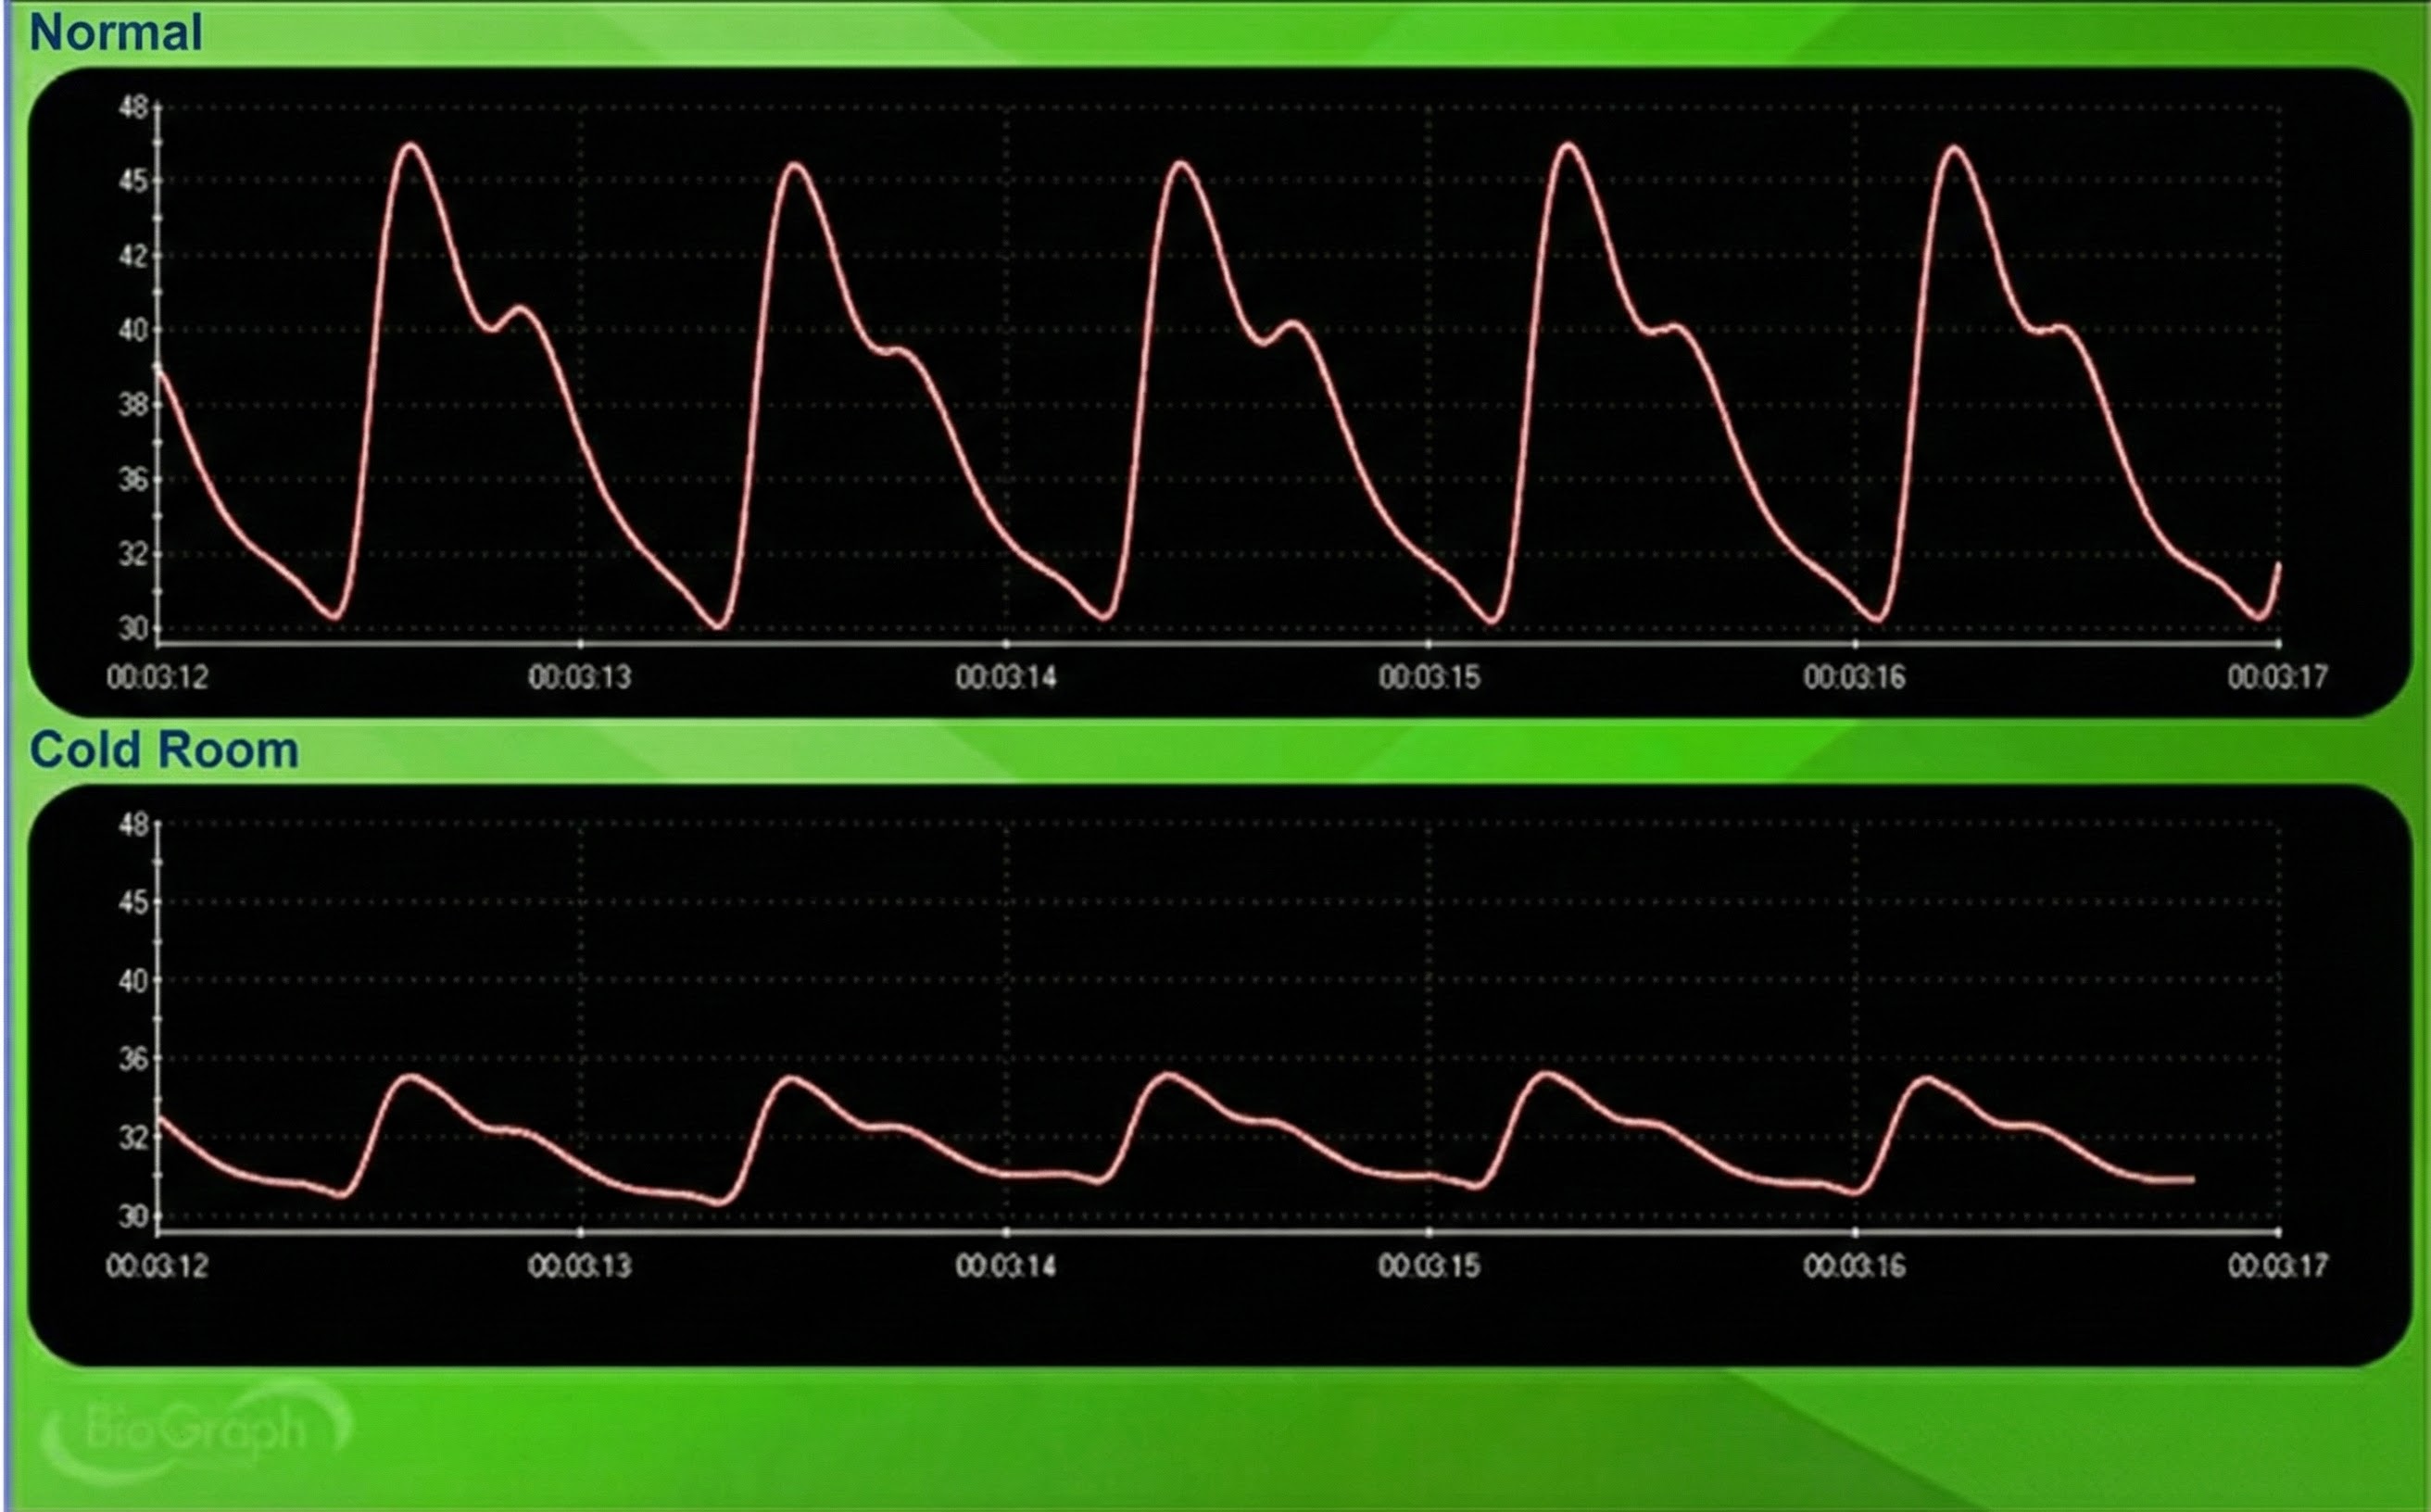
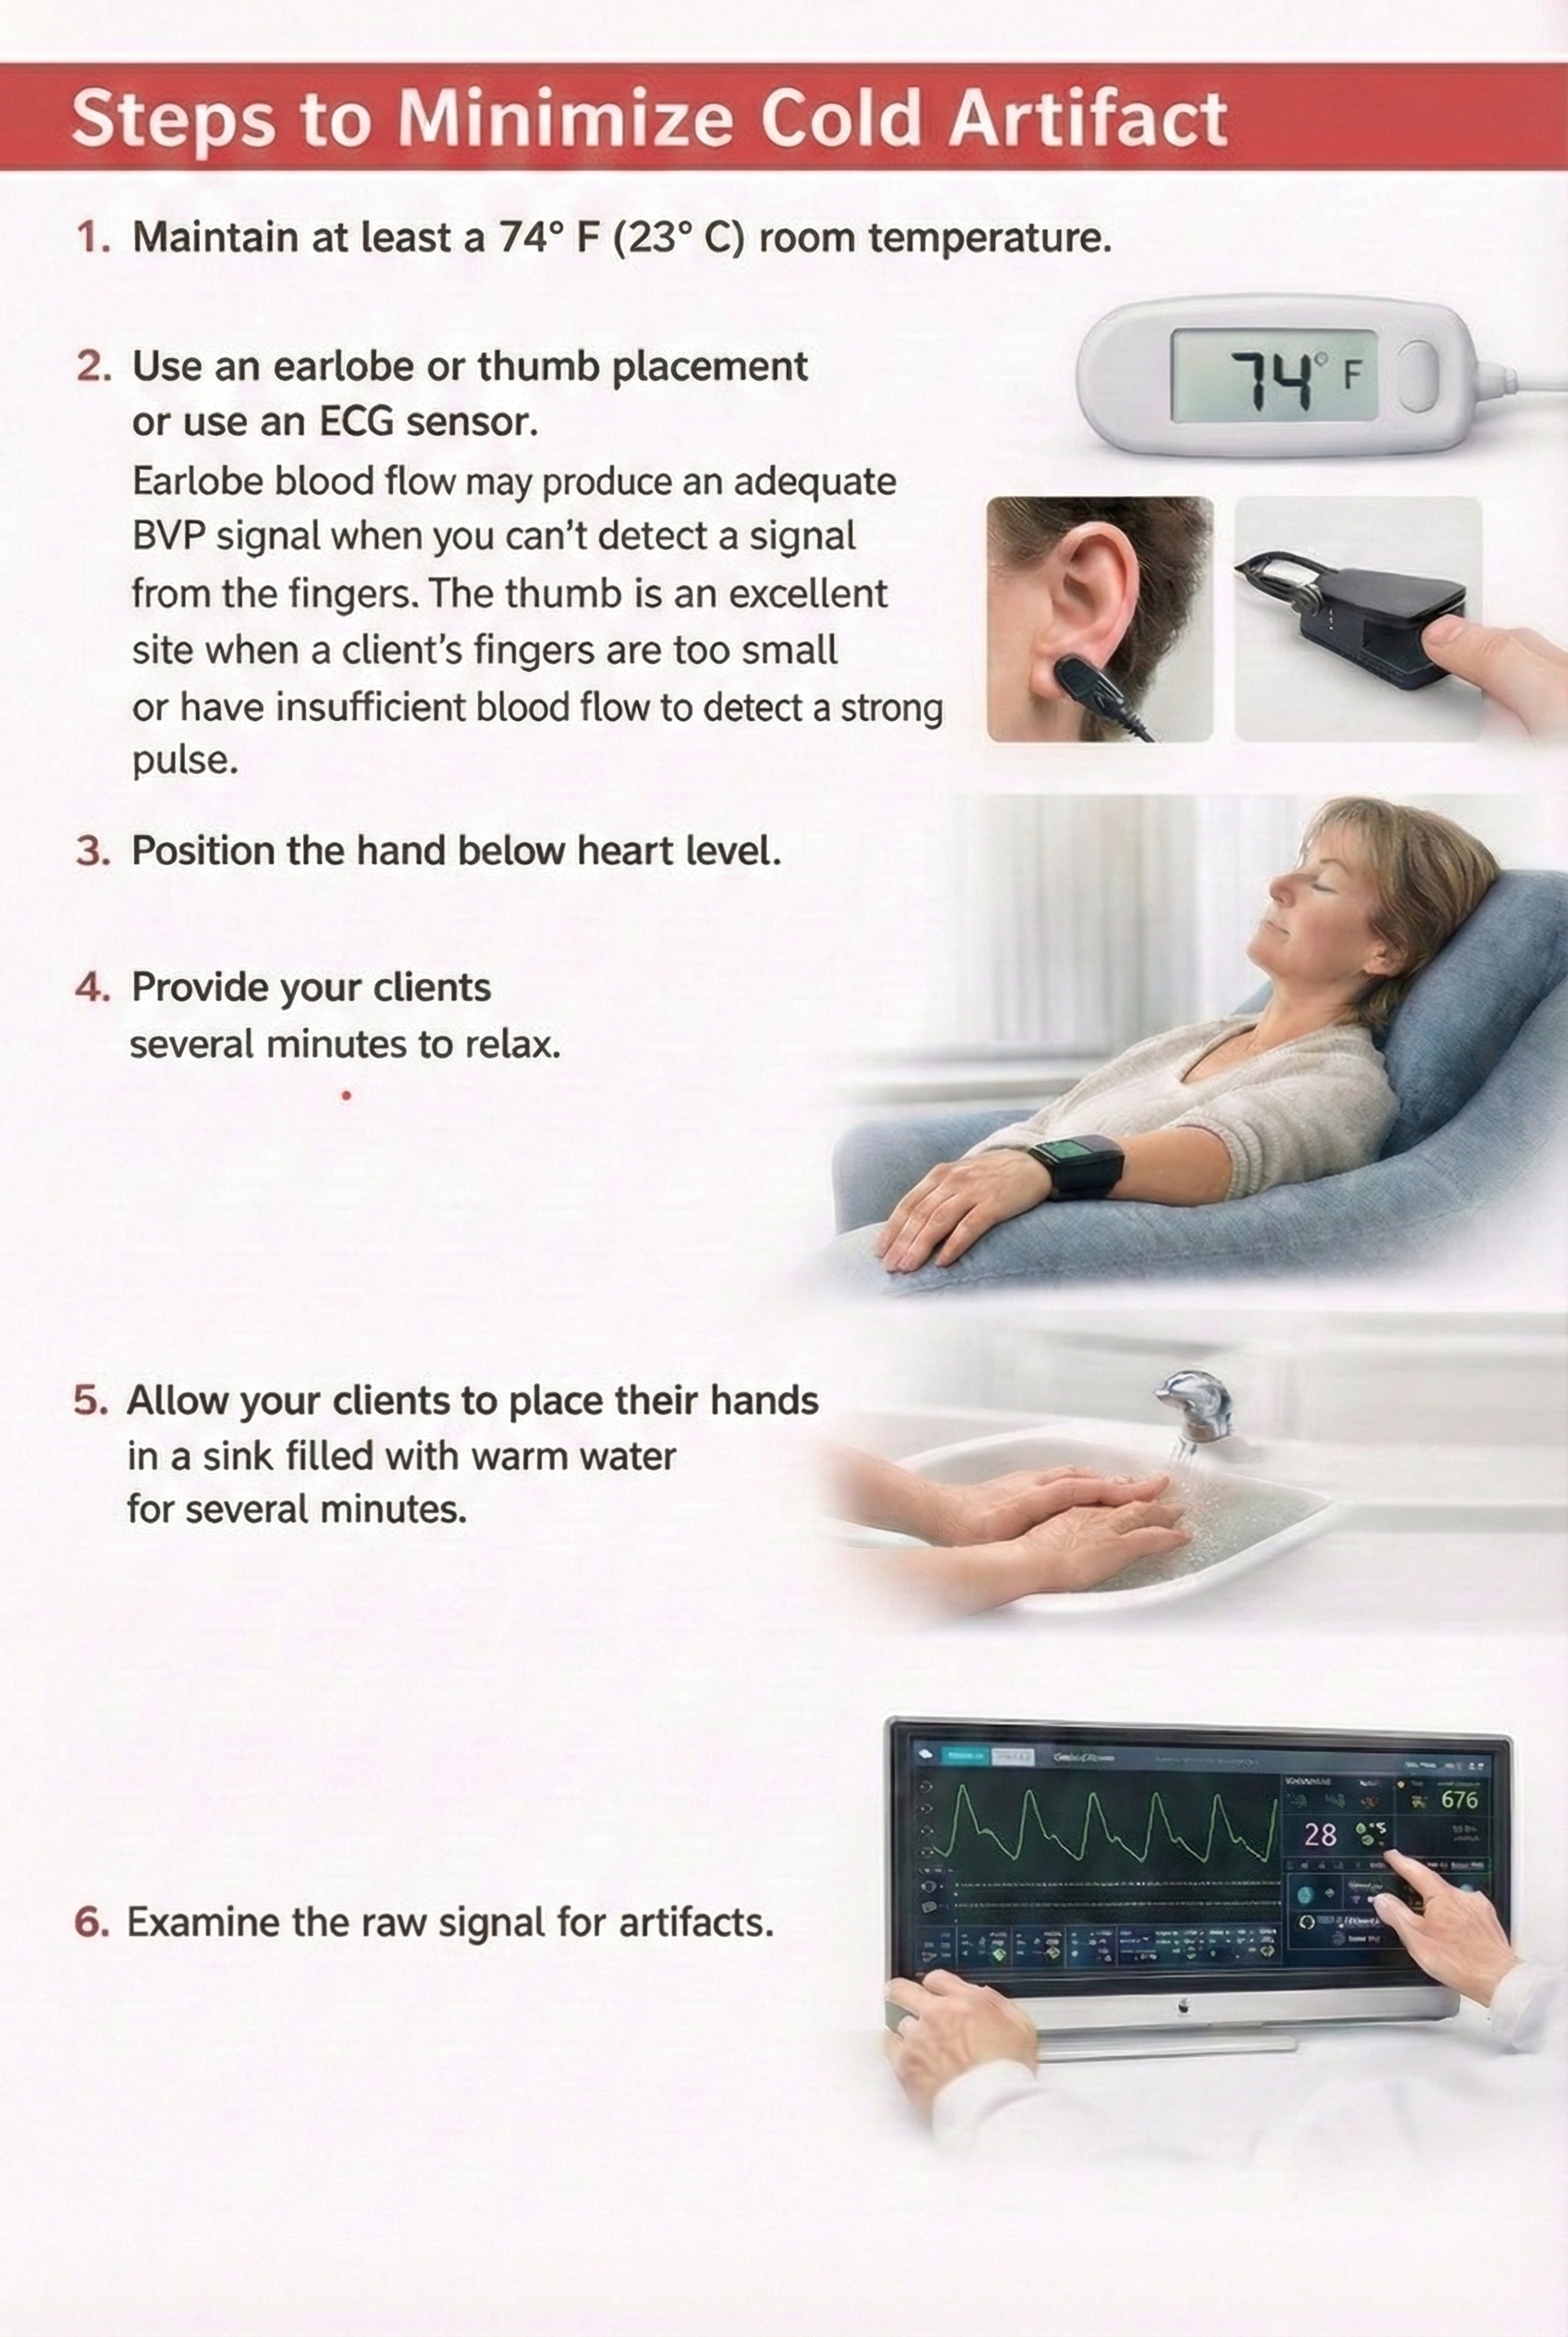
To minimize cold artifact, maintain room temperature at least 74 degrees Fahrenheit (23 degrees Celsius). Cold clinical environments are a common cause of poor BVP recordings, particularly in hospital settings where air conditioning runs continuously. Use an earlobe or thumb placement or switch to an ECG sensor when finger signal is inadequate. The earlobe often produces an adequate BVP signal even when finger readings fail because the ear receives blood from the external carotid artery and is less susceptible to sympathetically-mediated vasoconstriction. The thumb is an excellent alternative site when a client's fingers are too small or have insufficient blood flow to detect a strong pulse (Peper, Shaffer, & Lin, 2010).
Position the hand below heart level to increase blood volume in the digits through gravity-assisted venous pooling (Lehrer, 2018b). Provide your clients several minutes to acclimate and relax before beginning recording, as the sympathetic activation of arriving at a new environment can cause transient vasoconstriction. If vasoconstriction persists, allow your clients to place their hands in a sink filled with warm water (not hot, which can cause rebound vasoconstriction) or in front of a space heater for several minutes. Always examine the raw signal for artifact before interpreting derived measures.
Light Artifact
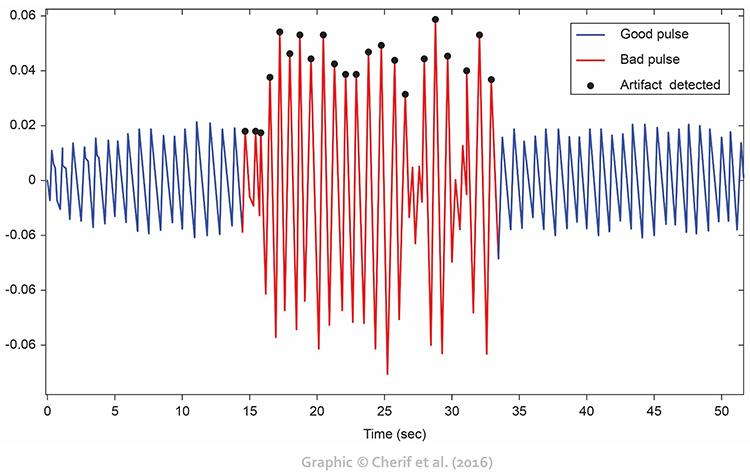
Light artifact occurs when ambient light overloads a PPG sensor's photodetector, producing exaggerated peak-to-trough differences (Cherif et al., 2016; Shaffer & Combatalade, 2013). The sensor cannot distinguish between infrared light from its own LED and stray light from the environment, so external light sources add to the detected signal. Flickering light sources, such as fluorescent tubes or computer monitors, can introduce rhythmic artifacts that may be mistaken for cardiac activity.
🎧 Mini-Lecture: BVP Light Artifact
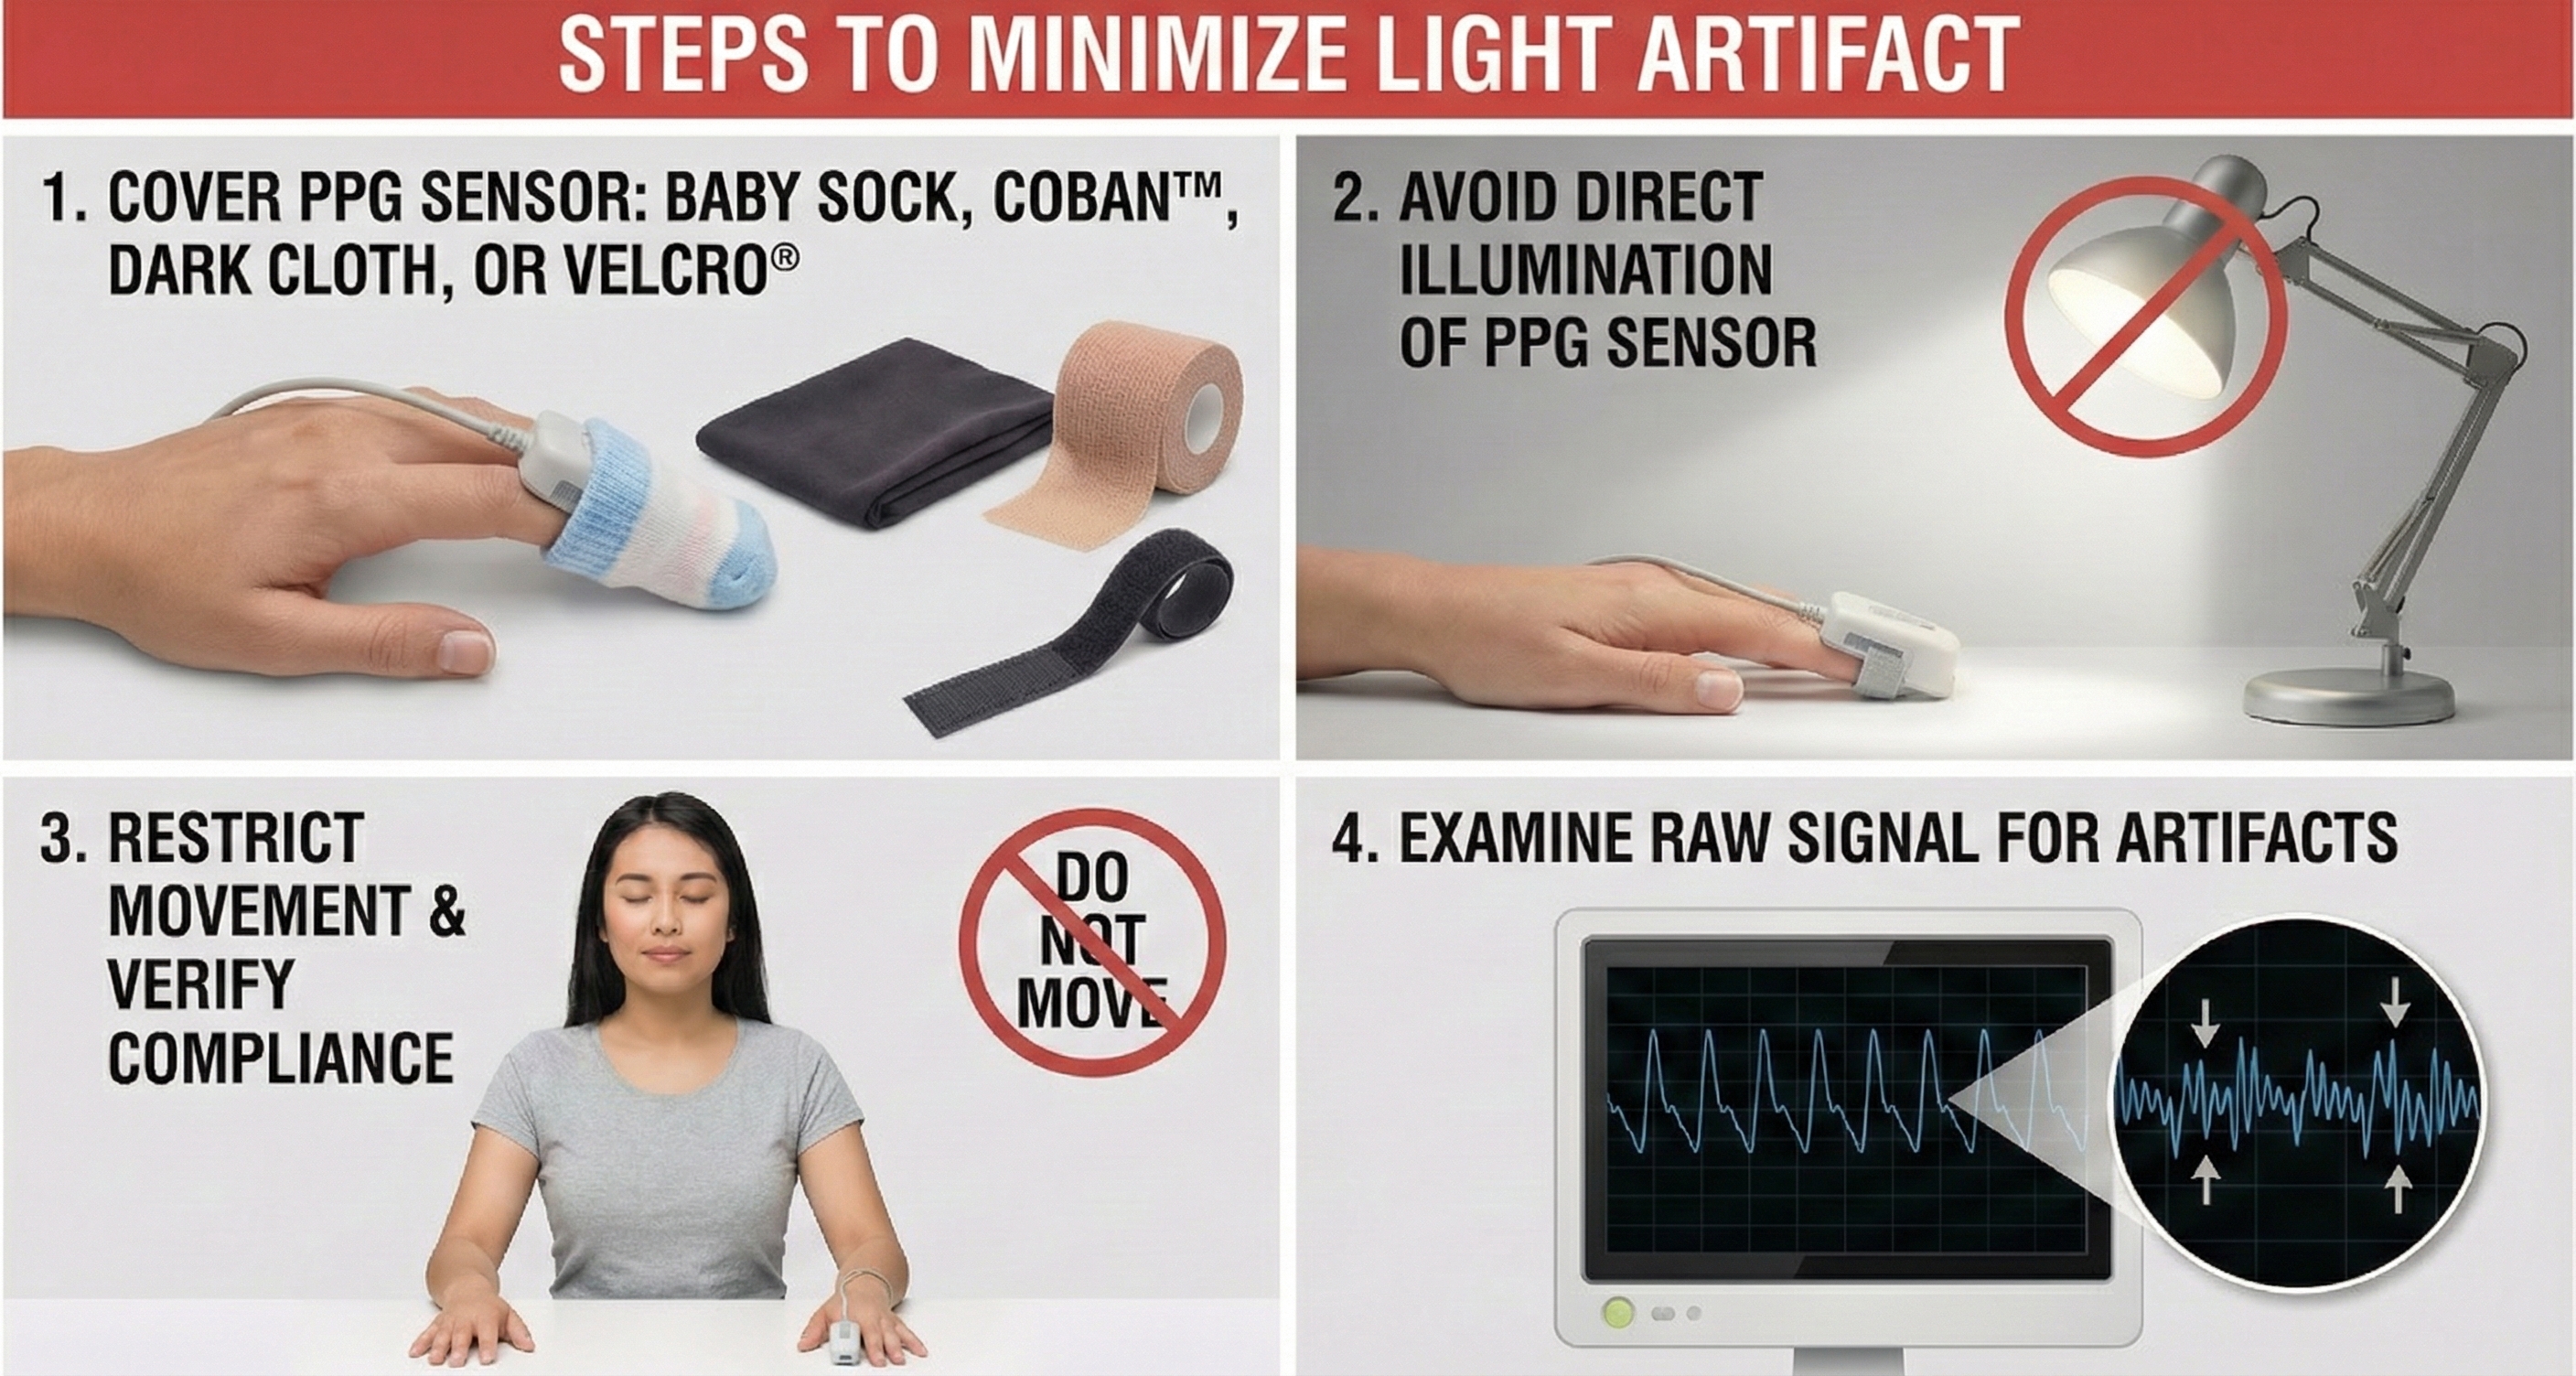
To minimize light artifact, cover the PPG sensor with a baby sock (an inexpensive and effective solution), Coban tape, a dark cloth, or Velcro band that wraps around the sensor housing. Avoid direct illumination of the PPG sensor, particularly from windows (which can introduce both sunlight and reflections), desk lamps, or overhead fluorescent lights that flicker at line frequency. Position the client so that the sensor faces away from light sources. Instruct clients to restrict movement and verify compliance throughout the session, as movement can shift the covering and allow light to enter. Always examine the raw signal for artifact, comparing the signal quality when the sensor is covered versus uncovered.
Line Interference (50/60 Hz) Artifact
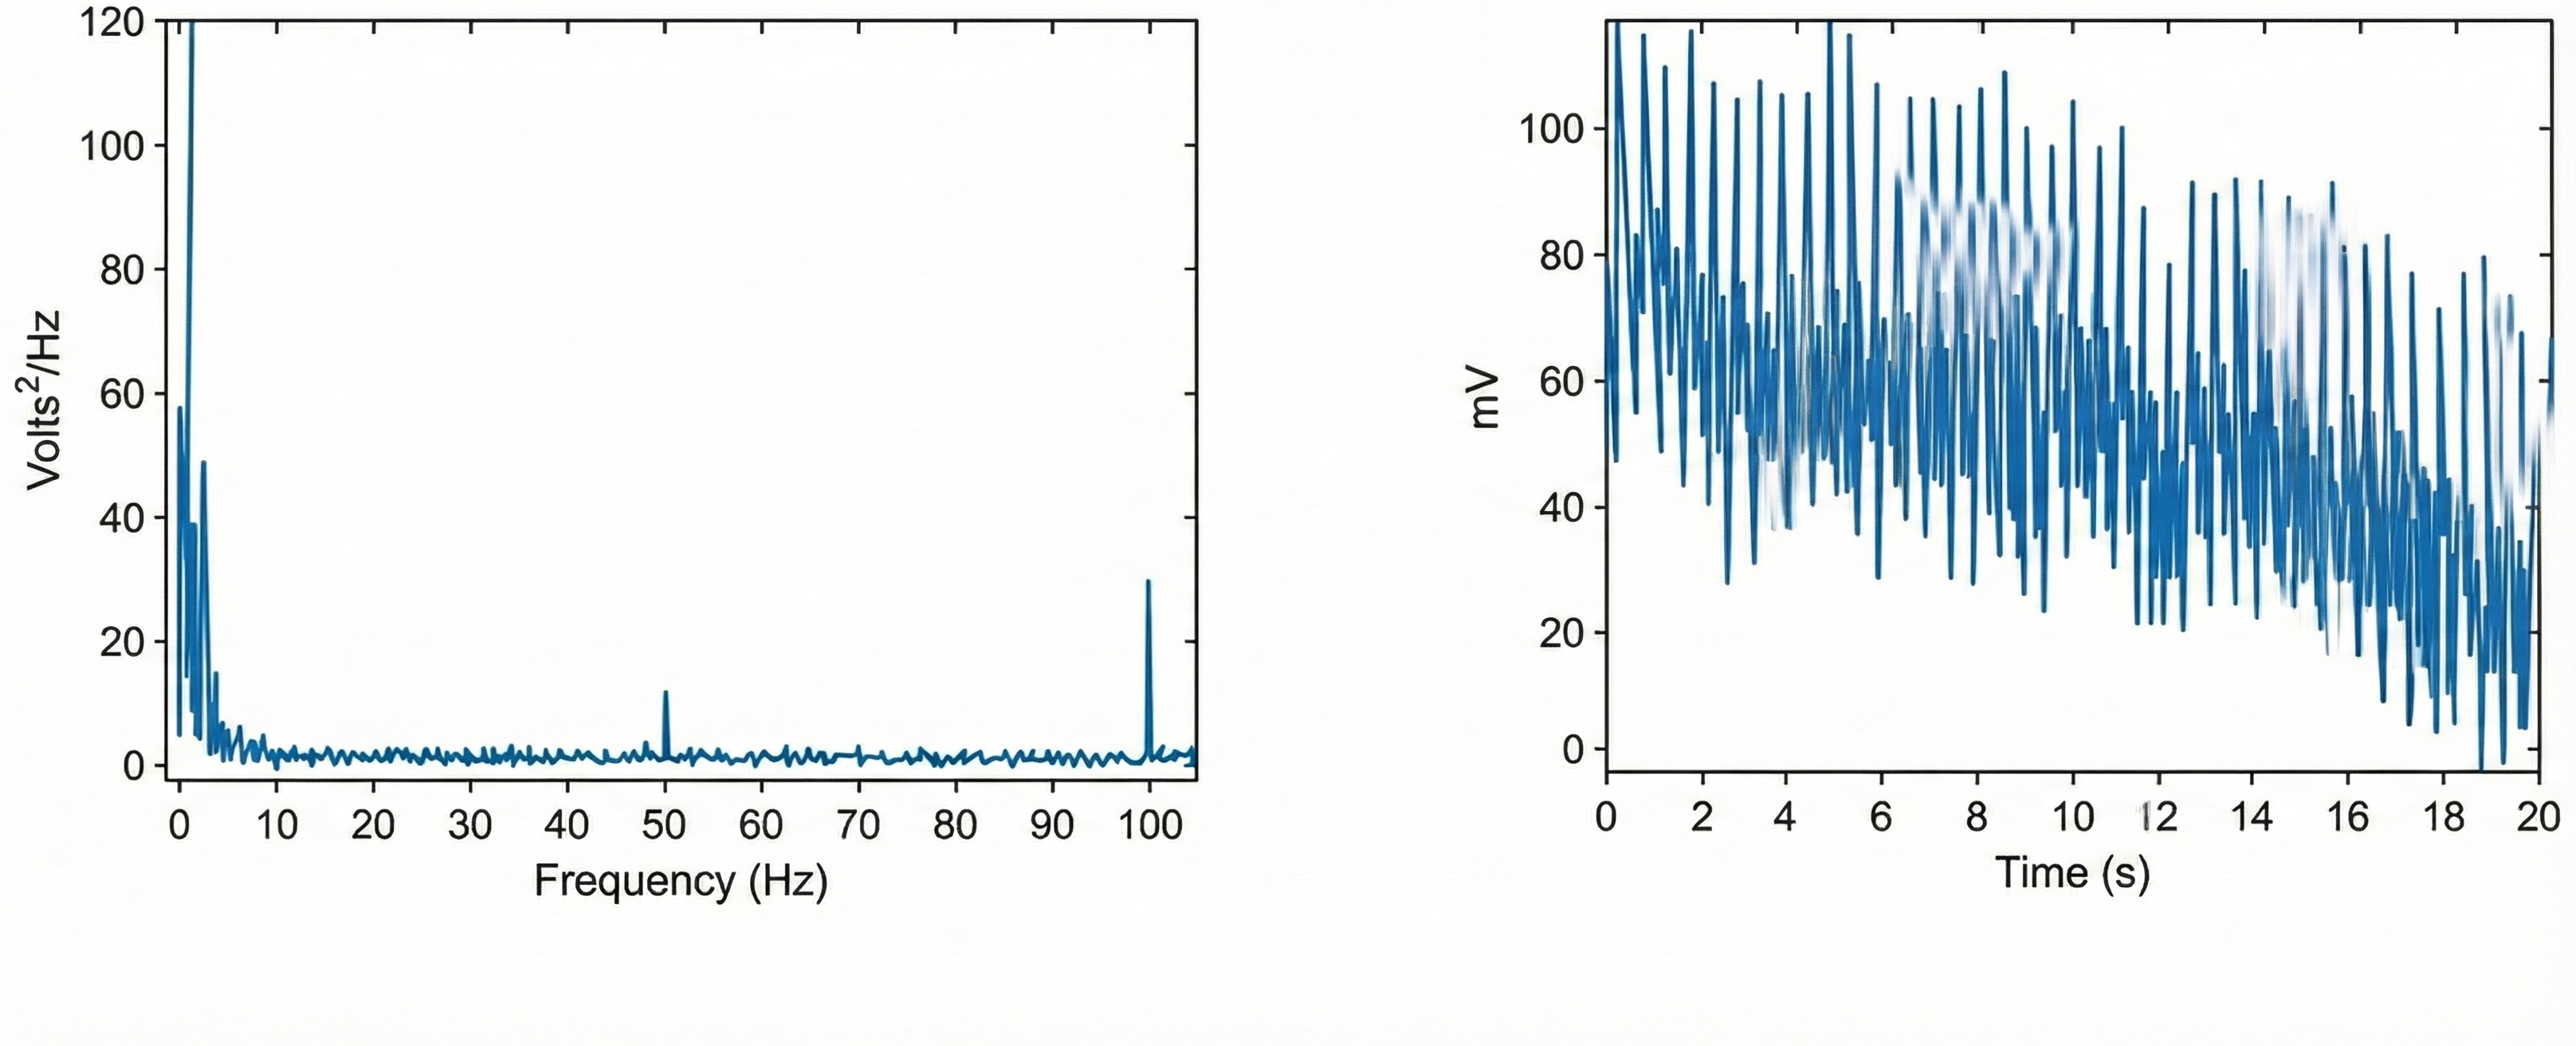
Line interference artifact appears as ripples during downswings in the raw blood volume pulse signal (Elgendi, 2012; Shaffer & Combatalade, 2013). This artifact results from electromagnetic interference from power lines, which operate at 50 Hz in most of the world or 60 Hz in North America and some other regions. The electromagnetic fields generated by electrical wiring, transformers, and electronic equipment induce small currents in sensor cables, adding noise to the recorded signal.
🎧 Mini-Lecture: BVP Line Interference Artifact
You may not see line interference if your data acquisition system includes built-in filters that remove the high-frequency component of the raw BVP signal before displaying it. However, the contamination still affects underlying measurements. The graphic below from Elgendi shows a 50-Hz peak and 100-Hz harmonic in frequency analysis (left) and contamination of the raw BVP signal (right). The harmonic at double the line frequency is a characteristic signature of power line interference.
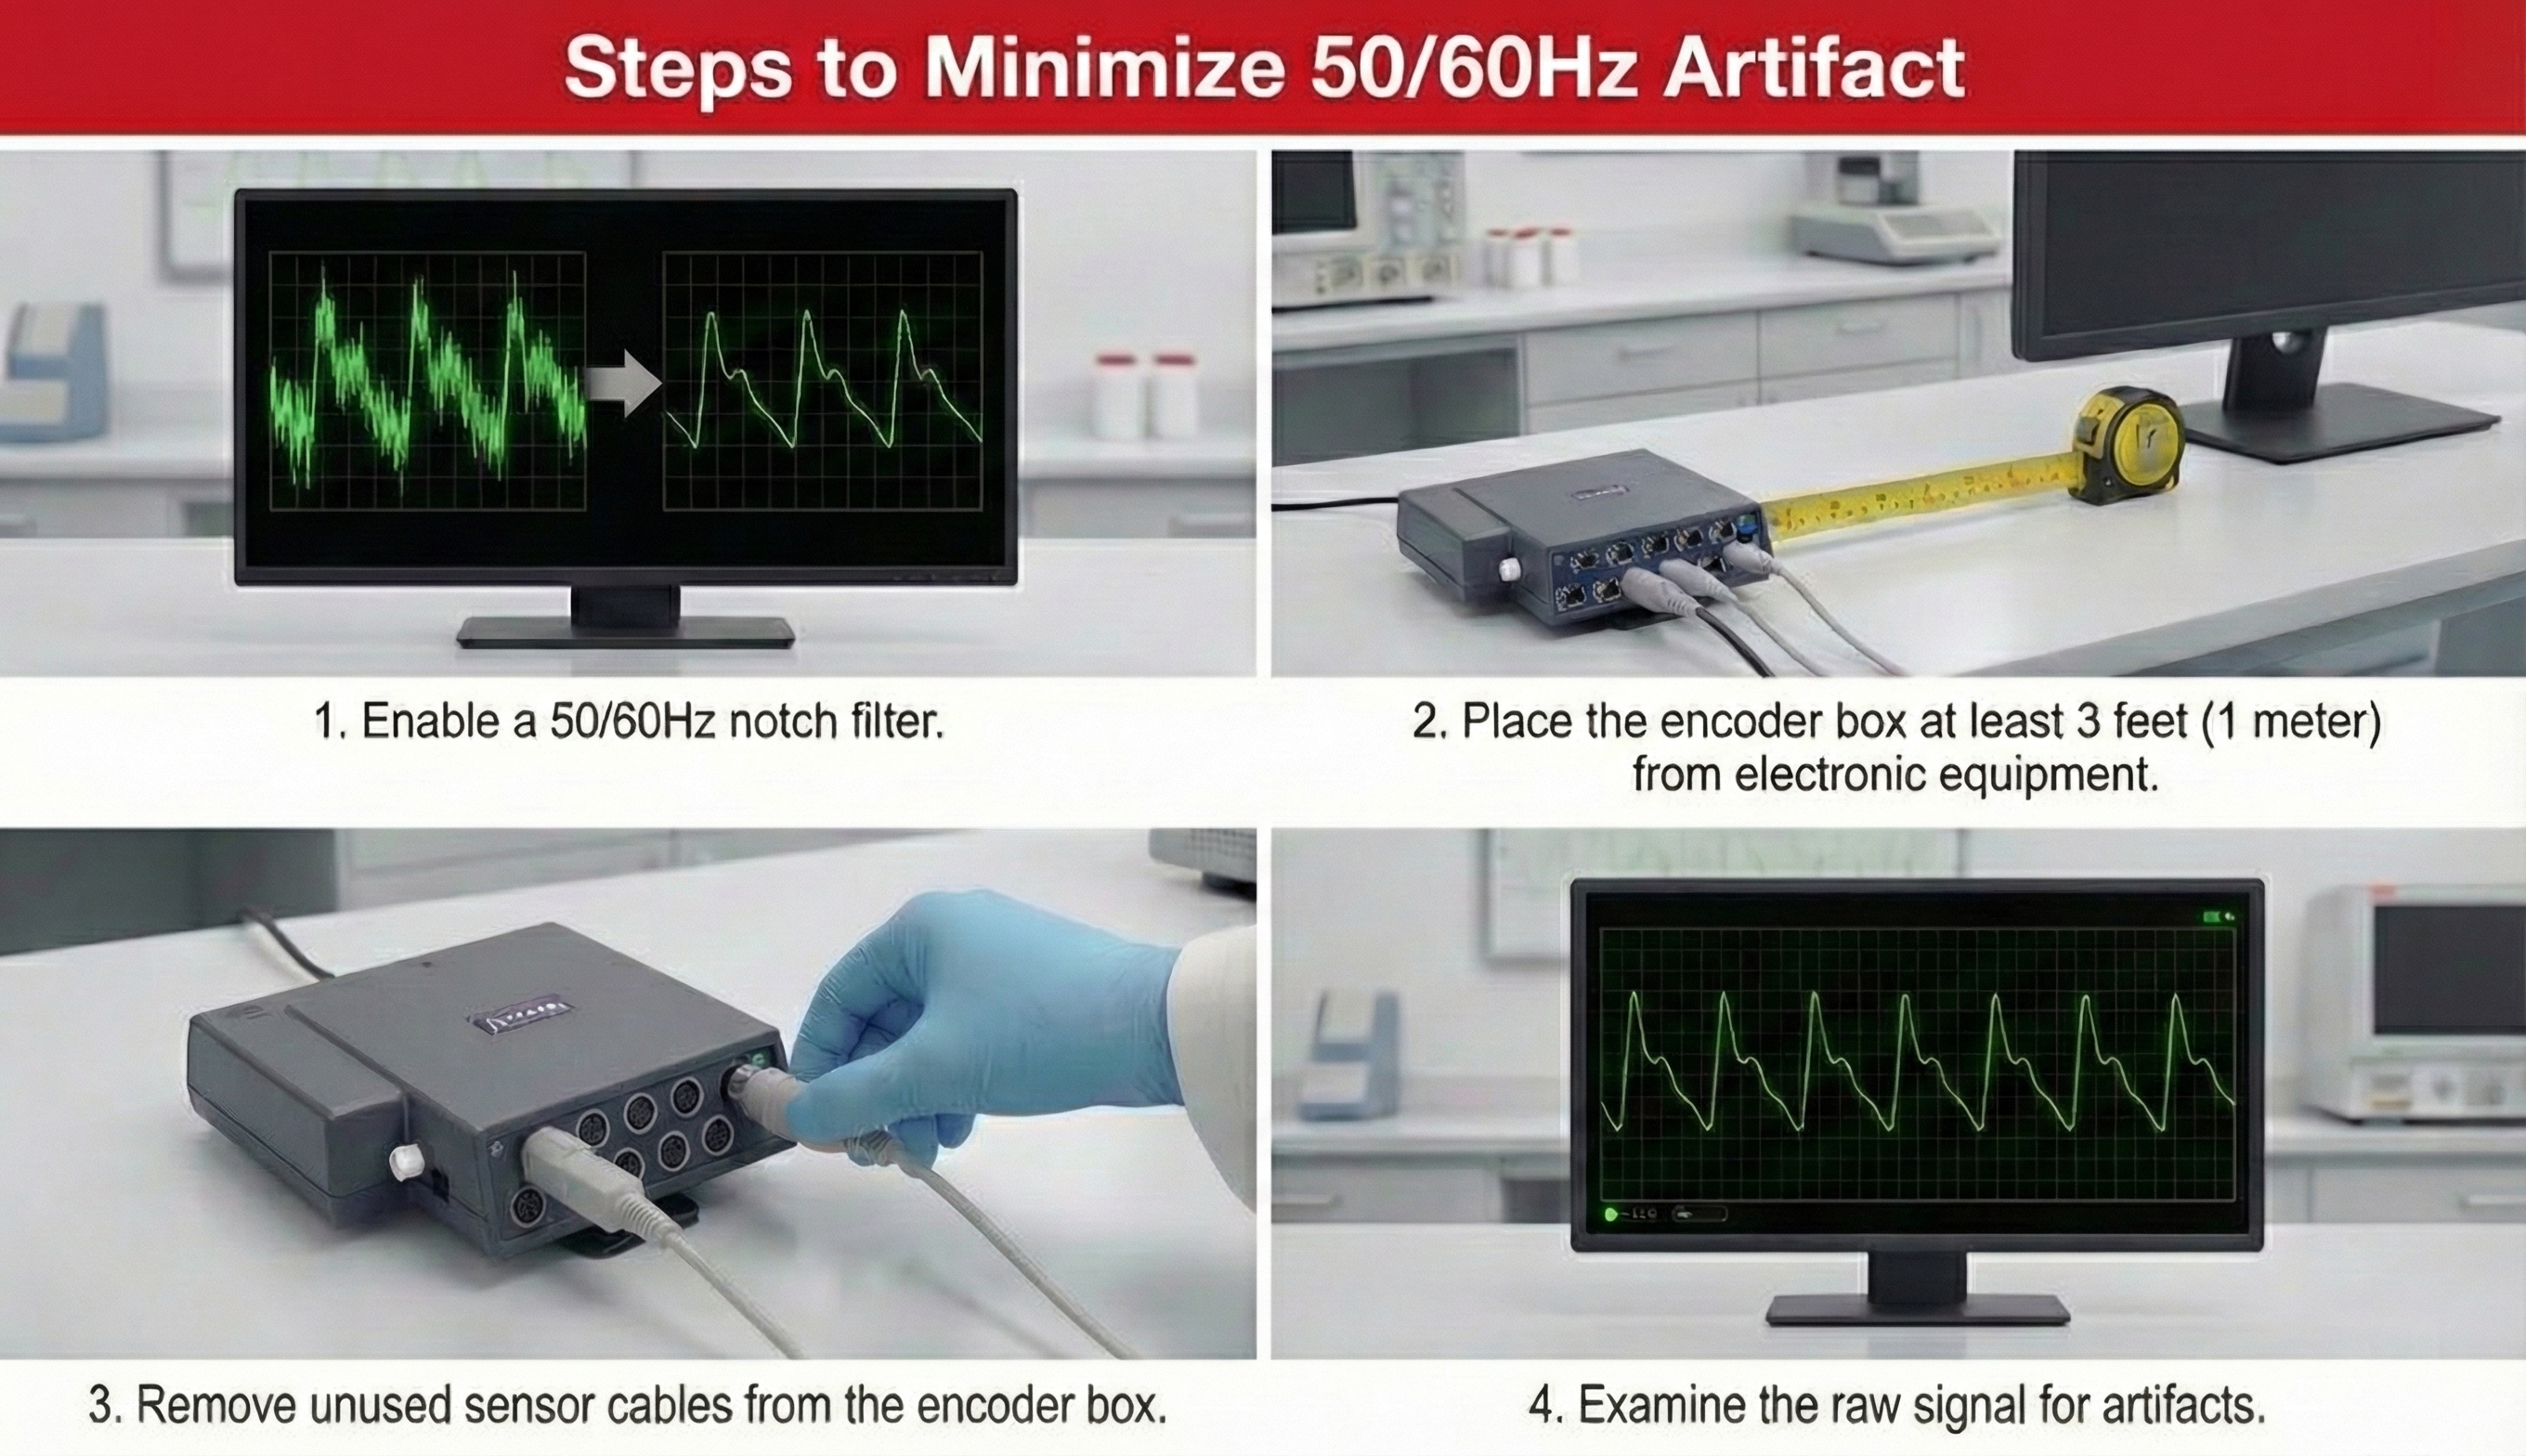
To minimize 50/60Hz artifact, use a notch filter if your equipment provides one. A notch filter selectively removes a narrow frequency band centered on the line frequency while preserving the rest of the signal. Place the encoder box at least 3 feet (1 meter) from electronic equipment including computers, monitors, smartphones, and fluorescent light ballasts, which can radiate significant electromagnetic interference. Remove unused sensor cables from the encoder box to reduce antenna effects, as dangling cables act as antennas that collect electromagnetic interference. Always examine the raw signal for artifact, looking for the characteristic ripple pattern during signal downswings.
Movement Artifact
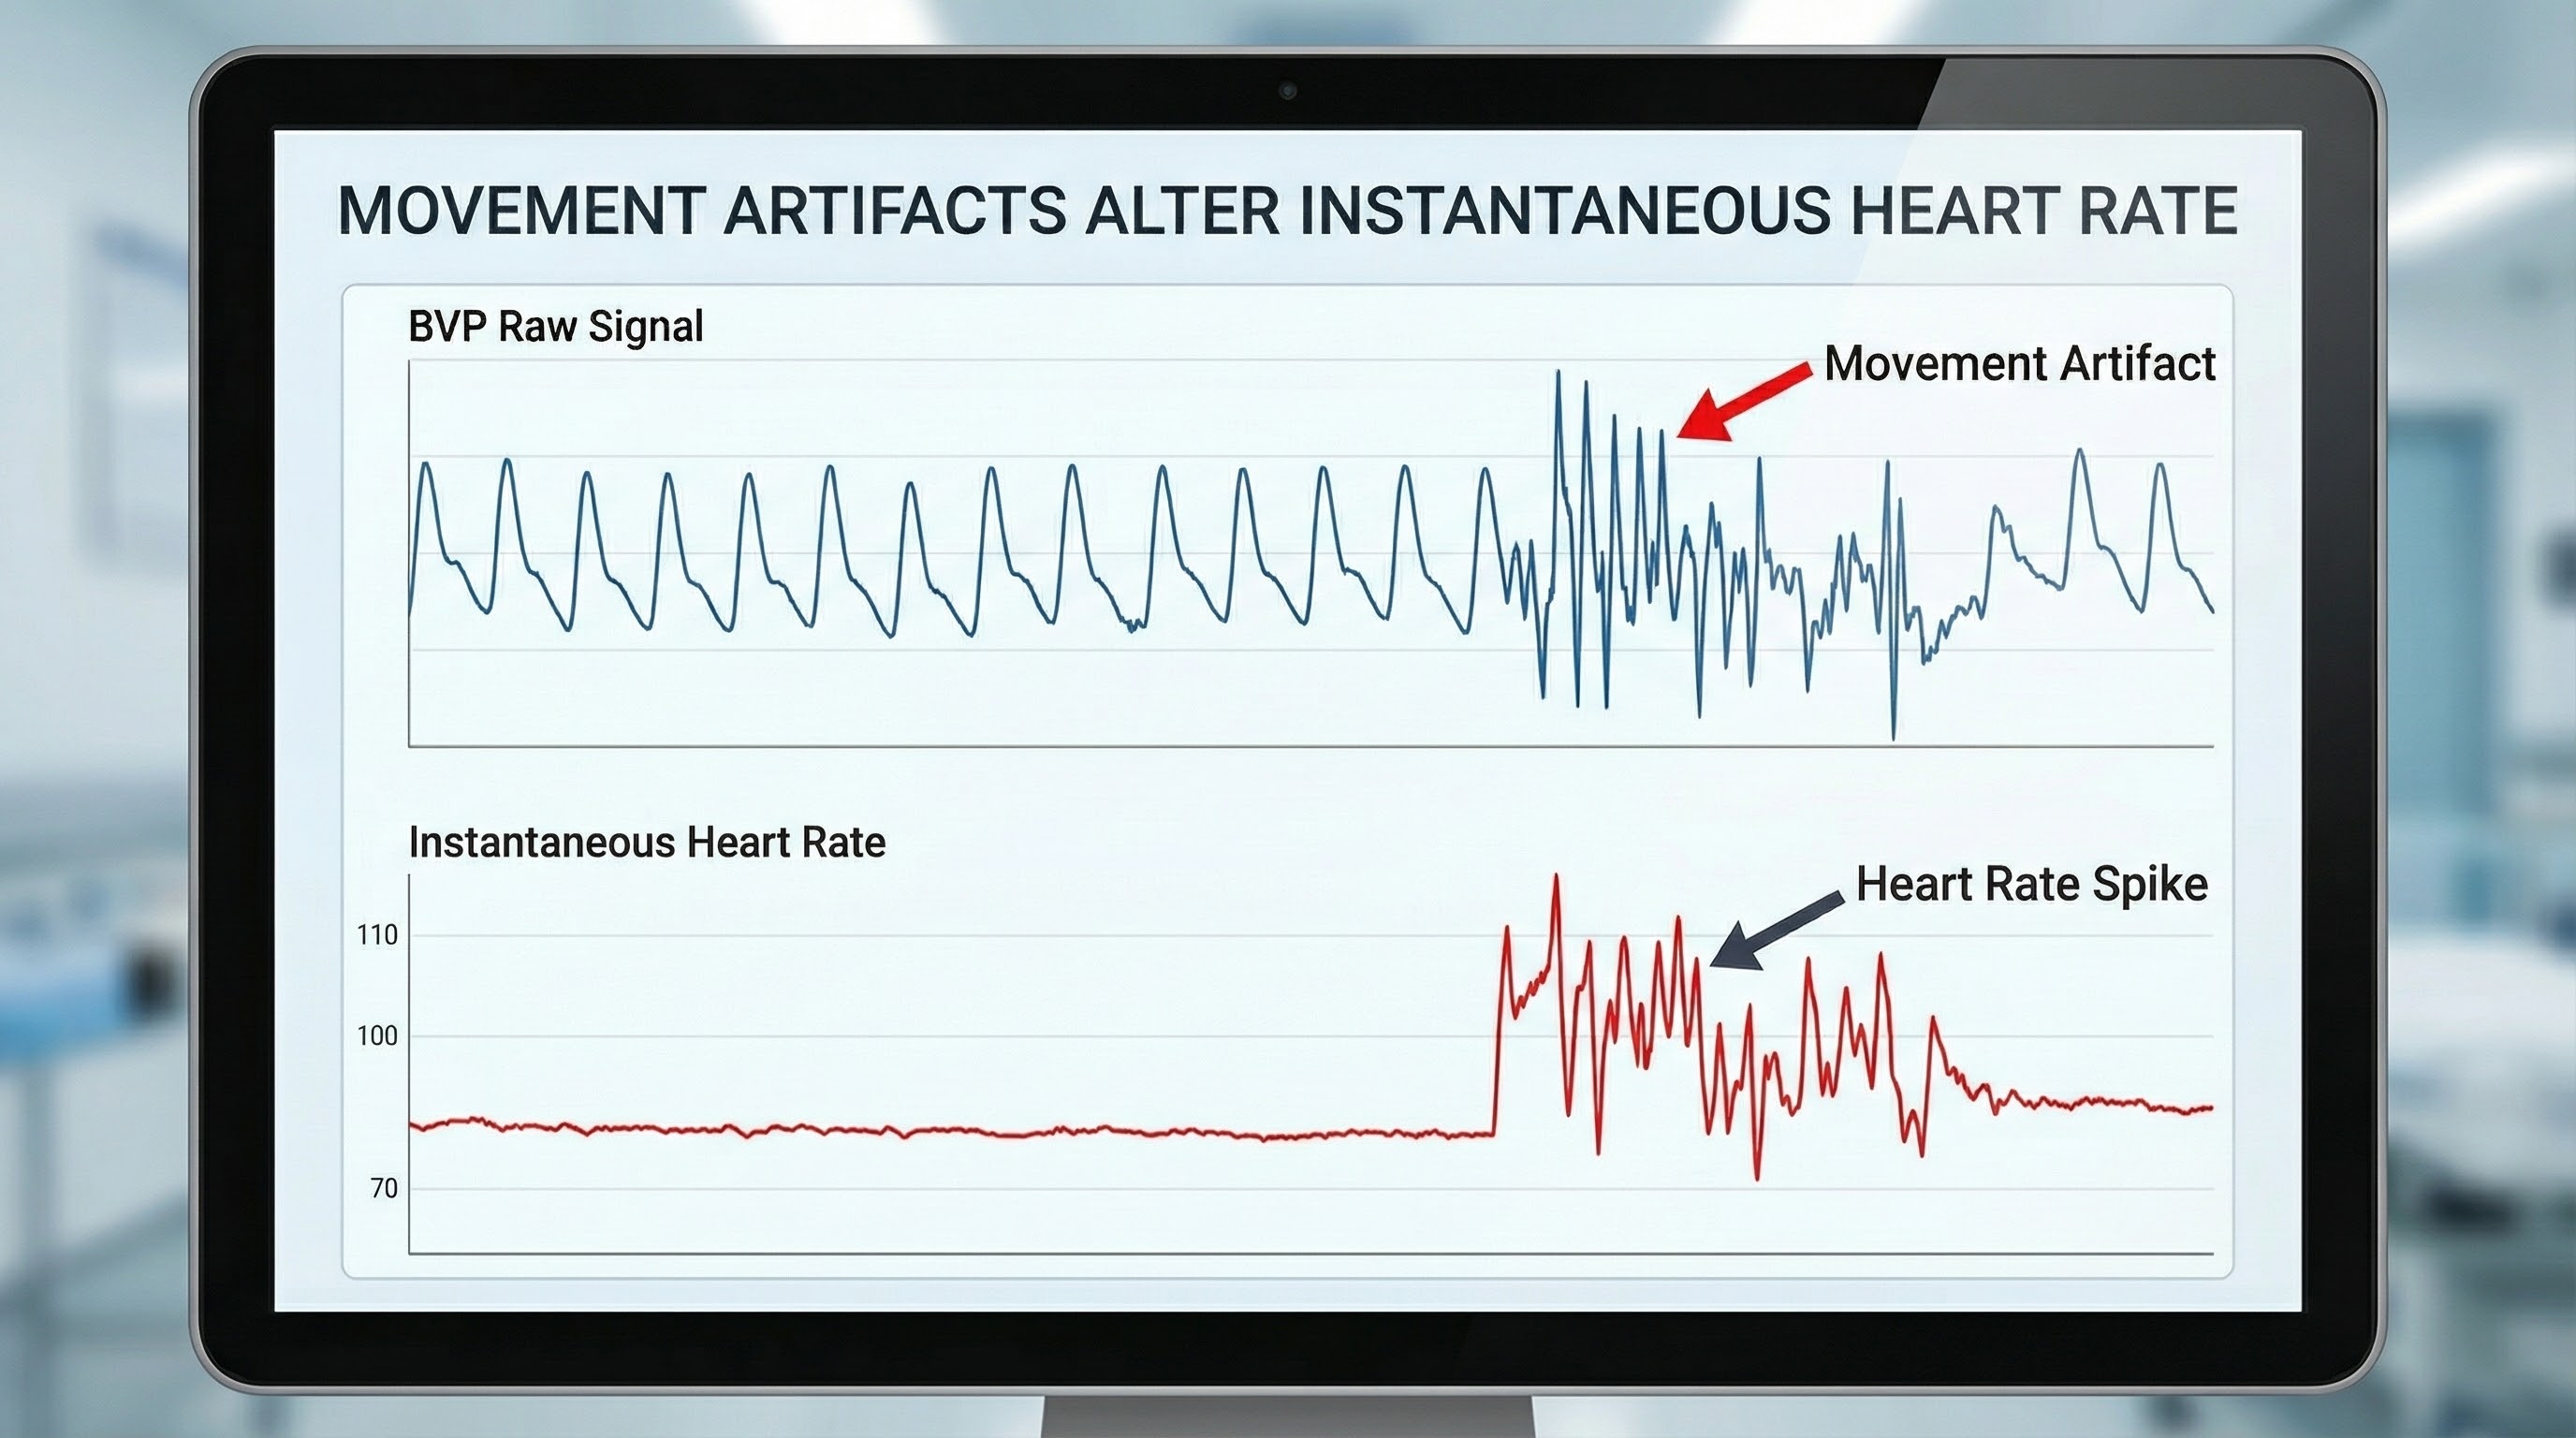
Sensor movement artifact is the leading cause of BVP signal distortion and can eliminate the signal entirely or result in extra or missed beats (Elgendi, 2012; Shaffer & Combatalade, 2013). Even subtle movements, such as shifting weight in a chair, adjusting posture, or the natural tremor that accompanies muscle tension, can dramatically affect signal quality. Understanding why movement causes artifact helps you explain the importance of stillness to your clients.
🎧 Mini-Lecture: BVP Movement Artifact
Sensor movement can interfere with infrared light transmission in two ways: by changing the path length through the tissue or by creating gaps between the sensor and skin that allow contamination by ambient light. A finger twitch, hand gesture, or shift in position can transform a clean signal into unusable noise in an instant. Talking, coughing, and deep sighs can also generate movement artifacts, particularly if the client's hands are not well-supported.

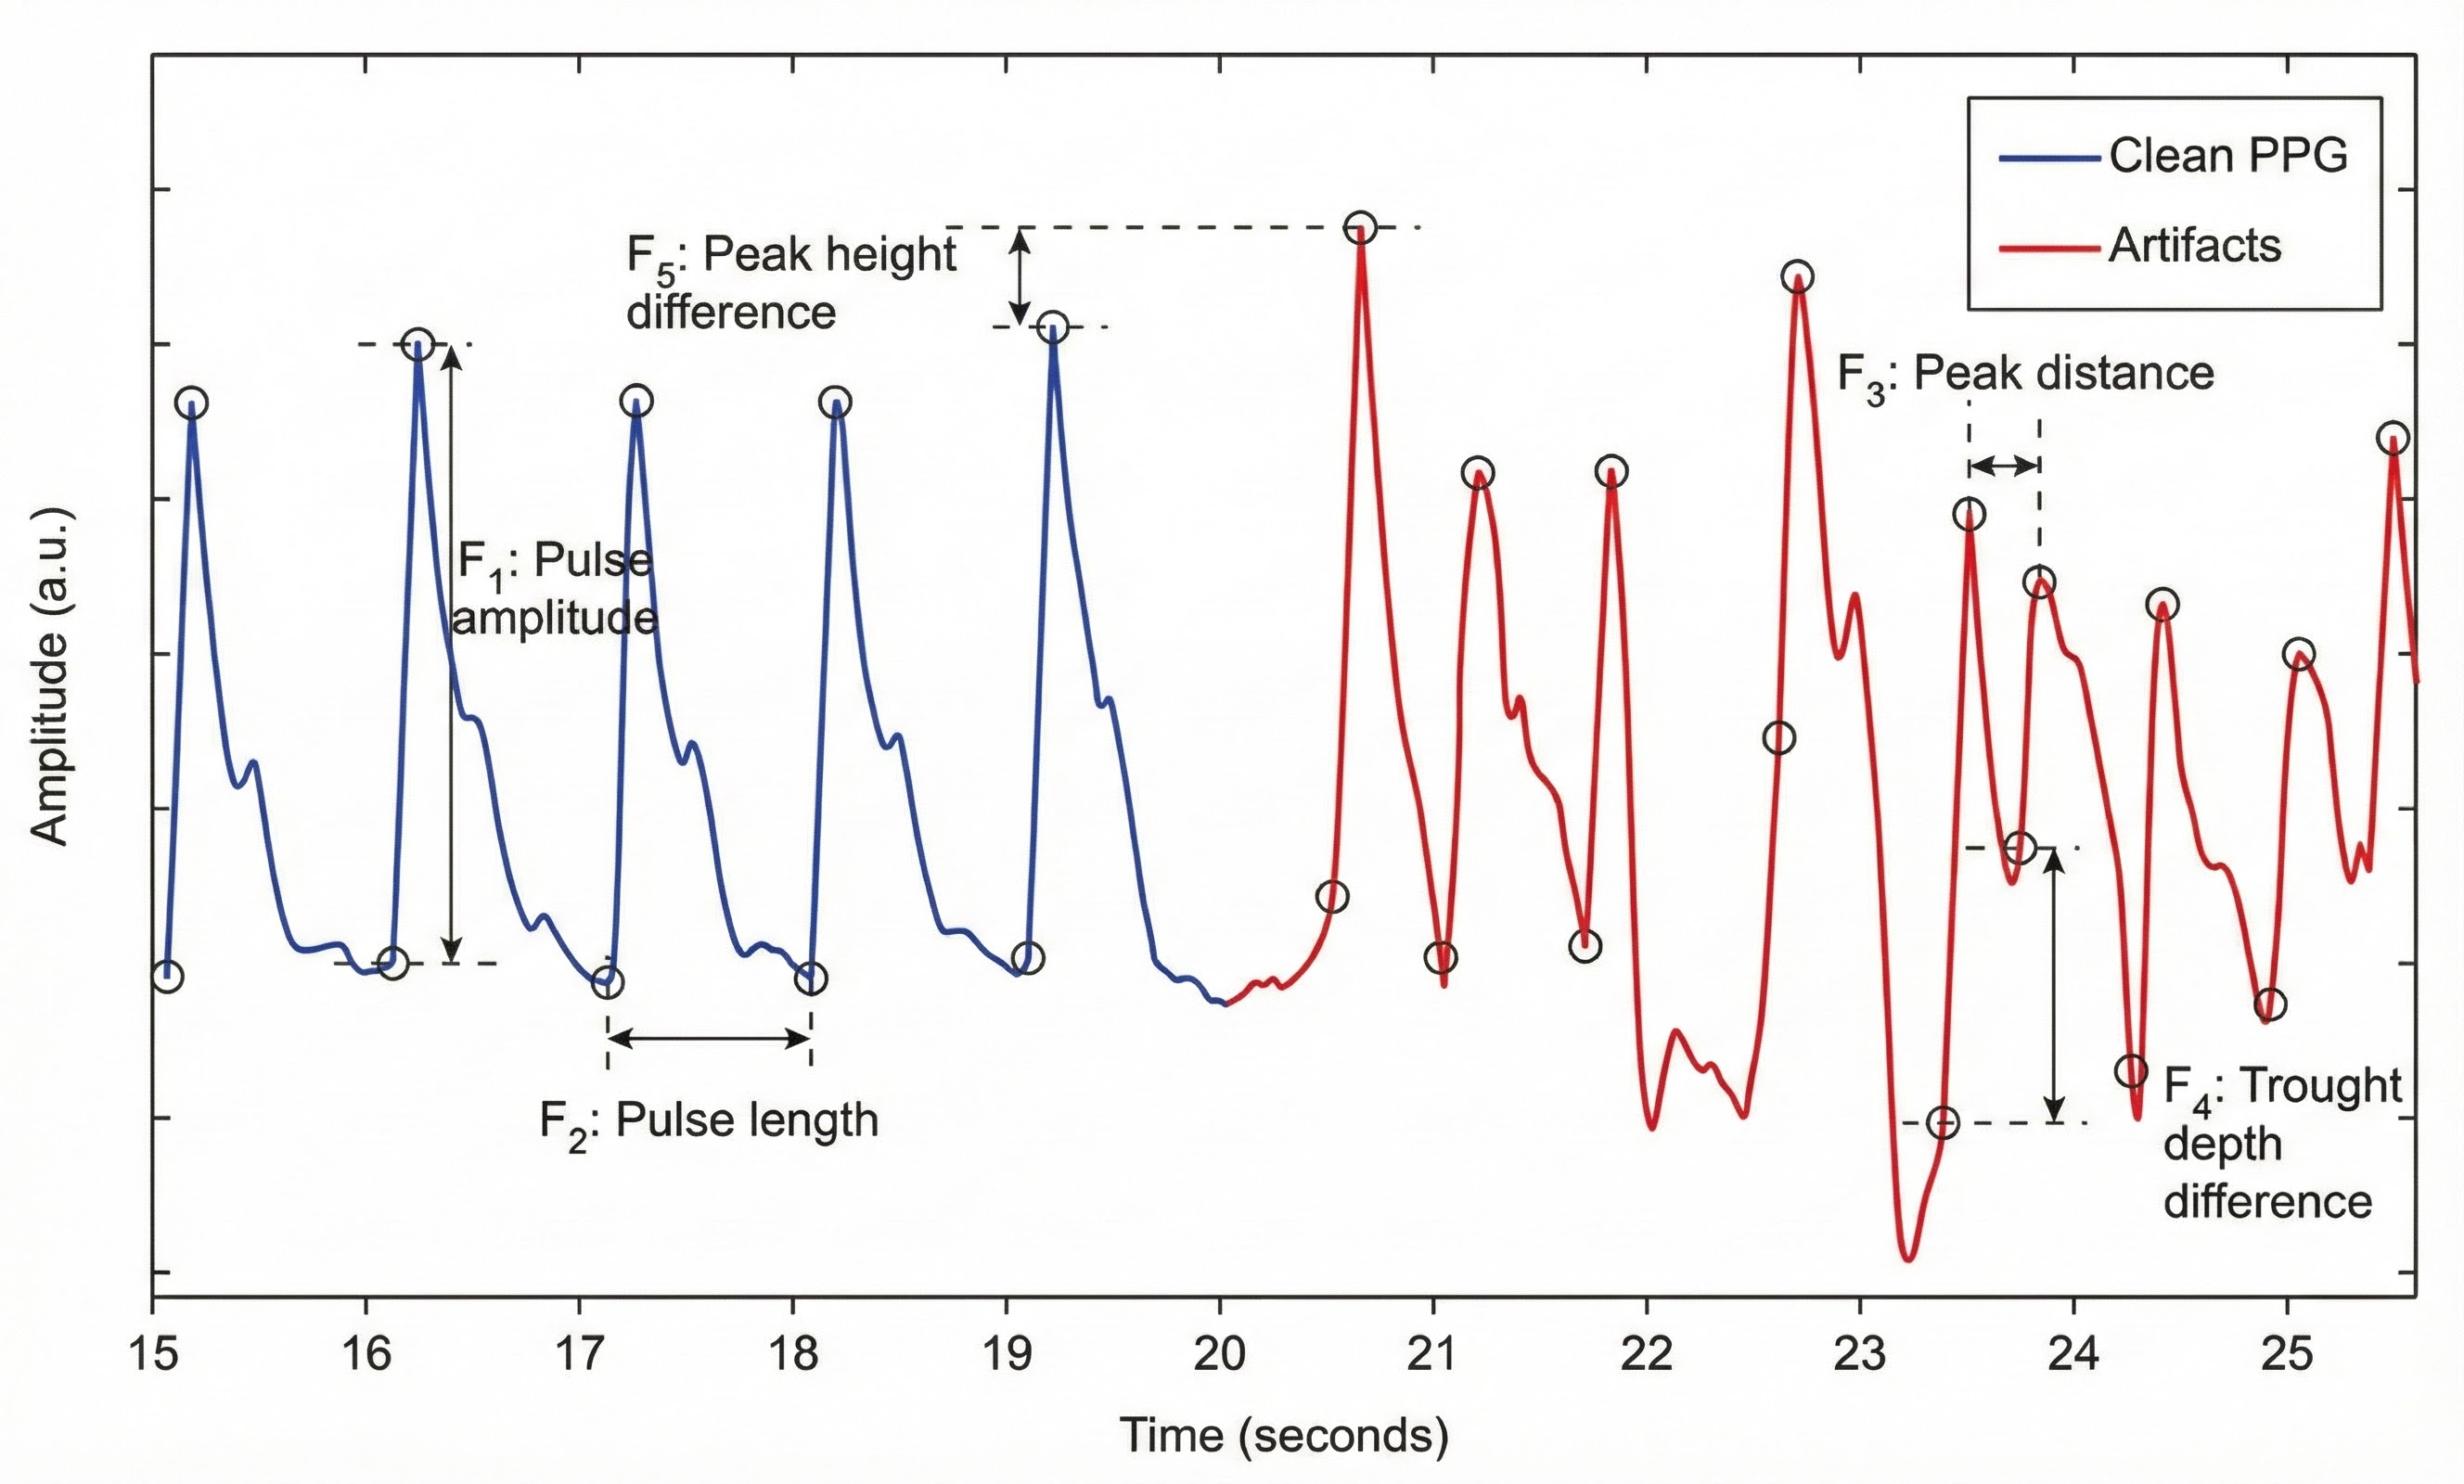
Movement artifacts appear as signal distortions that disrupt the normal waveform pattern. They can take many forms depending on the type and direction of movement. In the graphic below, movement artifacts are colored red (Couceiro et al., 2014). Notice how the contaminated segments stand out clearly when compared to the regular waveform pattern before and after.
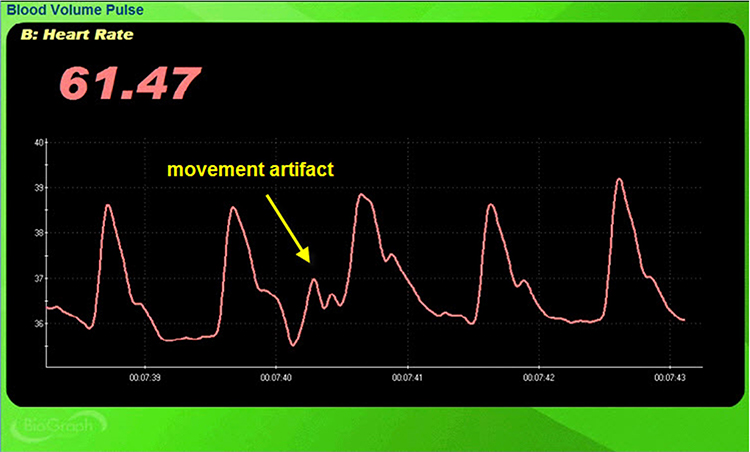
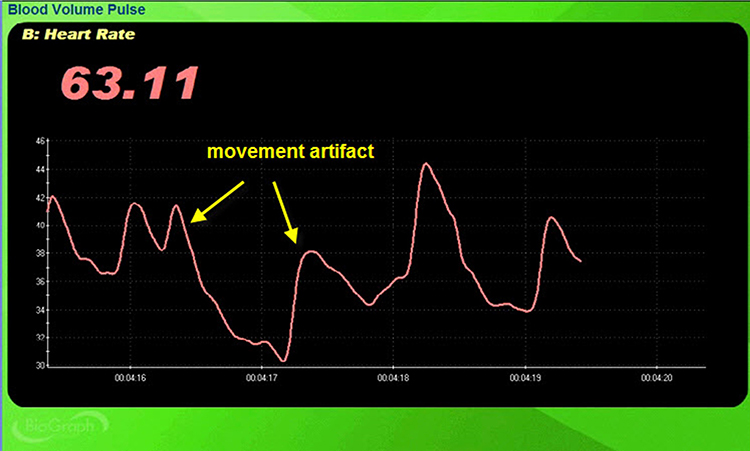
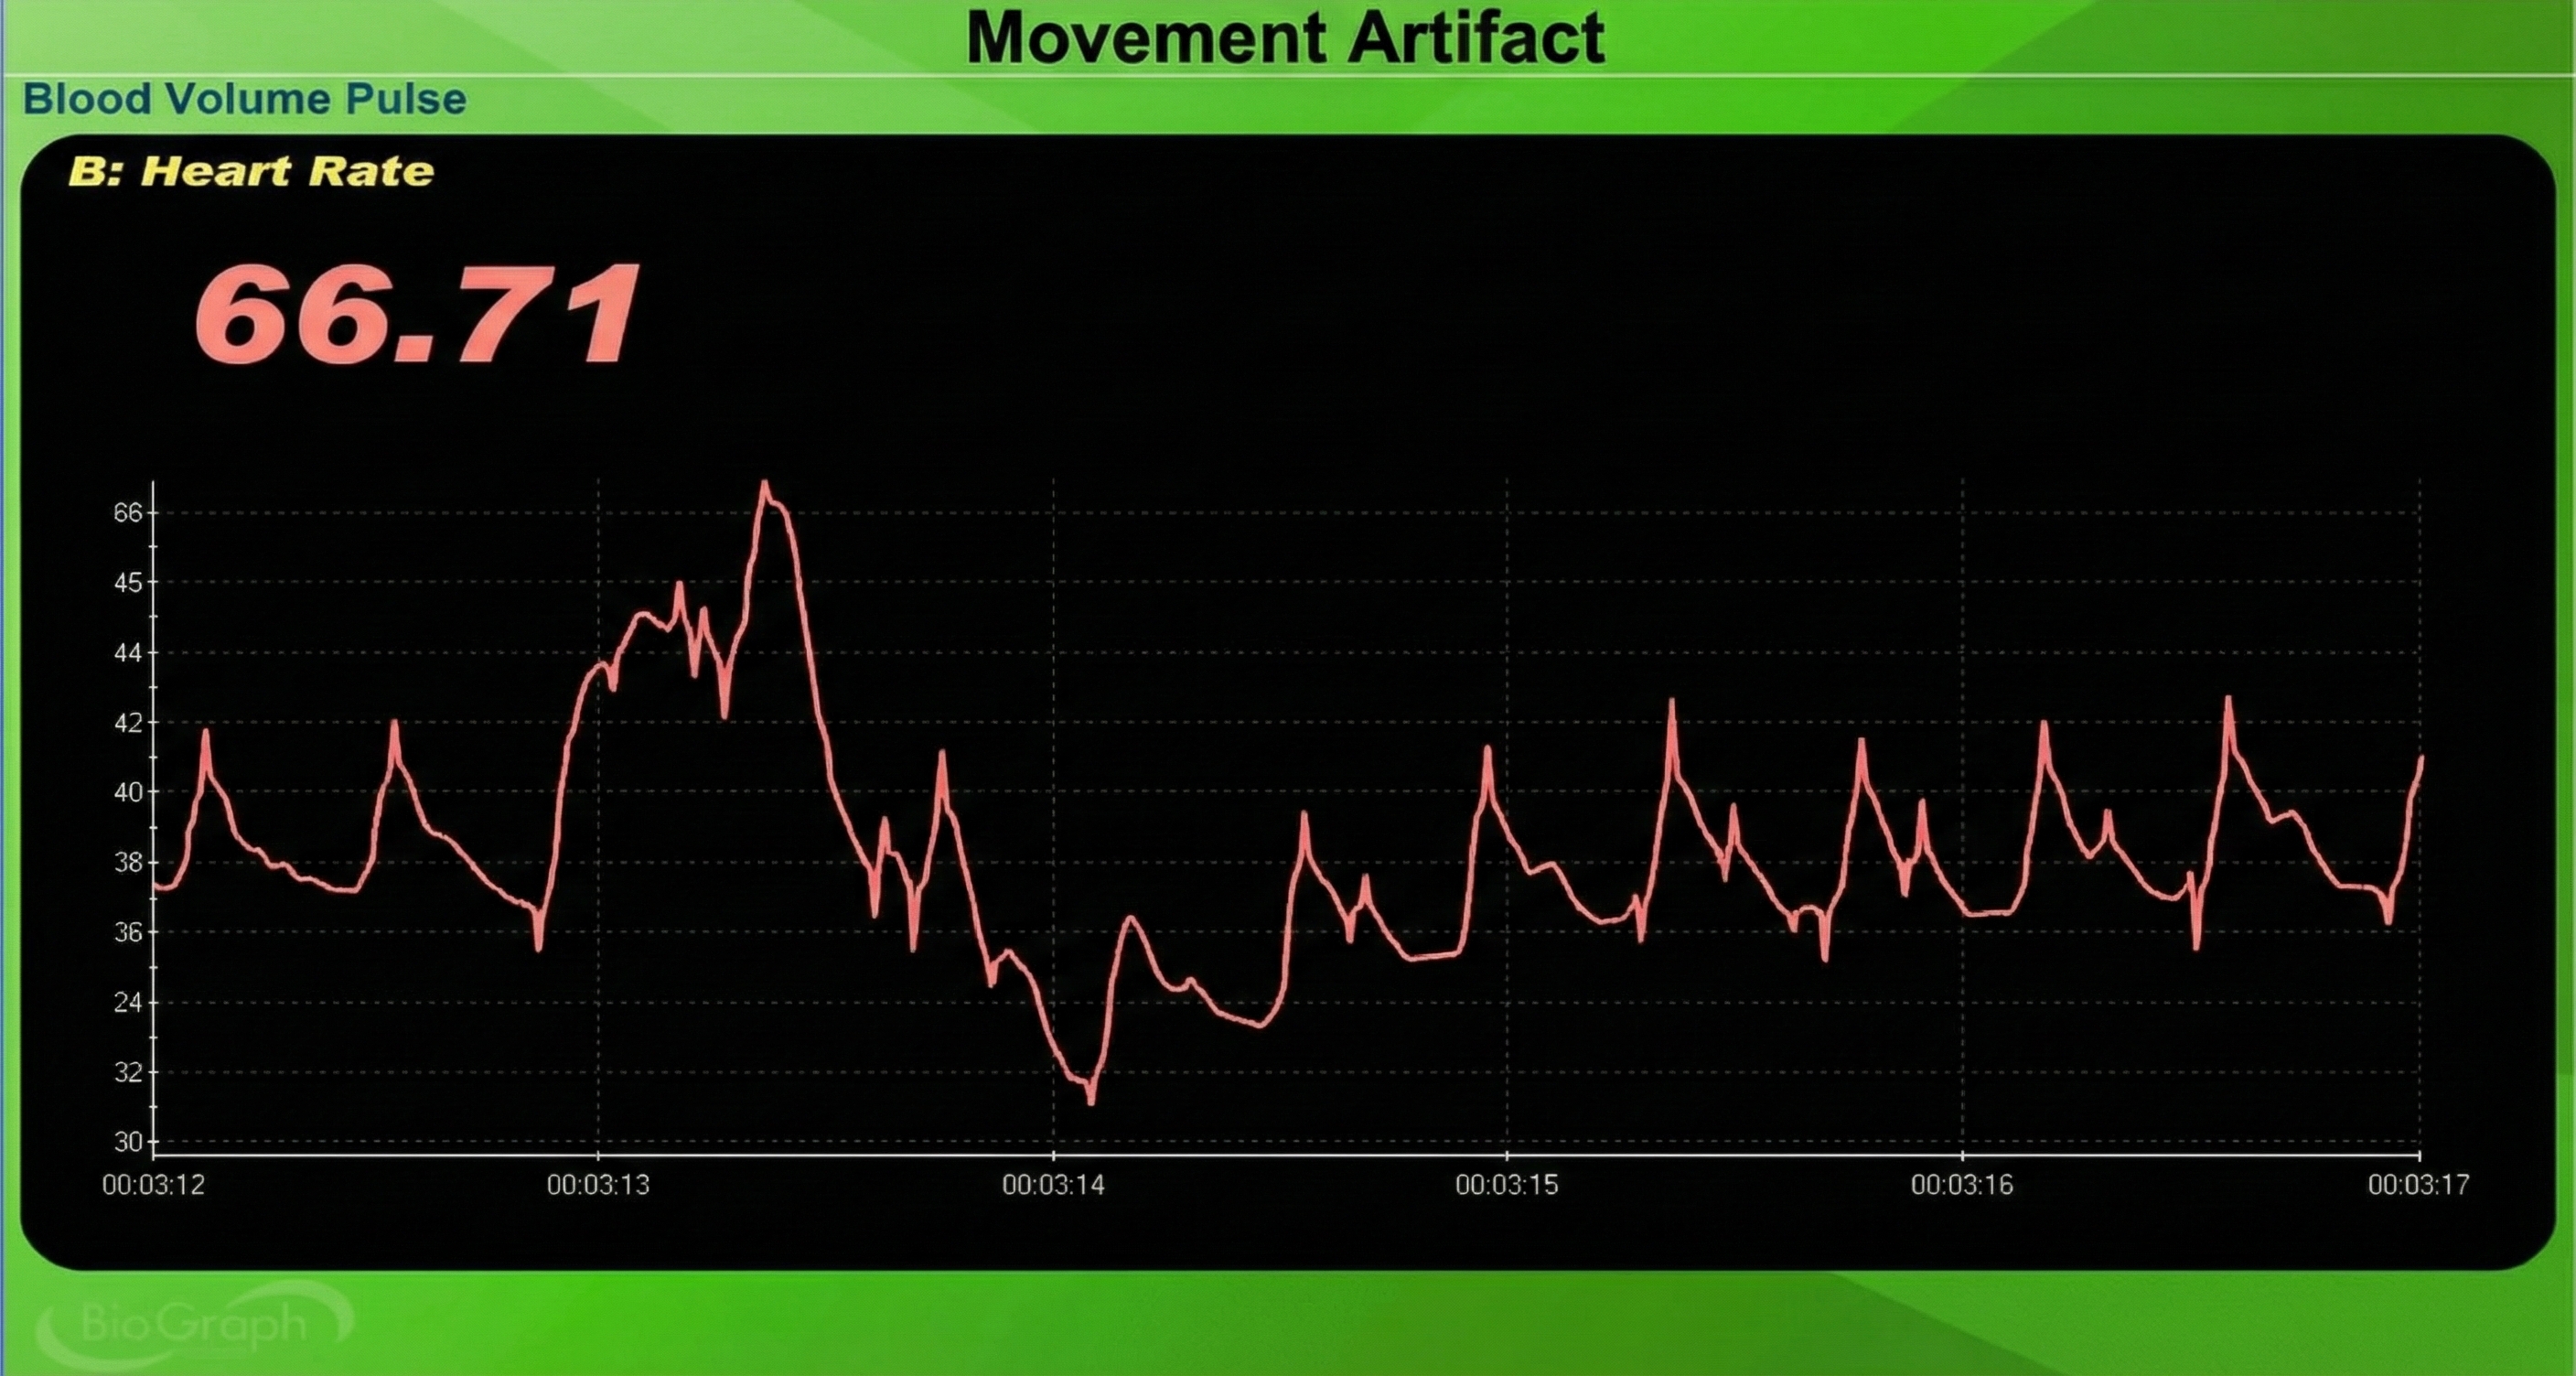
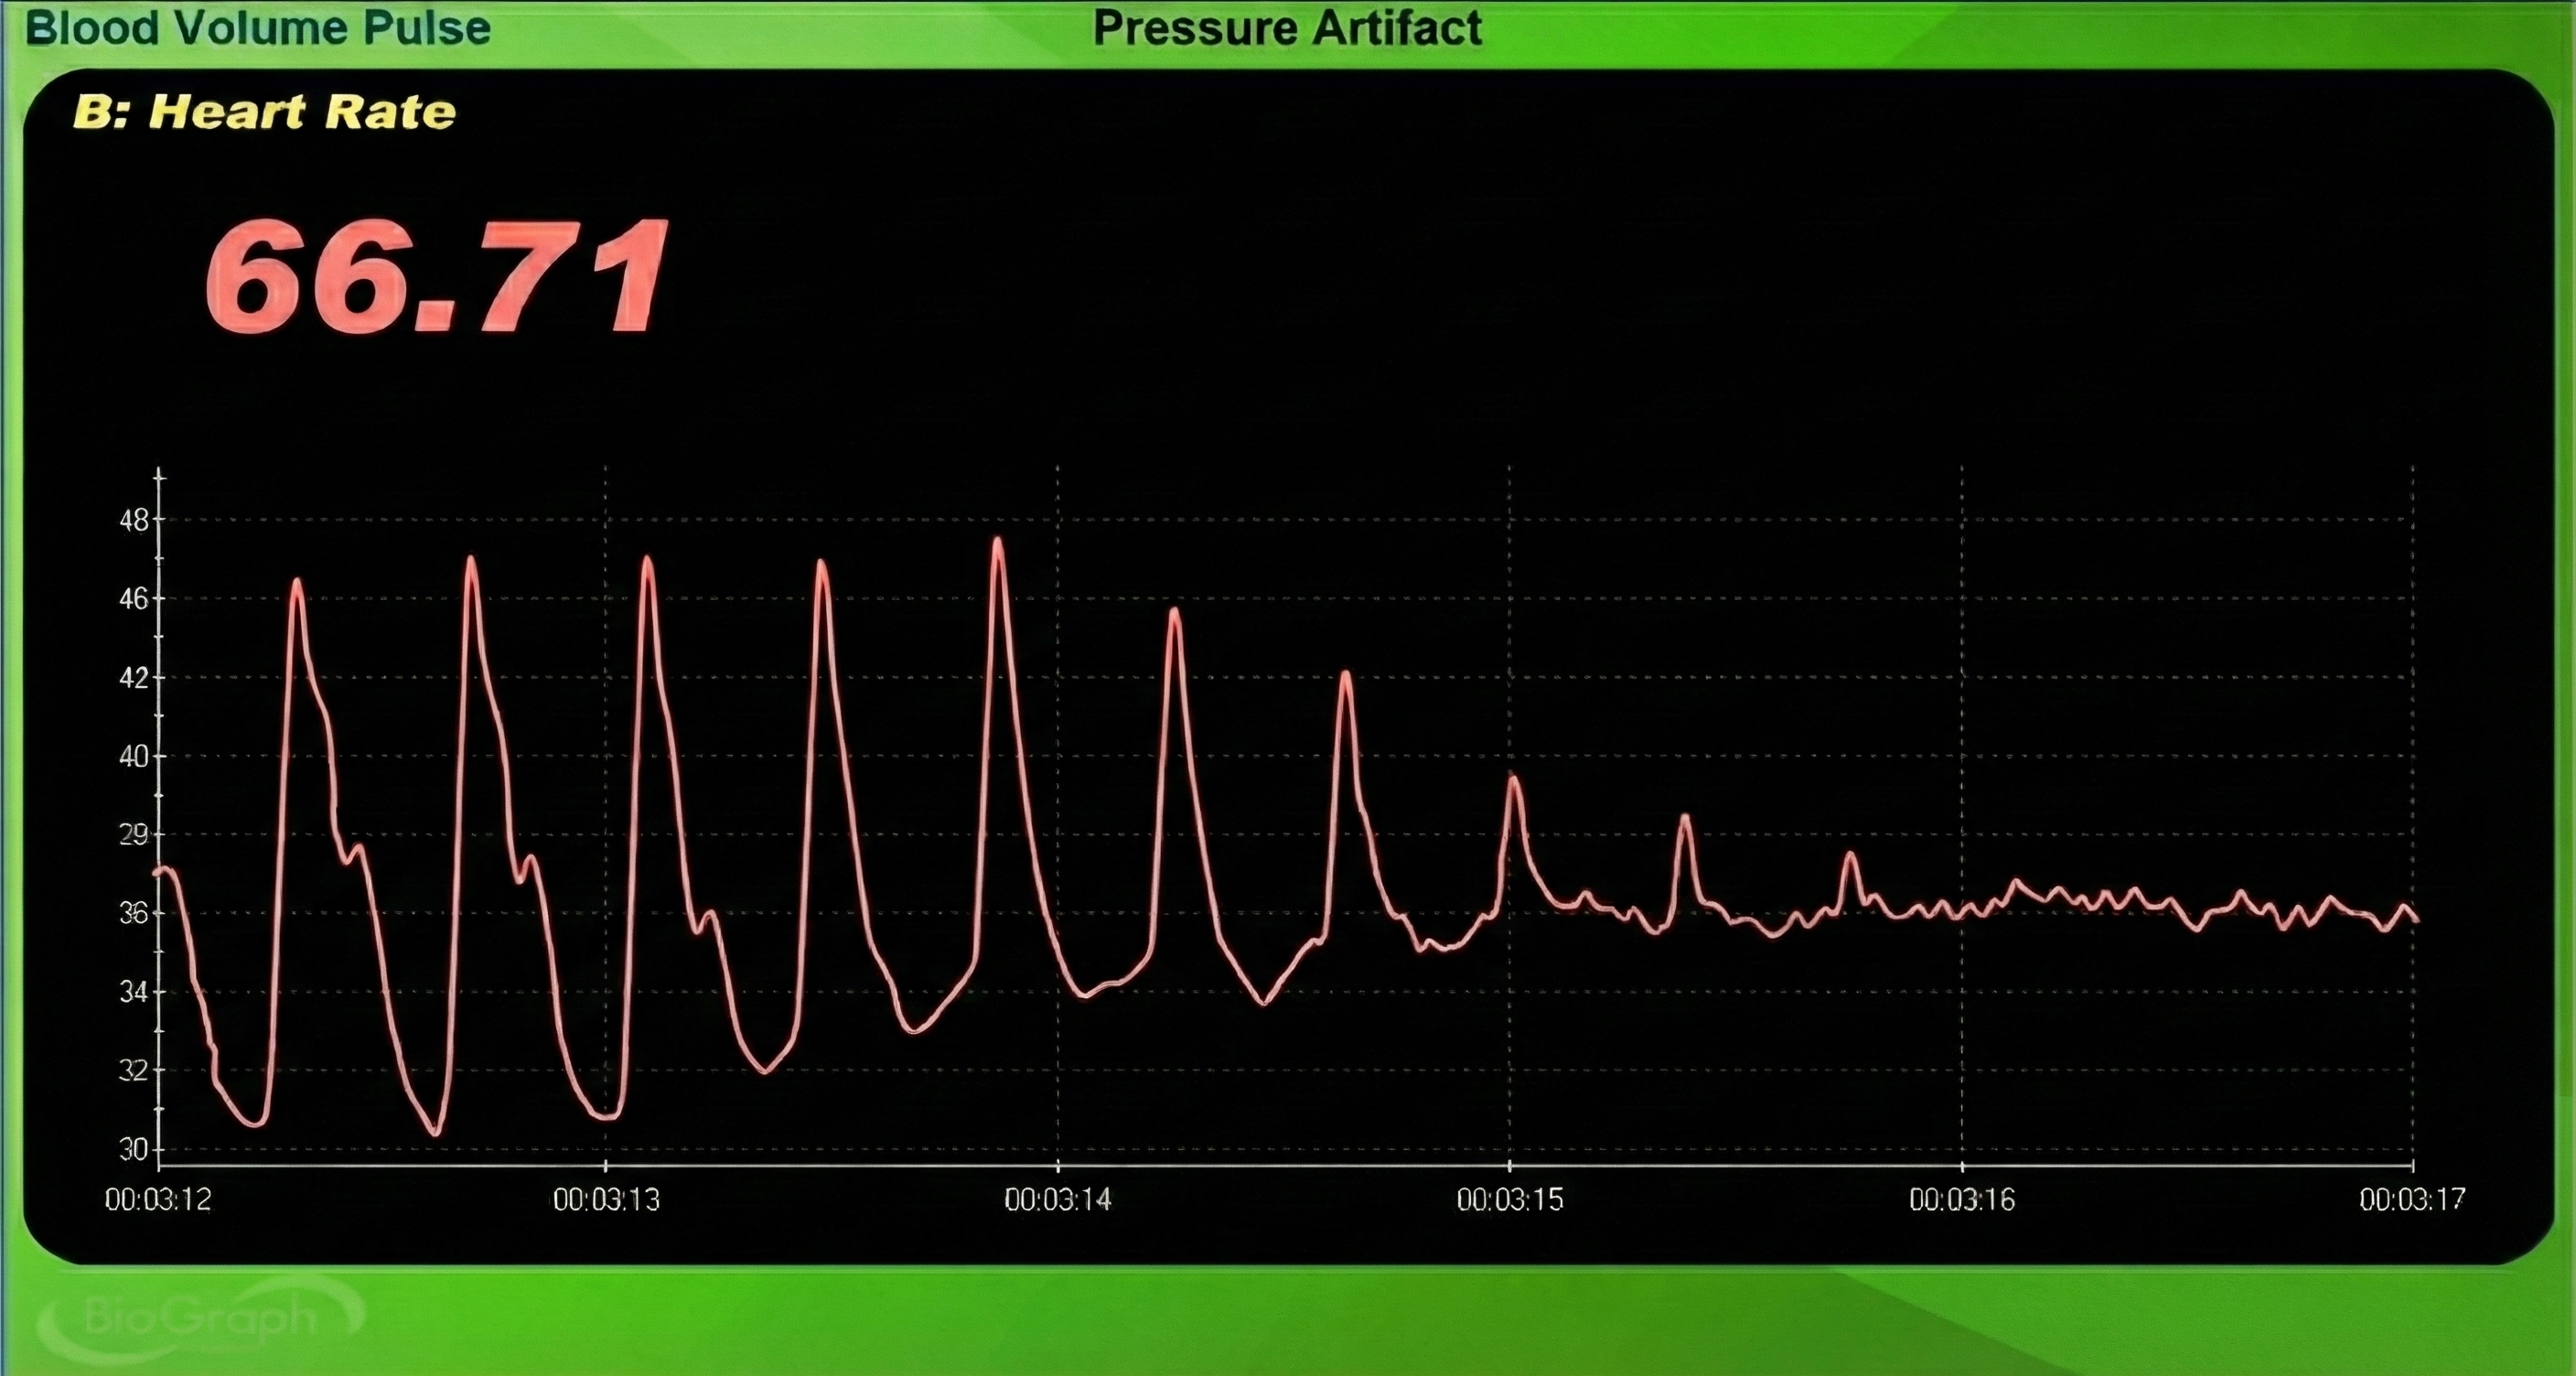
Inspection of the raw BVP signal can detect movement artifacts readily when you know what to look for. Below is a BioGraph Infiniti BVP display showing movement artifacts. Note the appearance of ripples and distortion in the shape of the waveform that differ markedly from the clean segments.
Movement artifacts can distort the BVP waveform in different ways.
Standing and sitting can produce blood pressure-mediated upward and downward drifts. Arm movement above or below the heart can also generate drifts.
Repeated movements like finger tapping can create waveforms with ripples that resemble multiple notches.
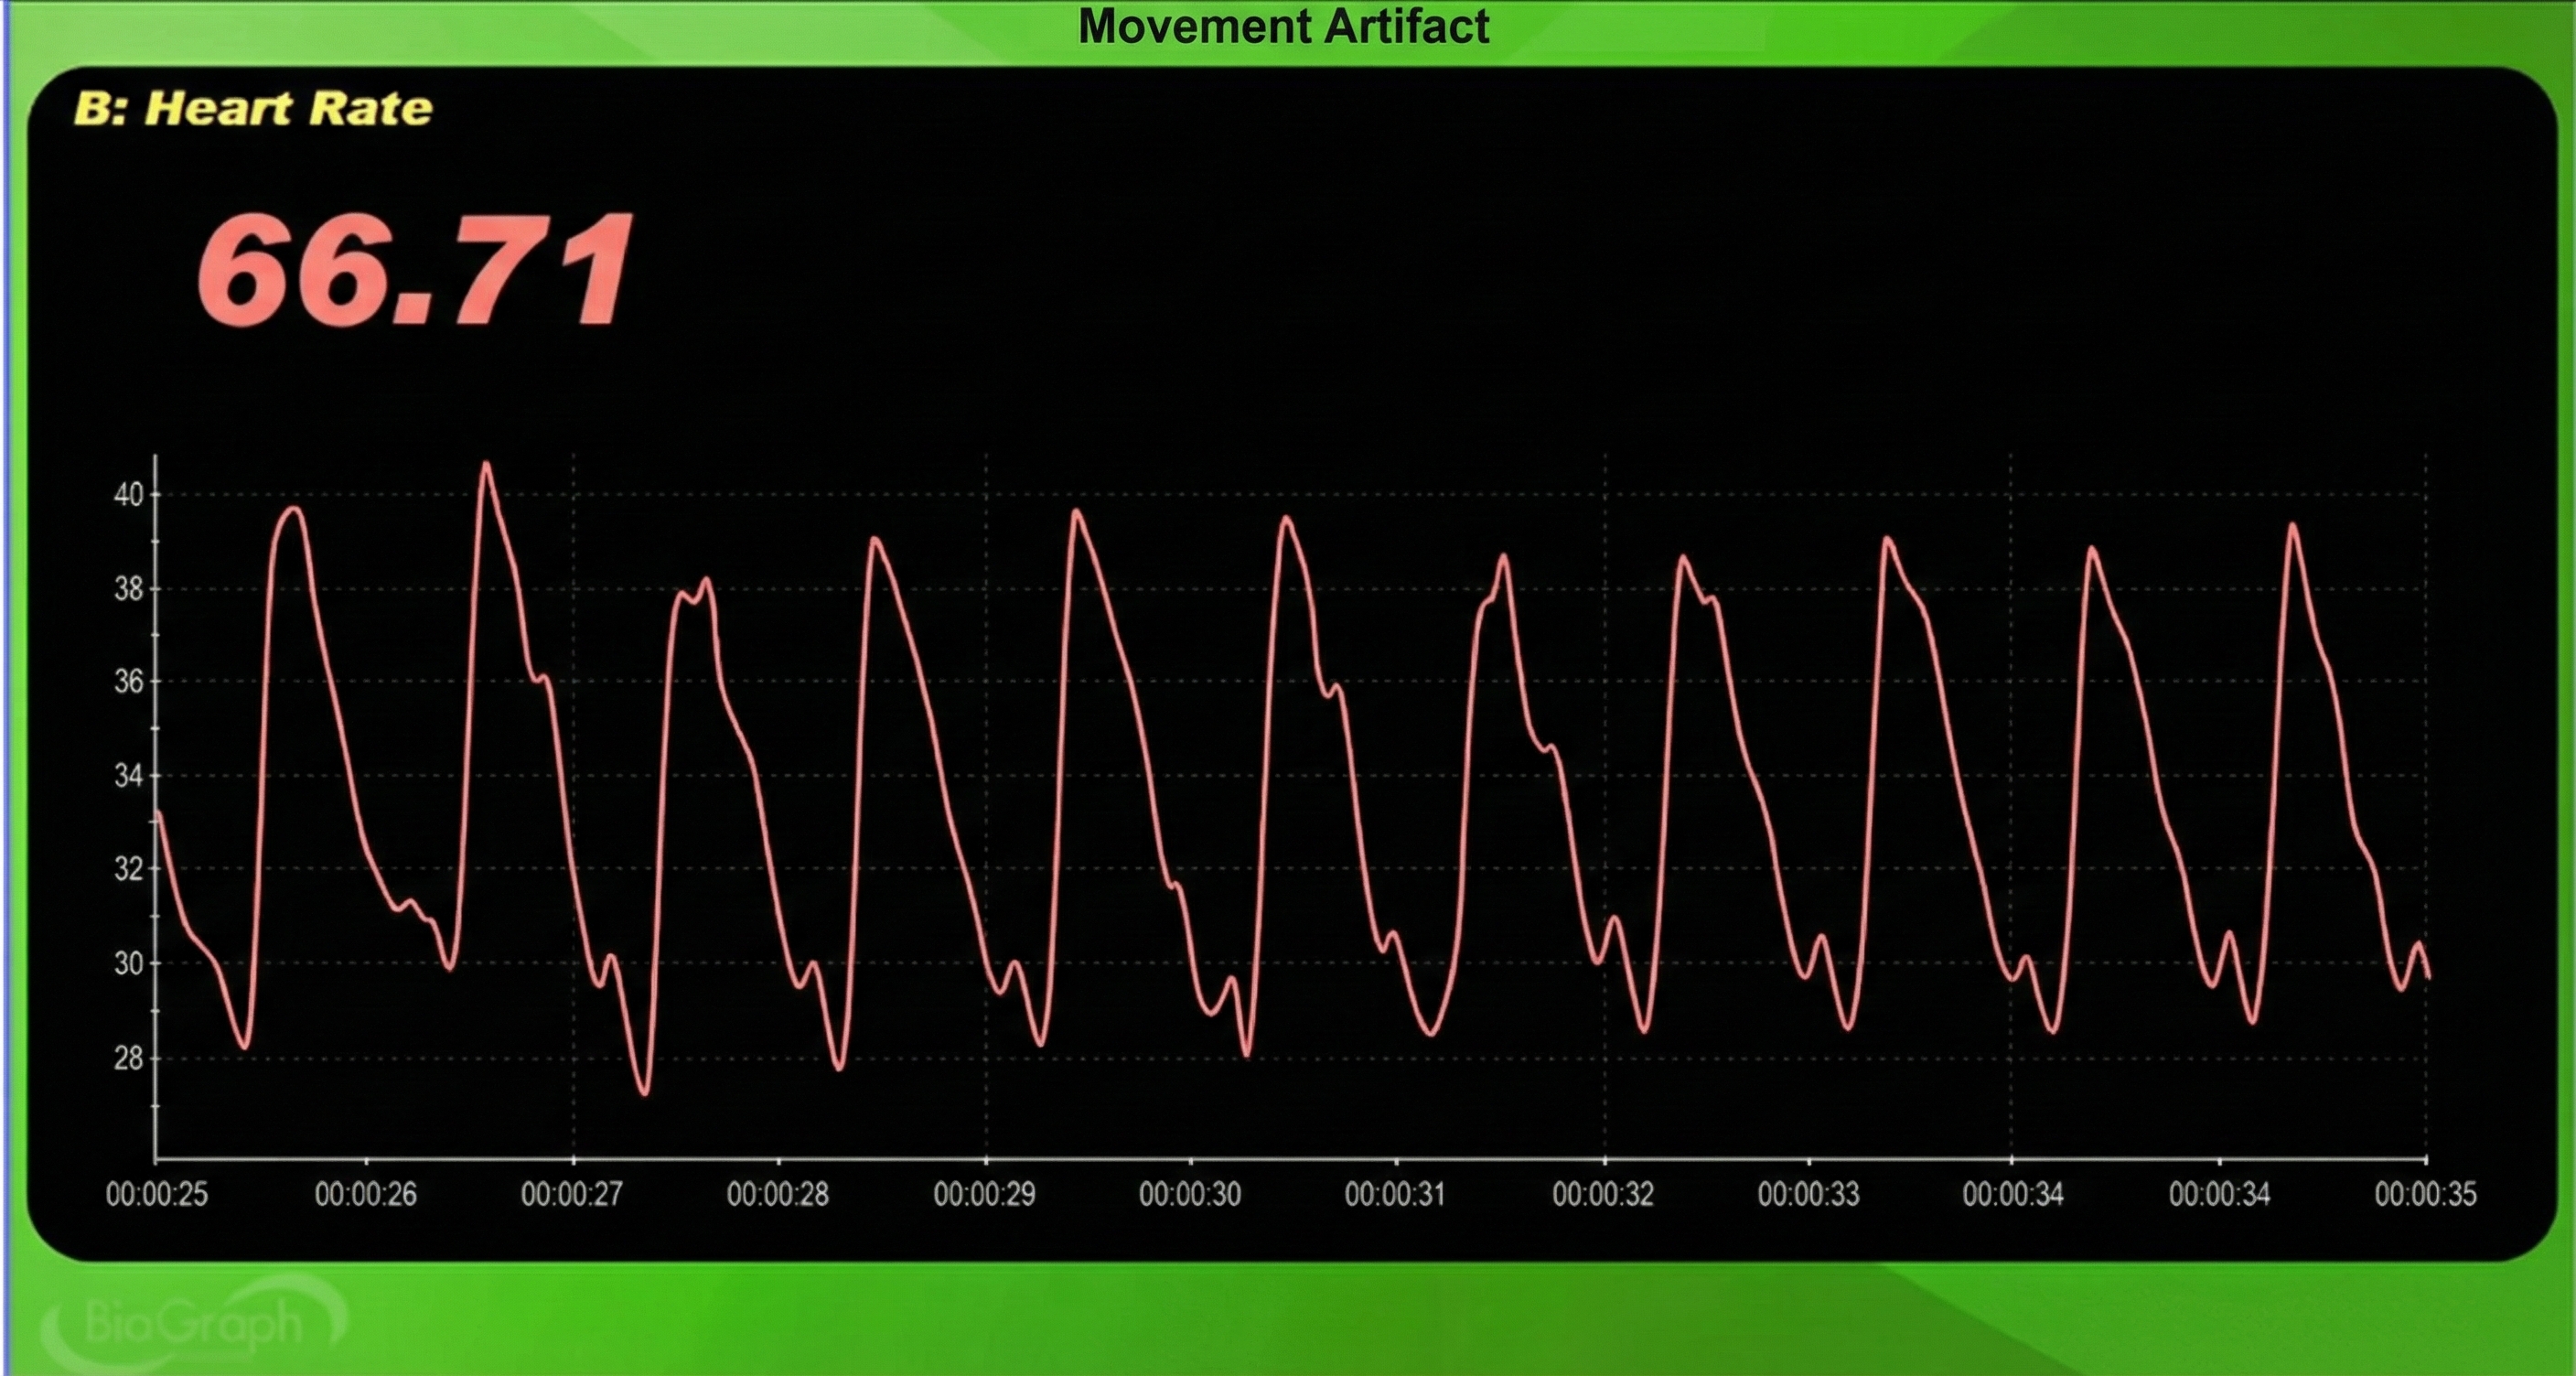
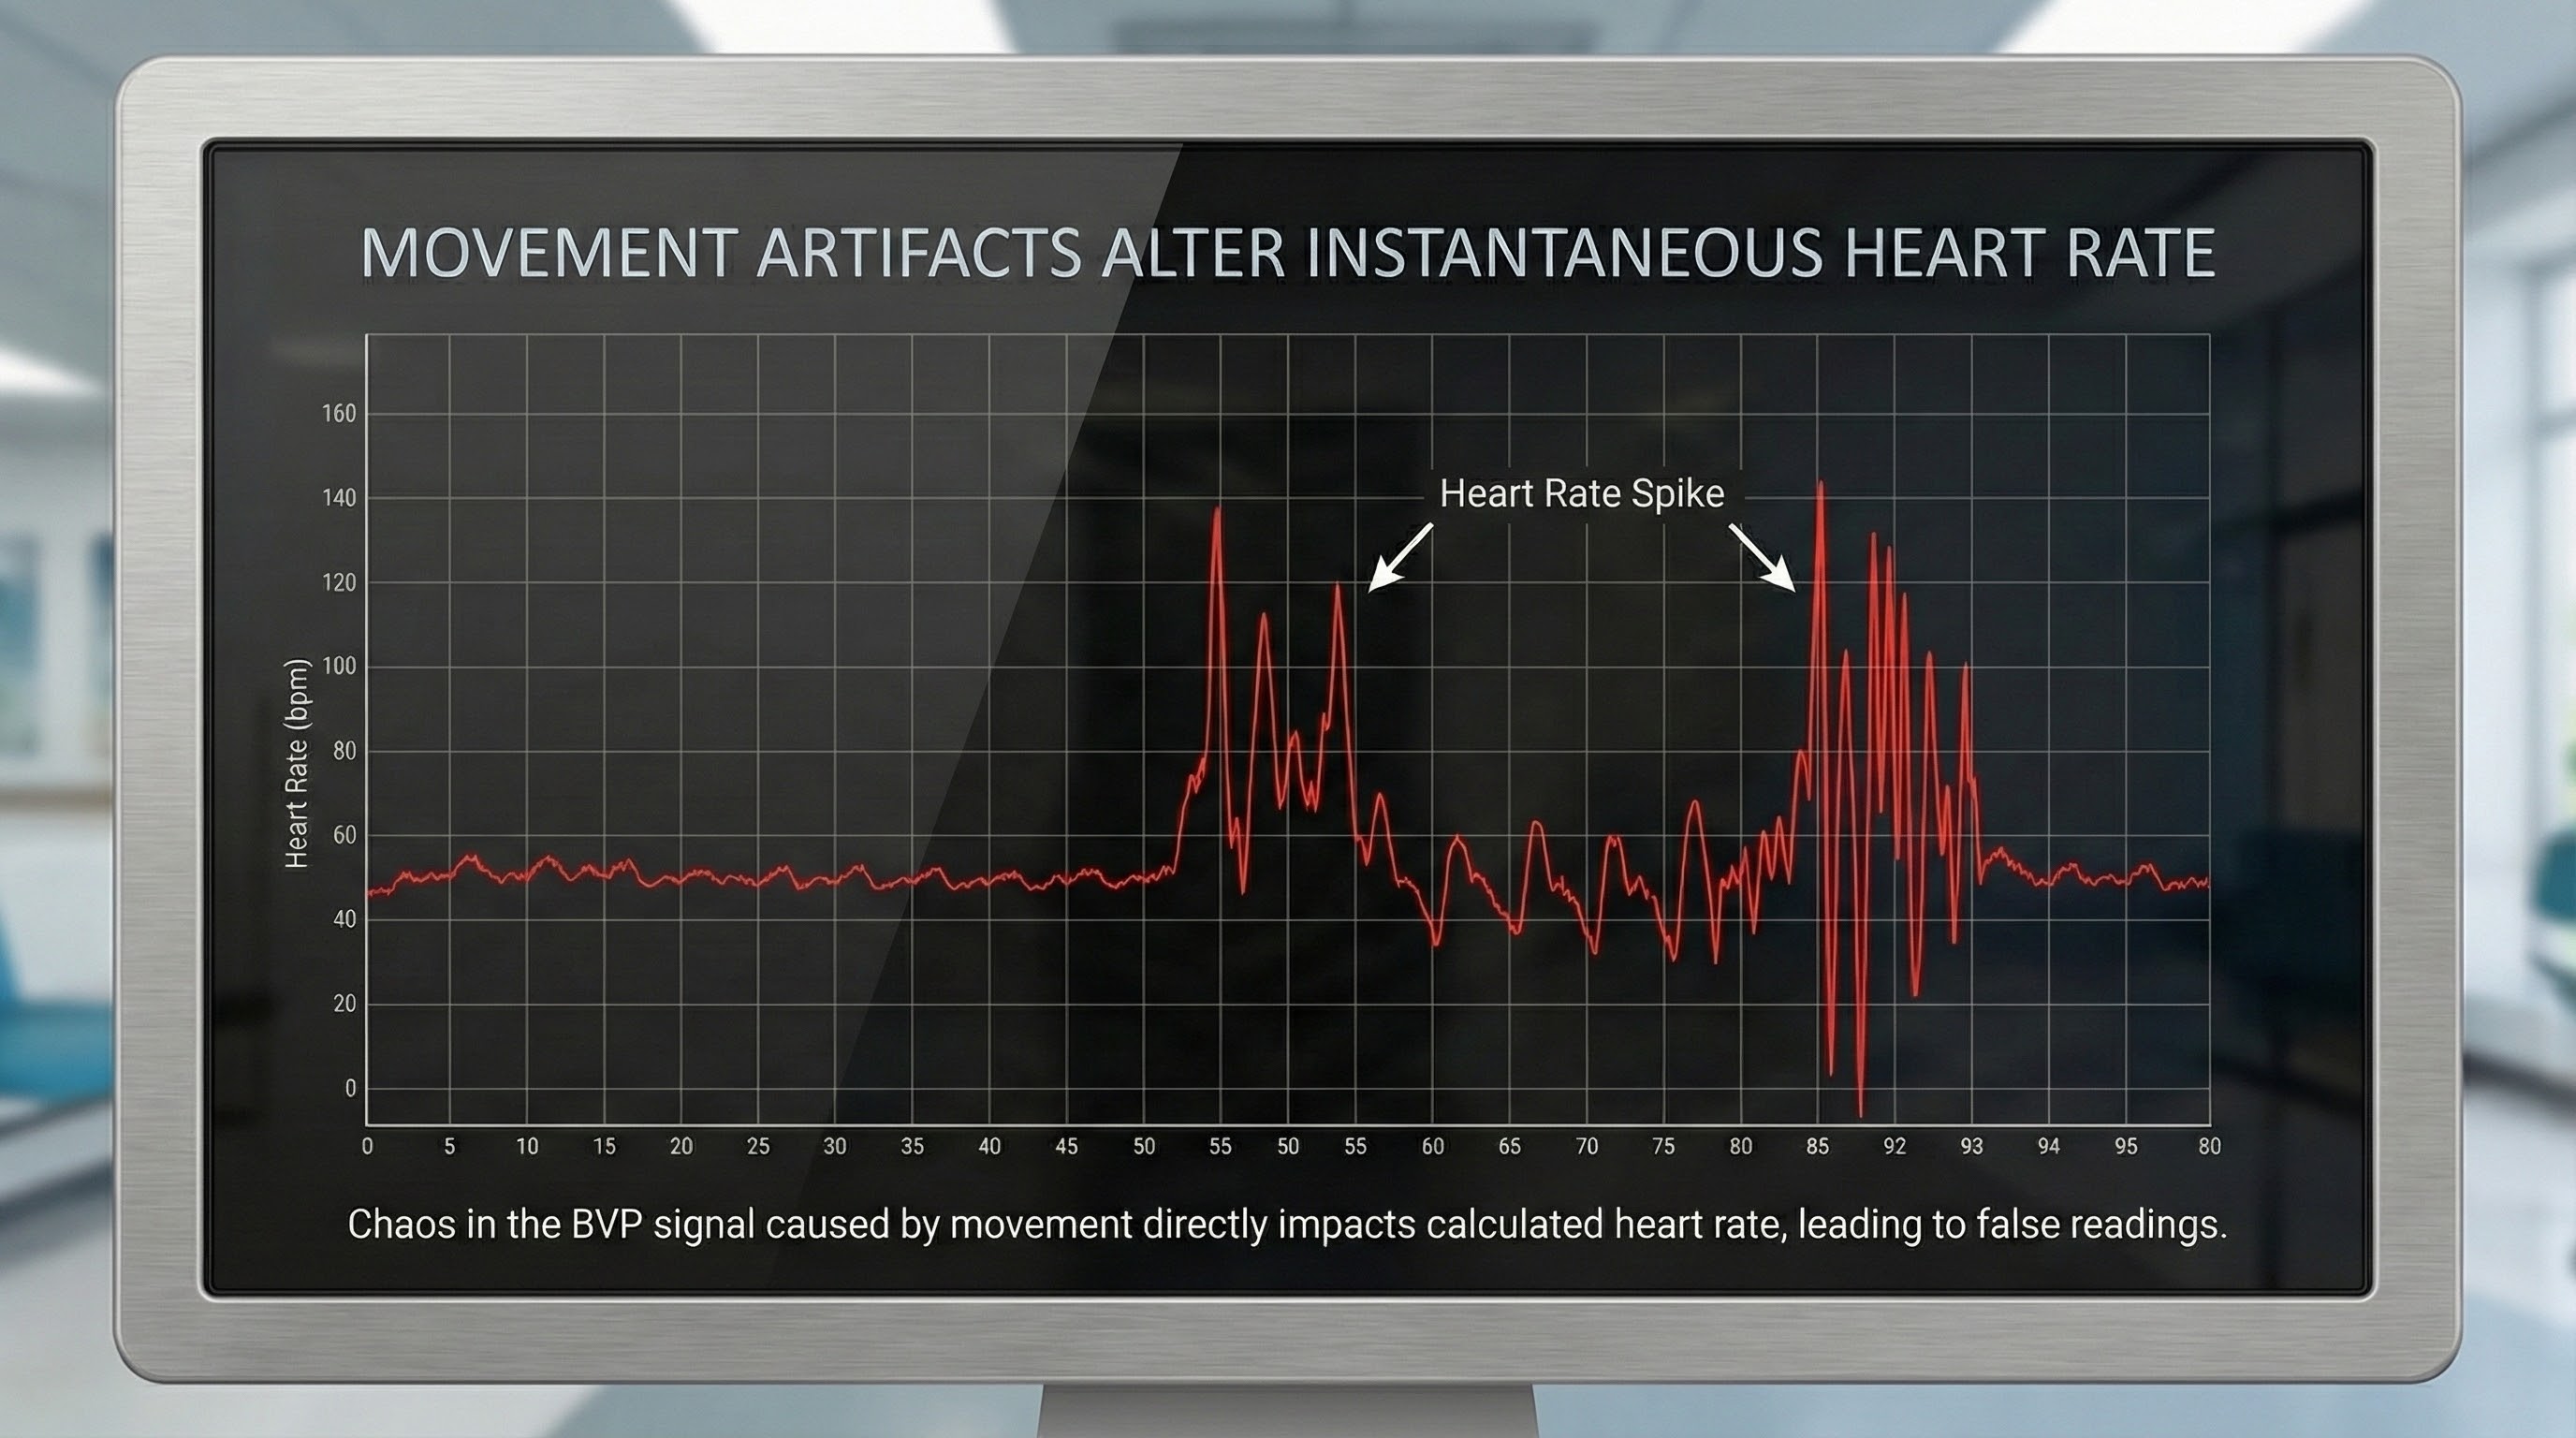
The display may show sudden changes in the raw BVP signal and HR.
Below is a close-up view of sudden HR increases.
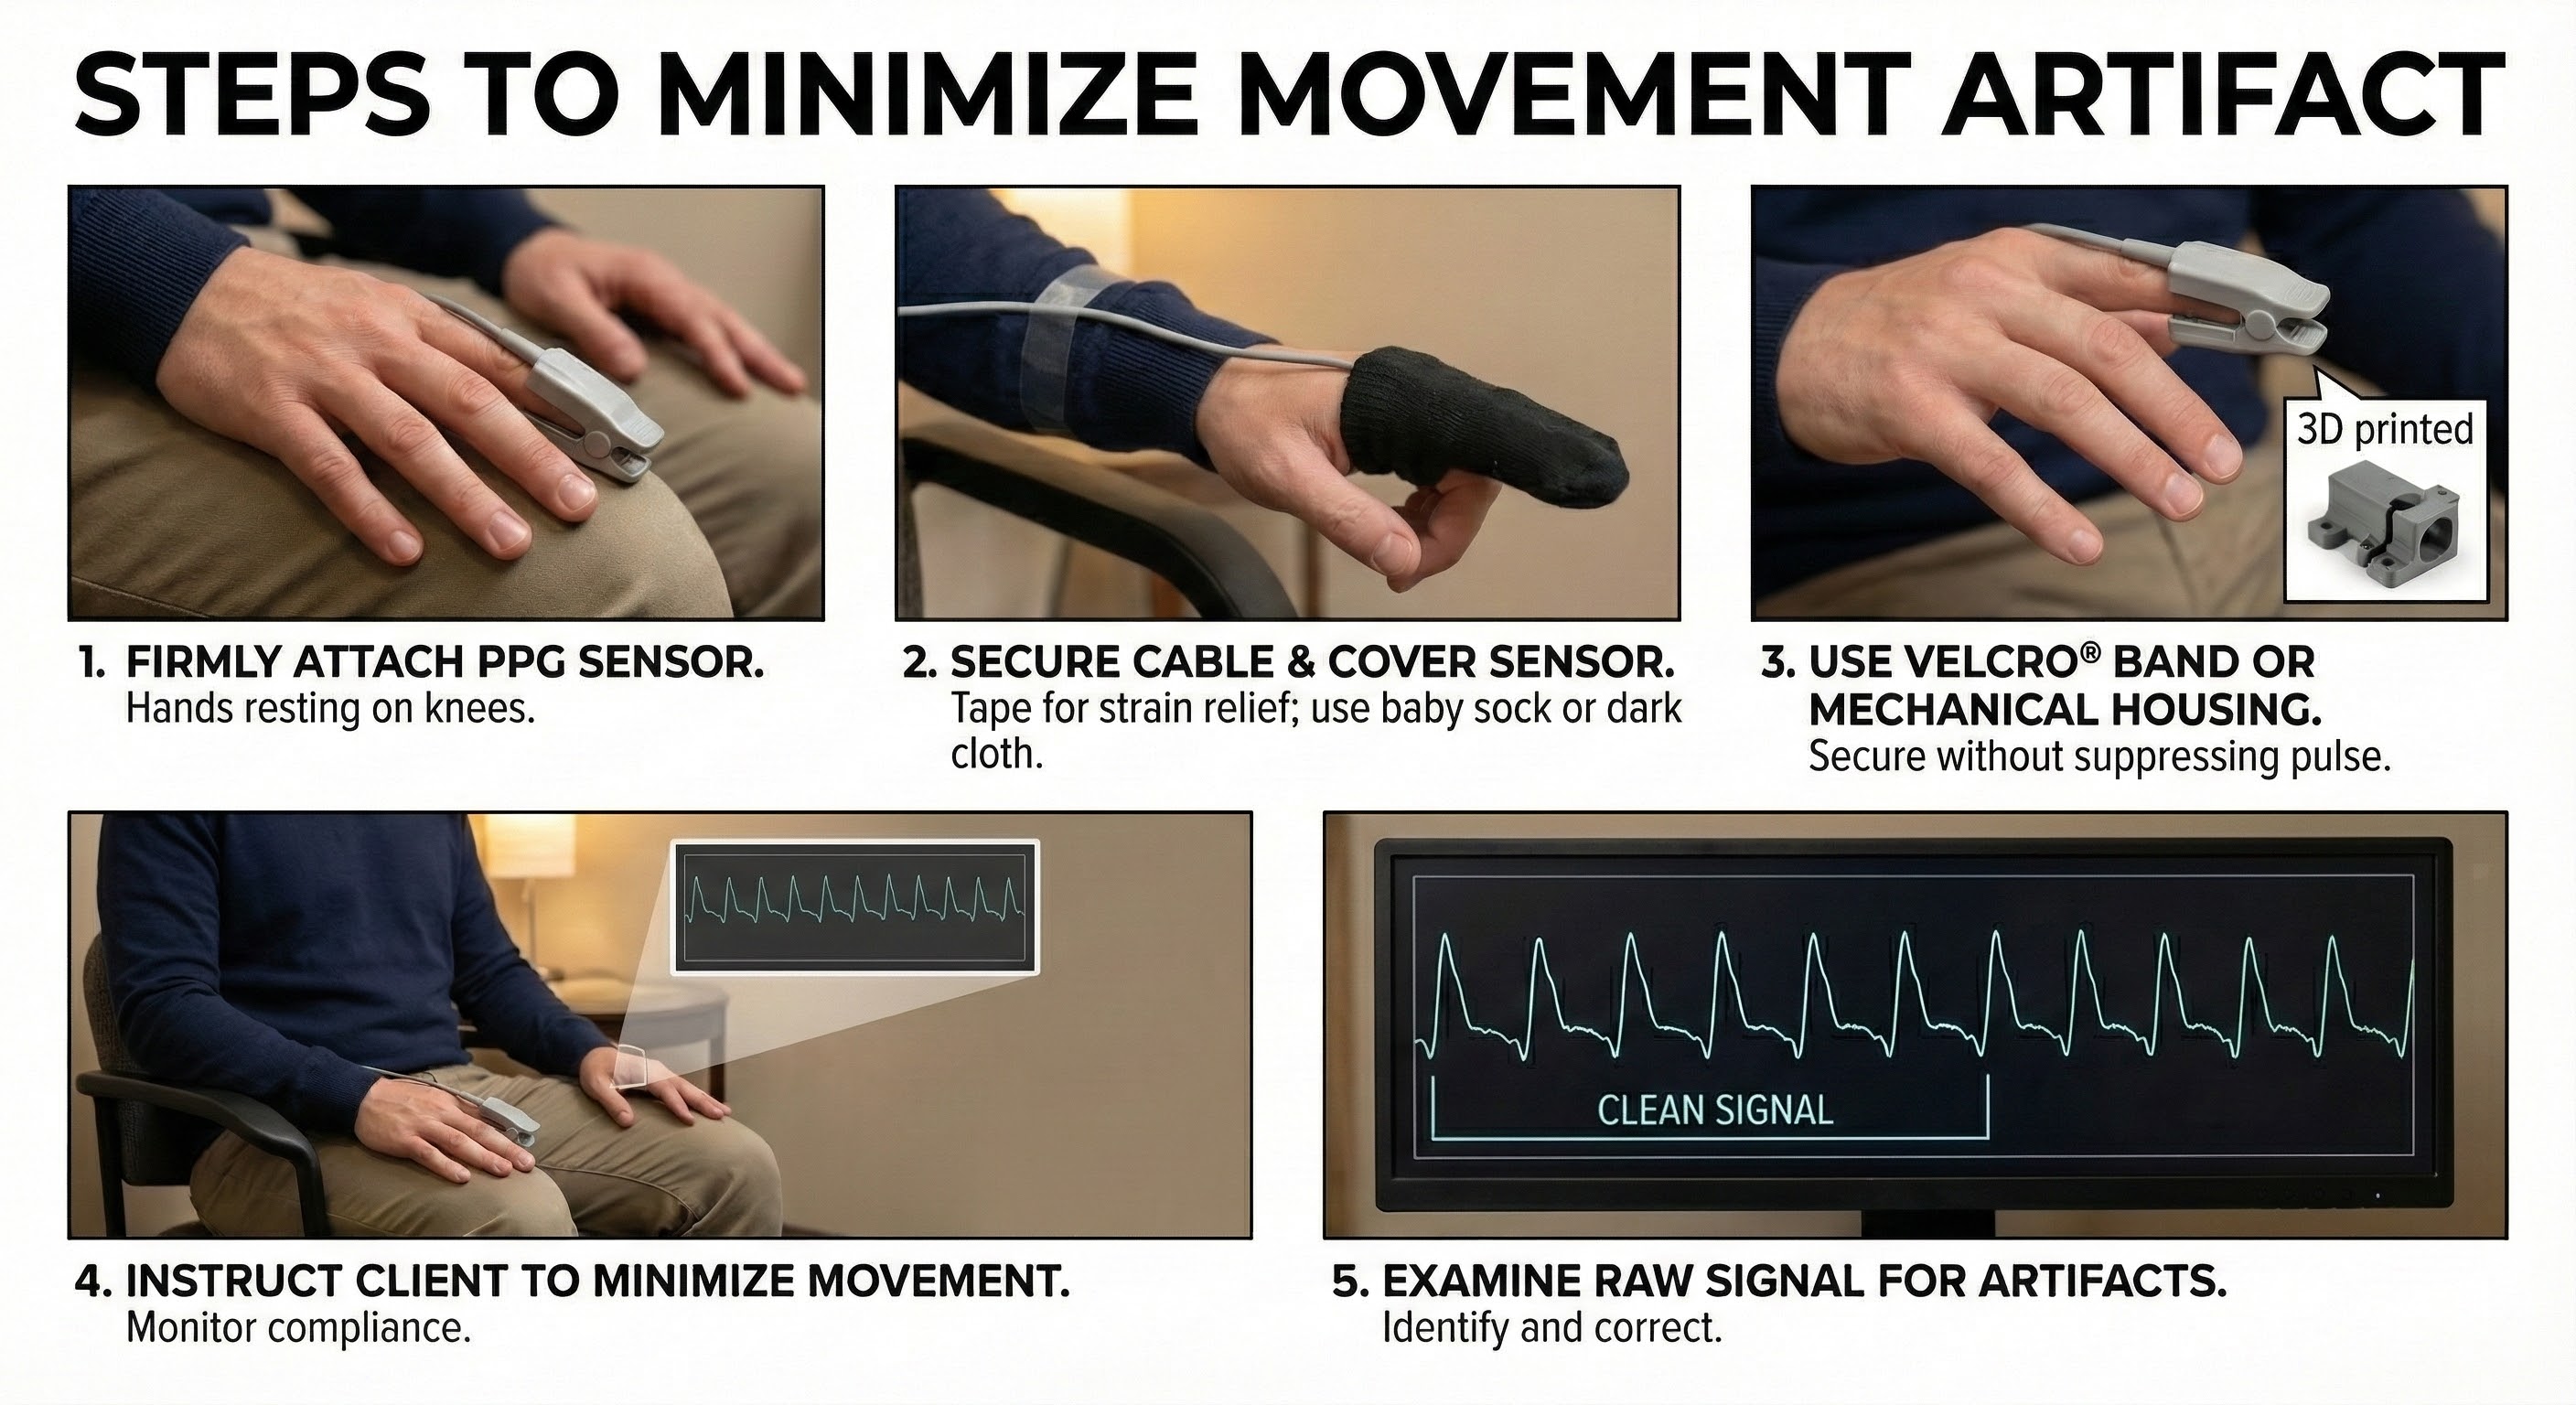
The sensor's stability is further reinforced using a Velcro band or mechanical housing, which must be applied carefully to secure the device without applying enough pressure to suppress the pulse. These physical setup measures are complemented by behavioral management, where the clinician explicitly instructs the client to remain still and monitors their compliance. The procedure concludes with a verification step in which the raw signal is examined visually to confirm the absence of artifacts before recording begins.
Pressure Artifact
Pressure artifact can be caused by wrapping a restraining band too tightly or by resting too much weight on the sensor. Excessive pressure compresses the underlying blood vessels, reducing blood flow to the measurement site. Clients may report throbbing when a Velcro band is wrapped too tightly around a finger, a symptom of venous congestion distal to the constriction.
🎧 Mini-Lecture: BVP Pressure Artifact
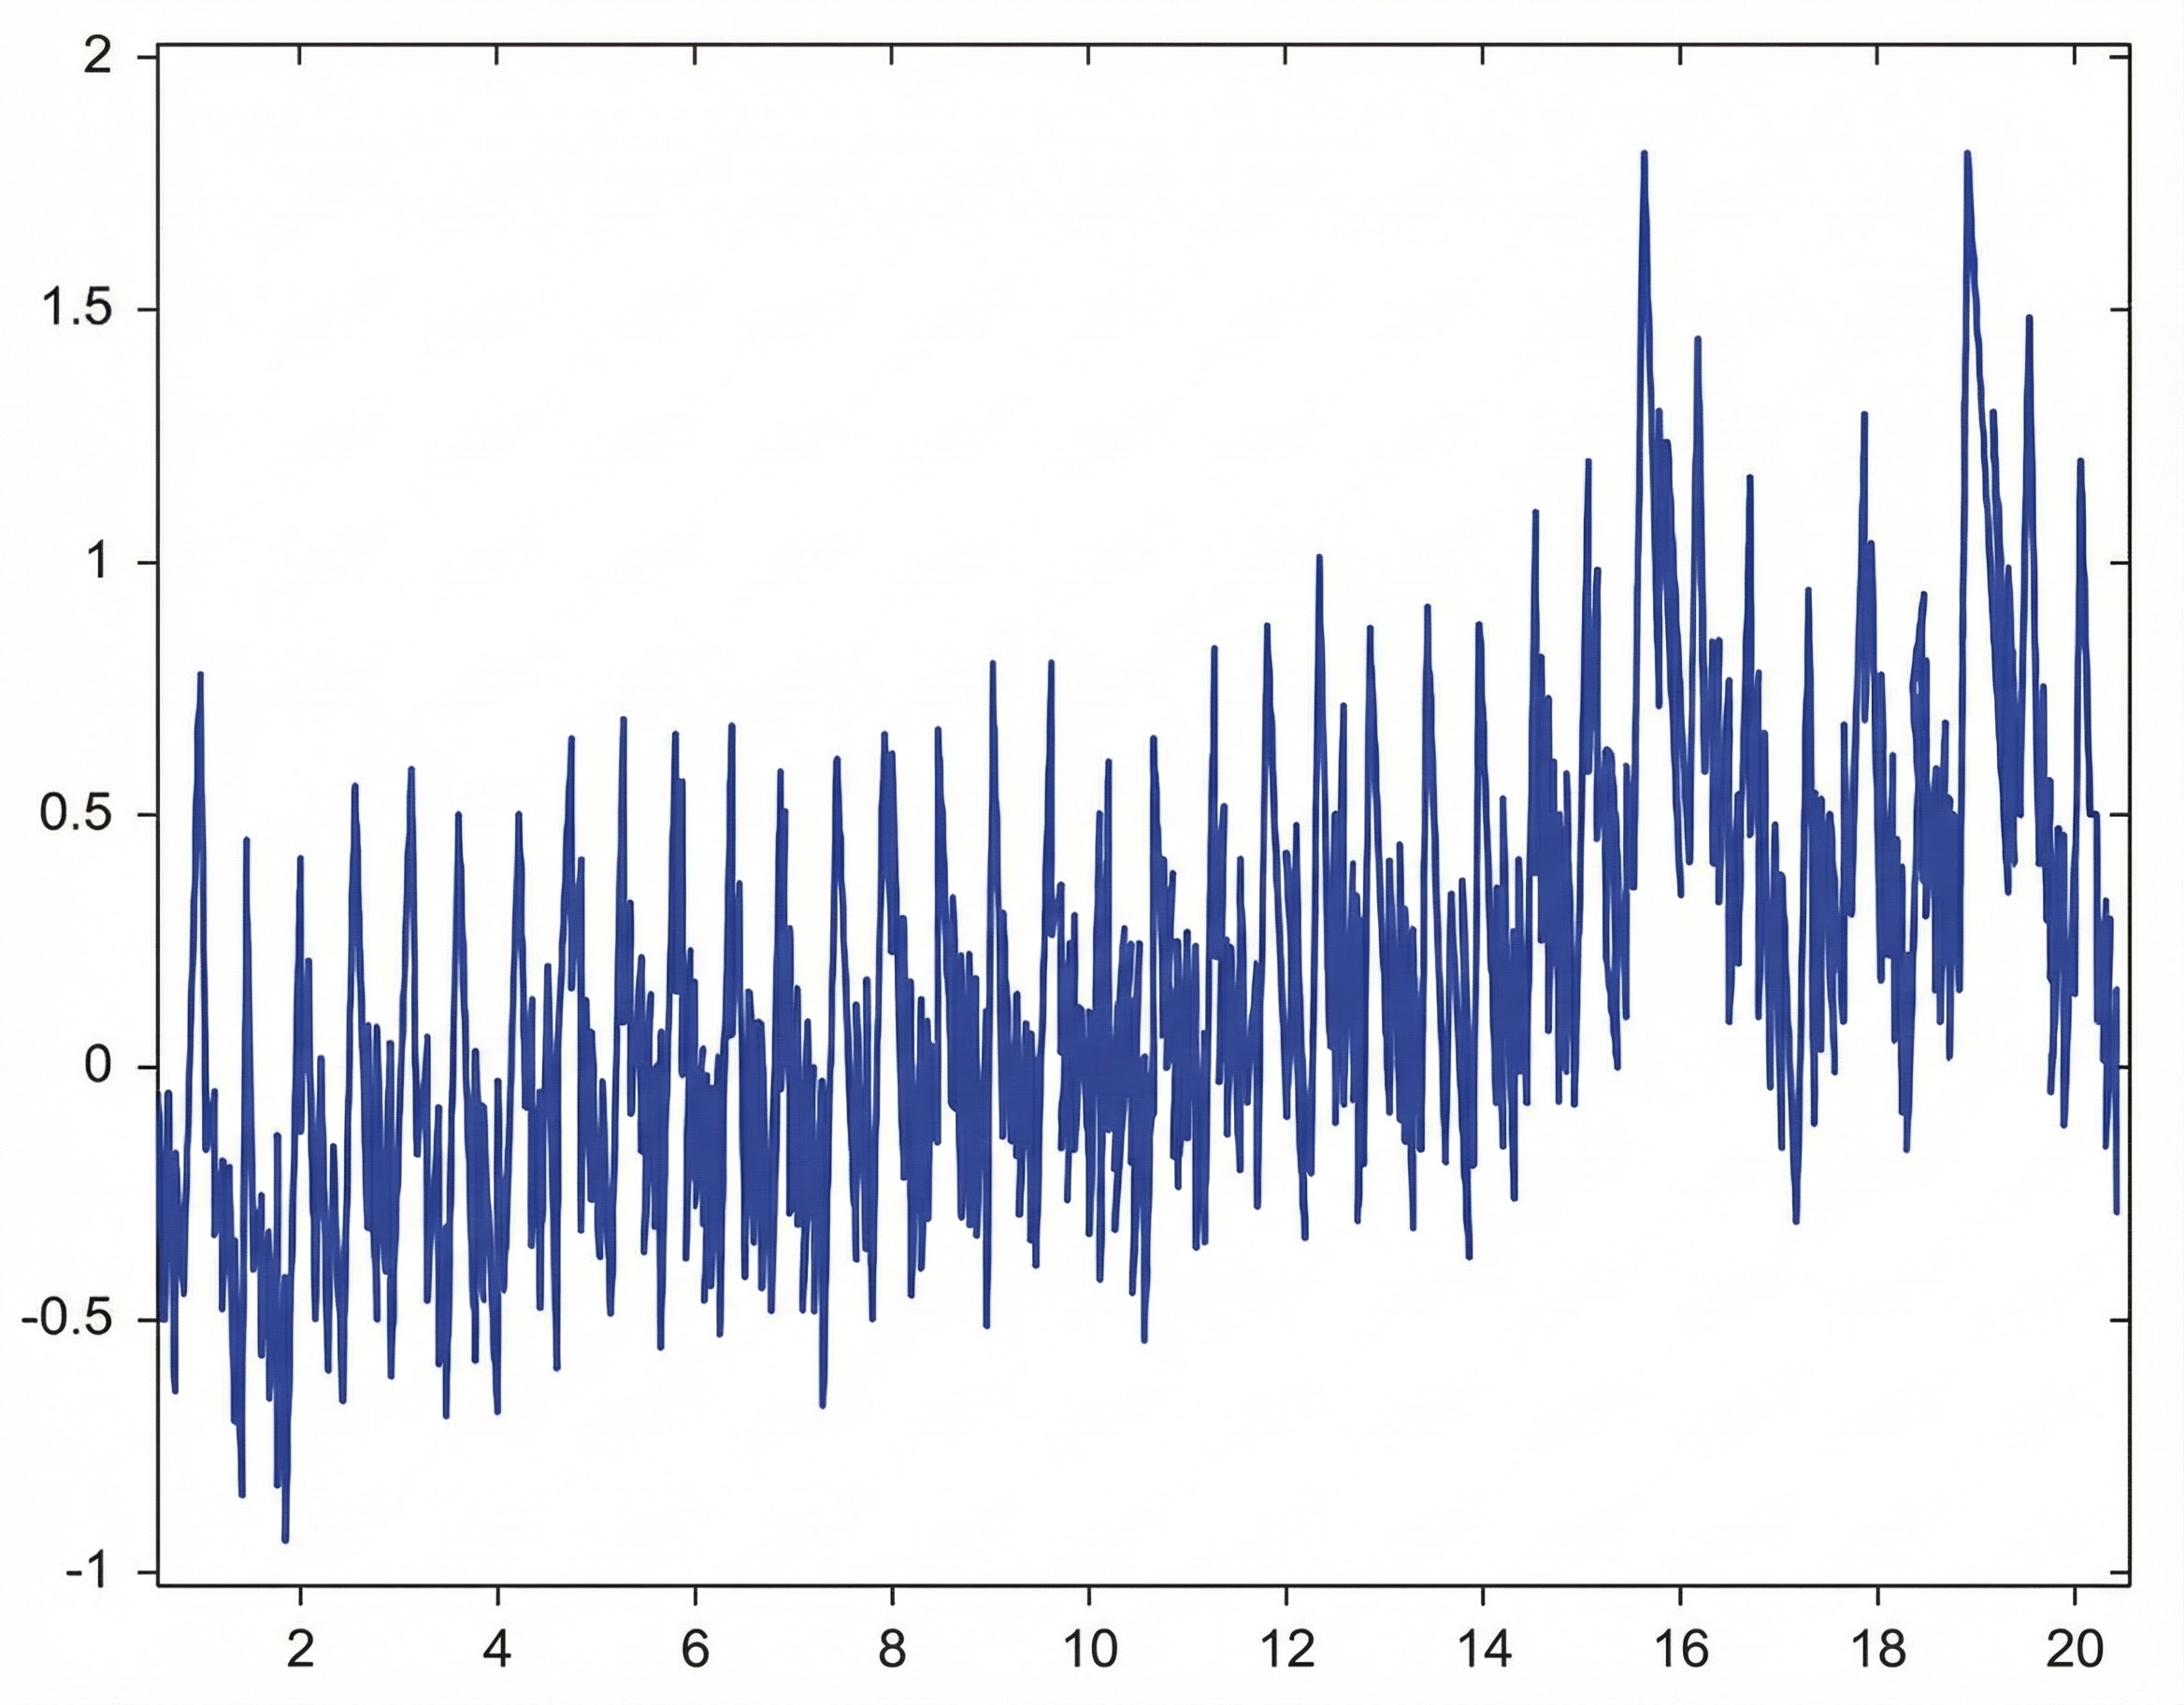
Pressure reduces raw signal amplitude, resulting in smaller values or a flat line, and may prevent detection of the peak of the pressure wave. Missed beats can lengthen IBIs and artificially slow calculated HRs (Shaffer & Combatalade, 2013). The resulting HRV metrics will be inaccurate, showing artificially increased variability due to the missed beats.
Excessive pressure can also occur when clients rest too much weight on the PPG sensor, such as when the hand presses the sensor against a knee or table surface. This pressure artifact reduces raw signal amplitude, resulting in smaller values (Peper, Shaffer, & Lin, 2010). The gradual onset of pressure artifact may be difficult to detect if you are not monitoring the raw signal continuously.
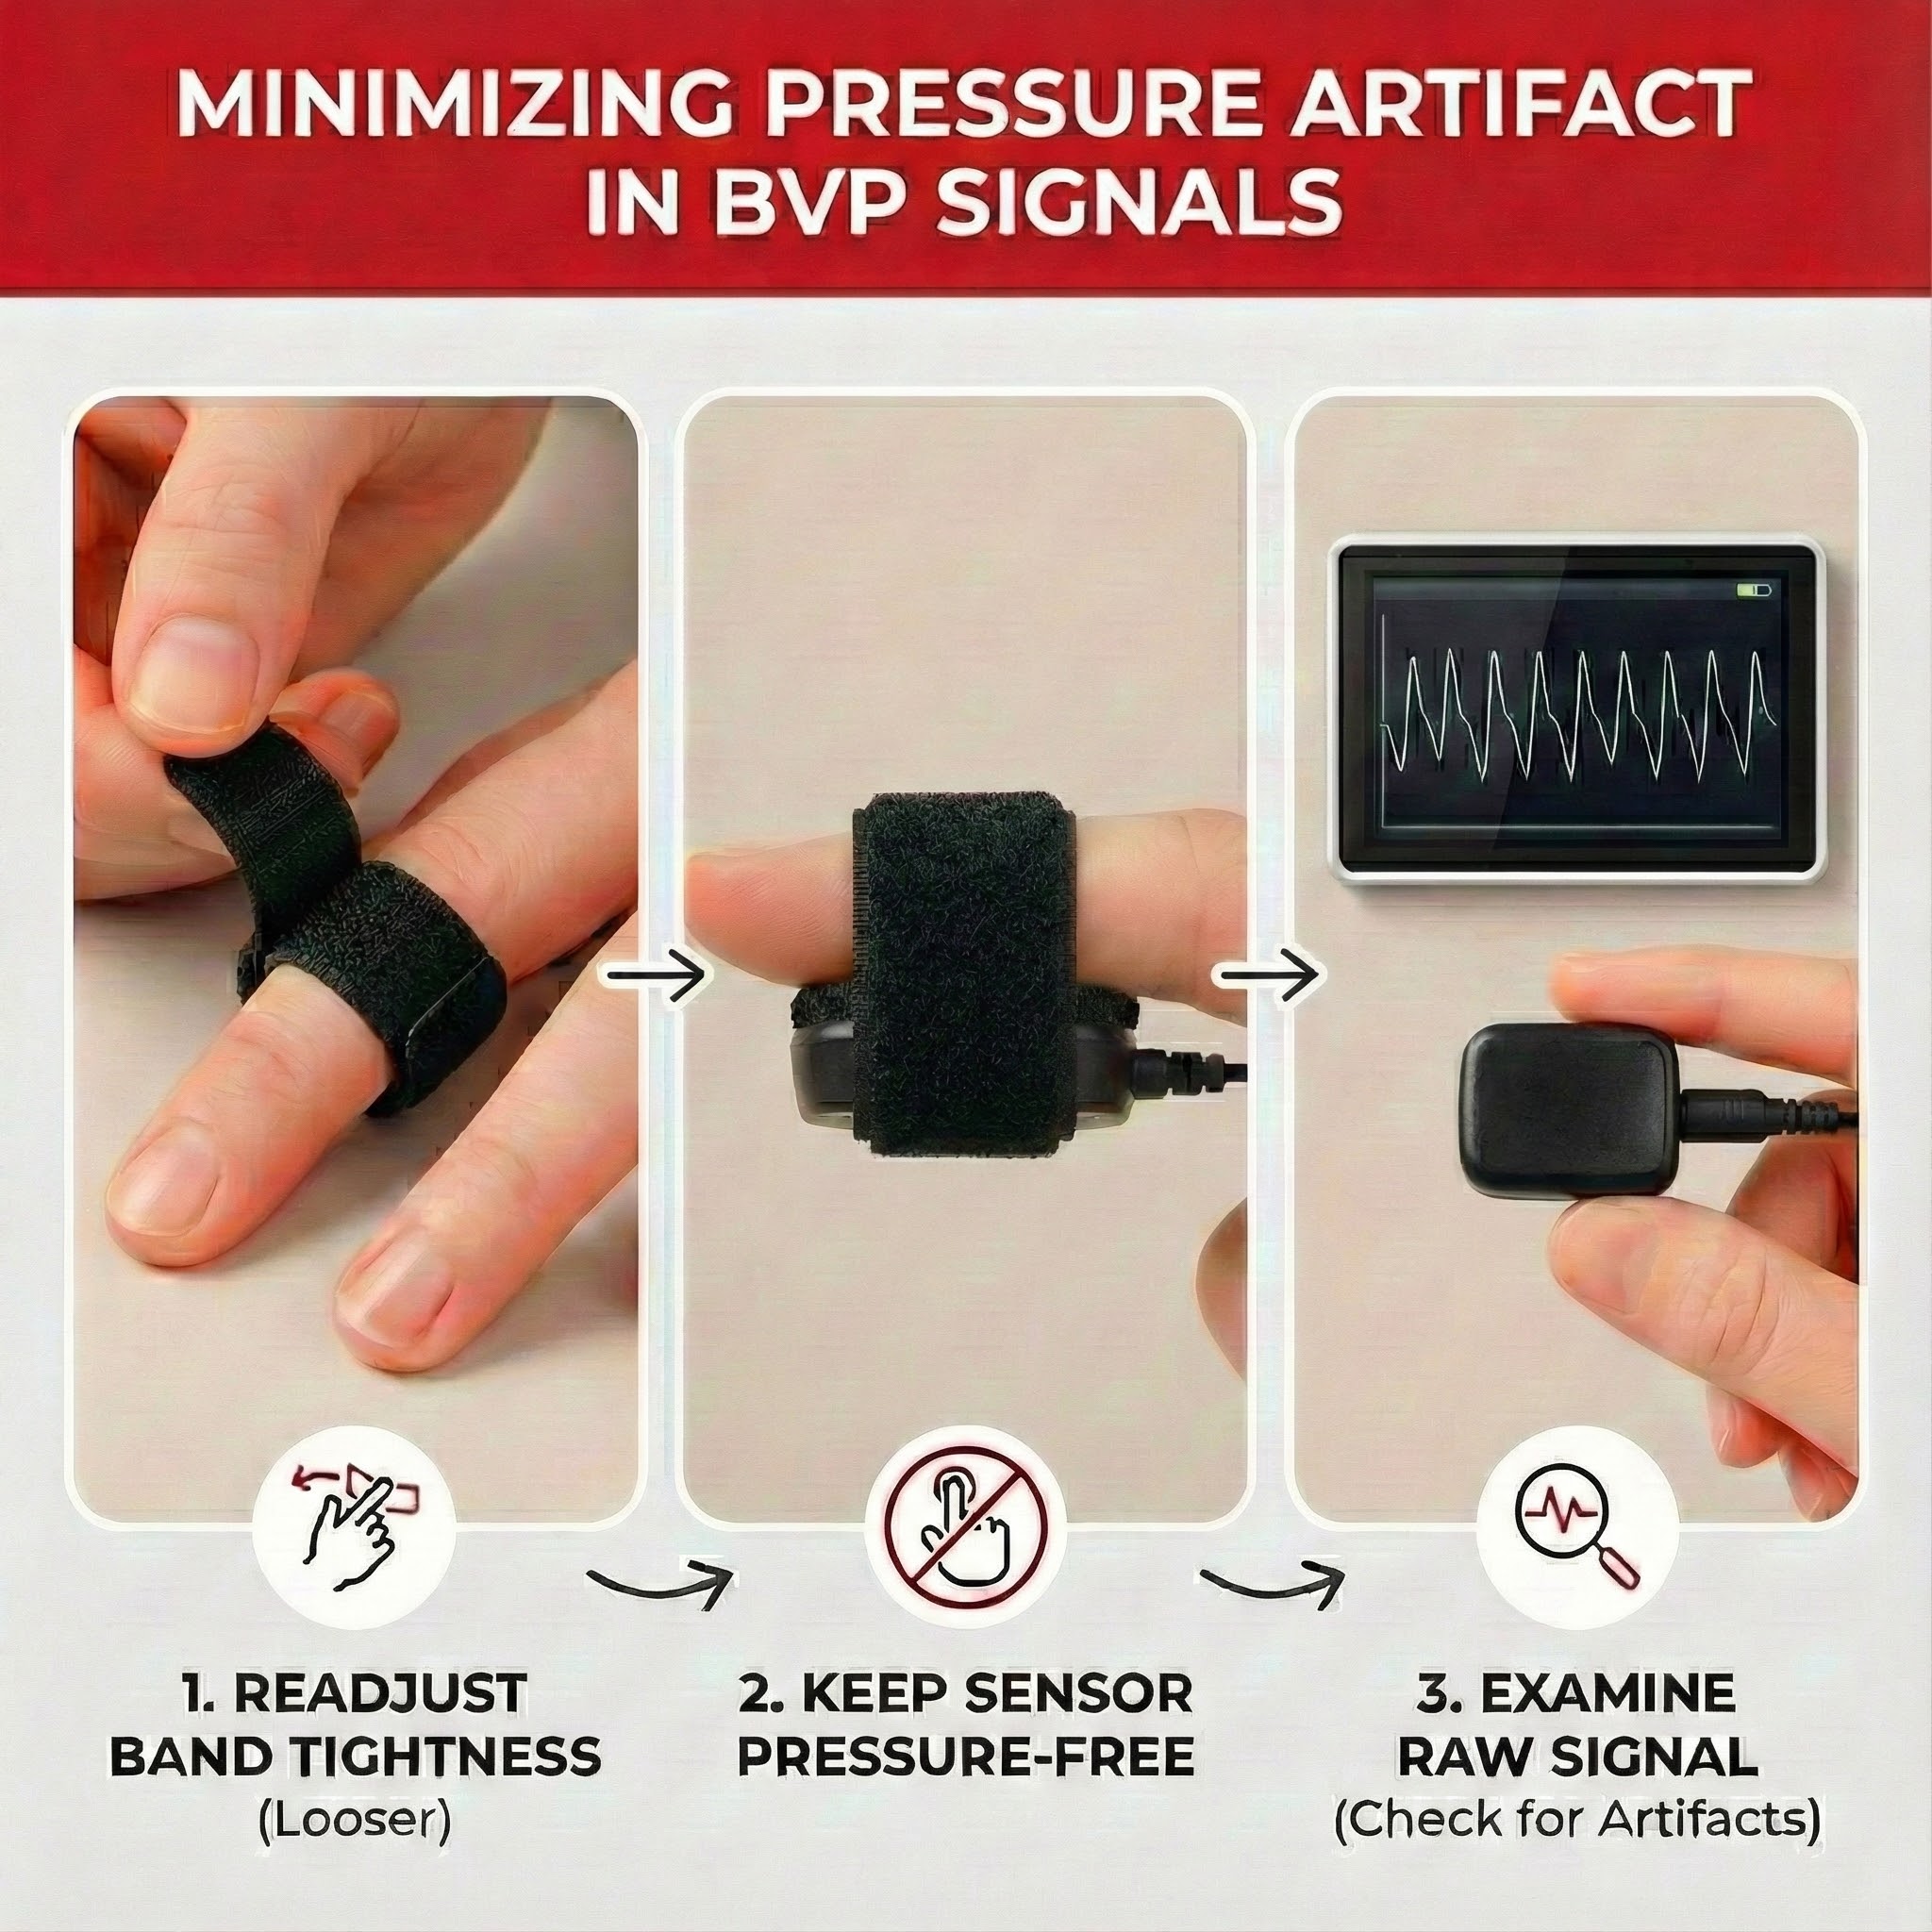
To minimize pressure artifact, readjust the tightness of the restraining band until the client no longer feels throbbing. The band should be snug enough to prevent slippage but loose enough to allow normal blood flow. Keep pressure off the PPG sensor by positioning the hand so weight rests on the palm rather than the sensor. If using a finger placement, ensure the sensor is on the top of the finger rather than pressed against a surface. Always examine the raw signal for artifact, looking for gradual amplitude decreases that may indicate developing pressure problems.
The graphic below from Elgendi (2012) shows multiple artifacts, including arrhythmia, EMG, low-amplitude, and movement, which can render an epoch unusable.
BVP artifacts arise from cardiac conduction abnormalities, cold exposure, ambient light, line interference, movement, and pressure. Each artifact type produces characteristic signal distortions that you can learn to recognize with practice. Prevention strategies include proper sensor placement, environmental control (temperature, lighting, electromagnetic interference), clear client instruction, and consistent signal inspection. Cardiac artifacts cannot be prevented behaviorally and must be removed through artifacting procedures. Movement artifact, the most common problem, requires stable hand positioning and secure sensor attachment. Always examine the raw BVP signal before interpreting HRV metrics, as calculated values cannot distinguish genuine variability from artifact-induced distortion.
Check Your Understanding
- What distinguishes cardiac conduction artifacts from other artifact types, and why can they not be prevented through sensor placement or client instruction?
- How does cold artifact affect the BVP signal, and what strategies can minimize its impact in clinical practice?
- Why is movement artifact the leading cause of BVP signal distortion, and what makes it so problematic?
- What should you do if a client reports a throbbing sensation at the sensor site?
- Why is it important to examine the raw BVP signal rather than relying solely on software-calculated HRV metrics?
Performing a Tracking Test
A tracking test verifies that the biofeedback display accurately mirrors client behavior. You can determine whether the ECG or BVP signals respond appropriately by observing whether instantaneous HR speeds during inhalation and slows during exhalation. This phenomenon, called respiratory sinus arrhythmia, confirms that your recording system is functioning properly and that the client's cardiovascular system responds normally to breathing. A successful tracking test builds confidence that subsequent biofeedback training will be valid.
![]()
To perform a BVP-specific tracking test, ask your client to raise the monitored hand above the heart and then lower it while you observe the signal amplitude. Based on the principles of limb position effects discussed earlier, you should see BVP amplitude decrease when the hand is raised and increase when lowered. If the signal responds in the expected direction, the sensor is properly detecting blood volume changes. If the signal does not respond appropriately, troubleshoot sensor attachment and placement.
🎧 Mini-Lecture: BVP Tracking Test
BVP and Respiration Demonstration
Dr. Inna Khazan demonstrates BVP and respiration recording, artifacts, and a tracking test in the following video. This comprehensive demonstration illustrates many of the concepts covered in this chapter.
Common Misconceptions About BVP and HRV

Misconception: BVP and ECG HRV measurements are interchangeable.
This common assumption can lead to inappropriate clinical decisions. The BVP method may not be usable if participants are vasoconstricted and software cannot detect the peak of the pulse wave. Even when signals appear adequate, BVP-derived PRV may inflate HRV estimates under certain conditions. PRV may be a poor proxy for HRV when participants stand, perform slow-paced breathing, or have low HRV (Jan et al., 2019). Since slow-paced breathing is the core intervention in HRV biofeedback, this limitation has direct clinical relevance.
Be cautious when evaluating studies that report PRV and HRV measurements are correlated. Correlation alone does not demonstrate interchangeability for clinical purposes. Two measures can be highly correlated but still differ systematically in ways that matter for clinical decision-making. Discount studies that do not report their measurement conditions (such as paced breathing rate and body position) and limits of agreement (Shaffer, Meehan, & Zerr, 2020). A study showing r = 0.95 correlation may still have clinically significant differences between PRV and HRV values that would affect treatment monitoring.
What should you do if the BVP signal is too weak to detect the peak of the pressure wave? First, shift the PPG sensor to the thumb or earlobe if currently placed on a finger. These sites typically maintain better blood flow during sympathetic activation. If you cannot record from the thumb because it is also vasoconstricted, allow your client to warm the digit using diaphragmatic breathing, progressive muscle relaxation, dipping the hands in a warm basin of water, or placing them in front of a space heater. If none of these options produce an adequate signal within 10-15 minutes, use the ECG method instead. Some clients, particularly those with severe anxiety, Raynaud's phenomenon, or certain medications, may consistently require ECG recording.

Normal Values
🎧 Listen to the Full Chapter Lecture Part 2
Normal resting HR values range from 60-80 beats per minute. Following a stressor, clinicians may measure elevations above baseline and the time required to recover to baseline values (Khazan, 2013, p. 46).
The photoplethysmograph detects blood volume pulse using infrared light transmitted through or reflected off tissue. BVP provides rapid phasic feedback about blood flow changes, complementing the slower tonic feedback from temperature biofeedback. PPG sensors can be placed on the finger, thumb, earlobe, or temporal artery, with the ear being less prone to artifact. Common BVP artifacts include cold artifact from vasoconstriction, light artifact from ambient light contamination, movement artifact from sensor displacement, and pressure artifact from overly tight bands. The tracking test confirms that heart rate appropriately speeds during inhalation and slows during exhalation. Short-term HRV values serve as proxies for 24-hour values but should never be compared directly with 24-hour norms.
Comprehension Questions: Photoplethysmography
- What is the difference between the transmission and reflection techniques for PPG measurement, and when might you choose one over the other?
- Why might the ear be a better PPG sensor site than the finger for HRV measurements?
- How does limb position relative to the heart affect BVP signal amplitude, and how can you use this clinically?
- Describe three types of BVP artifacts and explain strategies to minimize each one.
- When would you switch from PPG to ECG for heart rate variability measurement?
Pulse Amplitude Variability
Picture yourself watching a pulse waveform scroll across a biofeedback screen. You notice something curious: some heartbeats produce tall, robust waves while others generate shorter, more modest peaks. These beat-to-beat fluctuations in wave height represent pulse amplitude variability (PAV), a measure that captures something fundamentally different from heart rate variability (Yuda et al., 2020). Where HRV tracks the timing between beats, PAV reveals how much blood is actually reaching your fingertip with each cardiac contraction. This distinction carries real clinical significance because PAV reflects not just cardiac function but also the dynamic state of your peripheral blood vessels, telling us whether they are relaxed and open or tight and constricted (Mejía-Mejía et al., 2020; Pilz et al., 2024; Yuda et al., 2020). PAV opens a complementary window into autonomic regulation, showing how the nervous system orchestrates circulation, responds to stress, and shifts toward recovery throughout the day.
What Pulse Amplitude Variability Means
That familiar photoplethysmography tracing on your fingertip sensor or smartwatch is fundamentally a blood volume measurement: the sensor shines infrared light into tissue and detects how much light returns as blood pulses through the capillary bed (Yu et al., 2021). When the left ventricle ejects a large bolus of blood (high stroke volume) or when peripheral arterioles are dilated and welcoming, the resulting pulse wave swells to a tall peak at the fingertip. Conversely, when stroke volume drops or vessels clamp down, the pulse amplitude shrinks accordingly (Mejía-Mejía et al., 2020; Pilz et al., 2024).
The autonomic nervous system exerts powerful control over both factors, which means PAV carries rich information about vascular tone, blood pressure regulation, and the body's moment-to-moment stress responses (Draghici & Taylor, 2016; Yuda et al., 2020). Consider what happens during acute stress: sympathetic activation constricts peripheral vessels to shunt blood toward vital organs, often producing smaller, more erratic pulse waves at the fingernail bed even when heart rate has barely budged (Ishaque et al., 2021; Shaffer & Ginsberg, 2017). A clinician watching the raw waveform can literally see the vascular squeeze unfold in real time.
How PAV Is Detected and Used in Biofeedback
Clinicians typically derive PAV from the continuous pulse waveform captured by a contact PPG sensor clipped to the finger or earlobe. Newer approaches use camera-based photoplethysmography to detect the subtle flush and fade of skin color with each heartbeat, extracting pulse data from a video of the face without any physical sensor at all (Mejía-Mejía et al., 2020; Yu et al., 2021). Once the software identifies each pulse, it measures the peak-to-trough height and assembles these amplitudes into a time series that can be analyzed statistically or displayed as a rolling trend.
In HRV biofeedback protocols, clients breathe slowly at or near their personal resonance frequency, typically between 4.5 and 7 breaths per minute, to maximize heart rate oscillations and strengthen baroreflex sensitivity (Shaffer & Meehan, 2020; Shaffer & Ginsberg, 2017). Many biofeedback platforms display not only heart rate but also the raw pulse waveform, and something beautiful often emerges as the session progresses: the waveform becomes more uniform and begins to swell and recede in smooth, rhythmic cycles that mirror the breathing pattern (Fournié et al., 2021; Pruneti et al., 2023). Clients can literally watch their autonomic nervous system shift toward parasympathetic dominance, a visible confirmation that their relaxation efforts are producing genuine physiological change.
Strengths and Limitations for Health Monitoring
The great practical advantage of PAV is accessibility. Unlike electrocardiography, which requires electrode gel, skin preparation, and careful lead placement, PPG sensors are small, cheap, and comfortable enough to embed in consumer smartwatches and fitness bands that millions of people already wear (Mejía-Mejía et al., 2020; Singh et al., 2018). This democratization of physiological monitoring makes it feasible to track both pulse rate variability and amplitude around the clock, opening new possibilities for mobile health applications and longitudinal self-tracking (Faust et al., 2022; Ishaque et al., 2021).
The clinical promise is substantial: systematic reviews confirm that HRV biofeedback training can benefit patients with hypertension, asthma, depression, anxiety, chronic pain, and sleep disorders (Fournié et al., 2021; Shaffer & Meehan, 2020). As PAV metrics become integrated into these platforms, they may add valuable information about vascular health and stress reactivity that HRV alone cannot capture (Pilz et al., 2024). The technology does have significant limitations, however. Pulse signals are exquisitely sensitive to movement artifact, inconsistent sensor contact, variations in sampling rate, and algorithmic decisions about exactly which point on the waveform defines the "beat" (Hejjel & Béres, 2021; Quigley et al., 2024).
Beyond technical factors, physiological variables like posture, ambient temperature, and arterial stiffness can shift PAV in ways that do not map neatly onto changes in cardiac autonomic control (Mejía-Mejía et al., 2020; Yuda et al., 2020). Clinicians must interpret PAV data thoughtfully rather than assuming it mirrors HRV.
PAV, HRV, and Biofeedback: How They Fit Together
Heart rate variability derived from electrocardiogram R-R intervals remains the gold standard for assessing autonomic balance, with decades of research linking reduced HRV to cardiovascular mortality, impaired stress regulation, and diminished cognitive performance (Draghici & Taylor, 2016; Johnston et al., 2019; Shaffer & Ginsberg, 2017).
Pulse rate variability offers a convenient approximation of HRV by measuring the gaps between successive pulse peaks in the PPG signal (Mejía-Mejía et al., 2020). Yet neither PRV nor PAV is a perfect surrogate for HRV, and the discrepancies are physiologically meaningful.
The pulse wave at your fingertip is not a simple echo of the electrical signal at your heart; it has been shaped by electromechanical coupling (the delay between electrical activation and mechanical contraction), vascular compliance, and pulse transit time (the journey from aortic valve to peripheral sensor). These intervening steps can introduce variability into the pulse signal even when cardiac autonomic modulation is minimal (Mejía-Mejía et al., 2020; Yuda et al., 2020). Leading researchers now argue that PRV deserves recognition as a related but distinct biomarker that may encode information about mechanical and vascular dynamics beyond what HRV reveals (Mejía-Mejía et al., 2020; Sundas et al., 2025; Yuda et al., 2020).
For biofeedback practitioners and health researchers, the most powerful approach may be integrating all three metrics. By examining HRV, PRV, and PAV together, clinicians can move beyond asking simply whether the heart is well-regulated to understanding how the entire cardiovascular system, from cardiac output to peripheral vascular tone, responds to breathing exercises, stress challenges, and recovery periods. This multidimensional view opens possibilities for more precisely tailored interventions, whether the goal is optimizing athletic training loads, managing chronic illness, or helping students stay calm during high-stakes examinations (Addleman et al., 2024; Fournié et al., 2021; Pruneti et al., 2023).
Pulse amplitude variability (PAV) quantifies beat-to-beat changes in peripheral pulse wave height, revealing information about stroke volume, vascular tone, and autonomic regulation that complements traditional heart rate variability measures. PAV can be captured effortlessly from finger or wrist PPG sensors embedded in consumer wearables. Sympathetic stress responses constrict peripheral vessels and typically produce smaller, more variable pulse waves even before heart rate changes appreciably.
During successful HRV biofeedback, the pulse waveform often develops rhythmic amplitude oscillations synchronized with slow breathing, providing clients visible evidence of autonomic shift. Technical limitations include sensitivity to movement artifact, sensor placement, and algorithmic choices, while physiological confounds such as posture, temperature, and arterial stiffness can alter PAV independently of cardiac autonomic control. Integrating HRV, pulse rate variability, and PAV yields a richer cardiovascular portrait that can inform more individualized clinical and performance interventions.
Comprehension Questions: Pulse Amplitude Variability
- How does pulse amplitude variability differ from heart rate variability, and what additional physiological information does PAV provide?
- What factors influence pulse amplitude, and how does sympathetic activation typically affect the pulse wave during stress?
- Why might pulse rate variability and PAV not perfectly mirror HRV, and what additional steps in the cardiovascular system contribute to this difference?
- What are the advantages and limitations of using PPG-based PAV measurements for health monitoring?
- How might combining HRV, PRV, and PAV measurements improve biofeedback interventions compared to using HRV alone?
Essential Skills for BVP Recording
Competent BVP recording requires mastery of multiple interconnected skills that develop with supervised practice. As you work toward certification, focus on building proficiency in each area.
You should be able to explain the blood volume pulse signal and biofeedback to a client in terms they can understand. Avoid technical jargon and use analogies like the garden hose comparison introduced earlier. Clients who understand what they are measuring engage more actively in training. You need to explain PPG sensor attachment to a client and obtain informed consent to monitor them, addressing any concerns about the safety and comfort of the procedure.
Selecting a placement site and demonstrating how to attach a PPG sensor to minimize light and movement artifacts is essential. Consider the client's hand temperature, nail polish, hand size, and ability to remain still when choosing between finger, thumb, ear, and temporal artery placements. You should be able to perform a tracking test by asking your client to raise the monitored hand above the heart and then lower it, observing the corresponding changes in signal amplitude that confirm proper sensor function.
Identifying common artifacts in the raw PPG signal, especially movement, and explaining how to control for them and remove them from the raw data separates competent practitioners from beginners. Develop the habit of continuous signal monitoring rather than trusting that a good initial signal will remain clean throughout the session. You should explain the major measures of heart rate variability, including HR Max minus HR Min, pNN50, SDNN, and SDRR, in terms appropriate to your client's sophistication level.
Understanding why we train clients to increase power in the low-frequency band of the ECG and how breathing at 5-7 breaths per minute helps them accomplish this connects BVP recording to the broader goals of HRV biofeedback training. The technical skills of recording serve the clinical goals of self-regulation training. Demonstrating how to instruct a client to utilize a feedback display and describing strategies to help clients increase their heart rate variability are core competencies.
You should be able to demonstrate a complete HRV biofeedback training session, including record keeping, goal setting, site selection, baseline measurement, display and threshold setting, coaching, and debriefing at the end of the session. Each component contributes to effective training. Demonstrating how to select and assign a practice assignment based on training session results extends learning beyond the clinical session into daily life. Evaluating and summarizing client progress during a training session provides meaningful feedback to clients and guides your clinical decision-making about pace and protocol modifications.
Assignment
Now that you have completed this module, how would you explain how a PPG sensor detects a heartbeat? How do you control movement artifact? Write a brief explanation (200-300 words) suitable for a new client who has never experienced biofeedback before. Use everyday language and avoid technical jargon. Consider including an analogy to help the client understand the principle of photoplethysmography.
Acknowledgment
This unit draws heavily on graphics published in Didier Combatalade's Basics of Heart Rate Variability Applied to Psychophysiology, published by Thought Technology Ltd. Didier is the Director of Clinical Interface at Thought Technology Ltd and is a gifted educator, writer, and generous colleague whose visual explanations have helped countless students understand cardiovascular psychophysiology.

Cutting Edge Topics in PPG Technology
Wearable PPG Technology Advances
Consumer wearable devices have dramatically expanded access to HRV monitoring, but their accuracy varies considerably depending on hardware quality, signal processing algorithms, and wearing conditions. Recent research has examined the validity of smartwatch PPG sensors for HRV measurement during different activities and postures. The results highlight both the promise and the limitations of wrist-worn devices. Understanding which devices provide reliable measurements under which conditions helps clinicians guide clients who want to monitor HRV at home. For clients with COPD tracking their recovery from exacerbations or athletes monitoring training load, accurate home HRV data can complement clinical assessments.
Remote Photoplethysmography
Researchers are developing camera-based photoplethysmography (rPPG) that can detect pulse signals from facial video without any physical contact. By analyzing subtle color changes in facial skin that occur with each heartbeat, algorithms can extract heart rate and potentially HRV information from ordinary video cameras. This technology holds promise for telehealth applications, allowing HRV monitoring during remote therapy sessions. It could enable continuous monitoring in hospital settings without the infection risks of contact sensors and improve accessibility for clients who cannot tolerate contact sensors due to tactile sensitivity or skin conditions. While not yet ready for clinical HRV biofeedback, this emerging technology may transform how we measure cardiovascular function in the future, particularly for populations where traditional sensors present challenges.
Multi-Wavelength PPG
Traditional PPG sensors use single-wavelength infrared light, which works well for most clients but can be affected by skin pigmentation and motion. Newer multi-wavelength sensors combine red, green, and infrared LEDs to provide more robust measurements across different skin tones and reduce motion artifact. Green light penetrates tissue less deeply than infrared, making it more sensitive to arterial blood in the superficial dermis and less affected by movement of deeper tissues. These advances address longstanding concerns about PPG accuracy in diverse populations and challenging recording conditions. For clinicians serving diverse patient populations, multi-wavelength technology promises more equitable measurement accuracy.
Machine Learning for Artifact Detection
Automated artifact detection using machine learning algorithms shows promise for improving HRV measurement quality. These systems can identify and remove artifacts in real-time with greater consistency than manual inspection, potentially improving both clinical efficiency and measurement accuracy. Machine learning models trained on large datasets of labeled artifacts can recognize patterns that human observers might miss, particularly subtle movement artifacts or cardiac arrhythmias. As these tools mature, they may become standard features in professional biofeedback systems, allowing clinicians to focus on therapeutic interaction while the software handles quality control. For practitioners managing heavy caseloads in VA hospitals or busy clinics, automated artifact detection could significantly streamline workflow.
Final Review Questions
- Explain the difference between transmission and reflection PPG techniques. When might you choose one over the other in clinical practice?
- A new client arrives with extremely cold hands after walking from a distant parking lot on a winter day. Describe your step-by-step approach to obtaining a usable BVP signal.
- Why might PRV measurements differ from ECG-derived HRV during slow-paced breathing, and how does this affect your interpretation of training outcomes?
- Describe how you would perform a tracking test and what you expect to observe if the recording system is functioning properly.
- A client's BVP signal shows sudden amplitude increases and signal distortion. What artifact types should you consider, and how would you systematically troubleshoot each possibility?
Glossary
atrial fibrillation: a supraventricular arrhythmia characterized by chaotic cardiac conduction and rapid heart rates that can produce low-amplitude, irregular BVP signals. HRV metrics are not meaningful during atrial fibrillation.
blood volume: the amount of blood contained in an area, mainly reflecting venous tone and peripheral pooling.
blood volume pulse (BVP): the phasic change in blood volume with each heartbeat. It is the vertical distance between the minimum value (trough) of one pulse wave and the maximum value (peak) of the next, measured using a photoplethysmograph (PPG).
cardiac conduction artifacts: artifacts originating from abnormal electrical activity in the heart, including atrial fibrillation, premature atrial contractions, and premature ventricular contractions. These cannot be prevented through sensor placement and must be removed through artifacting.
cold artifact: cold exposure or sympathetically-mediated vasoconstriction that can reduce or eliminate a pulse wave, resulting in missed beats and artifactually-lengthened interbeat intervals.
dicrotic notch: the gap between the direct pulse wave and the reflected wave in the BVP waveform, marking closure of the aortic valve.
electromagnetic interference (EMI) artifact: ECG and PPG artifact generated when cell phones or other electronic devices transmit an artifactual voltage or when power lines induce currents in sensor cables.
extra beats: ECG and PPG artifact that shortens the IBI when signal distortion causes the software to detect nonexistent beats.
heart rate (HR): the number of heartbeats per minute, calculated from BVP by dividing 60 seconds by the interbeat interval.
interbeat interval (IBI): the time period between successive heartbeats, measured as the interval between successive peaks in the BVP signal. The foundation for all HRV calculations.
light artifact: PPG artifact occurring when ambient light overloads the photodetector, producing exaggerated peak-to-trough differences.
line interference artifact: ECG and PPG artifact appearing as ripples when 50/60Hz contamination of signals causes the software to detect nonexistent beats and shorten the IBI.
missed beats: ECG and PPG artifact that lengthens the IBI when signal distortion causes the software to overlook a beat and use the next good beat.
movement artifact: ECG and PPG artifact that can eliminate the signal or result in extra or missed beats when sensor position shifts relative to the tissue. The most common cause of BVP signal distortion.
photoelectric transducer: phototransistor that detects infrared light transmitted by a PPG sensor and converts it into a positive DC signal proportional to blood volume.
photoplethysmograph (PPG): a photoelectric transducer that transmits and detects infrared light that passes through or is reflected off tissue to measure brief changes in blood volume and detect the pulse wave.
plateaus: cessation of warming during temperature biofeedback, which may indicate an opportunity to switch to blood volume pulse biofeedback for continued progress.
premature atrial contractions (PACs): early atrial contractions characterized by abnormally-shaped P-waves that result in calculating extra beats and can inflate HRV measurements.
premature ventricular contractions (PVCs): extra heartbeats originating in the ventricles instead of the SA node, followed by a compensatory pause. Creates characteristic short-long interval pairs that distort HRV metrics.
pressure artifact: reduction in the amplitude of the BVP signal due to a tight restraining band or resting too much weight on the PPG sensor.
pulse amplitude variability (PAV): beat-to-beat variation in the height of the peripheral pulse wave, influenced by stroke volume, arterial stiffness, and vascular tone.
pulse rate variability (PRV): a proxy of HRV derived from the BVP signal, which may differ from ECG-derived HRV under certain conditions including standing, slow-paced breathing, or low HRV states.
pulse transit time: the time required for the pulse wave to travel from the heart to the peripheral measurement site, which varies with blood pressure and arterial stiffness.
reflection technique: PPG measurement method that places both light source and photodetector on the same side of the tissue, detecting light reflected back from blood in the tissue.
tracking test: a check of whether the biofeedback display mirrors client behavior, performed by raising and lowering the monitored hand relative to the heart to observe corresponding changes in BVP amplitude.
transmission technique: PPG measurement method that places the light source and photodetector on opposite sides of a digit, detecting light passing through the tissue.
vascular responder: an individual whose fingers cool when challenged by stressors due to sympathetically-mediated vasoconstriction, often showing dramatic drops in BVP amplitude.
References
Allen, J. (2007). Photoplethysmography and its application in clinical physiological measurement. Physiological Measurement, 28(3), R1-R39. https://doi.org/10.1088/0967-3334/28/3/R01
Andreassi, J. L. (2000). Psychophysiology: Human behavior and physiological response. Lawrence Erlbaum and Associates, Inc.
Béres, S., & Hejjel, L. (2021). The minimal sampling frequency of the photoplethysmogram for accurate pulse rate variability parameters in healthy volunteers. Biomedical Signal Processing and Control, 68, 102589. https://doi.org/10.1016/j.bspc.2021.102589
Berntson, G. G., Quigley, K. S., & Lozano, D. (2007). Cardiovascular psychophysiology. In J. T. Cacioppo, L. G. Tassinary, & G. G. Berntson (Eds.). Handbook of psychophysiology (3rd ed.). Cambridge University Press.
Cherif, S., Pastor, D., Nguyen, Q.-T., & L'Her, E. (2016). Detection of artifacts on photoplethysmography signals using random distortion testing. In Proceedings of the 38th Annual International Conference of the IEEE Engineering in Medicine and Biology Society (EMBS) (pp. 6214-6217). https://doi.org/10.1109/EMBC.2016.7592149
Combatalade, D. (2010). Basics of heart rate variability applied to psychophysiology. Thought Technology Ltd.
Constant, I., Laude, D., Murat, I., & Elghozi, J.-L. (1999). Pulse rate variability is not a surrogate for heart rate variability. Clinical Science, 97(4), 391-397. https://doi.org/10.1042/cs0970391
Couceiro, R., Carvalho, P., Paiva, R. P., Henriques, J., & Muehlsteff, J. (2014). Detection of motion artifact patterns in photoplethysmographic signals based on time and period domain analysis. Physiological Measurement, 35(12), 2369-2388.
Dukes, J. W., Dewland, T. A., Vittinghoff, E., Mandyam, M. C., Heckbert, S. R., Siscovick, D. S., Stein, P. K., Psaty, B. M., Sotoodehnia, N., Gottdiener, J. S., & Marcus, G. M. (2015). Ventricular ectopy as a predictor of heart failure and death. Journal of the American College of Cardiology, 66(2), 101-109. https://doi.org/10.1016/j.jacc.2015.04.062
Elgendi, M. (2012). On the analysis of fingertip photoplethysmogram signals. Current Cardiology Reviews, 8, 14-25. https://dx.doi.org/10.2174/157340312801215782
Garber, C. (1986). Biofeedback instrumentation: An introduction. In M. S. Schwartz (Ed.), Biofeedback: A practitioner's guide. Guilford Press.
Gevirtz, R. N. (2011). Cardio-respiratory psychophysiology: Gateway to mind-body medicine. BFE conference workshop.
Hemon, M. C., & Phillips, J. P. (2016). Comparison of foot finding methods for deriving instantaneous pulse rates from photoplethysmographic signals. Journal of Clinical Monitoring and Computing, 30(2), 157-168. https://doi.org/10.1007/s10877-015-9695-6
Jan, H.-Y., Chen, M.-F., Fu, T.-C., Lin, W.-C., Tsai, C.-L., & Lin, K.-P. (2019). Evaluation of coherence between ECG and PPG derived parameters on heart rate variability and respiration in healthy volunteers with/without controlled breathing. Journal of Medical and Biological Engineering, 39, 783-795. https://doi.org/10.1007/s40846-019-00468-9
Lehrer, P. M. (2012). Personal communication.
Lehrer, P. M. (2018). Personal communication regarding PPG sensor placement and signal quality.
Medeiros, R. F., Silva, B. M., Neves, F. J., Rocha, N. G., Sales, A. R. K., & Nobrega, A. C. (2011). Impaired hemodynamic response to mental stress in subjects with prehypertension is improved after a single bout of maximal dynamic exercise. Clinics, 66(9), 1523-1529. https://doi.org/10.1590/S1807-59322011000900003
Montgomery, D. (2004). Introduction of biofeedback. Module 3: Psychophysiological recording. In A. Crider & D. D. Montgomery (Eds.). Association for Applied Psychophysiology and Biofeedback.
Moss, D. (2004). Heart rate variability (HRV) biofeedback. Psychophysiology Today, 1, 4-11.
Nunan, D., Sandercock, G. R. H., & Brodie, D. A. (2010). A quantitative systematic review of normal values for short-term heart rate variability in healthy adults. Pacing and Clinical Electrophysiology, 33(11), 1407-1417. https://doi.org/10.1111/j.1540-8159.2010.02841.x
Peper, E. (2010). Personal communication.
Peper, E., Harvey, R., Lin, I., Tylova, H., & Moss, D. (2007). Is there more to blood volume pulse than heart rate variability, respiratory sinus arrhythmia, and cardio-respiratory synchrony? Biofeedback, 35(2), 54-61.
Peper, E., & Lin, I.-M. (2009). Keep cell phones and PDAs away from EMG sensors and the human body to prevent electromagnetic interference artifacts and cancer. Biofeedback, 37(3), 114-116. https://doi.org/10.5298/1081-5937-37.3.114
Peper, E., Shaffer, F., & Lin, I-M. (2010). Garbage in; garbage out: Identify blood volume pulse (BVP) artifacts before analyzing and interpreting BVP, blood volume pulse amplitude, and heart rate. Biofeedback, 38(1), 19-23. https://doi.org/10.5298/1081-5937-38.1.19
Shaffer, F., & Combatalade, D. C. (2013). Don't add or miss a beat: A guide to cleaner heart rate variability recordings. Biofeedback, 41(3), 121-130. https://doi.org/10.5298/1081-5937-41.3.04
Shaffer, F., Meehan, Z. M., & Zerr, C. L. (2020). A critical review of ultra-short-term heart rate variability norms research. Frontiers in Neuroscience. https://doi.org/10.3389/fnins.2020.594880
Shaffer, F., & Moss, D. (2006). Biofeedback. In Y. Chun-Su, E. J. Bieber, & B. Bauer (Eds.). Textbook of complementary and alternative medicine (2nd ed.). Informa Healthcare.
Stern, R. M., Ray, W. J., & Quigley, K. S. (2001). Psychophysiological recording (2nd ed.). Oxford University Press.
Task Force of the European Society of Cardiology and the North American Society of Pacing and Electrophysiology. (1996). Heart rate variability: Standards of measurement, physiological interpretation, and clinical use. Circulation, 93, 1043-1065. PMID: 8598068
Tortora, G. J., & Derrickson, B. H. (2021). Principles of anatomy and physiology (16th ed.). John Wiley & Sons, Inc.
Return to Top