
Frequency-Domain Measurements of Heart Rate Variability
What You Will Learn
If time-domain measurements tell you how much heart rate variability a person has, frequency-domain measurements tell you where it comes from. Think of it like a prism separating white light into its component colors. In this unit, you will learn how power spectral analysis breaks down HRV into four frequency bands, each driven by different physiological processes, each carrying unique clinical significance.
You will explore the ultra-low-frequency (ULF), very-low-frequency (VLF), low-frequency (LF), and high-frequency (HF) bands, discover why some common assumptions about these bands are myths, and learn how to use frequency-domain metrics to guide HRV biofeedback training. Whether you are monitoring a client's resting baseline or coaching them through slow-paced breathing, understanding these measurements will sharpen your clinical decision-making.
Introduction to Frequency-Domain Analysis
This section introduces frequency-domain analysis and explains why it matters for HRV biofeedback practice. You will learn how spectral analysis separates HRV into component rhythms, the three ways to express power, and why journals now prefer log-transformed values.
HRV frequency-domain measurements reveal the physiological sources of heart rate variability and play a central role in heart rate variability biofeedback (HRVB). In clinical practice, we train clients to increase LF power during slow-paced breathing in the clinic, with the goal of increasing HF power when they breathe at typical rates in everyday life (Gevirtz, 2020). Where time-domain indices quantify the total amount of HRV, frequency-domain measurements quantify how that variability is distributed across four distinct frequency bands.
Just as electroencephalography (EEG) uses spectral analysis to separate brainwaves into alpha, beta, and theta rhythms, we can use power spectral analysis or autoregressive (AR) modeling to separate HRV into its component rhythms. Each rhythm operates within a different frequency range, much like a prism refracting light into its component wavelengths. The graphic below illustrates this principle.

Review this post to learn more about Fast Fourier power spectral analysis.
The Four Frequency Bands
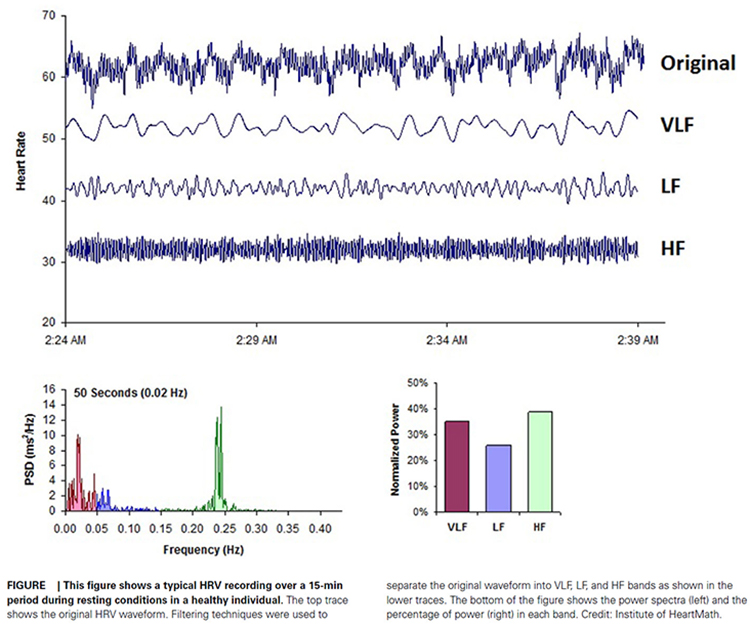
The Task Force of the European Society of Cardiology and the North American Society of Pacing and Electrophysiology (1996) divided heart rate oscillations into four frequency bands. The figure below shows the three bands visible in short-term recordings: VLF, LF, and HF.
How Power Is Expressed
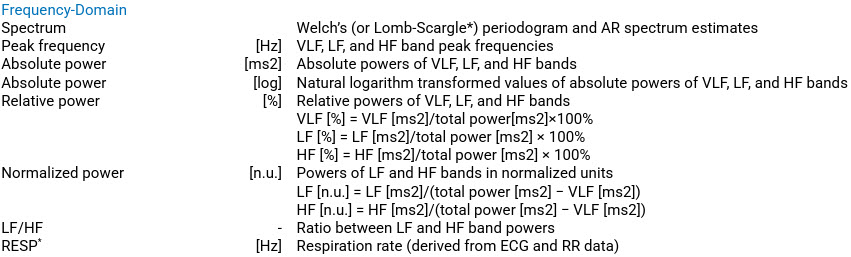
Clinicians can express frequency-domain power in three ways. Absolute power is measured in milliseconds squared divided by cycles per second (ms2/Hz) and tells you the raw signal energy within each band. Relative power expresses each band's contribution as a percentage of total HRV. Normal units (nu) are calculated by dividing a band's absolute power by the combined LF and HF power, which allows direct comparison of spectral distribution between clients.
However, normal units conceal how much each band actually contributes to overall HRV (Gevirtz, 2020). For this reason, journals now prefer reporting the natural logs of LF and HF power. A natural logarithm expresses a value to the base e, the irrational mathematical constant approximately equal to 2.71828. Log transformation compresses the wide range of raw power values into a more normally distributed scale, making statistical comparisons more reliable.
The autonomic contribution to the ultra-low-frequency (ULF), very-low-frequency (VLF), and low-frequency (LF) bands remains controversial since measurements profoundly vary with testing conditions (Lehrer, 2012). This is a theme that will recur throughout this unit: context matters when interpreting frequency-domain data.
Frequency-domain analysis separates HRV into four bands (ULF, VLF, LF, HF), each generated by different physiological processes. Power can be expressed as absolute values (ms2/Hz), relative percentages, or normal units. Journals now prefer natural log-transformed LF and HF values because normal units can obscure each band's actual contribution. Autonomic contributions to the lower-frequency bands remain context-dependent, making testing conditions critical for interpretation.
BCIA Blueprint Coverage
This unit addresses IV. HRV Measurements: B. Frequency-domain measurements and their meaning, properties, and correlates.
Professionals completing this unit will be able to discuss the following HRV frequency-domain indices: ULF, VLF, LF, HF, and the LF/HF ratio.
🎧 Listen to the Full Chapter Lecture
This unit covers the ULF, VLF, LF, and HF bands, minimum recording periods, and the controversial LF/HF ratio.
🎧 Mini-Lecture: HRV Frequency-Domain Metrics
How Frequency-Domain Measurements Reveal the Sources of HRV
This section explains the physiological basis for frequency-domain measurements. You will learn why different regulatory processes produce distinct frequency signatures, and how the four bands are color-coded in standard displays.
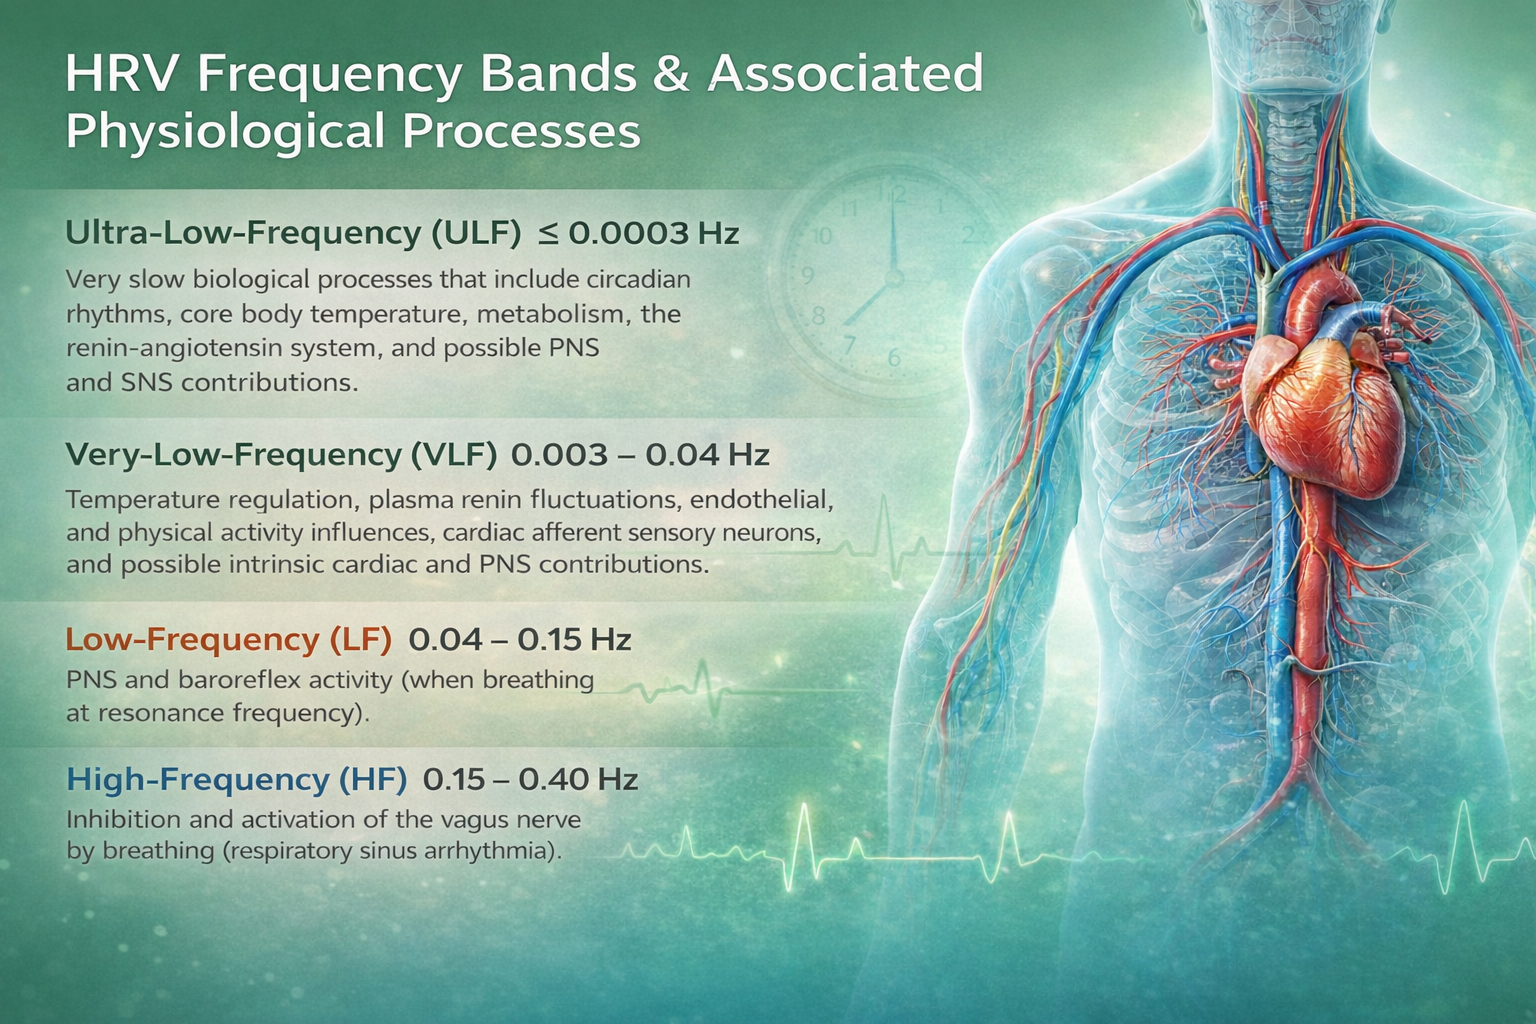
The regulatory processes that govern heart rate operate at different speeds, and each generates oscillations within a characteristic frequency range. Frequency-domain measurements quantify the absolute or relative amount of HRV signal power within each of four bands: ultra-low-frequency, very-low-frequency, low-frequency, and high-frequency. In the graphic below, adapted from Dr. Richard Gevirtz, ULF activity is red, VLF is green, LF is yellow, and HF is white.
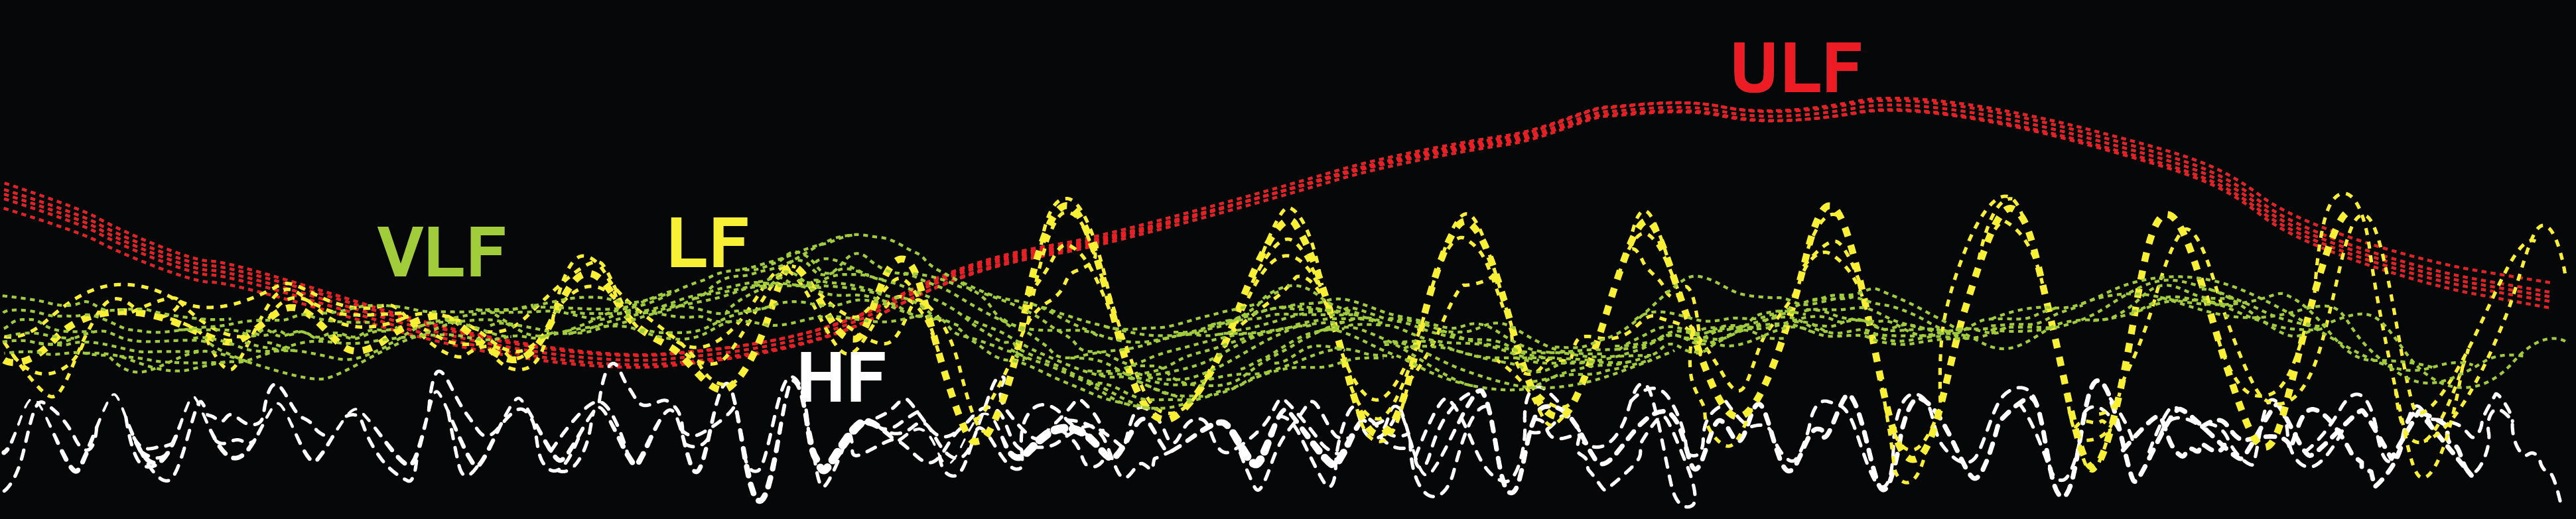
Understanding this color-coded map will help you quickly orient to spectral displays in software like Kubios, BioGraph Infiniti, and HeartMath. As you move from left to right across the spectrum, the oscillations become faster and the underlying physiology shifts from slow circadian processes to rapid respiratory-driven changes.
Ultra-Low-Frequency Band
This section covers the slowest HRV band. You will learn what the ULF band measures, why it requires 24-hour recordings, and which physiological processes drive it.
The ultra-low-frequency (ULF) band (≤ 0.003 Hz) captures fluctuations in interbeat intervals with cycle lengths ranging from 5 minutes to 24 hours. Because these oscillations are so slow, we can only measure ULF power reliably using 24-hour recordings (Kleiger et al., 2005). This also means ULF activity is far too gradual to train using conventional biofeedback, where clients need to see their physiology change in real time (Stauss, 2003).
ULF Sources
There is no consensus on the mechanisms that generate ULF power, but very slow-acting biological processes are implicated. Circadian rhythms — the roughly 24-hour cycles that regulate sleep, hormone release, and body temperature — may be the primary driver (Shaffer, McCraty, & Zerr, 2014). Core body temperature fluctuations, metabolic processes, and the renin-angiotensin system (a hormonal cascade that regulates blood pressure over hours) may also contribute (Task Force, 1996; Bonaduce et al., 1994).
Intriguingly, different psychiatric disorders produce distinct circadian patterns in 24-hour heart rate recordings, particularly during sleep (Stampfer, 1998; Stampfer & Dimmitt, 2013). This finding has clinical implications for psychiatrists and psychologists who monitor patients with mood disorders, schizophrenia, or PTSD using ambulatory recordings. There is ongoing disagreement about the contribution of the PNS and SNS to this band.
ULF Correlates
ULF power is highly correlated with the SDANN time-domain index, which captures variability across successive 5-minute segments of a 24-hour recording (Bigger et al., 1992). For clinicians working with ambulatory monitoring, this cross-reference between time-domain and frequency-domain measures can serve as a useful consistency check on data quality.
The ULF band (≤ 0.003 Hz) captures the slowest HRV oscillations and requires 24-hour recordings. Its primary drivers likely include circadian rhythms, core body temperature, and the renin-angiotensin system. ULF correlates with the SDANN time-domain index. Because ULF cycles are too slow for real-time feedback, this band is not targeted in conventional biofeedback training.
Comprehension Questions: ULF Band
- What is the frequency range of the ULF band, and why does measuring it require a 24-hour recording?
- What are the primary physiological processes believed to drive ULF power?
- Why is ULF activity too gradual to train with conventional biofeedback?
Very-Low-Frequency Band
This section covers the VLF band, its uncertain sources, and its striking clinical significance. You will learn why the heart's own nervous system may generate VLF rhythms, why sympathetic nerve activity is too fast to be responsible, and why VLF power is the strongest 24-hour predictor of all-cause mortality.
The very-low-frequency (VLF) band (0.0033–0.04 Hz) comprises rhythms with periods between 25 and 300 seconds. VLF measurement requires a recording period of at least 5 minutes but may be best monitored over 24 hours (Task Force, 1996). In the FFT spectral plot below, VLF power is colored gray.
VLF Sources
The physiological mechanisms responsible for VLF activity remain uncertain (Kleiger et al., 2005). The heart's intrinsic cardiac nervous system — sometimes called the "little brain on the heart" — appears to be a key contributor to VLF rhythms (Shaffer, McCraty, & Zerr, 2014). VLF power may also be generated by physical activity (Bernardi et al., 1996), thermoregulatory processes, renin-angiotensin fluctuations, and endothelial influences on the heart (Akselrod et al., 1981; Claydon & Krassioukov, 2008). There may also be an alpha-adrenergic (norepinephrine-mediated) vascular tone contribution (Lehrer & Gevirtz, 2021).
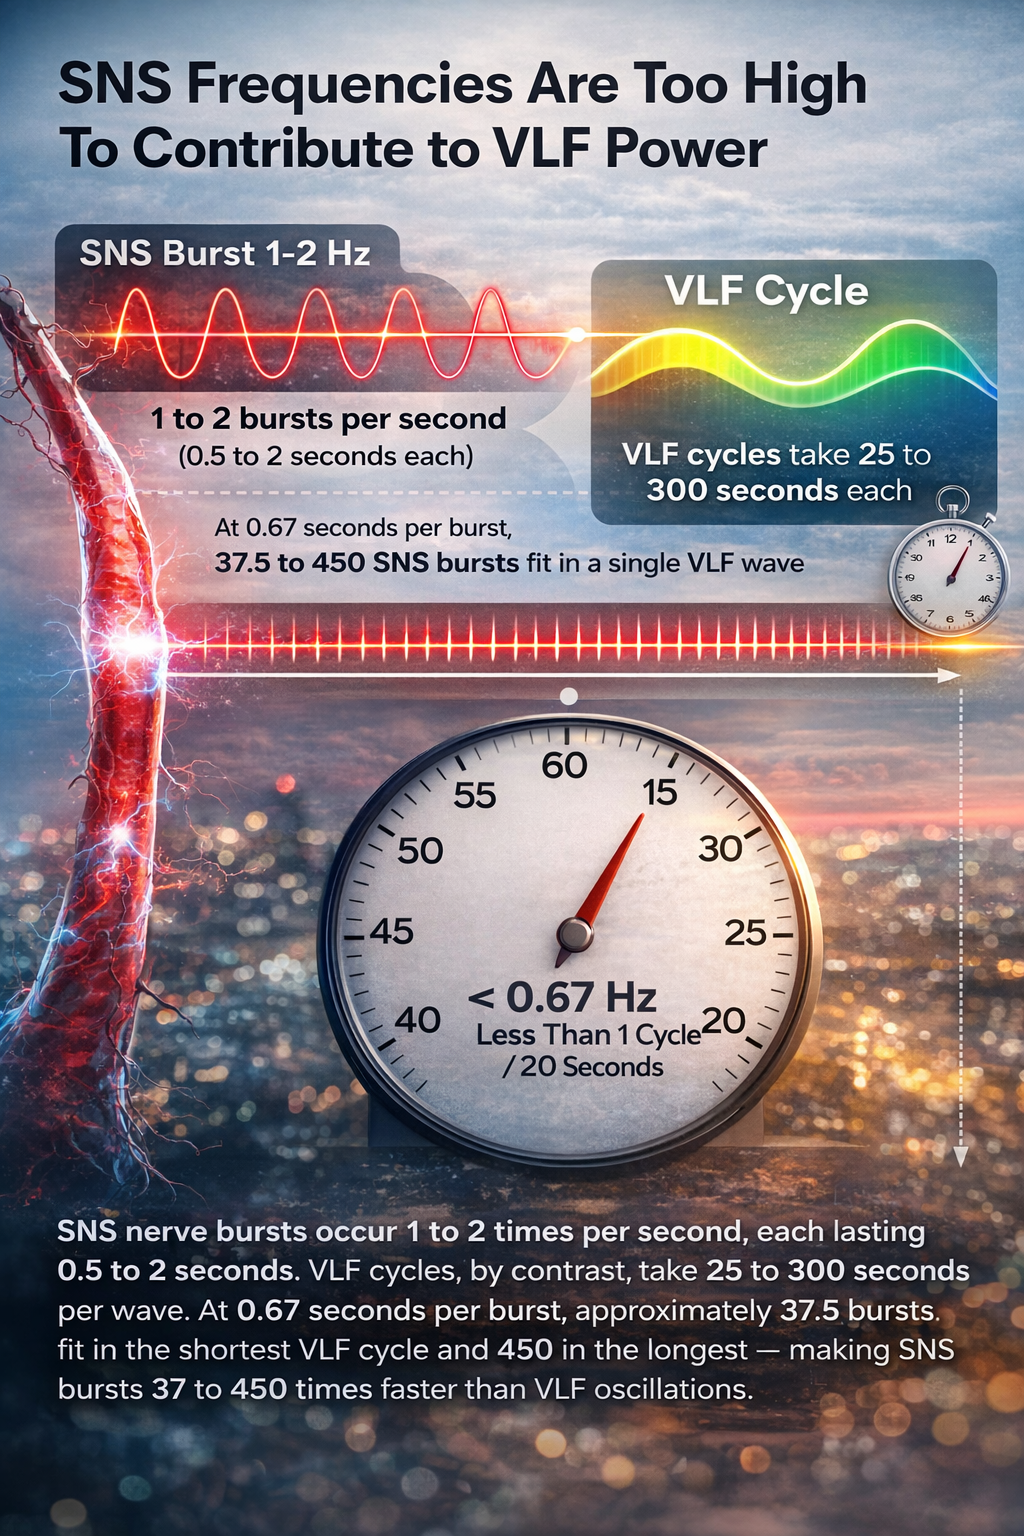
Parasympathetic (PNS) activity may also contribute to VLF power, since parasympathetic blockade almost completely abolishes it (Taylor et al., 1998). However, a common misconception is that sympathetic nervous system (SNS) activity drives VLF oscillations. Consider the math: SNS nerve bursts occur 1 to 2 times per second, each lasting 0.5 to 2 seconds (Macefield & Wallin, 1999). VLF cycles, by contrast, take 25 to 300 seconds per wave. At 0.67 seconds per burst, approximately 37.5 bursts fit in the shortest VLF cycle and 450 in the longest — making SNS bursts 37 to 450 times faster than VLF oscillations.
Beyond this timing mismatch, the SNS lacks a mechanism to produce the regular, sustained oscillations that characterize VLF activity. Sympathetic activity does not rise and fall smoothly like a wave; it reacts spontaneously to stressors without a predictable rhythm. Consistent with this, sympathetic blockade does not reduce VLF power, and VLF activity persists in tetraplegic individuals whose SNS innervation of the heart and lungs is disrupted (Task Force, 1996; Berntson et al., 1997).
The Intrinsic Cardiac Nervous System
Based on work by Armour (2003) and Kember et al. (2000, 2001), the VLF rhythm appears to be generated when afferent sensory neurons in the heart are stimulated. This activation engages multiple levels of feedback and feed-forward loops within the heart's intrinsic cardiac nervous system, as well as between the heart, the extrinsic cardiac ganglia, and the spinal column. This means some HRV patterns originate locally within the heart, rather than being driven entirely by the brain.
VLF Correlates
Among 24-hour clinical HRV measurements, VLF power is more strongly associated with all-cause mortality than either LF or HF power (Tsuji et al., 1994, 1996; Hadase et al., 2004; Schmidt et al., 2005). While all low values on 24-hour HRV measurements predict greater risk of adverse outcomes, the strength of the VLF-mortality association suggests this rhythm may be fundamental to health (Shaffer, McCraty, & Zerr, 2014).
Low VLF power is also associated with arrhythmic death (Bigger et al., 1992), PTSD (Shah et al., 2013), and elevated inflammation markers (Carney et al., 2007; Lampert et al., 2008). Interestingly, low VLF power correlates with low testosterone levels, while other biochemical markers mediated by the HPA axis, such as cortisol, did not show this association (Theorell et al., 2007). VLF power strongly correlates with the SDNN index time-domain measure, which averages 5-minute standard deviations for all NN intervals over 24 hours.
Significance for HRV Biofeedback
In clinical practice, unexpected VLF elevations during training sessions may signal chronic SNS activation or vagal withdrawal (parasympathetic suppression) due to chronic worry or excessive effort (Gevirtz, 2017). Monitoring VLF during sessions gives you an additional window into your client's autonomic state beyond what LF and HF alone reveal.
The VLF band (0.0033–0.04 Hz) requires at least 5 minutes of recording. Its sources include the heart's intrinsic nervous system, thermoregulation, and parasympathetic activity. SNS nerve bursts fire far too rapidly to generate VLF oscillations, and sympathetic blockade does not reduce VLF power. Among 24-hour measures, VLF power is the strongest predictor of all-cause mortality. In clinical training, elevated VLF may signal excessive effort or chronic worry.
Comprehension Questions: VLF Band
- What is the minimum recording period for VLF measurement, and why is 24-hour monitoring preferred?
- Why are SNS nerve bursts too fast to generate VLF oscillations? Walk through the math.
- What does elevated VLF power during a training session potentially indicate about your client?
- Why is VLF power considered a stronger predictor of all-cause mortality than LF or HF power?
Low-Frequency Band
This section covers the LF band, its relationship to the baroreflex, and why it is the primary target of HRV biofeedback training. You will learn what drives LF power, why the old "sympathetic band" label is misleading, and how to interpret LF values in clinical sessions.
The low-frequency (LF) band (0.04–0.15 Hz) comprises rhythms with periods between 7 and 25 seconds. It is affected by breathing from approximately 3 to 9 breaths per minute (bpm) and requires a minimum recording period of 2 minutes (Task Force, 1996). The baroreflex — the body's rapid blood-pressure regulation system — resonates within this band, which is why the LF region was previously called the "baroreceptor range" (McCraty & Shaffer, 2015). In the FFT spectral plot below, LF power is colored orange.
LF Sources
While there is ongoing disagreement regarding this band's sources, a sympathetic role during resting measurements appears unlikely (Hayano & Yuda, 2019). Instead, PNS activity and blood pressure regulation via baroreceptors — stretch-sensitive sensors in the carotid arteries and aortic arch that detect changes in arterial pressure — appear to be the primary contributors (Akselrod et al., 1981; Berntson, Quigley, & Lozano, 2007; Lehrer, 2007; Task Force, 1996). Goldstein et al. (2011) proposed that LF power may reflect modulation of cardiac autonomic outflows by baroreflex activity alone, rather than direct sympathetic input.
The late Evgeny Vaschillo identified a possible SNS component near 0.05 Hz (Lehrer & Gevirtz, 2021), suggesting that the picture is nuanced rather than all-or-nothing. Breathing at rates below 8.5 breaths per minute, as well as sighing and taking deep breaths, may also contribute to LF activity via vagal mechanisms (Shaffer, McCraty, & Zerr, 2014). This vagal contribution is precisely why slow-paced breathing at the resonance frequency — typically around 6 bpm — drives such large increases in LF power during biofeedback training.
Significance for HRV Biofeedback
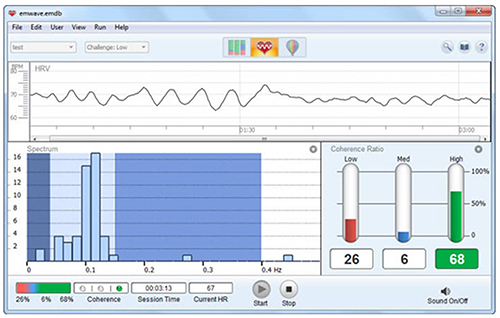
LF band power is your primary metric for assessing the success of HRVB during slow-paced breathing sessions. When your client breathes at 4.5 to 7.5 bpm, expect elevated LF power as the baroreflex resonance amplifies heart rate oscillations (Shaffer & Ginsberg, 2017). A single high-amplitude peak near 0.1 Hz on the spectral display indicates high coherence within the Institute of HeartMath model — a proprietary term describing a "narrow, high-amplitude, easily visualized peak" from 0.09 to 0.14 Hz (Ginsberg, Berry, & Powell, 2010, p. 54).
However, high LF power at typical resting breathing rates (e.g., 12 to 14 bpm) is a red flag. When LF power is elevated outside of slow-paced breathing, it suggests that the vagal brake — the parasympathetic nervous system's ability to quickly slow the heart — may not be functioning properly (Khazan, 2020). This is a finding worth discussing with the referring physician, as it may indicate autonomic dysregulation that warrants further medical evaluation.
HRVB trains clients to increase LF power during slow-paced breathing to increase HF power during baselines when they breathe at typical rates. This is the core principle of HRV biofeedback training.
The LF band (0.04–0.15 Hz) requires at least 2 minutes of recording and reflects PNS and baroreflex activity. A sympathetic role during resting measurements appears unlikely. LF power is the primary training target during HRVB, where slow-paced breathing amplifies baroreflex resonance near 0.1 Hz. Elevated LF power at typical resting breathing rates is a clinical red flag suggesting possible vagal brake dysfunction.
Comprehension Questions: LF Band
- What is the minimum recording period for the LF band, and what is its frequency range?
- Why does a sympathetic role in LF power during resting measurements appear unlikely?
- What does elevated LF power at a typical breathing rate (e.g., 12 to 14 bpm) suggest clinically?
- What does the term "coherence" mean in the Institute of HeartMath model?
High-Frequency (HF) Band
This section covers the HF band, its tight connection to breathing and vagal activity, and how to use it to evaluate training outcomes. You will learn why HF is called the "respiratory band," what happens when vagal activity is blocked, and how HF power tracks with client well-being.
The high-frequency (HF) or respiratory band (0.15–0.40 Hz) reflects heart rate oscillations driven by breathing at 9 to 24 bpm (Malik, 1996). It requires a recording period of at least 1 minute. For infants and children, who breathe faster than adults, the resting HF range can be adjusted upward to 0.24–1.04 Hz (Quintana et al., 2016). Clinicians working in pediatric settings should be aware of this age-adjusted range to avoid misinterpreting normal childhood HRV.
HF Sources
The HF band reflects parasympathetic activity and is called the respiratory band because it corresponds to heart rate variations linked to the breathing cycle. These phasic changes are known as respiratory sinus arrhythmia (RSA) — the natural acceleration of heart rate during inhalation and deceleration during exhalation. However, RSA may not be a pure index of cardiac vagal control (Grossman & Taylor, 2007).
The mechanism works as follows: during inhalation, the cardiovascular center in the brainstem inhibits vagal outflow, allowing the heart rate to speed up. During exhalation, vagal tone is restored and the heart slows through the release of the neurotransmitter acetylcholine at the sinoatrial node (Eckberg & Eckberg, 1982). Total vagal blockage virtually eliminates HF oscillations and also reduces power in the LF range, underscoring the vagus nerve's broad influence across the frequency spectrum (Shaffer, McCraty, & Zerr, 2014).
HF Correlates
HF power is highly correlated with two time-domain measures: pNN50 (the percentage of successive NN intervals that differ by more than 50 ms) and RMSSD (the root mean square of successive differences). These cross-domain correlations give you multiple ways to verify parasympathetic status (Kleiger et al., 2005). HF power typically increases at night during sleep and decreases during the day, reflecting the circadian rhythm of vagal dominance during rest (McCraty & Shaffer, 2015).
Lower HF power is correlated with stress, panic, anxiety, and chronic worry — conditions commonly seen in VA, hospital, and clinic settings. Deficient vagal inhibition is associated with increased cardiovascular morbidity, highlighting the importance of maintaining dynamic autonomic regulation (Thayer et al., 2010). For performance practitioners, HF power can also serve as a recovery marker, with suppressed values indicating incomplete physiological recovery in athletes and military personnel.
Significance for HRV Biofeedback
Use HF band power alongside time-domain metrics like RMSSD to assess HRV biofeedback training success during resting baselines (Shaffer & Ginsberg, 2017). Remember that the core training principle connects the two primary bands: we increase LF power during slow-paced breathing in the clinic so that HF power increases during resting baselines at typical breathing rates.
HRVB trains clients to increase LF power during slow-paced breathing to increase HF power during baselines when they breathe at typical rates.
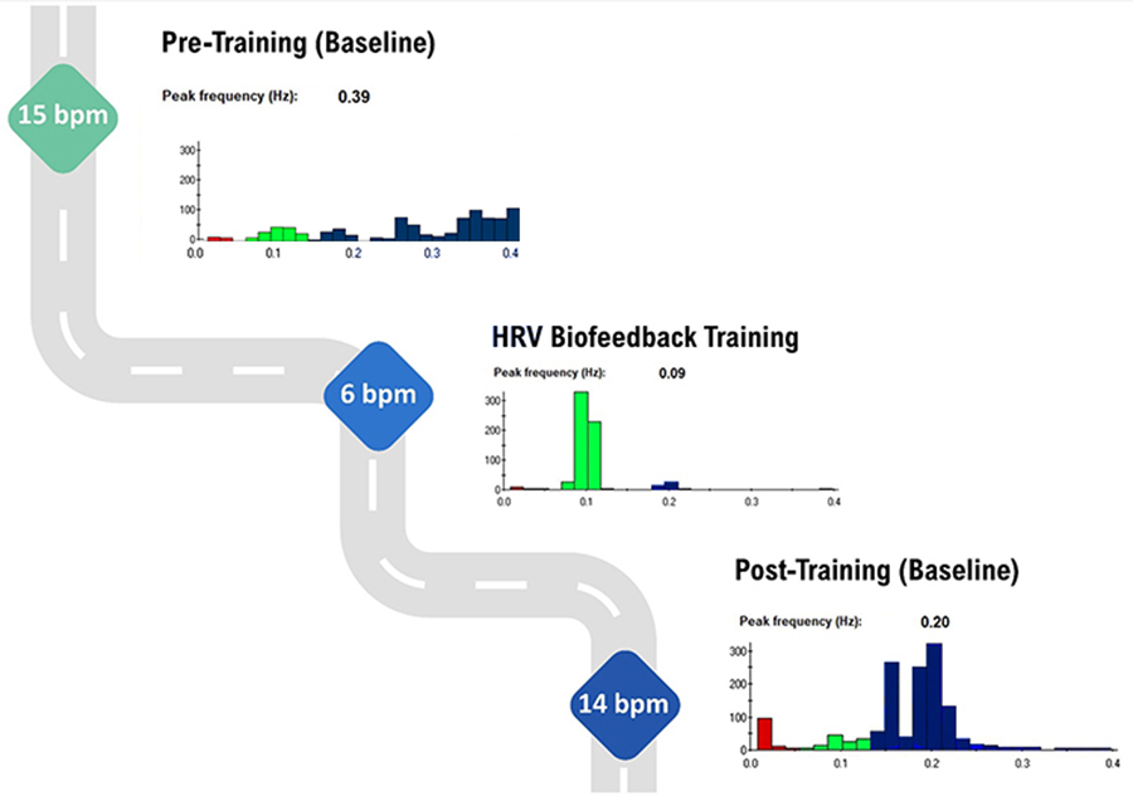
The graphic below illustrates this shift across training. Note the greater LF power concentration in the post-training baseline compared with the pre-training baseline, during which the client breathed at typical rates. Inna Khazan generously provided the spectral plots.
The HF band (0.15–0.40 Hz) reflects parasympathetic activity and respiratory sinus arrhythmia, requiring at least 1 minute of recording. HF power correlates with pNN50 and RMSSD, increases at night, and decreases during the day. Lower HF power is associated with stress, anxiety, and chronic worry. Use HF band power alongside RMSSD to assess HRVB training success during resting baselines.
Comprehension Questions: HF Band
- Why is the HF band also called the respiratory band?
- What happens to HF oscillations when vagal activity is completely blocked?
- Which time-domain measures correlate most strongly with HF power?
- How do you use HF band power to evaluate the success of HRVB training?
LF/HF Ratio
This section addresses the LF/HF ratio, a once-popular metric that has become increasingly controversial. You will learn why the ratio was originally developed, why it fails as a measure of autonomic balance during short recordings, and what to say when colleagues misinterpret it.
Power is the signal energy contained within a given frequency band. The LF/HF ratio divides LF power by HF power and was originally based on 24-hour recordings, during which both PNS and SNS activity contribute to LF power, while PNS activity primarily drives HF power. The intent was to estimate the balance between sympathetic and parasympathetic activity.
However, calculating a LF/HF ratio from brief or resting recordings is problematic because short-term values are poorly correlated with 24-hour measurements. The SNS contribution to LF activity varies profoundly with testing conditions (Lehrer, 2012). During resting conditions, the primary LF contributors are PNS activity and baroreflex activity, not the SNS. You are essentially dividing one parasympathetically influenced band by another, which tells you nothing about sympathetic-parasympathetic balance. Therefore, a 5-minute resting baseline cannot estimate autonomic balance (McCraty, 2013).
Minimum Recording Periods for Frequency-Domain Measures
This section provides the minimum recording durations needed for reliable frequency-domain measurement. Getting this wrong can lead to uninterpretable data, so these are practical boundaries every clinician should know.
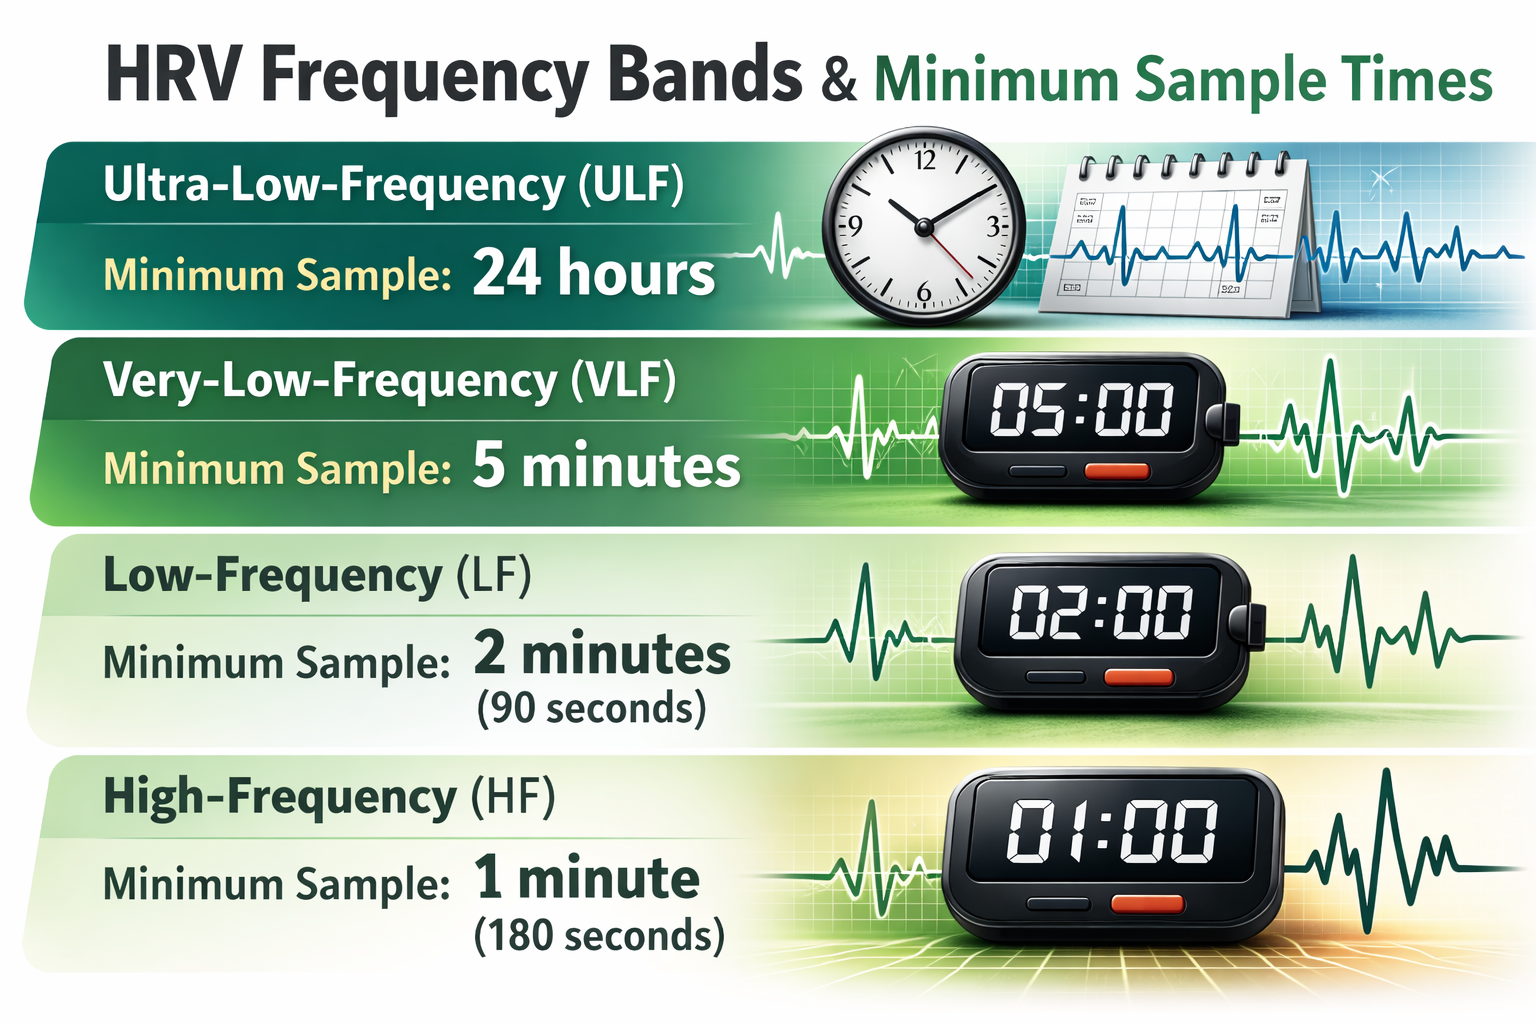
Each frequency band requires a minimum recording duration because you need to capture enough complete cycles for the mathematical analysis to be valid. The table below shows conventional and ultra-short-term samples (shown in parentheses) for the four HRV bands (Shaffer, Meehan, & Zerr, 2020). As a practical rule, longer recordings always yield more stable estimates, but these minimums set the floor below which data become unreliable.
The LF/HF ratio was designed for 24-hour recordings where both branches of the autonomic nervous system contribute to LF power. During short resting recordings, the SNS barely contributes to LF, making the ratio meaningless as a measure of autonomic balance. Each frequency band has a minimum recording period that must be met for valid measurement. These recording requirements should guide how you design assessment protocols.
HF Power and RSA Do Not Represent Vagal Tone
This section addresses one of the most common misunderstandings in HRV science. You will learn the critical distinction between vagal modulation and vagal tone, why changing breathing rate alters HRV indices without affecting tone, and why this matters for interpreting client data.
In healthy individuals, RSA can be dramatically increased simply by slowing and deepening breathing. Respiration rate changes can produce large-scale shifts in RSA magnitude without affecting vagal tone, which is defined as the overall level of vagal influence on the heart, reflected by mean HR change across conditions such as rest to exercise (Grossman, 2017b). This distinction has direct implications for how you interpret session-to-session changes in your clients' HRV data.
Grossman (2017a) proposed a simple thought experiment that illustrates the point. If you slow your breathing from 15 bpm to 6 bpm, you will observe dramatically increased heart rate fluctuations. However, your mean heart rate should not appreciably change, because your vagal tone has not decreased. If HF power truly reflected vagal tone, these shifts in HF power should produce corresponding changes in average heart rate — but they do not.
RSA and vagal tone are further dissociated during large-scale changes in SNS activity, chemical blockade of the sinoatrial node, and when intense vagal efferent traffic dramatically slows heart rate during both inhalation and exhalation (Grossman & Taylor, 2007). Shifts in respiration rate and volume can markedly change HRV indices including HF power, peak-to-trough differences, pNN50, and RMSSD, all without affecting vagal tone (Grossman, 2017b).
This is a crucial distinction: HF power and RSA measure vagal modulation (how the vagus adjusts heart rate beat-to-beat), not vagal tone (the overall level of vagal influence on the heart). Changing your breathing rate changes modulation without changing tone.
LnHF Power Can Estimate Vagal Tone Under Controlled Conditions
This section explains when and how log-transformed HF power can serve as a practical estimate of vagal tone. You will learn the specific conditions required and why baroreflex sensitivity plays a supporting role.
Despite the limitations just described, there is a practical workaround. The natural logarithm (Ln) is the logarithm to the base e of a numeric value. Under controlled conditions — specifically, when a client is sitting quietly and breathing at normal rates — LnHF power can serve as a reasonable estimate of vagal tone (Gevirtz, 2017). Baroreflex sensitivity is also strongly associated with power in the high-frequency band, providing a complementary window into parasympathetic function.
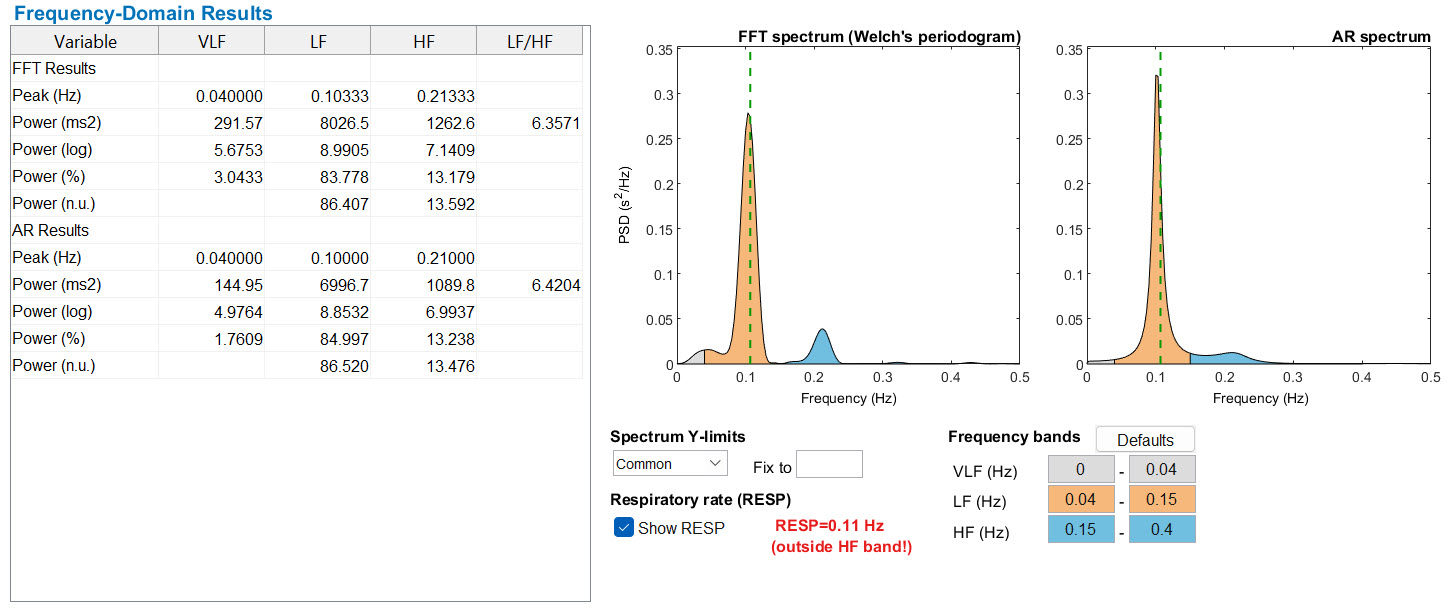
In the Kubios output table below, an HF power of 1262.8 ms2 corresponds to an LnHF of 7.14. The log transformation makes it easier to compare values across clients and track changes over time, since raw HF power values can vary by orders of magnitude between individuals.
HRV FREQUENCY BANDS
HF power and RSA index vagal modulation — how the vagus adjusts heart rate beat-to-beat — not vagal tone itself. Changing breathing rate alters HRV indices without changing mean heart rate. Under controlled conditions with normal breathing rates, LnHF power can serve as a practical estimate of vagal tone. Always confirm that clients are breathing at typical rates before interpreting HF-based metrics as indicators of tonic vagal activity.
Comprehension Questions: Vagal Tone, LnHF, and Recording Periods
- What is the critical distinction between vagal modulation and vagal tone?
- Why does slowing breathing from 15 bpm to 6 bpm change HF power without changing mean HR?
- Under what conditions can LnHF power serve as a practical estimate of vagal tone?
- What are the minimum recording periods for ULF, VLF, LF, and HF bands?
HRV Myths
This section debunks three persistent misconceptions about frequency-domain measurements. Recognizing these myths will help you avoid misinterpreting client data and will sharpen your conversations with colleagues and referral sources.

Misconception: HF and VLF Measurements Are Valid During Slow-Paced Breathing
HF and VLF values become uninterpretable during slow-paced breathing near the resonance frequency. When a client breathes at around 6 bpm, the respiratory-driven power shifts out of the HF band and into the LF band, leaving HF and VLF readings meaningless. Only measure HF and VLF during resting baselines when your client breathes at typical rates — this is a frequent source of error in clinical practice.
Misconception: The SNS Contributes to LF Power
During resting baseline conditions, the SNS does not generate LF power. As discussed in the LF band section, PNS activity and the baroreflex are the two primary LF sources at rest. The old textbook label of LF as the "sympathetic band" has been superseded by more rigorous evidence showing that baroreflex modulation, not sympathetic drive, dominates this range under resting conditions.
Misconception: The LF/HF Ratio Estimates Autonomic Balance During Short-Term Baseline Measurements
Since the SNS does not contribute significantly to LF power during short resting recordings, the LF/HF ratio cannot measure autonomic balance under these conditions. You are dividing one primarily parasympathetic measure by another, which provides no information about the sympathetic-parasympathetic axis. If a published study or device report presents LF/HF ratios from brief resting baselines as evidence of "sympathovagal balance," treat that claim with appropriate skepticism.
Three common myths can mislead clinicians: HF and VLF measurements are not valid during slow-paced breathing, the SNS does not drive LF power at rest, and the LF/HF ratio from short-term recordings does not estimate autonomic balance. Recognizing these misconceptions will protect you from misinterpreting client data and strengthen your evidence-based practice.
Cutting Edge Topics
Ultra-Short-Term HRV Recordings
Researchers are increasingly exploring whether recording periods shorter than the Task Force's conventional standards can yield reliable frequency-domain estimates. Shaffer, Meehan, and Zerr (2020) reviewed evidence for ultra-short-term samples across all four frequency bands. While promising for some clinical and mobile health applications, ultra-short-term estimates carry greater measurement error and should be interpreted cautiously. As wearable technology continues to advance, establishing the validity of brief recordings will become even more important for real-world HRV monitoring in clinical, military, and athletic settings.
Intrinsic Cardiac Nervous System and VLF Generation
The discovery that the heart possesses its own intrinsic nervous system has reshaped our understanding of VLF power. Work by Armour (2003) demonstrated that afferent sensory neurons in the heart can activate feedback and feed-forward loops independently of central nervous system input. This "little brain on the heart" may be a primary generator of VLF rhythms, suggesting that some HRV patterns originate locally rather than being driven entirely by the brain. Future research may reveal how targeting intrinsic cardiac function could open new therapeutic pathways for conditions associated with low VLF power.
Rethinking the LF/HF Ratio
The LF/HF ratio was once widely used as a convenient index of sympathovagal balance. However, accumulating evidence has challenged this interpretation, particularly for short-term recordings. Goldstein et al. (2011) demonstrated that LF power is not a reliable measure of cardiac sympathetic tone but may instead reflect modulation of cardiac autonomic outflows by baroreflexes. This paradigm shift has led many researchers to recommend abandoning the LF/HF ratio for brief recordings and instead using LnHF or RMSSD as more valid indices of parasympathetic function.
Assignment
Now that you have completed this module, explain why we cannot provide immediate ULF feedback. Why is increasing LF power desirable?
Glossary
absolute power: the magnitude of HRV within a frequency band measured in milliseconds squared divided by cycles per second (ms2/Hz).
coherence: self-coherence; signal power in the 0.09-0.14 region of the LF band.
heart rate: the number of heartbeats per minute, also called stroke rate.
heart rate variability (HRV): the beat-to-beat changes in heart rate, including changes in the RR intervals between consecutive heartbeats.
high-frequency (HF) band: a HRV frequency range from 0.15-0.40 Hz that represents the inhibition and activation of the vagus nerve by breathing (respiratory sinus arrhythmia).
interbeat interval (IBI): the time interval between the peaks of successive R-spikes (initial upward deflections in the QRS complex). This is also called the NN (normal-to-normal) interval.
low-frequency (LF) band: a HRV frequency range of 0.04-0.15 Hz that may represent the influence of PNS and baroreflex activity (when breathing at the RF).
natural logarithm (Ln): the logarithm to the base e of a numeric value.
normal units (nu): the division of the absolute power for a specific frequency band by the summed absolute power of the low frequency (LF) and high frequency (HF) bands.
power: the signal energy found within a frequency band.
relative power: the percentage of total HRV.
spectral analysis: the division of heart rate variability into component rhythms that operate within different frequency bands.
total power: the sum of power (ms2) in the ULF, VLF, LF, and HF bands for 24-hour recording and the VLF, LF, and HF bands for brief recording.
ultra-low-frequency (ULF) band: a HRV frequency range below 0.003 Hz. Very slow biological processes that include circadian rhythms, core body temperature, metabolism, the renin-angiotensin system, and possible PNS and SNS contributions.
very-low-frequency (VLF): a HRV frequency range of 0.003-0.04 Hz that may represent temperature regulation, plasma renin fluctuations, endothelial, physical activity influences, and possible intrinsic cardiac, and PNS contributions.
References
Akselrod, S., Gordon, D., Ubel, F. A., Shannon, D. C., Barger, A. C., & Cohen, R. J. (1981). Power spectrum analysis of heart rate fluctuation: A quantitative probe of beat-to-beat cardiovascular control. Science, 213(4504), 220-222.
Andreassi, J. L. (2000). Psychophysiology: Human behavior and physiological response. Lawrence Erlbaum and Associates, Inc.
Armour, J. A. (2003). Neurocardiology: Anatomical and functional principles. Institute of HeartMath.
Bernardi, L., Valle, F., Coco, M., Calciati, A., & Sleight, P. (1996). Physical activity influences heart rate variability and very-low-frequency components in Holter electrocardiograms. Cardiovascular Research, 32(2), 234-237.
Berntson, G. G., Bigger, J. T., Jr., Eckberg, D. L., Grossman, P., Kaufmann, P. G., Malik, M., . . . van der Molen, M. W. (1997). Heart rate variability: Origins, methods, and interpretive caveats. Psychophysiology, 34(6), 623-648.
Berntson, G. G., Quigley, K. S., & Lozano, D. (2007). Cardiovascular psychophysiology. In J. T. Cacioppo, L. G. Tassinary, & G. G. Berntson (Eds.), Handbook of psychophysiology (3rd ed.). Cambridge University Press.
Bigger, J. T., Jr., Fleiss, J. L., Steinman, R. C., Rolnitzky, L. M., Kleiger, R. E., & Rottman, J. N. (1992). Frequency domain measures of heart period variability and mortality after myocardial infarction. Circulation, 85(1), 164-171.
Bonaduce, D., Petretta, M., Piscione, F., Indolfi, C., Migaux, M. L., Bianchi, V., . . . Chiariello, M. (1994). Influence of reversible segmental left ventricular dysfunction on heart period variability in patients with one-vessel coronary artery disease. Journal of the American College of Cardiology, 24(2), 399-405.
Carney, R. M., Freedland, K. E., Stein, P. K., Miller, G. E., Steinmeyer, B., Rich, M. W., & Duntley, S. P. (2007). Heart rate variability and markers of inflammation and coagulation in depressed patients with coronary heart disease. Journal of Psychosomatic Research, 62(4), 463-467.
Claydon, V. E., & Krassioukov, A. V. (2008). Clinical correlates of frequency analyses of cardiovascular control after spinal cord injury. American Journal of Physiology-Heart and Circulatory Physiology, 294(2), H668-H678. https://doi.org/10.1152/ajpheart.00869.2007
Combatalade, D. (2010). Basics of heart rate variability applied to psychophysiology. Thought Technology Ltd.
Eckberg, D. L., & Eckberg, M. J. (1982). Human sinus node responses to repetitive, ramped carotid baroreceptor stimuli. The American Journal of Physiology, 242(4), H638-H644.
Gevirtz, R. N. (2017). Cardio-respiratory psychophysiology: Gateway to mind-body medicine.
Gevirtz, R. N. (2020). The myths and misconceptions of heart rate variability. Association for Applied Psychophysiology and Biofeedback Virtual Conference.
Ginsberg, J. P., Berry, M. E., & Powell, D. A. (2010). Cardiac coherence and posttraumatic stress disorder in combat veterans. Alternative Therapies in Health and Medicine, 16(4), 52-60.
Goldstein, D. S., Bentho, O., Park, M. Y., & Sharabi, Y. (2011). Low frequency power of heart rate variability is not a measure of cardiac sympathetic tone but may be a measure of modulation of cardiac autonomic outflows by baroreflexes. Experimental Physiology, 96(12), 1255-1261. https://doi.org/10.1113/expphysiol.2010.056259
Grossman, P. (2017a). Comments on Heart rate variability and cardiac vagal tone in psychophysiological research. Frontiers in Psychology.
Grossman, P. (2017b). Comments on Heart rate variability and cardiac vagal tone in psychophysiological research. Frontiers in Psychology.
Grossman, P., & Taylor, E. W. (2007). Toward understanding respiratory sinus arrhythmia: Relations to cardiac vagal tone, evolution and biobehavioral functions. Biological Psychology, 74, 263-285. https://doi.org/10.1016/j.biopsycho.2005.11.014
Hadase, M., Azuma, A., Zen, K., Asada, S., Kawasaki, T., Kamitani, T., . . . Matsubara, H. (2004). Very low frequency power of heart rate variability is a powerful predictor of clinical prognosis in patients with congestive heart failure. Circulation Journal, 68(4), 343-347.
Hayano, J., & Yuda, E. (2019). Pitfalls of assessment of autonomic function by heart rate variability. Journal of Physiological Anthropology, 38(1), 3. https://doi.org/10.1186/s40101-019-0193-2
Kember, G. C., Fenton, G. A., Armour, J. A., & Kalyaniwalla, N. (2001). Competition model for aperiodic stochastic resonance in a Fitzhugh-Nagumo model of cardiac sensory neurons. Physical Review E, 63(4 Pt 1), 041911.
Kember, G. C., Fenton, G. A., Collier, K., & Armour, J. A. (2000). Aperiodic stochastic resonance in a hysteretic population of cardiac neurons. Physical Review E, 61(2), 1816-1824.
Khazan, I. (2020). The myths and misconceptions of heart rate variability. Association for Applied Psychophysiology and Biofeedback Virtual Conference.
Kleiger, R. E., Stein, P. K., & Bigger, J. T., Jr. (2005). Heart rate variability: Measurement and clinical utility. Annals of Noninvasive Electrocardiology, 10(1), 88-101.
Lampert, R., Bremner, J. D., Su, S., Miller, A., Lee, F., Cheema, F., . . . Vaccarino, V. (2008). Decreased heart rate variability is associated with higher levels of inflammation in middle-aged men. American Heart Journal, 156(4), 759.e1-759.e7.
Lehrer, P. M. (2007). Biofeedback training to increase heart rate variability. In P. M. Lehrer, R. M. Woolfolk, & W. E. Sime (Eds.), Principles and practice of stress management (3rd ed.). The Guilford Press.
Lehrer, P. M. (2012). Personal communication about the sources of frequency domain measurements.
Lehrer, P. M., & Gevirtz, R. (2021). BCIA HRV Biofeedback didactic workshop. Association for Applied Psychophysiology and Biofeedback.
Lehrer, P. M., Vaschillo, E., & Vaschillo, B. (2000). Resonant frequency biofeedback training to increase cardiac variability: Rationale and manual for training. Applied Psychophysiology and Biofeedback, 25(3), 177-191. https://doi.org/10.1023/a:1009554825745
Macefield, V. G., & Wallin, B. G. (1999). Firing properties of single vasoconstrictor neurones in human subjects with high levels of muscle sympathetic activity. The Journal of Physiology, 516(Pt 1), 293-301.
Malik, M. (1996). Heart rate variability: Standards of measurement, physiological interpretation, and clinical use. Circulation, 93(5), 1043-1065.
McCraty, R. (2013). Personal communication regarding the LF/HF ratio.
McCraty, R., & Shaffer, F. (2015). Heart rate variability: New perspectives on physiological mechanisms, assessment of self-regulatory capacity, and health risk. Global Advances in Health and Medicine, 4(1), 46-61.
Moss, D. (2004). Heart rate variability (HRV) biofeedback. Psychophysiology Today, 1, 4-11.
Nunan, D., Sandercock, G. R. H., & Brodie, D. A. (2010). A quantitative systematic review of normal values for short-term heart rate variability in healthy adults. Pacing and Clinical Electrophysiology, 33(11), 1407-1417. https://doi.org/10.1111/j.1540-8159.2010.02841.x
Quintana, D. S., Alvares, G. A., & Heathers, J. A. J. (2016). Guidelines for reporting articles on psychiatry and heart rate variability (GRAPH): Recommendations to advance research communication. Translational Psychiatry, 6(5), e803.
Schmidt, H., Müller-Werdan, U., Hoffmann, T., Francis, D. P., Piepoli, M. F., Rauchhaus, M., . . . Werdan, K. (2005). Autonomic dysfunction predicts mortality in patients with multiple organ dysfunction syndrome of different age groups. Critical Care Medicine, 33(9), 1994-2002.
Shaffer, F., & Ginsberg, J. P. (2017). An overview of heart rate variability metrics and norms. Frontiers in Public Health, 5, 258. https://doi.org/10.3389/fpubh.2017.00258
Shaffer, F., McCraty, R., & Zerr, C. L. (2014). A healthy heart is not a metronome: An integrative review of the heart's anatomy and heart rate variability. Frontiers in Psychology, 5, 1040. https://doi.org/10.3389/fpsyg.2014.01040
Shaffer, F., Meehan, Z. M., & Zerr, C. L. (2020). A critical review of ultra-short-term heart rate variability norms research. Frontiers in Neuroscience, 14, 594880. https://doi.org/10.3389/fnins.2020.594880
Shah, A. J., Lampert, R., Goldberg, J., Veledar, E., Bremner, J. D., & Vaccarino, V. (2013). Posttraumatic stress disorder and impaired autonomic modulation in male twins. Biological Psychiatry, 73(11), 1103-1110.
Stampfer, H. G. (1998). The relationship between psychiatric illness and the circadian pattern of heart rate. The Australian and New Zealand Journal of Psychiatry, 32(2), 187-198.
Stampfer, H. G., & Dimmitt, S. B. (2013). Variations in circadian heart rate in psychiatric disorders: Theoretical and practical implications. ChronoPhysiology and Therapy, 3, 41-50.
Stauss, H. M. (2003). Heart rate variability. American Journal of Physiology-Regulatory, Integrative and Comparative Physiology, 285(5), R927-R931.
Tarvainen, M. P., & Niskanen, J.-P. (2020). Kubios HRV version 3.4 user's guide. Kubios Oy.
Task Force of the European Society of Cardiology and the North American Society of Pacing and Electrophysiology (1996). Heart rate variability: Standards of measurement, physiological interpretation, and clinical use. Circulation, 93, 1043-1065. PMID: 8598068
Taylor, J. A., Carr, D. L., Myers, C. W., & Eckberg, D. L. (1998). Mechanisms underlying very-low-frequency RR-interval oscillations in humans. Circulation, 98(6), 547-555.
Thayer, J. F., Yamamoto, S. S., & Brosschot, J. F. (2010). The relationship of autonomic imbalance, heart rate variability and cardiovascular disease risk factors. International Journal of Cardiology, 141(2), 122-131.
Theorell, T., Liljeholm-Johansson, Y., Björk, H., & Ericson, M. (2007). Saliva testosterone and heart rate variability in the professional symphony orchestra after "public faintings" of an orchestra member. Psychoneuroendocrinology, 32, 660-668. https://doi.org/10.1016/j.psyneuen.2007.04.006
Tsuji, H., Larson, M. G., Venditti, F. J., Jr., Manders, E. S., Evans, J. C., Feldman, C. L., & Levy, D. (1996). Impact of reduced heart rate variability on risk for cardiac events: The Framingham Heart Study. Circulation, 94(11), 2850-2855.
Tsuji, H., Venditti, F. J., Jr., Manders, E. S., Evans, J. C., Larson, M. G., Feldman, C. L., & Levy, D. (1994). Reduced heart rate variability and mortality risk in an elderly cohort: The Framingham Heart Study. Circulation, 90(2), 878-883.
Return to Top