
Respiration Assessment
What You Will Learn
Breathing assessment is the essential first step before initiating HRV biofeedback, yet it is often underemphasized in clinical training. Dysfunctional breathing patterns can undermine even the most carefully designed training protocol, making early identification critical to your client's success. This chapter equips you with a systematic approach to breathing assessment, from informal observation in the waiting room through comprehensive physiological measurement in the clinic.
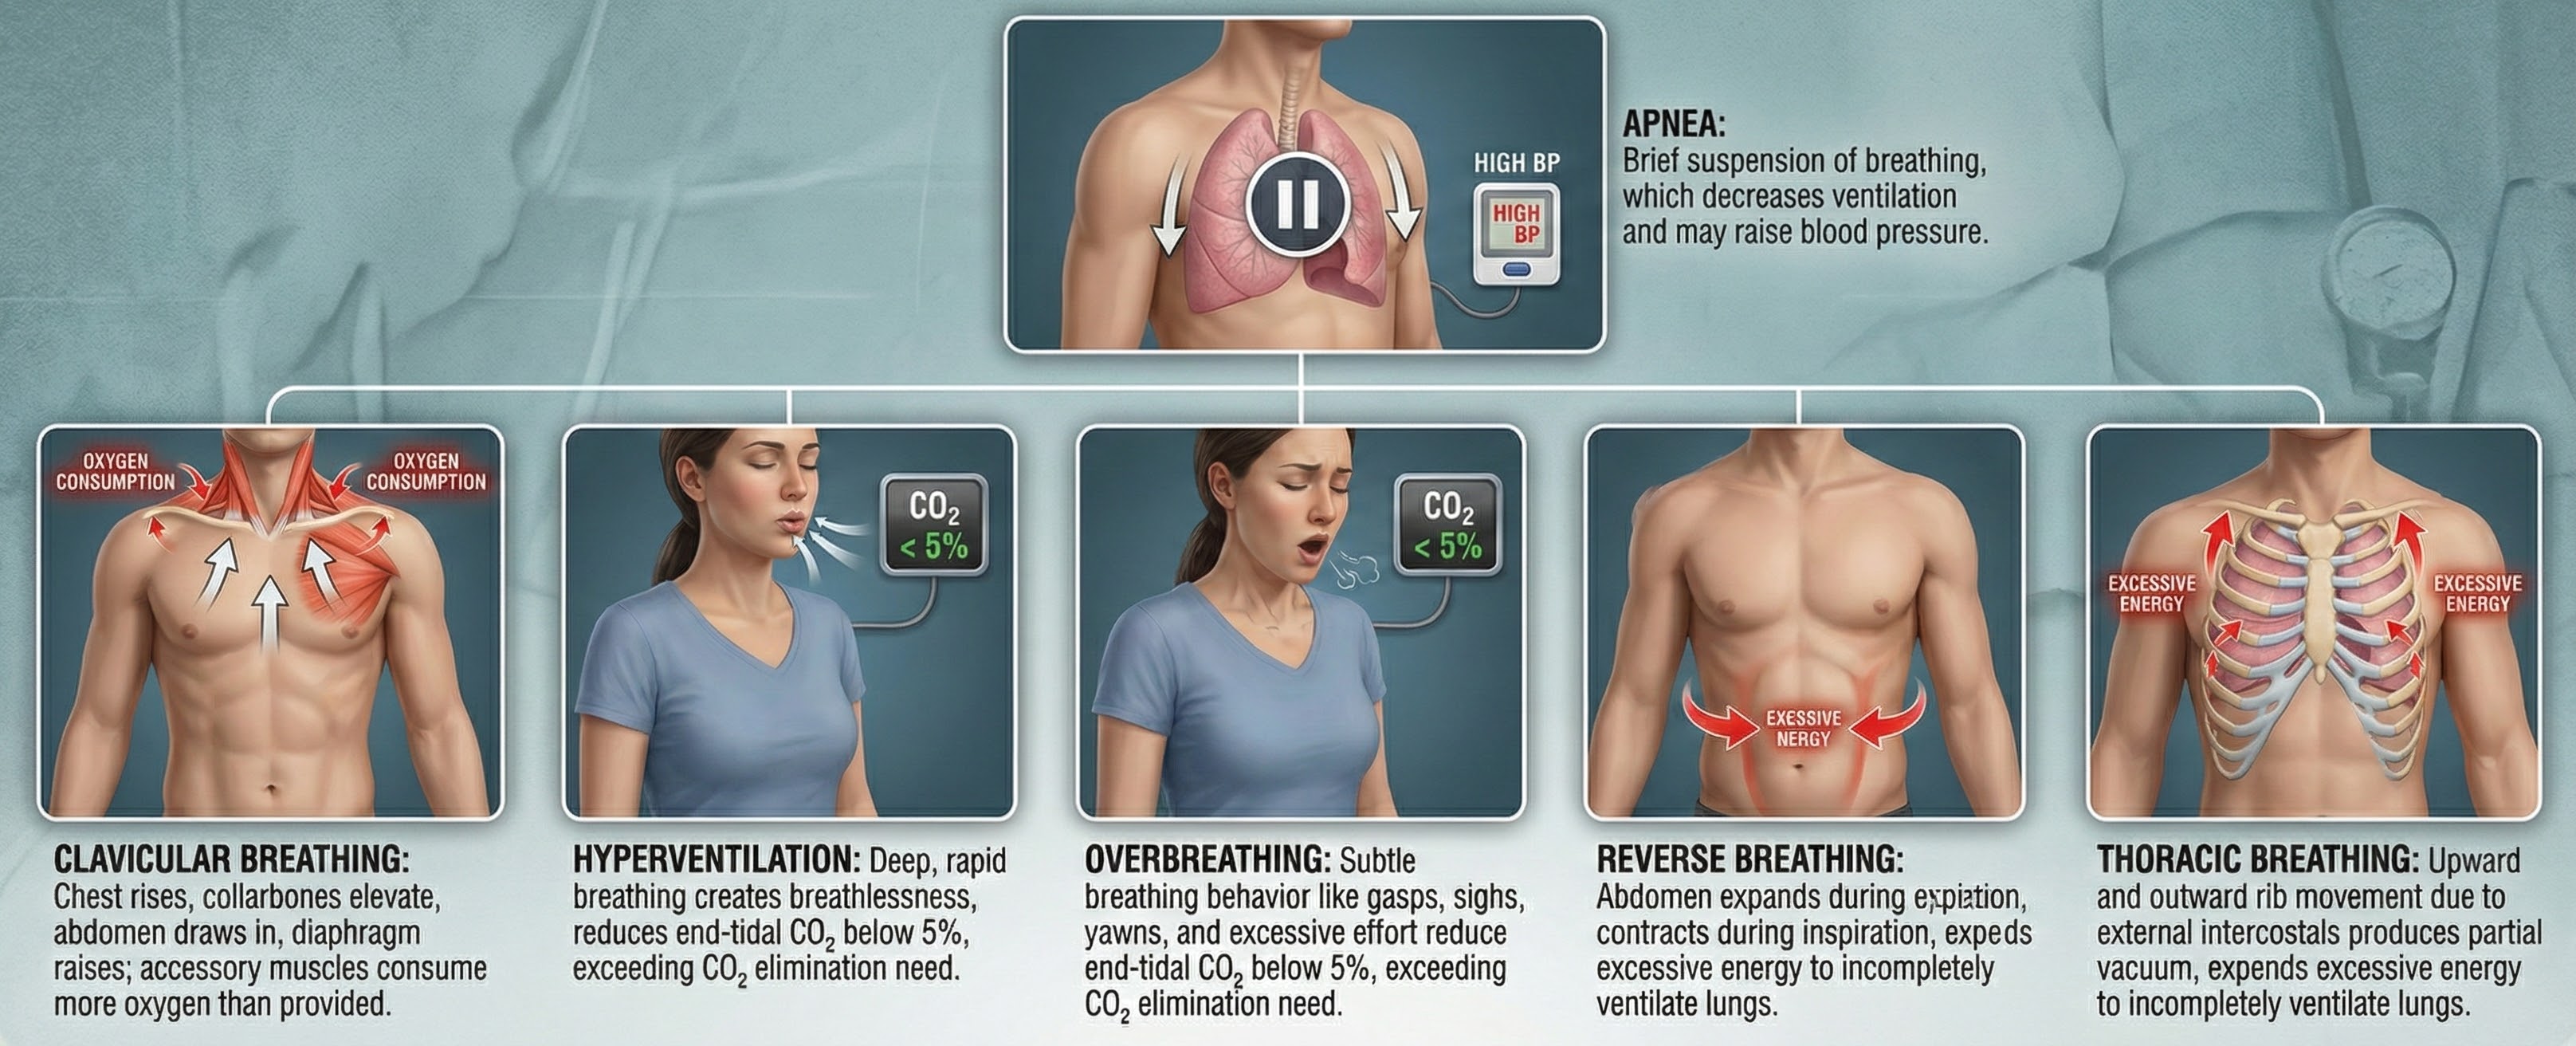
You will learn to identify key dysfunctional breathing patterns, including reverse breathing, clavicular breathing, thoracic dominance, apnea, and overbreathing. You will discover how to use respirometers, pulse oximeters, and capnometers to quantify what you observe. You will also walk through a complete eight-step breathing assessment protocol, explore the clinical significance of end-tidal CO2 measurement, and learn to administer the Nijmegen Questionnaire to screen for hyperventilation syndrome. By the end of this chapter, you will be able to design a thorough breathing evaluation that serves as a roadmap for corrective training.
This section explains why breathing assessment must come first in HRV biofeedback and introduces the core problems you will learn to detect. Breathing assessment should always precede HRV biofeedback because dysfunctional breathing—any pattern that impairs gas exchange, increases physiological strain, or undermines autonomic regulation—can frustrate training success. Think of it this way: if a client is breathing rapidly and shallowly through the chest, asking them to breathe at their resonance frequency is like asking someone to run a marathon in shoes two sizes too small. You need to fix the fundamentals first.
Respiration assessment provides a roadmap for correcting breathing mechanics before initiating HRV biofeedback. Whether you train clients at their resonance frequency (RF)—the breathing rate that maximizes heart rate variability—or at 6 breaths per minute (bpm), measuring their typical breathing rate is crucial. A client's resting respiration rate can alert you to the need for extensive healthy breathing training before initiating RF assessment and HRV biofeedback.
Overbreathing—a mismatch between breathing rate and depth due to excessive respiratory effort—may be the most common breathing problem you will encounter. Its expulsion of CO2 can produce a spectrum of medical and psychological symptoms (Khazan, 2020). Assessment should begin in the waiting room, where you can observe breathing behaviors without the reactivity that instrumentation introduces, and continue in the clinic with objective measurement.

BCIA Blueprint Coverage
This unit addresses V. HRV Biofeedback Strategies: B. How to assess breathing.
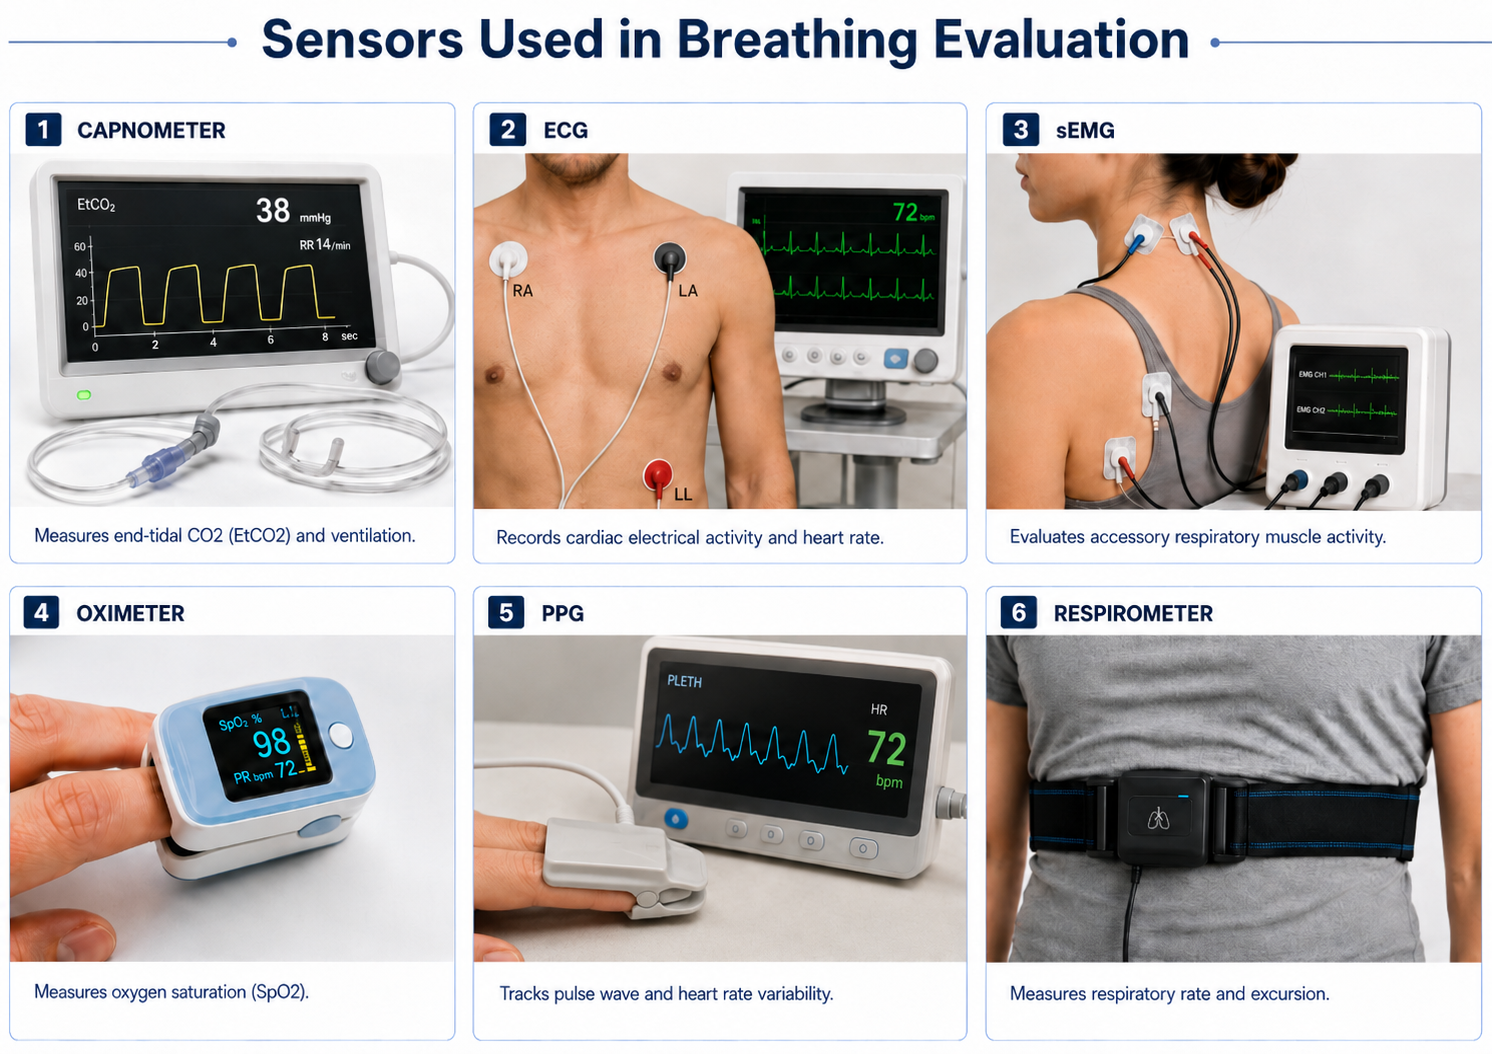
Professionals completing this unit will be able to discuss how to identify dysfunctional breathing behaviors and how to assess patient breathing using a respirometer, oximeter, and capnometer.
This unit covers waiting room assessment, clinic assessment, a detailed assessment protocol, and the Nijmegen Questionnaire.
🎧 Listen to the Full Chapter Lecture
Waiting Room Assessment: Observation Before Measurement
This section covers how to leverage the waiting room as a low-reactivity observation window and how to train staff to collect preliminary breathing data. The waiting room is an ideal setting for observing breathing behaviors before your instruments change them. A client's respiration rate may increase more than 5 bpm simply from the act of attaching breathing sensors (Peper et al., 2008). If your first measurement is in the clinic with sensors in place, you may be recording an artificially elevated rate from the start.

Reception staff should covertly observe respiration rate—the number of complete breath cycles per minute—along with thoracic breathing, shoulder movement, gasping, sighing, yawning, and breath-holding. A brief training session with your receptionist on what to watch for can turn routine check-in time into valuable clinical data. Imagine your receptionist noting: "Client was sighing frequently and breathing visibly through the chest while waiting." That single observation can shape your entire assessment strategy.

The waiting room provides an opportunity to observe breathing behaviors before sensors alter the client's natural patterns. Respiration rate can increase more than 5 bpm from sensor attachment alone. Train reception staff to covertly observe respiration rate, thoracic breathing, shoulder movement, gasping, sighing, yawning, and breath-holding. These informal observations create a valuable baseline that complements formal clinical measurement.
Clinic Assessment: A Systematic Approach
This section walks you through a structured clinic evaluation, covering each component of a comprehensive breathing assessment. Once your client moves from the waiting room to the clinic, a systematic approach reveals the full picture of their breathing mechanics. The following steps guide you from external observation—clothing, posture, and visible breathing patterns—through instrumental measurement using respirometers, SEMG, pulse oximeters, and capnometers.
Check for Restrictive Clothing
Watch for restrictive clothing that could interfere with abdominal expansion and the downward movement of the diaphragm—the dome-shaped muscle whose contraction enlarges the vertical diameter of the chest cavity and accounts for about 75% of air movement into the lungs during relaxed breathing. Tight waistbands, belts cinched snugly, and form-fitting garments can physically prevent the abdomen from expanding during inhalation. When this happens, the client compensates by breathing through the chest, driving up respiration rate and lowering HRV. Shaffer, Mayhew, Bergman, Dougherty, and Irwin (1999) demonstrated that even designer jeans can measurably increase breathing effort.

Check for Restrictive Posture
Look for a posture that restricts the abdomen. A client who is hunched forward or slouched compresses the abdominal cavity, limiting the diaphragm's range of motion—a problem known as reduced diaphragmatic excursion. Both restrictive clothing and poor ergonomics can increase respiration rate beyond a client's resonance frequency, lowering HRV. These are simple, correctable factors that you can address before any biofeedback training begins.

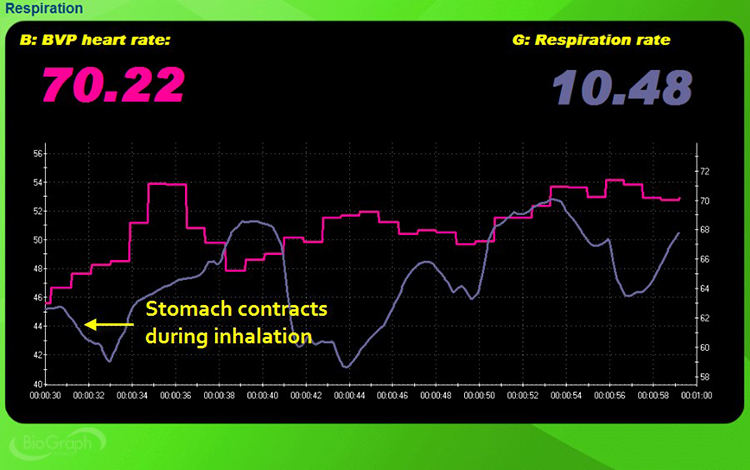
Check for Reverse Breathing
Check for reverse breathing, in which the abdomen contracts during inhalation and expands during exhalation—the opposite of healthy diaphragmatic breathing. In normal breathing, the diaphragm descends during inhalation, pushing the abdomen outward; in reverse breathing, the client pulls the abdomen inward, forcing the diaphragm upward and reducing lung volume. This pattern often results in rapid, shallow breathing at rates that exceed the resonance frequency.
In the screen capture below, the pink tracing shows instantaneous heart rate (HR), and the violet tracing shows respirometer expansion and contraction. Notice how the respirometer tracing falls where it should rise, confirming the reversed pattern.
Check for Clavicular Breathing
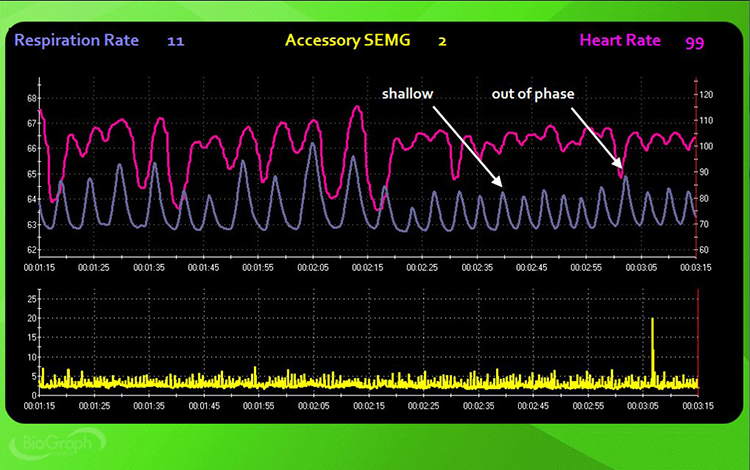
Check for clavicular breathing, a pattern in which the shoulders rise and fall with each breath cycle. Clavicular breathing primarily relies on the external intercostals and the accessory muscles—the sternocleidomastoid, pectoralis minor, scalene, and trapezius—to inflate the lungs. Because each breath is shallow, the client compensates with a rapid rate, consuming excessive energy while incompletely ventilating the lungs. In the screen capture below, the pink tracing shows accessory muscle SEMG, and the violet tracing shows respirometer expansion and contraction.
Check Whether Breathing Is Thoracic or Abdominal
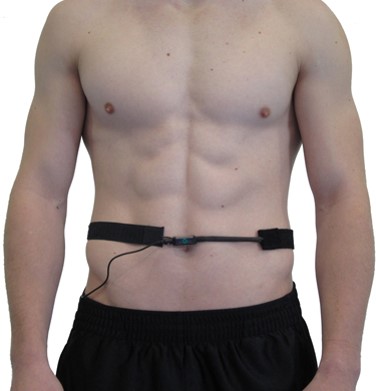
Check whether breathing is primarily thoracic or abdominal, using covert observation and a respirometer—a sensor that changes resistance to a current as it expands and contracts during the respiratory cycle. By placing the respirometer around the abdomen, you obtain objective data about how much the abdomen moves during breathing, which tells you whether the client is using the diaphragm effectively.
Thoracic breathing—a pattern relying primarily on the external intercostals rather than the diaphragm—can speed respiration above your client's resonance frequency. In the screen capture below, the pink tracing shows instantaneous HR and the violet tracing shows respirometer expansion and contraction. Notice the shallow, disorganized waveforms.
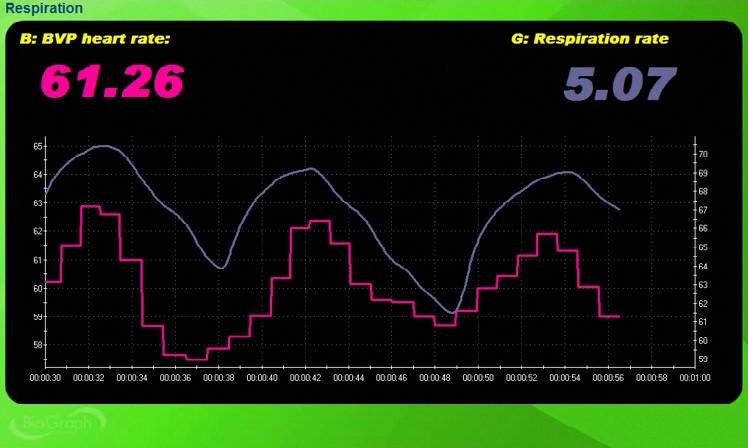
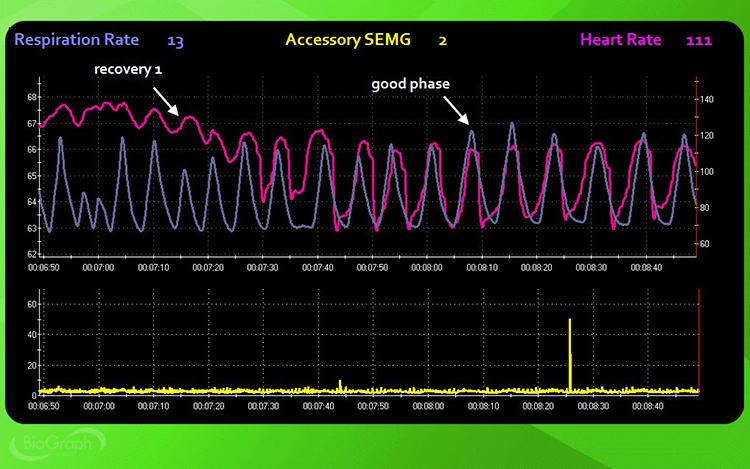
Compare this with the screen capture below, which illustrates abdominal breathing at 5.07 bpm. Both waveforms are sinusoidal with high amplitude and in-phase—their peaks and valleys coincide. This in-phase relationship, where HR accelerates during inhalation and decelerates during exhalation, reflects healthy respiratory sinus arrhythmia (RSA). This is the pattern you are working toward in training.
Check for Apnea
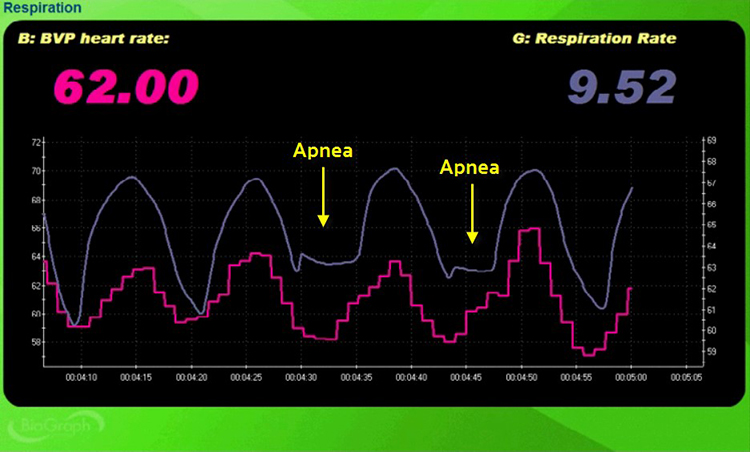
Check for apnea—the suspension of breathing. Apnea disrupts the rhythmic quality of abdominal breathing and can raise blood pressure. Even brief episodes of breath-holding break the sinusoidal pattern that healthy breathing produces, interrupting RSA and reducing HRV. In the screen capture below, the pink tracing shows instantaneous HR and the violet tracing shows respirometer expansion and contraction.
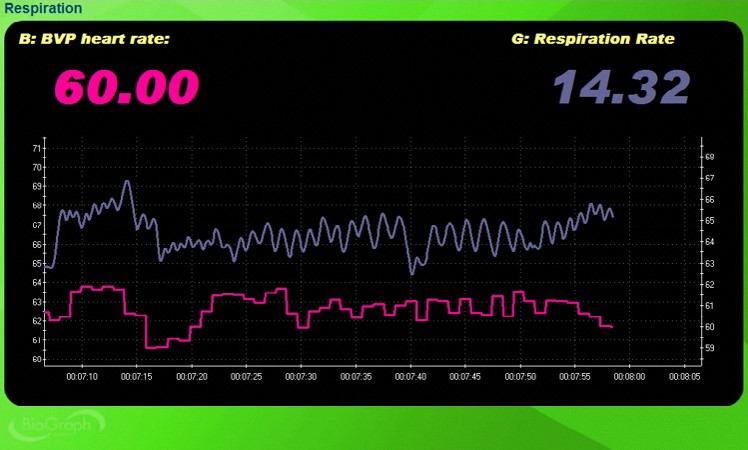
Check Respiration Rate and Amplitude
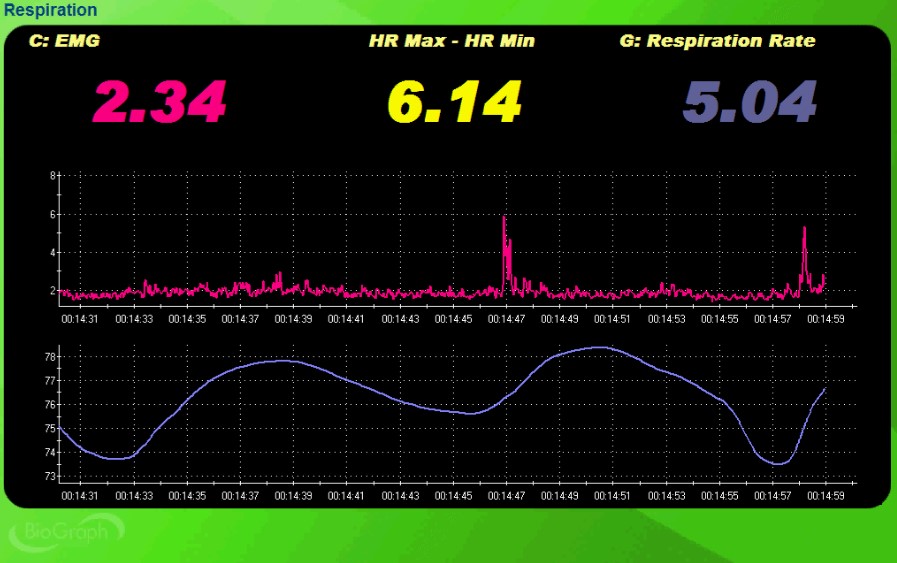
Check respiration rate and respiratory amplitude—the amount of excursion measured by an abdominal strain gauge. Thoracic breathing at rates at or above 16 bpm may be associated with overbreathing or hyperventilation syndrome (HVS), a condition increasingly reconceptualized as behavioral breathlessness. Neblett (2013) cautions that chronic pain patients may breathe faster than 20 bpm, making this population especially important to screen. The BioGraph ® Infiniti display below shows the shallow, rapid breathing that can characterize overbreathing.
Check Breathing Effort
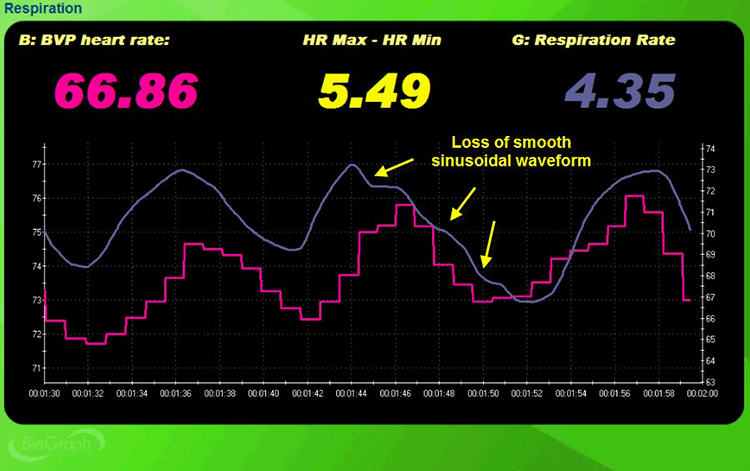
Check breathing effort by monitoring the abdominal tracing for loss of a smooth sinusoidal pattern. When a client works too hard to breathe, the respirometer waveform develops visible inflection points and irregularities rather than the smooth, rolling waves you see during effortless breathing. These inflection points are clinically meaningful because they indicate the client is recruiting unnecessary muscle tension, which increases metabolic cost and reduces breathing efficiency. Shaffer, Bergman, and Dougherty (1998) found that end-tidal CO2 is the best indicator of breathing effort.
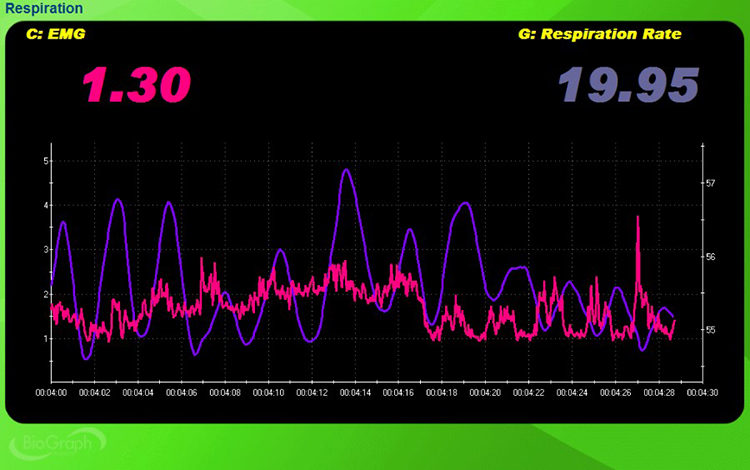
Monitor Accessory and Frontal SEMG
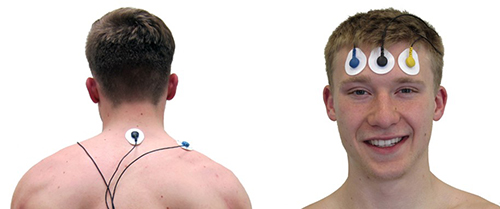
Monitor accessory and frontal SEMG as a second index of breathing effort. When clients recruit accessory muscles—such as the trapezius and scalenes—to breathe, SEMG sensors placed on these muscles will show spikes that coincide with inhalation. In the trapezius-scalene placement, active SEMG electrodes are positioned on the upper trapezius and scalene muscles to directly measure this respiratory effort. Frontal SEMG adds a complementary window into overall tension.
In the screen capture below, accessory SEMG is shown in pink and respirometer movement is shown in violet. The two SEMG spikes over 5 microvolts coincide with the last two inhalations, confirming that this client is recruiting accessory muscles to breathe. When SEMG spikes track consistently with inhalation, you have objective evidence that the client is working harder than necessary to move air.
Check Oxygen Saturation
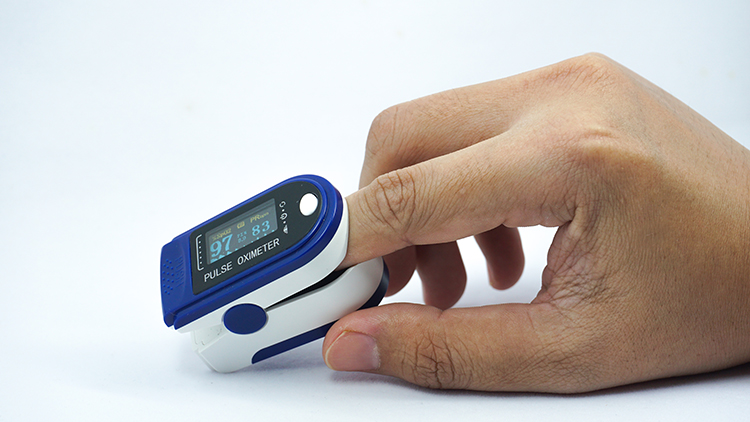
Check oxygen saturation (PO2) using a pulse oximeter—a device that measures dissolved oxygen in the bloodstream using a photoplethysmograph sensor placed against a finger or earlobe. A range of 95%-98% is ideal. Hyperventilation may push saturation to 100% (Gilbert, 2019). If you see a reading of 100% in a client who is breathing rapidly, treat this as a red flag for overbreathing, not a sign of excellent health.
Check End-Tidal CO2
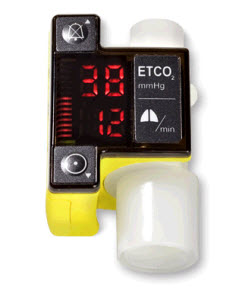
Check end-tidal CO2—the percentage of carbon dioxide in exhaled air at the end of exhalation—using a capnometer, an instrument that monitors CO2 concentration by measuring the absorption of infrared light. End-tidal CO2 is measured in torr—a unit of atmospheric pressure named after Torricelli that equals 1 millimeter of mercury (mmHg). A healthy range is 35-45 torr, while values below 33 torr are seen in hyperventilation syndrome and overbreathing.
Khazan (2020) provides a severity scale: values below 25 mmHg signal severe overbreathing, 25-30 mmHg indicate moderate-to-severe overbreathing, and 30-35 mmHg indicate mild-to-moderate overbreathing. End-tidal CO2 is particularly valuable because a client can appear to be breathing normally—with a reasonable rate and no visible distress—while still chronically overbreathing at a level that produces symptoms. This makes capnometry the single most diagnostic measurement in your assessment toolbox for detecting covert overbreathing.
Clinic assessment involves a systematic evaluation spanning eleven components: restrictive clothing, restrictive posture, reverse breathing, clavicular breathing, thoracic versus abdominal breathing, apnea, respiration rate and amplitude, breathing effort, accessory muscle SEMG, oxygen saturation via pulse oximetry, and end-tidal CO2 via capnometry. Thoracic breathing at 16 bpm or above may indicate overbreathing, and chronic pain patients may breathe faster than 20 bpm. Oxygen saturation of 100% in a rapid breather signals hyperventilation. End-tidal CO2 below 33 torr suggests HVS, and values below 25 mmHg signal severe overbreathing.
Comprehension Questions: Assessment Foundations
- Why should breathing assessment precede HRV biofeedback training, and what specific problems can arise if this step is skipped?
- Name at least three dysfunctional breathing patterns that clinic assessment should identify, and explain how each can interfere with HRV biofeedback training.
- How does end-tidal CO2 monitoring complement visual observation and respirometry in assessing overbreathing? Why might a client appear to breathe normally yet still be chronically overbreathing?
- What is the clinical significance of oxygen saturation reaching 100% in a client who is breathing rapidly?
Breathing Assessment Protocol: An Eight-Step Evaluation
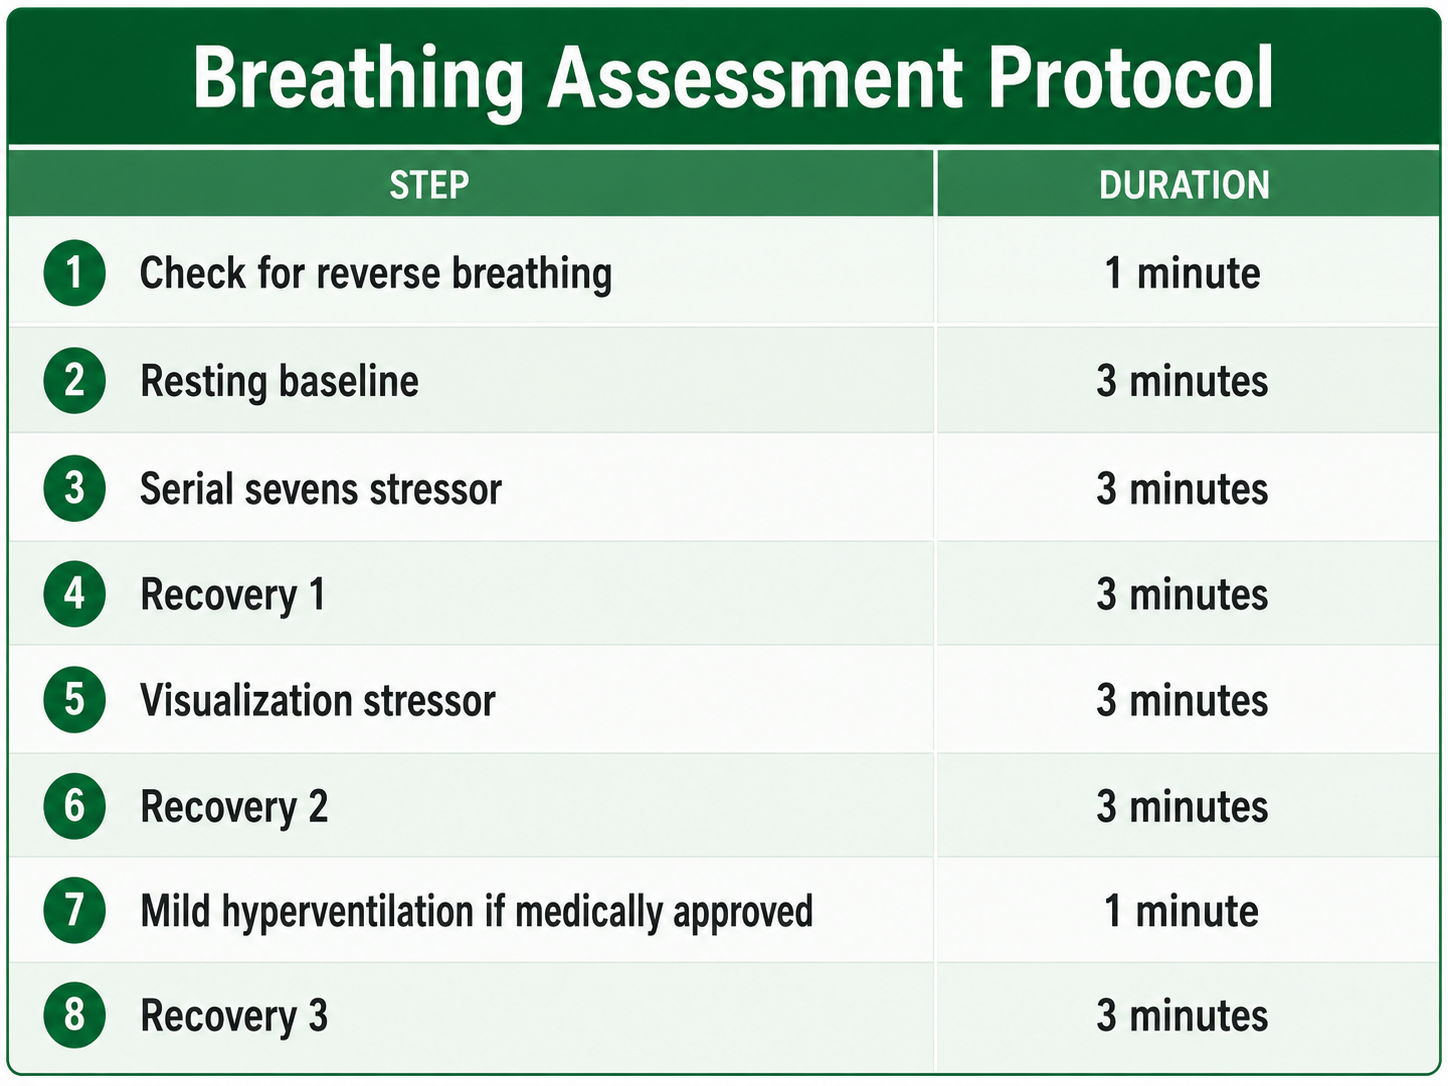
This section presents a standardized eight-step protocol for evaluating your client's breathing across baseline, stress, recovery, and challenge conditions. The protocol requires an ECG or PPG sensor to monitor HRV, a respirometer to measure abdominal excursion and respiration rate, and a SEMG sensor to evaluate accessory muscle activity. A capnometer to measure end-tidal CO2 and an oximeter to measure PO2 are optional but strongly recommended, as they reveal breathing chemistry that observation and respirometry alone can miss.
Each step includes specific instructions to give the client and key observations for the clinician. All steps use a no-feedback condition so that you capture the client's natural breathing response, uninfluenced by real-time data. The progression from baseline through stressors and recovery periods lets you compare how your client breathes at rest, under cognitive load, under emotional provocation, and during deliberate hyperventilation.
Step 1: Check for Reverse Breathing
Instruct the client: "Take a normal breath, hold it, and then exhale." Wait 30 seconds. Then say: "Take another normal breath and then exhale" (1 minute, no feedback). Watch the screen for evidence of reverse breathing—the respirometer tracing falling during inspiration and rising during expiration—and for accessory muscle overuse indicated by SEMG spikes.
In the screen capture below, the pink tracing shows instantaneous HR and the violet tracing shows respirometer contraction and expansion. The reversed pattern is immediately apparent: the respirometer falls where it should rise.
Step 2: Resting Baseline
Instruct the client: "Breathe normally for the next 3 minutes" (3 minutes, no feedback). Watch the display for abdominal excursion, smooth respiration, breathing effort, respiration rate, synchrony between the respiration and HR tracings, and apnea. Simultaneously observe your client for gasping, shoulder movement, sighing, and yawning—behaviors the instruments will not capture directly.
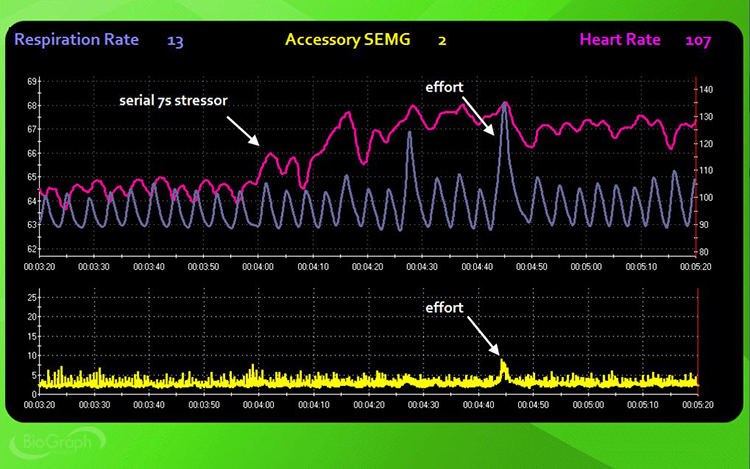
Step 3: Serial-Sevens Stressor
Instruct the client: "Mentally count backward from 1000 by 7s until I stop you and ask for the number you are on" (3 minutes, no feedback). This cognitive stressor tests how mental effort impacts breathing mechanics. Watch the display for the same markers observed during baseline, and compare them to identify stress-induced changes.
Step 4: Recovery 1
Instruct the client: "Stop subtracting and breathe normally for the next 3 minutes" (3 minutes, no feedback). This first recovery trial reveals how quickly your client's breathing mechanics return to baseline after cognitive stress. Watch for the same parameters, paying particular attention to how rapidly respiration rate slows and whether HR-respiration synchrony returns.
Step 5: Visualization Stressor
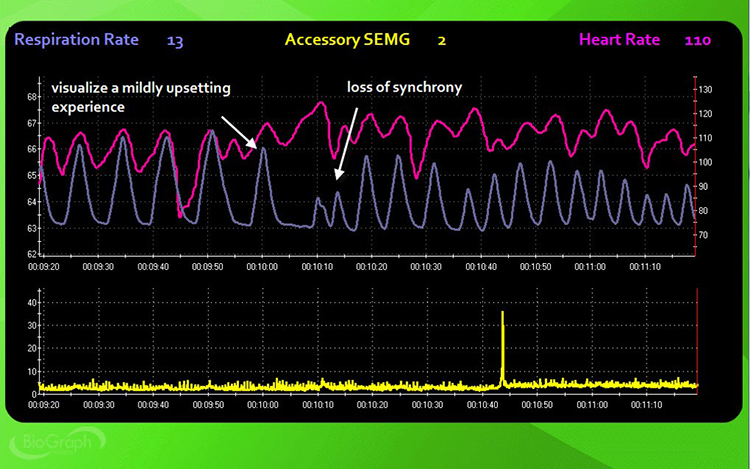
Instruct the client: "Use all of your senses to recreate a mildly upsetting experience vividly. Raise a finger when you are re-experiencing the event and continue for the next 3 minutes" (3 minutes, no feedback). The visualization stressor tests how emotional arousal—as distinct from cognitive load—impacts breathing. For many clients, emotional triggers produce more pronounced breathing disruption than arithmetic tasks.
Dr. Khazan recommends playing video of a performance error when assessing athletes, musicians, or special forces operators.
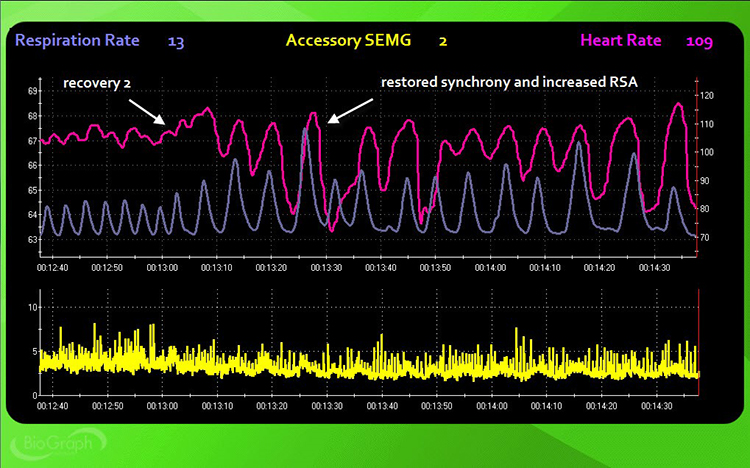
Step 6: Recovery 2
Instruct the client: "Stop your visualization and breathe normally for the next 3 minutes" (3 minutes, no feedback). Compare this recovery to Recovery 1 to determine whether emotional stressors leave a longer physiological footprint than cognitive stressors. Watch for the same parameters: abdominal excursion, smooth respiration, breathing effort, respiration rate, HR-respiration synchrony, and apnea.
Step 7: Hyperventilation Challenge
Instruct the client: "Breathe rapidly for one minute or until you are uncomfortable" (1 minute, no feedback). Watch your client closely for signs of distress and stop immediately if they experience dizziness, pain, or panic. This challenge deliberately provokes overbreathing to test how your client's respiratory chemistry responds under extreme conditions. Common symptoms of hyperventilation include feelings of anxiety, breathlessness, dizziness, lightheadedness, rapid heartbeat, and tingling (Lehrer et al., 2013).
Monitor respiration rate, end-tidal CO2, and oxygen saturation throughout. The value of this step lies not just in documenting the immediate response, but in setting up the recovery trial that follows—where you learn how quickly (or slowly) your client's breathing chemistry normalizes.
Step 8: Recovery 3
Instruct the client: "Stop breathing rapidly and breathe normally for the next 3 minutes" (3 minutes, no feedback). Monitor respiration rate, end-tidal CO2, and oxygen saturation. This final recovery trial reveals how quickly your client's breathing chemistry normalizes after a direct respiratory challenge, providing insight into their overall respiratory flexibility and vulnerability.
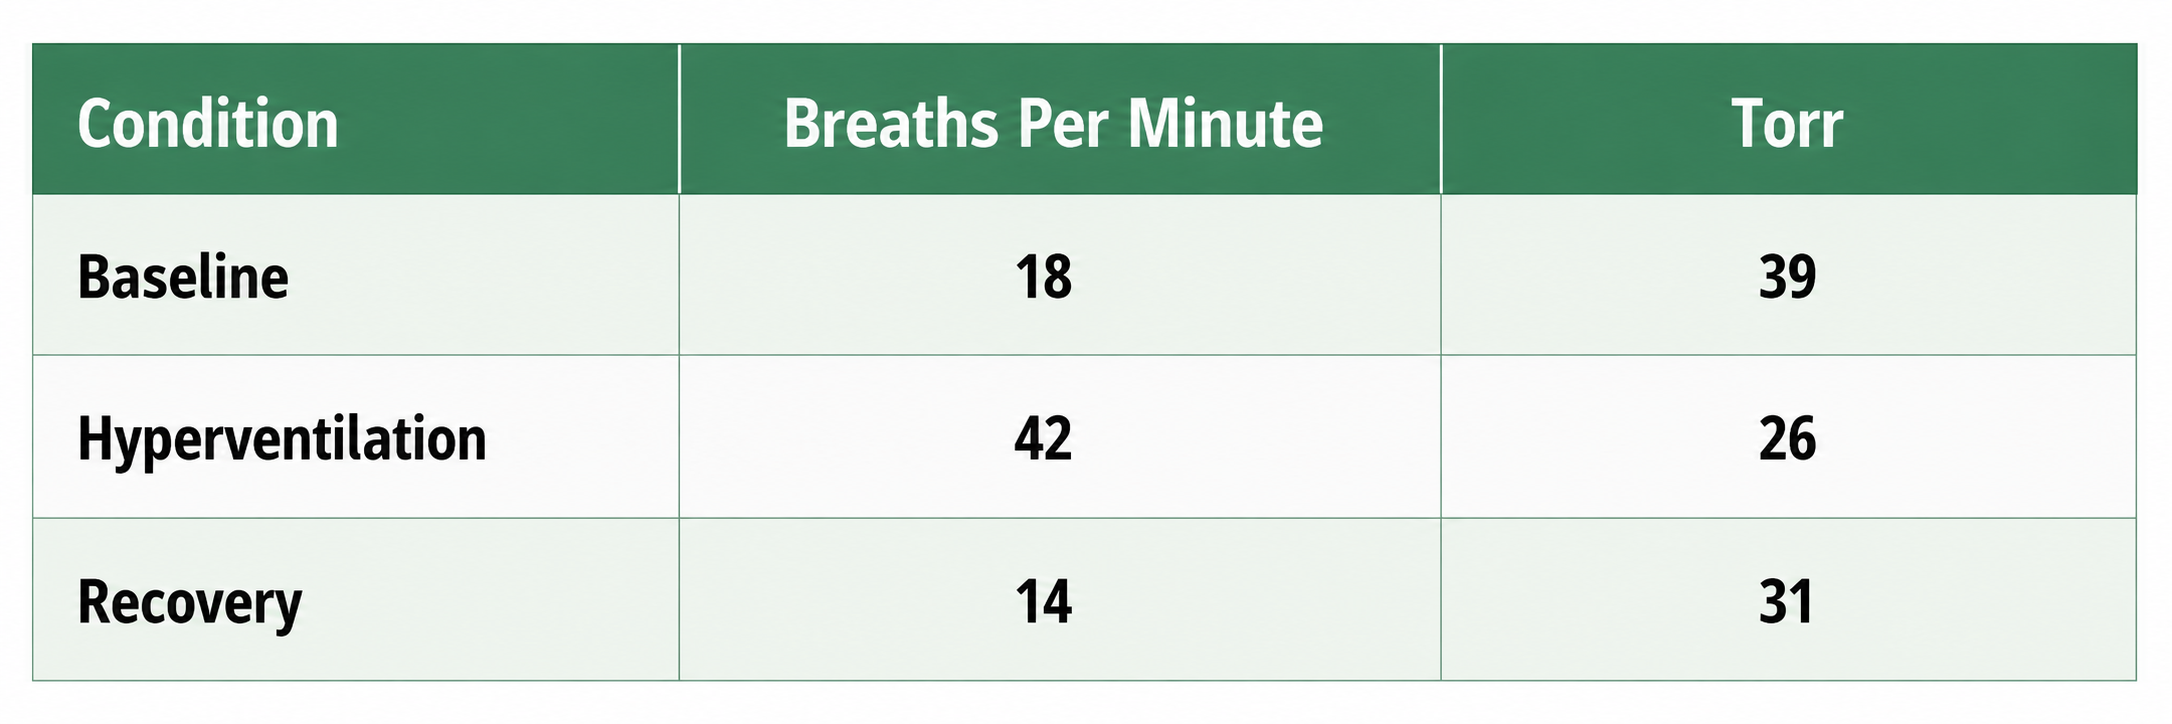
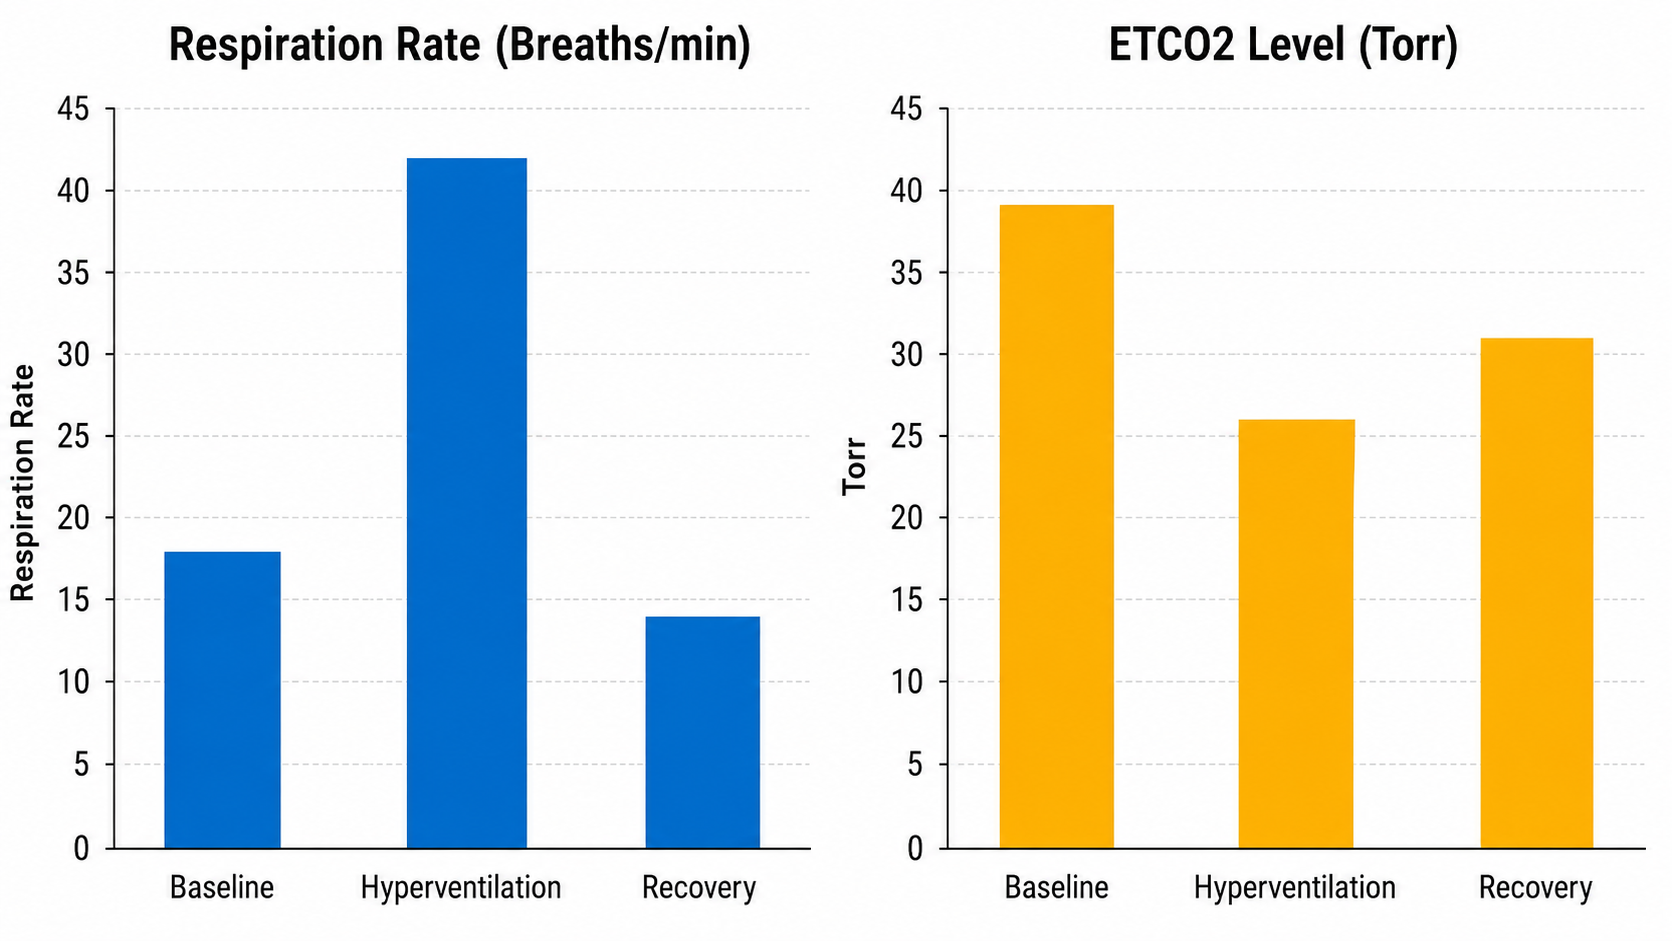
Despite breathing at 18 bpm during baseline, this client's end-tidal CO2 was normal—a reminder that rate alone does not tell the full story. The hyperventilation challenge increased her respiration rate to 42 bpm and resulted in hypocapnia—abnormally low blood CO2—with an end-tidal value of 26 torr. During the recovery trial, her respiration rate decreased below baseline, but her end-tidal CO2 remained below the normal cutoff of 35 torr. This persistent hypocapnia during recovery is clinically significant because it suggests the client's respiratory chemistry does not normalize quickly after stress, a pattern commonly seen in panic-prone individuals.
The eight-step breathing assessment protocol progresses through a reverse-breathing check, resting baseline, serial-sevens cognitive stressor, recovery, visualization stressor, recovery, hyperventilation challenge, and final recovery. Each step uses a no-feedback condition to capture the client's natural breathing response. Key observations include abdominal excursion, respiration rate, breathing effort, HR-respiration synchrony, apnea, gasping, shoulder movement, sighing, and yawning. The hyperventilation challenge reveals respiratory vulnerability and recovery capacity. The protocol requires ECG or PPG for HRV monitoring, a respirometer, and SEMG sensors, with capnometry and pulse oximetry strongly recommended.
Summary of the Breathing Assessment Protocol
This section covers contraindications for the hyperventilation challenge and introduces the Stroop test as an optional addition to the protocol. A mild hyperventilation challenge is contraindicated for clients diagnosed with epilepsy, heart disease, kidney disease, panic disorder, and PTSD. Always screen for these conditions before including Step 7 in your assessment battery, as provoked hyperventilation can trigger seizures, cardiac events, or dissociative episodes in vulnerable populations.
Adding the Stroop Test
Clinicians may add the Stroop test followed by a recovery period. The Stroop test requires participants to name the ink color of printed words while suppressing the automatic tendency to read the word itself, creating cognitive interference that often disrupts breathing patterns. This stressor can reveal breathing disruptions your client may not show during simpler tasks like the serial-sevens.

Khazan (2019) provided a compelling illustration of the Stroop test in breathing assessment. Her client was a 30-year-old woman divorcing her alcoholic husband, who presented with anxiety and diverse symptoms including difficulty focusing, gastrointestinal distress, headaches, lightheadedness, racing heart, and shortness of breath. Notably, end-tidal CO2 remained below the normal range (35-45 mmHg) throughout the entire assessment, confirming chronic overbreathing.
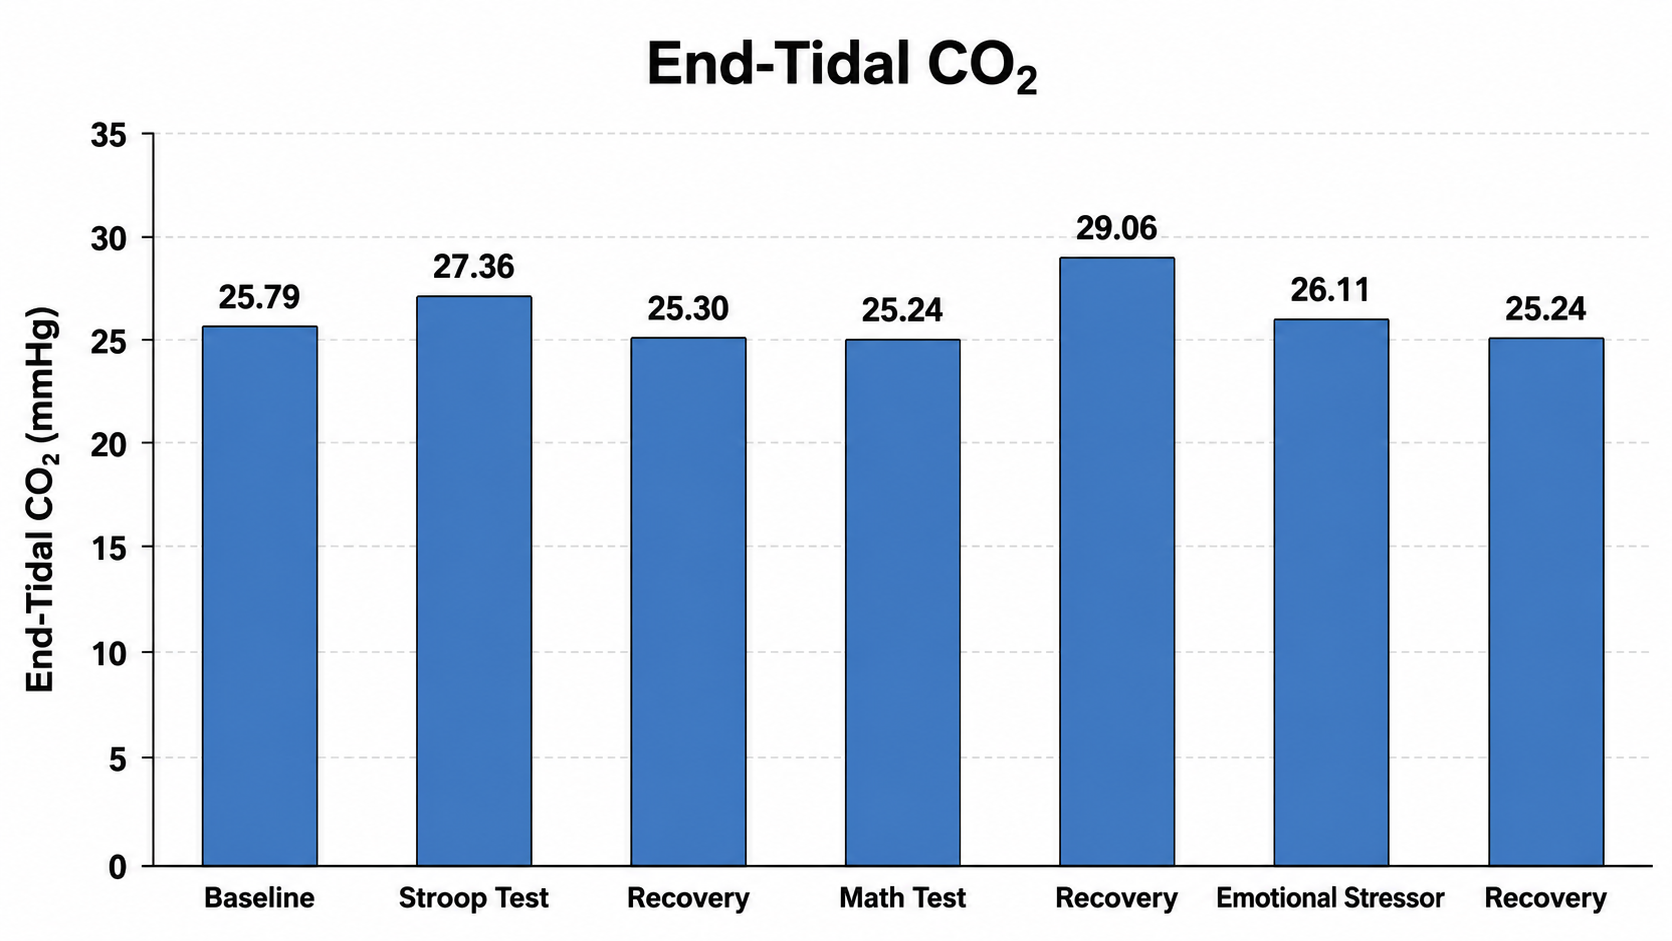
This case illustrates a critical insight: the emotional stressor produced a more pronounced and lasting effect on breathing chemistry than the cognitive stressor. Although the client recovered from the math stressor, end-tidal CO2 further declined following the emotional challenge. For clients presenting with anxiety-related symptoms, the visualization and emotional challenge components of your assessment protocol may be more diagnostically revealing than arithmetic tasks alone.
Comprehension Questions: Breathing Assessment Protocol
- List the eight steps of the breathing assessment protocol in order, and explain why each step contributes uniquely to the overall clinical picture.
- For which client populations is the mild hyperventilation challenge contraindicated, and what alternative assessment strategies might you use instead?
- In the case provided by Dr. Donald Moss (2013), the client's end-tidal CO2 remained below normal during recovery despite her respiration rate decreasing below baseline. What does this suggest about her respiratory physiology?
- How does the Khazan (2019) case study illustrate the differential effects of cognitive versus emotional stressors on breathing chemistry?
The Nijmegen Questionnaire: Screening for Hyperventilation Syndrome
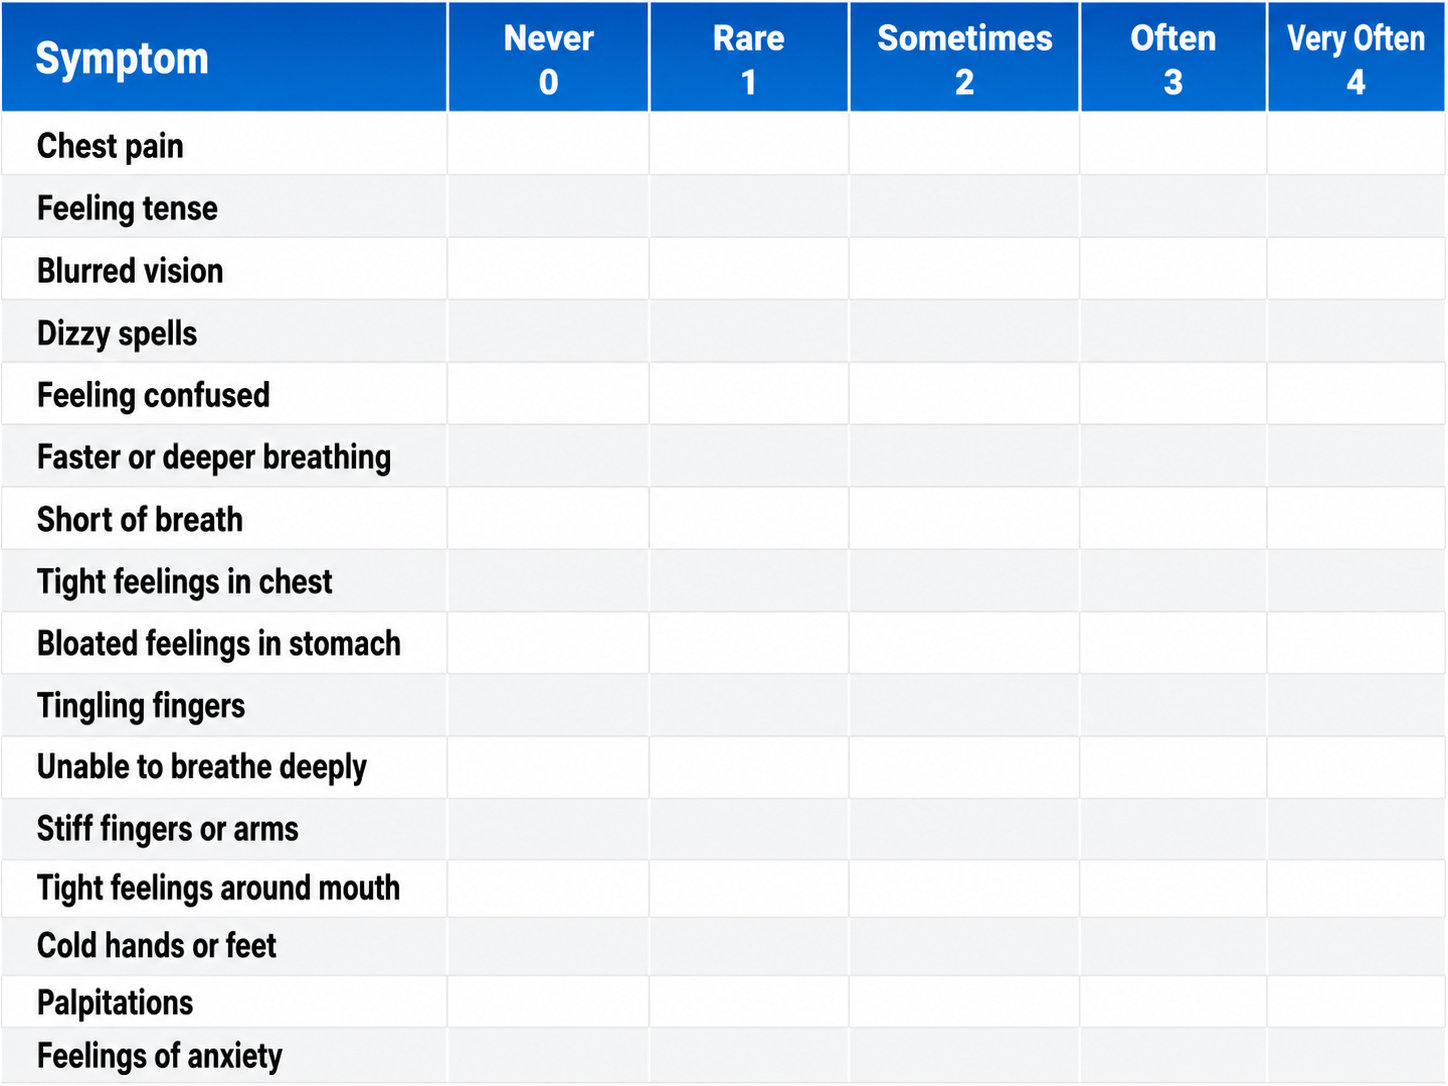
This section covers the Nijmegen Questionnaire, the physiological mechanism linking overbreathing to neurological symptoms, and the impact of medications on respiration rate. The Nijmegen Questionnaire is a 16-item self-report tool that screens for symptoms commonly associated with hyperventilation syndrome. It asks clients to rate the frequency of symptoms including chest pain, tense feelings, blurred vision, dizziness, tingling fingers, confusion, fast or deep breathing, shortness of breath, tight feelings in the chest, bloated abdominal sensation, tingling around the mouth, cold hands or feet, palpitations, and anxiety.
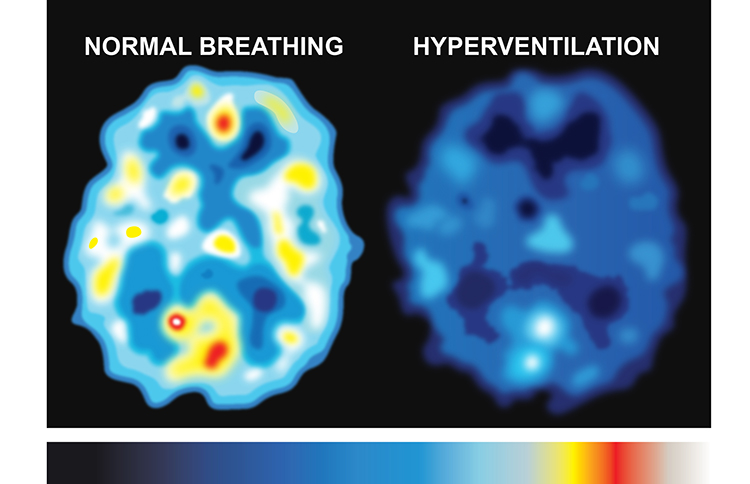
Understanding why overbreathing produces these diverse symptoms requires knowing the underlying vascular mechanism. There are approximately 100,000 miles of blood vessels in the brain, with a flow rate of about 750 milliliters per minute in adults. When overbreathing drives down CO2 levels, the resulting vasoconstriction—narrowing of blood vessels—reduces cerebral blood flow. This reduced perfusion produces the diverse neurological and cognitive symptoms that the Nijmegen Questionnaire is designed to capture.

This SPECT scan, created by Dr. Scott Woods and shared with his permission at Dr. Christopher Gilbert's request, shows the effect of overbreathing on brain metabolism. Darker colors represent reduced metabolism and compromised cortical functioning. Brain hypoperfusion (below normal blood flow) can produce dizziness, tingling, confusion, and chest tightness—precisely the symptoms your client reports and the Nijmegen Questionnaire measures.
A score of 23 out of 64 on the Nijmegen Questionnaire suggests further screening for hyperventilation syndrome. This cutoff makes the questionnaire a useful initial screening tool, though it should always be combined with physiological measurement—particularly capnometry—for diagnostic confirmation. A client may score highly on the questionnaire for reasons other than overbreathing, and conversely, some chronic overbreathers may underreport their symptoms.
Drug Effects on Respiration Rate
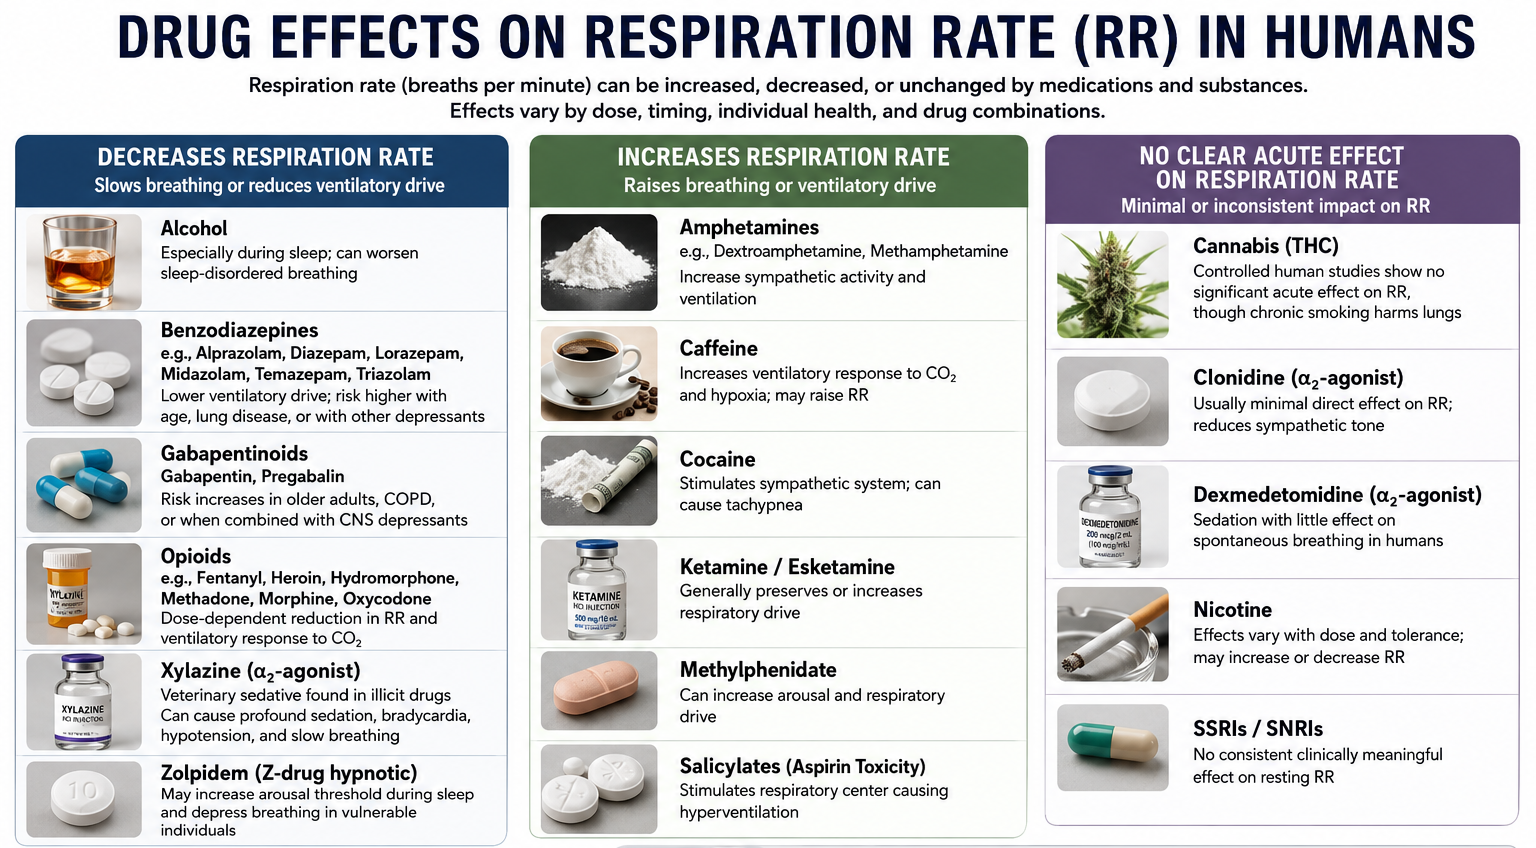
Clinicians must also account for the effects of medications on their client's breathing, as pharmacological influences can either increase or decrease respiration rate. Many clients you will see—particularly in VA, hospital, and pain management settings—take medications that directly alter respiratory drive. Opioids depress respiration, stimulants accelerate it, and anxiolytics may subtly slow breathing rate. Understanding these pharmacological influences helps you interpret assessment data more accurately and set realistic training goals.
The Nijmegen Questionnaire is a 16-item screening tool for hyperventilation syndrome, with a cutoff score of 23 out of 64 suggesting further screening. Overbreathing reduces cerebral blood perfusion by lowering CO2 levels and causing vasoconstriction, producing symptoms like dizziness, tingling, confusion, and chest tightness. The questionnaire should always be combined with physiological measurement, particularly capnometry, for diagnostic confirmation. Clinicians must also account for pharmacological effects on respiration rate when interpreting assessment data and designing training protocols.
Comprehension Questions: Nijmegen Questionnaire and Drug Effects
- What cutoff score on the Nijmegen Questionnaire suggests further screening for hyperventilation syndrome, and why should this tool be combined with physiological measurement?
- Explain the physiological pathway by which overbreathing produces the neurological symptoms captured by the Nijmegen Questionnaire.
- Why is it important for clinicians to know a client's medication list when interpreting breathing assessment data?
Cutting Edge Topics in Respiration Assessment
Capnometry as a Biofeedback Modality
While capnometry has traditionally served as an assessment tool, emerging clinical practice is leveraging real-time end-tidal CO2 feedback as a training modality in its own right. When a client can see their CO2 rising toward the normal range as they slow their breathing, the abstract instruction "breathe more slowly" becomes concrete and measurable. This approach complements traditional HRV biofeedback and may be particularly valuable for clients who continue to overbreathe despite achieving their resonance frequency. For clinicians in performance settings, capnometry feedback also offers a direct physiological target that elite athletes and military personnel often find compelling.
Wearable Respiratory Monitoring
Advances in wearable technology are transforming how clinicians can assess breathing outside the clinic. Chest-worn respiratory monitors, smartphone-connected pulse oximeters, and smartwatch-based respiration tracking are making it possible to capture breathing data during daily activities, sleep, and stress exposure. While these consumer devices lack the precision of clinical-grade instruments, they provide ecological validity—the ability to measure behavior in the settings where it naturally occurs—that lab-based assessment cannot match. Future assessment protocols may integrate multi-day ambulatory respiratory data with traditional in-clinic evaluation, giving clinicians a far more complete picture of their client's breathing habits across contexts.
Behavioral Breathlessness Syndrome
The traditional model of hyperventilation syndrome, in which excessive breathing drives down arterial CO2 and produces symptoms, has been challenged by the finding that many HVS patients have normal arterial CO2 levels during attacks. This has led to the reconceptualization of the condition as behavioral breathlessness syndrome, in which hyperventilation is understood as the consequence rather than the cause of the underlying disorder. This shift has important implications for assessment: clinicians should look beyond CO2 levels alone and consider the full behavioral pattern, including breathing irregularity, sighing frequency, and the relationship between breathing disruption and emotional triggers. For your practice, this means that a normal capnometry reading does not necessarily rule out clinically significant breathing dysfunction.
Assignment
Now that you have completed this module, how might you redesign your breathing assessment protocol? Which measurements might you add? Consider the equipment available in your clinic, the populations you serve, and the specific breathing problems you encounter most frequently. Write a brief reflection (300-500 words) describing your revised protocol, explaining the rationale behind each component you would include.
Glossary
accessory muscles: the sternocleidomastoid, pectoralis minor, scalene, and trapezius muscles, which are used during forceful breathing, as well as during clavicular and thoracic breathing.
apnea: breath suspension.
behavioral breathlessness syndrome: the perspective that hyperventilation is the consequence and not the cause of the disorder. The traditional model that hyperventilation results in reduced arterial CO2 levels has been challenged by the finding that many HVS patients have normal arterial CO2 levels during attacks.
capnometer: an instrument that monitors the carbon dioxide (CO2) concentration in an air sample (end-tidal CO2) by measuring the absorption of infrared light.
clavicular breathing: a breathing pattern that primarily relies on the external intercostals and the accessory muscles to inflate the lungs, resulting in a more rapid respiration rate, excessive energy consumption, and incomplete ventilation of the lungs.
diaphragm: the dome-shaped muscle whose contraction enlarges the vertical diameter of the chest cavity and accounts for about 75% of air movement into the lungs during relaxed breathing.
end-tidal CO2: the percentage of CO2 in exhaled air at the end of exhalation.
hyperventilation syndrome (HVS): a respiratory disorder that has been increasingly reconceptualized as a behavioral breathlessness syndrome in which hyperventilation is the consequence and not the cause of the disorder. The traditional model that hyperventilation results in reduced arterial CO2 levels has been challenged by the finding that many HVS patients have normal arterial CO2 levels during attacks.
overbreathing: a mismatch between breathing rate and depth due to excessive breathing effort; subtle breathing behaviors like sighs and yawns can reduce arterial CO2.
pulse oximeter: a device that measures dissolved oxygen in the bloodstream using a photoplethysmograph sensor placed against a finger or earlobe.
resonance frequency: the breathing rate that maximizes the most time-domain measurements of HRV.
respiratory amplitude: the excursion of an abdominal strain gauge.
respiratory sinus arrhythmia (RSA): HR acceleration during inspiration and deceleration during expiration.
respirometer: a sensor that changes resistance to a current as it expands and contracts during the respiratory cycle.
reverse breathing: the abdomen expands during exhalation and contracts during inhalation, often resulting in incomplete ventilation of the lungs.
thoracic breathing: a breathing pattern that primarily relies on the external intercostals to inflate the lungs, resulting in a more rapid respiration rate, excessive energy consumption, and incomplete ventilation of the lungs.
torr: a unit of atmospheric pressure, named after Torricelli, which equals 1 millimeter of mercury (mmHg) and is used to measure end-tidal CO2.
trapezius-scalene placement: the active SEMG electrodes are located on the upper trapezius and scalene muscles to measure respiratory effort.
References
Fried, R. (1987). The hyperventilation syndrome: Research and clinical treatment. Johns Hopkins University Press.
Gevirtz, R. N. (2005). Heart rate variability biofeedback in clinical practice [Workshop]. AAPB Fall Workshop.
Gilbert, C. (2012). Pulse oximetry and breathing training. Biofeedback, 40(4), 137-141. https://doi.org/10.5298/1081-5937-40.4.04
Gilbert, C. (2019). A guide to monitoring respiration. Biofeedback, 47(1), 6-11. https://doi.org/10.5298/1081-5937-47.1.02
Kern, B. (2014). Hyperventilation syndrome. eMedicine.
Khazan, I. (2020). The myths and misconceptions of heart rate variability [Conference presentation]. Association for Applied Psychophysiology and Biofeedback Virtual Conference.
Khazan, I., & Shaffer, F. (2019). Practical strategies for teaching your clients to breathe [Conference presentation]. Association for Applied Psychophysiology and Biofeedback 50th Annual Meeting, Denver, CO.
Khazan, I. Z. (2013). The clinical handbook of biofeedback: A step-by-step guide for training and practice with mindfulness. John Wiley & Sons, Ltd.
Lehrer, P., Vaschillo, B., Zucker, T., Graves, J., Katsamanis, M., Aviles, M., & Wamboldt, F. (2013). Protocol for heart rate variability biofeedback training. Biofeedback, 41(3), 98-109. https://doi.org/10.5298/1081-5937-41.3.08
Peper, E., Tylova, H., Gibney, K. H., Harvey, R., & Combatalade, D. (2008). Biofeedback mastery: An experiential teaching and self-training manual. AAPB.
Shaffer, F., Bergman, S., & Dougherty, J. (1998). End-tidal CO2 is the best indicator of breathing effort [Abstract]. Applied Psychophysiology and Biofeedback, 23(2).
Shaffer, F., Bergman, S., & Henson, M. (1998). Description of the Truman breathing assessment protocol [Abstract]. Applied Psychophysiology and Biofeedback, 23(2).
Shaffer, F., Bergman, S., & White, K. (1997). Indicators of diaphragmatic breathing effort [Abstract]. Applied Psychophysiology and Biofeedback, 22(2), 145.
Shaffer, F., Mayhew, J., Bergman, S., Dougherty, J., & Irwin, D. (1999). Designer jeans increase breathing effort [Abstract]. Applied Psychophysiology and Biofeedback, 24(2), 124-125.
Shaffer, F., & Moss, D. (2006). Biofeedback. In C.-S. Yuan, E. J. Bieber, & B. A. Bauer (Eds.), Textbook of complementary and alternative medicine (2nd ed.). Informa Healthcare.
Return to Top