Time-Domain Measurements of Heart Rate Variability
What You Will Learn
Your heart does not beat like a metronome. The subtle variations between successive heartbeats carry a wealth of information about autonomic nervous system function, cardiac health, and even mortality risk. In this chapter, you will learn how time-domain indices quantify these beat-to-beat changes and what they reveal about your clients' physiology.
You will master the key metrics that clinicians and researchers rely on, including SDNN, RMSSD, pNN50, and HR Max - HR Min. You will discover why 24-hour SDNN is the "gold standard" for cardiac risk stratification, why RMSSD is the preferred measure of short-term vagally-mediated HRV, and why normative values only apply when clients breathe at average rates. Along the way, you will learn to avoid common myths that can lead to misinterpretation of your clients' data.
Normative HRV values only apply when clients breathe at average rates (Shaffer & Ginsberg, 2017).
BCIA Blueprint Coverage
This unit addresses IV. HRV Measurements: A. Time-domain measurements and their meaning, properties, and correlates.
Professionals completing this unit will be able to discuss the following HRV time-domain indices: SDNN, SDRR, SDANN, pNN50, NN50, HR Max - HR Min, RMSSD, CVRR, HRV-CV, and HRV triangular index.
🎧 Chapter Lecture: Time-Domain Measurements
How Time-Domain Indices Work
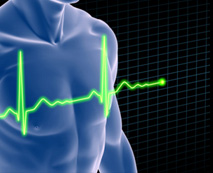
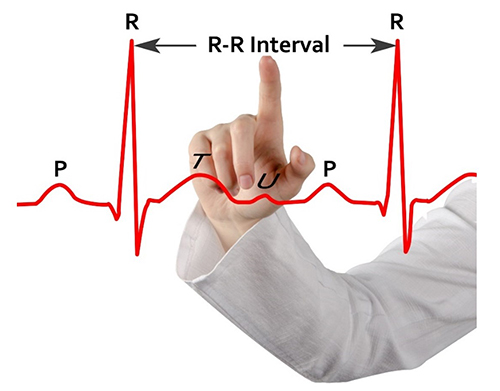
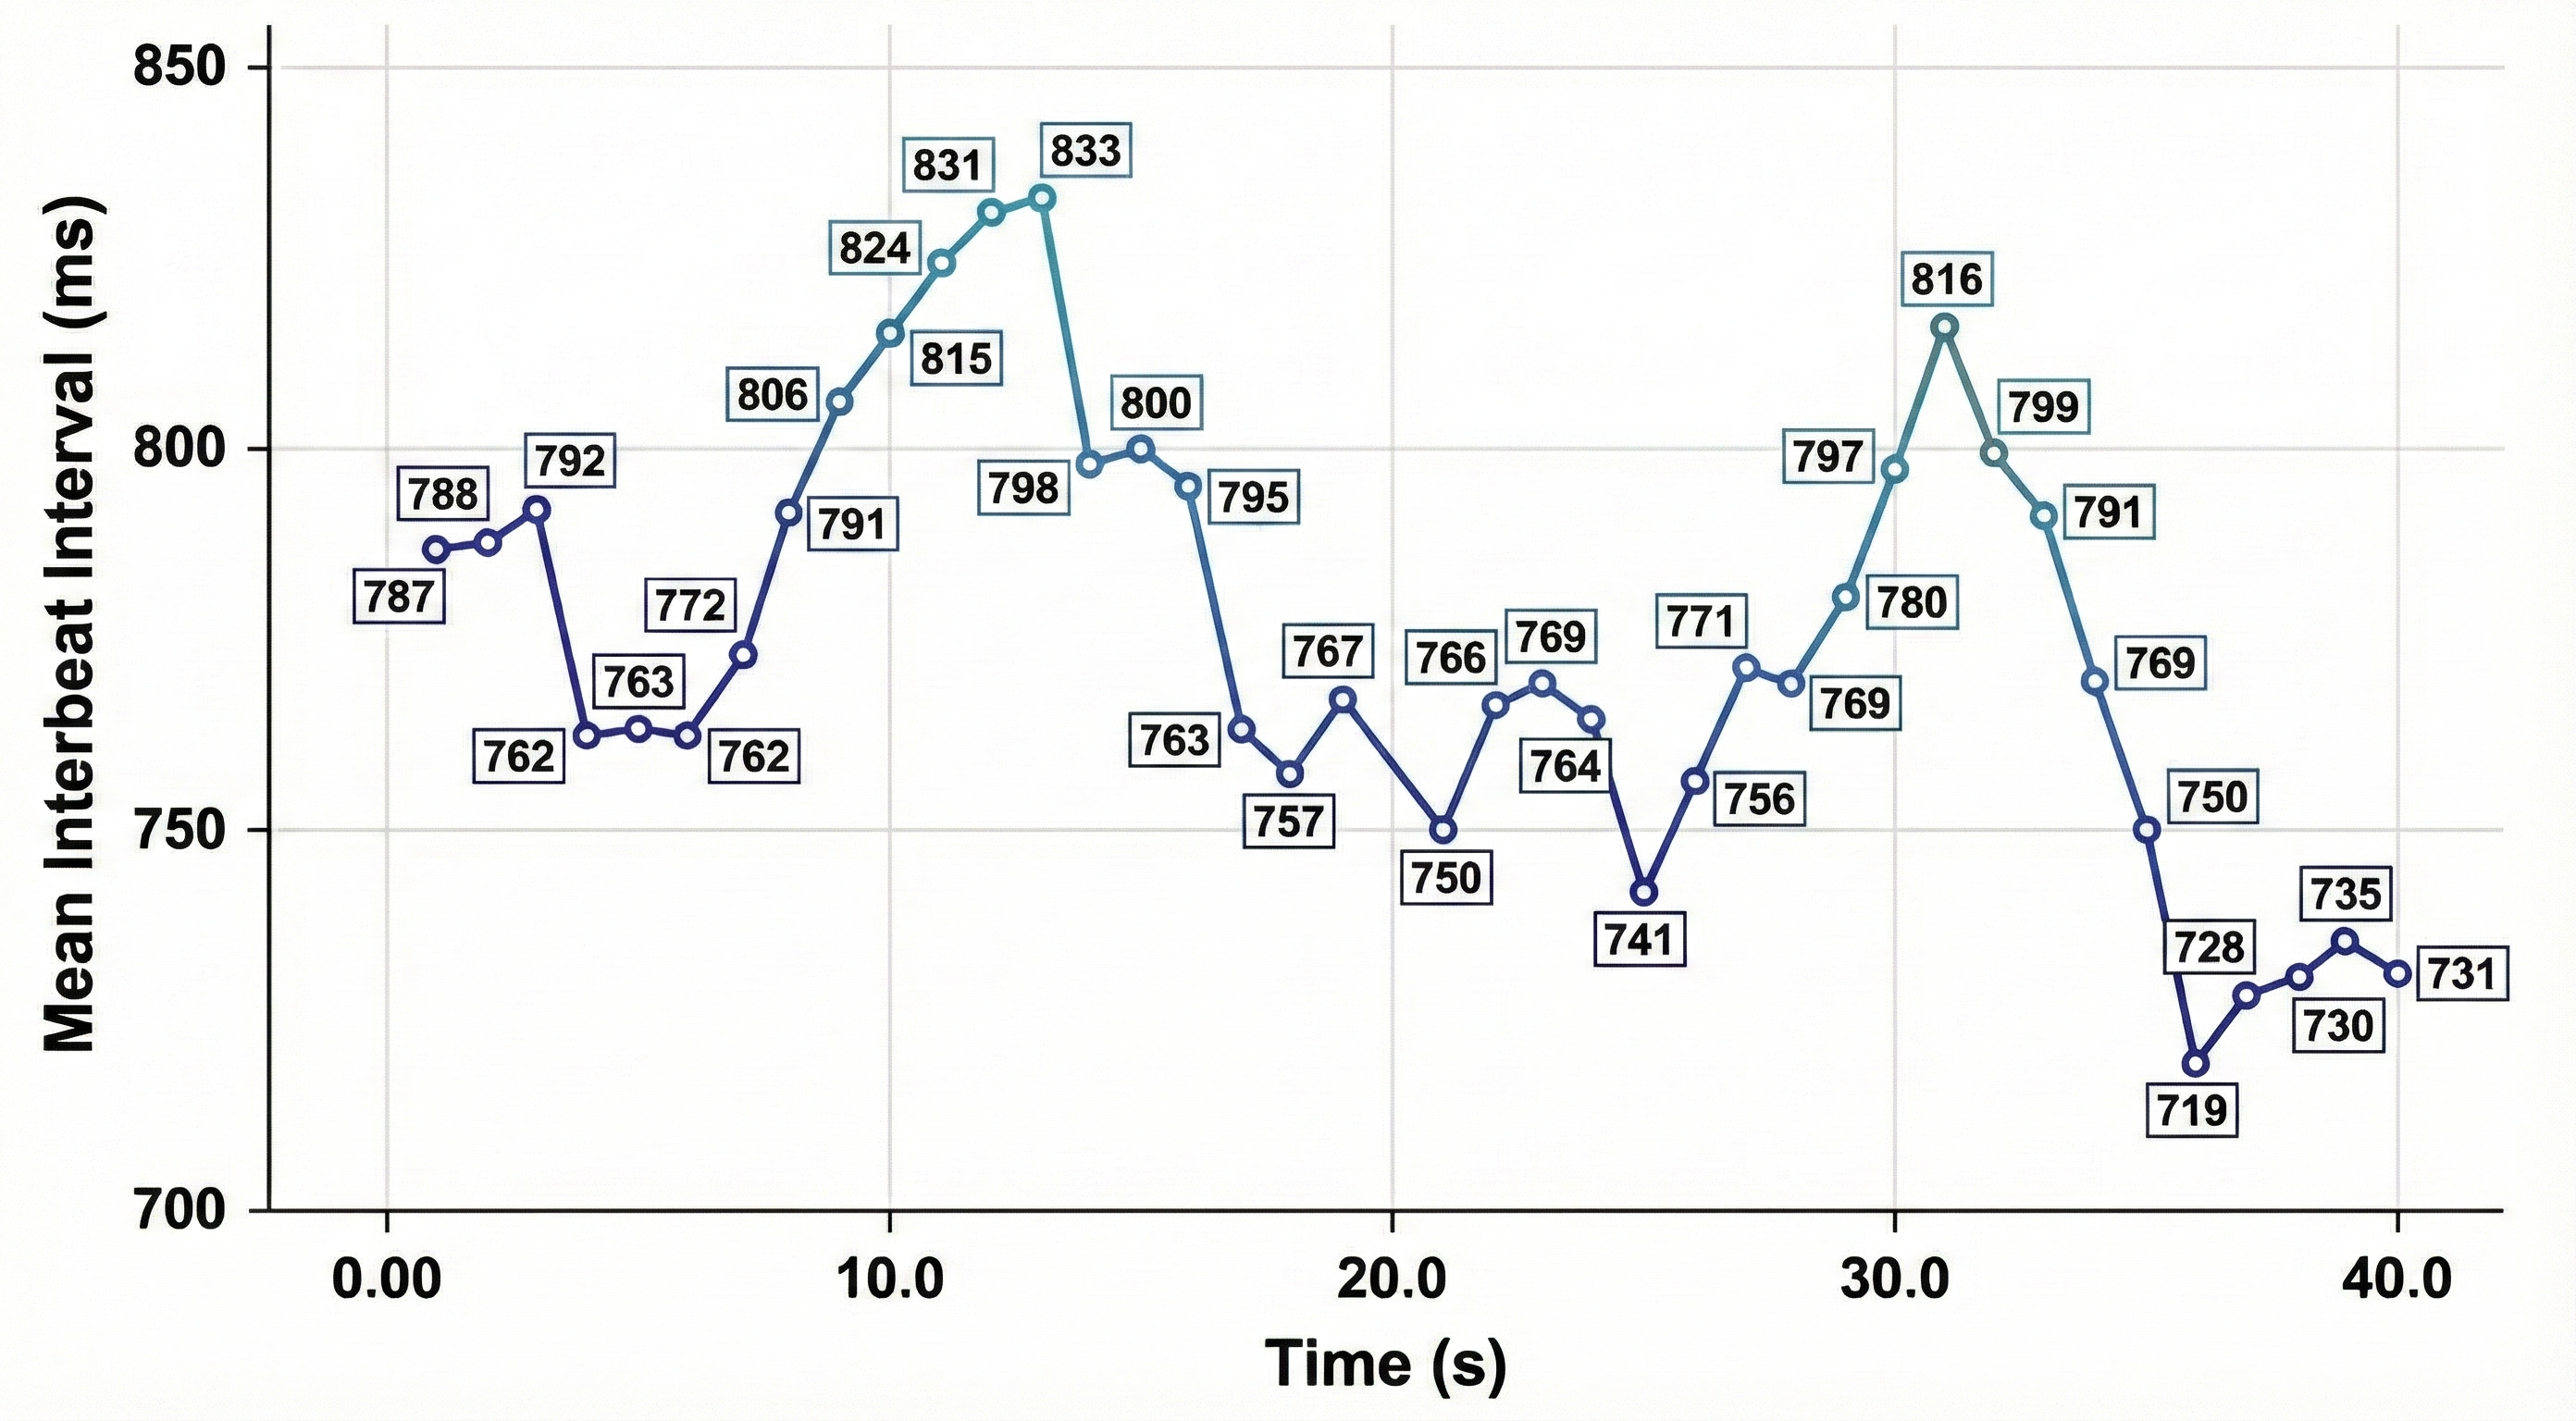
This section introduces the fundamental building block of time-domain HRV: the interbeat interval. Understanding how these intervals are measured and quantified is essential before exploring specific metrics. HRV time-domain indices quantify variability in the interbeat interval (IBI), which is the time between the peaks of successive R-spikes — the initial upward deflections in the QRS complex. Because the IBI is measured from one R-peak to the next, it is also called the R-R interval.
Software detects each heartbeat and measures the time to the next beat in milliseconds (ms). This process begins after the first detected beat and repeats continuously until the end of the epoch, which is the data collection period. The resulting series of IBIs forms the raw dataset from which all time-domain metrics are calculated.
Time-Domain vs. Frequency-Domain: Two Complementary Approaches
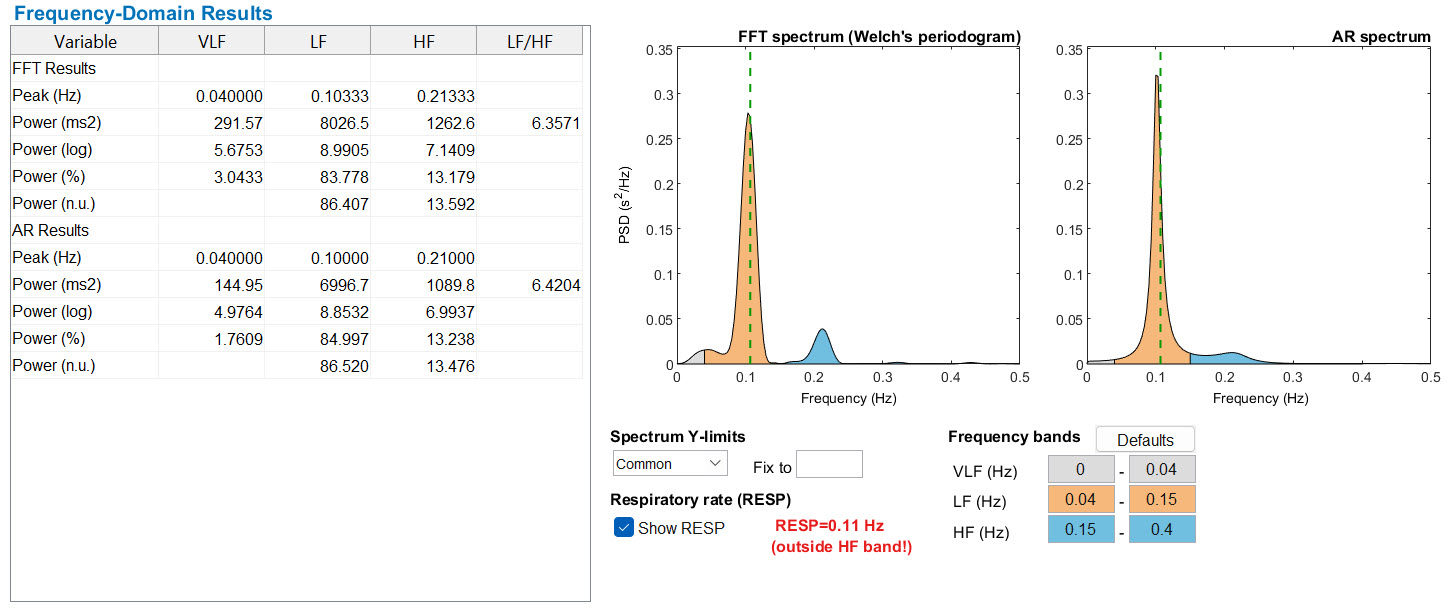
While time-domain indices measure how much interbeat intervals vary, frequency-domain measurements take a different approach: they decompose the heart rate signal into its underlying rhythmic components. Frequency-domain methods calculate the absolute or relative amount of signal energy, called power, in specific frequency bands — ultra-low frequency (ULF), very-low frequency (VLF), low frequency (LF), and high frequency (HF). These two approaches are complementary, and you will encounter correlations between them throughout this chapter.
SDNN: The Standard Deviation of Normal Heartbeat Intervals
This section covers the most widely cited time-domain metric and its role in cardiac risk assessment. The SDNN is the standard deviation of interbeat intervals for normal sinus beats, measured in milliseconds. The word "normal" here is critical: it means that abnormal beats, such as ectopic beats originating outside the sinoatrial node, have been removed through a process called artifacting. A related metric, the SDSD (standard deviation of successive RR interval differences), captures only short-term variability.
SDNN is calculated using data that are free of artifacts and abnormal heartbeats.
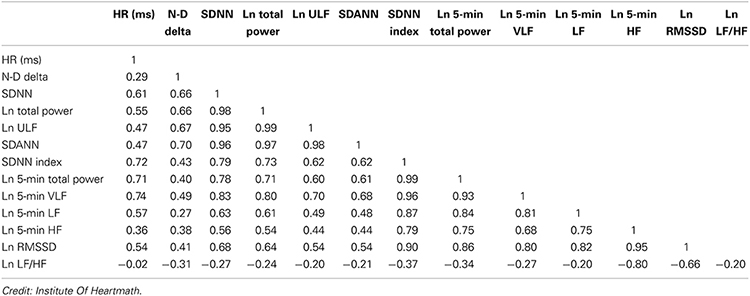
Both the sympathetic nervous system (SNS) and the parasympathetic nervous system (PNS) contribute to SDNN, and the metric is highly correlated with ULF, VLF, and LF band power, as well as total power (Umetani et al., 1998). In short-term resting recordings (≤ 5 minutes), the primary source of variation is parasympathetically-mediated respiratory sinus arrhythmia (RSA) — the natural acceleration and deceleration of heart rate with each breath — especially during slow-paced breathing protocols (Shaffer, McCraty, & Zerr, 2014). In 24-hour recordings, LF band power contributes more substantially to SDNN (Kusela, 2013). This distinction matters in practice: a 5-minute SDNN primarily reflects vagal tone, whereas a 24-hour SDNN captures the full range of autonomic influences.
The following table shows the correlations between time- and frequency-domain measures in 24-hour recordings and is provided courtesy of the Institute of HeartMath (Shaffer, McCraty, & Zerr, 2014).
Why 24-Hour Recording is More Accurate
The SDNN is more accurate when calculated over 24 hours than during the shorter periods typically used in biofeedback sessions. Extended recordings capture the heart's responses to a far wider range of demands, including changing workloads, anticipatory central nervous system activity involving classical conditioning, and circadian processes like sleep-wake cycles (Lehrer, 2012). In clinical terms, a 24-hour recording reveals contributions from the SNS that are largely invisible in a 5-minute sample (Grant et al., 2011).
While the conventional short-term recording standard is 5 minutes, researchers have proposed ultra-short-term (UST) recording periods ranging from 60 seconds (Salahuddin et al., 2007; Shaffer, Meehan, & Zerr, 2020) to 240 seconds (Baek et al., 2015). These abbreviated windows are increasingly relevant as wearable devices enter clinical settings, but they come with trade-offs in reliability that you will encounter later in this chapter.
24-Hour SDNN Predicts Mortality
The SDNN is the "gold standard" for medical stratification of cardiac risk when recorded over 24 hours (Task Force, 1996). Based on 24-hour monitoring, patients with SDNN values below 50 ms are classified as unhealthy, those between 50 and 100 ms have compromised health, and those above 100 ms are classified as healthy. These thresholds have direct implications for how you triage and prioritize your clients. The Task Force (1996) also established canonical normative 24-hour values for healthy adults: SDNN of approximately 141 ± 39 ms, SDANN of approximately 127 ± 35 ms, and HRV triangular index of approximately 37 ± 15. These values provide the reference benchmark against which clinical populations are compared.
A critical practical point is that SDNN is mathematically and physiologically tied to recording length and nonstationarity — the tendency of a signal's statistical properties to shift over time. A 5-minute SDNN and a 24-hour SDNN are not "more or less the same thing"; they are different summaries of different mixtures of biology, including respiratory sinus arrhythmia, baroreflex activity, thermoregulation, circadian effects, and activity patterns. This is why the standards explicitly warn that comparing HRV indices from time series of different lengths is inappropriate (Task Force, 1996).
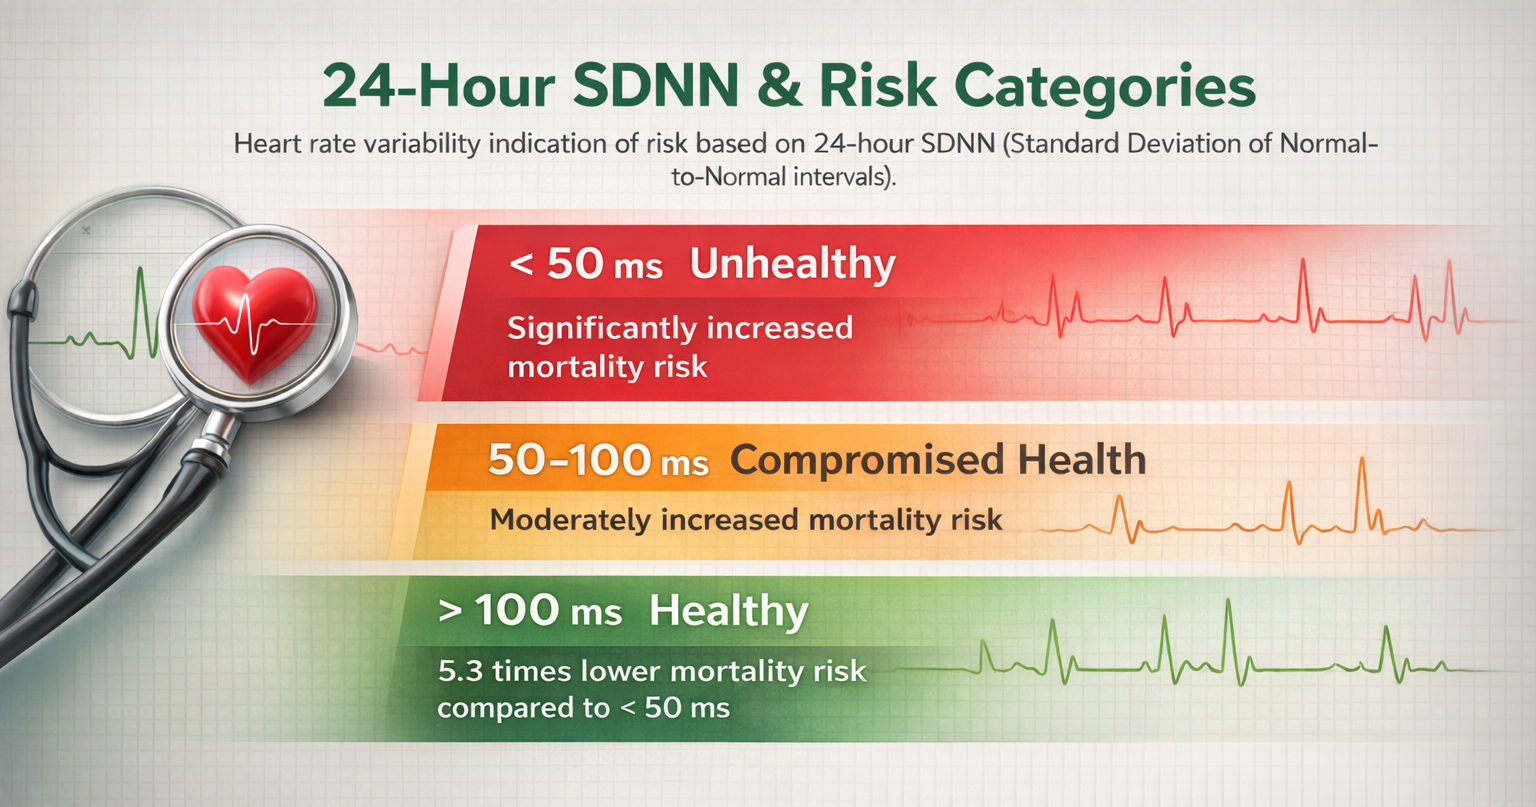
Heart attack survivors whose 24-hour measurements placed them in a higher category had a greater probability of living during a 31-month mean follow-up period. Patients with SDNN values over 100 ms had 5.3 times lower mortality risk at follow-up than those under 50 ms (Kleiger et al., 1987). This landmark finding raises a compelling clinical question: could training patients to increase SDNN to a higher category reduce their mortality risk?
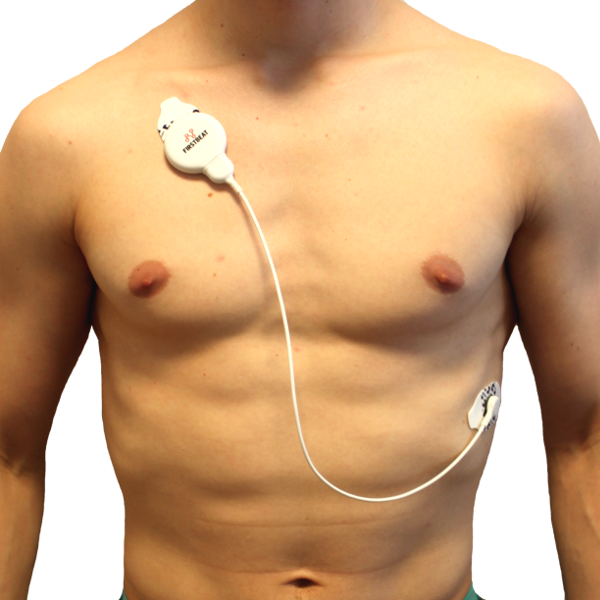
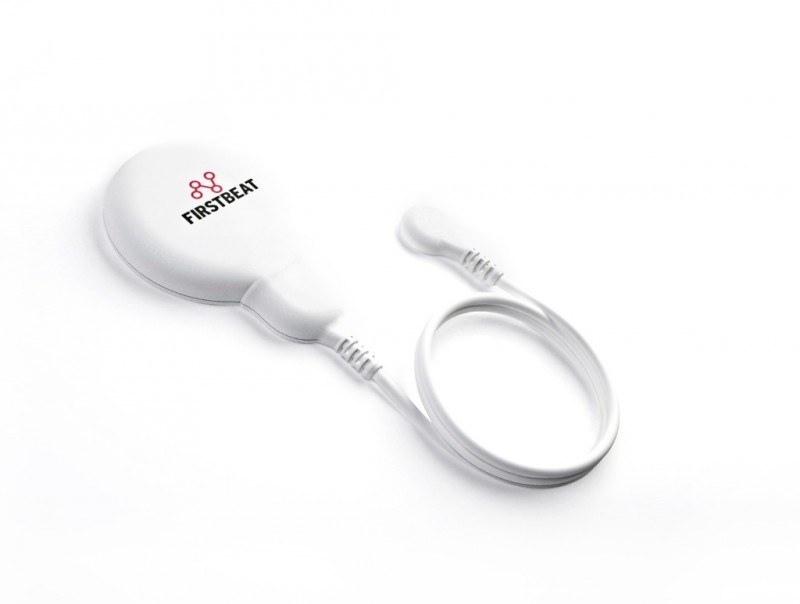
A Firstbeat Bodyguard 2, which is designed for ambulatory 24-hour monitoring, is shown below.
 |
 |
The SDNN is the standard deviation of normal sinus heartbeat intervals measured in milliseconds. Both SNS and PNS activity contribute to SDNN. In short-term resting recordings, the primary source of variation is parasympathetically-mediated RSA.
The SDNN calculated over 24 hours is the "gold standard" for cardiac risk stratification: values below 50 ms indicate unhealthy status, 50-100 ms indicate compromised health, and above 100 ms indicate healthy status. Heart attack survivors with SDNN above 100 ms had 5.3 times lower mortality risk than those below 50 ms.
Imagine you are working with Daniel, a 58-year-old recovering from a myocardial infarction. His cardiologist shares that his 24-hour SDNN is 45 ms, placing him in the "unhealthy" category. This information helps you understand the clinical urgency and shapes your approach to HRV biofeedback training, which may help improve his autonomic balance over time.
SDRR: Standard Deviation Including All Beats
This section covers a metric that is closely related to SDNN but includes a critical difference. The SDRR is the standard deviation of interbeat intervals for all sinus beats, including abnormal or ectopic beats — heartbeats originating outside the sinoatrial node — and artifacts, measured in milliseconds. Unlike SDNN, which excludes artifacts, the SDRR retains these irregular beats in the calculation. Like the SDNN, the SDRR is more accurate when calculated over 24 hours.
The inclusion of abnormal beats matters clinically because these beats may reflect underlying cardiac dysfunction or sensor noise that masquerades as genuine HRV. When you see a notable discrepancy between a client's SDRR and SDNN values, it suggests the presence of artifacts or ectopic beats that warrant further investigation. In practice, the SDNN is generally preferred precisely because it filters out these confounding signals. In a clean sinus-rhythm record, SDRR and SDNN will converge; as soon as ectopy or artifact enters, SDRR can increase for reasons that have nothing to do with autonomic modulation. That sensitivity is useful if your question is "how irregular is this rhythm?" but becomes a liability when you want to track autonomic control — one reason contemporary standards lean heavily on NN-based metrics for autonomic interpretation (Sammito et al., 2024; Task Force, 1996).
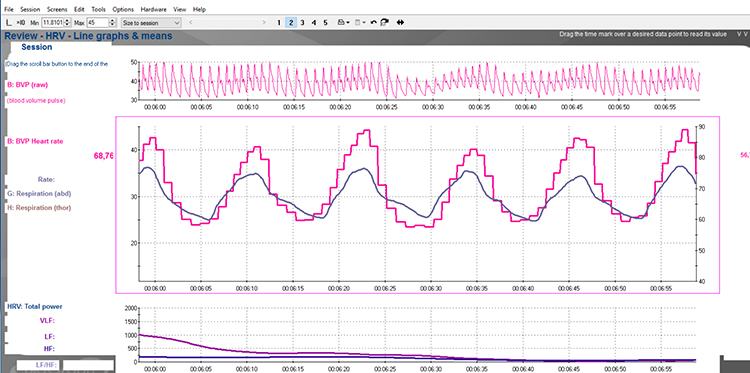
Below is a BioGraph® Infiniti heart rate variability display. The roller coaster accelerates as SDRR increases.
SDANN: Standard Deviation of Average 5-Minute Segments
This section introduces a 24-hour metric that captures slow-changing rhythms in heart rate. The SDANN is the standard deviation of the average NN intervals (normal-to-normal intervals — "clean" IBIs calculated after artifacting) for each of the 5-minute segments during a 24-hour recording. By averaging within each 5-minute window first, the SDANN estimates heart rate changes produced by cycles longer than 5 minutes, such as circadian rhythms and physical activity patterns.
Like the SDNN, the SDANN is measured and reported in milliseconds. It correlates strongly with SDNN and is generally considered redundant with it (Shaffer, McCraty, & Zerr, 2014). Minimum heart rate is more strongly associated with Ln SDANN (where Ln means natural logarithm) than with Ln RMSSD, while maximum heart rate is weakly and inconsistently correlated with these time-domain measures (Burr et al., 2006). For most clinical and biofeedback applications, the SDNN provides the same information.
SDNN Index (SDNNI): Average of 5-Minute Standard Deviations
This section covers a metric that complements the SDANN by focusing on variability within rather than across 5-minute windows. The SDNN Index (SDNNI) is the mean of the standard deviations of all NN intervals for each 5-minute segment of a 24-hour recording. It is calculated by dividing the 24-hour record into 288 five-minute segments, computing the standard deviation within each segment, and then averaging those 288 values.
Because the SDNNI captures variability within short windows, it primarily reflects autonomic influences on heart rate rather than the slower circadian and behavioral rhythms captured by SDANN. It correlates with VLF power over 24 hours (Shaffer, McCraty, & Zerr, 2014). Think of SDANN and SDNNI as complementary lenses: SDANN reveals how your client's average heart rate shifts across hours, while SDNNI reveals how variable each 5-minute window is on its own.
Age exerts a strong influence on all three Holter-derived metrics. In a large normative sample spanning ages 10–99, SDNN and SDANN declined gradually across decades, while the SDNN Index showed a more linear decrease across the lifespan (Umetani et al., 1998). This pattern has a direct practical implication: these are not static traits but age- and timescale-dependent summaries, and a "low" score in an older adult may be developmentally normal rather than clinically concerning. Applying young-adult norms to clients over 60 can lead to unnecessary alarm.
NN50 and pNN50: Counting Large Beat-to-Beat Changes
This section covers two related metrics that quantify abrupt shifts between consecutive heartbeats and link directly to parasympathetic activity. The NN50 measures the number of adjacent NN intervals that differ by more than 50 milliseconds. At least a 2-minute sample is required. The pNN50 expresses this count as a percentage of total NN intervals, making it easier to compare across recordings of different lengths.
While the conventional minimum recording for pNN50 is 5 minutes, researchers have proposed UST periods of 10 seconds (Salahuddin et al., 2007), 30 seconds (Baek et al., 2015), and 60 seconds (Shaffer, Meehan, & Zerr, 2020). The pNN50 is closely correlated with PNS activity (Umetani et al., 1998) and also tracks with both RMSSD and HF power. However, the RMSSD typically provides a better assessment of RSA, especially in older adults, and most researchers prefer it over pNN50 (Otzenberger et al., 1998).
A practical limitation of pNN50 is the floor effect that emerges with aging and elevated heart rates: as the cardiac cycle shortens, successive intervals rarely differ by more than 50 ms, so the threshold becomes increasingly difficult to cross and the metric collapses toward zero even in physiologically healthy individuals.
Normative data from healthy adults using 5-minute recordings illustrate this clearly: pNN50 averaged approximately 0.17 ± 0.18 in women and 0.15 ± 0.16 in men aged 25–49, but fell to only about 0.05 ± 0.09 in women and 0.04 ± 0.07 in men aged 50–74 (Voss et al., 2015). Note that pNN50 is sometimes reported as a proportion (0–1) and sometimes as a percent (0–100%), so values of 0.17 and 17% are equivalent. This fourfold drop across age groups means fixed cutpoints can over-label healthy older adults as "abnormally low" if age is not taken into account (Umetani et al., 1998).
Despite its limitations relative to RMSSD, pNN50 may be a more reliable index than short-term SDNN for the brief samples commonly used in biofeedback sessions. This makes it a practical backup metric when RMSSD is unavailable in your software platform. In summary, NN50 and pNN50 capture parasympathetic activity through a simple threshold-based approach, but RMSSD offers superior sensitivity, particularly with aging clients.
The SDRR includes all beats (even abnormal ones) and may reflect cardiac dysfunction or noise. The SDANN measures variability across 5-minute segments over 24 hours and is generally considered redundant with SDNN.
The SDNNI averages the standard deviations of 288 five-minute segments and correlates with VLF power. The NN50 counts adjacent NN intervals differing by more than 50 ms, while the pNN50 expresses this as a percentage and closely correlates with PNS activity. The RMSSD is preferred over pNN50 for assessing RSA, especially in older adults.
Comprehension Questions
- How does the SDRR differ from the SDNN, and why might this distinction matter clinically?
- Why is the SDANN generally considered redundant with the SDNN?
- What does the SDNNI's correlation with VLF power tell us about what it measures?
- Why do most researchers prefer the RMSSD over the pNN50 for assessing parasympathetic activity?
HR Max - HR Min: The Most Client-Friendly Metric
This section covers the time-domain metric that is easiest to explain to clients and most intuitive for real-time biofeedback displays. HR Max – HR Min is the average difference between the highest and lowest heart rates during each respiratory cycle. Where RMSSD and SDNN require explaining standard deviations and root mean squares, HR Max – HR Min simply measures a wave's height — a concept clients grasp immediately (Moss, 2022). At least a 2-minute sample is required, and physically active individuals typically show wider peak-trough differences than those who are sedentary.
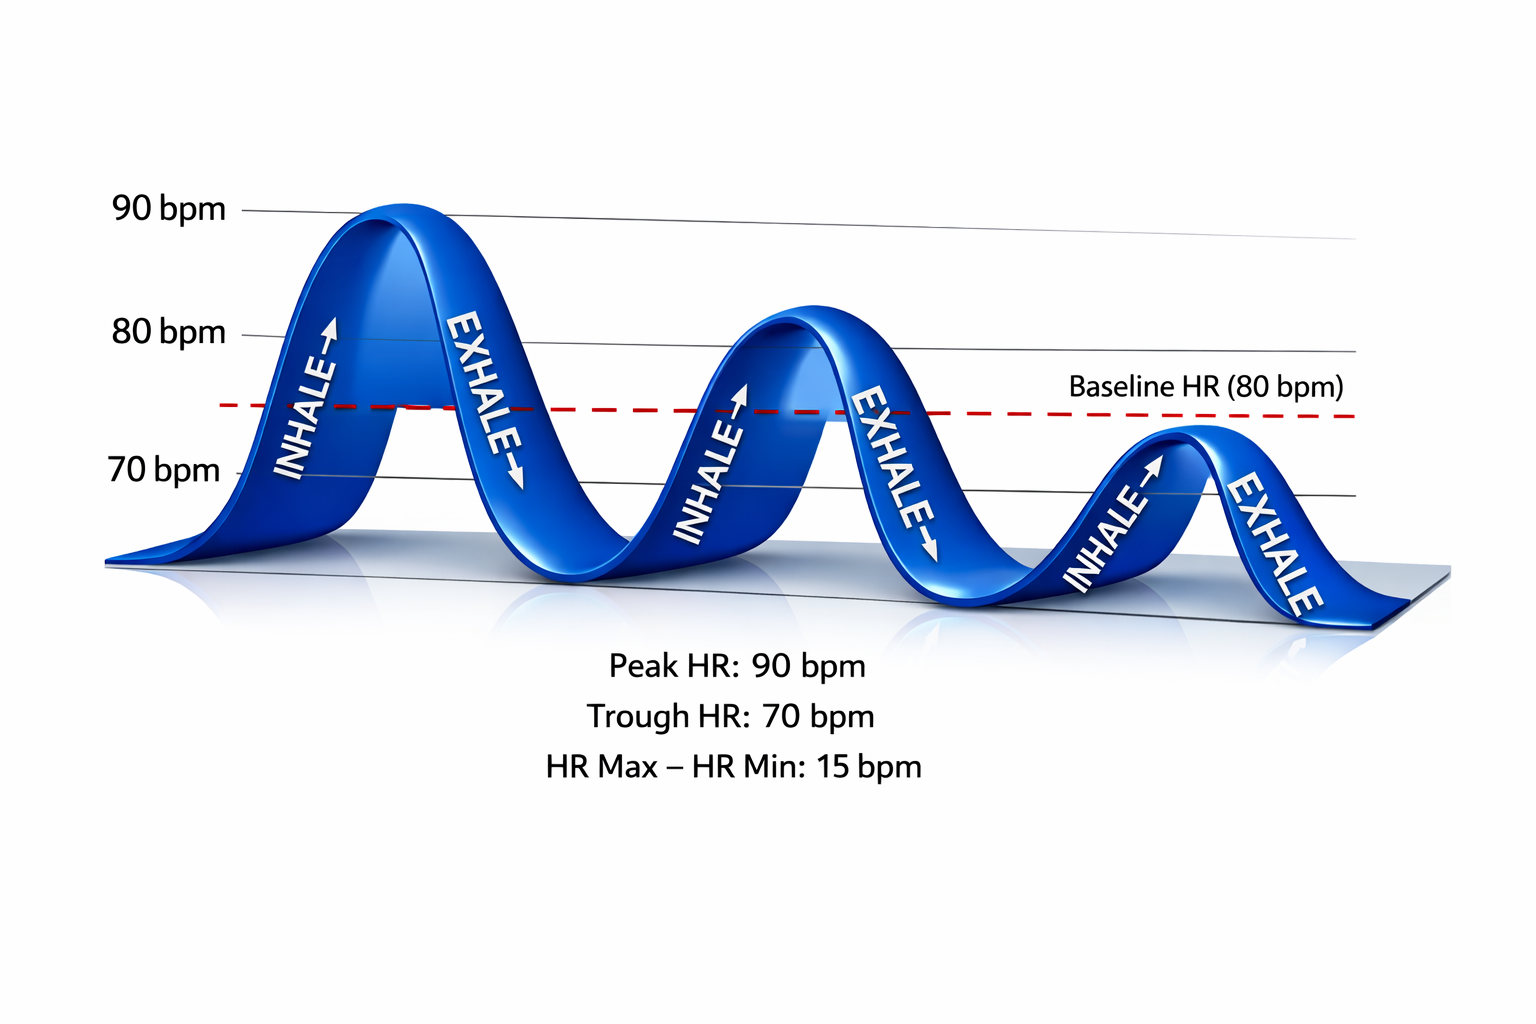
HR Max - HR Min is Affected by Breathing Rate and Measures RSA
An important nuance for practitioners is that this index is susceptible to the effects of respiration rate, independent of vagus nerve traffic. Rather than directly indexing vagal tone, HR Max – HR Min reflects RSA. This distinction matters clinically: since longer exhalations allow greater acetylcholine metabolism, slower respiration rates can produce higher RSA amplitudes that are not mediated by changes in vagal firing (Lehrer, 2012). In other words, a higher score during slow-paced breathing does not necessarily mean the vagus nerve is more active — it may simply reflect the biomechanics of slower breathing.
Booiman (2017) reported values in the 30- and 40-bpm range for Dutch clients in their teens and twenties during slow-paced breathing. For example, the screen capture below is from a 16-year-old female client, 2 weeks post-concussion, who achieved a HR Max – HR Min value of 30 bpm while breathing at 5.5 breaths per minute. HR Max – HR Min can reach 50 beats per minute for elite athletes, making it a useful benchmark in optimal performance work with military personnel and competitive athletes.
This measure is widely used for HRV assessment during paced breathing protocols and is highly correlated with both SDNN and RMSSD (Shaffer, McCraty, & Zerr, 2014). Its accessibility makes it especially valuable in settings where client engagement is a priority, such as VA clinics working with veterans who may be new to biofeedback concepts.
However, practitioners should recognize that HR Max–HR Min is fundamentally a breathing-pattern metric: it measures how the person is breathing as much as — or sometimes more than — how the autonomic nervous system is behaving as a stable trait. This fragility for normative interpretation is the same reason modern guidelines insist on keeping posture, time of day, activity state, and breathing protocol consistent across sessions and clients before drawing any clinical conclusions from this index (Sammito et al., 2024; Task Force, 1996).
Consider Sarah, a biofeedback clinician explaining HRV to her client, James, for the first time. Instead of describing standard deviations, she points to the HR Max - HR Min display on the screen and says, "See how your heart rate goes up when you breathe in and down when you breathe out? We are measuring the height of that wave. Bigger waves generally mean better flexibility in your nervous system." James immediately understands and feels motivated to practice.
RMSSD: The Best Short-Term HRV Measure
This section covers the single most important metric for biofeedback practitioners working with short-term recordings. The RMSSD — the root mean square of successive differences between normal heartbeats — is calculated by first measuring the time difference between each pair of adjacent interbeat intervals in milliseconds, then squaring each difference, averaging the squared values, and finally taking the square root. The result captures rapid beat-to-beat variance in heart rate and provides a better estimate of vagal activity than SDNN (Shaffer, McCraty, & Zerr, 2014).
The RMSSD is conceptualized as vagally-mediated HRV (vmHRV), meaning it predominantly reflects parasympathetic influence on the heart (Jarczok et al., 2021). It is the best overall measure of short-term HRV because it is less affected by outliers and artifacts than SDNN (Gevirtz, 2020). At least a 5-minute sample is required, though researchers have proposed UST periods of 10 seconds (Salahuddin et al., 2007), 30 seconds (Baek et al., 2015), and 60 seconds (Shaffer, Meehan, & Zerr, 2020).
Clinical Significance and Cross-Domain Connections
The RMSSD is mathematically identical to the nonlinear metric SD1, which reflects short-term HRV on a Poincaré plot (Ciccone et al., 2017). This equivalence means that when you see SD1 in a nonlinear analysis, you are looking at the same information as RMSSD expressed in a different visual format.
Because RMSSD values are right-skewed across populations — most individuals cluster at lower values while a smaller number show very high variability — researchers and apps frequently apply a natural-log transformation, yielding lnRMSSD (the natural logarithm of RMSSD). This transformation normalizes the distribution and makes statistical comparisons more stable, which is why lnRMSSD appears in performance-monitoring literature alongside the raw ms value (Besson et al., 2025; Ciccone et al., 2017).
While the RMSSD correlates with HF power (Kleiger et al., 2005), the influence of respiration rate on this index remains uncertain (Penttilä et al., 2001; Schipke et al., 1999). Notably, the RMSSD is less affected by respiration than RSA across several tasks (Hill & Siebenbrock, 2009).
Normative data from a large healthy cohort using 5-minute recordings help contextualize values you see in clinical practice. Mean RMSSD was approximately 36.5 ± 20.1 ms in women and 34.0 ± 18.3 ms in men aged 25–49, falling to roughly 22.0 ± 13.2 ms in women and 20.5 ± 11.0 ms in men aged 50–74 (Voss et al., 2015).
This age-related decline is consistent across studies and underscores the importance of age-matched interpretation: a 65-year-old client with an RMSSD of 20 ms may be entirely within normal limits. Breathing protocols also shift these values substantially. A systematic review found mean 5-minute SDNN of approximately 49 ms and RMSSD of approximately 43 ms under free breathing, compared with SDNN of approximately 59 ms and RMSSD of approximately 55 ms under paced breathing — a quiet reminder that "normal values" are conditional on how the person is breathing (Nunan et al., 2010).
The RMSSD has important prognostic value beyond biofeedback. Lower RMSSD values are correlated with higher scores on a risk inventory for sudden unexplained death in epilepsy (DeGiorgio et al., 2010). A novel ratio combining short-term RMSSD with C-reactive protein (an inflammatory marker) predicted survival in both cancer patients and the general population (Jarczok et al., 2021). These findings underscore how a metric you use in daily biofeedback sessions connects to life-and-death clinical outcomes.
Recent reliability research adds an important measurement-context dimension. In a 2025 study evaluating RMSSD across environments and body positions, RMSSD showed good-to-excellent reliability in supine morning measurements, with intraclass correlation coefficients (ICCs) above 0.75 — a commonly used benchmark for acceptable clinical reliability.
Standing measurements were generally less stable, and the absolute variability for RMSSD in the supine position was on the order of 6–8 ms. The practical takeaway: when you want to track RMSSD repeatedly over time, standardize posture and time of day before worrying about recording length (Besson et al., 2025).
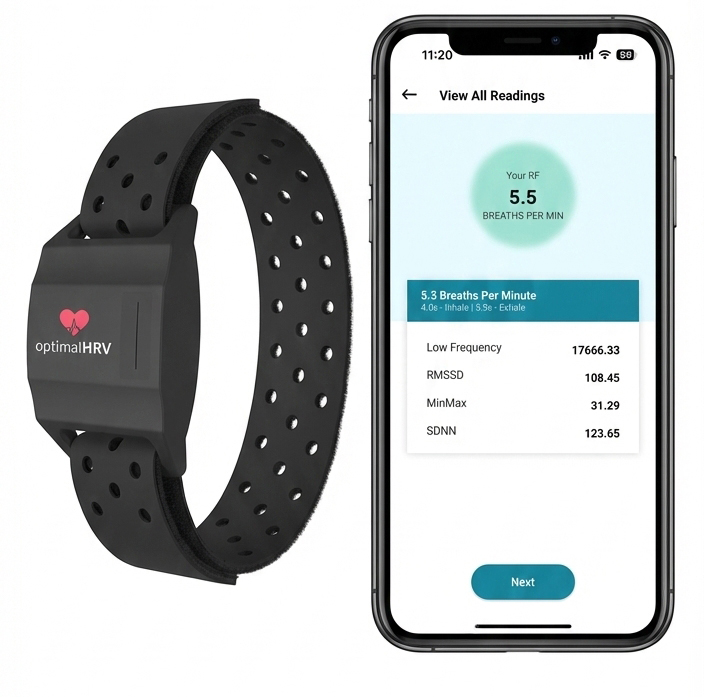
The RMSSD in Consumer Technology
Many popular HRV apps — including Apple Health, Elite HRV, Fitbit, Optimal HRV, and the Oura Ring— use RMSSD or lnRMSSD (its natural logarithm) as their primary HRV metric. This means your clients are increasingly likely to arrive at sessions with wearable-generated RMSSD data in hand. Understanding how these consumer measurements compare to clinical-grade recordings is essential for guiding clients who ask whether their smartwatch data is "accurate."
HR Max - HR Min is the most client-friendly metric because clients can easily visualize the wave height during breathing. It is susceptible to respiration rate and reflects RSA rather than directly indexing vagal tone.
The RMSSD is the best overall short-term HRV measure because it better estimates vagal activity than SDNN and is less affected by outliers and artifacts. The RMSSD is identical to the nonlinear metric SD1 and is conceptualized as vagally-mediated HRV. Many popular HRV apps rely on RMSSD or its natural logarithm.
Comprehension Questions
- Why is HR Max - HR Min considered the most client-friendly time-domain metric?
- Why is the RMSSD considered a better measure of short-term HRV than the SDNN?
- What does it mean to say the RMSSD is identical to SD1?
- Why might slower breathing rates produce higher HR Max - HR Min values that do not necessarily reflect increased vagal tone?
HRV-CV: Measuring the Stability of Heart Rate Variability Over Time
This section covers a metric that shifts the focus from a single recording to the consistency of HRV across days — an approach increasingly central to sport science and consumer health monitoring. The coefficient of variation (CV) is a standard statistical measure that expresses a standard deviation as a percentage of its mean. When applied to HRV, the CV appears in two distinct forms. In the first form, called the CVRR, it normalizes the variability of RR intervals within a single recording by dividing SDNN by the mean RR interval and multiplying by 100. This produces a heart-rate-corrected index of autonomic function expressed as a percentage, making it easier to compare individuals who have different resting heart rates (Shaffer & Ginsberg, 2017). In the second and more recent form, called HRV-CV, the CV is calculated across a series of daily HRV scores — most commonly the weekly mean and standard deviation of lnRMSSD — to quantify how much a person's autonomic activity fluctuates from day to day (Plews et al., 2012).
CVRR: A Heart-Rate-Corrected Window Into Autonomic Function
The CVRR addresses a practical problem with raw SDNN: because longer RR intervals (slower heart rates) tend to produce larger absolute variability, two individuals with identical autonomic function but different resting heart rates can show different SDNN values. Dividing by the mean RR interval removes this heart-rate dependency and yields a dimensionless percentage (Shaffer & Ginsberg, 2017). Typical CVRR values in healthy young adults at supine rest range from approximately 4% to 7%, declining with age in both sexes. In patients with essential hypertension, CVRR is significantly lower than in age-matched normotensive controls, suggesting impaired parasympathetic function.
The CVRR has proven especially valuable in detecting cardiovascular autonomic neuropathy (CAN), a complication of diabetes that can cause resting tachycardia, orthostatic hypotension, and sudden cardiac death. In young patients with type 1 diabetes, CVRR during deep breathing showed sensitivity and specificity exceeding 96% for detecting CAN, outperforming most other single time-domain measures (Razanskaite-Virbickiene et al., 2017). Decreased CVRR at rest is also associated with higher resting heart rate, prolonged QTc interval, and greater orthostatic blood pressure decline in non-elderly patients with diabetes (Sugimoto et al., 2024). Beyond diabetes, the CVRR is reduced in neurological conditions including Parkinson’s disease and dementia with Lewy bodies, where it serves as a convenient, noninvasive marker of autonomic deterioration. In elderly long-term care residents, higher CVRR predicted survival more effectively than standard annual health examinations (Kurita et al., 2013).
HRV-CV: Day-to-Day Variability as a Training and Health Signal
The day-to-day HRV-CV emerged from sport science as researchers recognized that a single morning HRV reading can fluctuate for many reasons — poor sleep, alcohol, stress, or simply measurement noise — but the pattern of fluctuation across a week tells a more meaningful story. Plews and colleagues (2012) first demonstrated this concept in a landmark case comparison of two elite triathletes. One athlete, who became non-functionally over-reached, showed a progressive decline in both the 7-day rolling average of lnRMSSD and its coefficient of variation, while the healthy control athlete maintained stable values. This observation launched a productive line of research showing that the weekly CV of lnRMSSD captures autonomic perturbations that the weekly mean alone may miss. Subsequent team-sport studies reinforced the pattern: national-level swimmers displayed more stable 7-day HRV-CV than their conference-level teammates during standardized training (Flatt et al., 2022), and rugby and futsal players with lower HRV-CV during training blocks showed superior gains in aerobic capacity (Flatt & Howells, 2019; Nakamura et al., 2020). These early findings were compelling but limited by small, homogeneous athletic samples and a narrow focus on human performance outcomes.
The HRV-CV is calculated by dividing the standard deviation of daily lnRMSSD values over a defined period (typically 7 days) by the weekly mean and multiplying by 100. Typical values range from roughly 2% to 20%, with lower values indicating more stable autonomic recovery and higher values signaling greater day-to-day perturbation (Flatt & Esco, 2016; Grosicki et al., 2026). A decrease in the weekly CV of lnRMSSD during training is generally a favorable sign: in collegiate female soccer players, the change in lnRMSSDCV over the first three weeks of a conditioning program correlated strongly (r = −0.74) with eventual improvement in intermittent running performance (Flatt & Esco, 2016). Conversely, athletes with the lowest CV during increased training loads showed the most favorable performance gains, suggesting that physiological resilience manifests as stable daily HRV (Plews et al., 2013).
Importantly, lower HRV-CV is not universally advantageous. The vagal tank theory proposes that cardiac vagal control comprises three domains — resting (tonic), reactivity (phasic), and recovery (phasic) — and that healthy autonomic regulation sometimes requires greater HRV fluctuation (Laborde et al., 2018). During exercise, larger vagal withdrawal supports improved cardiovascular performance, meaning that some day-to-day HRV variability reflects appropriate physiological engagement rather than maladaptive instability. Very low HRV-CV could also signal blunted autonomic reactivity in individuals with limited physiological responsiveness, such as older adults with diminished vagal reserve, or a lack of autonomic challenge in those leading highly sedentary lifestyles (Grosicki et al., 2026). Both high and low HRV-CV must therefore be interpreted in context, ideally alongside absolute HRV trends (Plews et al., 2012).
Consumer Applications and Emerging Population-Level Evidence
Several consumer platforms now incorporate HRV-CV or closely related trend metrics. HRV4Training displays the coefficient of variation alongside weekly baseline lnRMSSD, allowing athletes to identify periods of autonomic instability before the baseline itself changes. Elite HRV calculates a rolling 7-day CV of morning readiness scores. WHOOP has conducted large-scale research on sleep-derived HRV-CV, although the metric is not yet displayed directly in the app. The Oura Ring provides data that third-party platforms like Heads Up Health use to compute HRV-CV trends.
In the largest population study to date, Grosicki and colleagues (2026) analyzed approximately 2 million nocturnal HRV readings from over 21,000 wearable device users and established that at least five nights of data are required for reliable 7-day HRV-CV estimates (ICC ≥ 0.80). Reliability held across all day-of-week combinations as long as five days were included, although four-day samples that excluded weekend nights fell below acceptable thresholds — consistent with evidence that sleep and activity patterns shift systematically on weekends. Higher HRV-CV was associated with greater alcohol consumption, lower physical activity, shorter and less consistent sleep, older age, and higher body mass index. Notably, alcohol consumption and sleep patterns showed stronger standardized associations with HRV-CV than with HRV or resting heart rate, suggesting that day-to-day fluctuation captures behavioral influences on autonomic function that absolute HRV values may underrepresent.
The study also revealed distinct age trajectories by biological sex that persisted after adjusting for health behaviors, body mass index, and HRV. In males, HRV-CV remained stable through early adulthood but rose progressively after approximately age 40 — a pattern the authors linked to the typical midlife decline in testosterone. In females, HRV-CV followed a U-shaped trajectory, declining through midlife and increasing after roughly age 50 in a pattern broadly consistent with the menopausal transition. HRV-CV also increased with higher body mass index in both sexes, with stronger effects in males even after controlling for behavioral factors. These findings support HRV-CV as a behavior-sensitive digital biomarker with applications extending beyond athletic performance into population health monitoring and risk stratification.
Strengths and Limitations
The CVRR’s principal strength is its heart-rate correction, which allows fairer comparisons across individuals with different resting rates and makes it particularly sensitive to early autonomic neuropathy. Its limitation is that no single normative threshold has been universally adopted; reference values vary by age, posture, and breathing protocol, and the metric is not included in the 1996 Task Force standards. The day-to-day HRV-CV adds a longitudinal dimension that captures recovery dynamics invisible to any single-session metric. However, it requires consistent daily measurement under standardized conditions — same time of day, same posture, same recording duration — because protocol variation inflates the CV for reasons unrelated to autonomic function.
Both forms of the CV share a mathematical sensitivity: when the mean is small, even modest fluctuations produce disproportionately large CV values, which can exaggerate instability in individuals with low baseline HRV. Practitioners should also remember that HRV-CV is a trend metric — it tells you how stable your client’s autonomic profile is, not why it is unstable. A rising HRV-CV in an athlete may reflect training overload, poor sleep, alcohol use, illness onset, or simply a change in measurement routine. As with all HRV indices, context is everything.
The CVRR normalizes RR interval variability by heart rate, yielding a percentage that facilitates comparisons across individuals with different resting heart rates. It is especially useful for detecting cardiovascular autonomic neuropathy in diabetes and predicts survival in elderly populations.
The day-to-day HRV-CV quantifies how much daily HRV fluctuates across a week. Lower values generally signal stable recovery and positive training adaptation, while higher values indicate autonomic perturbation. However, the vagal tank theory cautions that very low HRV-CV can also reflect blunted reactivity, so context and absolute HRV trends are essential for interpretation. Large-scale wearable research associates higher HRV-CV more strongly with alcohol and sleep behaviors than HRV itself, and reveals distinct age trajectories by sex that may reflect underlying hormonal changes.
Imagine you are monitoring Alicia, a 32-year-old recreational runner preparing for a half-marathon. Over the past two weeks, her average morning lnRMSSD has remained within her normal range, but her weekly HRV-CV has climbed from 6% to 14%. This divergence suggests that while her average autonomic status looks stable, her day-to-day recovery has become erratic — possibly from combining intense workouts with inconsistent sleep. You advise her to prioritize sleep consistency and reduce training intensity for a few days, then reassess. The following week, her HRV-CV drops to 8%, confirming that the adjustment restored physiological stability before her baseline ever deteriorated.
Comprehension Questions
- How does the CVRR differ from the SDNN, and what practical problem does it solve?
- Why is the CVRR particularly valuable in screening for cardiovascular autonomic neuropathy?
- What did the Plews et al. (2012) case comparison reveal about the relationship between the coefficient of variation of lnRMSSD and non-functional over-reaching?
- According to the vagal tank theory, why might very low HRV-CV sometimes be a cause for concern rather than a sign of good health?
- Why did the Grosicki et al. (2026) study conclude that HRV-CV may be more sensitive to alcohol and sleep behaviors than HRV itself?
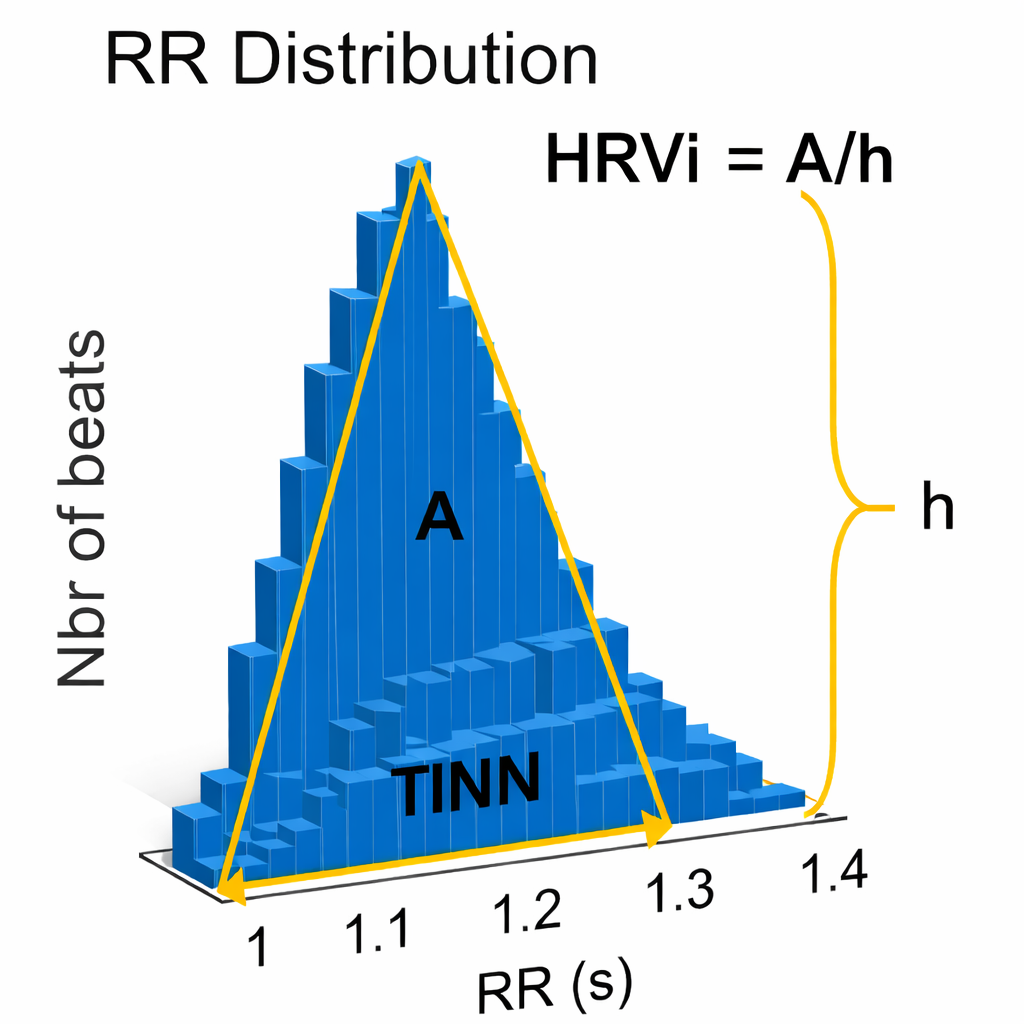
HRV Triangular Index (HRVi): A Geometric Approach
This section introduces two geometric measures that take a different approach to quantifying HRV — using histogram shapes rather than statistical calculations. The HRV triangular index (HRVi) is a geometric measure based on 24-hour recordings. It is calculated by dividing the integral (total area) of the RR interval histogram's density by its maximum height, essentially measuring how spread out the distribution of interbeat intervals is (Task Force, 1996). A broader distribution produces a higher HTI, reflecting greater overall variability. HRVi is a dimensionless index tied to histogram peak and total counts.
Both the PNS and SNS contribute to the HRV triangular index (Billman et al., 1982; Schwartz et al., 1988). A 5-minute epoch may be sufficient to represent this metric (Jovic & Bogunovic, 2011), and a 120-second UST period has been proposed (Shaffer, Meehan, & Zerr, 2020). However, the original standards explicitly state that geometric methods require approximately 20 minutes as a minimum, with 24 hours preferred for reliable histogram formation — because the NN interval distribution needs sufficient data points before its shape becomes stable and interpretable (Task Force, 1996).
The canonical normative 24-hour value for healthy adults is approximately 37 ± 15 (Task Force, 1996). A particularly valuable clinical application is that HRVi and RMSSD can jointly distinguish between normal heart rhythms and arrhythmias: when HRVi ≤ 20.42 and RMSSD ≤ 0.068, the rhythm is normal, but when HRVi exceeds 20.42, the rhythm is arrhythmic (Jovic & Bogunovic, 2011).
The HRVi independently predicts cardiovascular mortality in patients diagnosed with atrial fibrillation (Hämmerle et al., 2020). For practitioners working with cardiac populations in hospital or VA settings, this makes the HRVi a useful screening tool that complements SDNN-based risk stratification.
The Triangular Interpolation of the NN Interval Histogram (TINN)
The Triangular Interpolation of the NN Interval Histogram (TINN) is the baseline width of a histogram displaying NN intervals. To visualize this metric, imagine a histogram where the X-axis represents interbeat interval length in milliseconds and the Y-axis represents the count of intervals at each length (Yilmaz et al., 2018). The TINN measures how wide this distribution is at its base — a wider base indicates more variability across the recording. The width is the distance between the left and right base intercepts of the fitted triangle. At least a 5-minute sample is required (Shaffer & Ginsberg, 2017).
Summary Tables
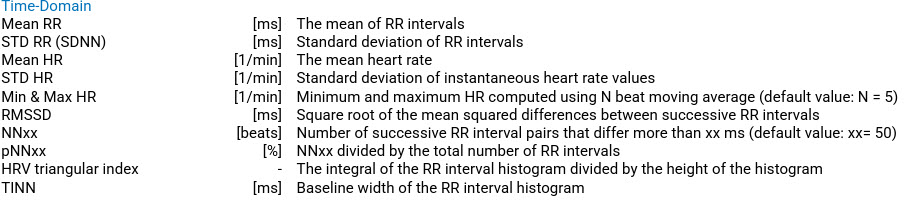
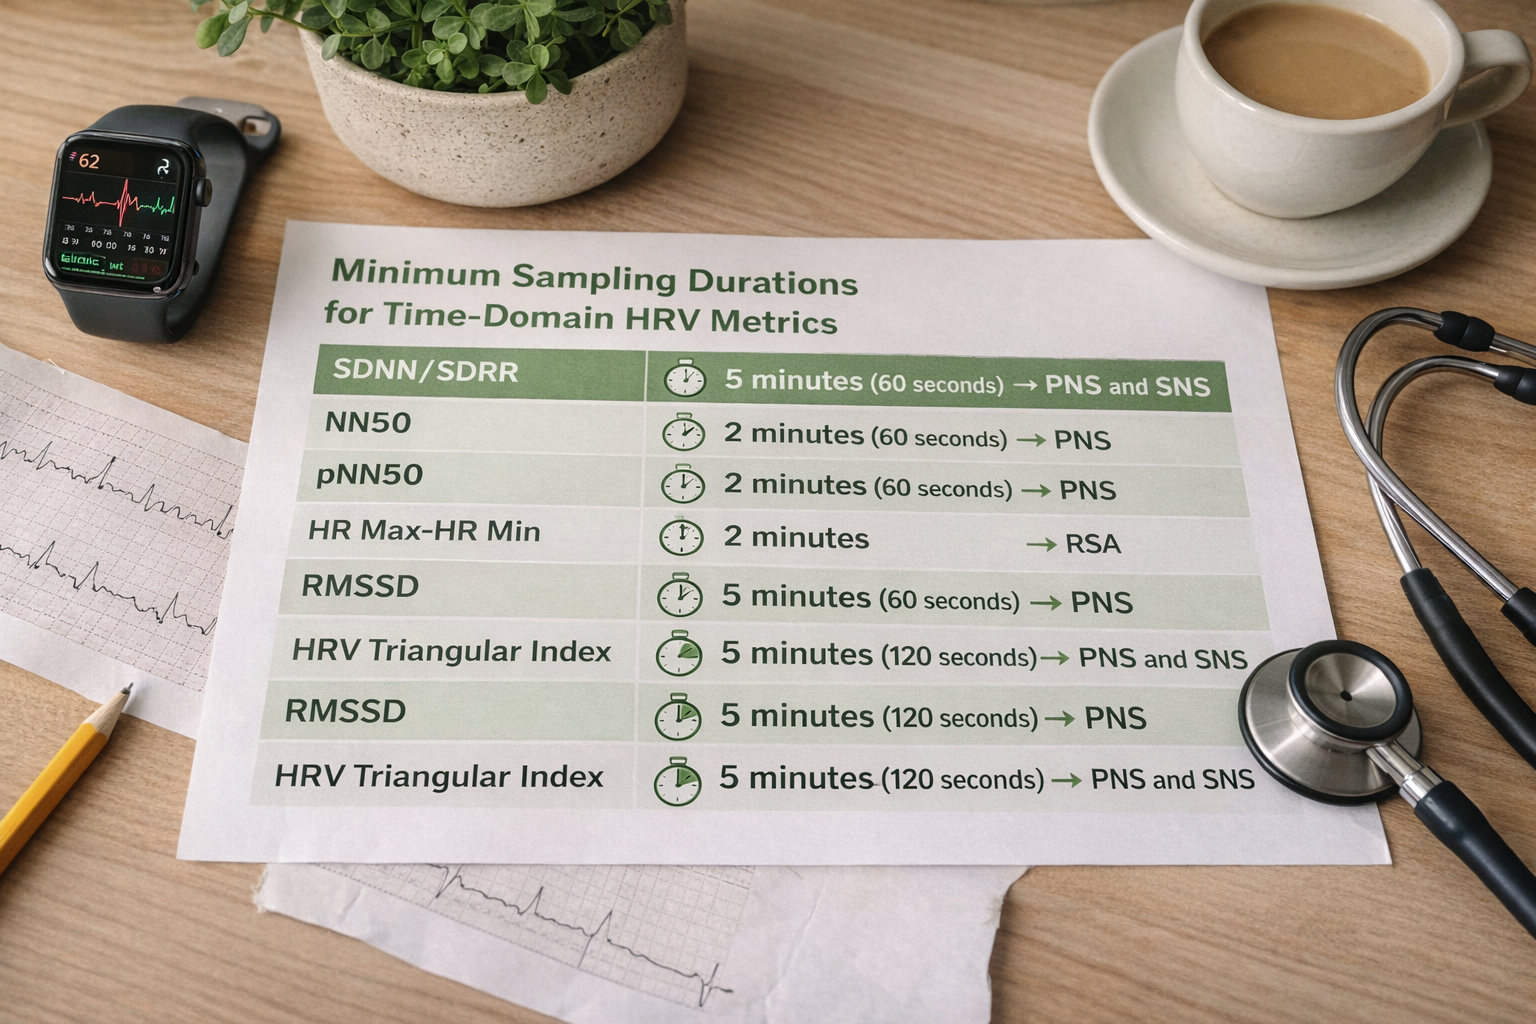
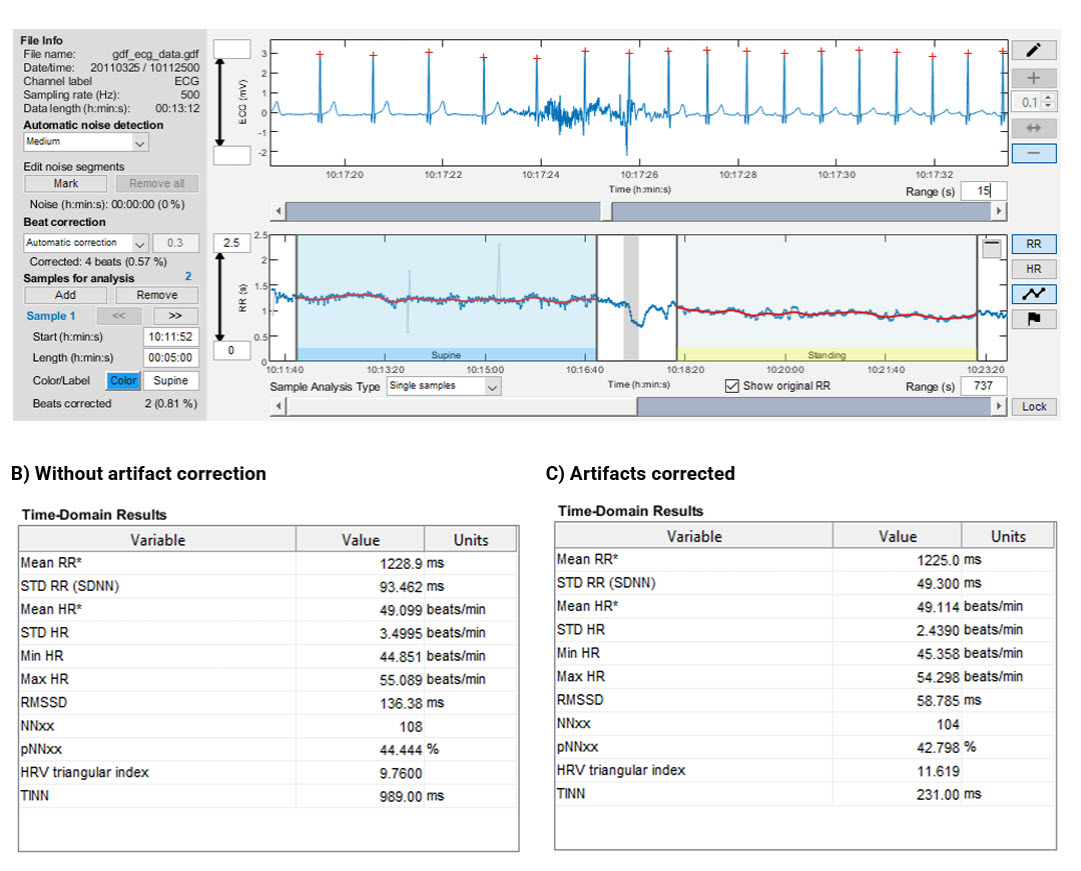
The following tables consolidate the key properties of time-domain indices for quick reference. Table 1 summarizes each metric's definition and clinical significance. Table 2 shows the minimum conventional and UST recording periods recommended for each metric (Shaffer, Meehan, & Zerr, 2020). Table 3 displays an example of Kubios time-domain calculations before and after artifact correction, illustrating how these values appear in commonly used HRV analysis software.
HRV Myths: Avoiding Common Misinterpretations
This section addresses three widespread misconceptions that can lead to clinical errors. Even experienced practitioners sometimes misapply HRV norms, and these mistakes can distort clinical decision-making. Understanding these pitfalls will protect you from overstating or understating your clients' autonomic health.

Myth 1: Short-Term and 24-Hour Measurements Are Interchangeable
You cannot interpret short-term metrics using 24-hour norms because they are obtained under fundamentally different conditions. A 24-hour recording captures circadian rhythms, sleep-wake transitions, physical activity, and emotional responses throughout the day. Briefer recording periods miss these slower sources of variability and therefore generally produce lower HRV values. Applying 24-hour cutoffs to a 5-minute recording will inevitably overestimate your client's cardiac risk.
Myth 2: Slow-Paced Breathing Values Can Be Compared with Resting Norms
Resting norms are established with participants breathing at typical rates, usually 12 to 14 breaths per minute. Slow-paced breathing at 6 breaths per minute — less than half the typical rate — amplifies RSA and inflates time-domain values well beyond resting baselines. Comparing slow-paced breathing data to resting norms would dramatically overestimate a client's baseline autonomic flexibility.
The magnitude of this inflation is not trivial: a systematic review of normal values found mean 5-minute RMSSD of approximately 43 ms under free breathing versus approximately 55 ms under paced breathing, and mean SDNN of approximately 49 ms versus approximately 59 ms, respectively (Nunan et al., 2010). In practical terms, a client who achieves an RMSSD of 55 ms during paced breathing is not demonstrating an above-average resting autonomic profile; they are demonstrating a normal response to a known HRV-amplifying procedure. Always match the norm to the breathing context.
Myth 3: UST and Short-Term Measurements Are Interchangeable
UST measurements are more vulnerable to corruption by artifact because they are based on fewer data points. Currently, there is no consensus on an acceptable UST measurement length for each metric. As Shaffer, Meehan, and Zerr (2020) put it, "UST measurements are proxies of proxies. They seek to replace short-term values, which, in turn, attempt to estimate reference standard long-term metrics." When your clients bring wearable data based on 30- or 60-second recordings, this context is essential for setting realistic expectations.

Test Your Understanding
A clinician calculates an SDNN value of 60 milliseconds from a 15-minute resting baseline and is concerned that their client may have an elevated heart attack risk. What have they overlooked?
They mistakenly applied cutoffs based on 24-hour recordings to a brief recording. Twenty-four-hour and brief recording values are not interchangeable because short monitoring periods exclude long-term sources of HRV like circadian rhythms. The 50/100 ms thresholds only apply to data collected over a full 24-hour period.
The HRV triangular index is a geometric measure where both PNS and SNS contribute. HTI and RMSSD can jointly distinguish normal rhythms from arrhythmias. The TINN measures the baseline width of an NN interval histogram.
Three critical myths to avoid: short-term and 24-hour values are not interchangeable, slow-paced breathing values cannot be compared with resting norms, and UST measurements are proxies of proxies that are more vulnerable to artifact corruption.
Consider Tom, a new biofeedback practitioner, who records a 5-minute baseline SDNN of 42 ms for his client and panics, thinking this places the client in the "unhealthy" cardiac risk category. His supervisor gently reminds him that those cutoffs (below 50 ms = unhealthy) were established using 24-hour recordings. A 5-minute recording is expected to produce lower SDNN values because it captures far less variability than a full day of data. Tom learns a valuable lesson about matching norms to recording duration.
Comprehension Questions
- How can HRVi and RMSSD together help distinguish normal rhythms from arrhythmias?
- Why is it inappropriate to use 24-hour SDNN cutoffs to interpret 5-minute recordings?
- Why are UST measurements described as "proxies of proxies"?
- A client breathes at 6 breaths per minute during a 5-minute assessment and achieves an SDNN of 85 ms. Can you interpret this using resting norms? Why or why not?
- What does the TINN measure, and why is a minimum 5-minute sample required?
Cutting Edge Topics in Time-Domain HRV
Ultra-Short-Term HRV: Promise and Pitfalls
The growing popularity of consumer wearables has driven intense interest in ultra-short-term (UST) HRV measurement. Devices like the Apple Watch, Fitbit, and Oura Ring typically rely on brief recording windows, often 60 seconds or less. While these measurements provide convenient snapshots, Shaffer, Meehan, and Zerr (2020) conducted a critical review showing that UST metrics are less reliable and more susceptible to artifact than conventional short-term recordings. The field still lacks consensus on minimum UST recording lengths for each metric, making interpretation challenging for clinicians who must counsel clients about wearable data.
Clinical Reliability: What Context Conditions Matter Most?
A 2025 multi-environment, multi-position reliability study found that time-domain metrics, including SDNN and RMSSD, performed consistently well in supine morning measurements, with intraclass correlation coefficients (ICCs) exceeding 0.75. Standing measurements were less reliable across the board. The absolute measurement variability for SDNN and RMSSD in the optimal (supine) condition was approximately 6–8 ms — a number that helps practitioners decide whether an observed change in a client's RMSSD over time is a real physiological shift or simply measurement noise. The practical message: standardizing posture and time of day has as much impact on reliability as extending recording length (Besson et al., 2025).
HRV Monitoring in Occupational and Sport Settings
Recent occupational health guidelines highlight that HRV, and RMSSD in particular, offers genuine utility for health monitoring and stress assessment — but only when acquisition conditions are rigorously controlled for posture, time of day, activity state, and breathing (Sammito et al., 2024). In elite sport, time-domain HRV — especially RMSSD and lnRMSSD — has become a standard tool for tracking training adaptation and recovery. Research with elite endurance athletes demonstrated that systematic HRV monitoring can guide training load decisions and detect early signs of overreaching (Plews et al., 2013). Smartphone-derived RMSSD has also been validated in team-sport contexts, reflecting a broader shift from laboratory-only HRV toward accessible field monitoring (Flatt & Esco, 2015). The interpretive caution that applies across all these settings remains the same: a single-day drop in RMSSD may reflect accumulated fatigue, insufficient sleep, illness onset, psychological strain, or simply a change in measurement conditions. Treating HRV as a trend signal rather than a standalone readiness verdict is the key to meaningful applied use (Besson et al., 2025; Sammito et al., 2024).
RMSSD and C-Reactive Protein: A Novel Prognostic Ratio
Jarczok and colleagues (2021) introduced a novel index combining short-term RMSSD with C-reactive protein (CRP) levels. Lower values of this vagal-neuroimmunomodulation index were associated with higher all-cause mortality in two large general population samples with 18-year follow-up. This finding highlights the intersection of autonomic function and inflammatory markers, suggesting that the vagus nerve's anti-inflammatory reflex plays a meaningful role in long-term survival outcomes.
HRV Triangular Index and Atrial Fibrillation Prognosis
Hämmerle and colleagues (2020) from the Swiss-AF Study demonstrated that the HRV triangular index independently predicts cardiovascular mortality in patients with atrial fibrillation. This geometric measure, once considered a secondary metric, may prove valuable for risk stratification in one of the most common cardiac arrhythmias worldwide.
Assignment
Now that you have completed this module, review the missed beat and extra beat graphics and see whether you can identify abnormally long and short IBIs. Based on this module, how might you improve your artifacting?
Additionally, identify the index that is the "gold standard" for predicting the risk of morbidity and mortality when based on 24-hour recording. Which index should be most easily understood by your clients? Why?
Glossary
cardiovascular autonomic neuropathy (CAN): damage to the autonomic nerve fibers that innervate the heart and blood vessels, commonly caused by diabetes. CAN can manifest as resting tachycardia, orthostatic hypotension, exercise intolerance, and increased risk of silent myocardial infarction and sudden cardiac death.
coefficient of variation (CV): a standardized measure of dispersion calculated by dividing the standard deviation by the mean and multiplying by 100, expressed as a percentage. In HRV, the CV appears in two forms: CVRR normalizes RR interval variability within a single recording, and HRV-CV quantifies day-to-day fluctuation in HRV scores across multiple days.
CVRR: the coefficient of variation of RR intervals, calculated by dividing SDNN by the mean RR interval and multiplying by 100. By normalizing for heart rate, the CVRR allows fairer comparisons of autonomic function across individuals with different resting heart rates.
digital biomarker: a quantifiable physiological or behavioral measure collected through digital devices — such as wearable sensors or smartphones — that can be used for health monitoring, risk stratification, or tracking treatment response. Sleep-derived HRV-CV is an example of a digital biomarker because it is captured passively by a wearable device and reflects behavioral and demographic factors linked to health outcomes.
ectopic beat: a heartbeat originating outside the sinoatrial node, such as a premature ventricular or atrial contraction. Ectopic beats are excluded from NN-interval calculations because they do not reflect normal sinus rhythm variability.
floor effect: a measurement limitation that occurs when a metric reaches a lower boundary and can no longer meaningfully discriminate between individuals. For pNN50, the 50-ms threshold becomes increasingly difficult to exceed at higher heart rates and older ages, causing scores to cluster near zero even in physiologically healthy individuals.
heart rate: the number of heartbeats per minute, also called stroke rate.
heart rate variability (HRV): the beat-to-beat changes in HR involving changes in the RR intervals between consecutive heartbeats.
HR Max – HR Min: an HRV index that calculates the average difference between the highest and lowest HRs during each respiratory cycle.
HRV-CV: the coefficient of variation of daily HRV scores (typically lnRMSSD) calculated over a rolling period, usually 7 days. HRV-CV quantifies day-to-day autonomic fluctuation; lower values indicate stable recovery, while higher values suggest greater physiological perturbation.
HRV triangular index (HRVi): a geometric measure based on 24-hour recordings, which calculates the integral of the RR interval histogram's density divided by its height.
intraclass correlation coefficient (ICC): a statistical measure of reliability or agreement between repeated measurements. Values above 0.75 are generally considered good-to-excellent for clinical measurement purposes.
interbeat interval (IBI): the time interval between the peaks of successive R-spikes (initial upward deflections in the QRS complex).
lnRMSSD: the natural logarithm of RMSSD. Because raw RMSSD values are right-skewed across populations, log-transformation normalizes the distribution and stabilizes statistical comparisons. Widely used in performance monitoring and consumer HRV applications.
NN interval: the normal-to-normal interval is an IBI after removing artifacts.
NN50: the number of adjacent NN intervals that differ from each other by more than 50 milliseconds.
nonstationarity: the tendency of a physiological signal's statistical properties — such as its mean or variance — to shift over time. Nonstationarity is a key reason that SDNN values from recordings of different lengths cannot be directly compared.
non-functional over-reaching (NFOR): a state of accumulated training stress in which an athlete experiences performance decrements and prolonged recovery that may take weeks to months to resolve. NFOR is distinguished from short-term functional over-reaching, which resolves within days, and from overtraining syndrome, which may require months of recovery.
pNN50: the percentage of adjacent NN intervals that differ by more than 50 milliseconds. Sometimes reported as a proportion (0–1) rather than a percent (0–100%); a value of 0.17 equals 17%.
parasympathetic saturation: a phenomenon during states of high parasympathetic dominance — such as slow-wave sleep — in which HRV decreases independently of stress because the cardiac vagal system is operating near its physiological ceiling. Parasympathetic saturation can cause HRV to decline alongside resting heart rate, potentially masking the effects of behavioral perturbations on autonomic function.
RMSSD: the square root of the mean squared difference of adjacent NN intervals.
SDANN: the standard deviation of the average NN intervals (mean heart rate) for each of the 5-minute segments during a 24-hour recording.
SDNN: the standard deviation of the normal (NN) sinus-initiated IBI measured in milliseconds.
SDNN index (SDNNI): the mean of the standard deviations of all the NN intervals for each 5-minute segment of a 24-hour HRV recording.
SDRR: the standard deviation of the interbeat interval for all sinus beats measured in milliseconds, which predicts morbidity and mortality.
Triangular Interpolation of the NN Interval Histogram (TINN): the baseline width of a histogram displaying NN intervals.
vagal tank theory: a theoretical framework proposing that cardiac vagal control operates across three functional domains: resting (tonic level of vagal activity), reactivity (phasic vagal withdrawal in response to challenge), and recovery (phasic vagal rebound after challenge). The theory highlights that healthy autonomic function requires not only high resting vagal tone but also the capacity for appropriate vagal withdrawal and efficient recovery.
References
Andreassi, J. L. (2000). Psychophysiology: Human behavior and physiological response. Lawrence Erlbaum Associates.
Aubert, A. E., Seps, B., & Beckers, F. (2003). Heart rate variability in athletes. Sports Medicine, 33(12), 889–919. https://doi.org/10.2165/00007256-200333120-00003
Berntson, G. G., Quigley, K. S., & Lozano, D. (2007). Cardiovascular psychophysiology. In J. T. Cacioppo, L. G. Tassinary, & G. G. Berntson (Eds.), Handbook of psychophysiology (3rd ed.). Cambridge University Press.
Besson, C., Baggish, A. L., Monteventi, P., Schmitt, L., Stucky, F., & Gremeaux, V. (2025). Assessing the clinical reliability of short-term heart rate variability: Insights from controlled dual-environment and dual-position measurements. Scientific Reports, 15, Article 5611. https://doi.org/10.1038/s41598-025-89892-3
Billman, G. E., Schwartz, P. J., & Stone, H. L. (1982). Baroreceptor reflex control of heart rate: A predictor of sudden cardiac death. Circulation, 66(4), 874-880. https://doi.org/10.1161/01.cir.66.4.874
Burr, R. L., Motzer, S. A., Chen, W., Cowan, M. J., Shulman, R. J., & Heitkemper, M. M. (2006). Heart rate variability and 24-hour minimum heart rate. Biological Research for Nursing, 7(4), 256-267. https://doi.org/10.1177/1099800405285268
Ciccone, A. B., Siedlik, J. A., Wecht, J. M., Deckert, J. A., Nguyen, N. D., & Weir, J. P. (2017). Reminder: RMSSD and SD1 are identical heart rate variability metrics. Muscle & Nerve, 56(4), 674-678. https://doi.org/10.1002/mus.25573
Combatalade, D. (2010). Basics of heart rate variability applied to psychophysiology. Thought Technology.
DeGiorgio, C. M., Miller, P., Meymandi, S., Chin, A., Epps, J., Gordon, S., Gornbein, J., & Harper, R. M. (2010). RMSSD, a measure of vagus-mediated heart rate variability, is associated with risk factors for SUDEP: The SUDEP-7 Inventory. Epilepsy & Behavior, 19(1), 78-81. https://doi.org/10.1016/j.yebeh.2010.06.011
Flatt, A. A., & Esco, M. R. (2015). Smartphone-derived heart-rate variability and training load in a women's soccer team. International Journal of Sports Physiology and Performance, 10(8), 994–1000. https://doi.org/10.1123/ijspp.2014-0556
Flatt, A. A., & Esco, M. R. (2016). Evaluating individual training adaptation with smartphone-derived heart rate variability in a collegiate female soccer team. Journal of Strength and Conditioning Research, 30(2), 378–385. https://doi.org/10.1519/JSC.0000000000001095
Flatt, A. A., Hornikel, B., Nakamura, F. Y., & Esco, M. R. (2022). Effect of competitive status and experience on heart rate variability profiles in collegiate sprint-swimmers. Journal of Strength and Conditioning Research, 36(10), 2898–2904. https://doi.org/10.1519/JSC.0000000000003992
Flatt, A. A., & Howells, D. (2019). Effects of varying training load on heart rate variability and running performance among an Olympic rugby sevens team. Journal of Science and Medicine in Sport, 22(2), 222–226. https://doi.org/10.1016/j.jsams.2018.07.014
Gevirtz, R. N. (2017). Cardio-respiratory psychophysiology: Gateway to mind-body medicine.
Grosicki, G. J., Carter, J. R., Laursen, P. B., Plews, D. J., Altini, M., Galpin, A. J., Fielding, F., von Hippel, W., Chapman, C., Jasinski, S. R., Beattie, U. K., & Holmes, K. E. (2026). Heart rate variability coefficient of variation during sleep as a digital biomarker that reflects behavior and varies by age and sex. American Journal of Physiology–Heart and Circulatory Physiology, 330(1), H187–H199. https://doi.org/10.1152/ajpheart.00738.2025
Hämmerle, P., Eick, C., Blum, S., Schlageter, V., Bauer, A., Rizas, K. D., Eken, C., Coslovsky, M., Aeschbacher, S., Krisai, P., Meyre, P., Vesin, J.-M., Rodondi, N., Moutzouri, E., Beer, J., Moschovitis, G., Kobza, R., Di Valentino, M., Corino, V. D. A., Laureanti, R., . . . Swiss-AF Study Investigators (2020). Heart rate variability triangular index as a predictor of cardiovascular mortality in patients with atrial fibrillation. Journal of the American Heart Association, 9(15), Article e016075. https://doi.org/10.1161/JAHA.120.016075
Hill, L. K., & Siebenbrock, A. (2009). Are all measures created equal? Heart rate variability and respiration – biomed 2009. Biomedical Sciences Instrumentation, 45, 71-76. https://pubmed.ncbi.nlm.nih.gov/19369742
Jarczok, M. N., Koenig, J., & Thayer, J. F. (2021). Lower values of a novel index of vagal-neuroimmunomodulation are associated to higher all-cause mortality in two large general population samples with 18 year follow up. Scientific Reports, 11, 2554. https://doi.org/10.1038/s41598-021-82168-6
Jovic, A., & Bogunovic, N. (2011). Electrocardiogram analysis using a combination of statistical, geometric, and nonlinear heart rate variability features. Artificial Intelligence in Medicine, 51, 175-186. https://doi.org/10.1016/j.artmed.2010.09.005
Kleiger, R. E., Miller, J. P., Bigger, J. T., & Moss, A. J. (1987). Decreased heart rate variability and its association with increased mortality after acute myocardial infarction. American Journal of Cardiology, 59, 256-262. https://doi.org/10.1016/0002-9149(87)90795-8
Kurita, A., Takase, B., Kodani, E., Iwahara, S., Kusama, Y., & Atarashi, H. (2013). Prognostic value of heart rate variability in comparison with annual health examinations in very elderly subjects. Journal of Nippon Medical School, 80(6), 420–425. https://doi.org/10.1272/jnms.80.420
Laborde, S., Mosley, E., & Mertgen, A. (2018). Vagal tank theory: The three Rs of cardiac vagal control functioning – resting, reactivity, and recovery. Frontiers in Neuroscience, 12, Article 458. https://doi.org/10.3389/fnins.2018.00458
Lehrer, P. M. (2007). Biofeedback training to increase heart rate variability. In P. M. Lehrer, R. M. Woolfolk, & W. E. Sime (Eds.), Principles and practice of stress management (3rd ed.). The Guilford Press.
Lehrer, P. M., Vaschillo, E., & Vaschillo, B. (2000). Resonant frequency biofeedback training to increase cardiac variability: Rationale and manual for training. Applied Psychophysiology and Biofeedback, 25(3), 177-191. https://doi.org/10.1023/a:1009554825745
Moss, D. (2022). HRV biofeedback bootcamp. Association for Applied Psychophysiology and Biofeedback.
Nakamura, F. Y., Antunes, P., Nunes, C., Costa, J. A., Esco, M. R., & Travassos, B. (2020). Heart rate variability changes from traditional vs. ultra–short-term recordings in relation to preseason training load and performance in futsal players. Journal of Strength and Conditioning Research, 34(10), 2974–2981. https://doi.org/10.1519/JSC.0000000000002910
Nunan, D., Sandercock, G. R. H., & Brodie, D. A. (2010). A quantitative systematic review of normal values for short-term heart rate variability in healthy adults. Pacing and Clinical Electrophysiology, 33(11), 1407-1417. https://doi.org/10.1111/j.1540-8159.2010.02841.x
Penttilä, J., Helminen, A., Jartti, T., Kuusela, T., Huikuri, H. V., Tulppo, M. P., Coffeng, R., & Scheinin, H. (2001). Time domain, geometrical and frequency domain analysis of cardiac vagal outflow: Effects of various respiratory patterns. Clinical Physiology, 21, 365-376. https://doi.org/10.1046/j.1365-2281.2001.00337.x
Plews, D. J., Laursen, P. B., Kilding, A. E., & Buchheit, M. (2012). Heart rate variability in elite triathletes, is variation in variability the key to effective training? A case comparison. European Journal of Applied Physiology, 112(11), 3729–3741. https://doi.org/10.1007/s00421-012-2354-4
Plews, D. J., Laursen, P. B., Stanley, J., Kilding, A. E., & Buchheit, M. (2013). Training adaptation and heart rate variability in elite endurance athletes: Opening the door to effective monitoring. Sports Medicine, 43(9), 773–781. https://doi.org/10.1007/s40279-013-0071-8
Razanskaite-Virbickiene, D., Danyte, E., Mockeviciene, G., Dobrovolskiene, R., Verkauskiene, R., & Zalinkevicius, R. (2017). Can coefficient of variation of time-domain analysis be valuable for detecting cardiovascular autonomic neuropathy in young patients with type 1 diabetes: A case control study. BMC Cardiovascular Disorders, 17(1), Article 34. https://doi.org/10.1186/s12872-016-0467-0
Sammito, S., Thielmann, B., Klussmann, A., Deußen, A., Braumann, K.-M., & Böckelmann, I. (2024). Guideline for the application of heart rate and heart rate variability in occupational medicine and occupational health science. Journal of Occupational Medicine and Toxicology, 19, Article 15. https://doi.org/10.1186/s12995-024-00414-9
Schipke, J. D., Arnold, G., & Pelzer, M. (1999). Effect of respiration rate on short-term heart rate variability. Journal of Clinical and Basic Cardiology, 2, 92-95.
Schwartz, P. J., Vanoli, E., Stramba-Badiale, M., De Ferrari, G. M., Billman, G. E., & Foreman, R. D. (1988). Autonomic mechanisms and sudden death. New insights from analysis of baroreceptor reflexes in conscious dogs with and without a myocardial infarction. Circulation, 78(4), 969-979. https://doi.org/10.1161/01.cir.78.4.969
Shaffer, F., & Ginsberg, J. P. (2017). An overview of heart rate variability metrics and norms. Frontiers in Public Health, 5, Article 258. https://doi.org/10.3389/fpubh.2017.00258
Shaffer, F., McCraty, R., & Zerr, C. L. (2014). A healthy heart is not a metronome: An integrative review of the heart's anatomy and heart rate variability. Frontiers in Psychology, 5, Article 1040. https://doi.org/10.3389/fpsyg.2014.01040
Shaffer, F., Meehan, Z. M., & Zerr, C. L. (2020). A critical review of ultra-short-term heart rate variability norms research. Frontiers in Neuroscience, 14, Article 594880. https://doi.org/10.3389/fnins.2020.594880
Sugimoto, K., Miyaoka, H., Sozu, T., Watanabe, Y., Tamura, A., Yamazaki, T., Ohta, S., Suzuki, S., Shimbo, T., & Hoshino, T. (2024). Associations of age-adjusted coefficient of variation of R-R intervals with autonomic and peripheral nerve function in non-elderly persons with diabetes. Journal of Diabetes Investigation, 15(2), 186–196. https://doi.org/10.1111/jdi.14094
Tarvainen, M. P., & Niskanen, J.-P. (2017). Kubios HRV version 3.0 user's guide. University of Eastern Finland.
Task Force of the European Society of Cardiology and the North American Society of Pacing and Electrophysiology (1996). Heart rate variability: Standards of measurement, physiological interpretation, and clinical use. Circulation, 93, 1043-1065. https://pubmed.ncbi.nlm.nih.gov/8598068
Umetani, K., Singer, D. H., McCraty, R., & Atkinson, M. (1998). Twenty-four hour time domain heart rate variability and heart rate: Relations to age and gender over nine decades. Journal of the American College of Cardiology, 31(2), 593-601. https://doi.org/10.1016/s0735-1097(97)00554-8
Voss, A., Schroeder, R., Heitmann, A., Peters, A., & Perz, S. (2015). Short-term heart rate variability—Influence of gender and age in healthy subjects. PLOS ONE, 10(3), Article e0118308. https://doi.org/10.1371/journal.pone.0118308
Zerr, C., Kane, A., Vodopest, T., Allen, J., Fluty, E., Gregory, J., . . . Shaffer, F. (2014). Heart rate variability norms for healthy undergraduates [Abstract]. Applied Psychophysiology and Biofeedback, 39(3), 300. https://doi.org/10.1007/s10484-014-9254-9
Return to Top