Resonance Frequency Assessment
What You Will Learn
Your cardiovascular system has a "sweet spot," a specific breathing rate where it responds with maximum power. Finding that rate is one of the most important skills in HRV biofeedback. This chapter walks you through the science and practice of resonance frequency assessment, the process of identifying the unique breathing rate at which your client's cardiovascular system produces its strongest oscillations.
You will learn the stepped and sliding protocols for measuring resonance frequency, how to select the optimal rate using multiple converging criteria, and how to fine-tune your estimate during training sessions. You will see how Fisher and Lehrer and Optimal HRV have reduced the number of criteria from six to one or two HRV metrics. Along the way, you will explore alternative assessment methods for distance training, discover when and why ECG outperforms PPG for this measurement, and examine unanswered research questions that may reshape how we approach RF assessment in the future.
What Is the Resonance Frequency?
The resonance frequency is theorized to be a fixed characteristic of an adult's cardiovascular system that reflects the blood volume in the vascular tree (Vaschillo et al., 2002, 2006).

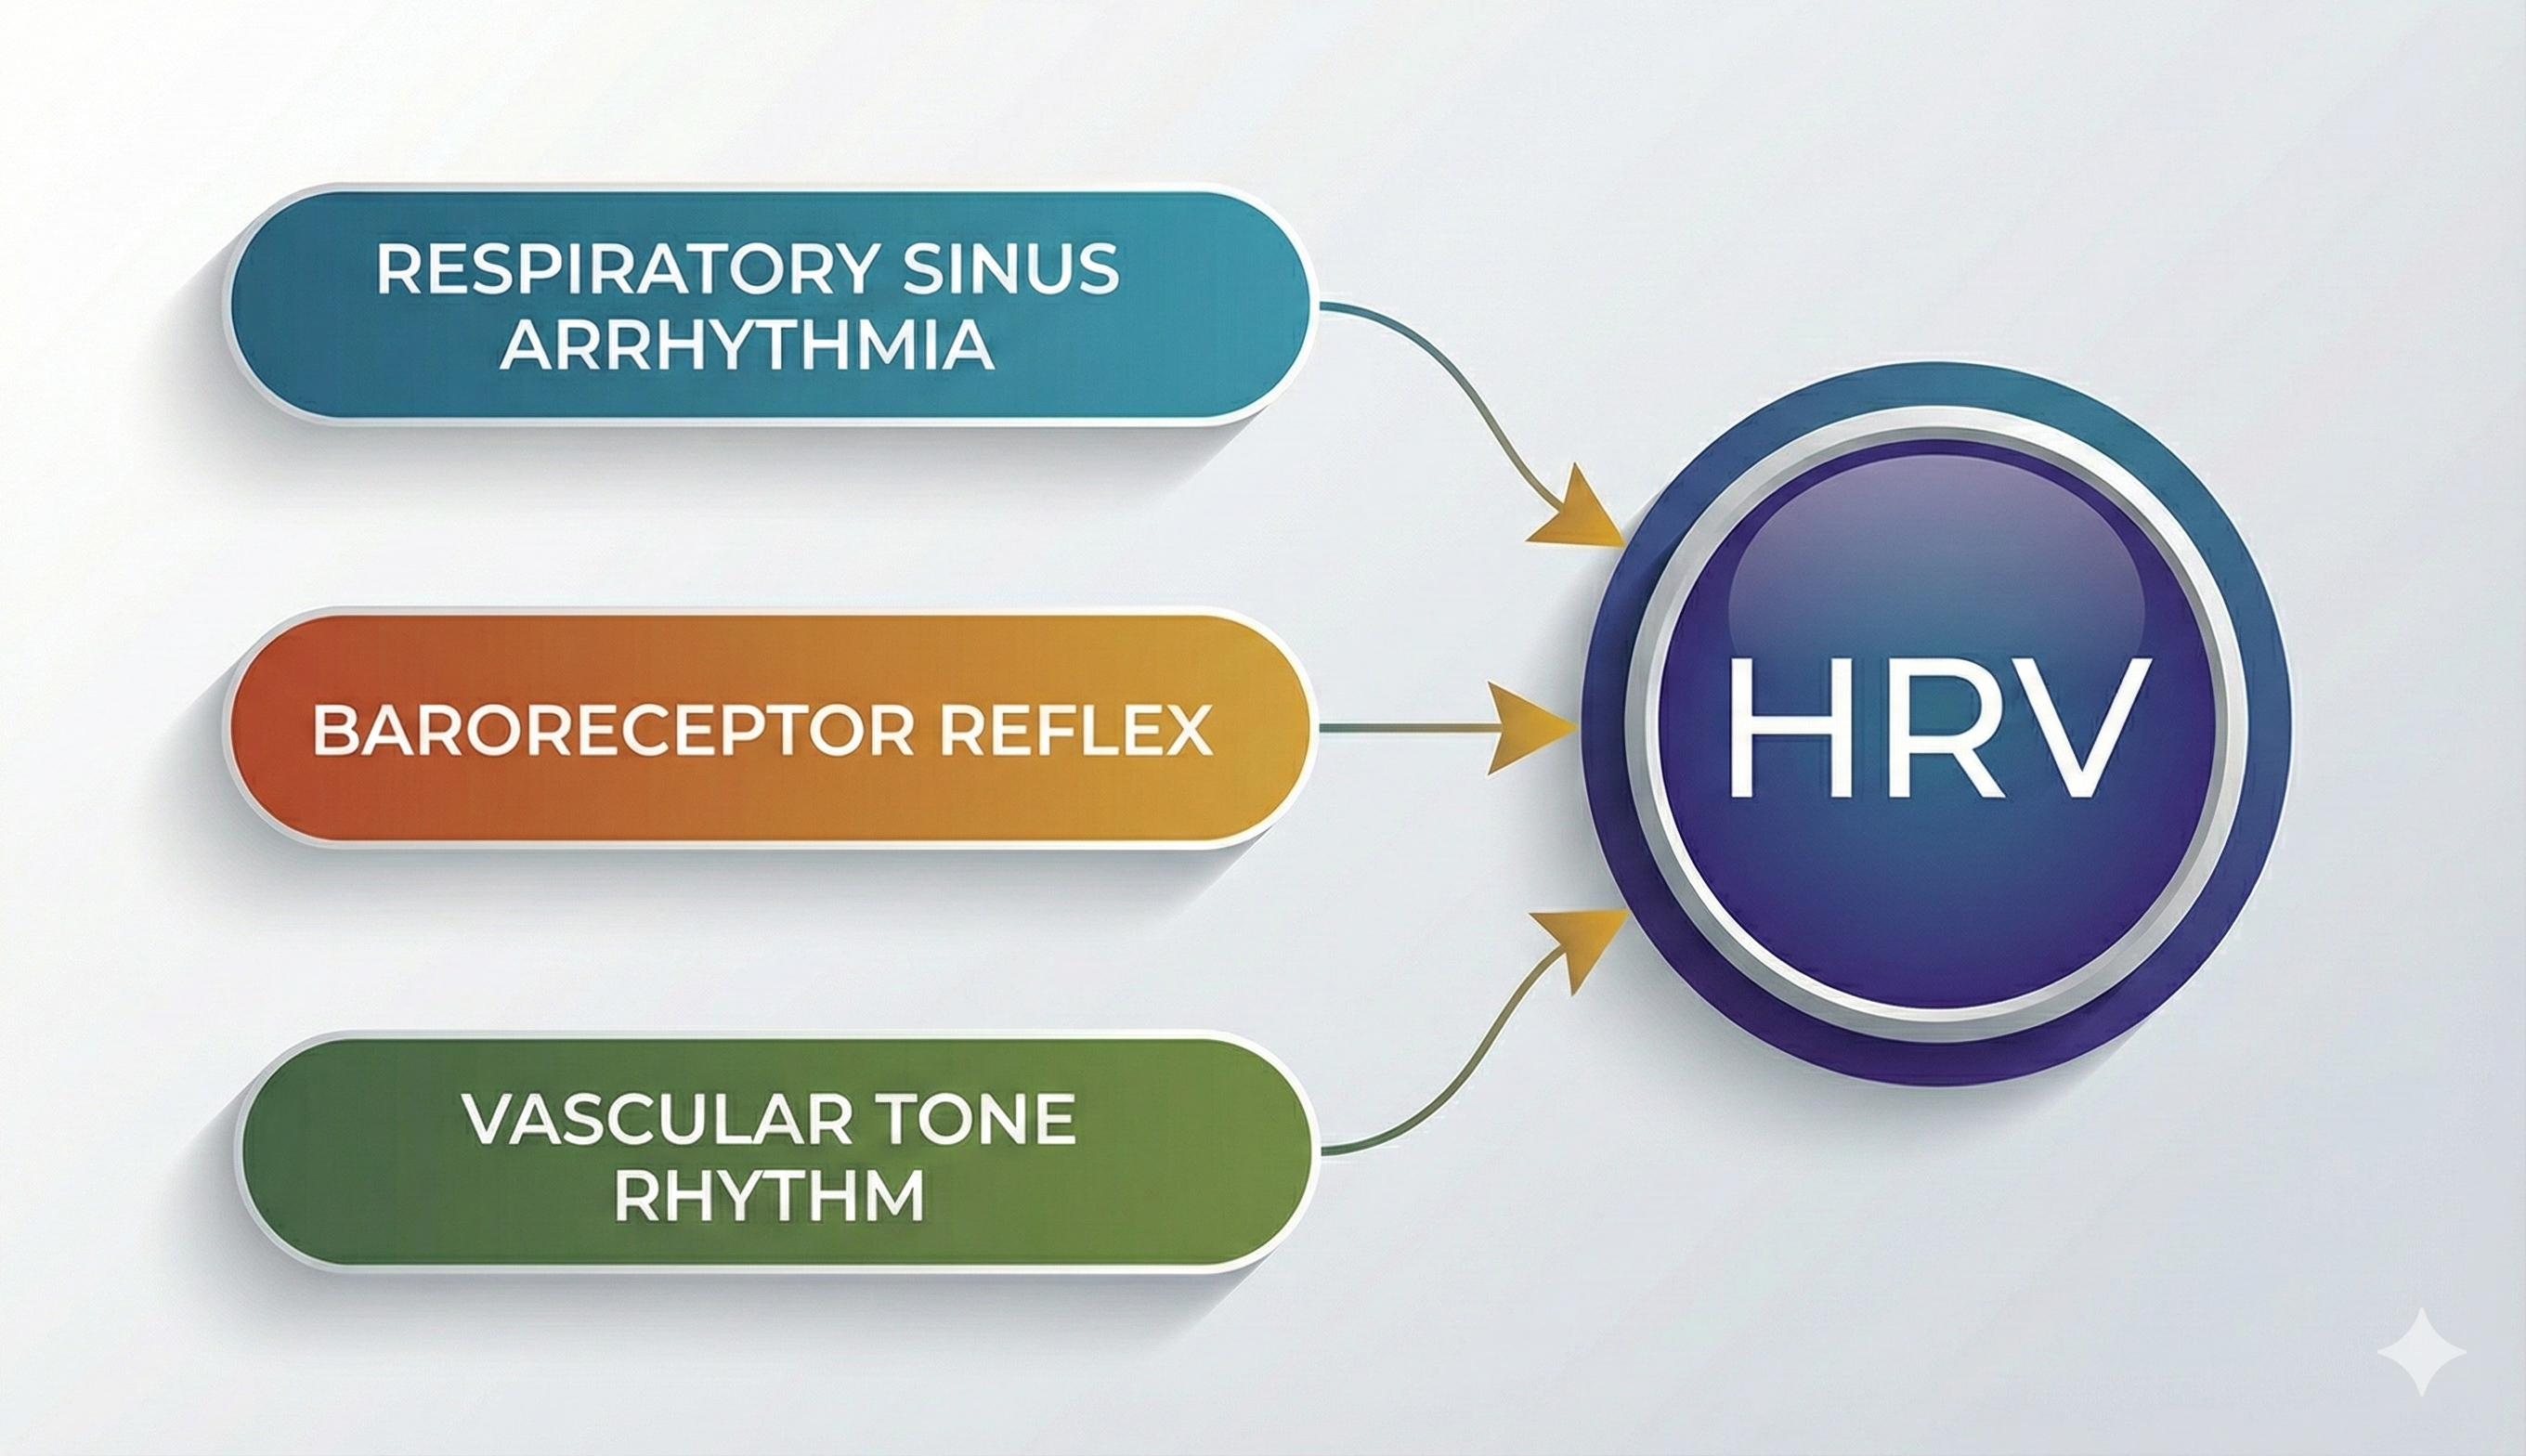
This section introduces the concept of resonance frequency and explains why it matters for HRV biofeedback practice. Every adult cardiovascular system is theorized to have a characteristic resonance frequency (RF)—a specific rate of stimulation at which the system produces its largest heart rate oscillations.
Slow Breathing Amplifies Your Heart's Natural Rhythm
Your heart doesn't beat like a metronome. It speeds up slightly when you inhale and slows down when you exhale. This elegant fluctuation is called respiratory sinus arrhythmia (RSA), and it is one of the primary engines of heart rate variability.
Since HRV simply measures the variation in time between successive heartbeats, anything that increases the size of these oscillations will increase your overall HRV. Slow-paced breathing (SPB) is one of the most reliable ways to amplify RSA and, in turn, boost HRV.
Resonance Frequency Breathing Recruits the Baroreflex
RSA is not the only system that can drive large heart rate swings. Your baroreflex, the feedback loop that senses blood pressure changes and adjusts heart rate and vascular tone in response, is another powerful contributor. Under normal resting conditions, RSA and the baroreflex operate at different frequencies, so they work somewhat independently of each other.
Something remarkable happens when you slow your breathing to roughly 4.5 to 7 breaths per minute (around 0.1 Hz). At that pace, your breathing rhythm locks onto the natural rhythm of the baroreflex system. The large blood pressure swings produced by each slow breath powerfully stimulate the baroreceptors, which trigger massive compensatory oscillations in both heart rate and vascular tone.
This synchronization is the basis of resonance frequency breathing. When respiration and the baroreflex are phase-locked, the result is dramatically amplified heart rate oscillations and a significant increase in total HRV.
The Baroreflex Contributes to HRV Even When You Are Not Thinking About Your Breathing
HRV is not driven by a single mechanism. It reflects the combined output of multiple physiological control systems operating at different frequencies. RSA primarily drives heart rate fluctuations in the high-frequency (HF) band, typically between 0.15 and 0.40 Hz.
The baroreflex and the resulting Mayer waves, which are slow blood pressure oscillations reflecting vascular tone regulation, operate in the low-frequency (LF) band around 0.1 Hz. While slow breathing can synchronize these systems with RSA, the baroreflex does not need your breathing to do its job. It works continuously in the background to maintain blood pressure homeostasis regardless of your respiratory rate.
This means the heart rate adjustments driven by the baroreflex generate their own contribution to HRV that is completely independent of RSA. Even at rest with no conscious breathing control, your baroreflex is creating variability in your heart rate all on its own.
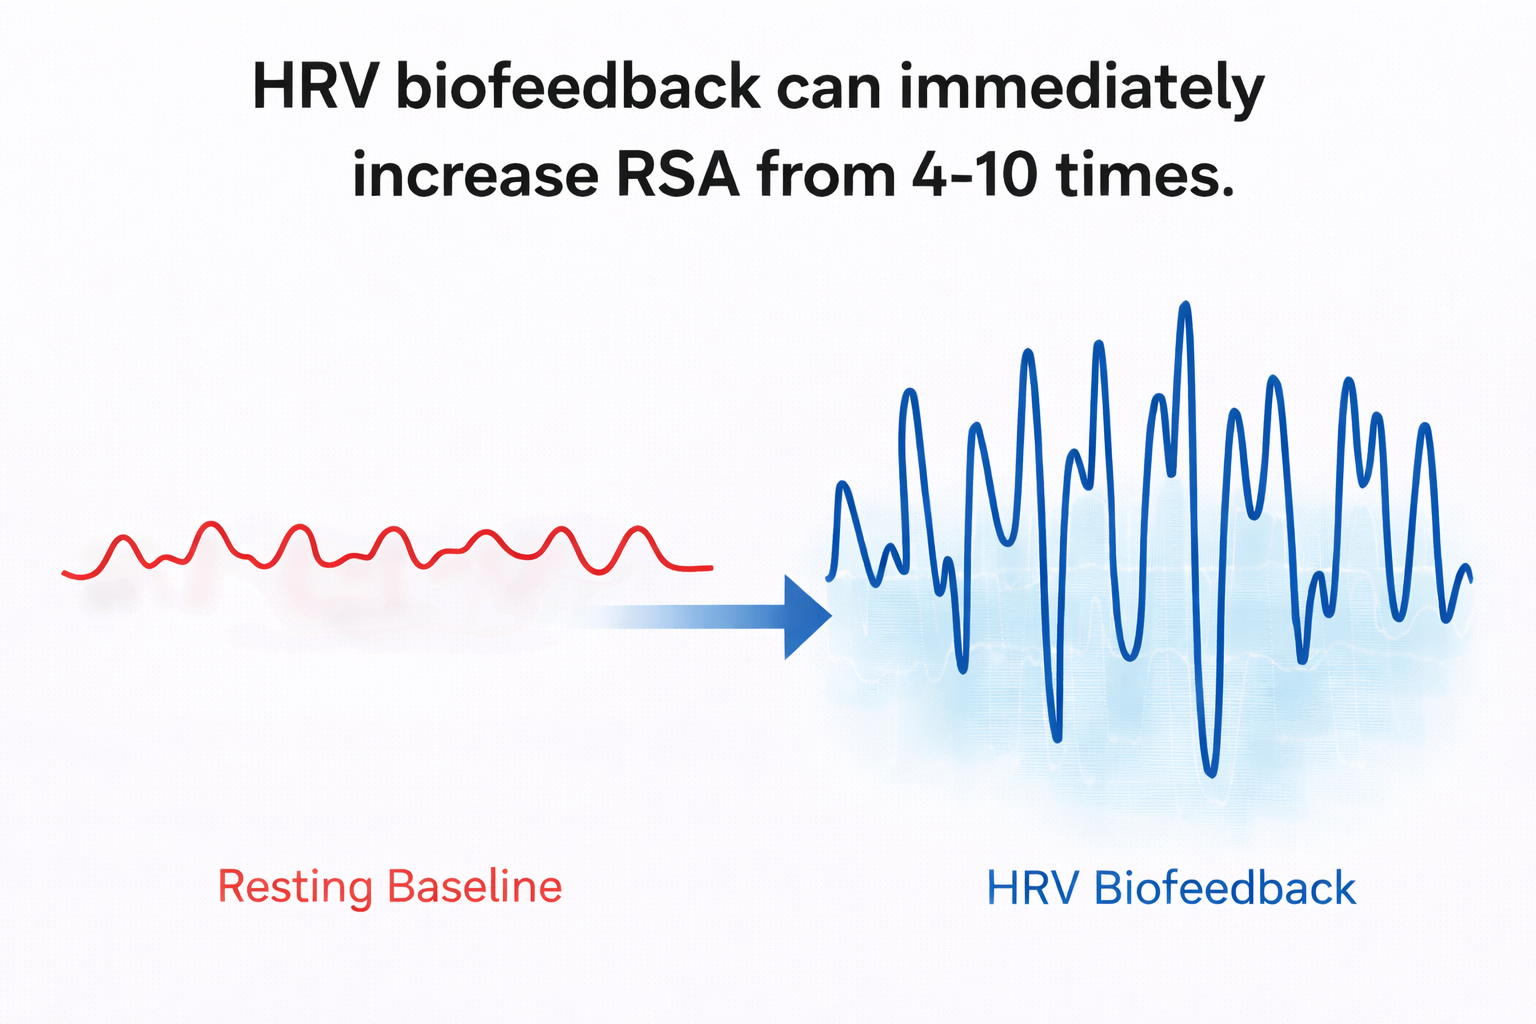
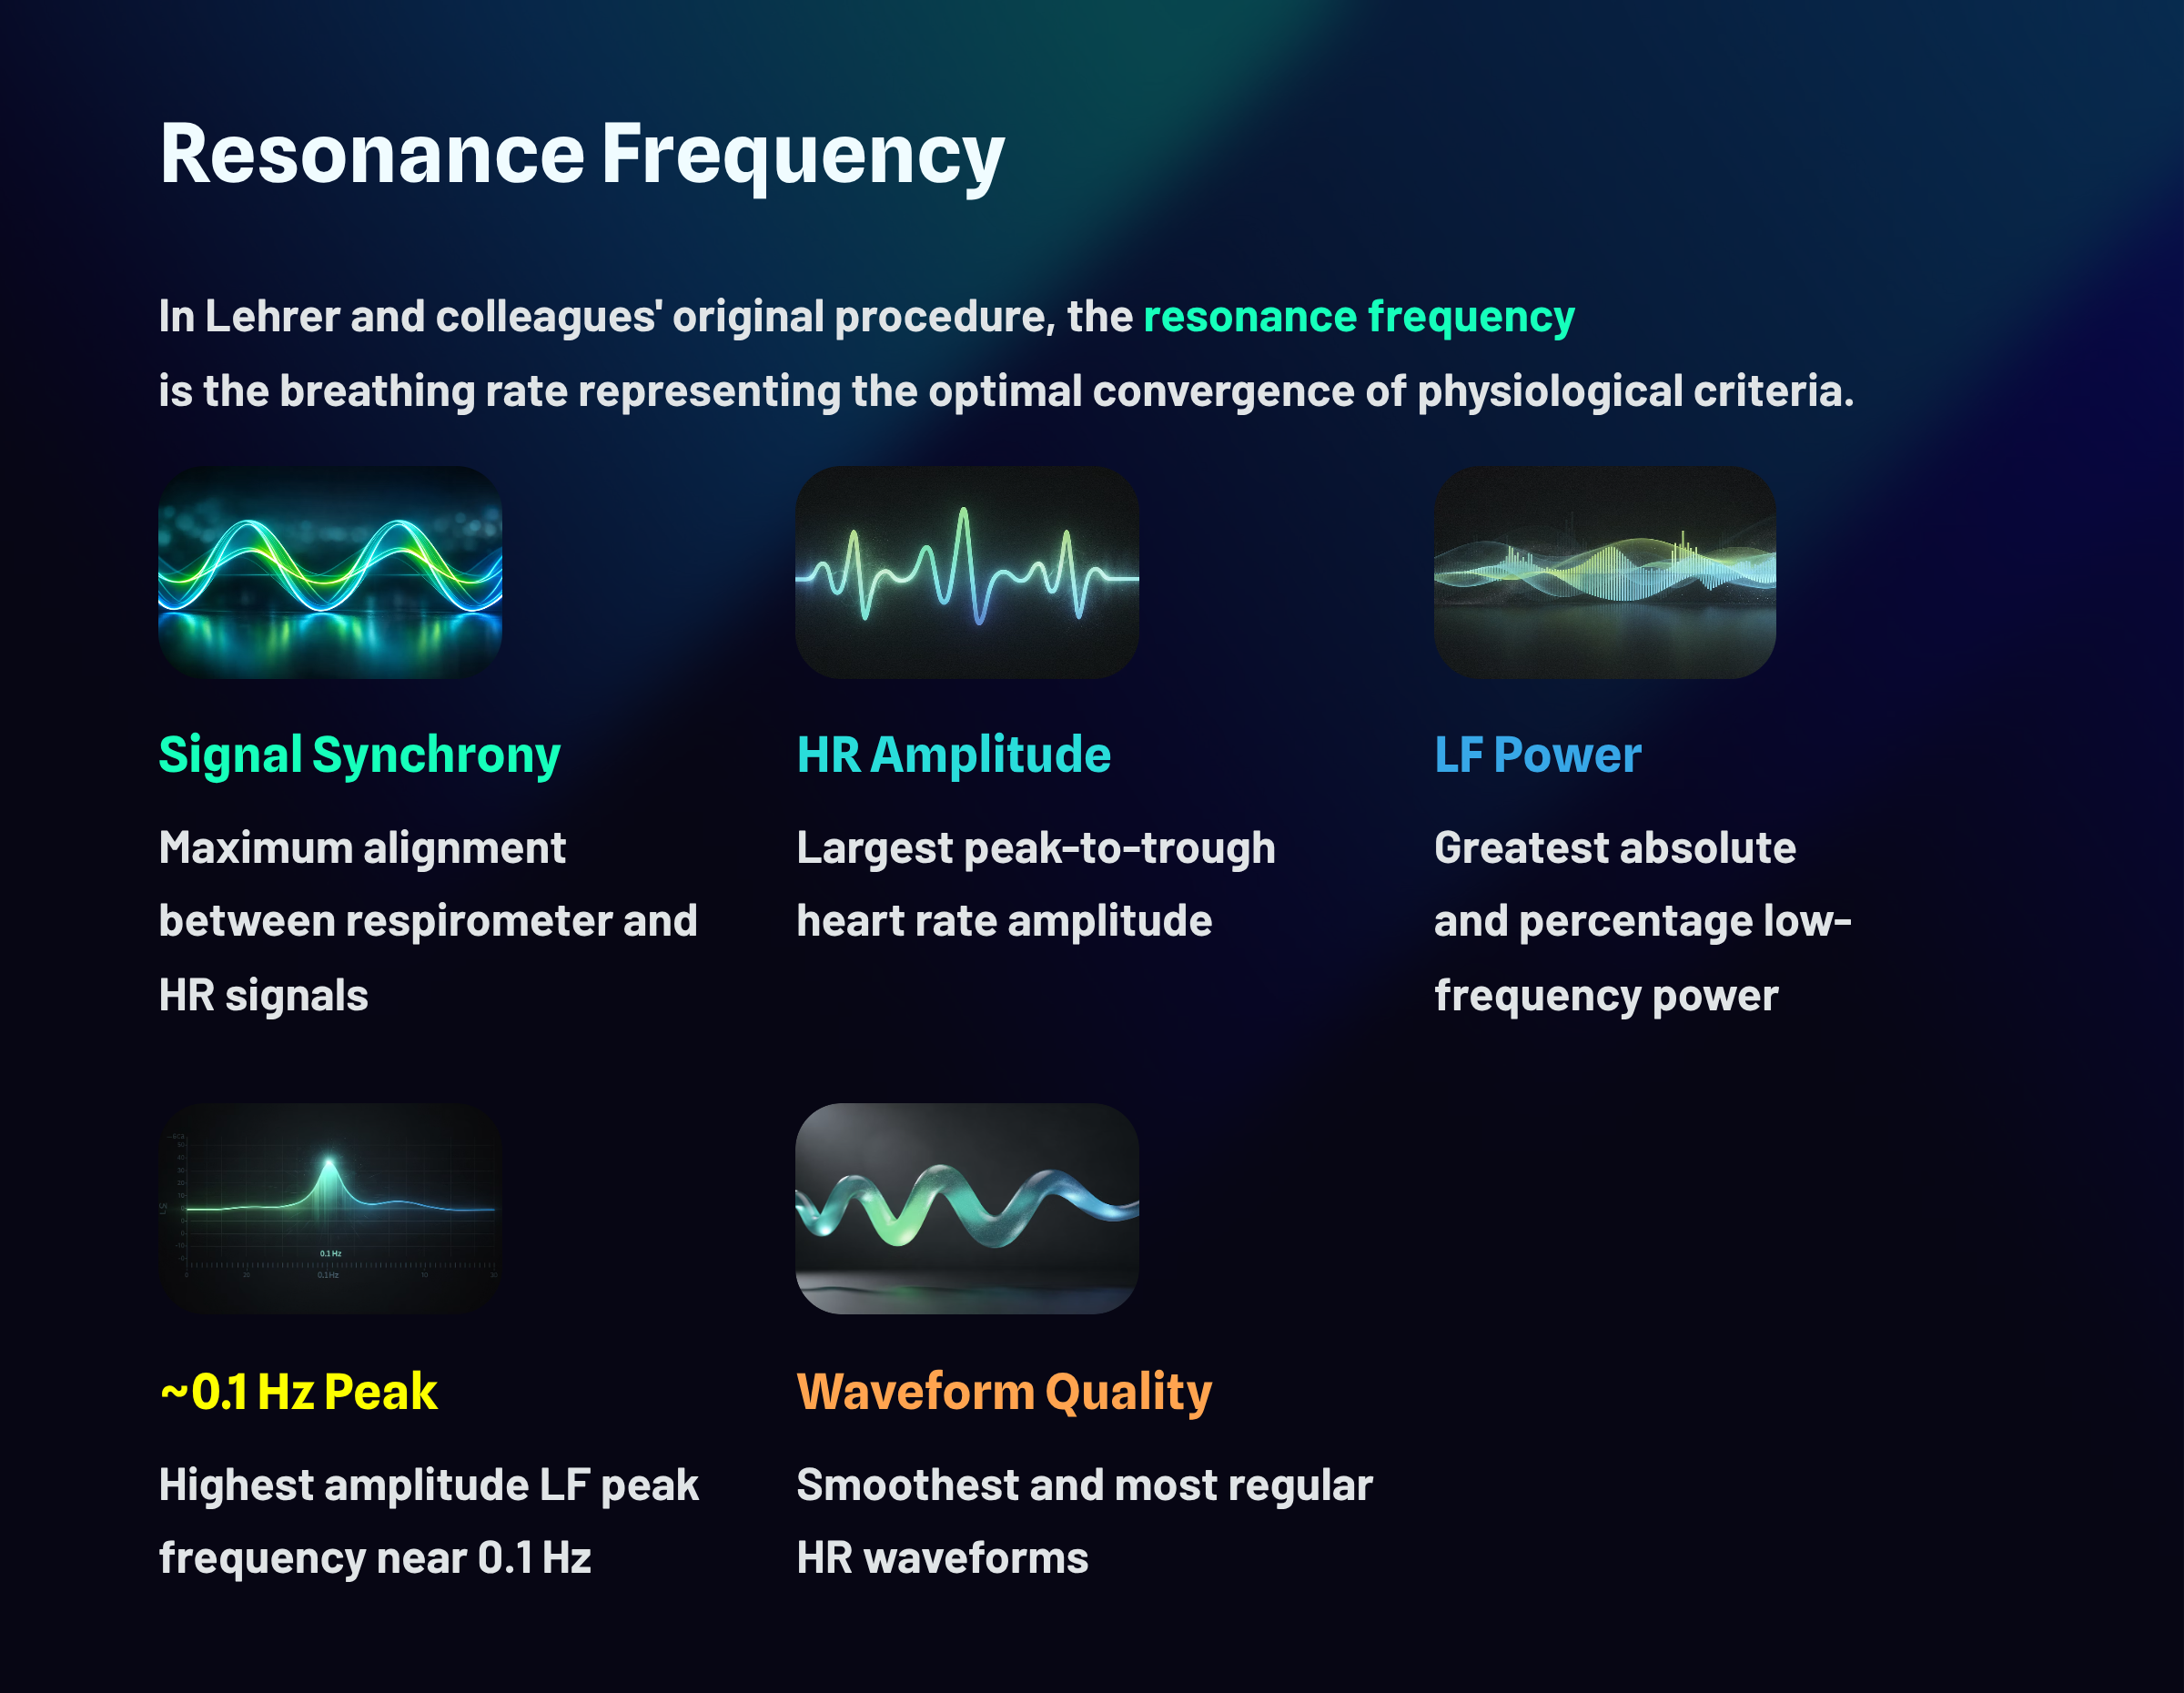
The RF is the breathing or muscle contraction rate at which the cardiovascular system produces the greatest RSA amplitudes, HRV, and baroreflex gain—the magnitude of heart rate (HR) change per 1 mmHg change in blood pressure (BP; Lehrer, Vaschillo, & Vaschillo, 2000; Lehrer & Gevirtz, 2014). Think of it like pushing a child on a swing: push at exactly the right rhythm and you get maximum height with minimal effort. Push too fast or too slow and the effect diminishes. This is the same principle that governs resonance in the cardiovascular system.
The mechanisms underlying this amplification are complex and involve multiple interacting processes. As Lehrer and Gevirtz (2014) explained, the effect arises from a confluence of phase relationships between heart rate oscillations and blood pressure oscillations at specific frequencies, phase relationships between heart rate and breathing, activity of the baroreflex, and the inherent resonance characteristics of the cardiovascular system itself. The practical payoff is substantial: breathing at the RF can amplify RSA by 4 to 10 times compared to resting levels (Vaschillo et al., 2002; Lehrer et al., 2020b), as illustrated in the graphic below adapted from Gevirtz et al. (2016).
🎧 Mini-Lecture: Resonance Frequency
RF assessment aims to identify the approximate stimulation rate that produces the strongest resonance effects (RSA).
The RF model assumes that the RF ranges between 4.5 and 6.5 breaths per minute (bpm) for adults and 6.5 to 9.5 bpm for children, and that training near a client's RF will produce the greatest RSA and HRV (Lehrer et al., 2013; Lehrer & Gevirtz, 2014). For clinicians working with diverse populations—from veterans managing PTSD to athletes seeking performance gains—this means that one of the first steps in effective HRV biofeedback is identifying each client's unique RF. The remainder of this chapter explains exactly how to do that.
The resonance frequency is each individual's unique breathing rate, typically between 4.5 and 6.5 breaths per minute for adults, at which their cardiovascular system produces maximal RSA, HRV, and baroreflex gain. Think of it like finding the perfect frequency for pushing a child on a swing: at just the right timing, you get maximum height with minimal effort. SPB at or near the RF can amplify RSA by 4 to 10 times compared to resting levels. The RF is a fixed characteristic of the cardiovascular system that reflects blood volume in the vascular tree.
Appreciation
Lehrer et al. (2013) developed the original RF measurement protocol. We recommend their excellent article on HRV biofeedback training in Biofeedback.
We also enthusiastically recommend Lehrer and Gevirtz's Frontiers HRV biofeedback overview.
Didier Combatalade, Director of Clinical Interface at Thought Technology Ltd., provided invaluable technical support in measuring the phase relationship between respirometer and heart rate signals using BioGraph Infiniti software.

BCIA Blueprint Coverage
This unit addresses V. HRV Biofeedback Strategies: C. How to measure the resonance frequency.
Professionals completing this unit will be able to discuss the meaning of resonance frequency and resonance frequency assessment.
This unit covers the Resonance Frequency Measurement Protocols, Fine-Tuning the Resonance Frequency, An Alternative Method to Find the Resonance Frequency, and Unanswered Questions.
🎧 Listen to the Full Chapter Lecture
Resonance Frequency Measurement Protocols
Start with Breathing Assessment
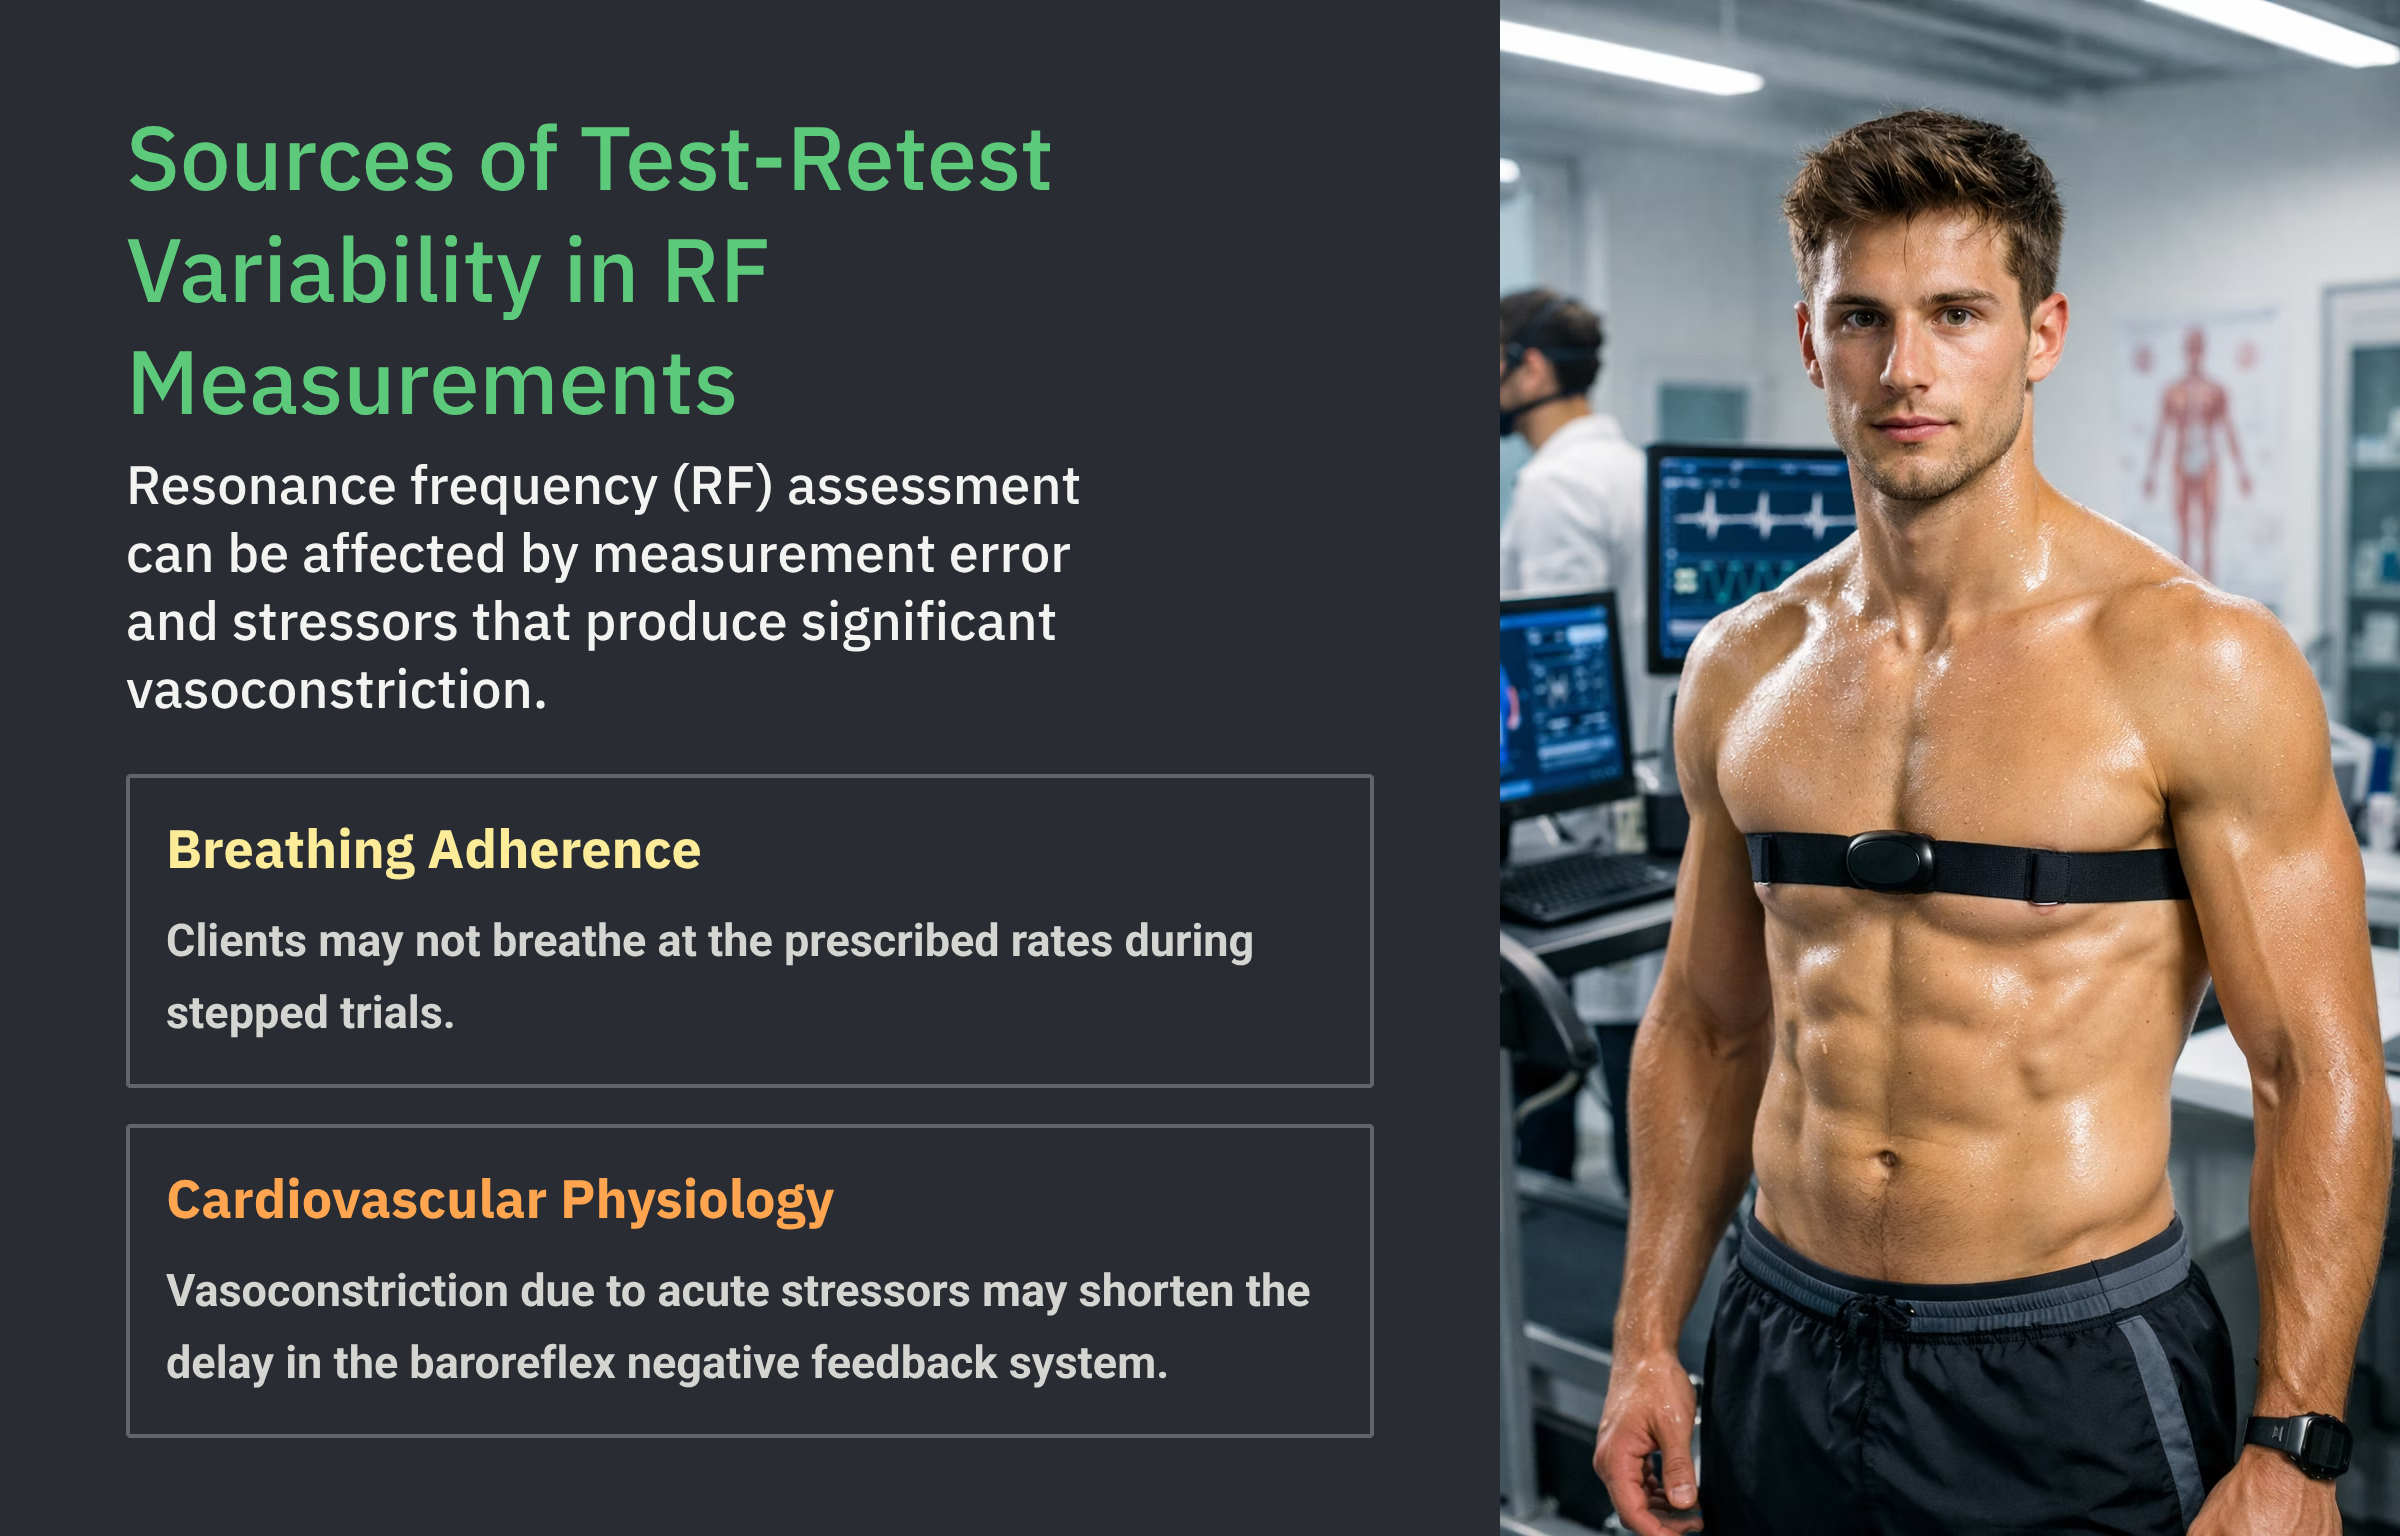
This section covers the essential prerequisites for RF assessment, beginning with why breathing assessment must come first. RF measurement protocols require clients to breathe continuously and smoothly at slower-than-typical rates—well below the healthy resting adult range of 12 to 20 bpm (Khazan, 2019a). Research participants often find breathing consistently at 6 bpm challenging, let alone at 4.5, 5.0, or 5.5 bpm.
For example, Steffen and colleagues (2021) reported "The participants in the 6 breath per minute pacer condition were unable to consistently breathe at that rate and averaged about 12 breaths per minute."
Valid RF assessment not only requires SPB but also consistent breathing at each target respiration rate (RR). Failure to "lock in" each breathing rate can reduce resonance effects and threaten the validity of RF calculations. When this happens, critics of RF protocols may conclude that the RF is not a stable individual characteristic. The jury is still out on this question.
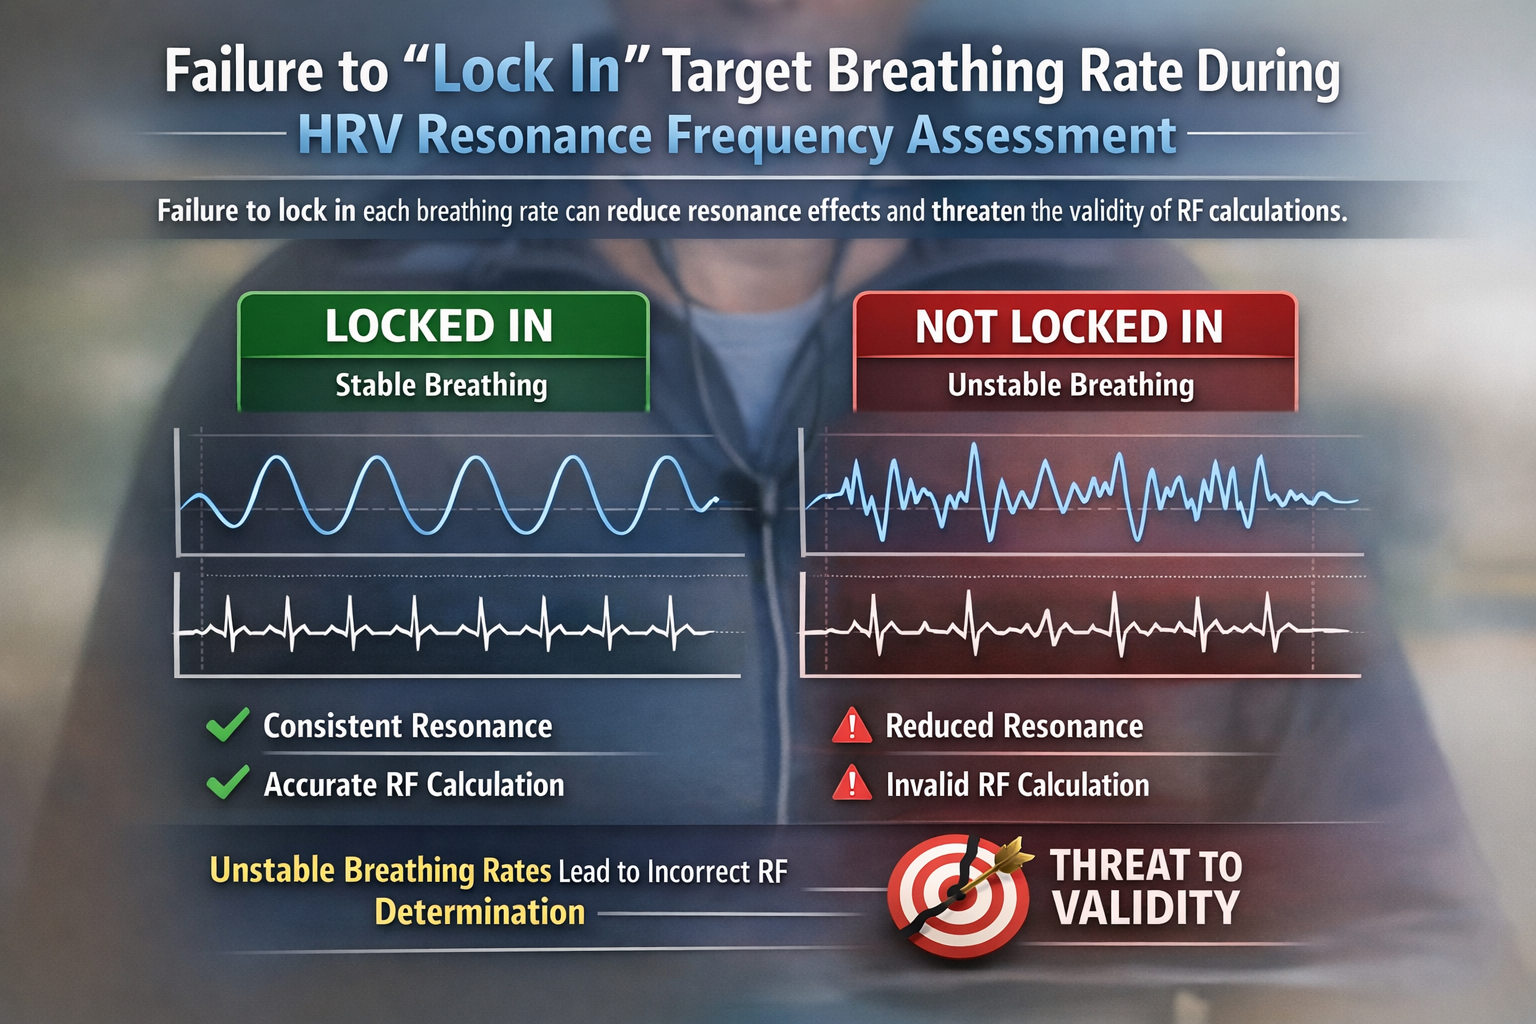
Breathing assessment can reveal rapid breathing and dysfunctional behaviors that would interfere with accurate RF determination. Conditions such as asthma, chronic pain, Generalized Anxiety Disorder, and behaviors like overbreathing are all associated with elevated respiratory rates that make SPB difficult.
The clinical bottom line is straightforward: postpone RF assessment for adults until you have successfully trained them to breathe effortlessly between 4.5 and 6.5 bpm (Peper et al., 2008). Attempting the protocol before a client can sustain these rates wastes session time and risks producing unreliable data. For clinicians in hospital or VA settings who may face time pressure, investing in this foundational skill during early sessions pays dividends when the RF assessment proceeds smoothly.
Resonance Frequency Assessment Concerns and Contraindications
This section addresses safety considerations that every clinician must evaluate before proceeding with RF assessment. Some clients may find SPB difficult and may overbreathe, expelling excessive CO2. If they report feeling faint or experiencing rapid heartbeats, encourage them to take shallower and smoother breaths (Lehrer et al., 2013). These symptoms typically resolve quickly with this simple adjustment.
Two populations are contraindicated for RF assessment. First, clients whose sinus rhythm is continuously driven by a pacemaker should not be assessed because the device externally regulates HRV, making the measurement meaningless. Second, clients whose rapid breathing compensates for metabolic acidosis due to kidney disease or respiratory acidosis due to chronic obstructive pulmonary disease (COPD), should not slow their breathing. Slowing respiration in these individuals would increase CO2 levels and dangerously worsen blood acidity (Khazan, 2013). When in doubt, consult the client's physician before proceeding.
Sensor Channels and Parameters Monitored
This section covers the equipment needed for RF assessment and explains when to choose one sensor type over another. Resonance frequency measurement requires the real-time display of two signals: instantaneous HR and respiration. The quality of your data depends entirely on the quality of these signals, so understanding each sensor's strengths and limitations is essential for reliable assessment.
ECG or PPG Methods
Clinicians monitor HR using either an electrocardiograph (ECG) or a photoplethysmograph (PPG). Under resting conditions with healthy blood flow, these two sensor types obtain similar interbeat interval (IBI) values—the time between successive heartbeats (Giardino et al., 2002; Schafer & Vagedes, 2013). However, this equivalence breaks down during SPB. PPG monitoring from the toes, thumb, and earlobes increasingly lags behind the ECG as breathing slows, and this phase delay is symmetrical between corresponding recording sites such as the left and right index fingers (Allen, 2019).
The clinical implications are important. While PPG earlobe recordings agree with ECG measurements during resting conditions after 1 minute of deep breathing (Weinschenk et al., 2016), PPG may be less accurate during the sustained SPB that RF assessment demands (Jan et al., 2019). Sympathetic activation further compounds this problem: disorders such as anxiety produce peripheral vasoconstriction that weakens the PPG pulse signal from the digits. ECG detection of R-spikes from the chest, torso, or wrists is unaffected by vasoconstriction (Giardino et al., 2002; Schafer & Vagedes, 2013; Shaffer & Combatalade, 2013).
To determine which method to use, examine the raw PPG waveform before beginning the protocol. If it appears flat or low-amplitude, switch to the ECG (Shaffer & Combatalade, 2013). This is especially relevant for clinicians working with anxious populations in VA or clinical settings, where vasoconstriction is common. In summary, ECG is the more reliable choice for RF assessment, particularly when clients are anxious, have poor peripheral circulation, or when phase synchrony between HR and respiration is a primary selection criterion.
Respirometer
The respiratory signal is equally critical to the assessment. Clinicians use a respirometer—a flexible sensor band worn around the abdomen or thorax that changes resistance as it expands and contracts during breathing—to detect the respiratory waveform (Shaffer & Moss, 2019). As adults breathe from 6.5 to 4.5 bpm in 0.5-bpm steps during the protocol, a respirometer serves three essential functions: pacing the client at the prescribed rate, confirming the actual RR for each trial, and identifying dysfunctional breathing patterns such as apnea or overbreathing.
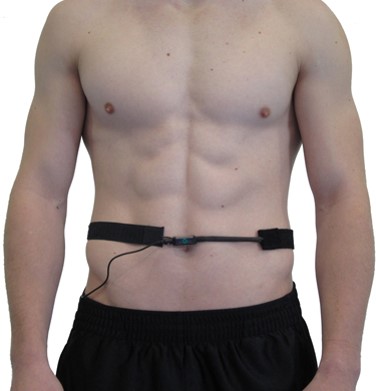
The confirmation function deserves emphasis. We cannot evaluate the effects of breathing at 5.5 bpm if a client actually breathed at 6 bpm—the data from that trial would be attributed to the wrong frequency. Without a respirometer, there is no objective quality control over breathing rate. Beyond rate confirmation, the respirometer also detects dysfunctional behaviors like apnea (breath-holding) and overbreathing (excessive CO2 loss) that can interfere with HRV biofeedback.
Throughout the assessment, clinicians should continuously monitor all raw waveforms—both the ECG or PPG and the respirometer—for artifacts (false values caused by movement, sensor malfunction, or signal interference). Detecting artifacts in real time allows you to immediately repeat any failed trial, rather than discovering invalid data after the session ends.
RF assessment requires real-time display of instantaneous HR and respiration. ECG and PPG sensors produce comparable IBI values at rest, but PPG increasingly lags behind ECG during SPB, especially from finger and toe sites. Anxiety-related vasoconstriction can further compromise PPG accuracy. The respirometer serves three functions: pacing the client, confirming the actual RR, and identifying dysfunctional breathing. Always monitor raw waveforms for artifacts during each trial so invalid epochs can be repeated immediately.
Orientation for RF Assessment
Clear client orientation sets the stage for a successful assessment. The resonance frequency assessment protocol (Lehrer et al., 2013) provides intuitive directions that you can adapt to each client's level of understanding. Begin by explaining the sensors and what the displays show:
"Today, I am going to introduce you to a method that will help you control your symptoms. We will be using a number of measuring devices, and wearing them may feel a little strange in the beginning. This introduction will allow you to become familiar with what it feels like to wear the sensors, and to watch the body signals they are measuring on the screen, before we start your biofeedback training. I will attach all of the sensors to your body and then you will see what they are measuring on your monitor. These sensors will simply be measuring your physiological activity and will not cause any harm to you. I will briefly explain what each measurement is" (p. 98). Attach and test each sensor, start displaying physiological activity, and explain the meaning of the graphs and numerical values. For example: "In this top graph, the red line is your heart rate in terms of beats per minute, and the blue line shows your breathing. You'll notice that the blue line moves up as you breathe in and down as you breathe out" (p. 99).
After inviting questions, provide a brief overview of the assessment procedure. Adjust the complexity of your explanation to match each client's background—a veteran with prior biofeedback exposure will need less orientation than a first-time client (Lehrer et al., 2013):
"Today we are going to find out the speed of breathing that should best help you to cope with your symptoms. This breathing frequency is different for each person. When you breathe at this rate, your breathing will produce strong effects on your nervous and cardiovascular systems that should be very good for you and should help you to control your symptoms" (p. 99). "Your heart rate varies with each breath, and with various other processes in your body, including the baroreflex. This variability is good and is a sign of health. We will now find your 'resonance frequency' – the speed of breathing at which your HRV is the highest. In this task, we will ask you to breathe at five rates for periods of about 2 min each. You should not find this task difficult. However, if you feel uncomfortable at any time, you can simply stop the task and tell us. When we begin, we will ask you to breathe in and out at a 10-s breathing rate. Then we will ask you to breathe at various other rates, so we can find the exact frequency at which your cardiovascular system resonates. This will be your own resonance breathing frequency. You will be able to use this breathing rate to best help your symptoms. Breathe easily and comfortably, but not too deeply. Do not try too hard. Do you have any questions?" (p. 99).
Practice Breathing Trials
Before beginning the formal RF trials, provide your client with breathing practice. This precaution is crucial because the protocol requires rates that are less than half the typical resting respiratory rate. Clinical populations such as chronic pain patients may find these rates particularly challenging.
Allow clients to practice healthy breathing from 5.5 to 6 bpm before starting RF trials. When a specific rate proves difficult, instruct them to adjust by 0.5-bpm increments. For example, if a client typically breathes at 18 bpm, guide them to decrease their rate gradually—from 18 to 17.5 to 17 bpm, and so on—until they reach the target range comfortably.
Standardize the inhalation-to-exhalation (I-E) ratio across all breathing trials. Although Lehrer and colleagues (2013) recommended longer exhalation than inhalation during RF assessment, several studies (Meehan et al., 2017; Zerr et al., 2015) found no significant difference in HRV metrics such as HR Max-HR Min, pNN50, RMSSD, SDNN, and LF power between 1:1 and 1:2 I-E ratios. What matters most is consistency: use the same ratio across all trials so that breathing pattern does not become a confound.
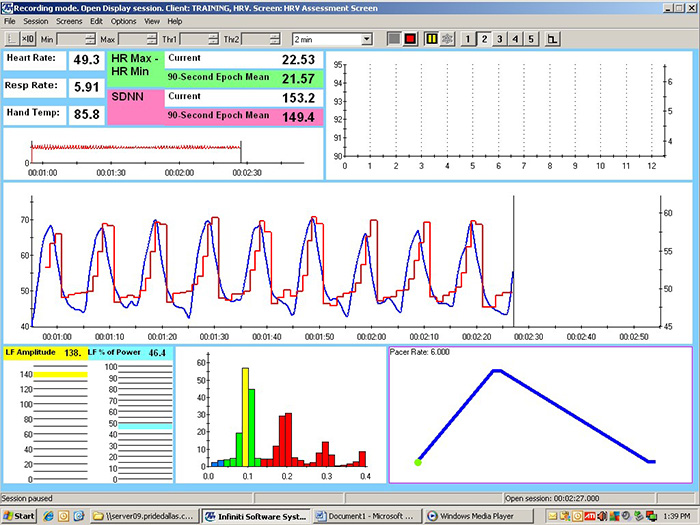
The Stepped Protocol
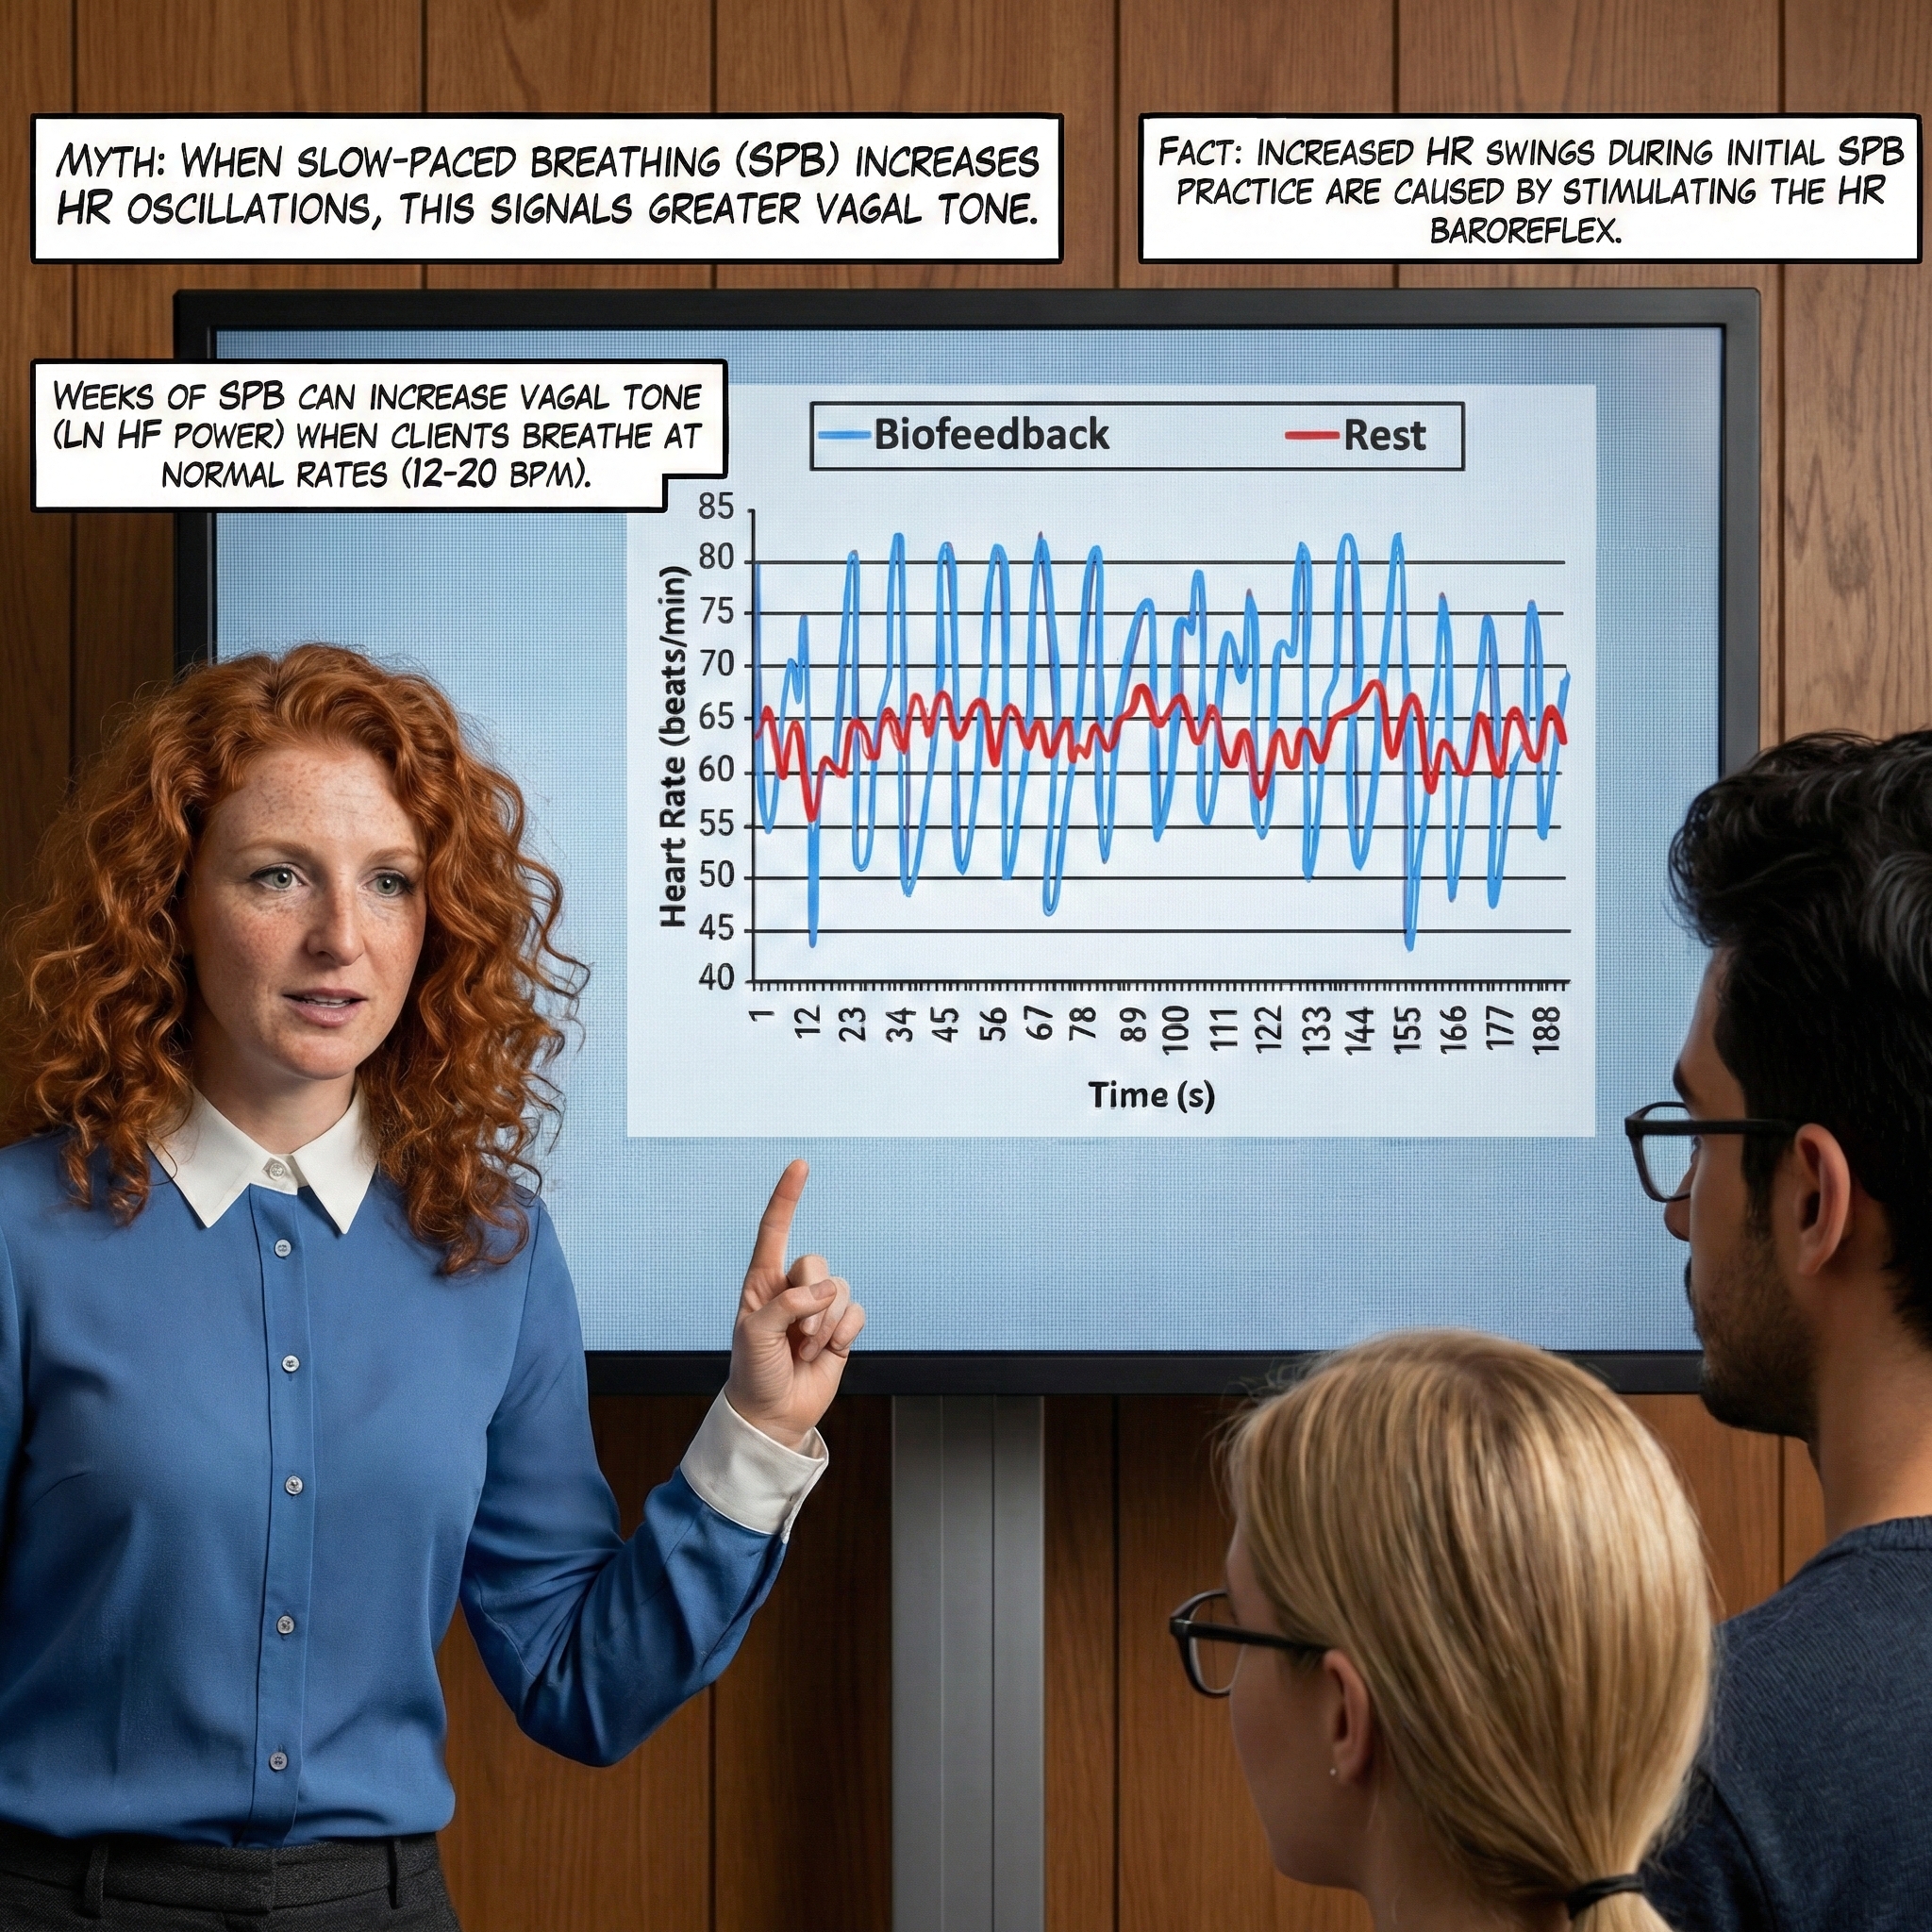
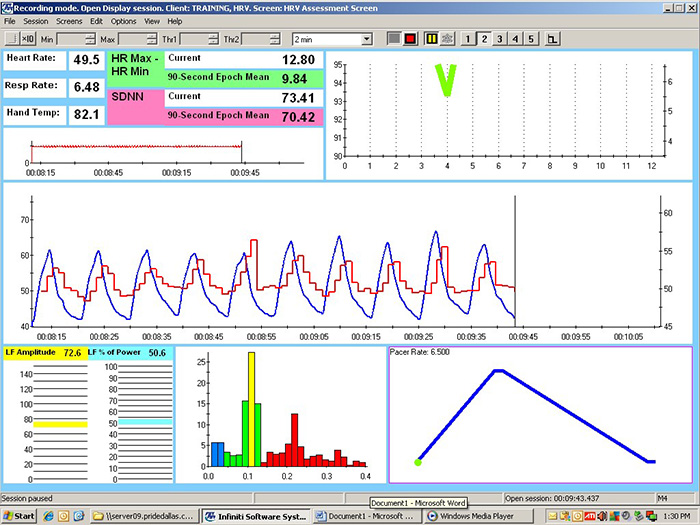
This section describes Lehrer and colleagues' (2013) original stepped protocol for RF assessment and explains how to execute each trial. Instruct your client to breathe for 2-minute intervals from 6.5 to 4.5 bpm, decreasing in 0.5-bpm steps with 2-minute rest periods between trials. Record physiological activity during each SPB trial as a separate 2-minute epoch, and create a separate display capturing raw breathing and HR waveforms on the same graph for each respiratory rate.
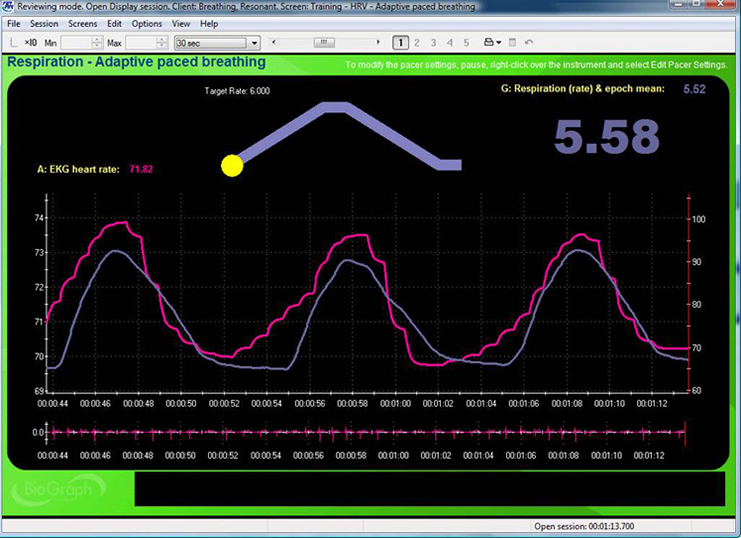
The display above illustrates a typical pacing screen. The moving yellow ball at top guides the client to breathe at 6 bpm, with a post-expiratory pause following exhalation. The current RR (5.58 bpm) appears on the right. The graph immediately below shows instantaneous heart rate (pink) and respiration (purple)—note how closely the peaks and troughs coincide, which graphically represents phase synchrony. A raw ECG waveform appears toward the bottom.
When introducing each new breathing rate, consider using simple directions: "Now try breathing at this frequency (following the pacer)" (Lehrer et al., 2013, p. 101).
After your client completes each 2-minute trial, check on their comfort and verify that they followed the pacer by confirming the average RR. Repeat any trial where the client was 0.25 bpm too fast or slow—without this quality control, you cannot be confident the data represent breathing at the intended frequency. Also check for artifactual IBIs and repeat invalid epochs after the client has rested for 2 minutes.
Finally, examine the segment spectral display for the location of LF peaks. When a peak occurs at the boundary of the tested range (4.5 or 6.5 bpm), extend assessment with additional trials 0.5 bpm above or below that inflection point until LF amplitude decreases. This ensures you have captured the full range of the client's resonance response.
Resonance Frequency Selection Criteria
This section explains the six criteria Dr. Lehrer originally used to select the RF and why they are weighted in a specific order. RF selection aims to identify the frequency that best stimulates the baroreflex system, increasing RSA and HRV. Because the stepped protocol's resolution is limited to 0.5-bpm steps, the Lehrer and colleagues (2013) protocol estimates a client's approximate RF. When a client's actual RF falls between steps—say at 5.75 bpm—both 5.5 and 6.0 bpm could maximize different selection criteria.
The Lehrer and colleagues strategy incorporates six criteria prioritized by their association with resonance effects. Since a single breathing rate may not maximize all six criteria, clinicians select the estimate representing the "best convergence" of the selection criteria (Lehrer et al., 2013, p. 102). These criteria and their relative weights have not yet received experimental confirmation (Shaffer & Meehan, 2020).
(1) Phase Synchrony
Phase synchrony refers to the temporal alignment between the respiration and HR waveforms. When these signals rise and fall simultaneously (0°), this maximally stimulates the baroreflex and increases RSA in adults (Vaschillo et al., 2004; Lehrer & Gevirtz, 2014; Lehrer et al., 2020a). Whether RSA also optimizes pulmonary gas exchange efficiency remains unclear (Buchheit, 2010). Software measures the phase relationship between these waveforms: 0° means HR begins to rise at the start of inhalation; 90° means HR begins to increase mid-inhalation and decrease mid-exhalation; 180° means HR decreases during inhalation and increases during exhalation.
Phase synchrony (~0°) carries the greatest weight among the six criteria because it enables the greatest resonance effects. Strong resonance effects increase RSA and multiple HRV metrics and allow HRV biofeedback training to more effectively stimulate and strengthen the baroreflex over time (Lehrer et al., 2003, 2013; Shaffer & Meehan, 2020). For clinicians, this means that when two breathing rates produce similar HRV values, the rate with better phase synchrony should generally be preferred.
(2) HR Peak-Trough Amplitude
The second criterion is the difference between the fastest and slowest heart rate within each breathing cycle. Higher peak-trough HR amplitudes are desirable because greater RSA can increase baroreflex sensitivity over weeks of HRV RF training (Lehrer et al., 2003; Lehrer & Gevirtz, 2014). Clinicians quantify this using HR Max − HR Min, which calculates the average difference between the highest and lowest HRs during each respiratory cycle (Cipresso et al., 2019). A respirometer is required to determine when each breathing cycle starts and ends.
Peak-trough amplitude is second in the hierarchy because larger differences signal greater resonance effects and contribute to more effective baroreflex activation (Vaschillo et al., 2002; Shaffer & Meehan, 2020). In practical terms, this is one of the most intuitive criteria to evaluate: you can often see it simply by looking at how "tall" the HR oscillations are on the display screen.
(3) Low-Frequency Power
The third criterion is low-frequency (LF) power, which reflects spectral energy in the 0.04–0.15 Hz range of the HRV signal. The baroreflex system exhibits resonance because it is a feedback system with a constant delay (Lehrer, 2013), and its RF lies within this LF range. Higher absolute and percent total LF power are desirable because they increase as the respiratory rate approaches the RF and more effectively stimulate the baroreflex (Vaschillo et al., 2002). Additionally, cardiac vagal activity increases when individuals engage in SPB within the LF range (Kromenacker et al., 2018).
Clinicians measure absolute LF power in ms2/Hz and calculate percent total LF power as LF/(LF + HF) or LF/(VLF + LF + HF; Lehrer et al., 2013). LF power is ranked third because it confirms that clients are breathing at rates between 4.5 and 6.5 bpm—the range necessary to produce the greatest resonance effects and therefore the largest RSA (Shaffer & Meehan, 2020). This criterion connects directly to the frequency-domain measurement concepts covered in earlier units of this tutorial.
(4) Maximum LF Amplitude Peak
The fourth criterion examines the spectral display for the single largest peak within the LF range. Larger LF peaks reflect stronger resonance effects due to greater synchrony between breathing and HR. Clinicians use spectral analysis to identify the LF peak with the greatest absolute power. This criterion is ranked fourth because the LF spectral peak is higher at the RF than at any other respiratory frequency (Lehrer et al., 2013), and consistent breathing within the LF range increases resonance effects and RSA (Shaffer & Meehan, 2020).
(5) Smoothness of the HR Curve Envelope
The fifth criterion assesses the visual quality of the HR waveform. Smooth, sinusoidal heart rate curves are preferred because they permit closer phase synchrony with the respiration waveform, allowing clients to achieve the greatest resonance effects and RSA (Lehrer & Gevirtz, 2014). Clinicians evaluate this by visually inspecting the HR curve envelope: sinusoidal signals are smooth, whereas jagged waveforms are irregular (Lehrer et al., 2013). This criterion is ranked fifth because it reflects the breathing mechanics required to achieve optimal resonance (Shaffer & Meehan, 2020).
(6) Fewest LF Peaks
The final criterion counts the number of distinct peaks in the LF spectral display. Fewer peaks indicate that the client breathed within a narrow frequency band centered on the RF, while multiple peaks suggest that breathing varied—producing one peak at the respiratory rate and another at the baroreflex frequency. Breathing at a single consistent frequency better enables phase synchrony between breathing and HR, stimulates the baroreflex, and increases RSA (Vaschillo et al., 2002).
This criterion is ranked sixth because it demonstrates consistent breathing within a narrow band of the LF range, which maximizes resonance effects and RSA (Shaffer & Meehan, 2020). In practice, a single tall LF peak is the spectral signature of effective RF breathing, while scattered peaks suggest the client struggled to maintain a steady rate. The table below, adapted from Lehrer and colleagues' (2013) RF assessment protocol, summarizes all six criteria.
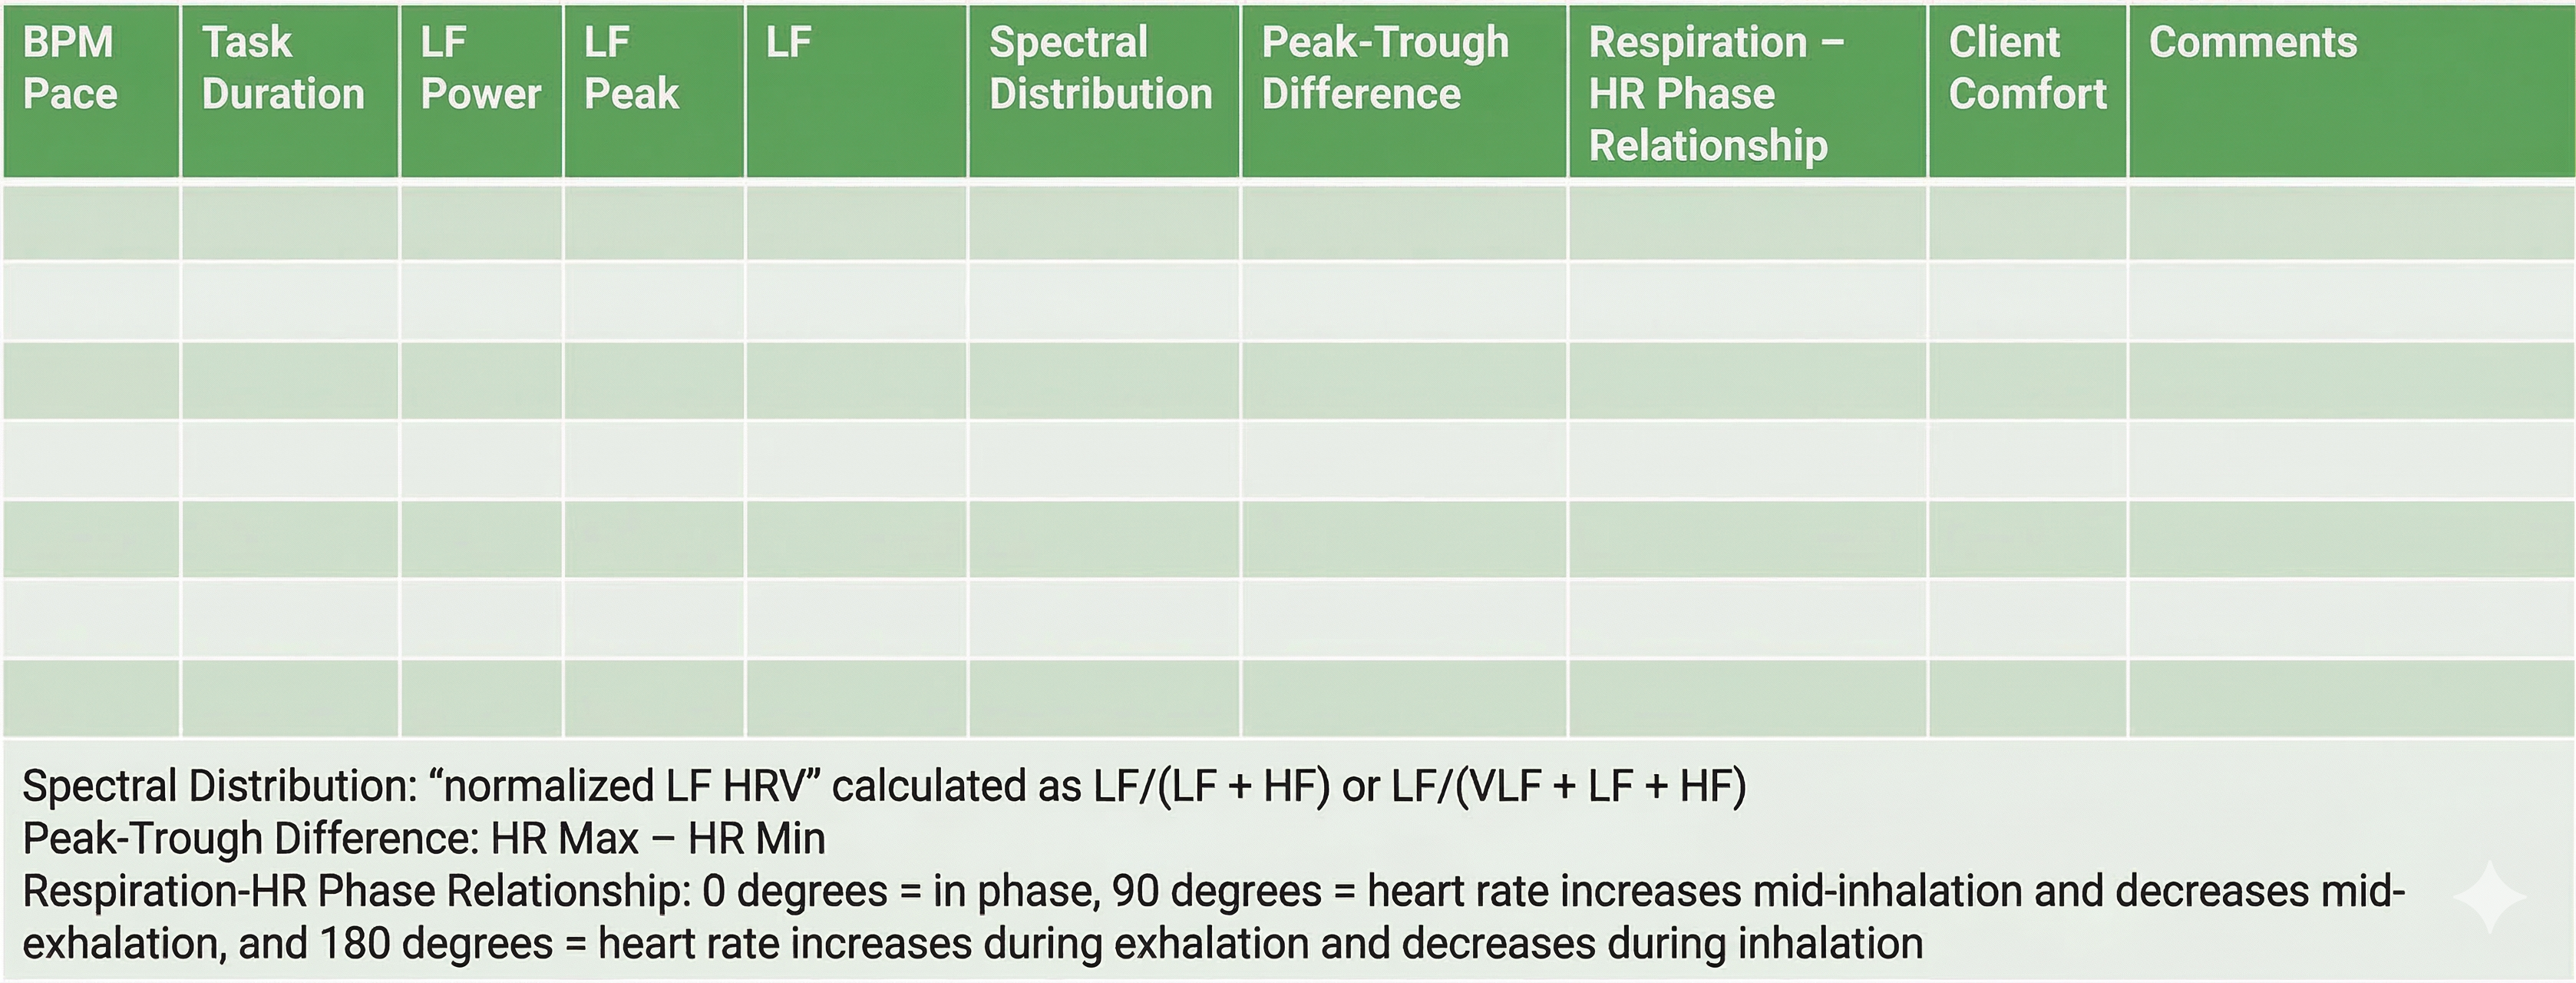
Resonance Frequency Selection Criteria
To summarize, the RF is the breathing rate that represents the "best convergence" of these criteria (Lehrer et al., 2013, p. 102): synchrony of the respirometer and HR signals, largest peak-to-trough HR amplitude, largest absolute and percentage LF power and highest amplitude LF peak frequency near 0.1 Hz, and smoothest and most regular HR waveforms.
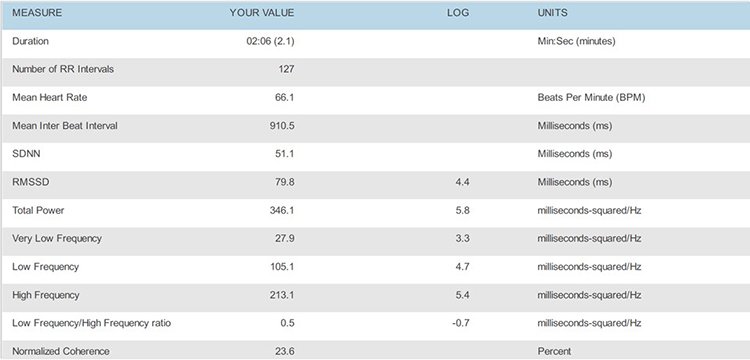
Selecting the RF Using Actual Data
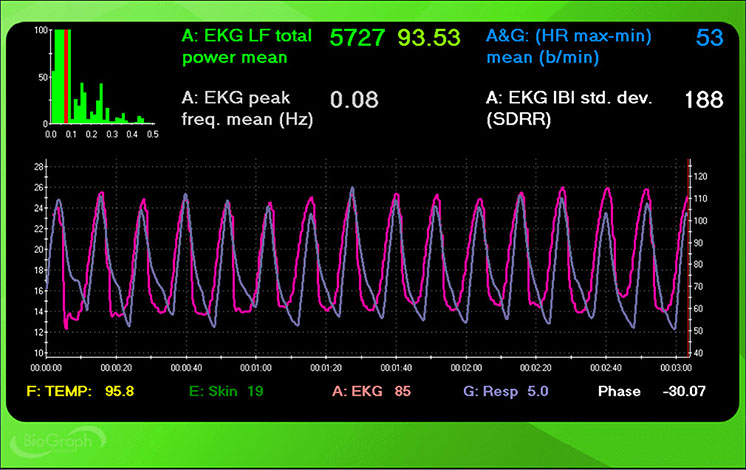
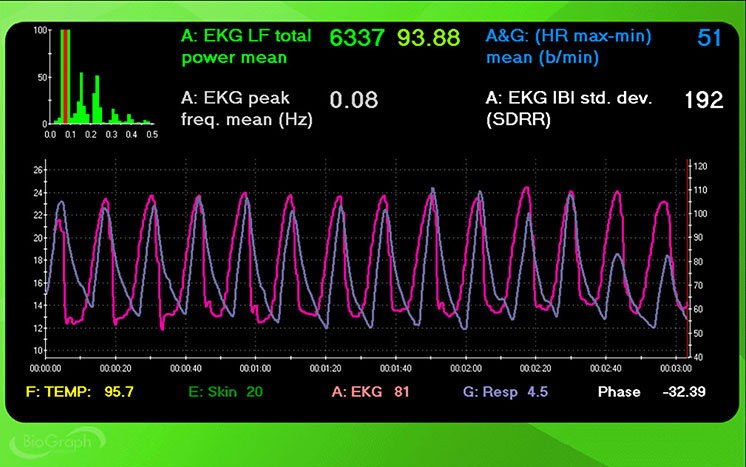
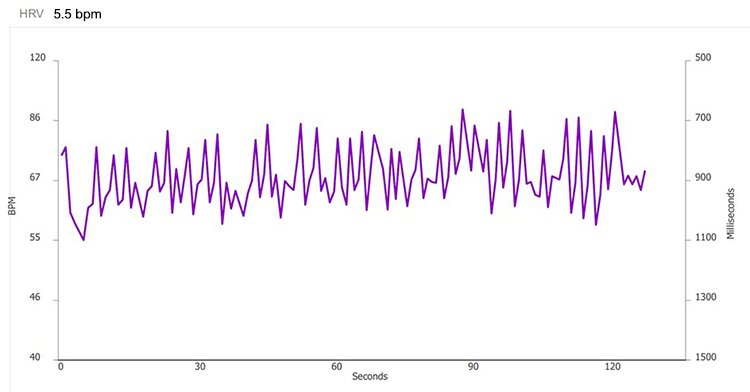
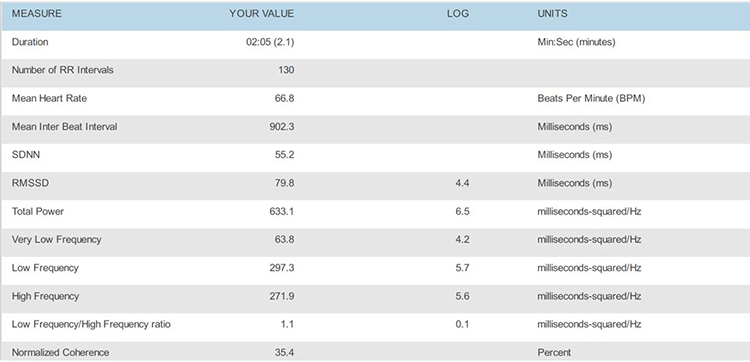
This section walks through RF selection with real assessment data to illustrate how the criteria work in practice. Using the Lehrer et al. (2013) criteria, we might choose a RR of 5.5 bpm based on its strong synchrony (7°), peak-to-trough difference (49 bpm), HR curve envelope smoothness (+), and number of LF peaks (+).
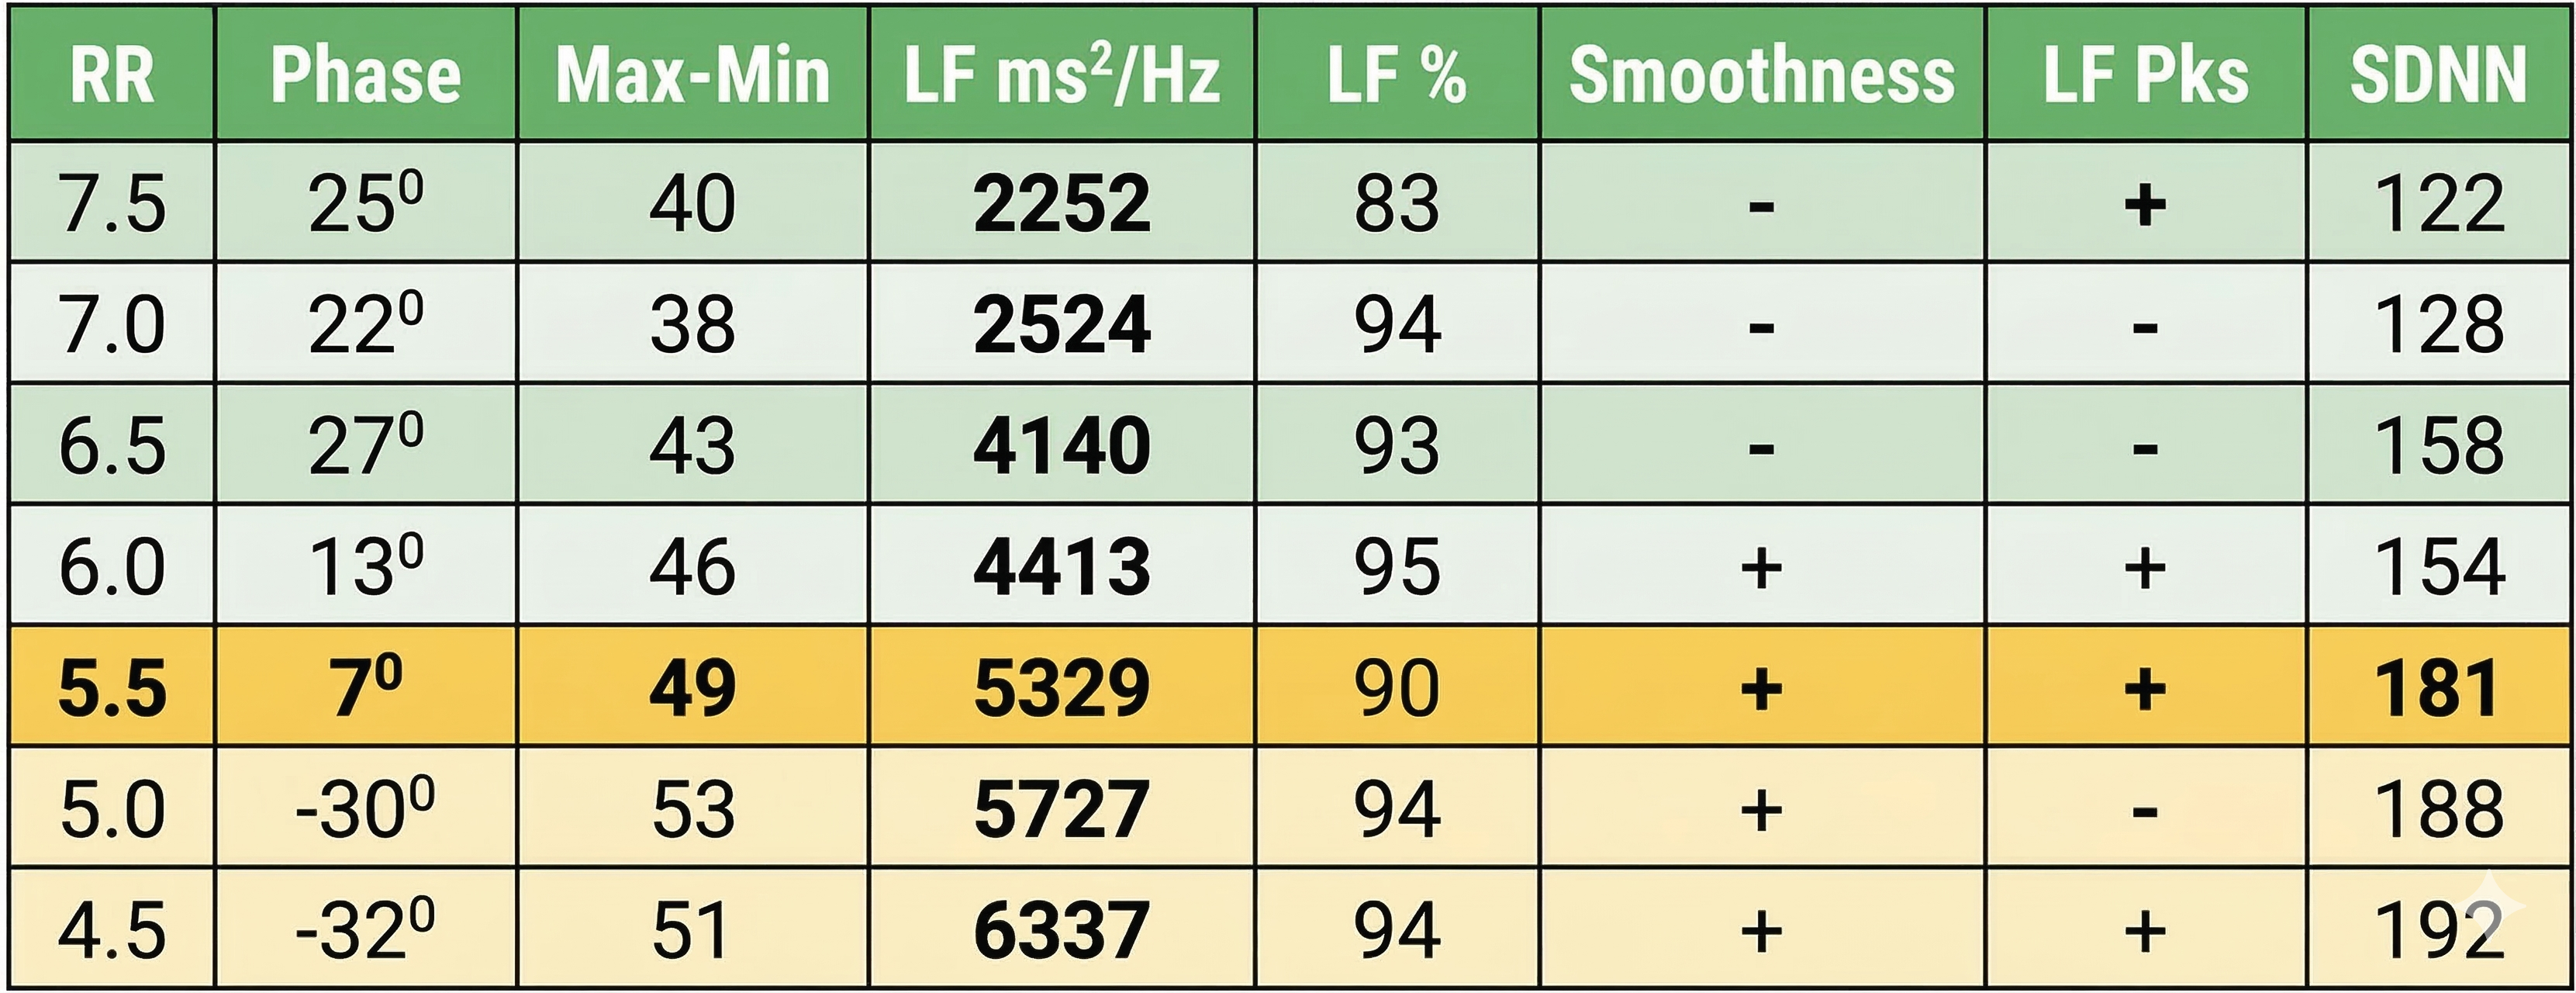
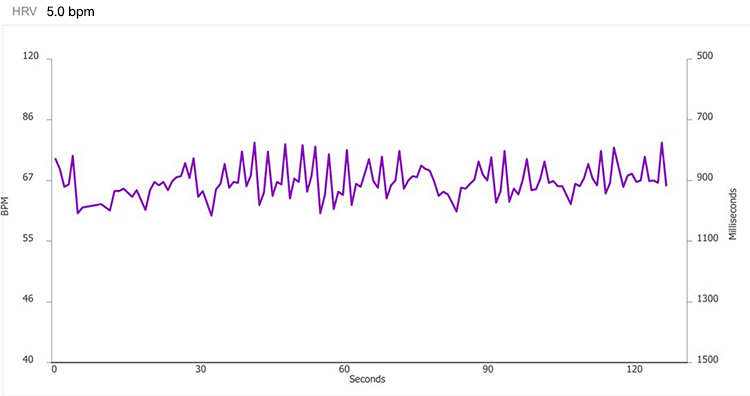
However, this case illustrates why RF selection requires clinical judgment rather than a simple algorithm. A clinician could also make a strong case for 5.0 or 4.5 bpm. Despite dramatically worse phase synchrony, these rates achieved higher peak-to-trough differences (53 and 51 bpm), LF power (5727 and 6337 ms2/Hz), LF % (both 94), and SDNN (188 and 192 ms) than 5.5 bpm. This kind of split between criteria is common and underscores why Lehrer and colleagues emphasized convergence rather than any single metric.
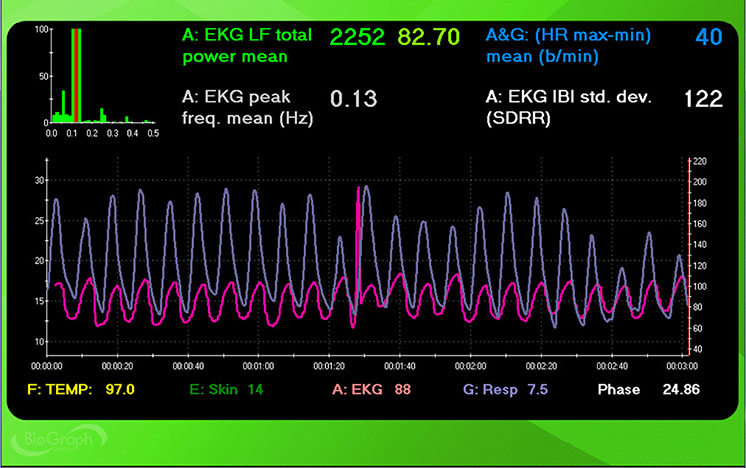
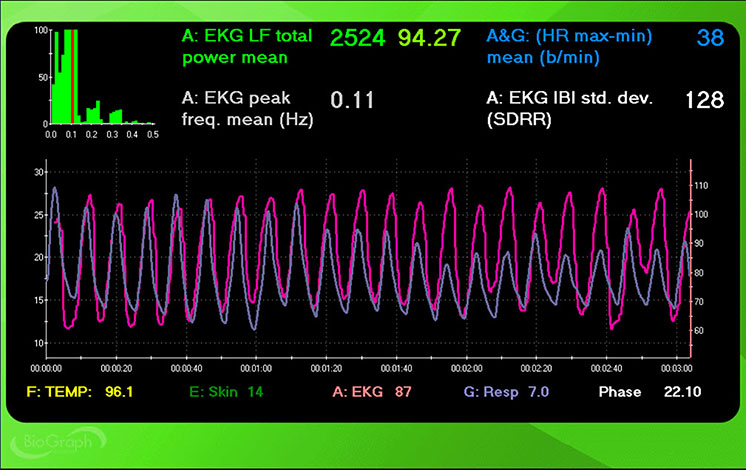
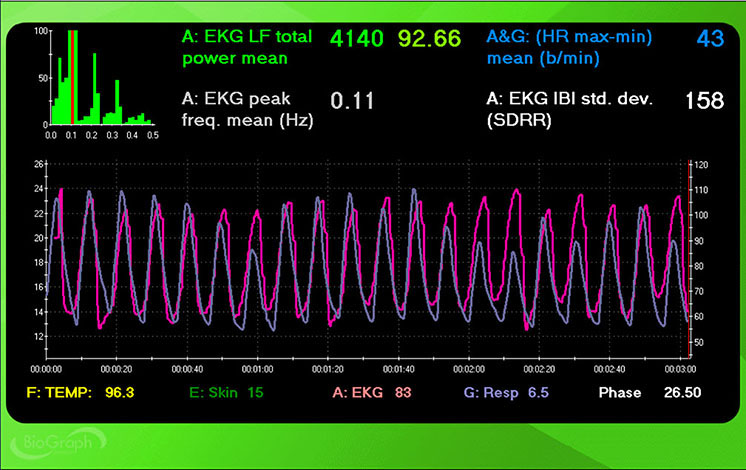
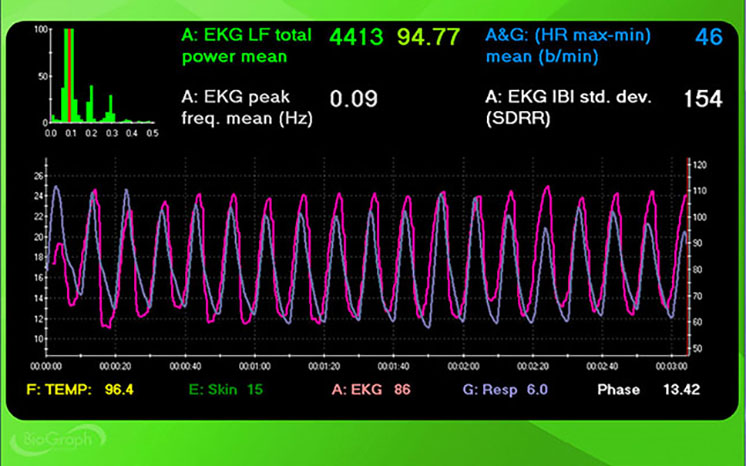
The screenshots below display HR and respiration waveforms for each breathing trial from 7.5 to 4.5 bpm. The pink tracing shows instantaneous HR, and the violet tracing shows respirometer expansion and contraction. Examine how the alignment between these tracings shifts across breathing rates.
7.5 bpm
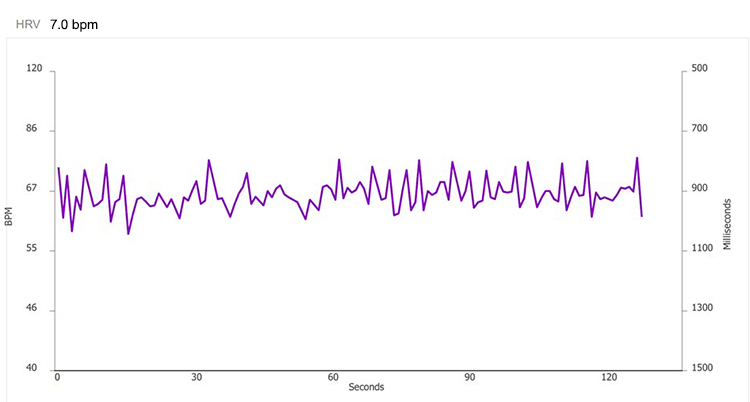
7.0 bpm
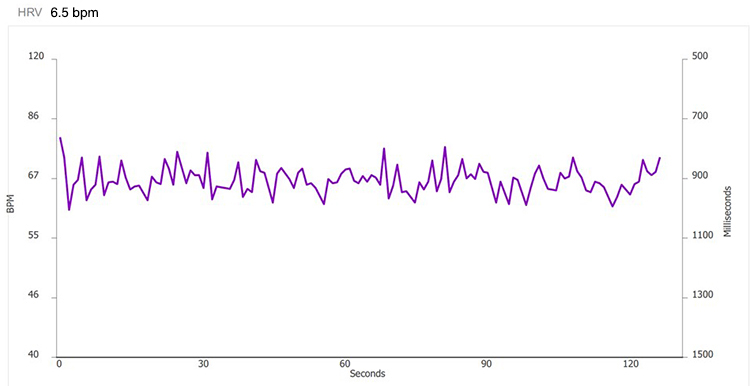
6.5 bpm
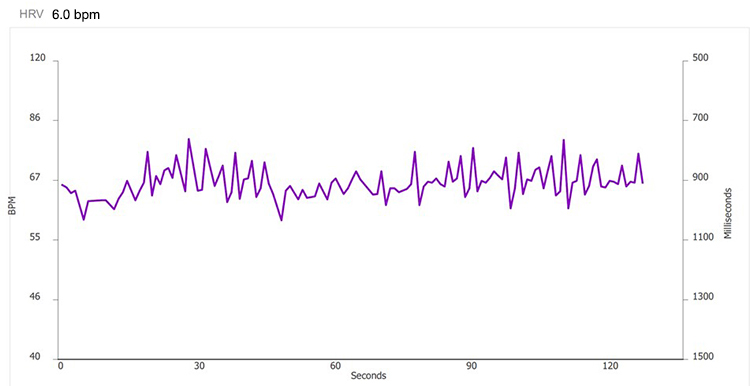
6.0 bpm
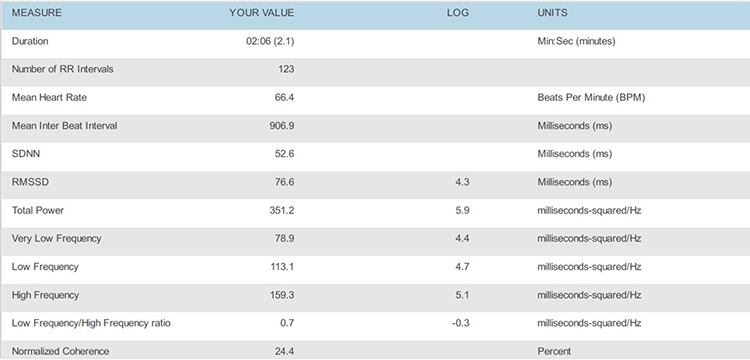
5.5 bpm

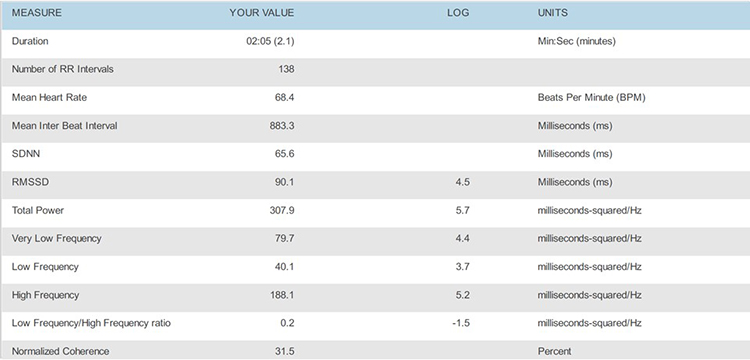
5.0 bpm
4.5 bpm
Comprehension Questions: Measurement Protocols
- Why is a respirometer essential during RF assessment, and what three functions does it serve?
- Under what conditions might ECG be preferred over PPG for RF measurement?
- List the six RF selection criteria in order of priority and explain why phase synchrony carries the greatest weight.
- When assessing a client whose best RF criteria converge on two different breathing rates, what additional considerations should guide your final selection?
Breaking Ties and Fine-Tuning the RF
How to Break Ties
When the selection criteria point to two or more candidate breathing rates, client comfort and treatment goals become the deciding factors. Selecting the rate your client finds most comfortable and rewarding is critical because a client-friendly rate will increase the likelihood of practicing RF breathing between sessions. For example, if a client struggles with breathing at 4.5 bpm, this pace may result in overbreathing, vagal withdrawal, discomfort, and reduced engagement (Porges, 1995; Thayer et al., 2012).
Also consider which rate brings your client closest to their training goal. If a veteran entered training to reduce blood pressure, consider the frequency that produces the lowest readings. If an athlete is training for optimal performance, consider which rate produces the largest HRV gains. The physiological data identify candidate rates; the client's experience and treatment objectives break the tie.
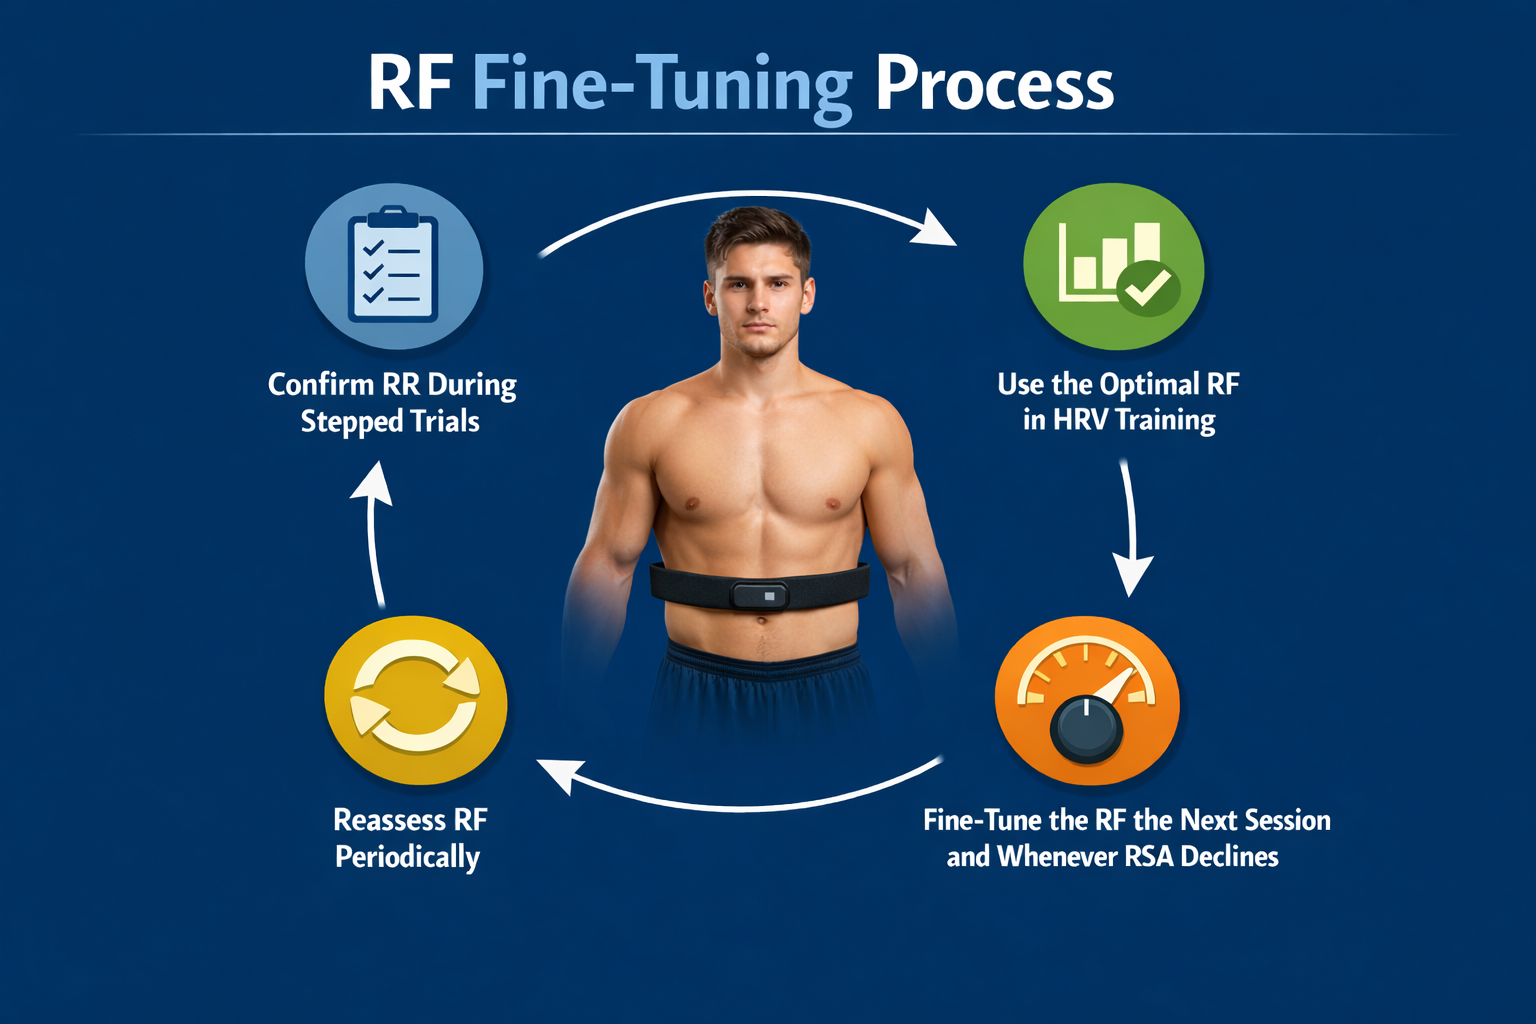
How to Fine-Tune the RF

The stepped protocol provides an initial estimate, but fine-tuning at the start of the first training session refines it further. Following a resting baseline, have the client breathe at the estimated RF for 3 to 5 minutes while watching for signs of overbreathing such as faintness and tingling of the extremities (Lehrer et al., 2013). If such symptoms appear, encourage shallower breathing to reduce the CO2 loss responsible for them.
Next, have the client breathe at rates 1/2 bpm faster and slower than the estimated RF for 3 to 5 minutes each. This step serves two purposes: it allows clients to compare their subjective comfort across the three rates, and it provides additional physiological data for comparison. After artifacting, evaluate all three trials (RF, RF + 1/2 bpm, and RF − 1/2 bpm) using the RF selection criteria described above.
Stepped Protocol Difficulties
This section examines important limitations of the stepped protocol that clinicians should consider when interpreting their results. SPB can be challenging for clients who breathe at average or higher-than-typical rates. In addition to slowing their respiratory rate, the protocol may ask them to lengthen their exhalation. Although clients may achieve the target rate on average during RF trials, they may not consistently follow the pacing display from breath to breath.
This inconsistency can compromise most of the selection criteria. Specifically, breathing variability around each target rate could reduce phase synchrony, lower the maximum LF peak, decrease the smoothness of the HR curve envelope, and increase the number of LF peaks. In effect, these four criteria may measure SPB proficiency as much as baroreflex frequency—a critical distinction when working with novice breathers or clinical populations.
This observation suggests a practical refinement: use the confluence of peak-trough amplitude and LF absolute power since they are less affected by breathing proficiency.
We recommend using LF absolute power instead of % power to more directly measure LF-band activity. If you want to know how much "fuel" is in the tank, look at absolute power. If you only look at LF%, you only know what percentage of the tank is full, without knowing if the tank itself has shrunk from a gallon to a thimble.
We present these simplified RF criteria to stimulate conversation and research about optimizing RF selection for real-world clinical practice.
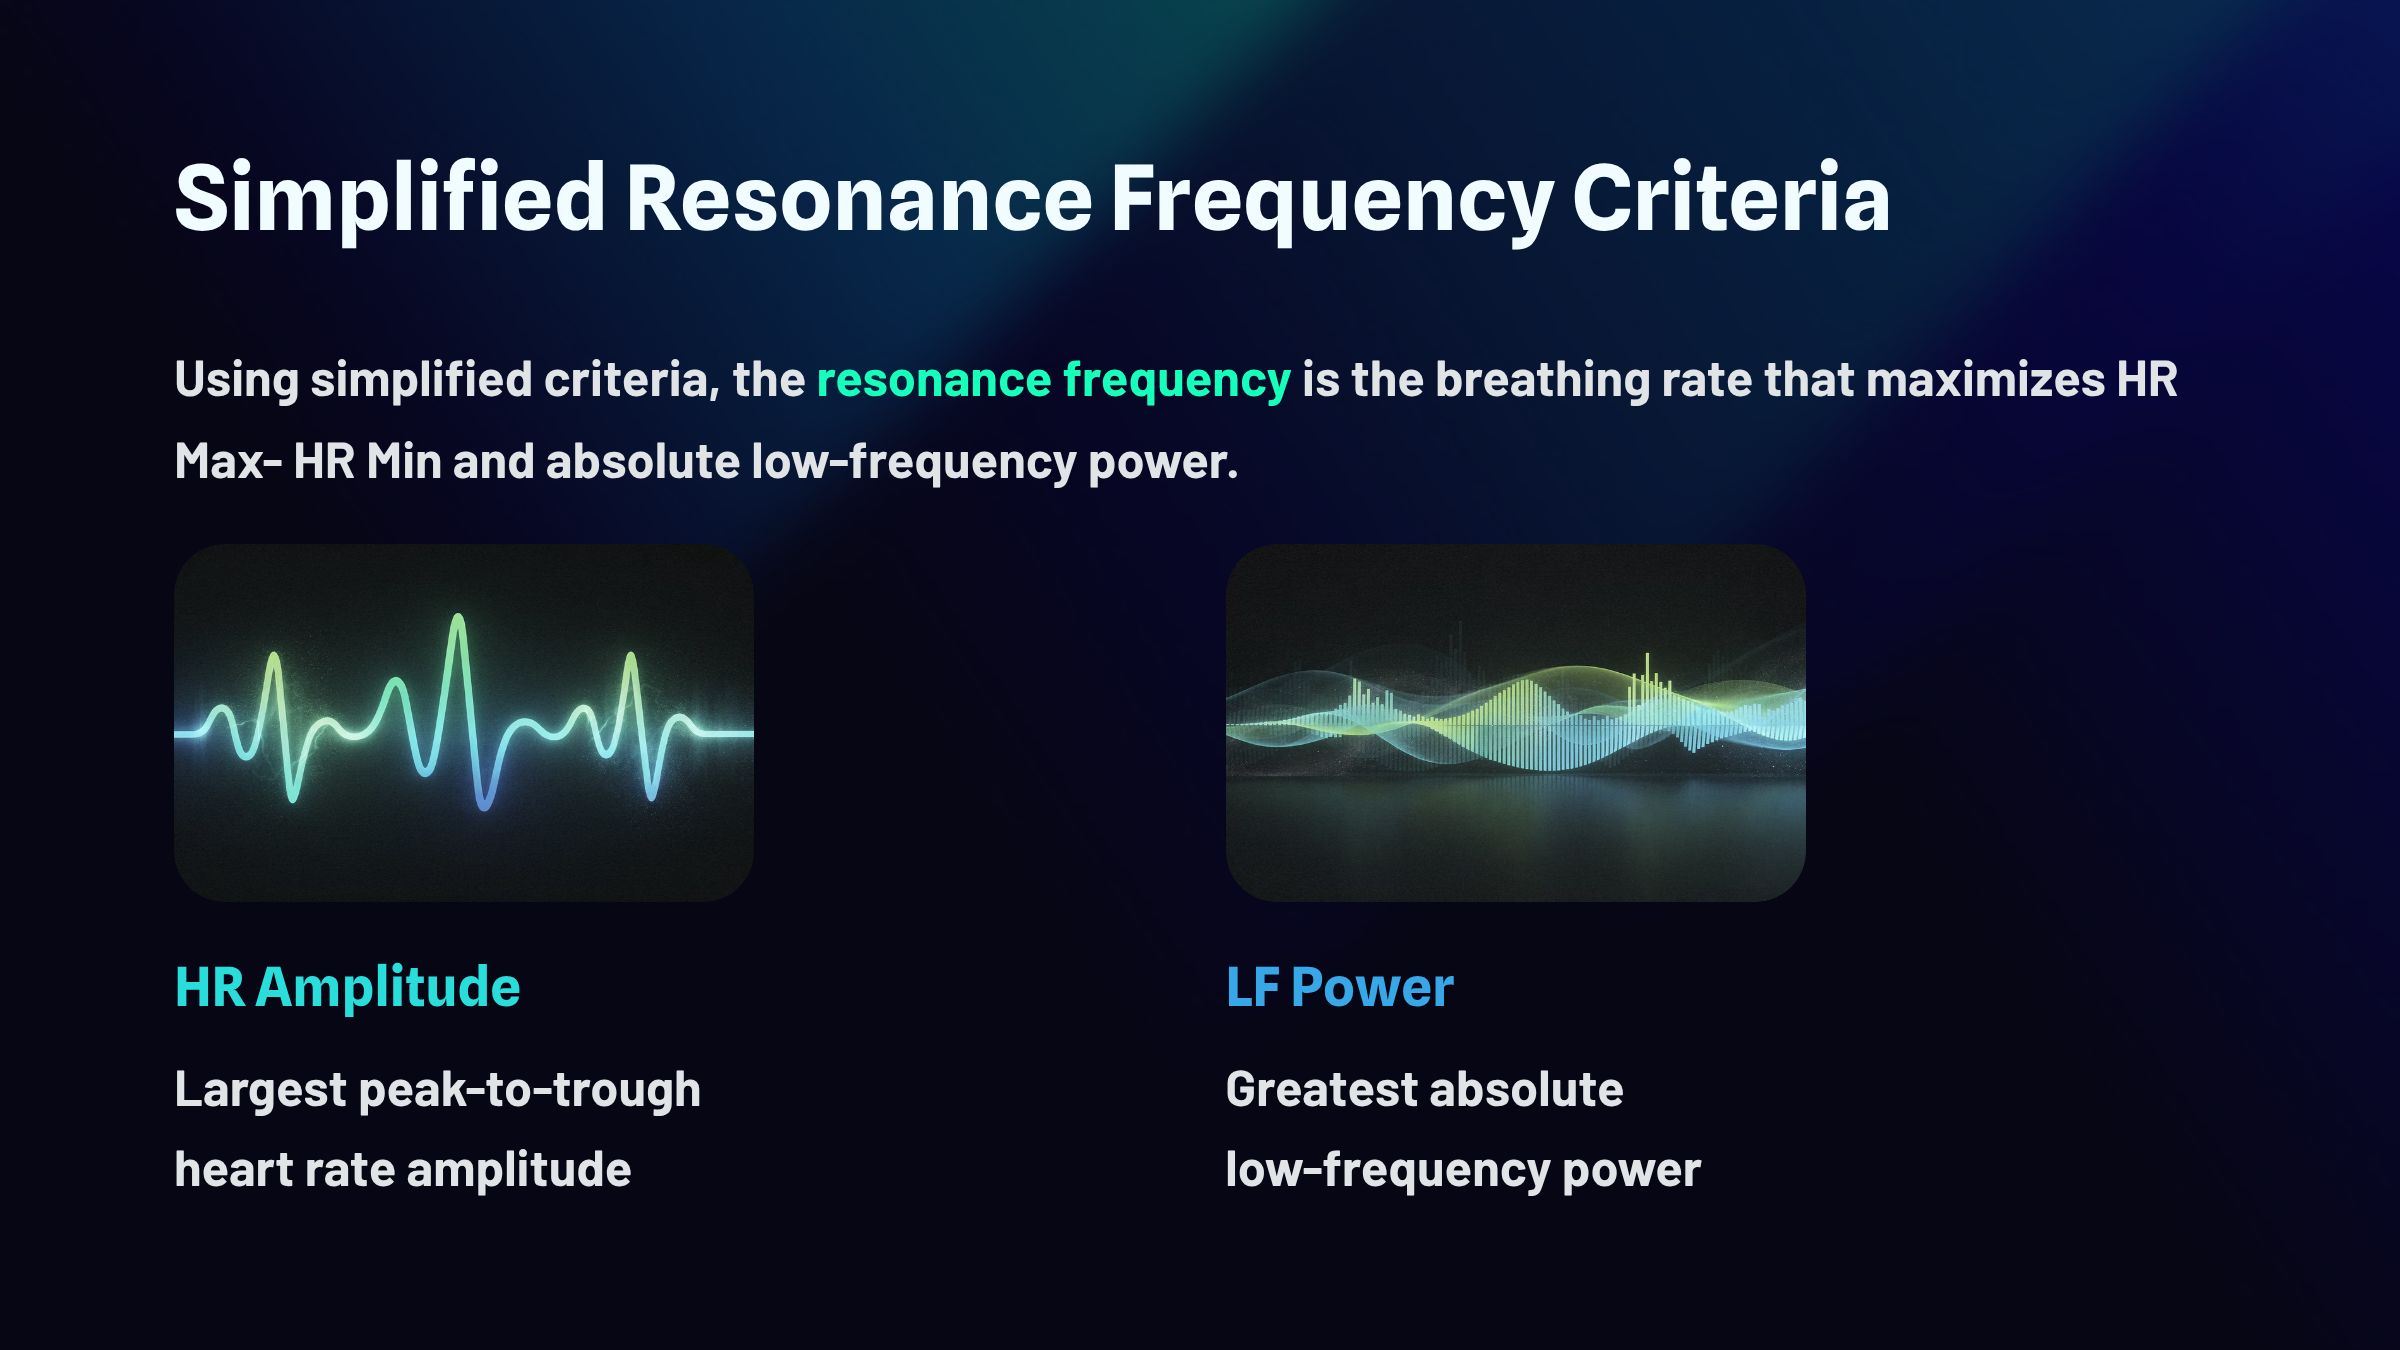
Using the simplified RF criteria, 4.5 bpm is the clear winner with HR Max-HR Min of 51 bpm and absolute LF power of 6337.
The Sliding Protocol
This section introduces an alternative approach to RF assessment that may address some of the stepped protocol's limitations. Fisher and Lehrer (2022) described a 15-minute automated sliding protocol in which participants breathe continuously between 4.25 and 6.5 bpm, with a constant rate of change (67.04 ms per step). Rather than testing discrete rates, this approach measures peak-trough amplitude at 78 frequencies across a continuous sweep. The key advantage: instead of relying on the subjectively weighted multiple criteria of the stepped approach, the sliding protocol identifies the single frequency with the largest peak-trough amplitude.
The practical results are encouraging. The mean absolute difference in RF estimates between the stepped and sliding methods was only 0.22 ± 0.169 bpm (Fisher & Lehrer, 2022). The authors raise the important question of whether this slight difference is too small to affect physiological or psychological outcomes—a question with real implications for whether the simpler sliding protocol could eventually replace the more complex stepped approach in clinical settings.
When breaking ties between candidate RFs, prioritize client comfort and treatment goals. Fine-tune the RF at the start of the first training session by comparing breathing at the estimated RF, 1/2 bpm faster, and 1/2 bpm slower. The stepped protocol can be challenging for clients who struggle with SPB, and inconsistency around target rates may compromise criteria that depend on breathing proficiency. An alternative sliding protocol by Fisher and Lehrer (2022) measures peak-trough amplitude at 78 frequencies across a 15-minute continuous sweep, producing RF estimates within 0.22 bpm of the stepped approach.
Measuring the Resonance Frequency Using the Optimal HRV Application
The next two sections describes RF assessment protocols that do not require a respirometer. This approach extends RF assessment to telehealth settings where traditional in-office equipment is unavailable.
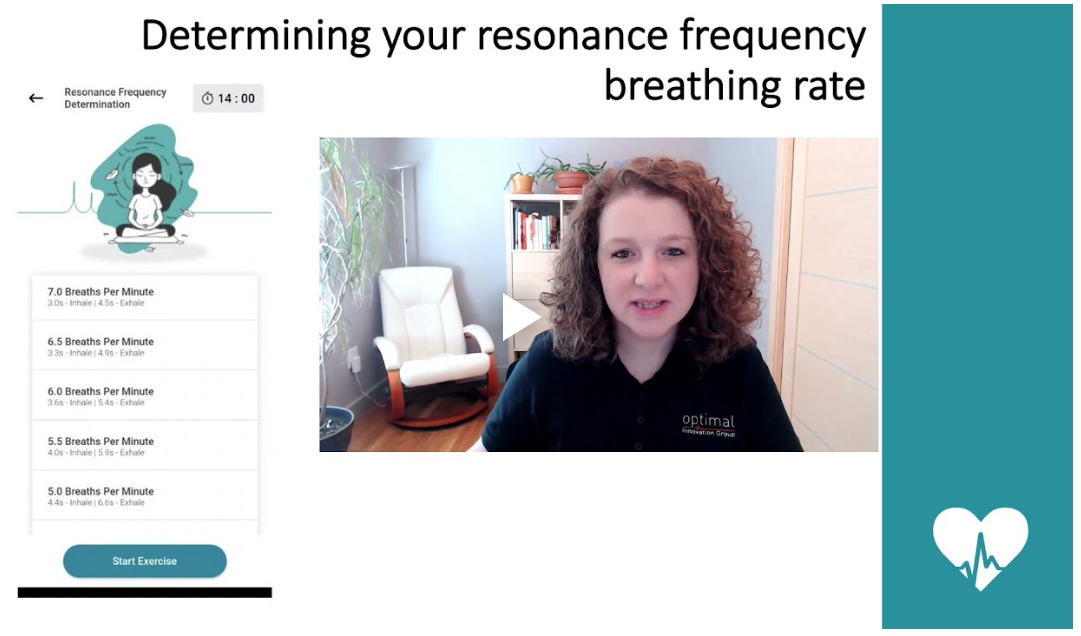
The Optimal HRV application provides an animated pacing display to help clients slow their breathing.
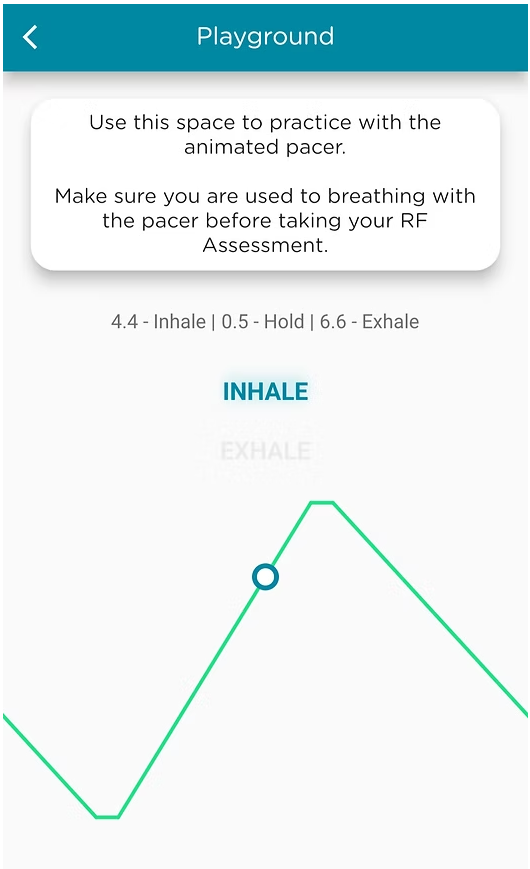
Optimal HRV offers automated RF calculation using an animated pacer. Their 14-minute RF procedure guides clients through seven 2-minute trials with longer exhalations than inhalations:
7.0 bpm - 3.0-s inhale and 4.5-s exhale
6.5 bpm - 3.3-s inhale and 4.9-s exhale
6.0 bpm - 3.6-s inhale and 5.4-s exhale
5.5 bpm - 4.0-s inhale and 5.9-s exhale
5.0 bpm - 4.4-s inhale and 6.6-s exhale
4.5 bpm - 4.9-s inhale and 7.4-s exhale
4.0 bpm - 5.6-s inhale and 8.4-s exhale
Dr. Inna Khazan describes how to determine your RF in the following video.
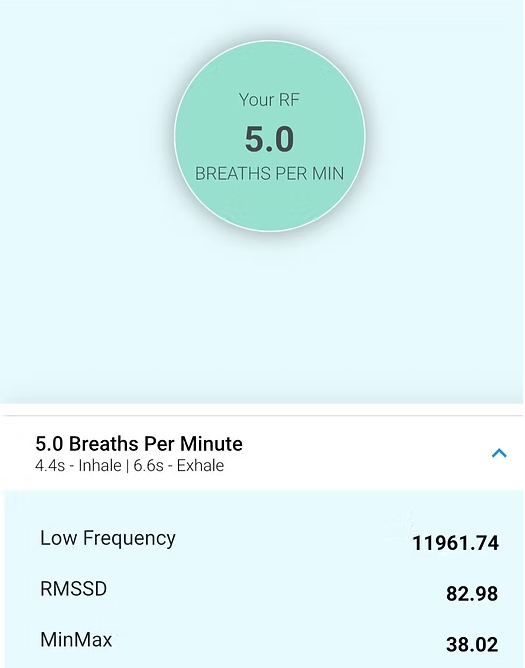
The Optimal HRV application calculates a RF using weighted criteria, including LF power and HR MinMax. For a 6-foot male client, the RF was 5.0 breaths per minute.
The bar chart below shows a logarithmic conversion of LF power, RMSSD, and HR MinMax values. Optimal HRV's algorithm assigns the greatest weight to LF power (light blue) and selected 5.0 bpm as the RF. The highest RMSSD and MinMax values were observed at 7.0 and 6.5 bpm, respectively.
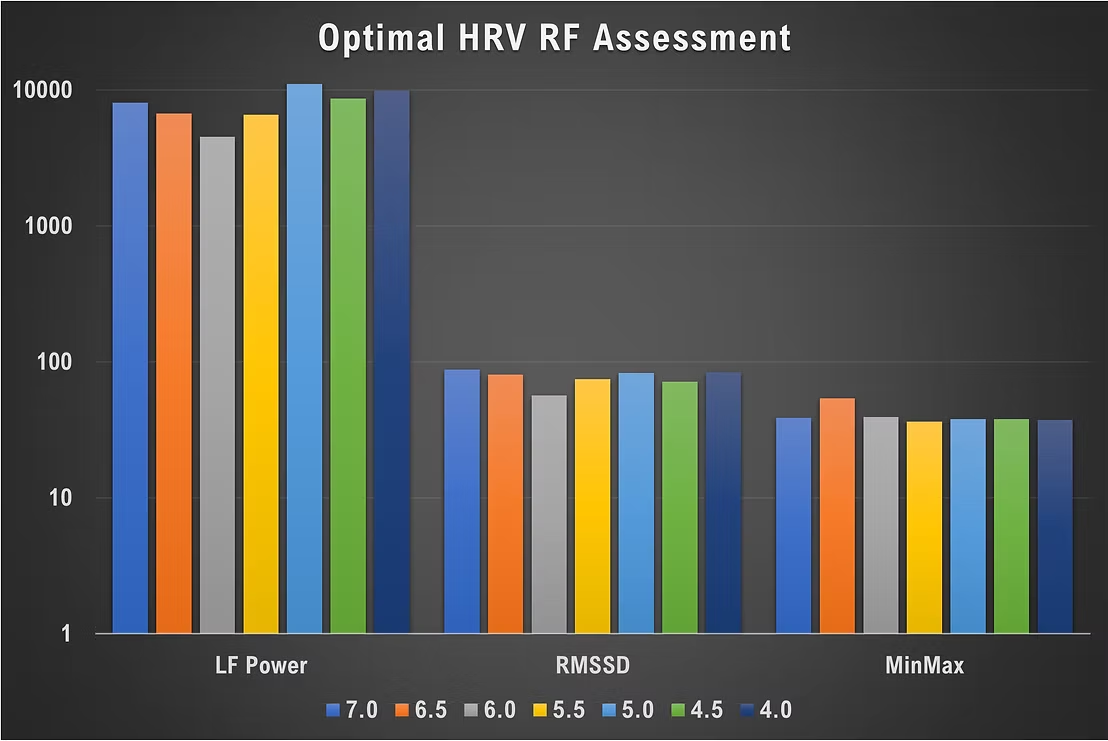
The table below shows the same data in their original units.
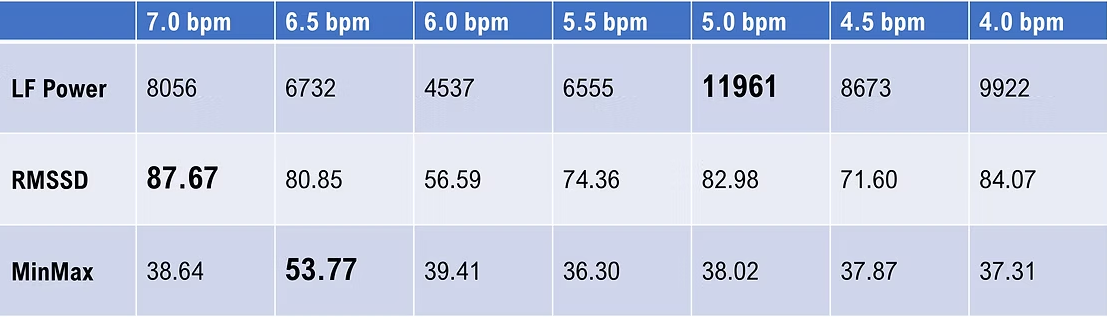
Fisher and Lehrer (2022) observed that RF criteria can point to different breathing rates, requiring clinical judgment. "There is something of an art to evaluating these metrics when they point to disparate frequencies (p. 19)."
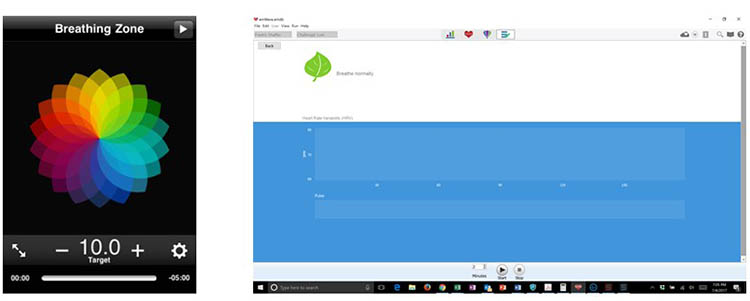
Measuring the Resonance Frequency Using the emWave Pro Plus® with a Separate Smartphone Pacer
Perform a series of 2-minute Assessments using the emWave Pro Plus® and a separate breathing pacer while the client sits upright. Adults breathe from 7.5 to 4.5 bpm in descending 0.5-bpm steps (use 9.5 to 6.5 bpm for children). After each 2-minute trial, inquire about hyperventilation symptoms such as feeling lightheaded, dizzy, or having a pounding heart. Set the emWave Pro Plus Assessment duration to 2 minutes.
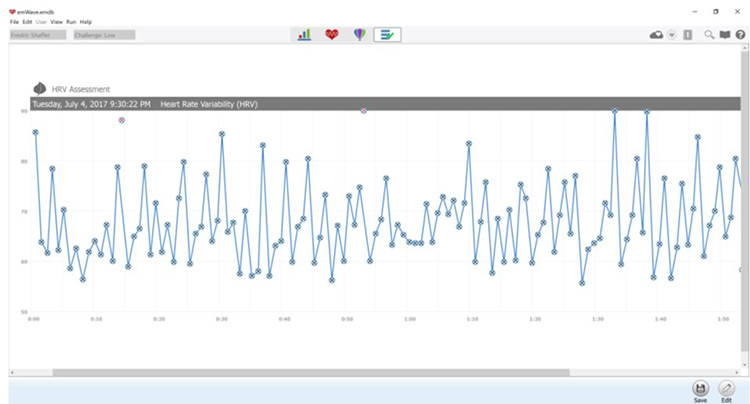
Artifacting and Data Review
Data quality is just as important in the emWave protocol as in the standard stepped protocol. After completing all 2-minute Assessments, visually inspect the data points to ensure that emWave Pro Plus has deleted all false beats (shown by a circled red x). The example below shows two false beats near the top of the tachogram, around 14 seconds and 53 seconds. Use the Edit function to delete any overlooked false beats before proceeding to analysis.
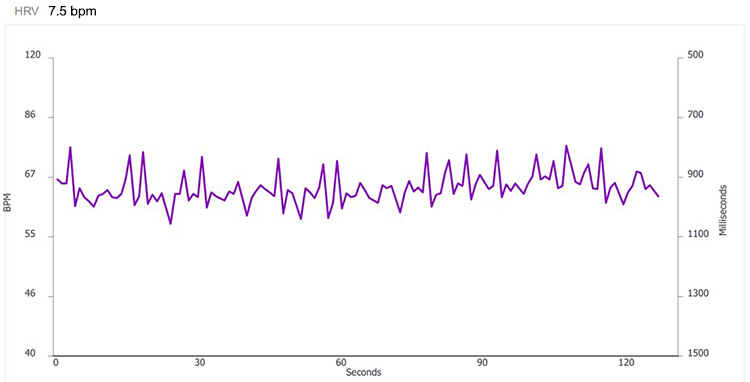
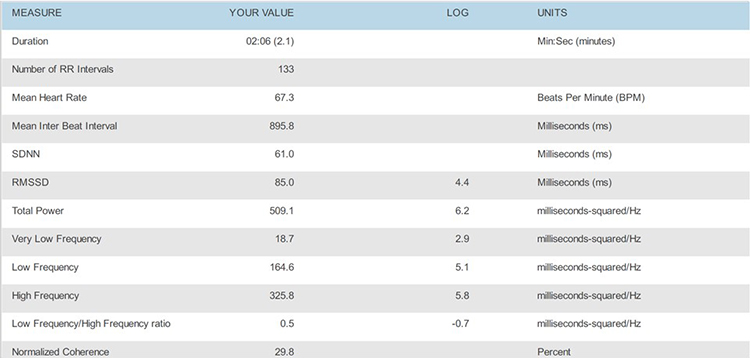
After you complete artifacting, run a separate report for each trial and compare the HR tachograms and summary statistics. Organize the tachograms and HRV measurements for each breathing trial on separate PowerPoint slides or in a Word document for side-by-side comparison. The displays below show data for each breathing rate from 7.5 to 4.5 bpm.
7.5 bpm
7.0 bpm
6.5 bpm

6.0 bpm
5.5 bpm
5.0 bpm
4.5 bpm
RF Selection with the emWave Method
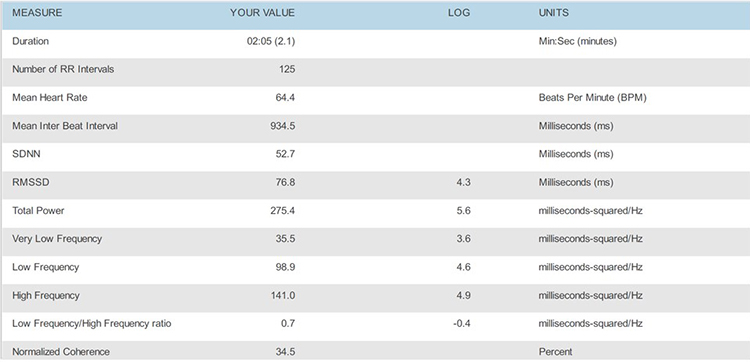
Place the HRV time-domain and frequency-domain values in a summary table for comparison across all breathing rates.
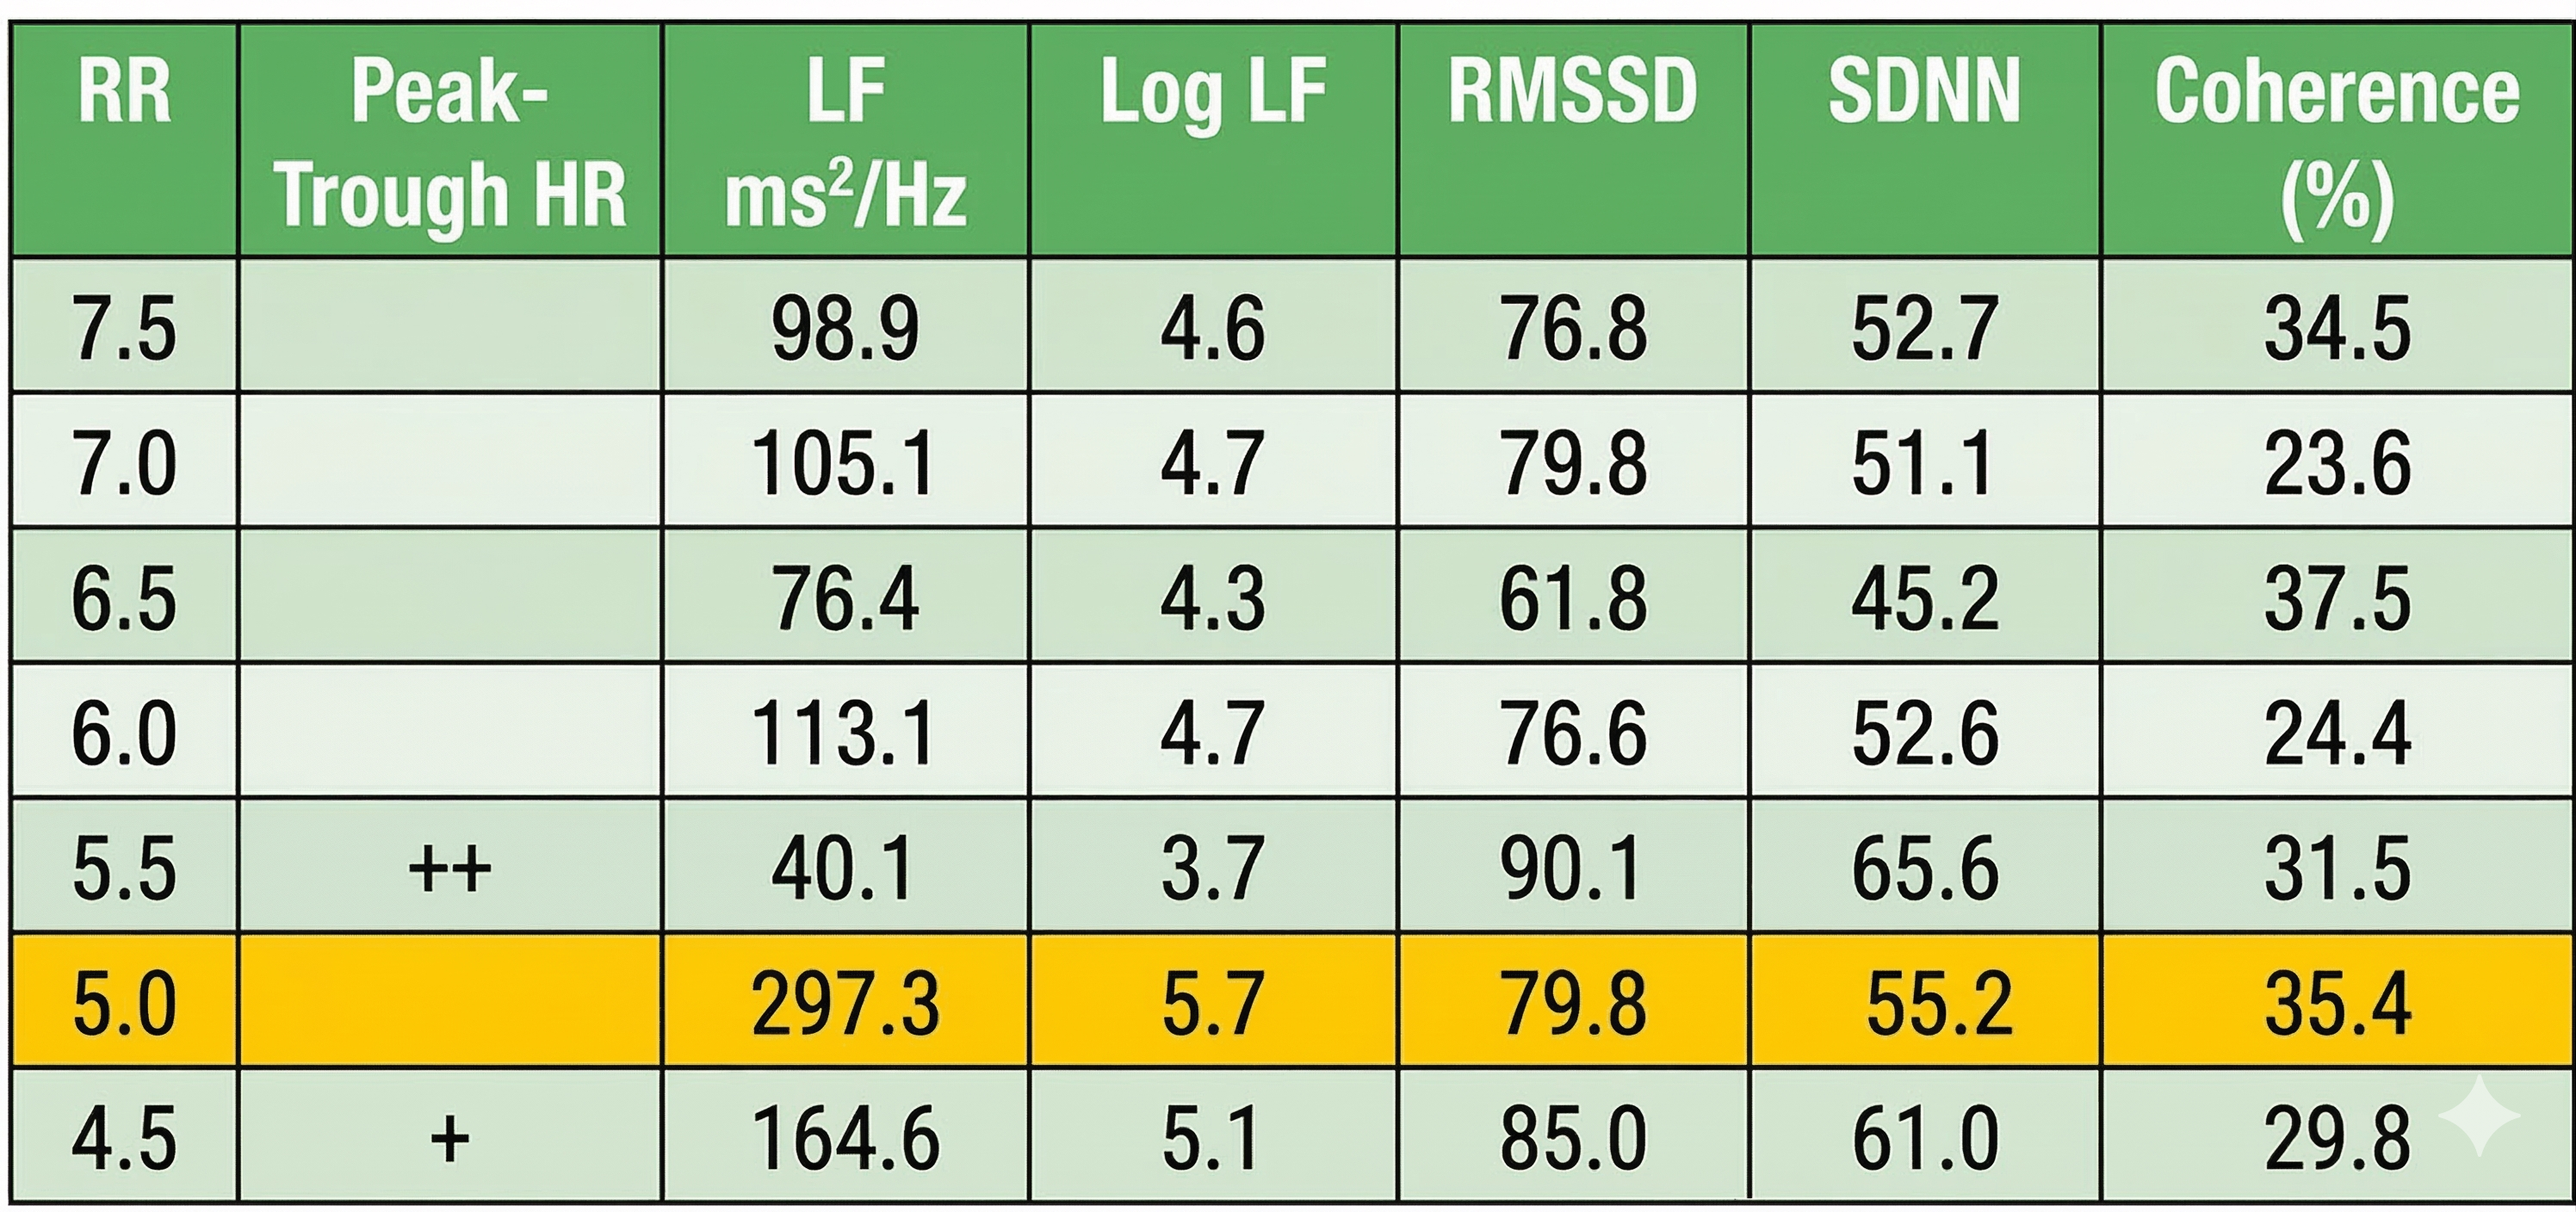
Select the RF using these criteria: normalized LF power and peak-trough HR. The strongest case can be made for 5.0 bpm based on its normalized LF value (297.3), although its peak-trough HR values are lower than 5.5 or 4.5 bpm. Confirm the RF during the next session with a series of 2-minute trials at the RF, and one-half breath faster and slower.
Can the Coherence Score Identify the RF?
At least for this case, the highest coherence score (37.5%) would have selected one of the least promising frequencies. Breathing at 6.5 bpm was associated with lower peak-trough HR and LF power than the candidate rates. This finding illustrates why relying on any single metric can be misleading. Following Lehrer, we encourage RF selection based on a "convergence" of measurements rather than any one criterion in isolation.
Comprehension Questions: Alternative Methods and Protocol Selection
- How does the Optimal HRV application extend RF assessment to settings where traditional in-office equipment is unavailable, and what key hardware requirement does it eliminate?
- The Optimal HRV protocol uses seven 2-minute trials ranging from 7.0 to 4.0 bpm with longer exhalations than inhalations. How does this breathing rate range compare to the standard Lehrer stepped protocol, and why might the wider range be clinically useful?
- The Optimal HRV algorithm assigns the greatest weight to LF power when calculating the RF. In the case example, the highest RMSSD and HR MinMax values were observed at 7.0 and 6.5 bpm, yet the algorithm selected 5.0 bpm. What does this discrepancy illustrate about the relationship between different HRV metrics during RF assessment?
- What is the primary limitation of the emWave Pro Plus method for RF assessment compared to the standard stepped protocol?
- Why might the coherence score alone be insufficient for identifying the resonance frequency?
- How does the sliding protocol differ from the stepped protocol in its approach to identifying the RF, and what is the reported difference in RF estimates between the two methods?
- Fisher and Lehrer (2022) described RF selection as "something of an art" when criteria point to different breathing rates. How does this observation apply to interpreting the Optimal HRV application's automated RF calculation?
Unanswered Questions
This section examines four significant research questions that remain unresolved in the field of RF assessment. These questions have direct implications for clinical practice and include whether RF training outperforms generic 6-bpm SPB, the minimum epoch required for valid RF measurements, the test-retest reliability of the Lehrer protocol, and whether rhythmic skeletal muscle tension can replace SPB in RF assessment.
Does RF Training Produce Superior Outcomes?
The fundamental clinical question is whether the time invested in RF assessment translates to better outcomes than simply training all clients at 6 bpm. Initial studies (Lin et al., 2012; Steffen et al., 2017) found evidence that RF-specific training produces greater systolic blood pressure reductions and more positive mood compared to non-RF breathing. However, a recent meta-analysis (Lehrer et al., 2020a) found non-significant effects on diastolic or systolic blood pressure, raising doubt about the generalizability of those earlier findings.
The answer may depend on the disorder being treated. Due to the different pathomechanics underlying different conditions, researchers may need to answer this question one disorder at a time (Shaffer & Meehan, 2020). RF training might prove critical for conditions that are particularly responsive to baroreflex stimulation (such as hypertension) while offering little additional benefit for conditions that respond primarily to the general relaxation effects of slow breathing. Until disorder-specific evidence accumulates, the most prudent clinical approach is to continue conducting RF assessments when feasible.
What Minimum Epoch Is Required to Obtain Valid Resonance Frequency Measurements?
The standard protocol uses 2-minute recording epochs, but no peer-reviewed study has demonstrated that this duration achieves acceptable concurrent validity with respect to 5-minute recordings for RF criteria like heart rate-respiration phase synchrony and HR Max-HR Min. This is a significant gap because clinicians routinely make RF decisions based on these 2-minute epochs.
Different epoch lengths may be required for different HRV metrics. Shaffer et al. (2019) evaluated concurrent validity of LF and normalized LF power in 38 healthy undergraduates using stringent criteria: a Pearson's correlation of 0.90 and Bland-Altman limits of agreement within ±5% of the 5-minute value range. They found that 90-second epochs were sufficient for LF power, but 180-second records were needed to estimate 5-minute normalized LF power. Researchers should investigate the concurrent validity of ultra-short RF versus 5-min measures with a larger, more representative sample (Shaffer & Meehan, 2020).
How Reliable Is RF Assessment?
Reliability is a pivotal question for RF assessment. If the RF changes significantly across sessions, the clinical rationale for investing an entire session in its measurement weakens considerably.
How Breathing Can Invalidate RF Calculations
Stepped RF measurement protocols depend on clients precisely following pacing displays during SPB. Remember, resting adults typically breathe from 12-20 bpm, and RF protocols require them to breathe at a fraction of these rates. Even without dysfunctional breathing, this can be extremely challenging for healthy undergraduates, and harder still for clinical populations diagnosed with asthma and chronic pain. The Truman Center for Applied Psychophysiology measures real-time RR, and requires that participants immediately repeat trials when they are 0.25 bpm faster or slower than the target RR.
Unless clinicians and performance coaches perform these manipulation checks, their initial RF measurements may be invalid with poor test-retest reliability. In this case, RF instability is due to measurement error, not intrinsic RF variability.
How Acute Stress Can Change the RF
The traditional view is that the adult cardiorespiratory system RF is a relatively fixed trait, largely dictated by anatomical factors like height and total blood volume. This fixed inertia model assumes that the RF is determined by the constant delay in the baroreflex negative feedback system, which takes about 5 seconds for a change in heart rate to mechanically produce a change in blood pressure (Lehrer, 2013).
However, there is evidence that the baroreflex delay is not always constant. Transient states like acute stress can cause rapid vasoconstriction, which alters the mechanical inertia and resistance within the vascular tree (Xie et al., 2017). As a result, delay is shorter and the RF shifts upward.
When acute stress activates the sympathetic nervous system, it triggers rapid vasoconstriction, which decreases arterial compliance and temporarily stiffens the blood vessels. Central or reflex activation of peripheral sympathetic nerves causes vasoconstriction that can selectively or diffusely increase peripheral vascular resistance. This stiffening, in turn, increases pulse wave velocity (PWV), the speed at which the physical pressure wave generated by each heartbeat travels from the heart through the arterial system.
Research has demonstrated that acute increases in sympathetic activity can independently increase both central and whole-body arterial stiffness, even after controlling for the confounding effects of altered blood pressure.
The consequences for the RF follow directly. Because the blood pressure wave travels faster through stiffened arteries, it reaches the baroreceptors in the carotid sinus and aortic arch more quickly, shortening the total baroreflex delay. The baroreflex operates as a closed-loop negative feedback system, and its RF is mathematically defined by the inverse of twice the loop delay.
Inertia and plasticity of the vasculature produce a delay that accounts for the approximately 0.1 Hz resonance in the cardiovascular system, and this delay can depend on factors such as blood volume, blood viscosity, and the length and volume of the vasculature. The delays between heart rate and blood pressure changes, roughly a 10-second period, result in a resonance frequency at about 0.1 Hz and are specific to the HR loop of the baroreflex. Therefore, if vasoconstriction shortens the delay from approximately 5 seconds to 4 seconds, the resonance frequency would shift upward from 0.10 Hz (6 bpm) to an estimated 0.125 Hz (7.5 bpm).
Test-Retest Reliability Studies
Wally et al. (2011) provided encouraging results for Lehrer and colleagues' original protocol: in 21 undergraduate participants monitored with ECG and respirometer, the RF was stable (r = 0.73, d = 2.14) over a 2-week interval, with breathing rate verified within 0.25 bpm of the target.However, Capdevila and colleagues (2021) found more complex results. While the mean group RF was stable from pretest to posttest (6.1 versus 5.9 bpm) and the group modes were identical (6 versus 6 bpm), a granular analysis revealed that 66.7% of individual RFs changed between sessions.
Critically, the authors did not use a respirometer to confirm real-time breathing rates. Instead, they inferred whether participants followed the pacing rhythm by examining each trial's FFT power spectrum after collecting the data. They provided no evidence that each participant breathed within 0.25 bpm of target rates during each stepped SPB trial. Without this methodological control, inconsistent breathing could have accounted for the observed individual RF changes.
Researchers should replicate these studies using a larger, more representative sample and the recommended methodological controls.
How to Increase RF Validity and Test-Retest Reliability
Address breathing by monitoring it with a respirometer, providing SPB practice until clients can demonstrate their ability to breathe between 4.5 and 7.5 bpm. When measuring the RF using a stepped protocol, confirm their breathing within 0.25 bpm of the target before proceeding to the next rate.
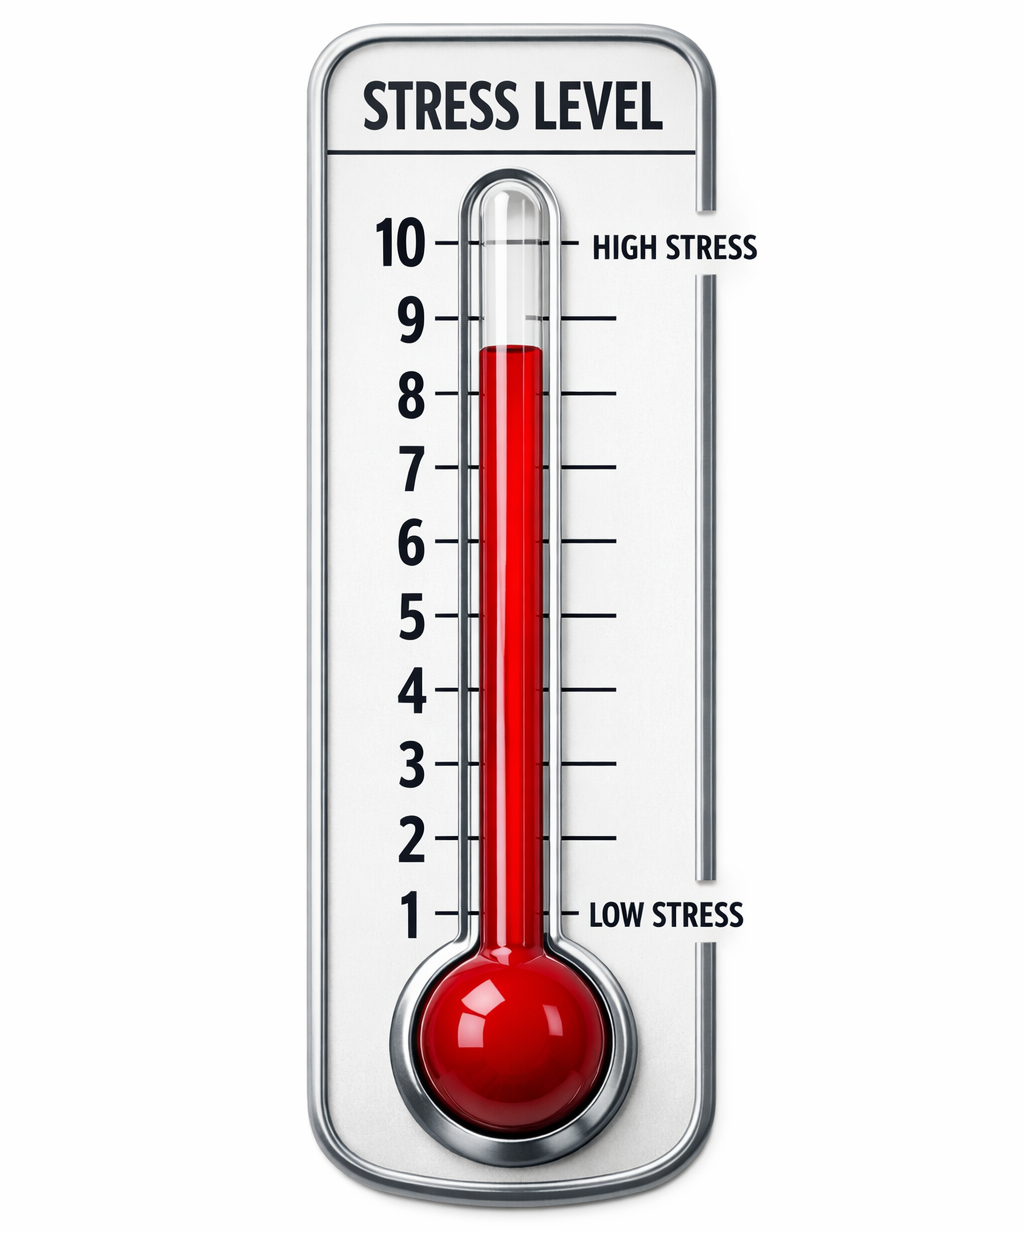
Since you cannot control your client's acute stressors like sleep deprivation, consider tracking self-reported stress using an analog stress scale and adjusting for its effects.
When HRV biofeedback at their original RF yields lower RSA, repeat the fine-tuning process to dial-in their current RF. Use this value for subsequent sessions until they experience another RSA decline. Then, dial-in their RF, again.
Could Slow-Paced Contraction Replace SPB in RF Assessment?
Slow-paced muscle contraction (SPC) can stimulate the baroreflex similarly to resonance frequency breathing and increase LF HRV power (Vaschillo et al., 2011). In their study, participants in a semi-recumbent position rhythmically contracted their hands and feet at 3, 6, and 12 times per minute. Notably, SPC produced high-amplitude oscillations in blood pressure, heart rate, and vascular tone only at 6 contractions per minute (0.1 Hz)—the frequency at which many cardiovascular systems resonate.
These findings raise an intriguing possibility: SPC could replace SPB for both RF measurement and HRV biofeedback training. This would eliminate the challenging requirement that clients breathe at prolonged slow rates—a significant barrier for individuals with anxiety, chronic pain, or respiratory conditions. Before this protocol can be adopted clinically, however, research must demonstrate acceptable criterion validity (confirmation that test scores accurately estimate scores of validated measures; Gulliksen, 1987) with respect to SPB, as well as acceptable test-retest reliability (Shaffer & Meehan, 2020).

Four critical research questions remain. First, it is unclear whether RF-specific training produces better outcomes than generic 6-bpm breathing, and the answer may need to be determined one disorder at a time. Second, the minimum epoch length needed for valid RF measurements has not been established for the most critical criteria. Third, RF reliability faces two distinct threats: measurement error from inaccurate breathing and genuine RF shifts caused by acute stress. Inaccurate breathing is the more controllable threat; clinicians should monitor respiratory rate in real time and require breathing within 0.25 bpm of the target before accepting any trial. Acute stress can independently shift the RF upward by triggering vasoconstriction, which stiffens arteries, increases pulse wave velocity, and shortens the baroreflex delay. The limited test-retest data show promising group-level stability (r = 0.73 over two weeks with breathing verified), but a study without respiratory monitoring found that two-thirds of individual RFs changed between sessions. Fourth, slow-paced contraction at 0.1 Hz may offer an alternative to SPB for clients who cannot sustain slow breathing rates, but criterion validity research is needed before clinical adoption.
Comprehension Questions: Unanswered Questions
- Why might the question of whether RF training produces superior outcomes need to be answered one disorder at a time?
- How can inaccurate breathing during a stepped RF protocol produce poor test-retest reliability, and what manipulation check can clinicians use to prevent this source of measurement error?
- Explain the physiological chain through which acute stress can shift the resonance frequency upward, beginning with sympathetic activation and ending with a changed baroreflex delay.
- What methodological limitation in the Capdevila et al. (2021) study may have inflated the appearance of RF instability, and how did the Wally et al. (2011) study address this limitation?
- A client whose RF was previously measured at 6.0 bpm returns for a session after a sleepless night and shows lower RSA at that rate. Using the strategies described in this section, what two steps should the clinician take?
- How might SPC address challenges that some clients face during traditional SPB RF assessment?
Cutting Edge Topics
Machine Learning Approaches to RF Determination
Researchers are beginning to explore whether machine learning algorithms could automate RF selection. Rather than relying on a clinician's subjective weighting of the six selection criteria, computational approaches could analyze multiple HRV parameters simultaneously to identify optimal breathing rates. This could improve consistency across practitioners and clinics, reduce the time required for assessment, and potentially identify RF estimates that fall between the 0.5-bpm steps of the standard protocol.
Wearable Technology and Remote RF Assessment
The growing accuracy of consumer-grade heart rate sensors in smartwatches and chest straps raises the question of whether RF assessment could move outside the clinic. While current PPG-based wearables may lack the precision needed during SPB, advances in sensor technology and signal processing may eventually enable reliable at-home RF determination. This would expand access to personalized HRV biofeedback, particularly for rural and underserved populations.
Individual Variability in RF Stability
The finding by Capdevila et al. (2021) that two-thirds of individual RFs changed across sessions, despite group-level stability, highlights a critical question. Some researchers speculate that RF may vary with factors like hydration status, recent physical activity, autonomic state, and even time of day. Understanding the sources of individual variability could lead to dynamic RF protocols that adapt to a client's current physiological state rather than relying on a single fixed estimate.
Assignment
These recordings were from a chronic pain patient who received treatment in an interdisciplinary chronic pain program. Look at the summary screens for pacing at 6.5 and 6.0 breaths per minute. Based on these data, which RR is closer to the client's resonance frequency? Why?
Check the mean RRs to confirm that this client breathed at the pacing rates. He did. Examine the values for HR Max - HR Min and LF amplitude—both were higher at 6.0 than 6.5. Inspect the synchrony of the HR and respirometer tracings: the peaks and valleys were more closely aligned at 6.0 than 6.5 breaths per minute.
Finally, compare the hand temperatures—his hands were almost 4 degrees F warmer at 6.0 than 6.5, suggesting greater parasympathetic activation and peripheral vasodilation at that rate. The overall pattern of his measurements argues for training at 6.0 breaths per minute. If the clinic had monitored skin conductance during this session, it might have decreased at the breathing rate closest to his resonance frequency.
Glossary
artifacts: false values in physiological recordings caused by movement, sensor malfunction, or signal interference.
baroreflex gain: HR change per 1 mmHg change in BP.
coherence: self-coherence; signal power in the 0.09-0.14 region of the LF band.
fixed inertia model: the assumption that the adult cardiovascular RF is a relatively stable trait determined by the constant delay (~5 seconds) in the baroreflex negative feedback loop, which is itself dictated by invariant anatomical factors like height and total blood volume.
frequency-domain measures of HRV: the calculation of the absolute or relative power of the HRV signal within four frequency bands.
high-frequency (HF) band: the HRV frequency range from 0.15-0.40 Hz representing the inhibition and activation of the vagus nerve by breathing (RSA).
HR Max-HR Min: a HRV index that calculates the average difference between the highest and lowest HRs during each respiratory cycle.
interbeat interval (IBI): the time interval between the peaks of successive R-spikes (initial upward deflections in the QRS complex). The IBI is also called the NN (normal-to-normal) interval.
low-frequency (LF) band: the HRV frequency range of 0.04-0.15 Hz that may represent the influence of PNS and baroreflex activity (when breathing at resonance frequency).
Mayer waves: spontaneous, rhythmic oscillations in arterial blood pressure and vascular tone that occur at a low frequency of approximately 0.1 Hz (about one cycle every 10 seconds) in humans. They arise primarily from sympathetic baroreflex feedback loops that regulate vascular resistance and maintain blood pressure stability. These oscillations reflect the dynamic interaction between baroreceptor sensing, central autonomic control, and sympathetic modulation of peripheral vasculature.
peak-trough HR: the difference between the fastest and slowest HR in each breathing cycle.
resonance frequency: the frequency at which a system, like the cardiovascular system, can be activated or stimulated.
respiratory sinus arrhythmia (RSA): respiration-driven heart rhythm that contributes to the high frequency (HF) component of heart rate variability. Inhalation inhibits vagal nerve slowing of the heart (increasing HR), while exhalation restores vagal slowing (decreasing HR).
respirometer: a sensor that changes resistance to a current as it expands and contracts during the respiratory cycle.
SD1: the standard deviation of the distance of each point from the y = x-axis that measures short-term HRV.
slow-paced breathing (SPB): diaphragmatic breathing between 4.5 to 6.5 bpm.
slow-paced contraction (SPC): the simultaneous contraction of the wrists, core, and ankles between 4.5 to 6.5 cpm to increase RSA.
time-domain measures of HRV: indices like SDNN that measure the degree to which the IBIs between successive heartbeats vary.
very-low-frequency (VLF) band: the HRV frequency range of 0.003-0.04 Hz that may represent temperature regulation, plasma renin fluctuations, endothelial and physical activity influences, and possible intrinsic cardiac, PNS, and SNS contributions.
References
Allen, J. (2019). Quantifying the delays between multi-site photoplethysmography pulse and electrocardiogram R-R interval changes under slow-paced breathing. Frontiers in Physiology, 10, 1190. https://doi.org/10.3389/fphys.2019.01190
Buchheit, M. (2010). Respiratory sinus arrhythmia and pulmonary gas exchange efficiency: Time for a reappraisal. Experimental Physiology, 95, 767. https://doi.org/10.1113/expphysiol.2010.053470
Capdevila, L., Parrado, E., Ramos-Castro, J., Zapata-Lamana, R., & Lalanza, J. F. (2021). Resonance frequency is not always stable over time and could be related to the inter-beat interval. Scientific Reports, 11, 8400. https://doi.org/10.1038/s41598-021-87867-8
Cipresso, P., Colombo, D., & Riva, G. (2019). Computational psychometrics using psychophysiological measures for the assessment of acute mental stress. Sensors, 19, 781. https://doi.org/10.3390/s19040781
Fisher, L. R., & Lehrer, P. M. (2022). A method for more accurate determination of resonance frequency of the cardiovascular system, and evaluation of a program to perform it. Applied Psychophysiology and Biofeedback, 47(1), 17–26. https://doi.org/10.1007/s10484-021-09524-0
Gevirtz, R. N. (2005). Heart rate variability biofeedback in clinical practice. AAPB Fall workshop.
Giardino, N. D., Lehrer, P. M., & Edelberg, R. (2002). Comparison of finger plethysmograph to ECG in the measurement of heart rate variability. Psychophysiology, 39, 246–253. https://doi.org/10.1111/1469-8986.3920246
Gulliksen, H. (1987). Theory of mental tests. Erlbaum.
Jan, H. Y., Chen, M. F., Fu, T. C., Lin, W. C., Tsai, C. L., & Lin, K. P. (2019). Evaluation of coherence between ECG and PPG derived parameters on heart rate variability and respiration in healthy volunteers with/without controlled breathing. Journal of Medical and Biological Engineering, 39, 783–795. https://doi.org/10.1007/s40846-019-00468-9
Khazan, I. (2019a). Biofeedback and mindfulness in everyday life: Practical solutions for improving your health and performance. W. W. Norton & Company.
Khazan, I. (2019b). A guide to normal values in biofeedback. In D. Moss & F. Shaffer (Eds.), Physiological recording technology and applications in biofeedback and neurofeedback (pp. 2–6). Association for Applied Psychophysiology and Biofeedback.
Khazan, I. Z. (2013). The clinical handbook of biofeedback: A step-by-step guide for training and practice with mindfulness. Wiley-Blackwell.
Lehrer, P., Kaur, K., Sharma, A., Shah, K., Huseby, R., Bhavsar, J., Sgobba, P., & Zhang, Y. (2020a). Heart rate variability biofeedback improves emotional and physical health and performance: A systematic review and meta-analysis. Applied Psychophysiology and Biofeedback, 45, 109–129. https://doi.org/10.1007/s10484-020-09466-z
Lehrer, P., Vaschillo, B., Zucker, T., Graves, J., Katsamanis, M., Aviles, M., & Wamboldt, F. (2013). Protocol for heart rate variability biofeedback training. Biofeedback, 41(3), 98–109. https://doi.org/10.5298/1081-5937-41.3.08
Lehrer, P. M. (2013). Personal communication regarding the test-retest reliability of the resonance frequency in adults.
Lehrer, P. M., & Gevirtz, R. (2014). Heart rate variability: How and why does it work? Frontiers in Psychology. https://doi.org/10.3389/fpsyg.2014.00756
Lehrer, P. M., Vaschillo, E., & Vaschillo, B. (2000). Resonant frequency biofeedback training to increase cardiac variability: Rationale and manual for training. Applied Psychophysiology and Biofeedback, 25(3), 177–191. https://doi.org/10.1023/A:1009554825745
Lin, G., Xiang, Q., Fu, X., Wang, S., Wang, S., Chen, S., . . . Wang, T. (2012). Heart rate variability biofeedback decreases blood pressure in prehypertensive subjects by improving autonomic function and baroreflex. Journal of Alternative and Complementary Medicine, 18, 143–152. https://doi.org/10.1089/acm.2010.0607
Meehan, Z., Muesenfechter, N., Gravett, N., Watson, T., Smith, A., Shearman, S., . . . Shaffer, F. (2017). A 1:2 inhalation-to-exhalation ratio does not increase heart rate variability during 6-bpm breathing [Abstract]. Applied Psychophysiology and Biofeedback, 45, 110–111. https://doi.org/10.1007/s10484-018-9390-8
Peper, E., Gibney, K. H., Tylova, H., Harvey, R., & Combatalade, D. (2008). Biofeedback mastery: An experiential teaching and self-training manual. Association for Applied Psychophysiology and Biofeedback.
Schafer, A., & Vagedes, J. (2013). How accurate is pulse rate variability as an estimate of heart rate variability? A review on studies comparing photoplethysmographic technology with an electrocardiogram. International Journal of Cardiology, 166, 15–29. https://doi.org/10.1016/j.ijcard.2012.03.119
Shaffer, F., & Combatalade, D. (2013). Don't add or miss a beat: A guide to cleaner heart rate variability recordings. Biofeedback, 41, 121–130. https://doi.org/10.5298/1081-5937-41.3.04
Shaffer, F., & Meehan, Z. M. (2020). A practical guide to resonance frequency assessment for heart rate variability biofeedback. Frontiers in Neuroscience. https://doi.org/10.3389/fnins.2020.570400
Shaffer, F., & Moss, D. (2019). Biofeedback. In D. Bugada, V. Bellini, E. G. Bignami, & L. F. Lorini (Eds.), Brain and heart dynamics (pp. 1–15). Springer.
Steffen, P. R., Austin, T., DeBarros, A., & Brown, T. (2017). The impact of resonance frequency breathing on measures of heart rate variability, blood pressure, and mood. Frontiers in Public Health, 5, 222. https://doi.org/10.3389/fpubh.2017.00222
Steffen, P. R., Bartlett, D., Channell, R. M., Jackman, K., Cressman, M., Bills, J., & Pescatello, M. (2021). Integrating breathing techniques into psychotherapy to improve HRV: Which approach is best? Frontiers in Psychology, 12, 624254. https://doi.org/10.3389/fpsyg.2021.624254
Strauss-Blasche, G., Moser, M., Voica, M., McLeod, D., Klammer, N., & Marktl, W. (2000). Relative timing of inspiration and expiration affects respiratory sinus arrhythmia. Clinical and Experimental Pharmacology and Physiology, 27, 601–606. https://doi.org/10.1046/j.1440-1681.2000.03306.x
Van Diest, I., Verstappen, K., Aubert, A. E., Widjaja, D., Vansteenwegen, D., & Vlemincx, E. (2014). Inhalation/exhalation ratio modulates the effect of slow breathing on heart rate variability and relaxation. Applied Psychophysiology and Biofeedback, 39, 171–180. https://doi.org/10.1007/s10484-014-9253-x
Vaschillo, E., Lehrer, P., Rishe, N., & Konstantinov, M. (2002). Heart rate variability biofeedback as a method for assessing baroreflex function: A preliminary study of resonance in the cardiovascular system. Applied Psychophysiology and Biofeedback, 27(1), 1–27. https://doi.org/10.1023/a:1014587304314
Vaschillo, E. G., Vaschillo, B., & Lehrer, P. M. (2004). Heartbeat synchronizes with respiratory rhythm only under specific circumstances. Chest, 126, 1385–1386. https://doi.org/10.1016/S0012-3692(15)31329-5
Vaschillo, E. G., Vaschillo, B., Pandina, R. J., & Bates, M. E. (2011). Resonances in the cardiovascular system caused by rhythmical muscle tension. Psychophysiology, 48, 927–936. https://doi.org/10.1111/j.1469-8986.2010.01156.x
Wally, C., Korenfeld, I., Brooks, K., Carrell, D., Lau, D., Peterson, J., Schafer, M., Truitt, A., Fuller, J., Westermann-Long, A., & Korenfeld, D. (2011). Resonance frequency measurements are reliable [Abstract]. Poster presented at the meeting of the Association for Applied Psychophysiology and Biofeedback, New Orleans, Louisiana.
Weinschenk, S. W., Beise, R. D., & Lorenz, J. (2016). Heart rate variability (HRV) in deep breathing tests and 5-min short-term recordings: Agreement of ear photoplethysmography with ECG measurements, in 343 subjects. European Journal of Applied Physiology, 116, 1527–1535. https://doi.org/10.1007/s00421-016-3401-3
Xie, L., Liu, B., Wang, X., Mei, M., Li, M., Yu, X., & Zhang, J. (2017). Effects of different stresses on cardiac autonomic control and cardiovascular coupling. Journal of Applied Physiology, 122, 435 445. https://doi.org/10.1152/japplphysiol.00245.2016
Zerr, C., Kane, A., Vodopest, T., Allen, J., Hannan, J., Fabbri, M., . . . Shaffer, F. (2015). Does inhalation-to-exhalation ratio matter in heart rate variability biofeedback? [Abstract]. Applied Psychophysiology and Biofeedback, 40(2), 135. https://doi.org/10.1007/s10484-015-9282-0
Return to Top