Electrocardiogram (ECG) Instrumentation
What You Will Learn
The electrocardiogram is your most powerful tool for accurate heart rate and heart rate variability measurement. In this unit, you will learn how the heart's electrical conduction system generates the ECG signal, how to select and apply ECG sensors, and how to choose among six standard electrode placements based on your clinical priorities.
You will also develop the skills to recognize and troubleshoot the most common ECG artifacts, from line interference and EMG contamination to movement and polarity problems. Finally, you will master the tracking test, a simple but essential quality-assurance check that confirms your data acquisition system faithfully displays changes in client HRV.

BCIA Blueprint Coverage
This unit addresses III. HRV Instrumentation: B. The electrocardiogram (ECG/EKG).
Professionals completing this unit will be able to discuss electrocardiogram source, ECG sensors, signal characteristics, sensor placements, tracking tests, and artifacts. Specifically, this unit covers the source of the ECG, ECG sensors, ECG signal, sampling rate, ECG sensor placement, ECG artifacts, and tracking tests.
🎧 Listen to the Full Chapter Lecture
Source of the ECG Signal
This section explains where the ECG signal originates and how the heart's conduction system produces the waveform you will monitor during biofeedback sessions. Understanding this electrical pathway is essential because any disruption along it can alter the signal your software detects, directly affecting the accuracy of your HRV measurements.
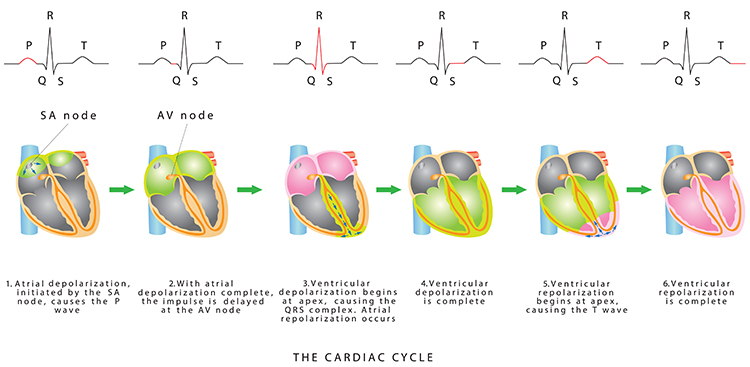
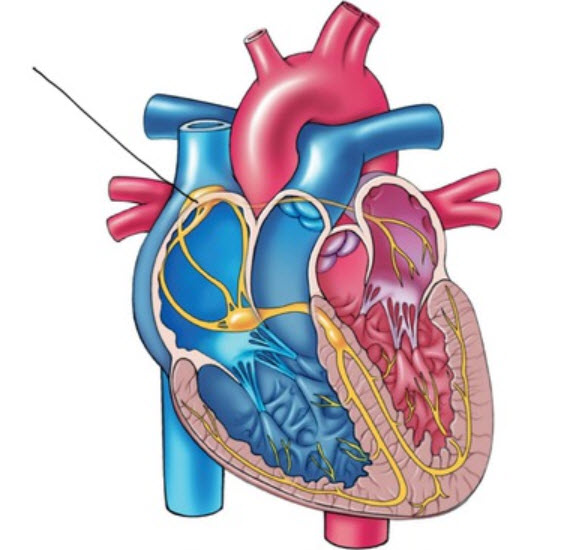
In a healthy heart, the SA node—a cluster of autorhythmic cells in the right atrium—initiates each cardiac cycle by spontaneously depolarizing. The SA node fires 60–100 action potentials per minute, a rate fast enough to prevent slower regions of the conduction system and the myocardium (heart muscle) from generating competing electrical impulses. This dominance is why the SA node is called the heart's natural pacemaker.
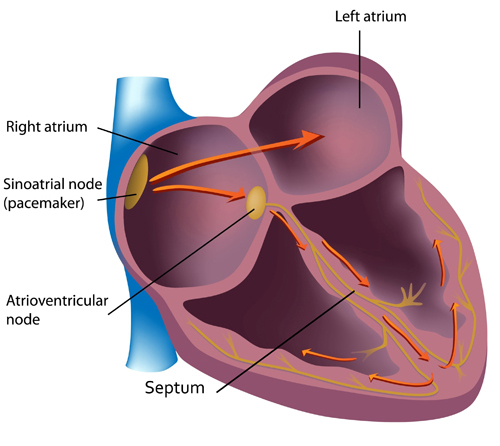
Each SA node impulse travels through the atria to the AV node in about 0.03 seconds, triggering the AV node to fire. As the contractile fibers of the atria depolarize, they produce the P wave—the first deflection of the ECG waveform. The P wave culminates in atrial contraction (atrial systole), which pushes blood into the ventricles.
ECG Sensors
This section covers the hardware you need to capture the ECG signal: electrode assemblies, lead cables, and electrode types. Selecting the right sensors and preparing the skin properly are your first lines of defense against noisy, artifact-laden recordings.
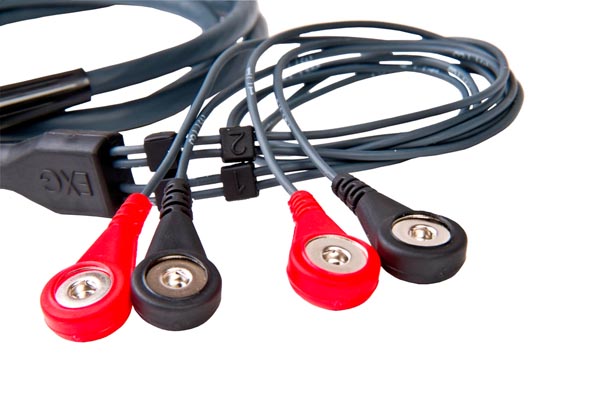
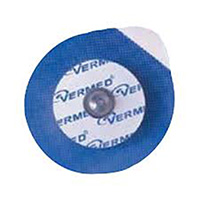
Three- or four-lead electrode assemblies are sufficient to record the ECG signal for HRV biofeedback. There is no universal color-coding system for ECG electrodes, so always consult your manufacturer's documentation (Lehrer, 2018b). ECG sensors can be identical to EMG sensors and use standard lead cables with snap buttons onto which disposable electrodes are affixed.
Both dry and gelled electrodes can be used for ECG recording. Pre-gelled disposable electrodes are the preferred choice in most clinical settings because they save preparation time, ensure consistent skin-electrode contact, and reduce the risk of cross-contamination between clients.
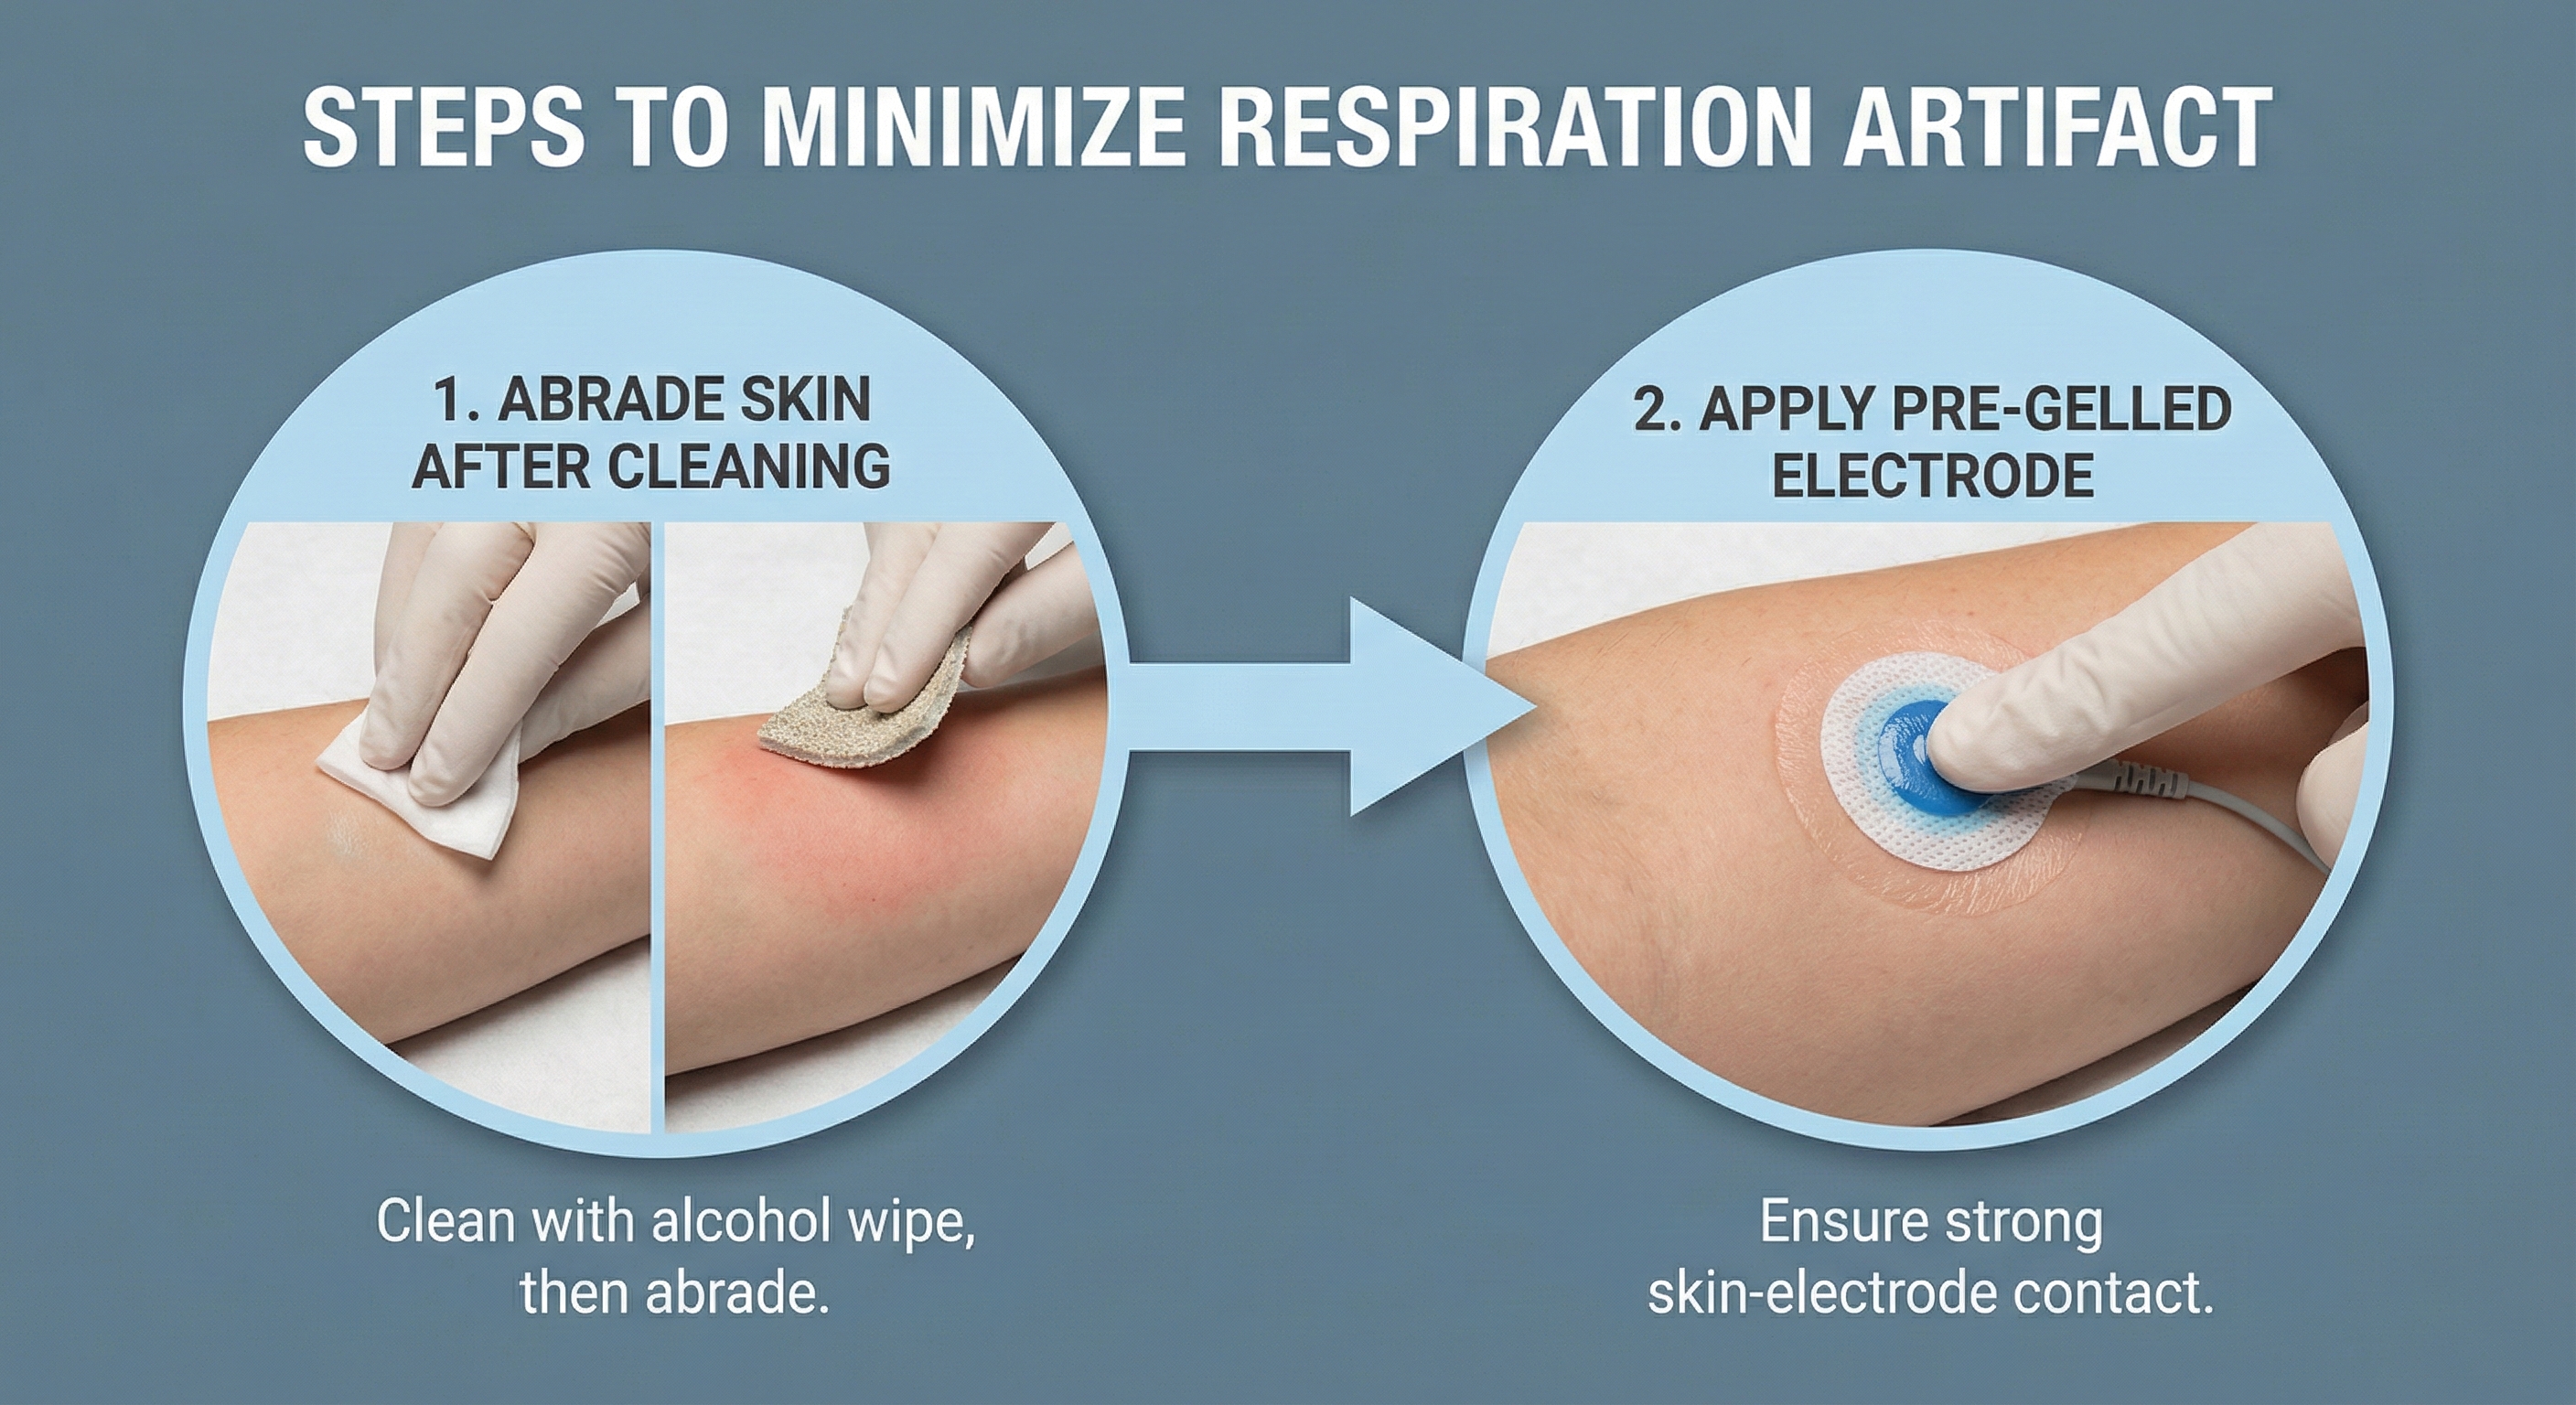
Skin Preparation
Good skin preparation is one of the simplest steps you can take to ensure a clean ECG signal, yet it is frequently overlooked. Prepare the skin by rubbing the electrode site with an alcohol wipe to remove oil and dirt. This cleaning reduces impedance—the opposition to alternating current (AC) flow—which improves signal quality and reduces the likelihood of drift artifacts. For male clients, you may need to shave the chest or abdomen if body hair prevents satisfactory electrode contact.
ECG Signal
This section traces the ECG waveform from ventricular depolarization through repolarization. Understanding each waveform component matters clinically because your biofeedback software relies on one specific deflection—the R-spike—to detect heartbeats and calculate the interbeat interval (IBI) that drives every HRV metric.
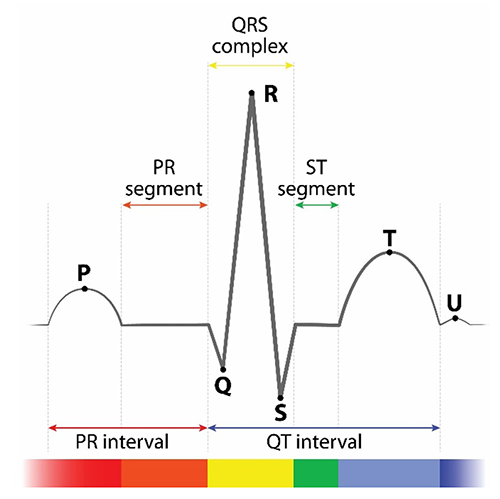
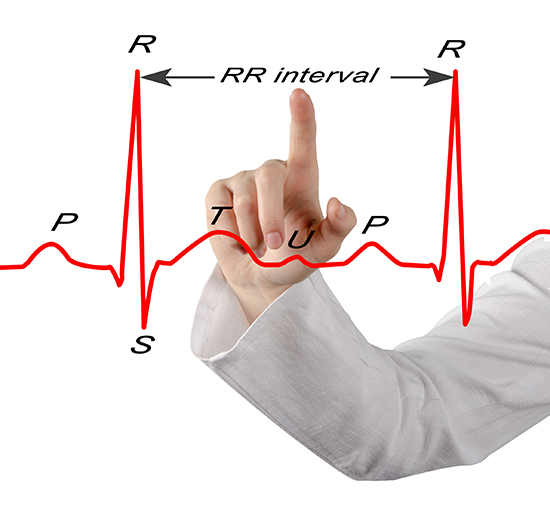
The signal from the SA node rapidly spreads through the atrioventricular (AV) bundle, reaching the top of the septum. Descending right and left bundle branches conduct the action potential over the ventricles about 0.2 seconds after the appearance of the P wave. Conduction myofibers extend from the bundle branches into the myocardium, depolarizing the contractile fibers of the ventricles (the lower chambers) and generating the QRS complex. The R-spike—the tallest upward deflection in the QRS complex (depicted below at 3)—is the landmark your software uses to detect each heartbeat and measure the IBI.
The ventricles contract (ventricular systole) soon after the QRS complex emerges, and their contraction continues through the S-T segment. Ventricular contractile fiber repolarization then generates the T wave about 0.4 seconds after the P wave. The ventricles relax (ventricular diastole) approximately 0.6 seconds after the P wave begins, completing the cardiac cycle (Tortora & Derrickson, 2021). Check out the YouTube video 15 Second EKG for a rapid visual review of these waveform components.
Sampling Rate
This section addresses how fast your system must digitize the ECG signal to produce reliable HRV data. Sampling rate directly determines the precision of your R-spike detection, so getting it right is a prerequisite for valid clinical measurements.
The Task Force of the European Society of Cardiology and the North American Society of Pacing and Electrophysiology (1996) recommended an ECG sampling rate of at least 250–500 Hz without interpolation. Laborde et al. (2017) advised a minimum 125-Hz rate for research but suggested a minimum 500-Hz rate when respiratory sinus arrhythmia (RSA) amplitude is low. For most clinical HRV biofeedback applications, 250 Hz provides a practical balance of timing accuracy and manageable data file sizes.
Comprehension Questions: ECG Source, Sensors, and Signal
- What role does the SA node play in generating the ECG signal?
- Why is skin preparation important before applying ECG electrodes?
- Which component of the ECG waveform does software use to detect a heartbeat and measure the IBI?
- What minimum sampling rate did the Task Force (1996) recommend for ECG recording, and why does sampling rate matter for HRV measurement?
ECG Sensor Placements
This section covers six standard ECG electrode placements and the practical trade-offs among them. Choosing the right placement is one of your most consequential clinical decisions because it affects signal quality, client comfort, and session efficiency—factors that directly influence treatment outcomes whether you are working in a VA clinic, a hospital rehabilitation unit, or a sports performance lab.
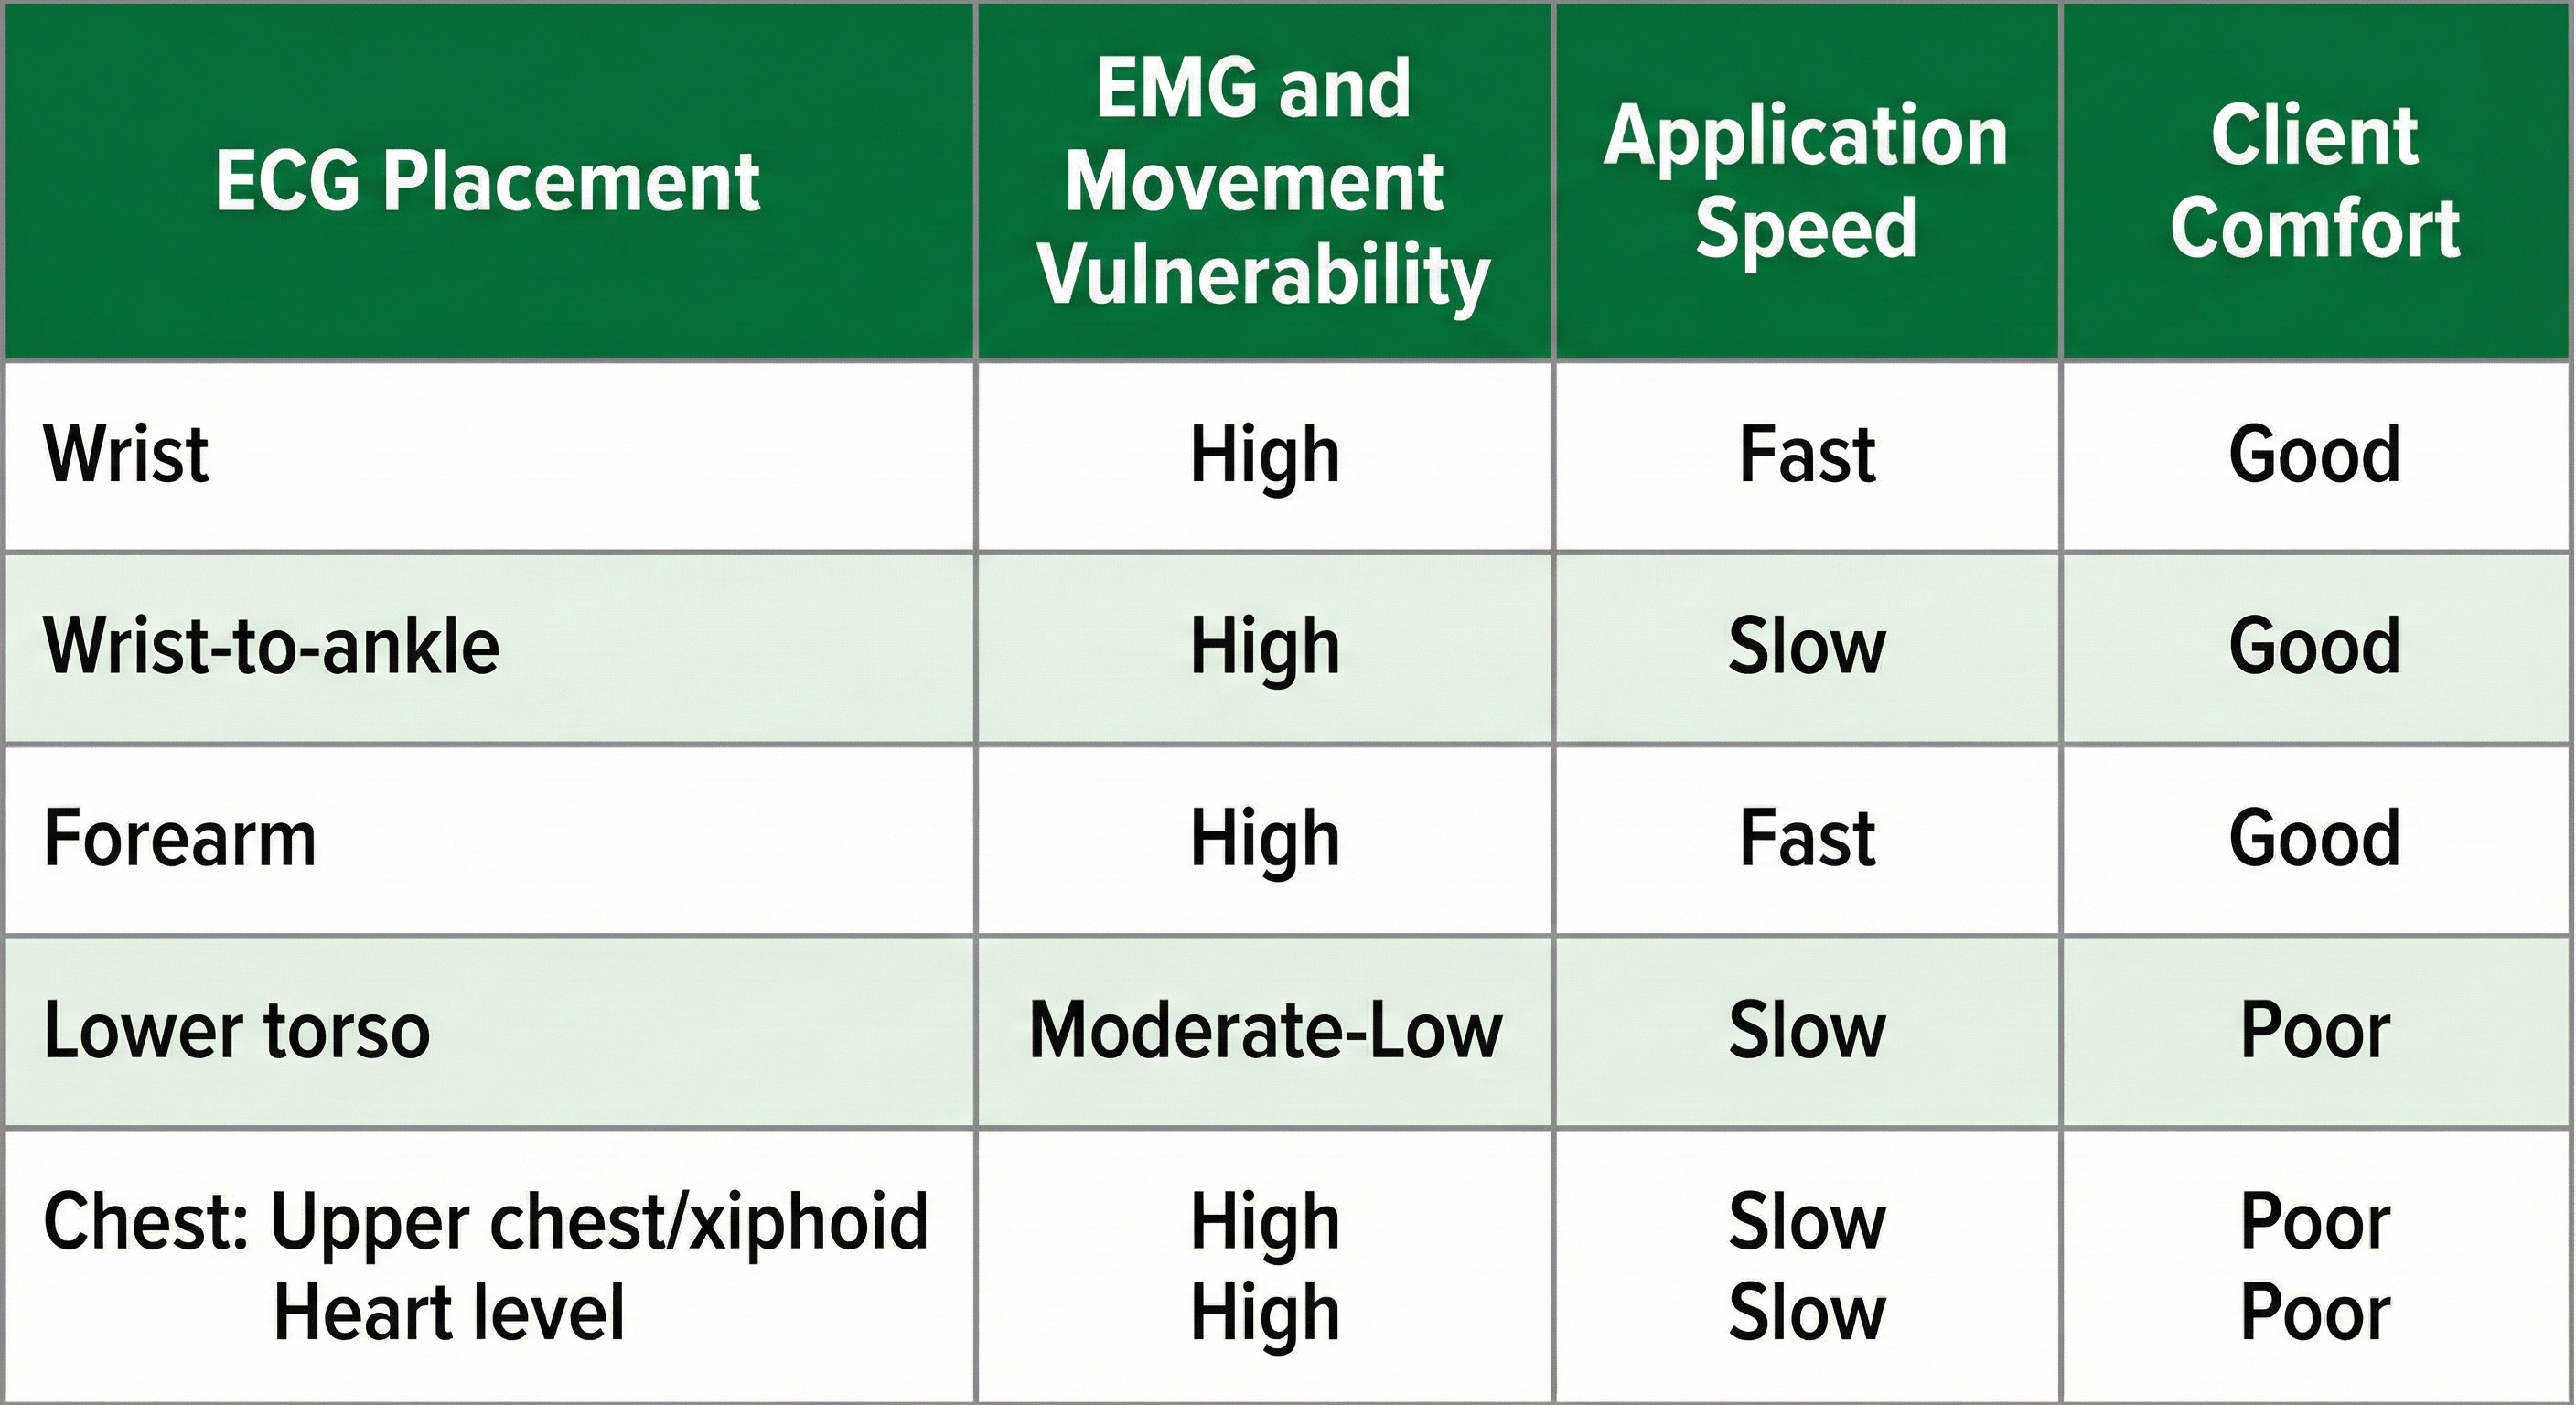
The six placements—wrist, wrist-to-ankle, forearm, lower torso, and two chest configurations (upper chest/xiphoid and heart level)—differ in their vulnerability to skeletal muscle (EMG) and movement artifact, speed of application, and degree of client comfort. Understanding these trade-offs allows you to match the placement to the clinical situation rather than defaulting to a single approach for every client.
🎧 Mini-Lecture: Six ECG Placements
Wrist Placement
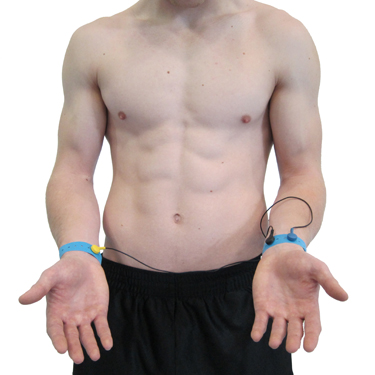
A wrist placement uses electrode straps rather than adhesive electrodes: one strap attaches an active electrode to the right wrist and the other attaches the reference and second active electrode to the left wrist. This is the easiest, most socially comfortable, and quickest ECG electrode placement—making it ideal for initial sessions with anxious clients or in settings where rapid setup is essential. However, it is the most vulnerable to arm EMG and movement artifacts, so monitor your raw signal closely.
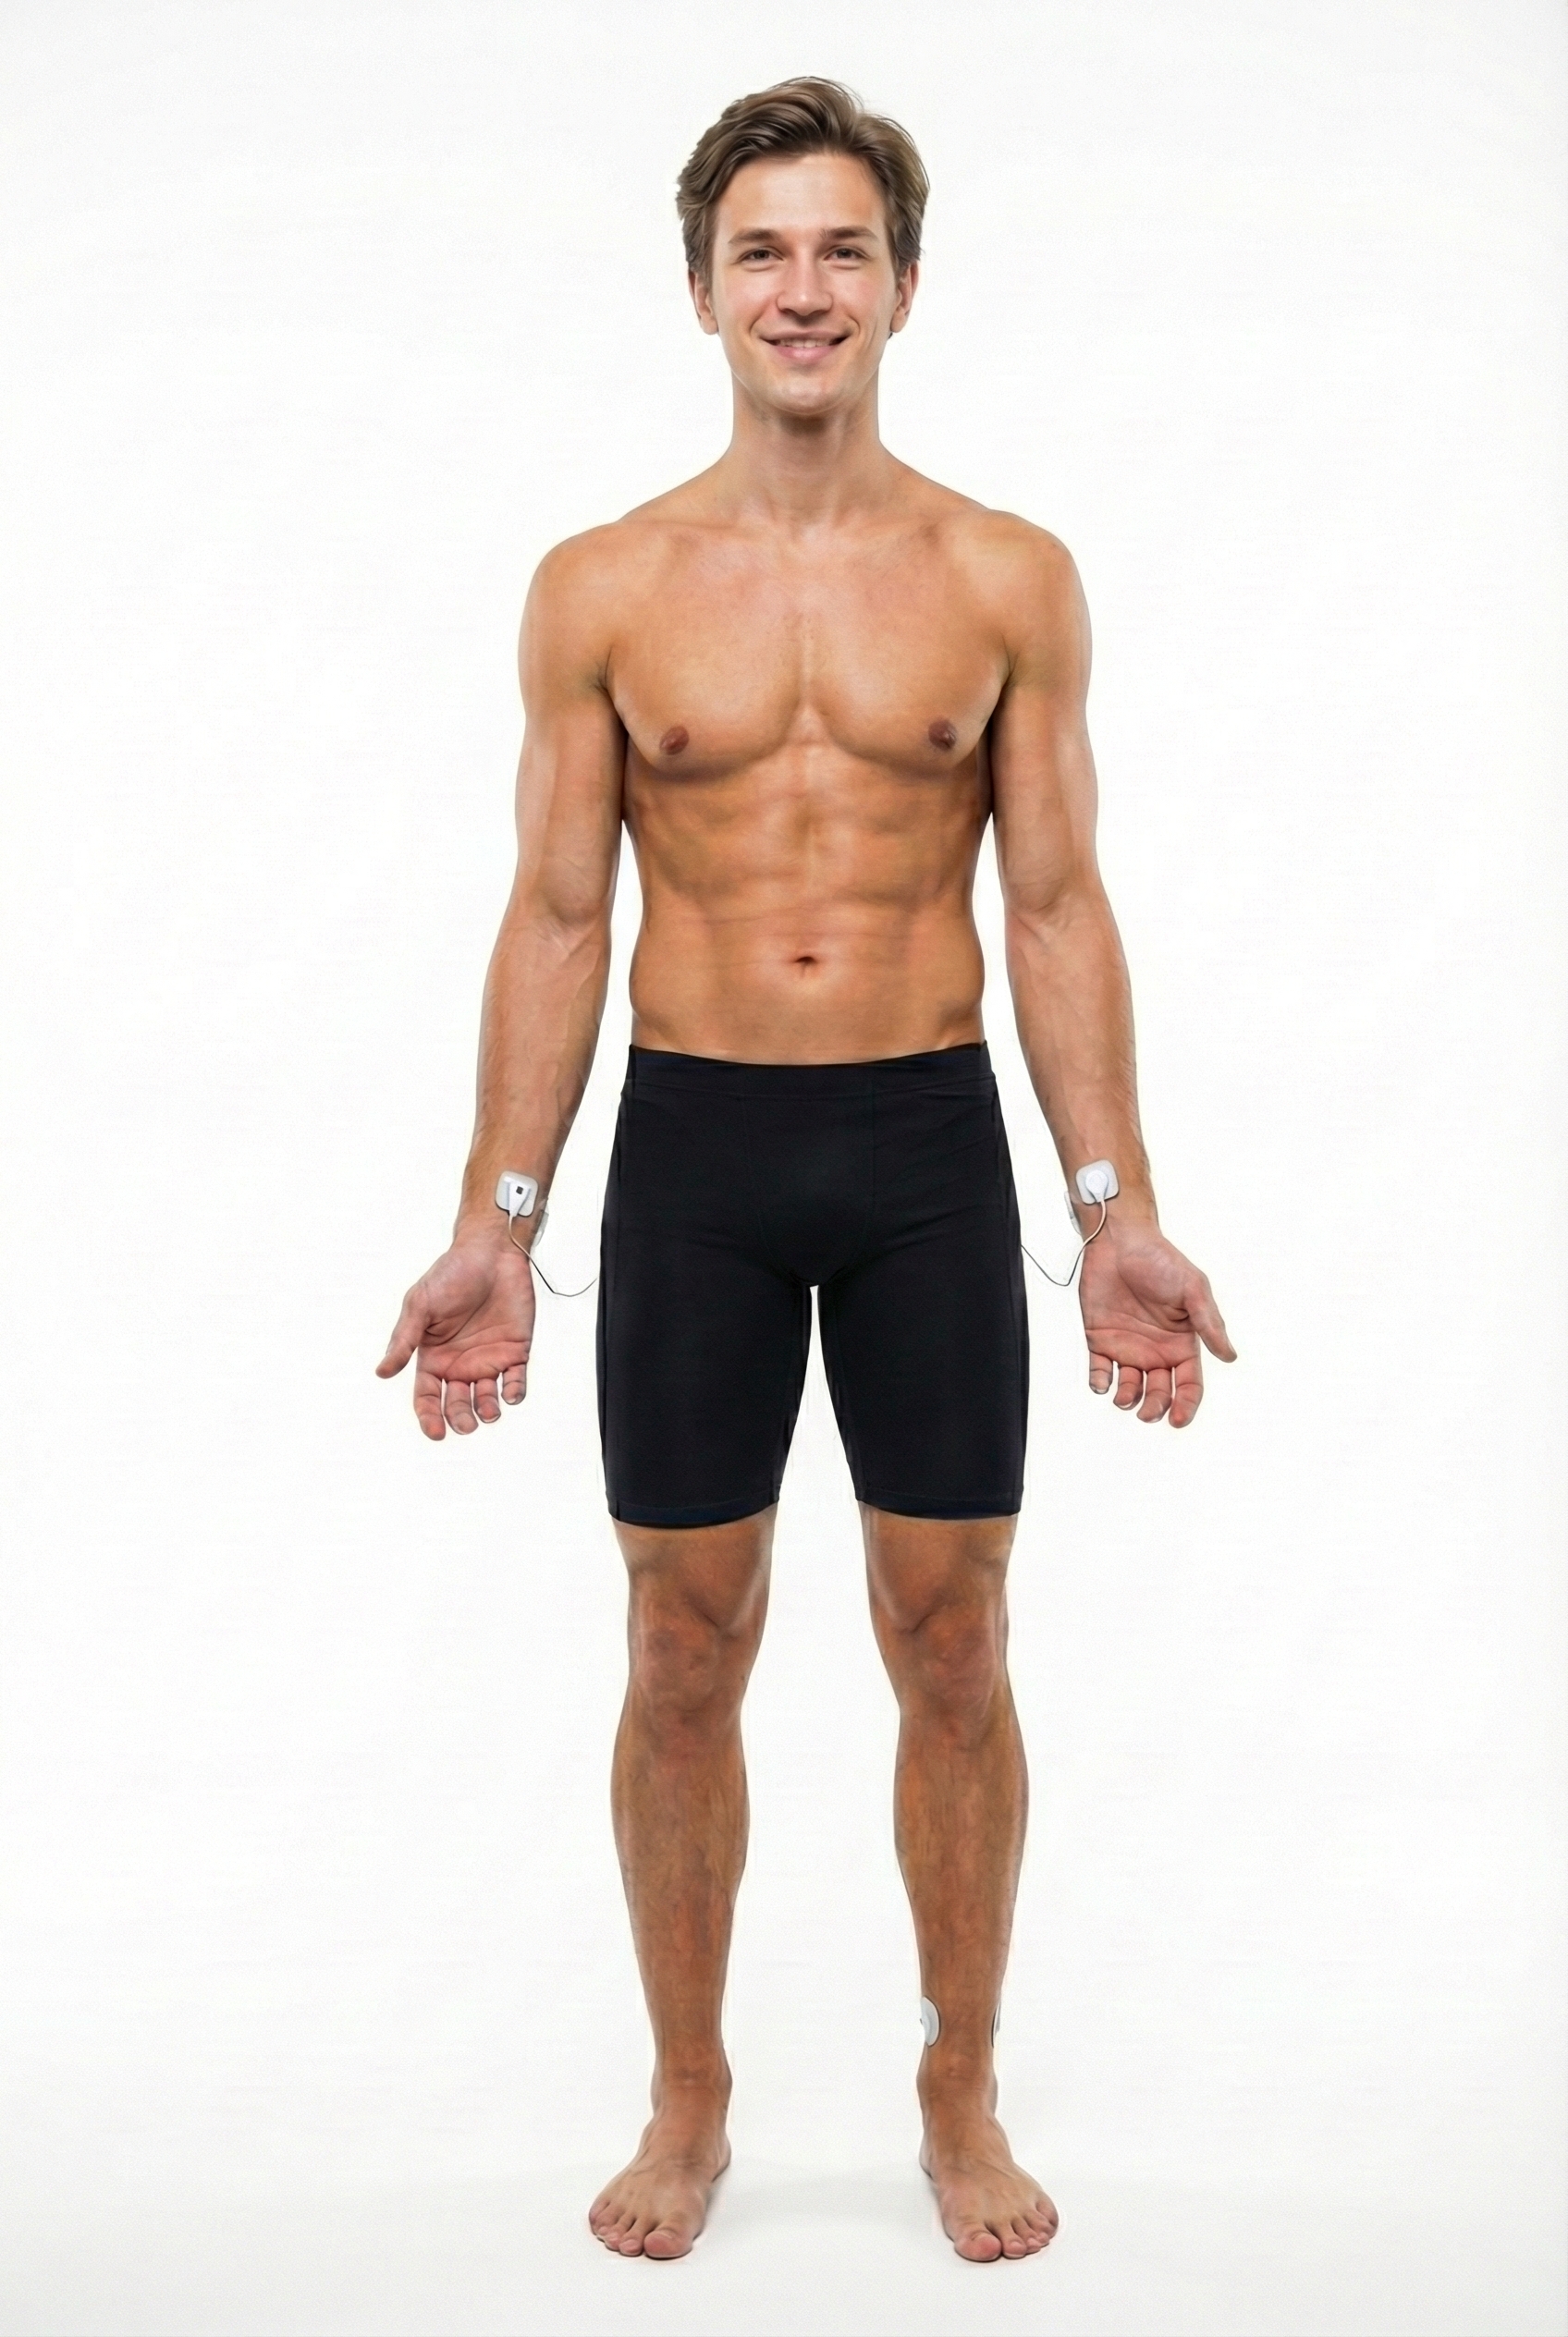
Wrist-to-Ankle Placement
For the wrist-to-ankle configuration, place the active (+) electrodes on the left wrist and ankle and the reference (−) electrode on the right wrist. The right-arm-to-left-leg alignment often accentuates the R-spike in individuals with large T-waves, making it easier for software to distinguish heartbeats from T-wave deflections (Lehrer, 2018b). This placement is less invasive than chest or lower torso placements but more vulnerable to movement artifacts than those torso-based options.
Forearm Placement
A forearm placement locates an active electrode on the right forearm and the reference and second active electrodes on the left forearm. Select an area with minimal or no hair for optimal electrode contact. Like the wrist placement, this configuration is more vulnerable to contamination by arm and chest EMG and movement artifacts, so it works best when clients can remain still during recording.
Lower Torso Placement
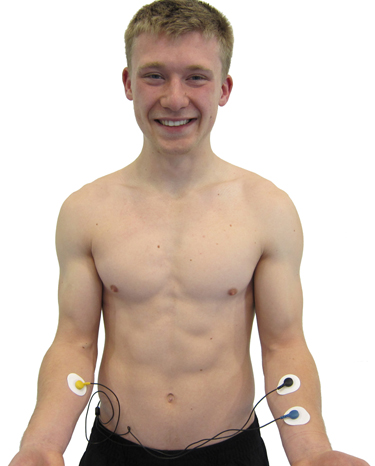
The lower torso placement, suggested by Peper (2010), centers the reference electrode over the angle of the sternum and the active electrodes about 5 centimeters above the navel and 10 centimeters to the left and right of the midline. This placement offers a practical compromise: it is less vulnerable to arm EMG and movement artifacts than wrist or forearm configurations, while providing an alternative for clients who are uncomfortable exposing their chests—they simply lift the bottom edge of their blouse or shirt.
.jpg)
Upper Chest Placement
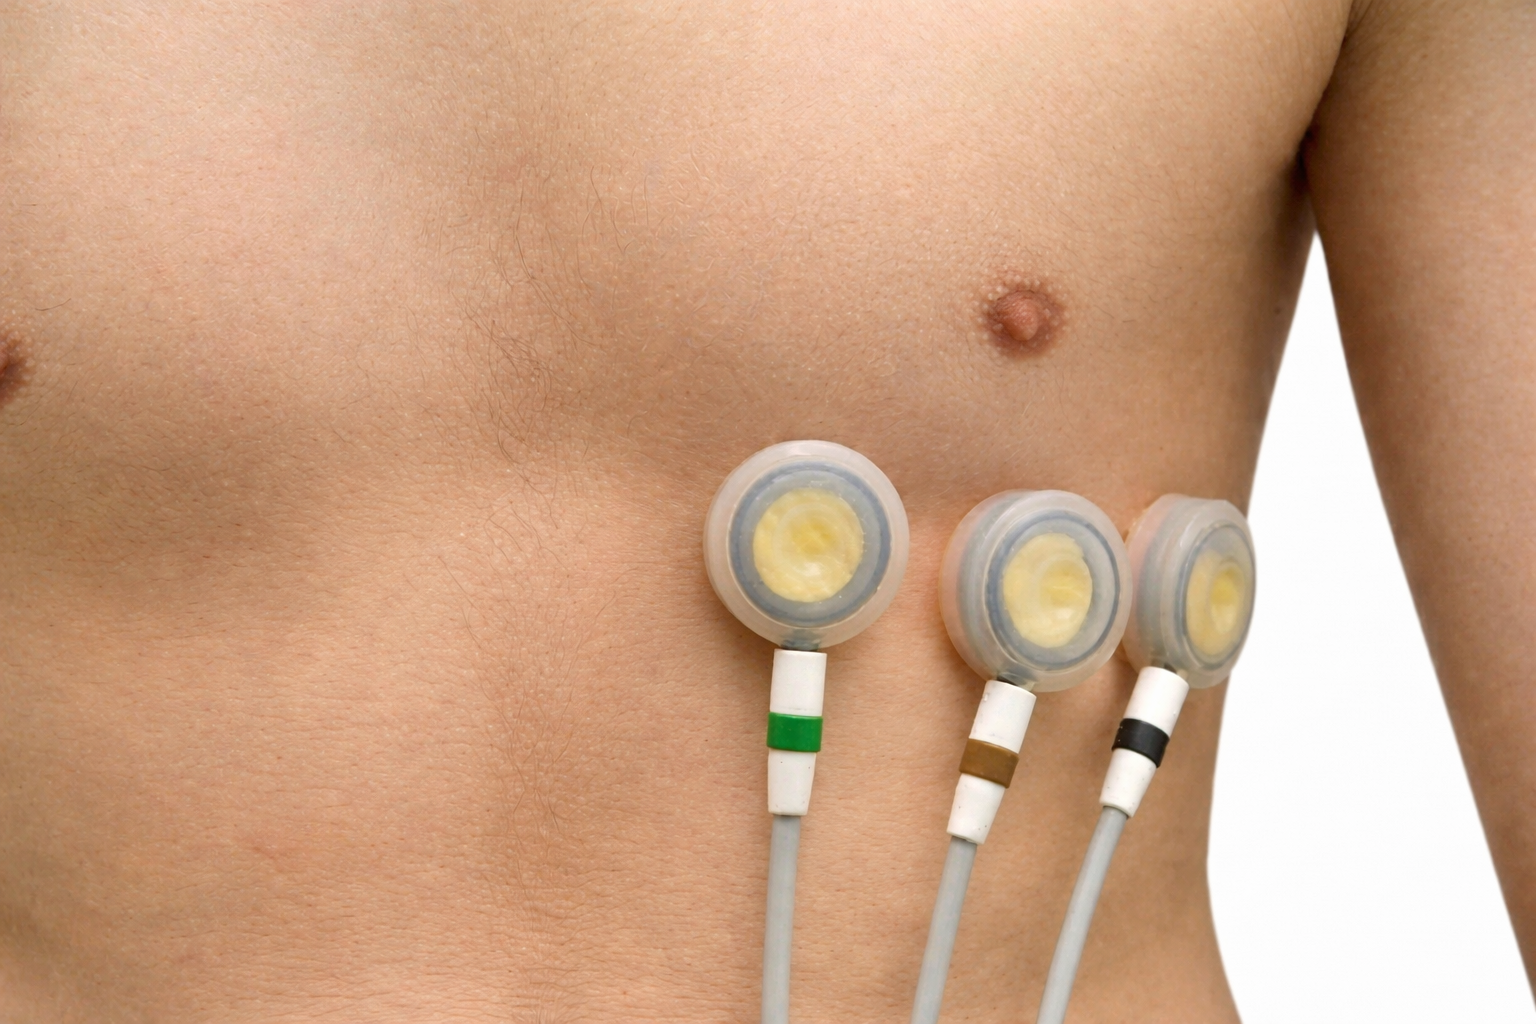
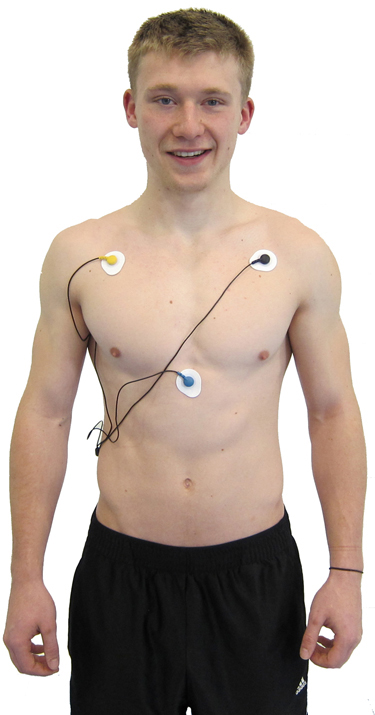
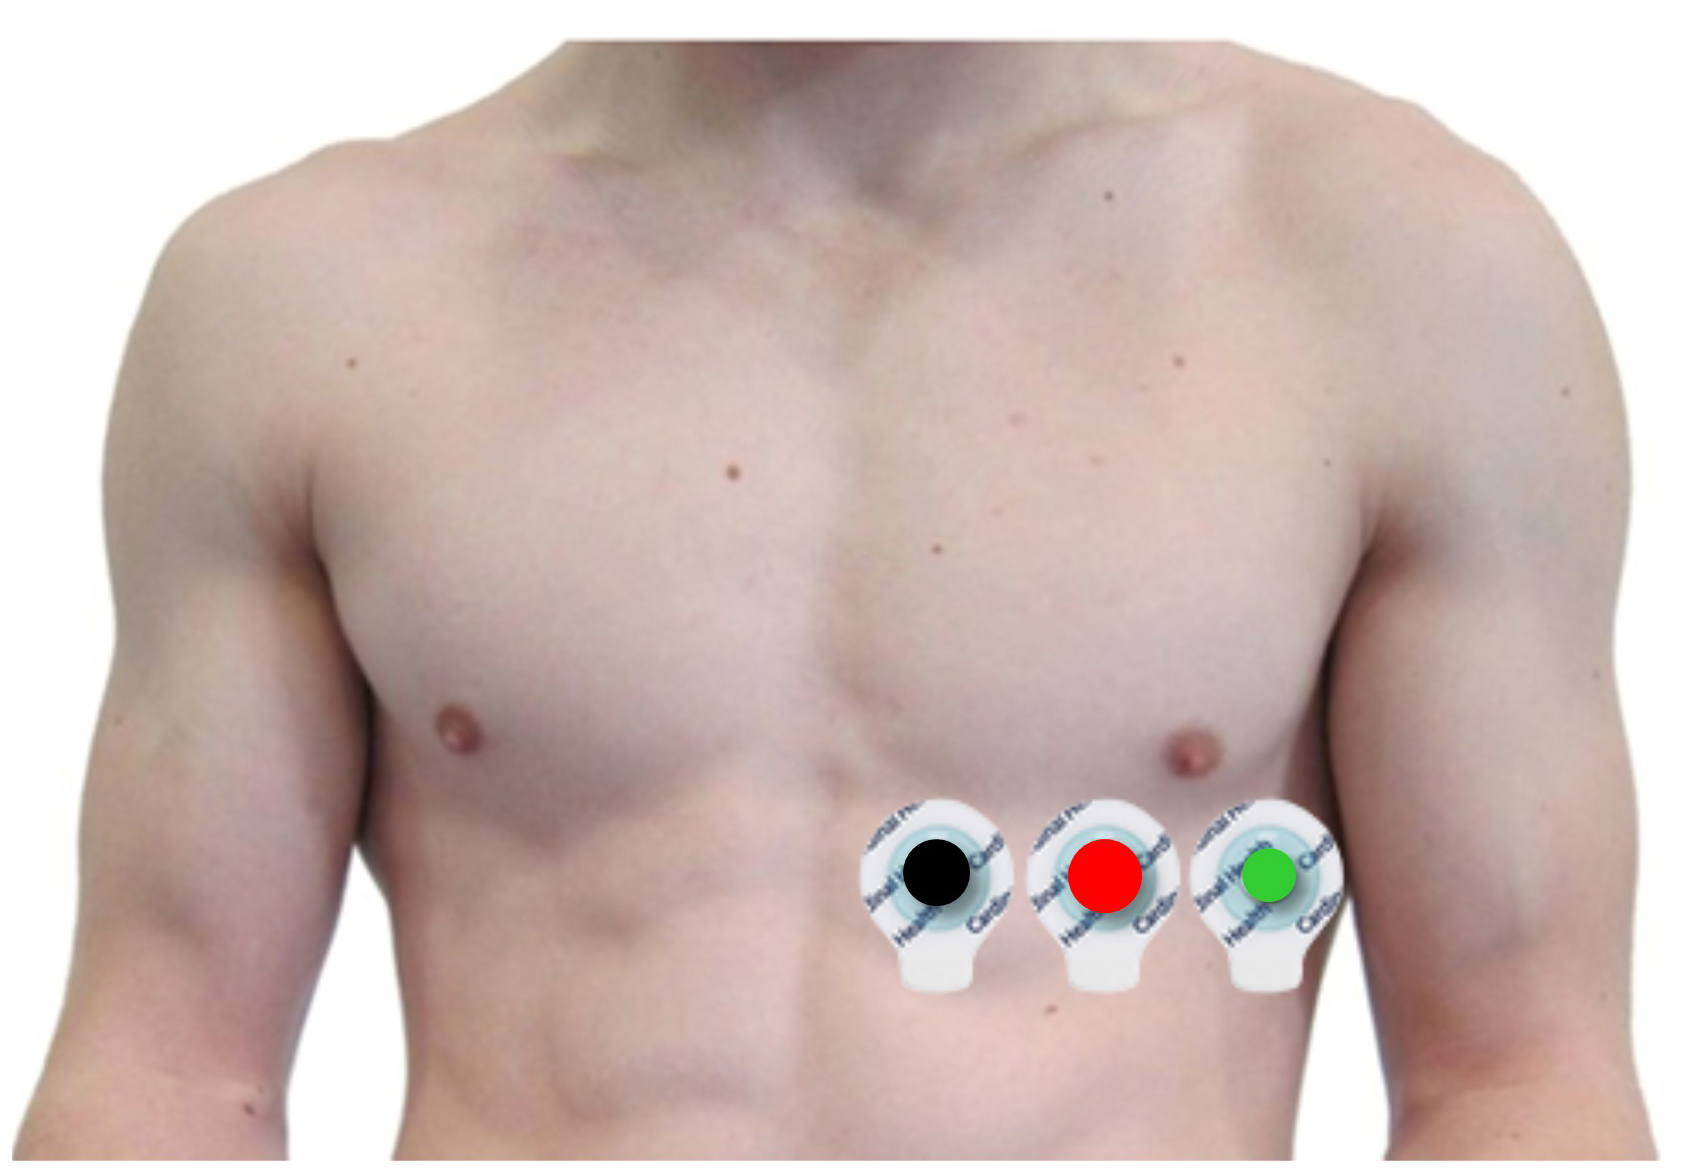
The upper chest placement locates the active and reference electrodes over the right and left coracoid processes (bony projections at the front of each shoulder), respectively, and a second active electrode over the xiphoid process (the small extension at the bottom of the sternum). This configuration reduces the risk of arm muscle artifact because the electrodes are positioned closer to the heart and away from the large muscles of the arms. However, it exposes the chest area, which can be uncomfortable for female clients and requires additional client education and written informed consent (Shaffer & Combatalade, 2013).
Heart-Level Chest Placement
An alternative chest placement locates all three electrodes in a row at heart level. This arrangement can detect the largest-amplitude R-spikes of any standard configuration (Lehrer, 2018b), making it especially useful when software struggles to distinguish the R-spike from background noise or large T-waves. The Lief Therapeutics wearable sensor uses this same placement for continuous ambulatory HRV monitoring.
Placement Summary
Wrist or forearm placements offer greater client comfort and quicker application speeds where EMG and movement artifacts don't contaminate your recordings. The lower torso placement may be best for research when these artifacts are present. Sensor placement on the upper chest and abdomen requires client/participant education and written informed consent.
Review the ECG
Click on the graphic below to review the ECG Quizlet set by Stephanie Verbeek.
Comprehension Questions: ECG Placements
- Which ECG placement is fastest to apply but most vulnerable to arm EMG artifact?
- Why might the wrist-to-ankle placement be preferred over chest placement for some clients?
- What advantage does Peper's lower torso placement offer compared to the wrist and forearm placements?
- Under what circumstances would you recommend obtaining written informed consent before applying ECG sensors?
ECG Artifacts
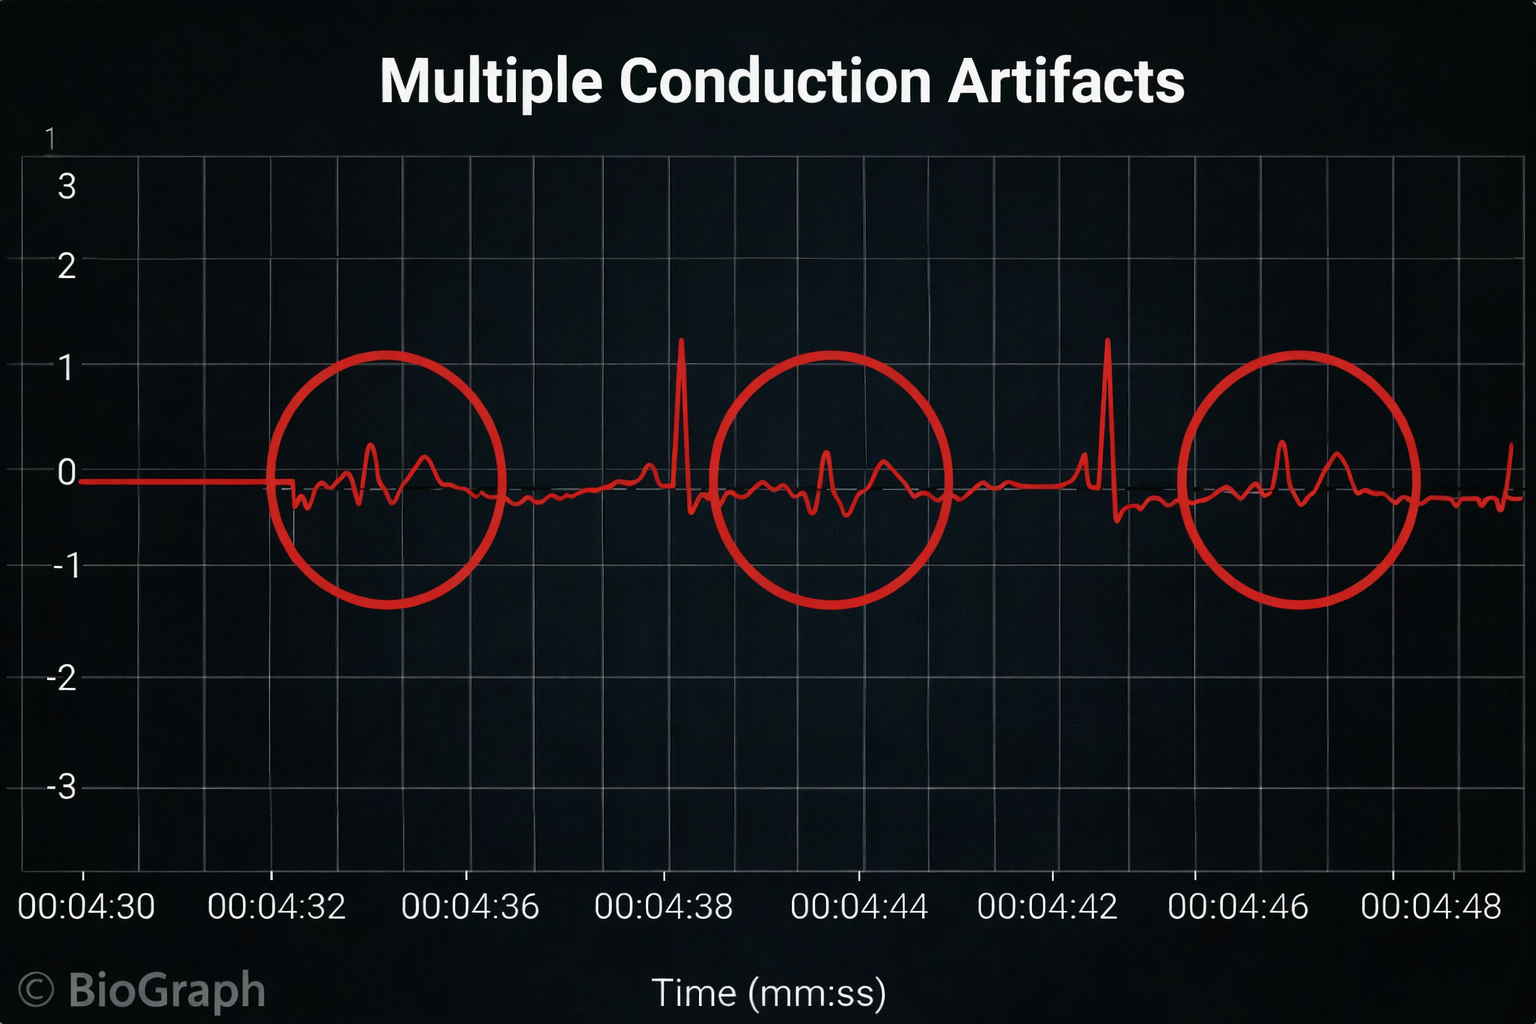
This section covers the seven major ECG artifacts you will encounter in clinical practice: missed and extra beats, line interference, EMG, movement, respiration, DC offset, electromagnetic interference (EMI), and polarity. Recognizing these artifacts quickly is a core clinical competency because even small measurement errors can distort time-domain, frequency-domain, and nonlinear HRV metrics—potentially leading to incorrect clinical decisions.
Each artifact type has distinct causes and characteristic signatures in the raw signal. More importantly, each has practical solutions you can apply on the spot to restore signal integrity. As a general rule, three preventive strategies apply across nearly all artifact types: thorough skin preparation, use of pre-gelled electrodes, and routine inspection of the raw ECG signal before trusting your data.
Missed and Extra Beats
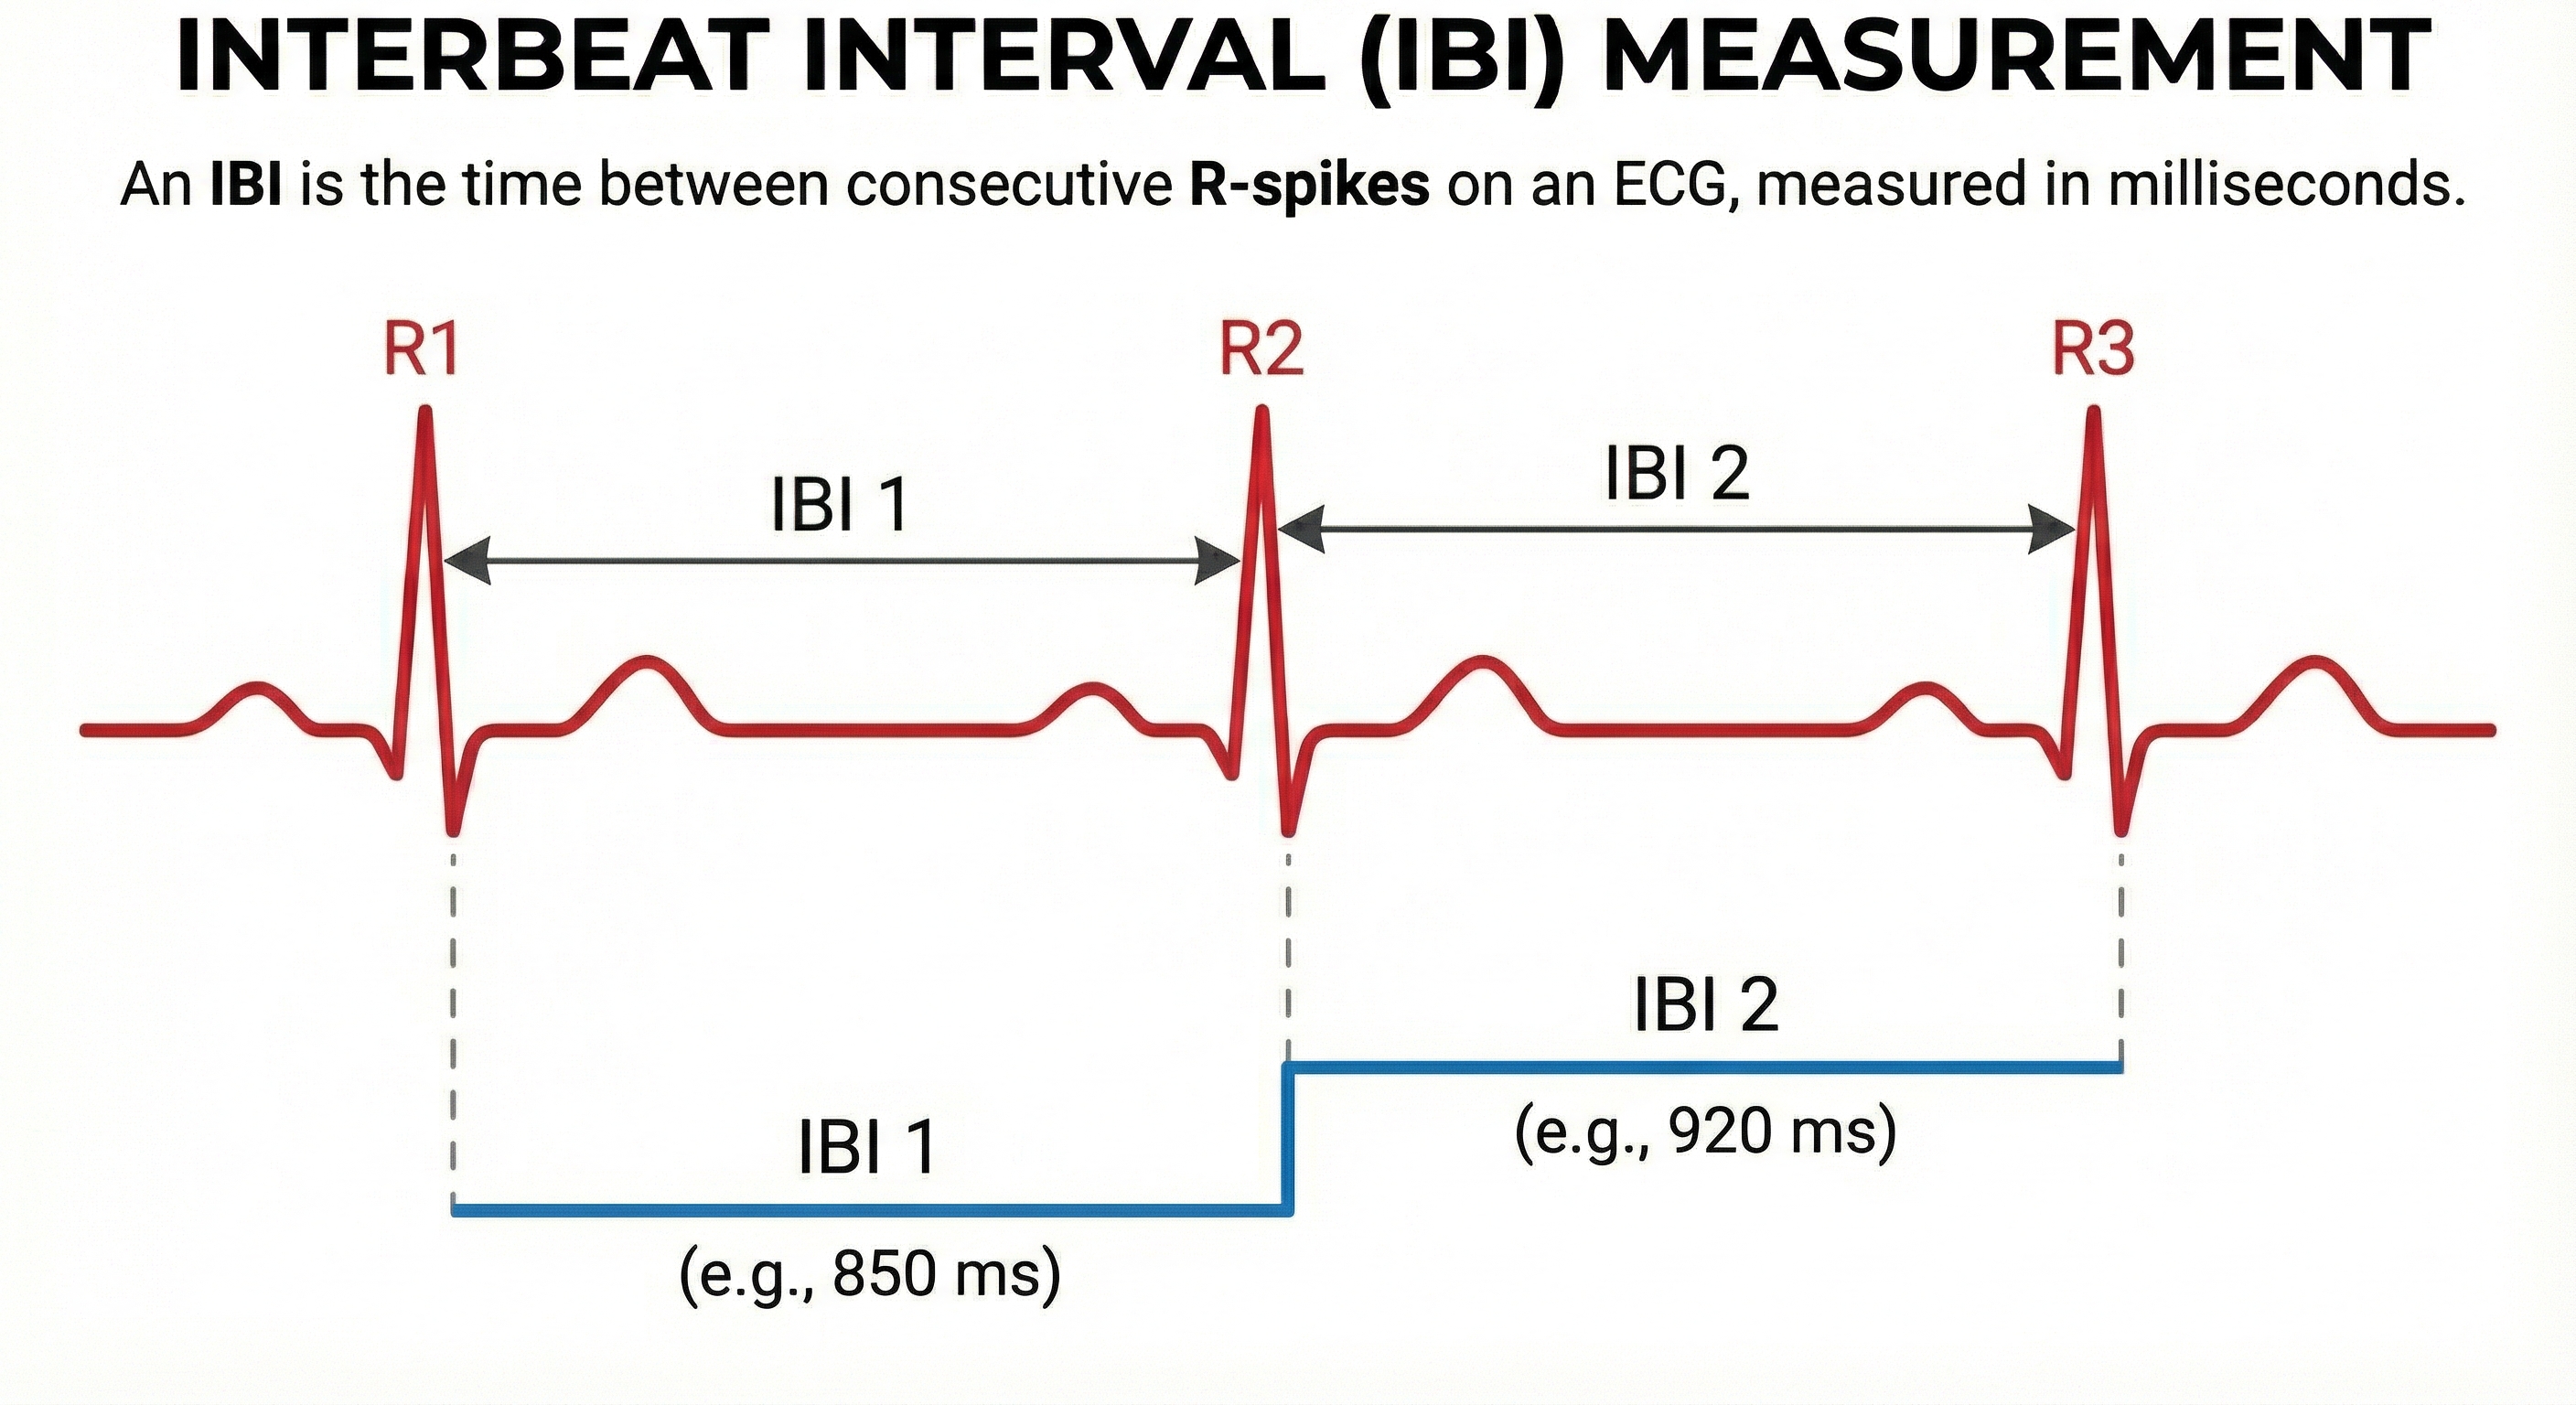
HRV software determines the interbeat interval (IBI)—the time between the peaks of successive R-spikes—by detecting adjacent beats and measuring the elapsed time in milliseconds. After detecting the first beat, the software starts counting and calculates the first IBI. This process repeats until the end of the epoch, the data collection period during which IBI measurements are recorded and analyzed.
🎧 Mini-Lecture: Missed and Extra Beats
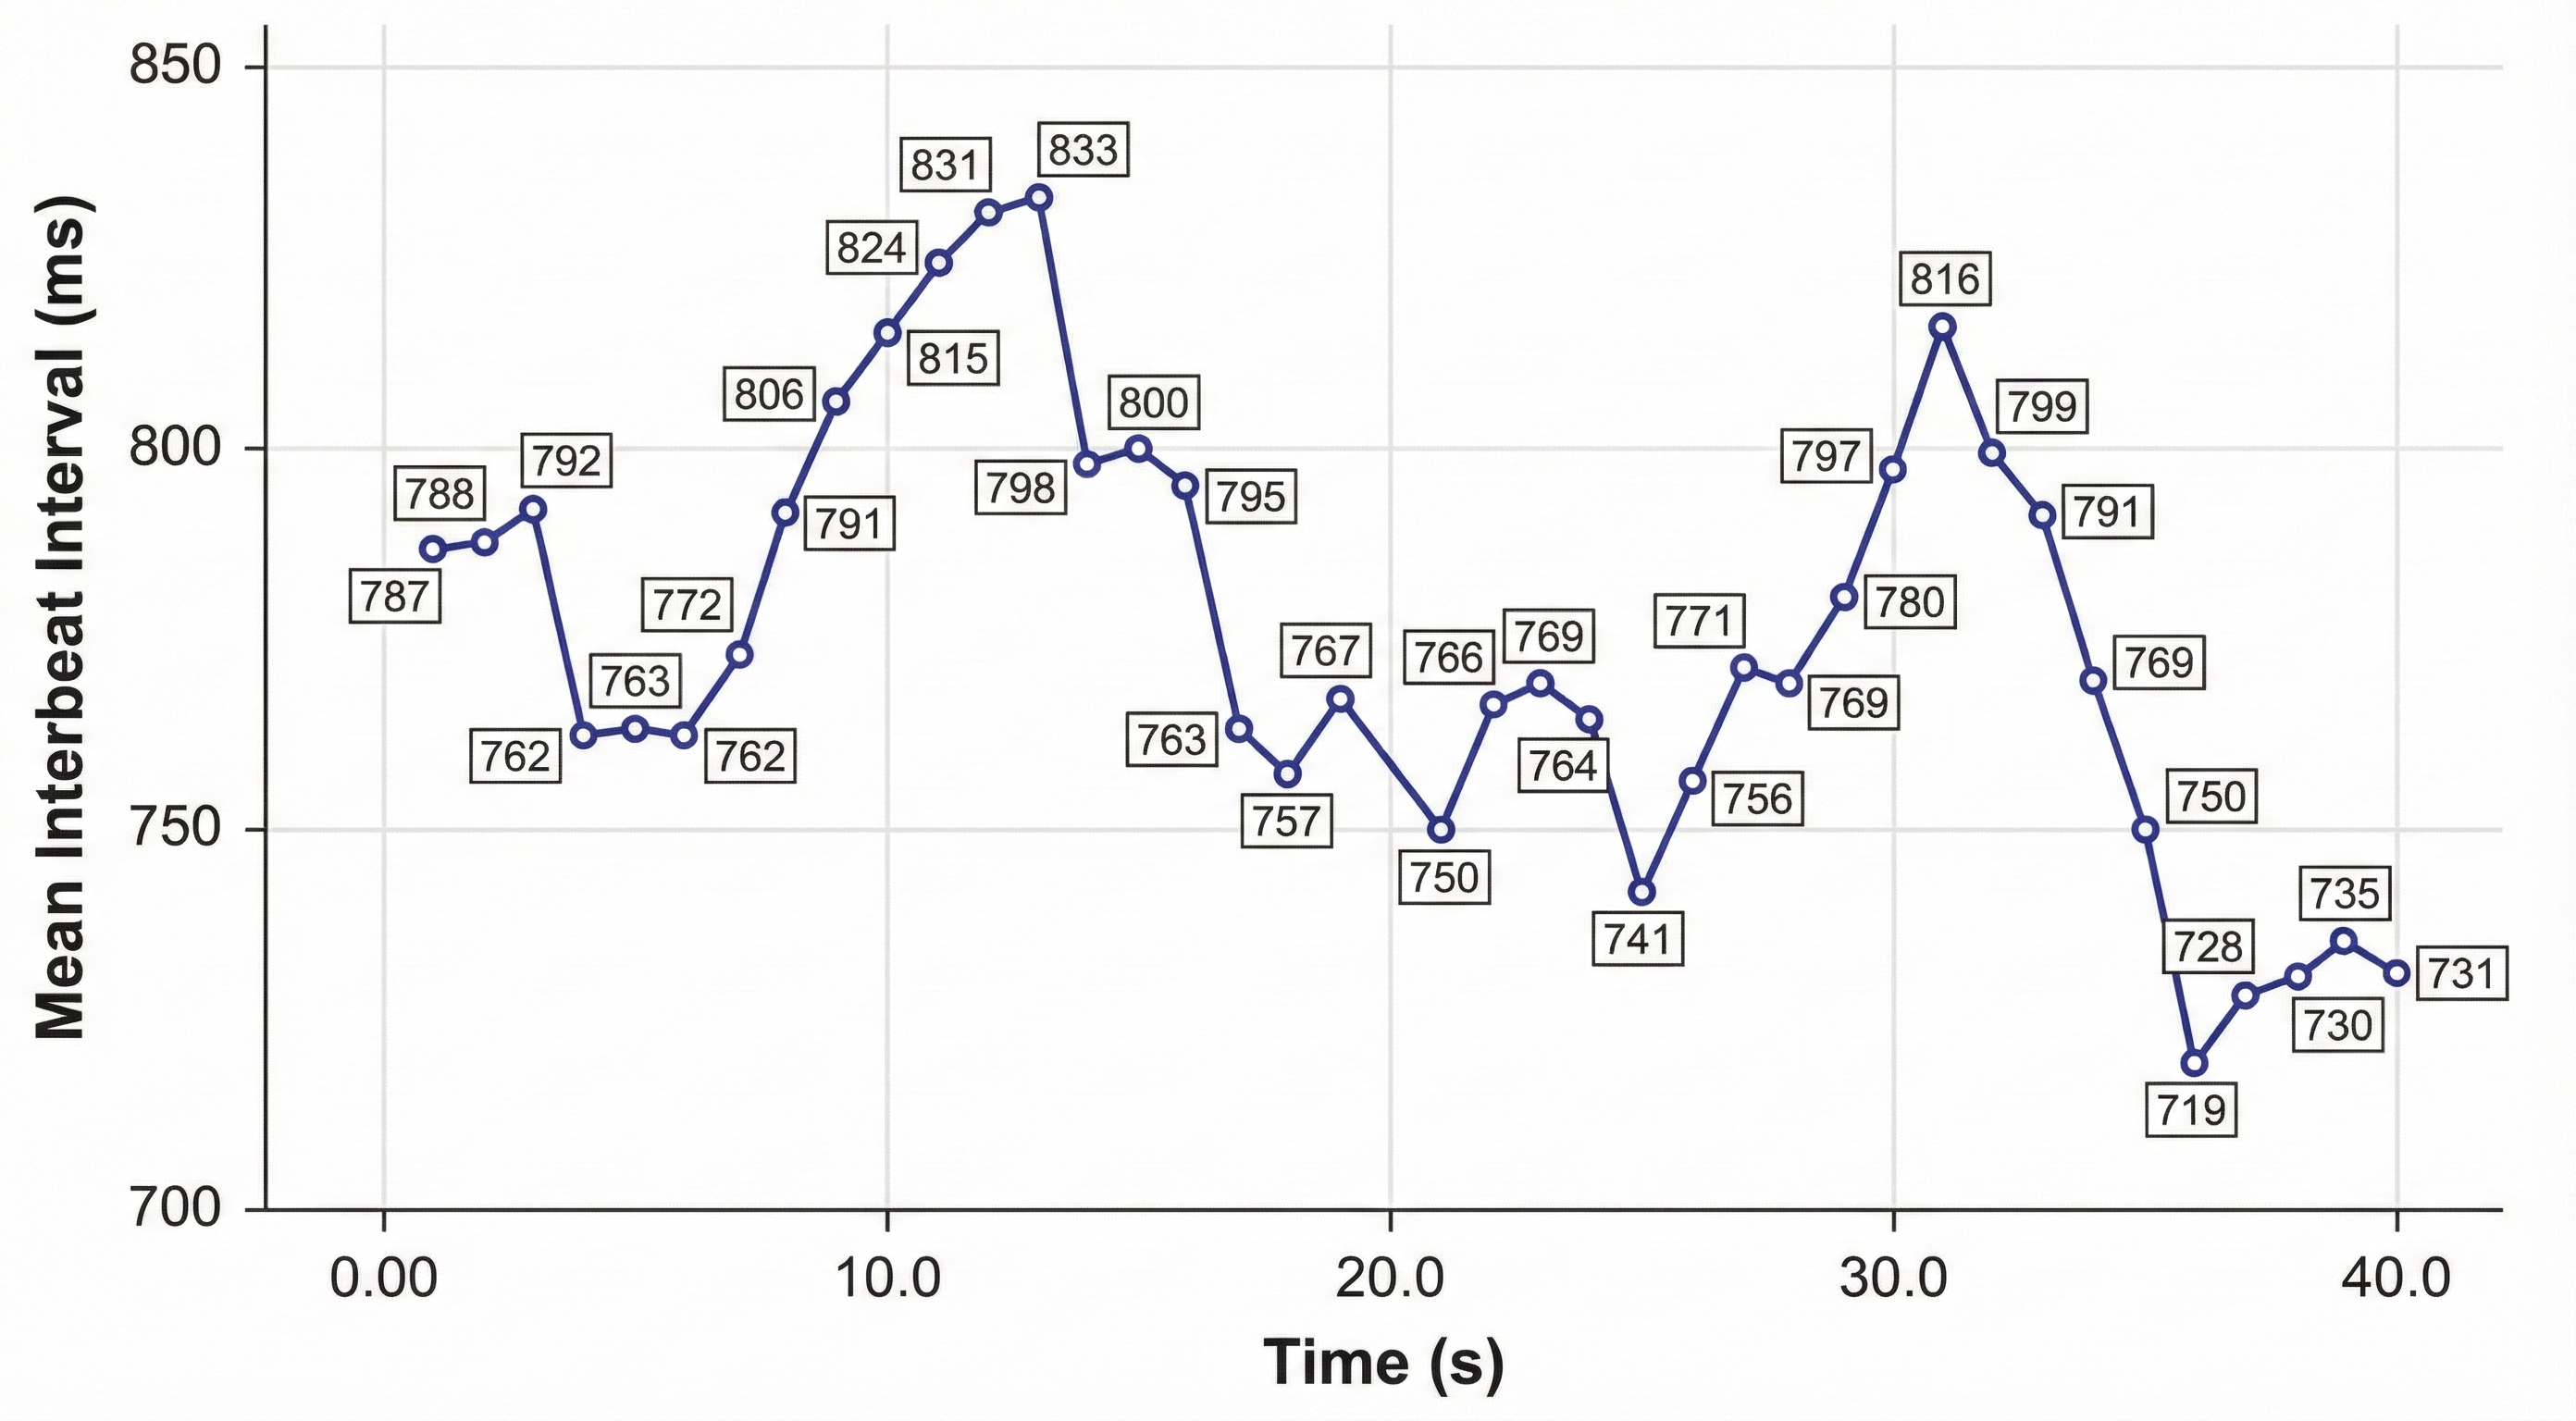
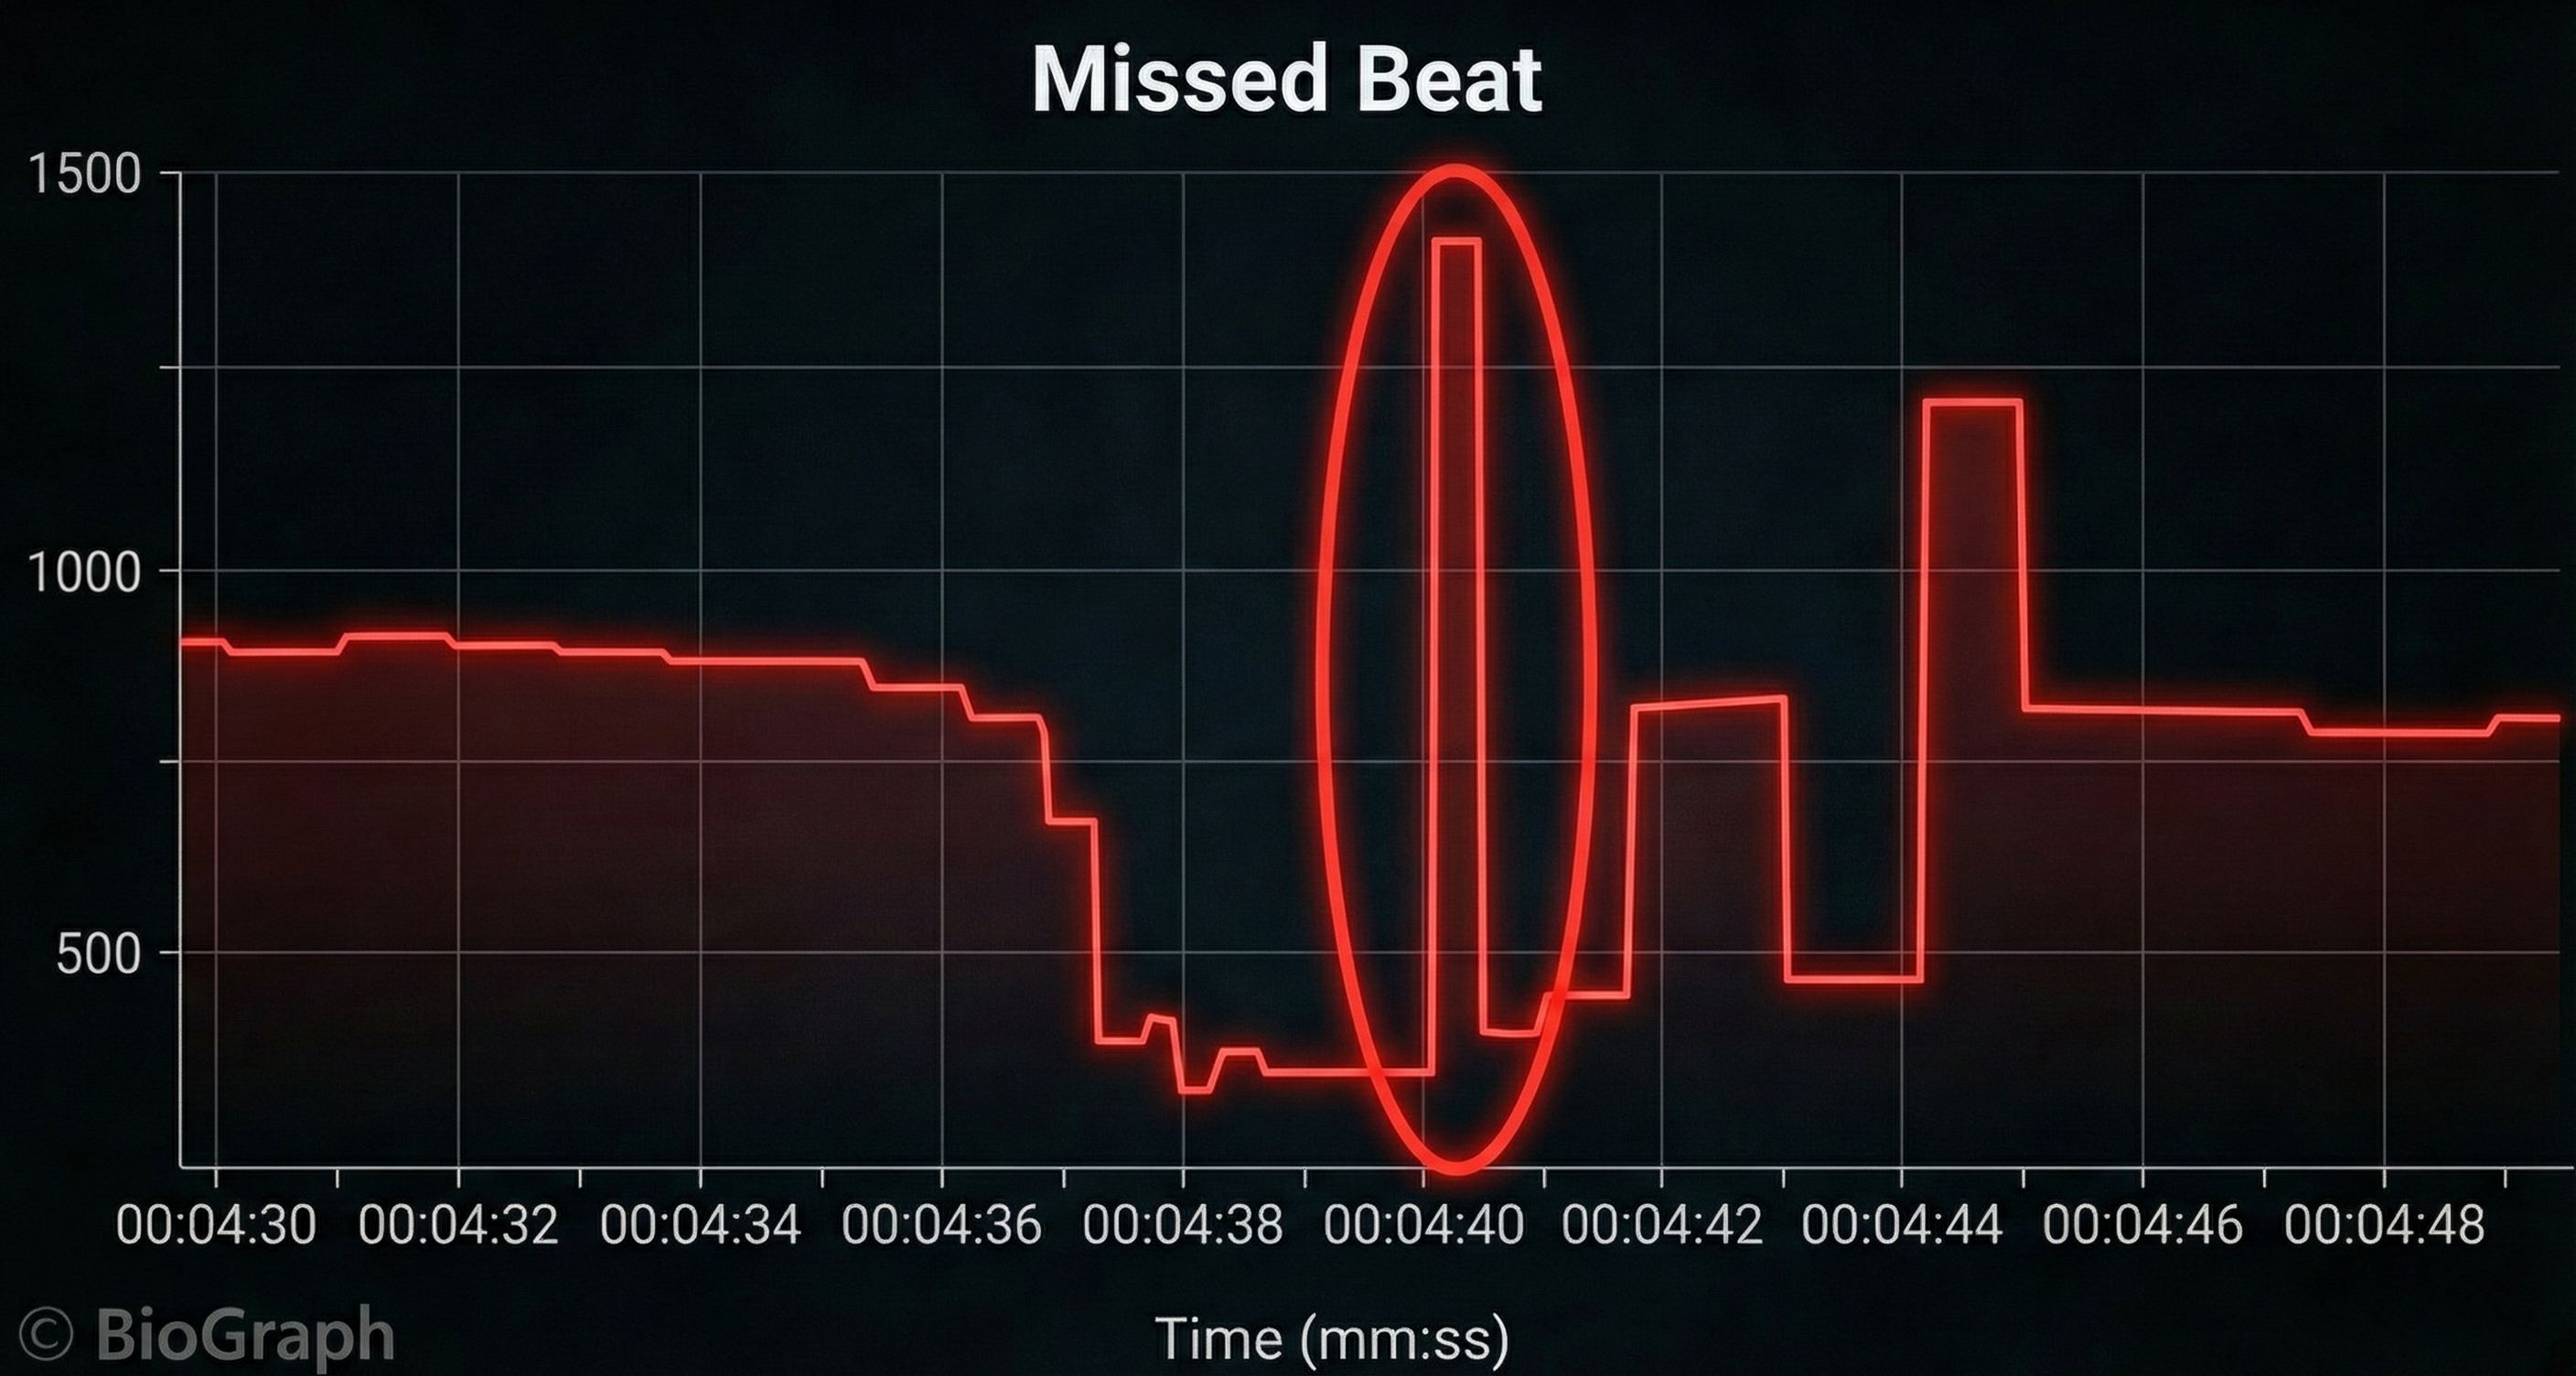
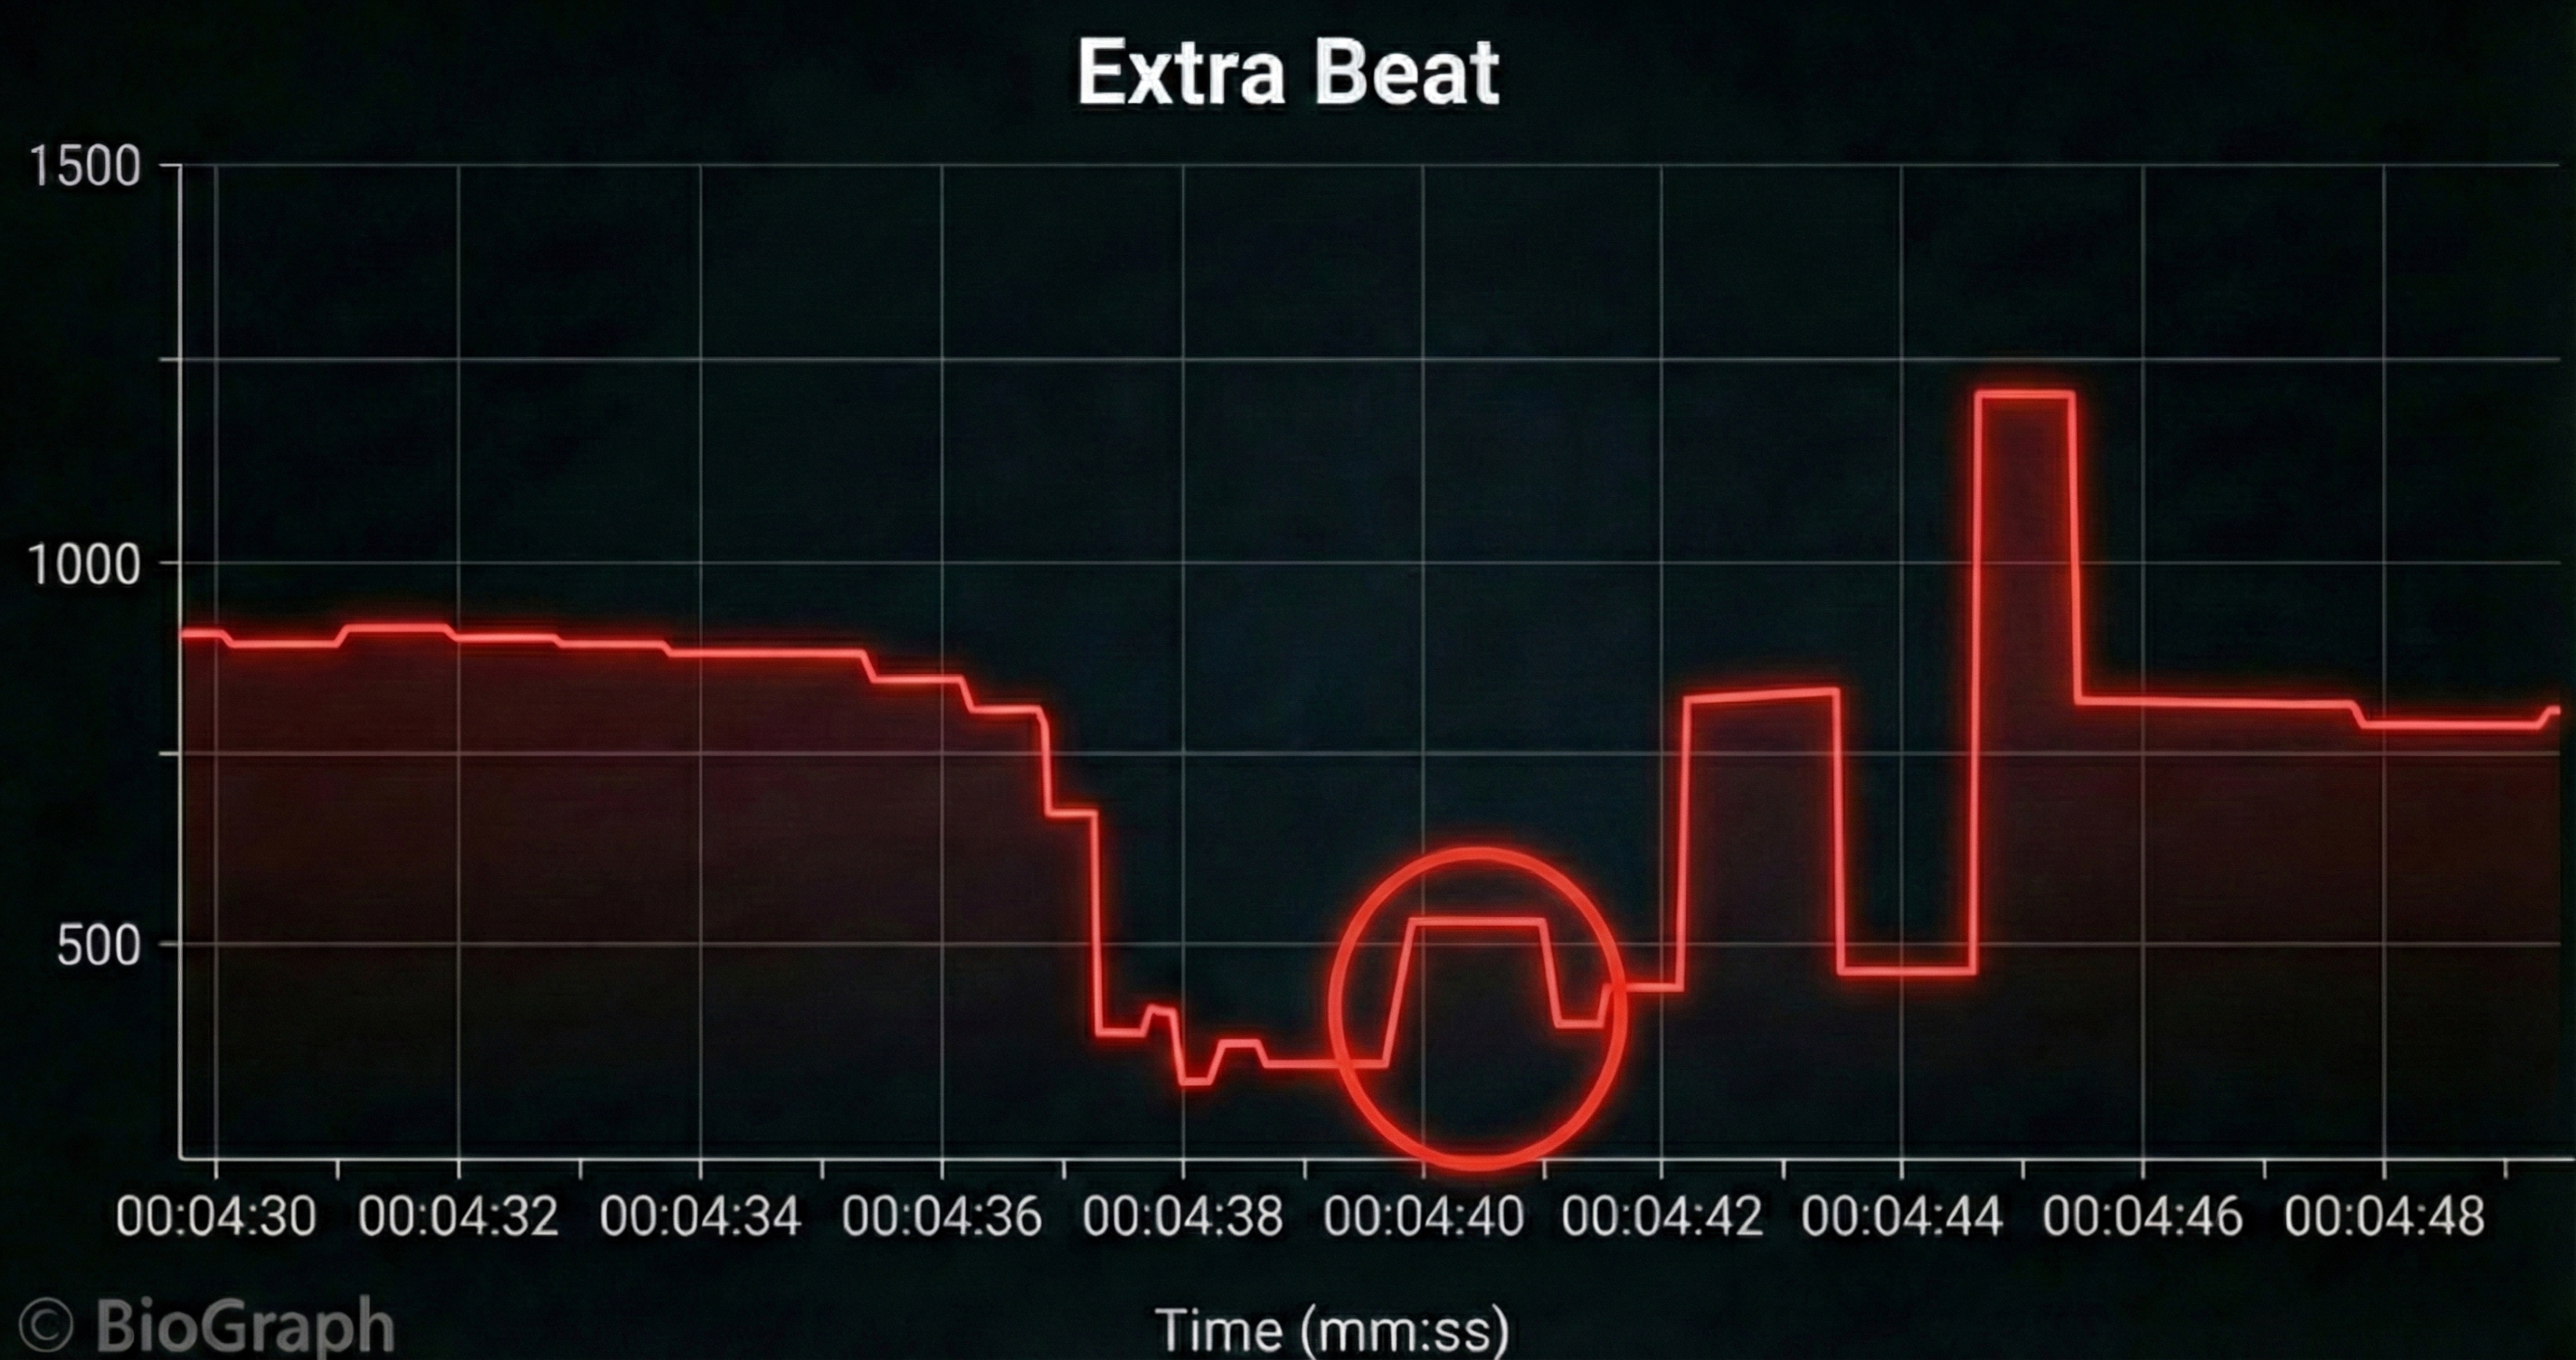
IBI measurements are the foundation of all HRV metrics, including time-domain measures (pNN50, RMSSD, and SDNN), frequency-domain measures (VLF, LF, and HF), and nonlinear measures. When signal distortion prevents the software from detecting a heartbeat, the result is a missed beat and a prolonged IBI. On the graph below, a missed beat generated the circled IBI (1500 ms). Conversely, when distortion causes the software to detect a nonexistent extra beat, this produces an artifactually short IBI. Missed and extra beats also affect photoplethysmography (PPG) recording (Elgendi, 2012).
As with BVP, use clean ECG recordings as a reference.
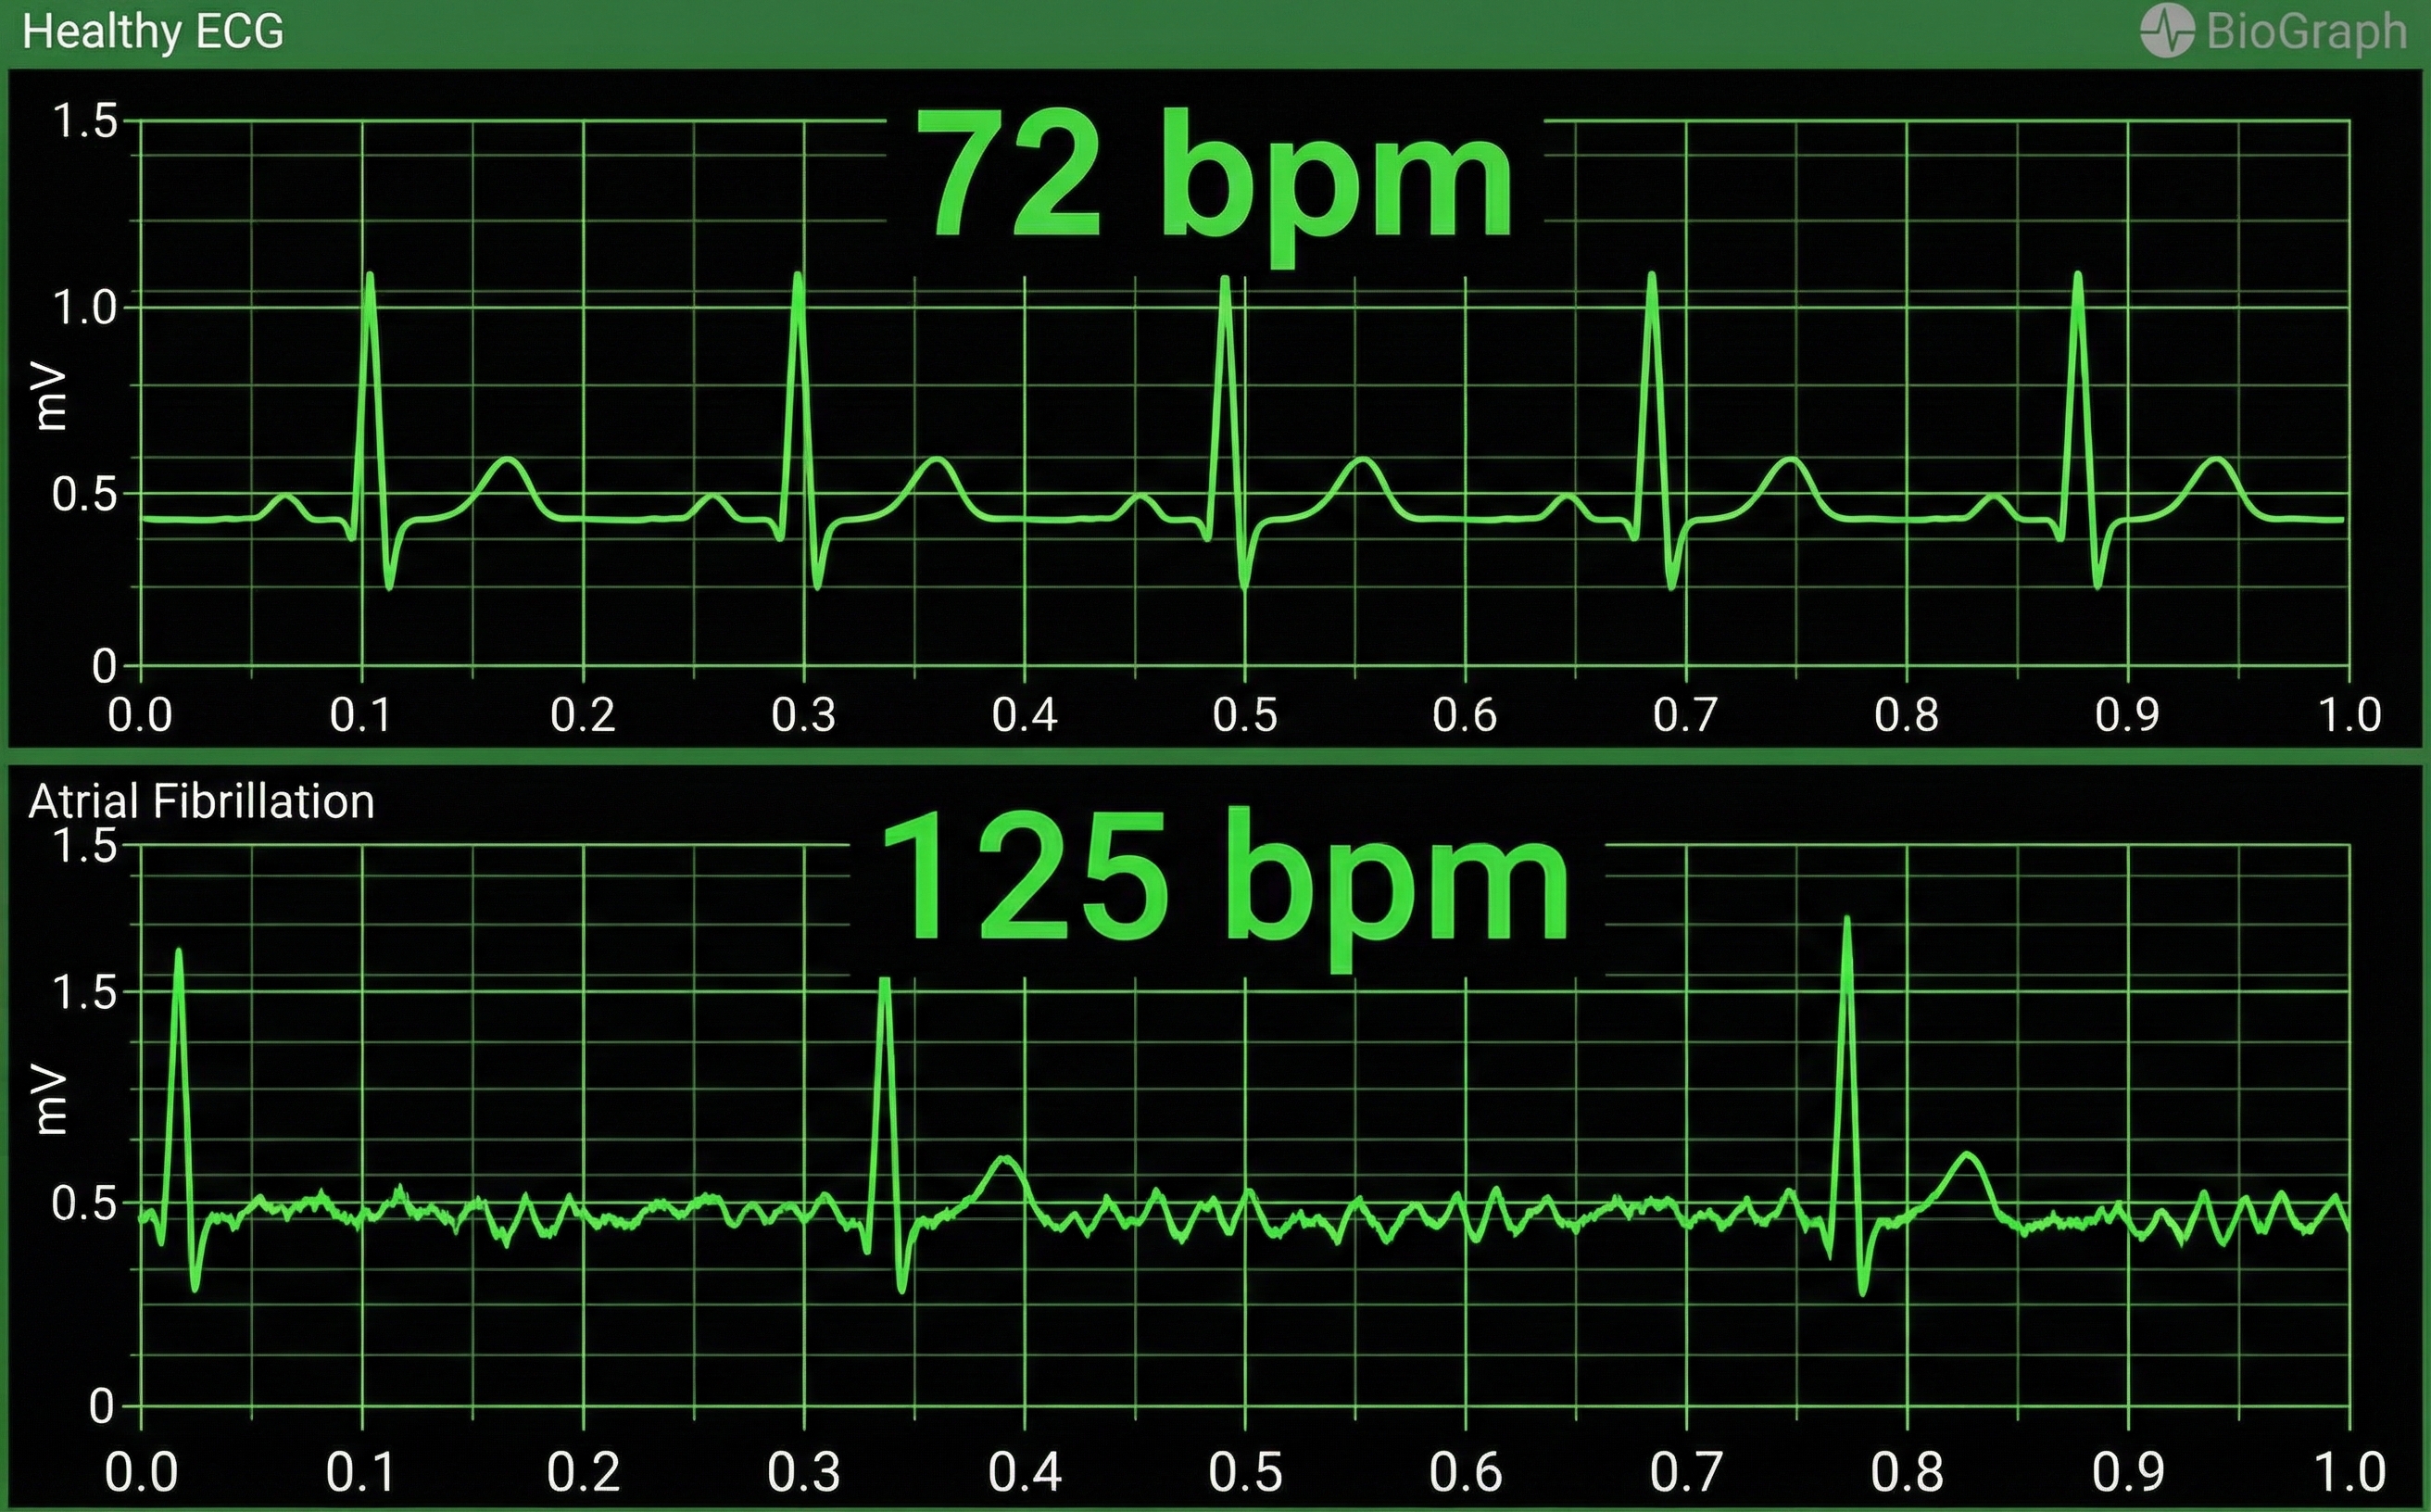
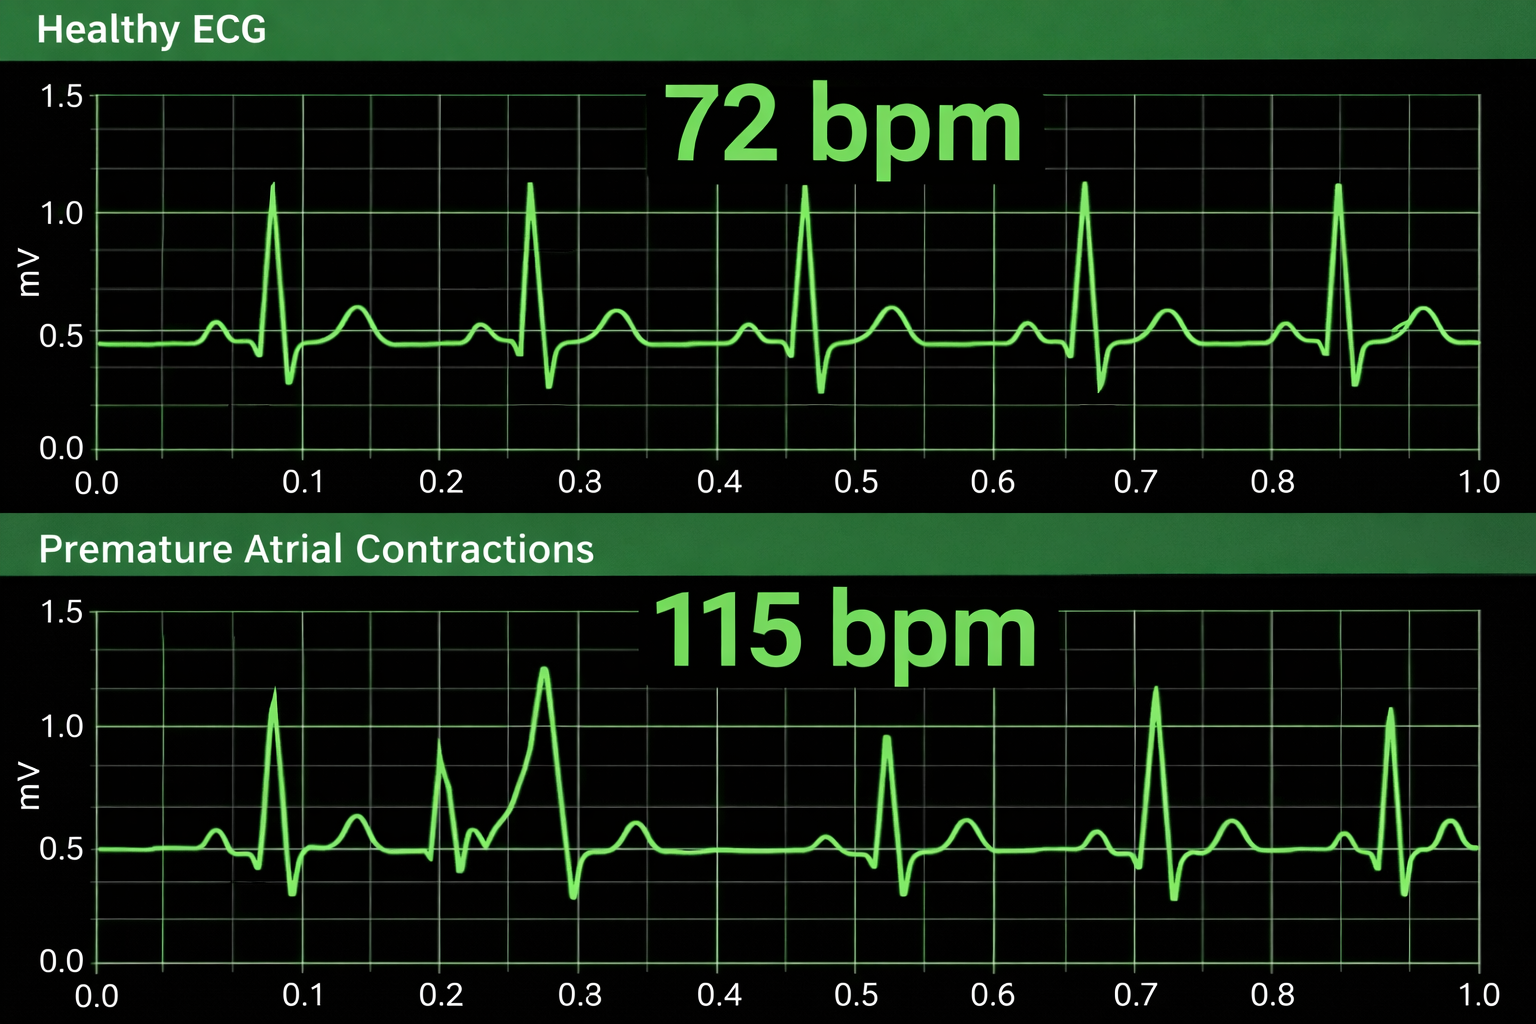
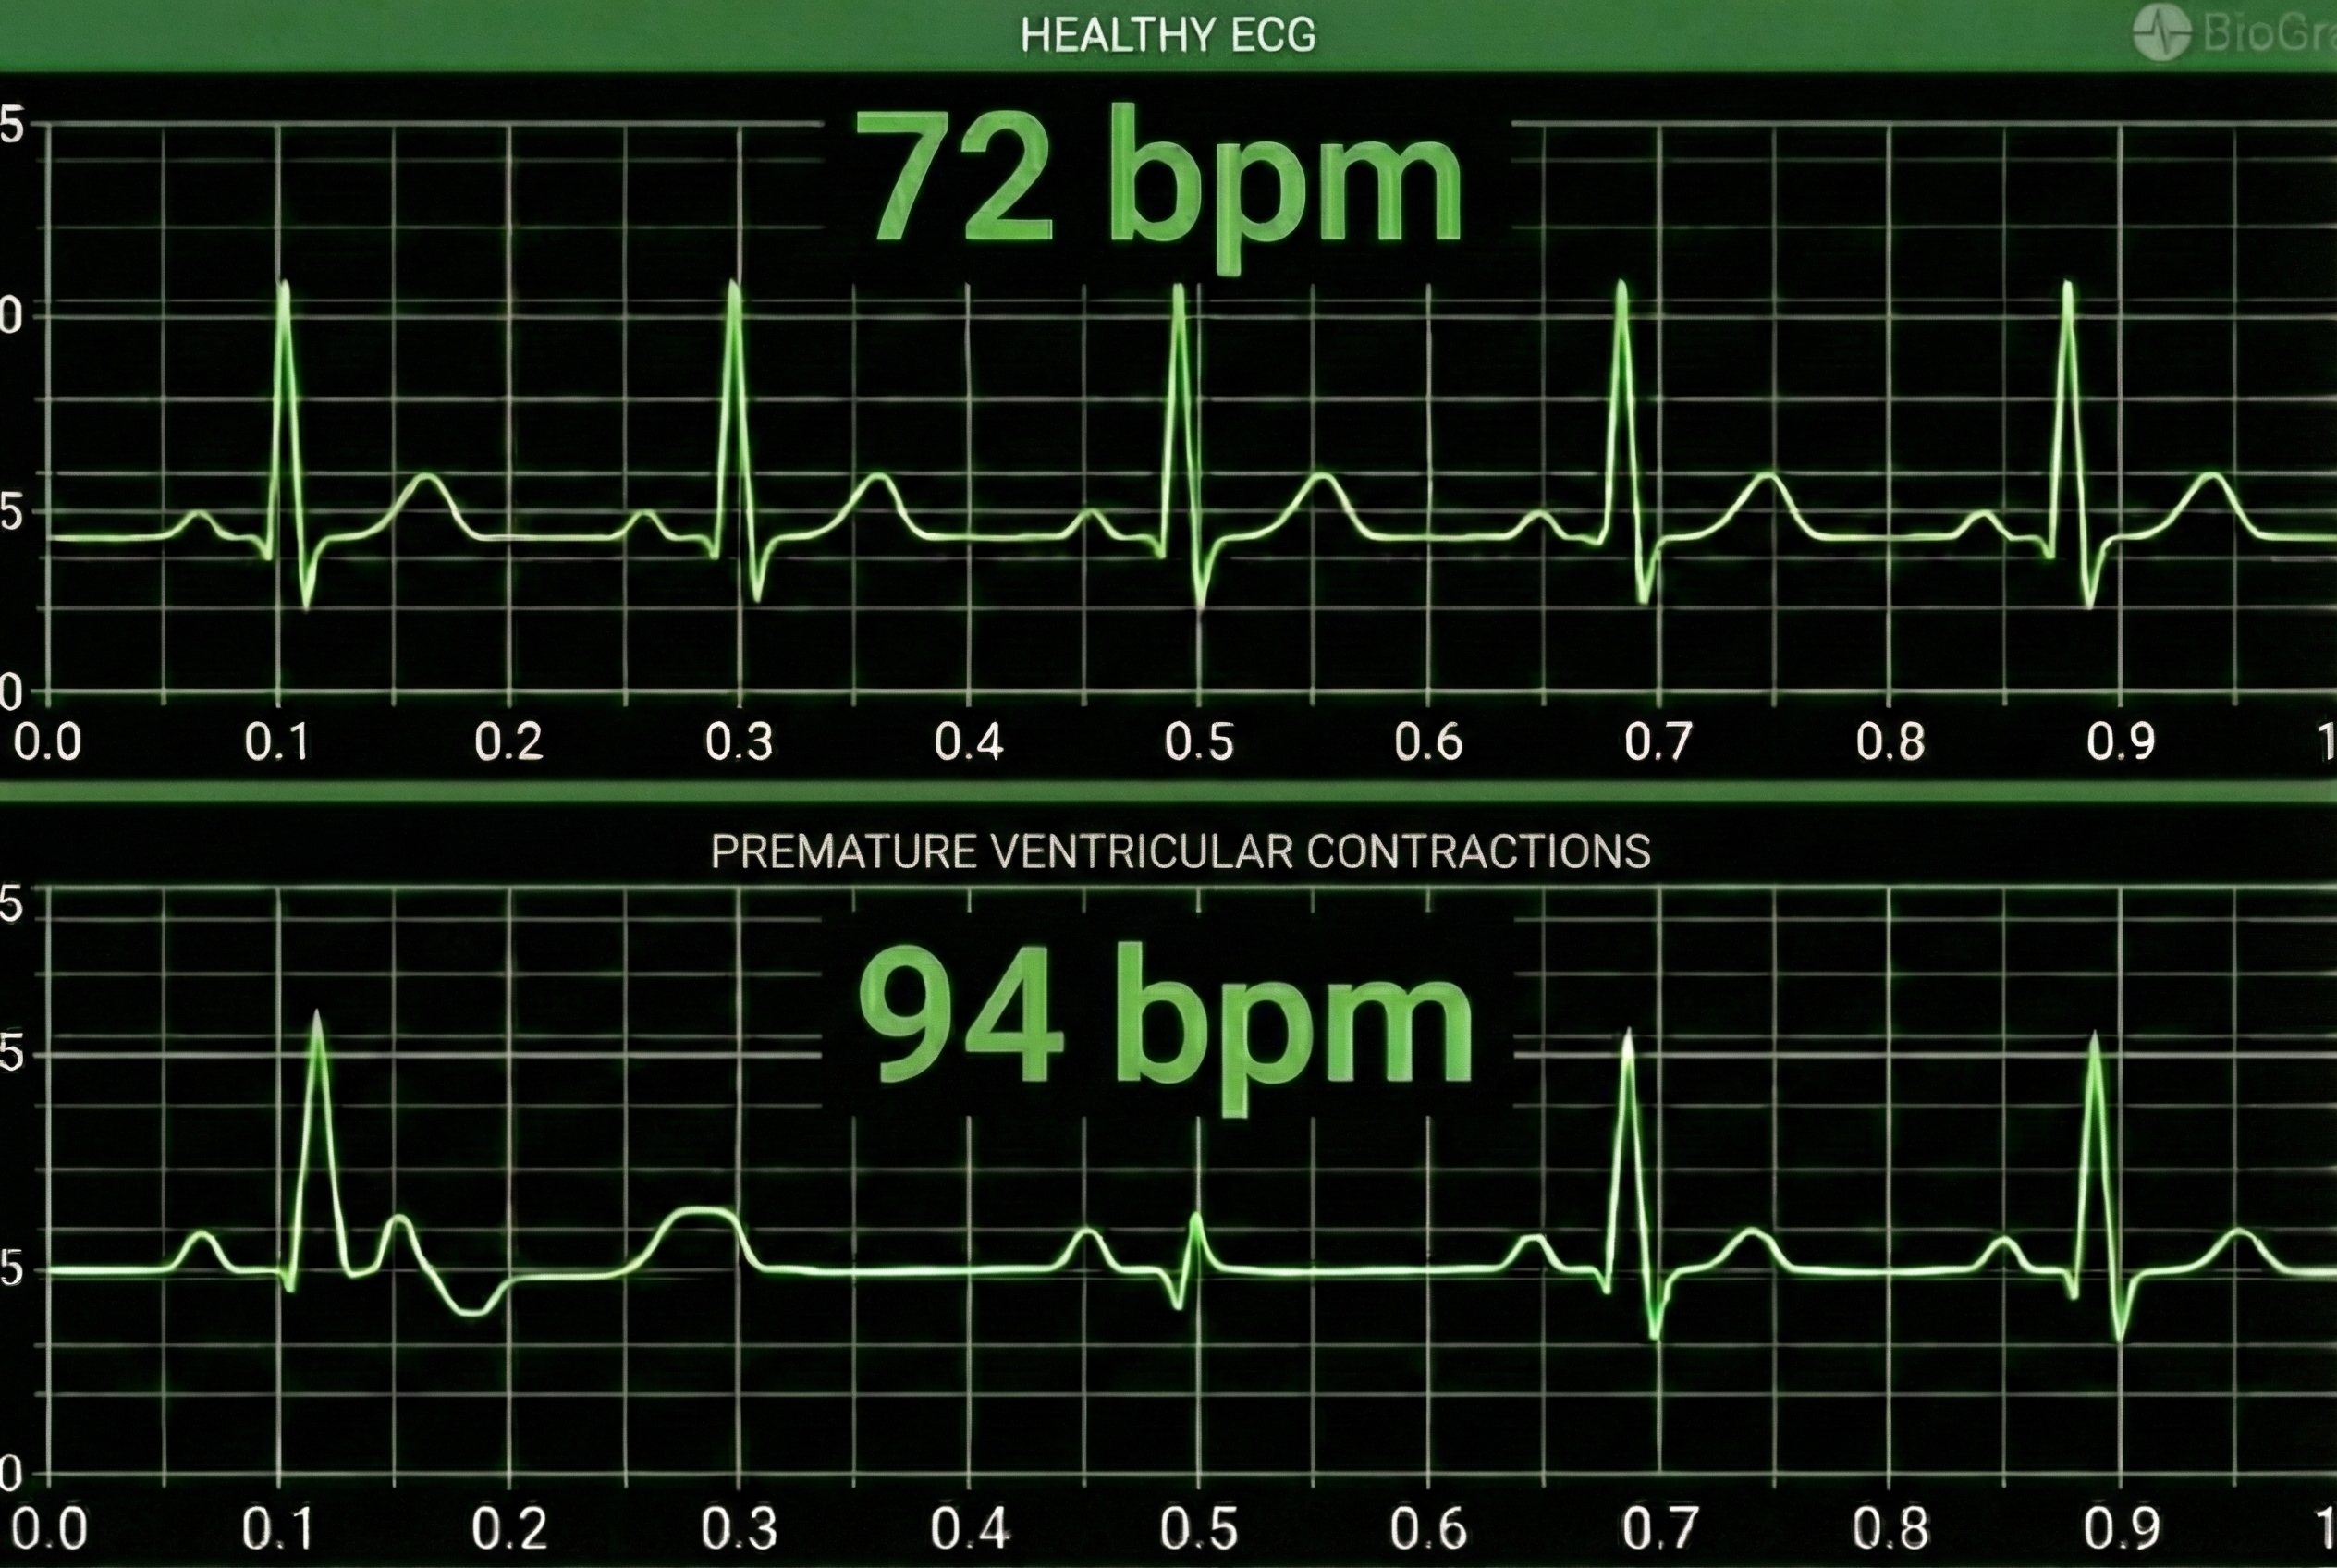
HRV artifacts can be produced by physiological events like atrial fibrillation, premature atrial contractions (PACs) and premature ventricular contractions (PVCs).
Discard a segment when more than 5% of IBI values are corrupted. Depending on the frequency of conduction abnormalities, you may not be able to analyze a contaminated data record.
Conversely, when distortion causes the software to detect an extra beat, this produces an artifactually short interbeat interval (IBI). As emphasized earlier, missed and extra beats also affect PPG recording (Elgendi, 2012).
Watch for These Artifacts
Always inspect the raw ECG signal before relying on your data. The following subsections detail each major artifact type—line interference, EMG, movement, respiration, DC offset, electromagnetic interference, and polarity—along with their characteristic appearances and practical clinical tips for prevention and correction.

EMG Artifact
Frequencies generated by the depolarization of skeletal muscles overlap with the ECG spectrum and produce EMG artifacts.
🎧 Mini-Lecture: ECG EMG Artifact
The surface EMG ranges from 1-1,000 Hz (Stern, Ray, & Quigley, 2001), while the ECG extends from 0.1-1,000 Hz (Langner & Geselowitz, 1960). Muscle action potentials from large muscle groups travel to ECG sensors via the process of volume conduction (Shaffer & Neblett, 2010).
Contraction of muscles in the arm can cause the software to "see" many extra beats and calculate shorter IBIs (Shaffer & Combatalade, 2013).
While EMG artifact affects ECG recordings, it does not contaminate the BVP signal since we detect it using infrared light.
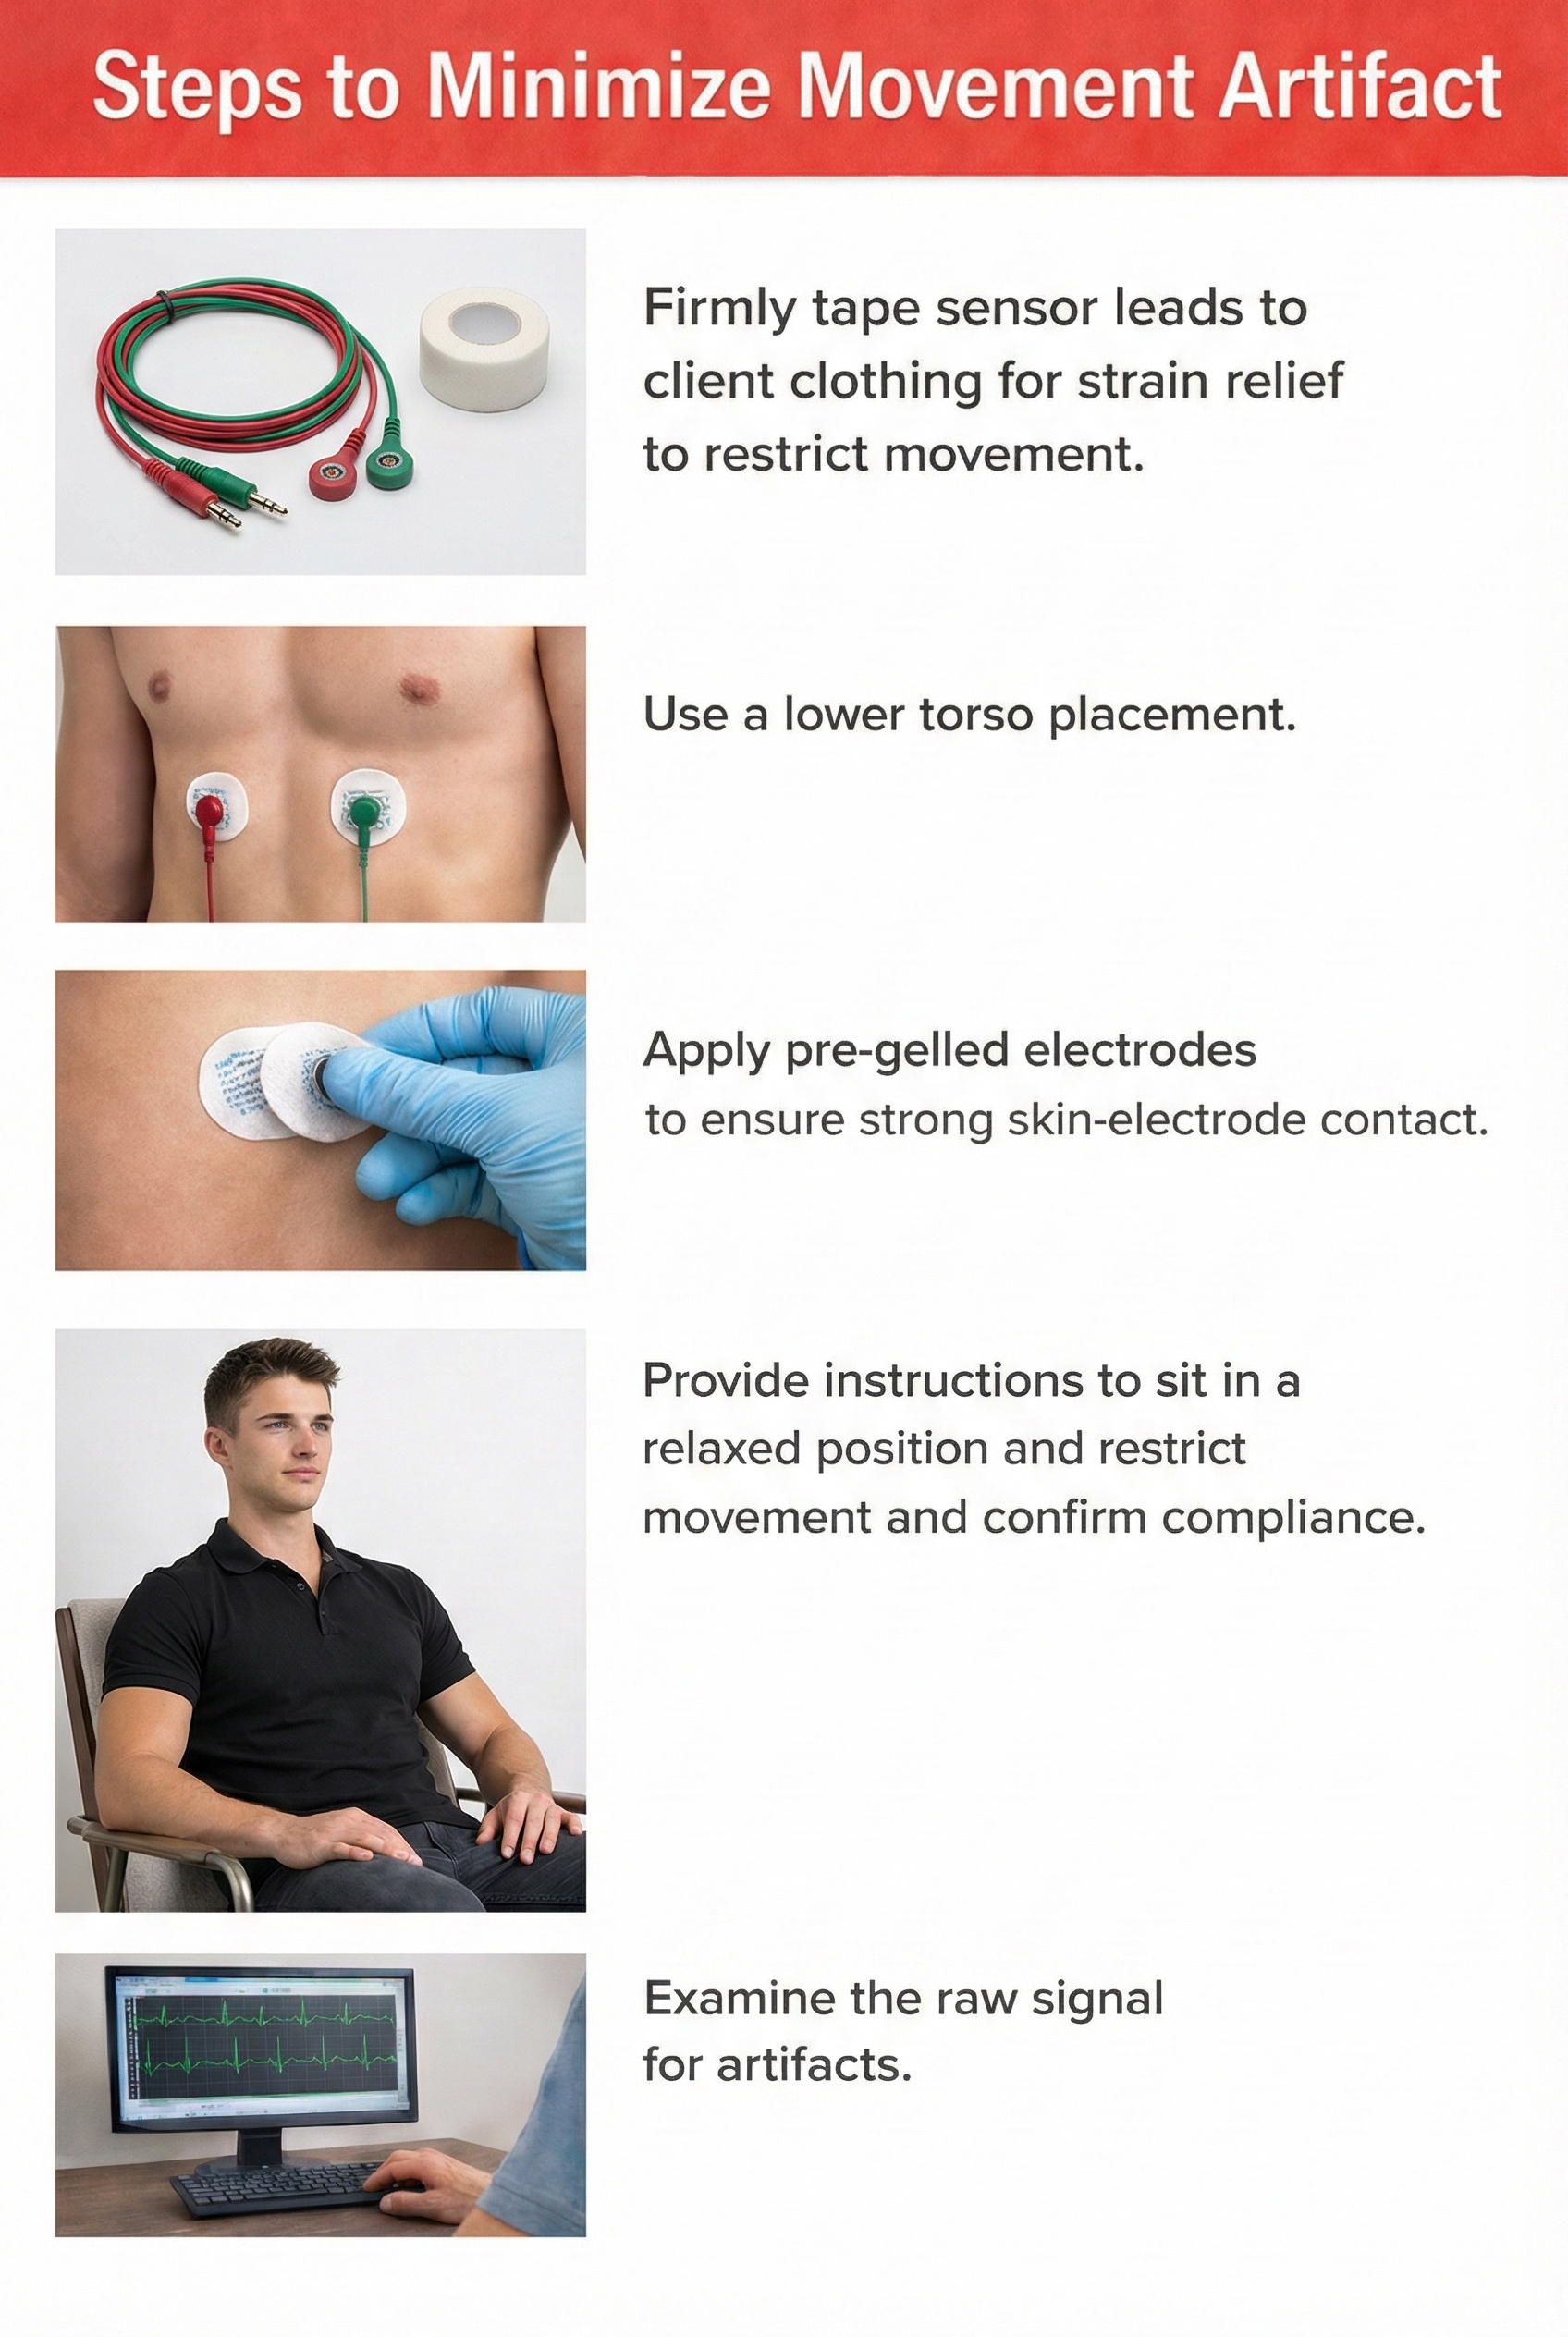
Movement Artifact
Client movement can pull the electrode cable so that the electrode partially (or completely) loses contact with the skin.
🎧 Mini-Lecture: ECG Movement Artifact
Movement artifact consists of high-amplitude signal fluctuations that cause the software to "see many extra beats and calculate shorter IBIs as with EMG artifact."
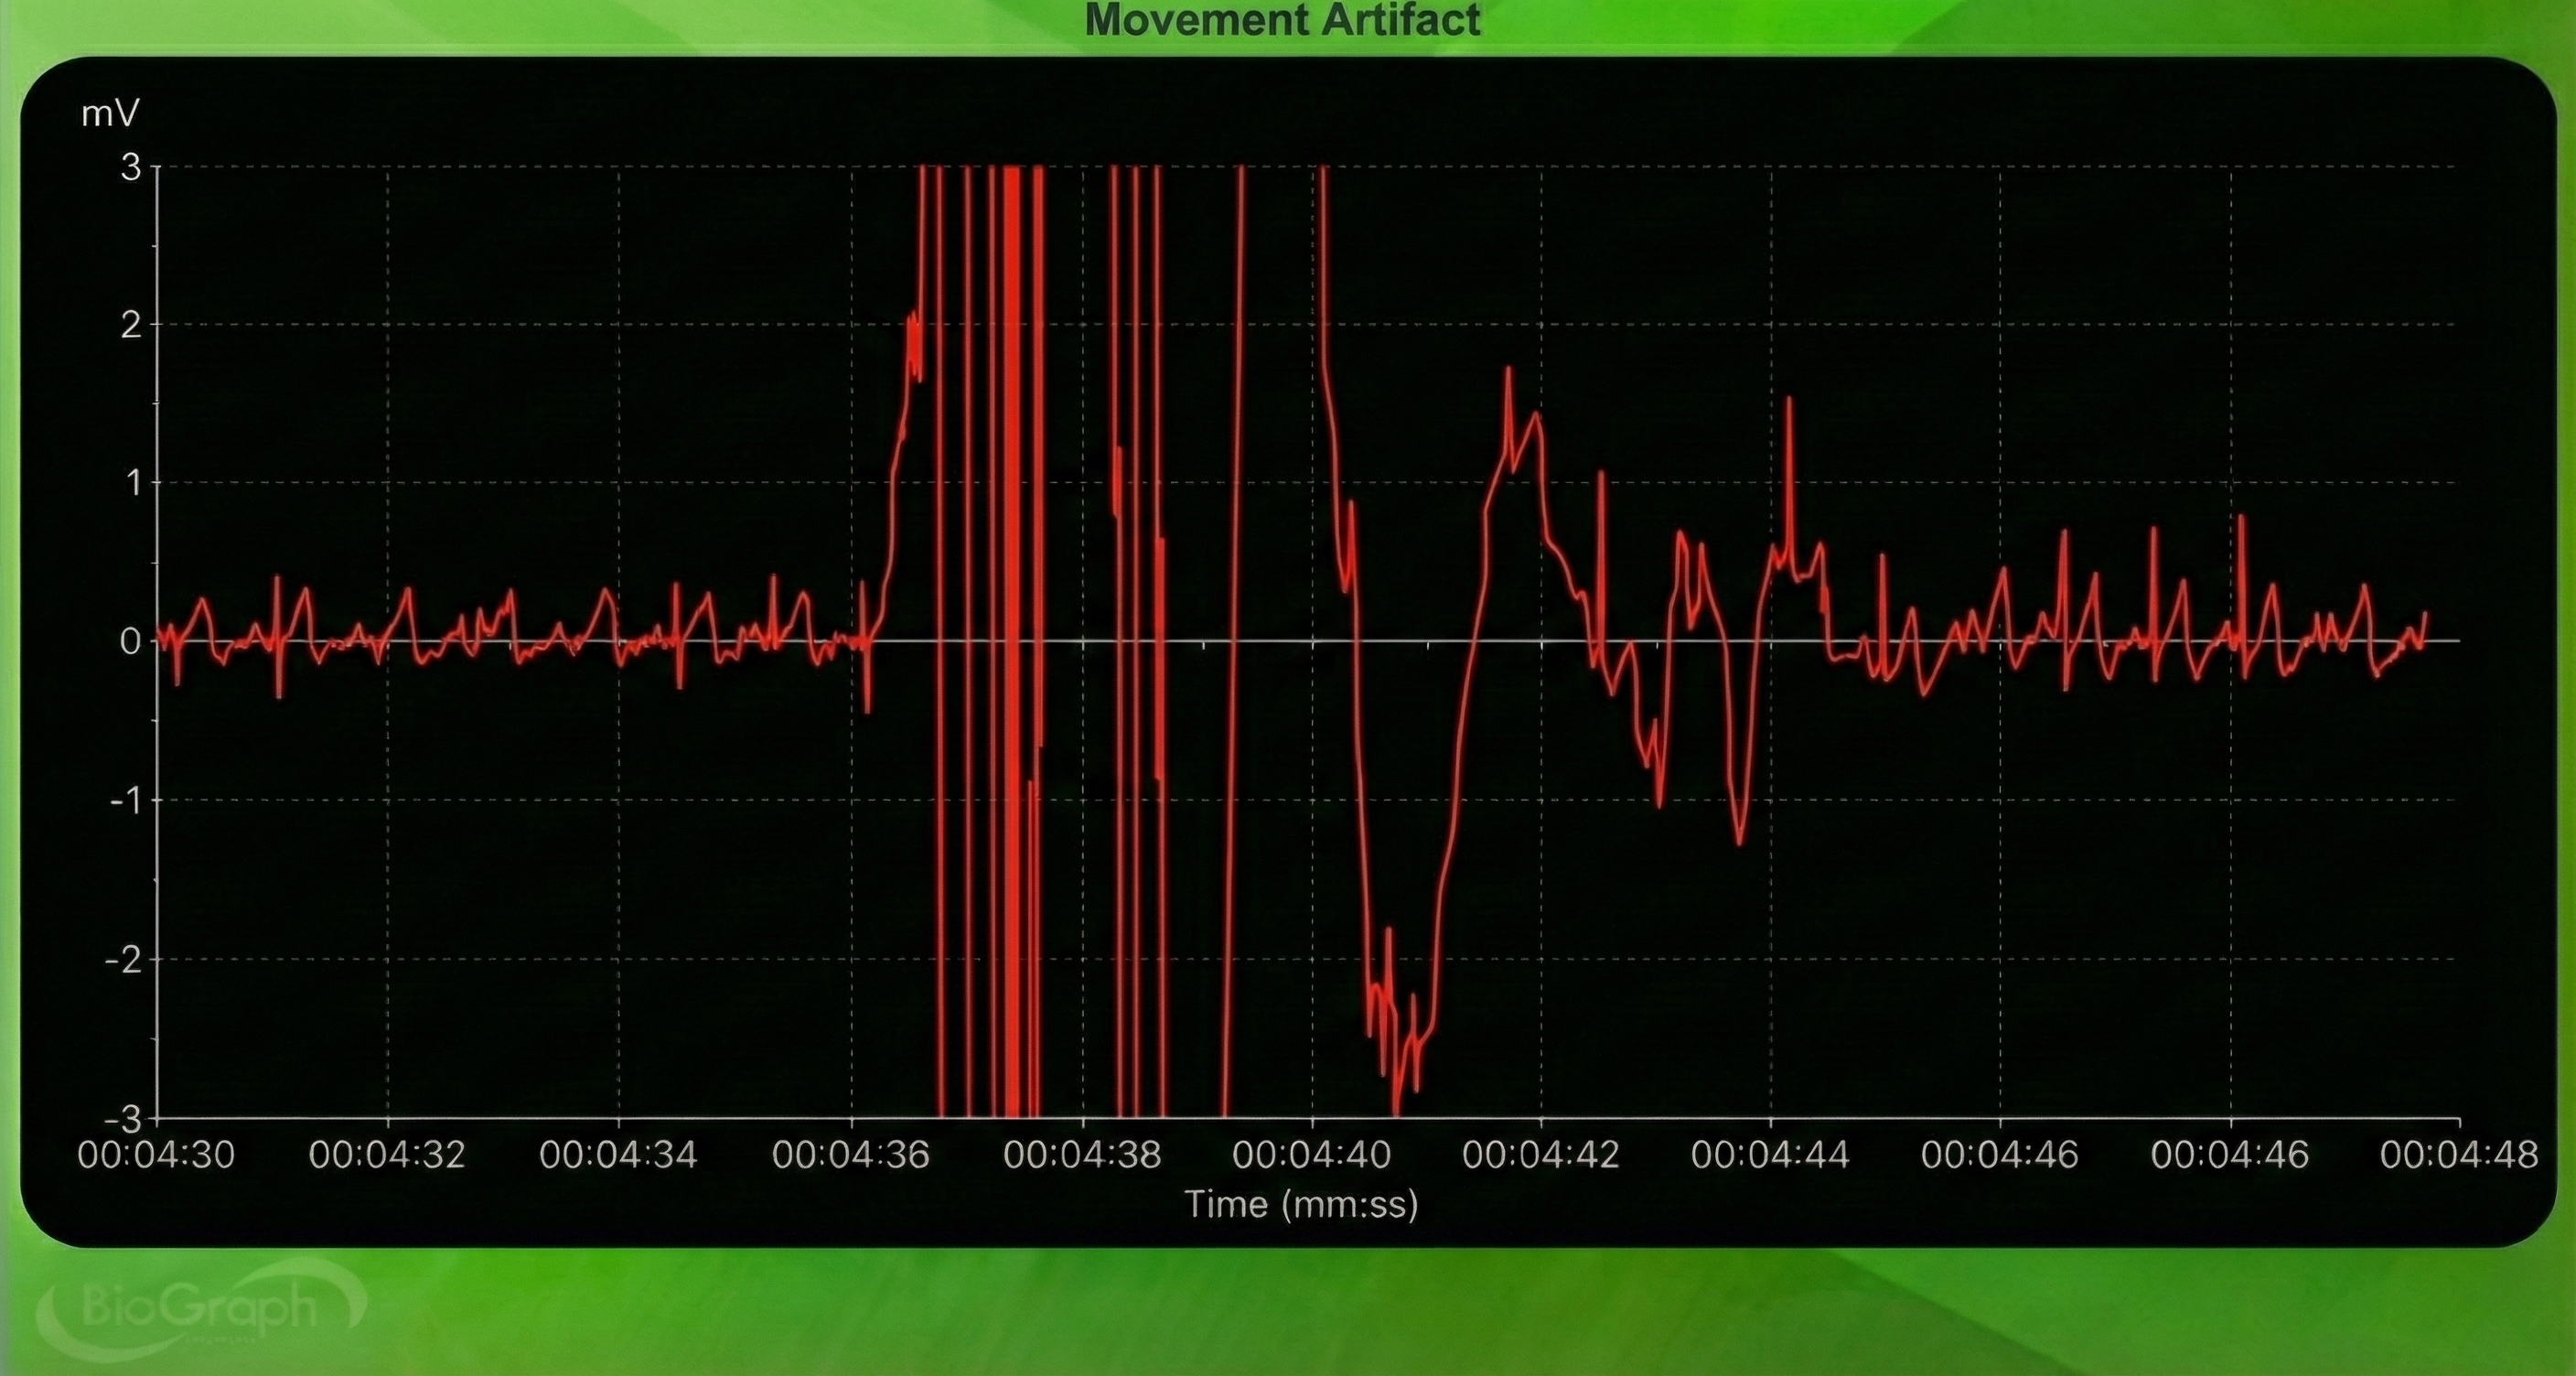
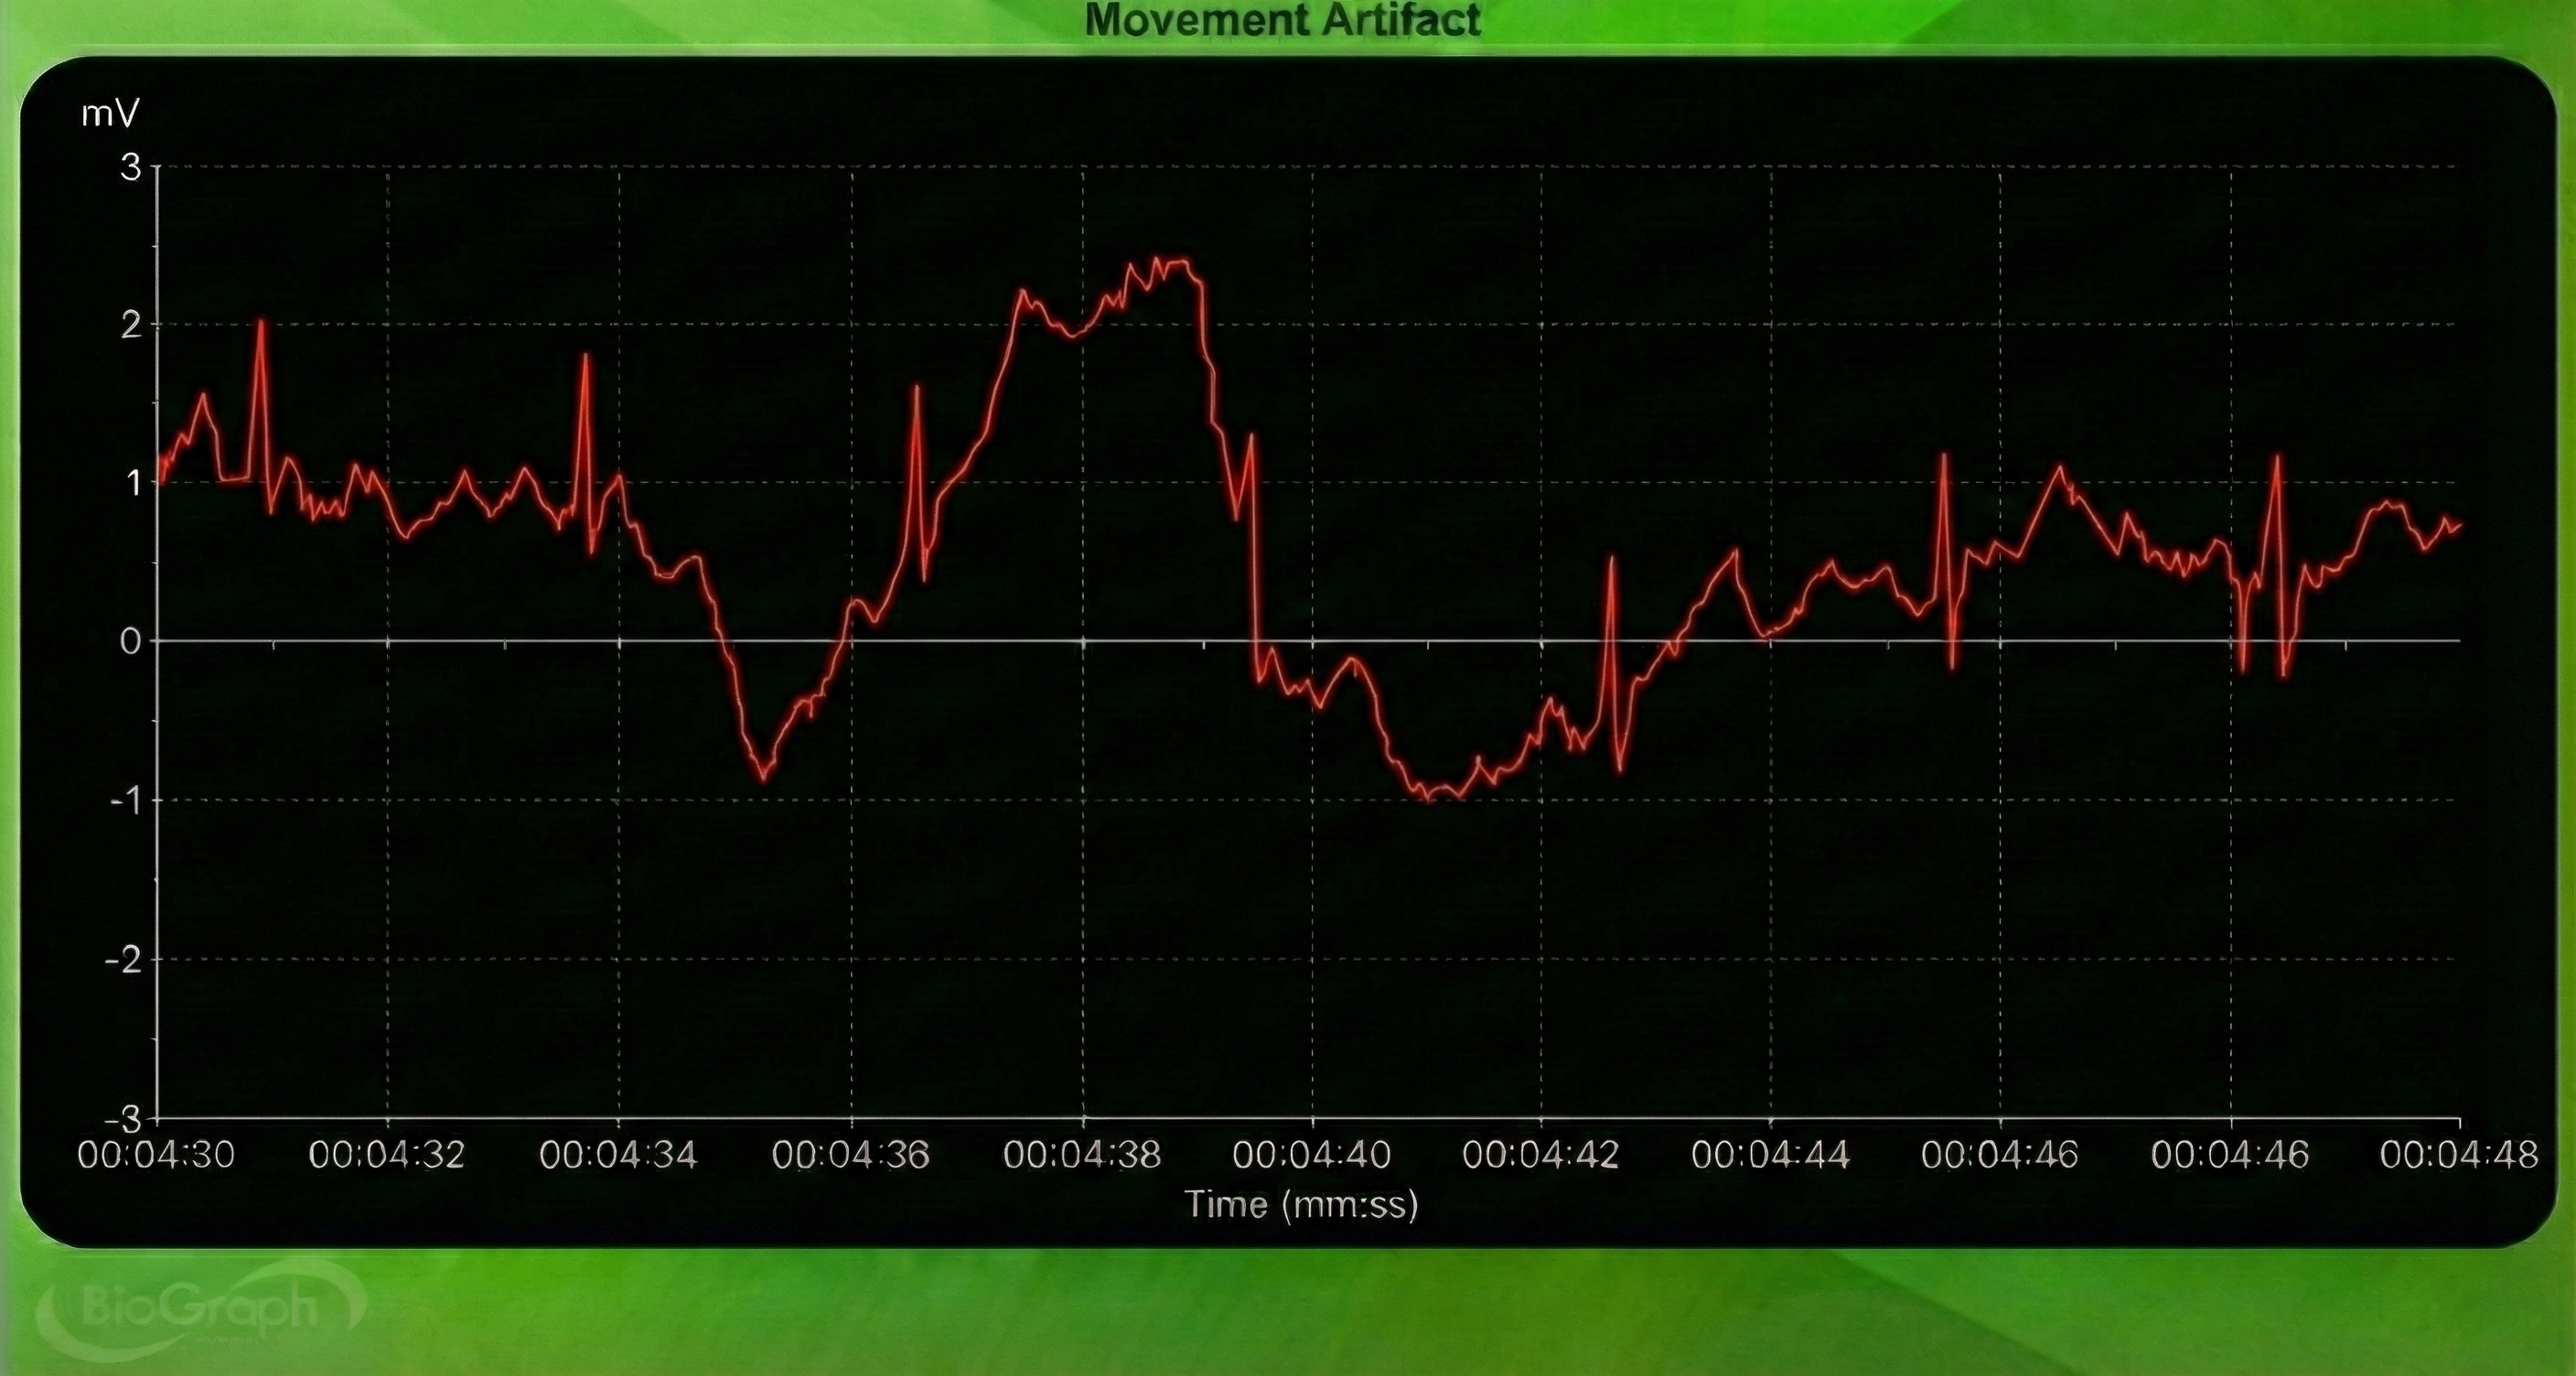
Below is a BioGraph ® Infiniti ECG display of movement artifact. The ECG (also called EKG) waveform abruptly shifts upward after the sixth heartbeat and then returns to normal.
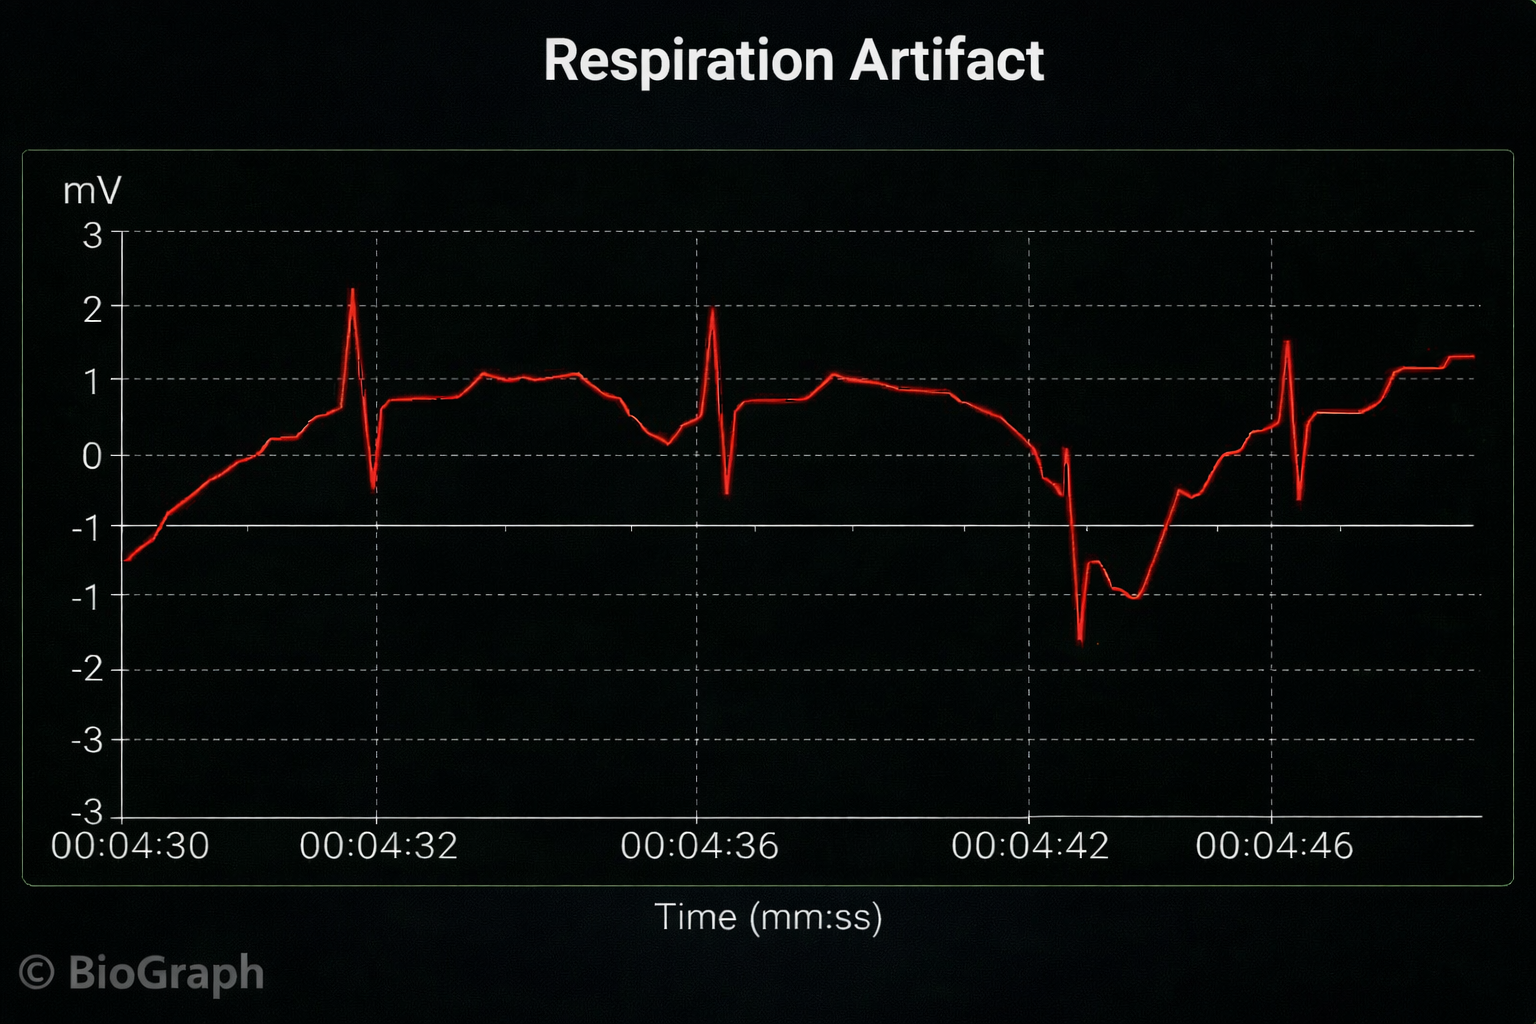
Respiration Artifact
Respiration artifacts can result from dried gel and inadequate skin preparation.
🎧 Mini-Lecture: ECG Respiration Artifact
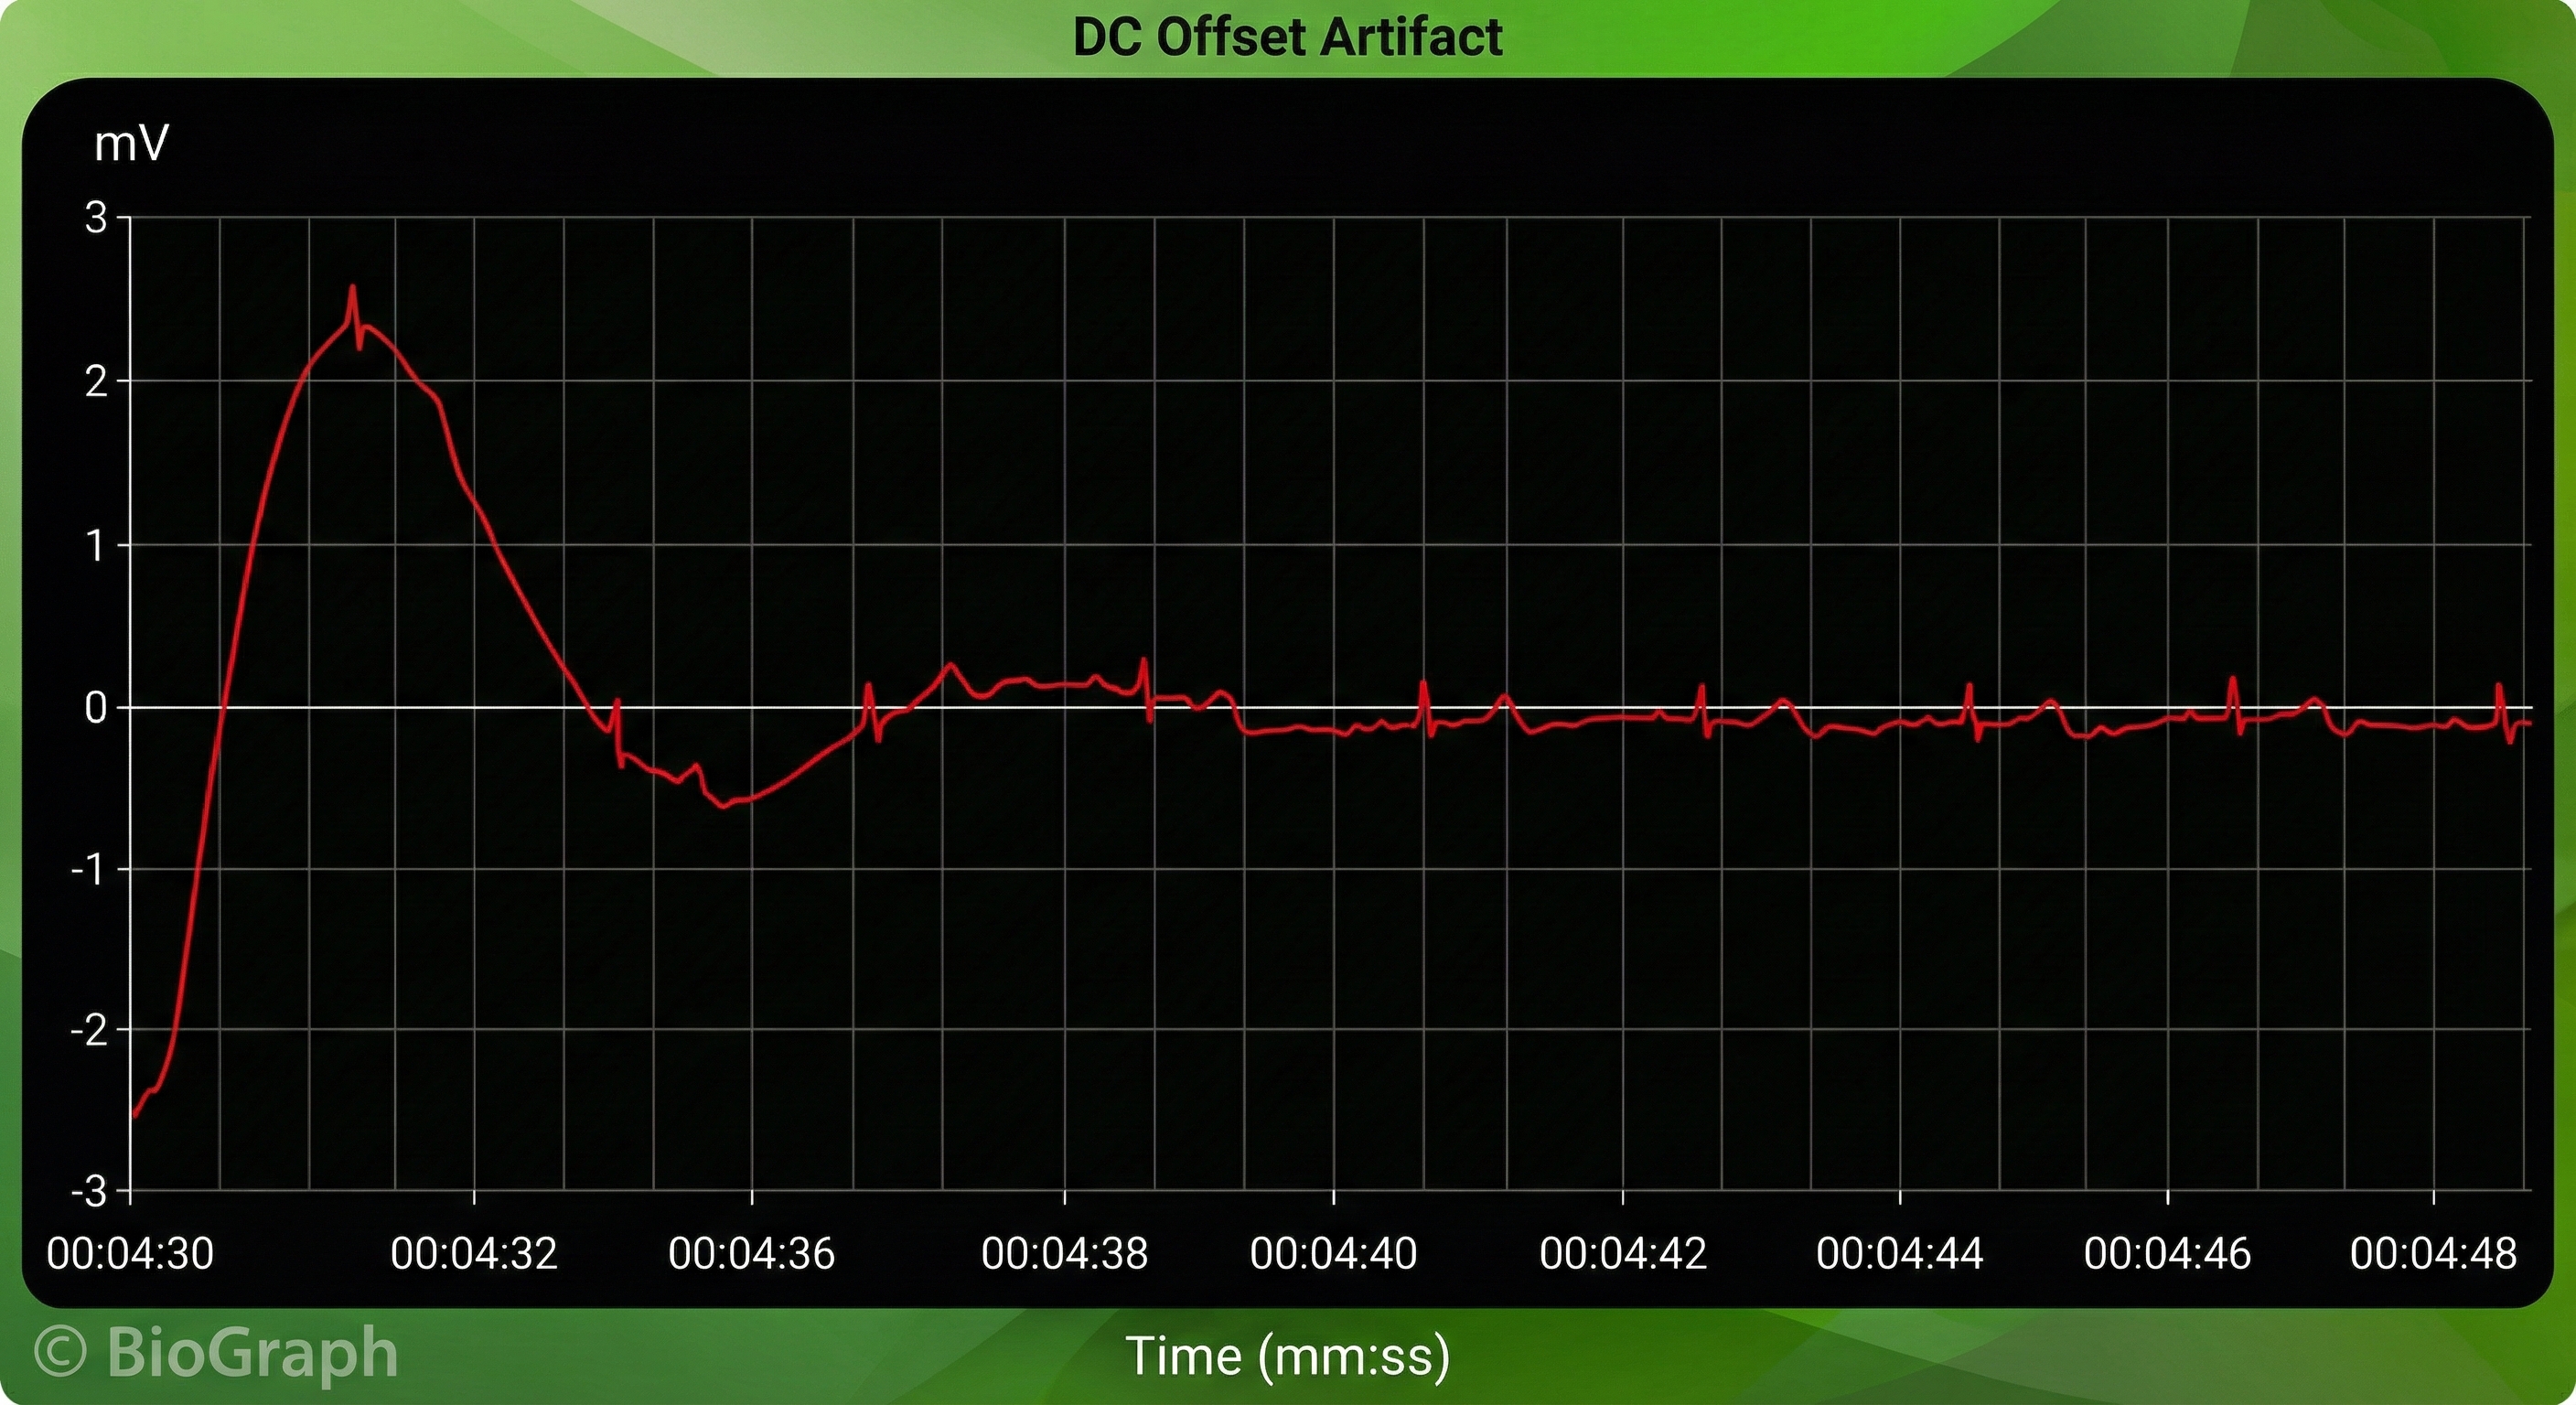
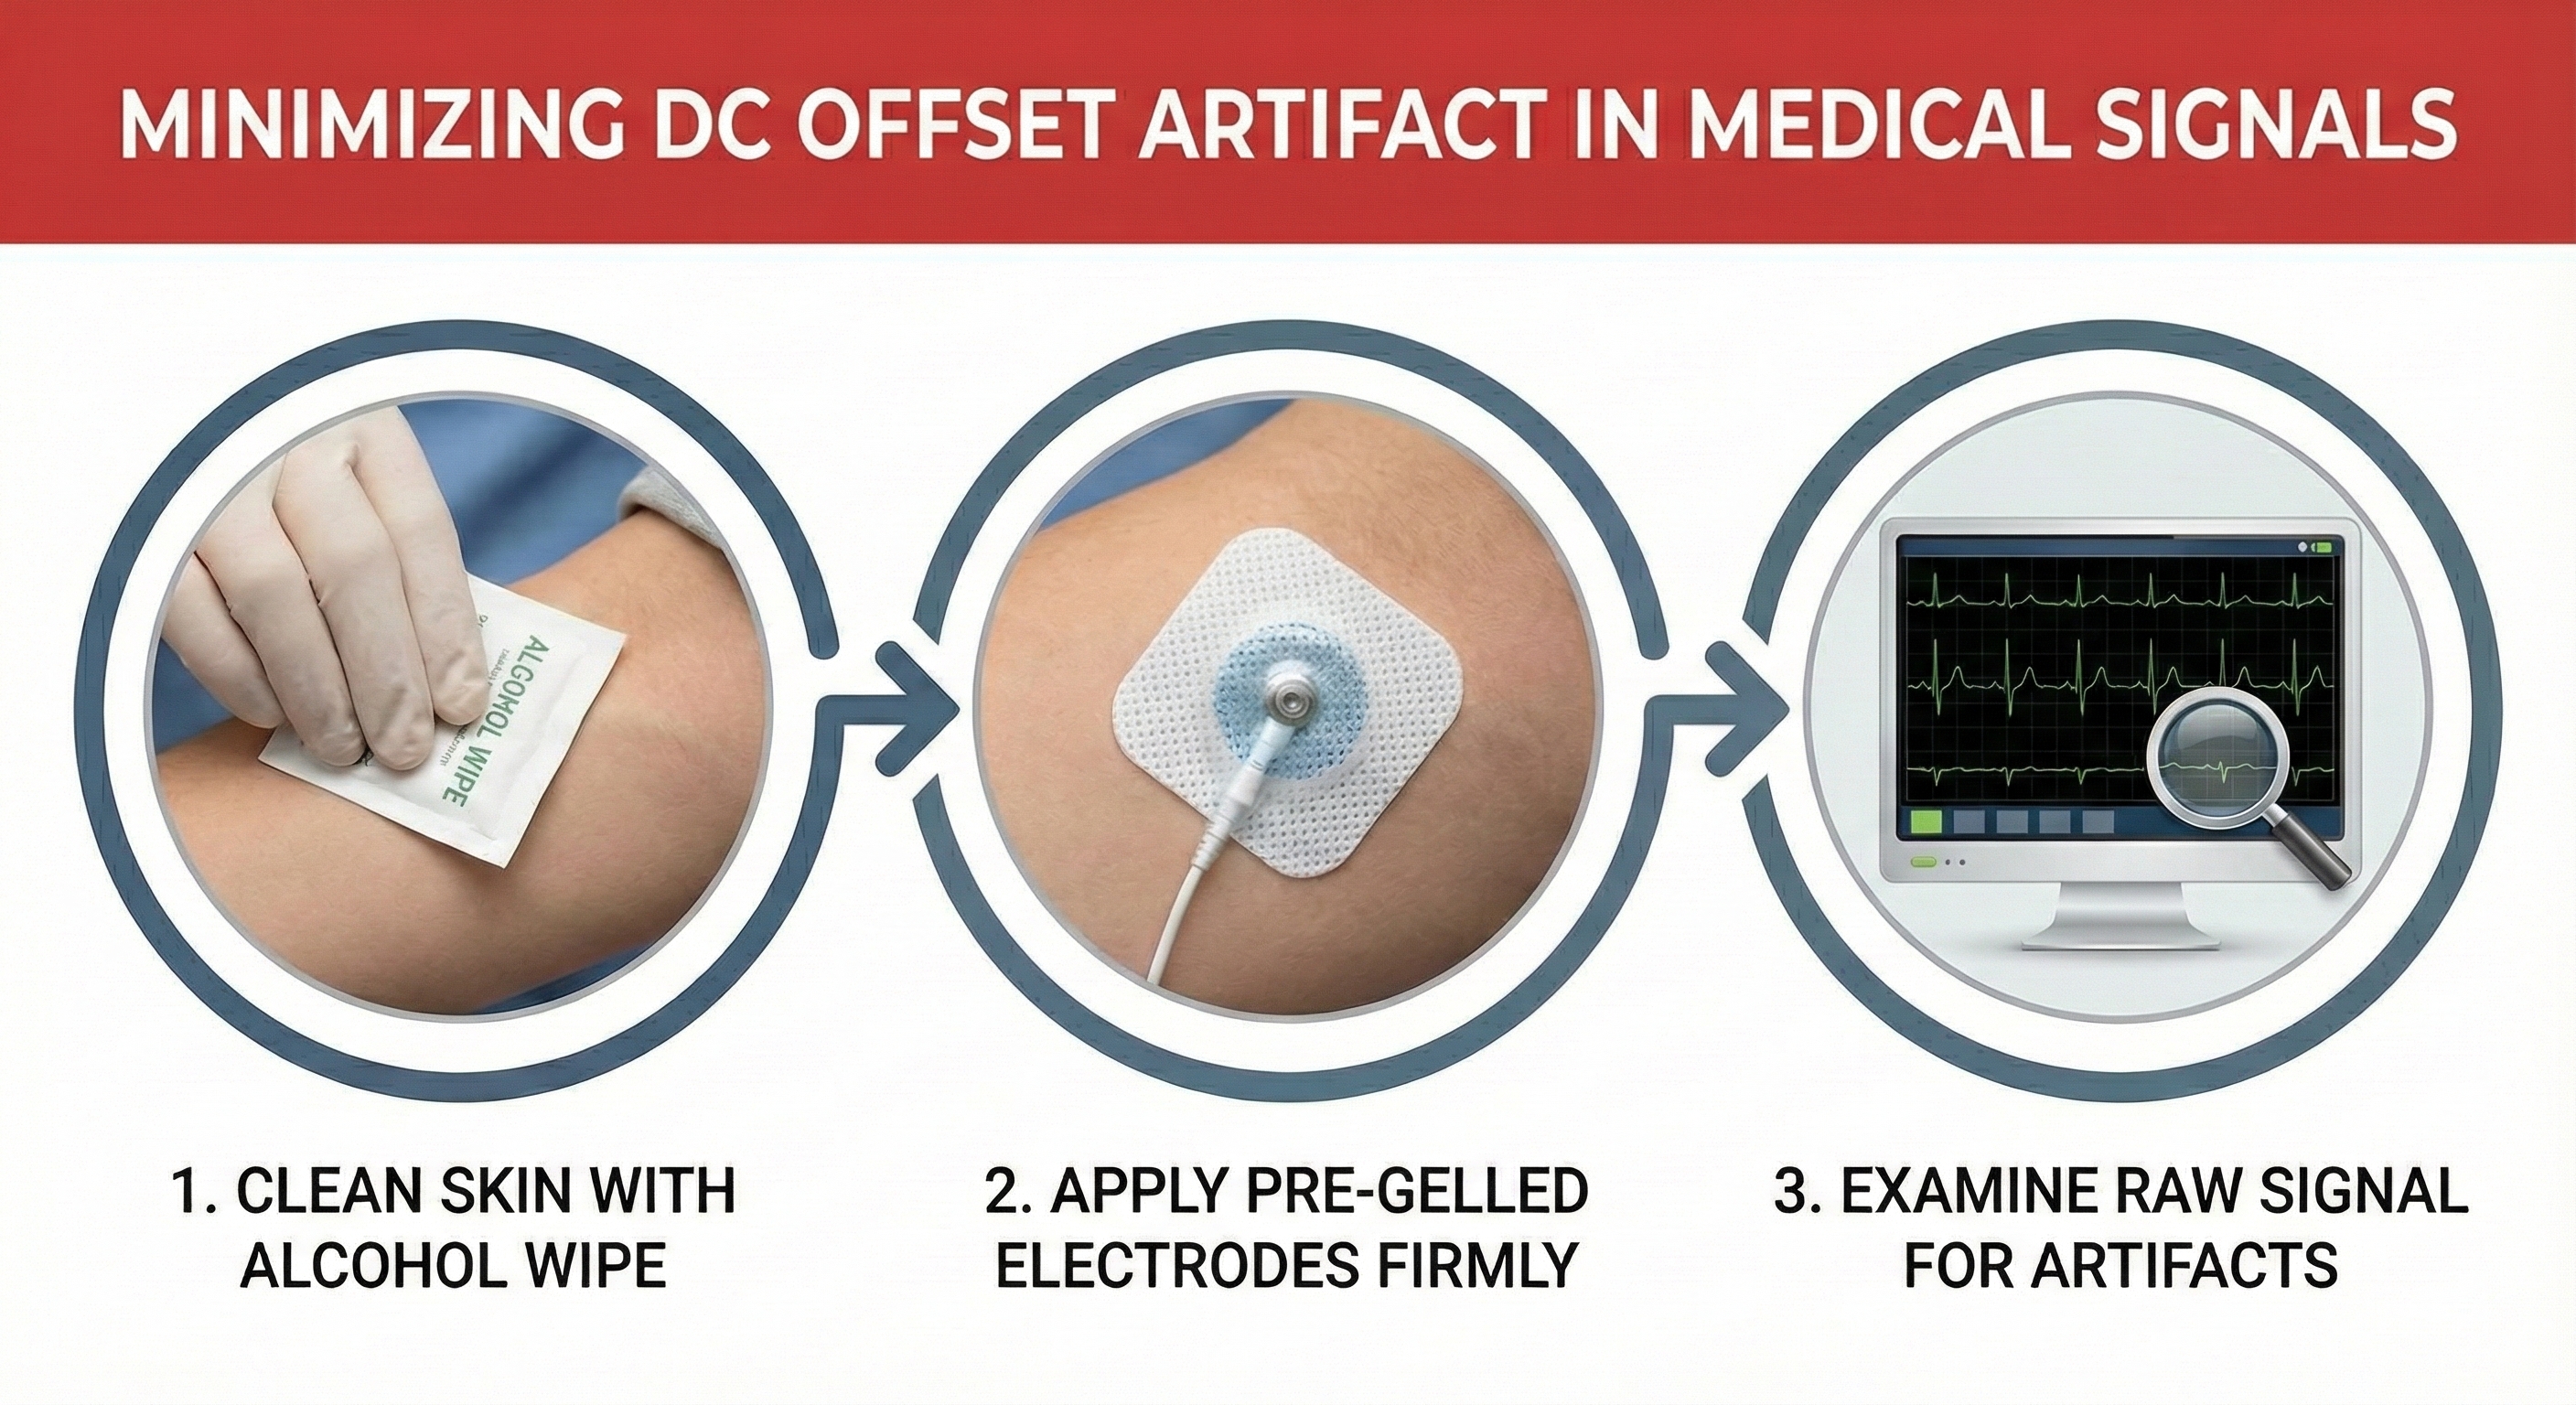
Direct Current (DC) Offset Artifact
DC offset artifact occurs when the skin-electrode impedances of the three ECG electrodes differ due to poor skin-electrode contact.
🎧 Mini-Lecture: ECG DC Offset Artifact
The ECG signal may drift up or down, causing extra or missed beats.
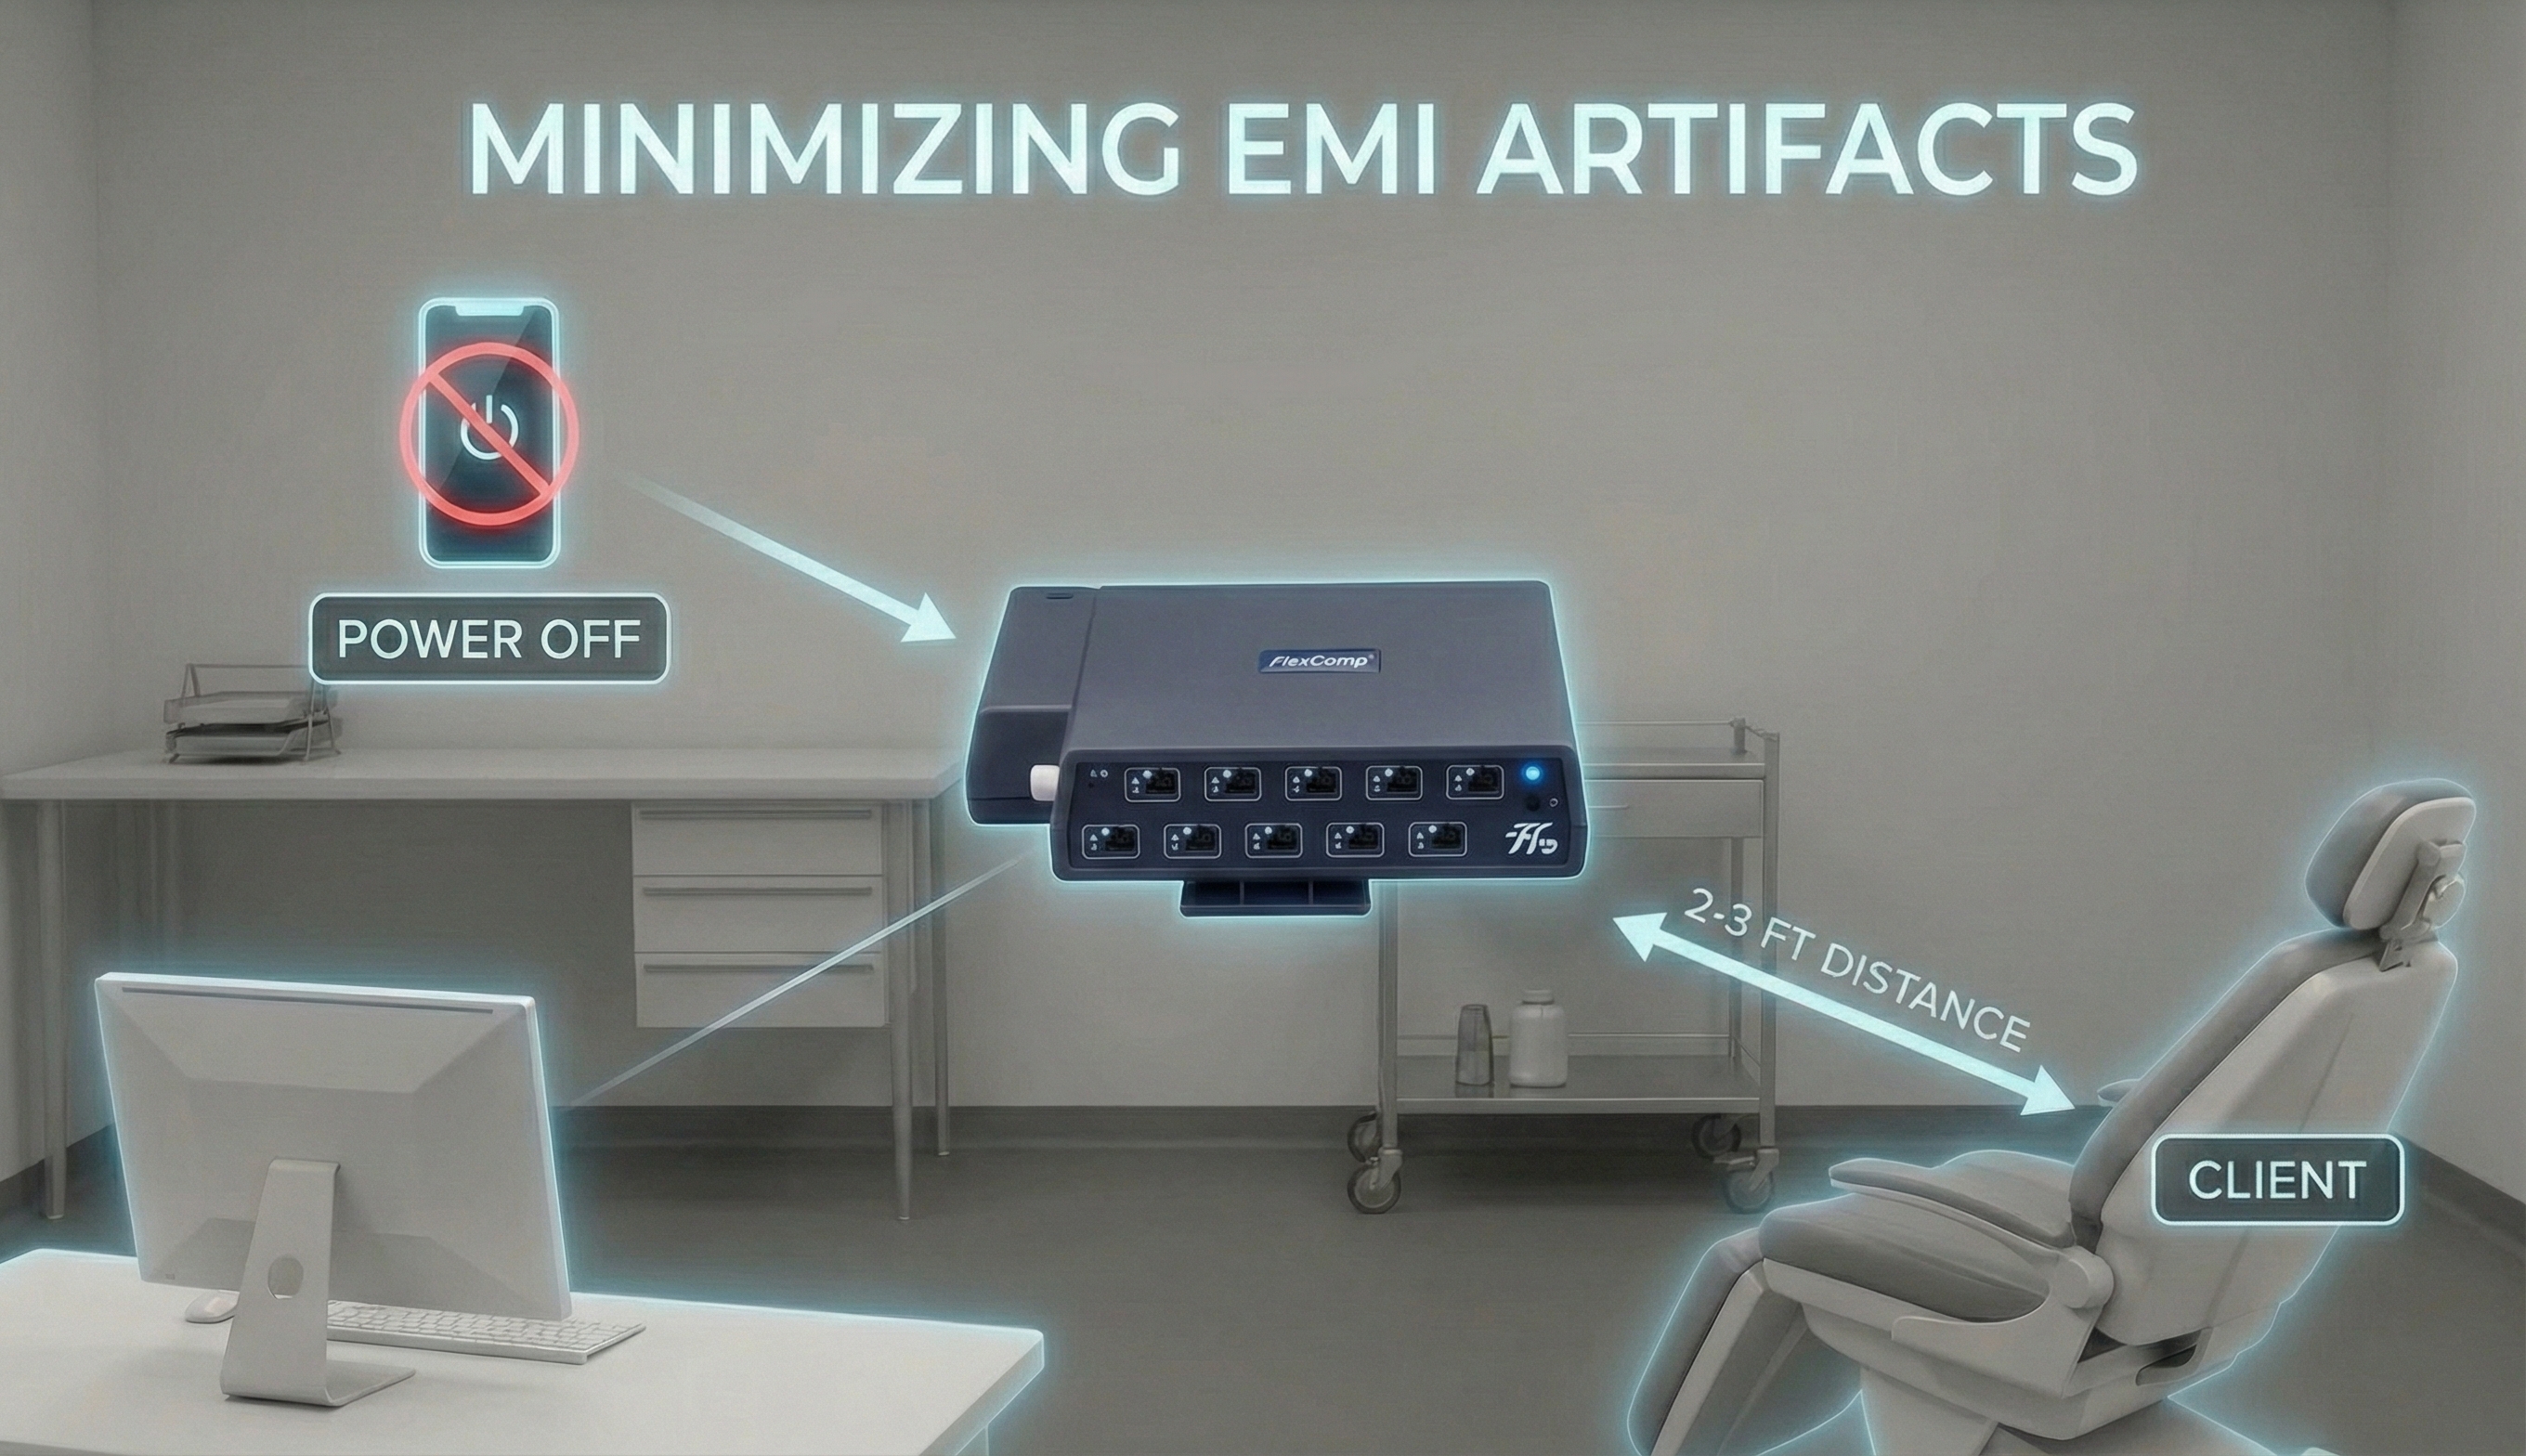
Electromagnetic Interference (EMI) Artifacts
Electromagnetic interference (EMI) artifacts are generated by cell phones when they are less than 6 ft (2 m) from ECG sensors or encoder boxes (Peper & Lin, 2010).
🎧 Mini-Lecture: ECG Electromagnetic Interference Artifacts
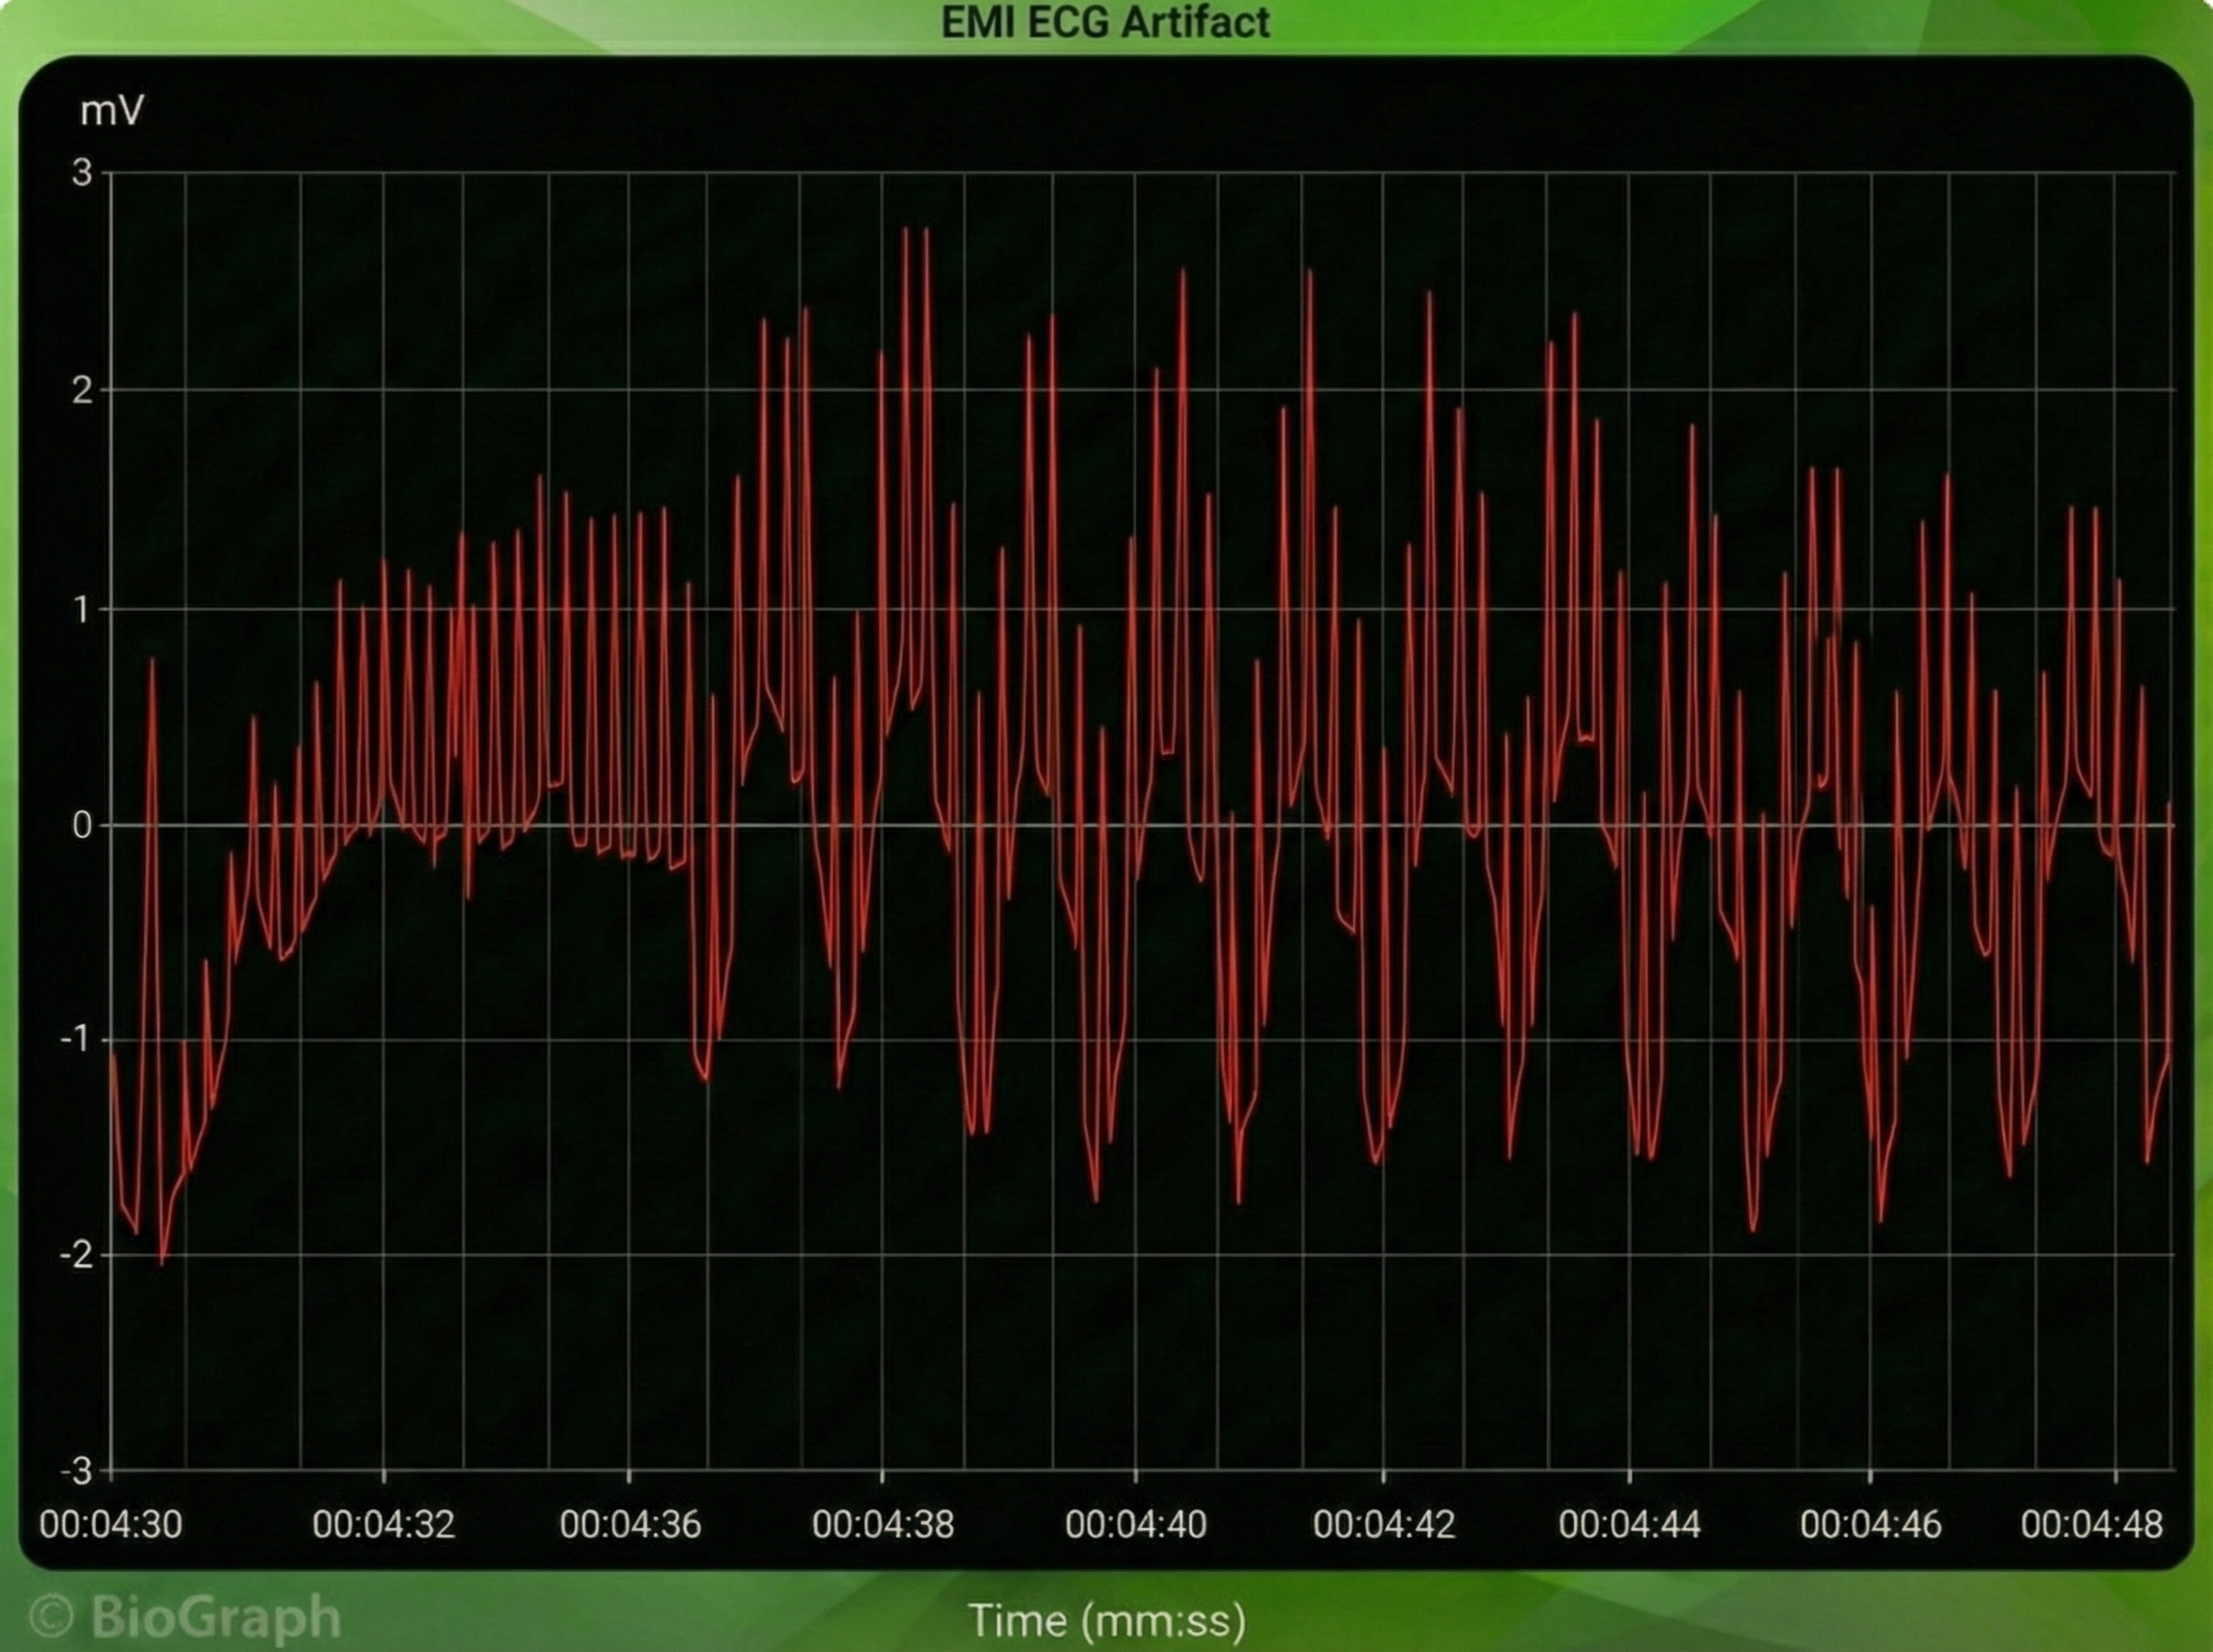
Computer monitors and television screens generate EMI artifacts. These are also called radiofrequency (RF) artifact. High-frequency energy expands outward from a monitor like a cone (Montgomery, 2004).
Also, watch out for audiovisual systems and high-voltage equipment like centrifuges, elevators, and x-ray machines (Lehrer, 2018b).
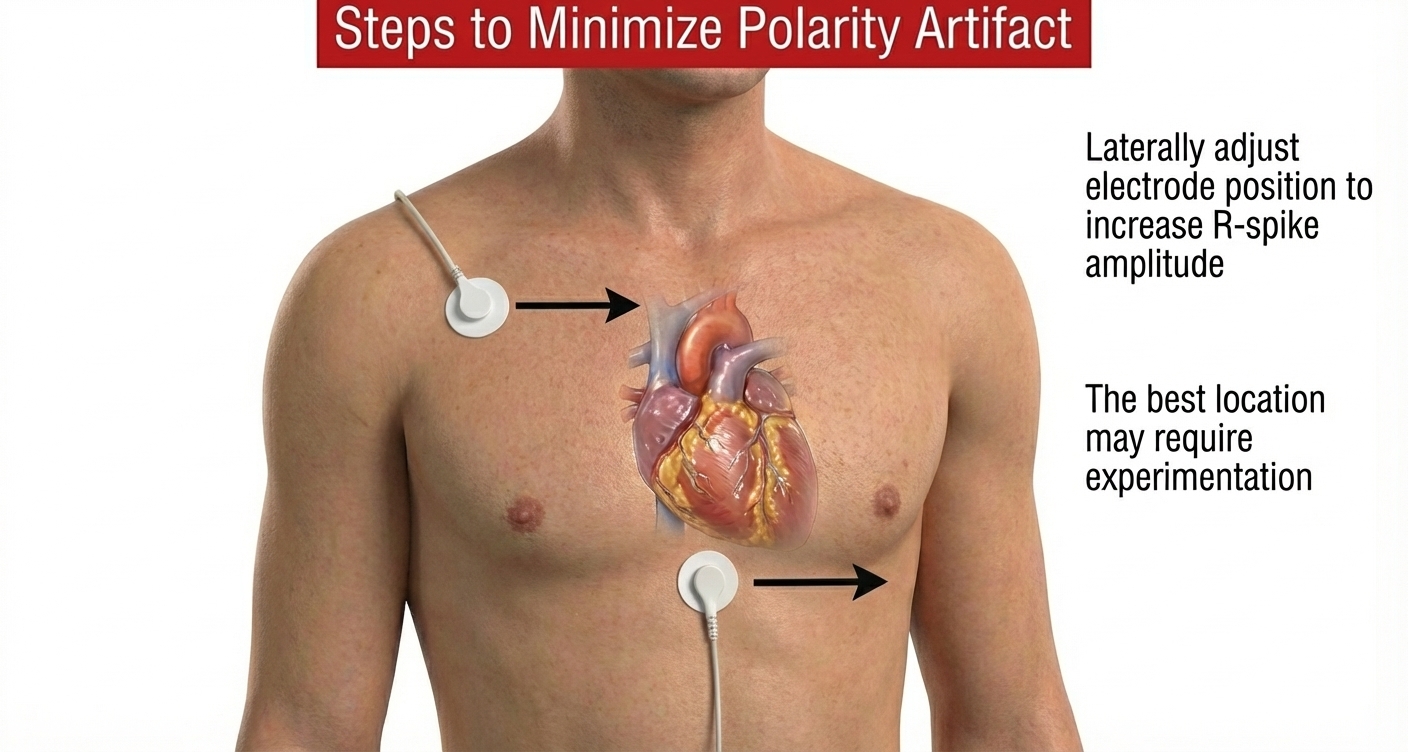
Polarity Artifact
Polarity artifact occurs when the active electrodes (yellow and blue for Thought Technology) are misaligned with respect to the heart's axis.
🎧 Mini-Lecture: ECG Polarity Artifact
A low-amplitude downward-oriented R-spike can cause the software to miss beats and lengthen the IBI.
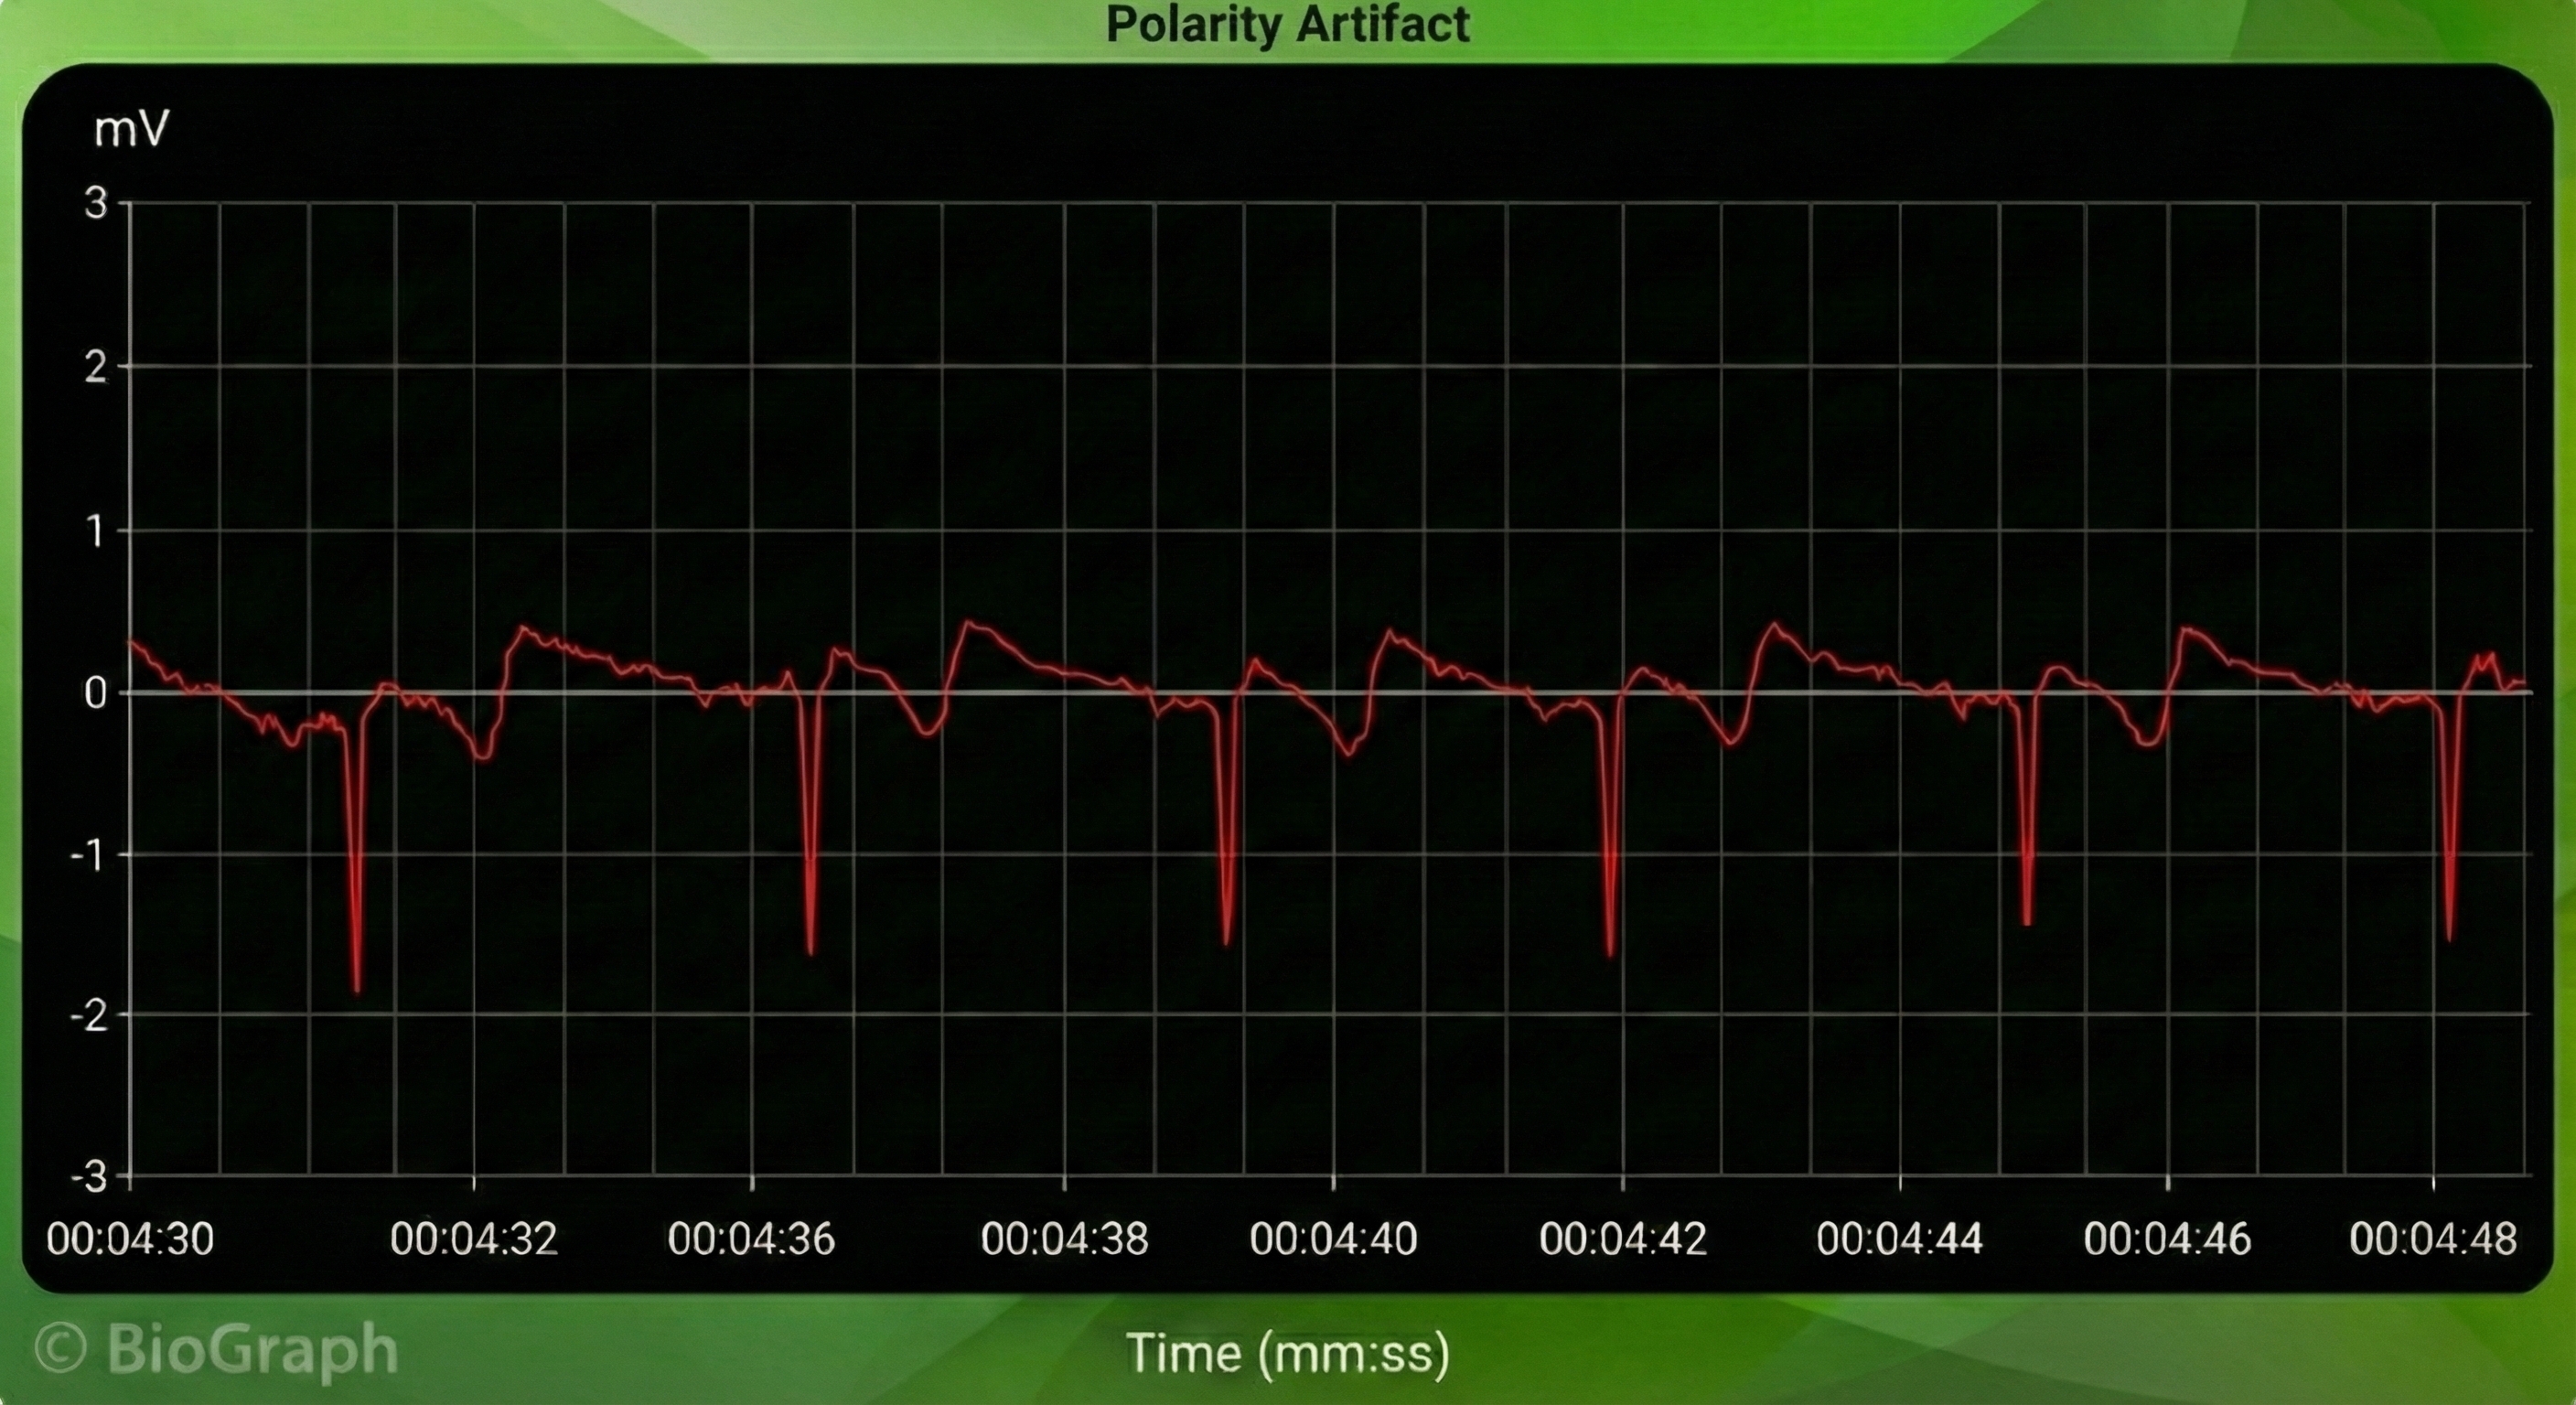
Software packages can automatically correct for polarity artifact (Lehrer, 2018b).
Tracking Test
Using a respirometer, you can determine whether the ECG signal responds to your client's breathing by observing whether instantaneous HR speeds during inhalation and slows during exhalation (gray line) (Nederend et al., 2016).
🎧 Mini-Lecture: ECG Tracking Test
![]()
The BioGraph ® Infiniti display below shows that instantaneous HR (pink) speeds and slows as the abdominal strain gauge (purple) rhythmically expands and contracts. You can enlarge the video by clicking on the bracket icon at the bottom right of the screen. When finished, click on the ESC key.
ECG and Respiration Demonstration
In this video demonstration, Dr. Inna Khazan walks through a complete ECG and respiration recording, including real-time artifact identification and a tracking test. Watching an experienced clinician perform these procedures brings together the concepts covered throughout this unit—sensor placement, artifact recognition, and signal verification—into a coherent clinical workflow. You can enlarge the video by clicking on the bracket icon at the bottom right of the screen. When finished, click on the ESC key.
Which ECG Placement Would You Recommend?
Which ECG placement would you recommend for HRV training? The answer depends on your clinical priorities. Select a wrist or forearm placement when client comfort and preparation time are your primary concerns—for example, during an initial evaluation with an anxious veteran or a first-time athlete. Consider Erik Peper's lower torso placement if these limb placements produce unacceptable movement artifacts, as it provides cleaner data while remaining accessible and minimally invasive.
Comprehension Questions: Tracking Test and Clinical Decision-Making
- What should you observe during a tracking test to confirm that your ECG system is working properly?
- Why is the tracking test important before beginning an HRV biofeedback session?
- A new client is anxious about the session. Which placement would you choose first, and what would prompt you to switch to a different placement?
Cutting Edge Topics
Wearable ECG Technology
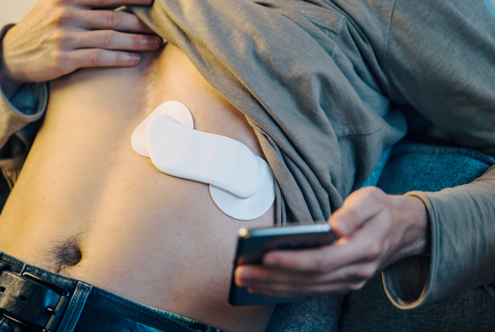
Consumer wearable devices like the Apple Watch, Fitbit, and dedicated HRV trackers such as the Lief Therapeutics sensor are making continuous ECG monitoring increasingly accessible outside clinical settings. These devices use simplified electrode configurations, often single-lead setups, that sacrifice some signal quality for convenience and long-term wearability. While not yet equivalent to clinical-grade systems for diagnostic purposes, they are expanding the possibilities for home-based HRV biofeedback training and ambulatory monitoring.
AI-Assisted Artifact Detection
Machine learning algorithms are being developed to automatically detect and classify ECG artifacts in real time. These systems can potentially identify line interference, EMG contamination, and movement artifacts faster and more consistently than manual inspection, helping clinicians spend less time troubleshooting signal quality and more time on therapeutic interventions.
Smartphone-Based ECG Recording
Smartphone applications paired with small external sensors or even the phone's built-in sensors are enabling ECG recording in settings where traditional biofeedback equipment is impractical. Research is exploring the reliability of these systems for HRV assessment and biofeedback training, particularly in underserved communities and remote telehealth applications.
Essential Skills
After completing this unit, you should be able to demonstrate each of the following essential skills related to ECG instrumentation:
1. Explain the ECG signal and biofeedback to a client.
2. Explain ECG sensor attachment to a client and obtain permission to monitor her.
3. Explain how to select a placement site and demonstrate how to attach ECG sensors to minimize movement artifacts.
4. Demonstrate skin preparation.
5. Perform a tracking test by asking your client to inhale slowly and then exhale as you watch the change in heart rate.
6. Identify movement artifact in the raw ECG signal and explain how to control movement, and remove this artifact from the raw data.
7. Explain the major measures of heart rate variability, including HR Max - HR Min, pNN50, SDNN, and SDRR.
8. Explain why we train clients to increase power in the low-frequency band of the ECG and how breathing at 5-7 breaths per minute helps them accomplish this.
9. Demonstrate how to instruct a client to utilize a feedback display.
10. Describe strategies to help clients increase their heart rate variability.
11. Demonstrate an HRV biofeedback training session, including record keeping, goal setting, site selection, baseline measurement, display and threshold setting, coaching, and debriefing at the end of the session.
12. Demonstrate how to select and assign a practice assignment based on training session results.
13. Evaluate and summarize client progress during a training session.
Assignment
What is wrong with the heart rate signal shown below? What problem could this cause?
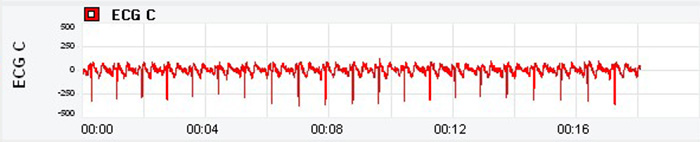
The ECG waveform is inverted, with the R-spike pointing downward. While this was not a problem for this particular client, low-amplitude R-spikes could confuse the software algorithm that detects each interbeat interval (IBI), resulting in missed beats and lengthened IBIs. The clinician should reposition the active sensors with respect to the heart's axis to correct R-spike orientation.
Acknowledgment
This unit draws heavily on graphics published in Didier Combatalade's Basics of Heart Rate Variability Applied to Psychophysiology, published by Thought Technology Ltd. Didier is the Director of Clinical Interface at Thought Technology Ltd and is a gifted educator and writer, and generous colleague.

Glossary
active electrodes: negative and positive ECG electrodes that may be placed on the right upper chest and below the sternum, above the palmar surface of the right and left wrists, or above the palmar surface of the right wrist and the left knee.
artifact: measurement errors in calculating the interbeat interval.
DC offset artifact: an ECG artifact that lengthens the IBI when differences in skin-electrode impedance produce signal drift causing the software to miss beats.
electromagnetic interference (EMI) artifact: an ECG artifact generated when cell phones transmit an artifactual voltage.
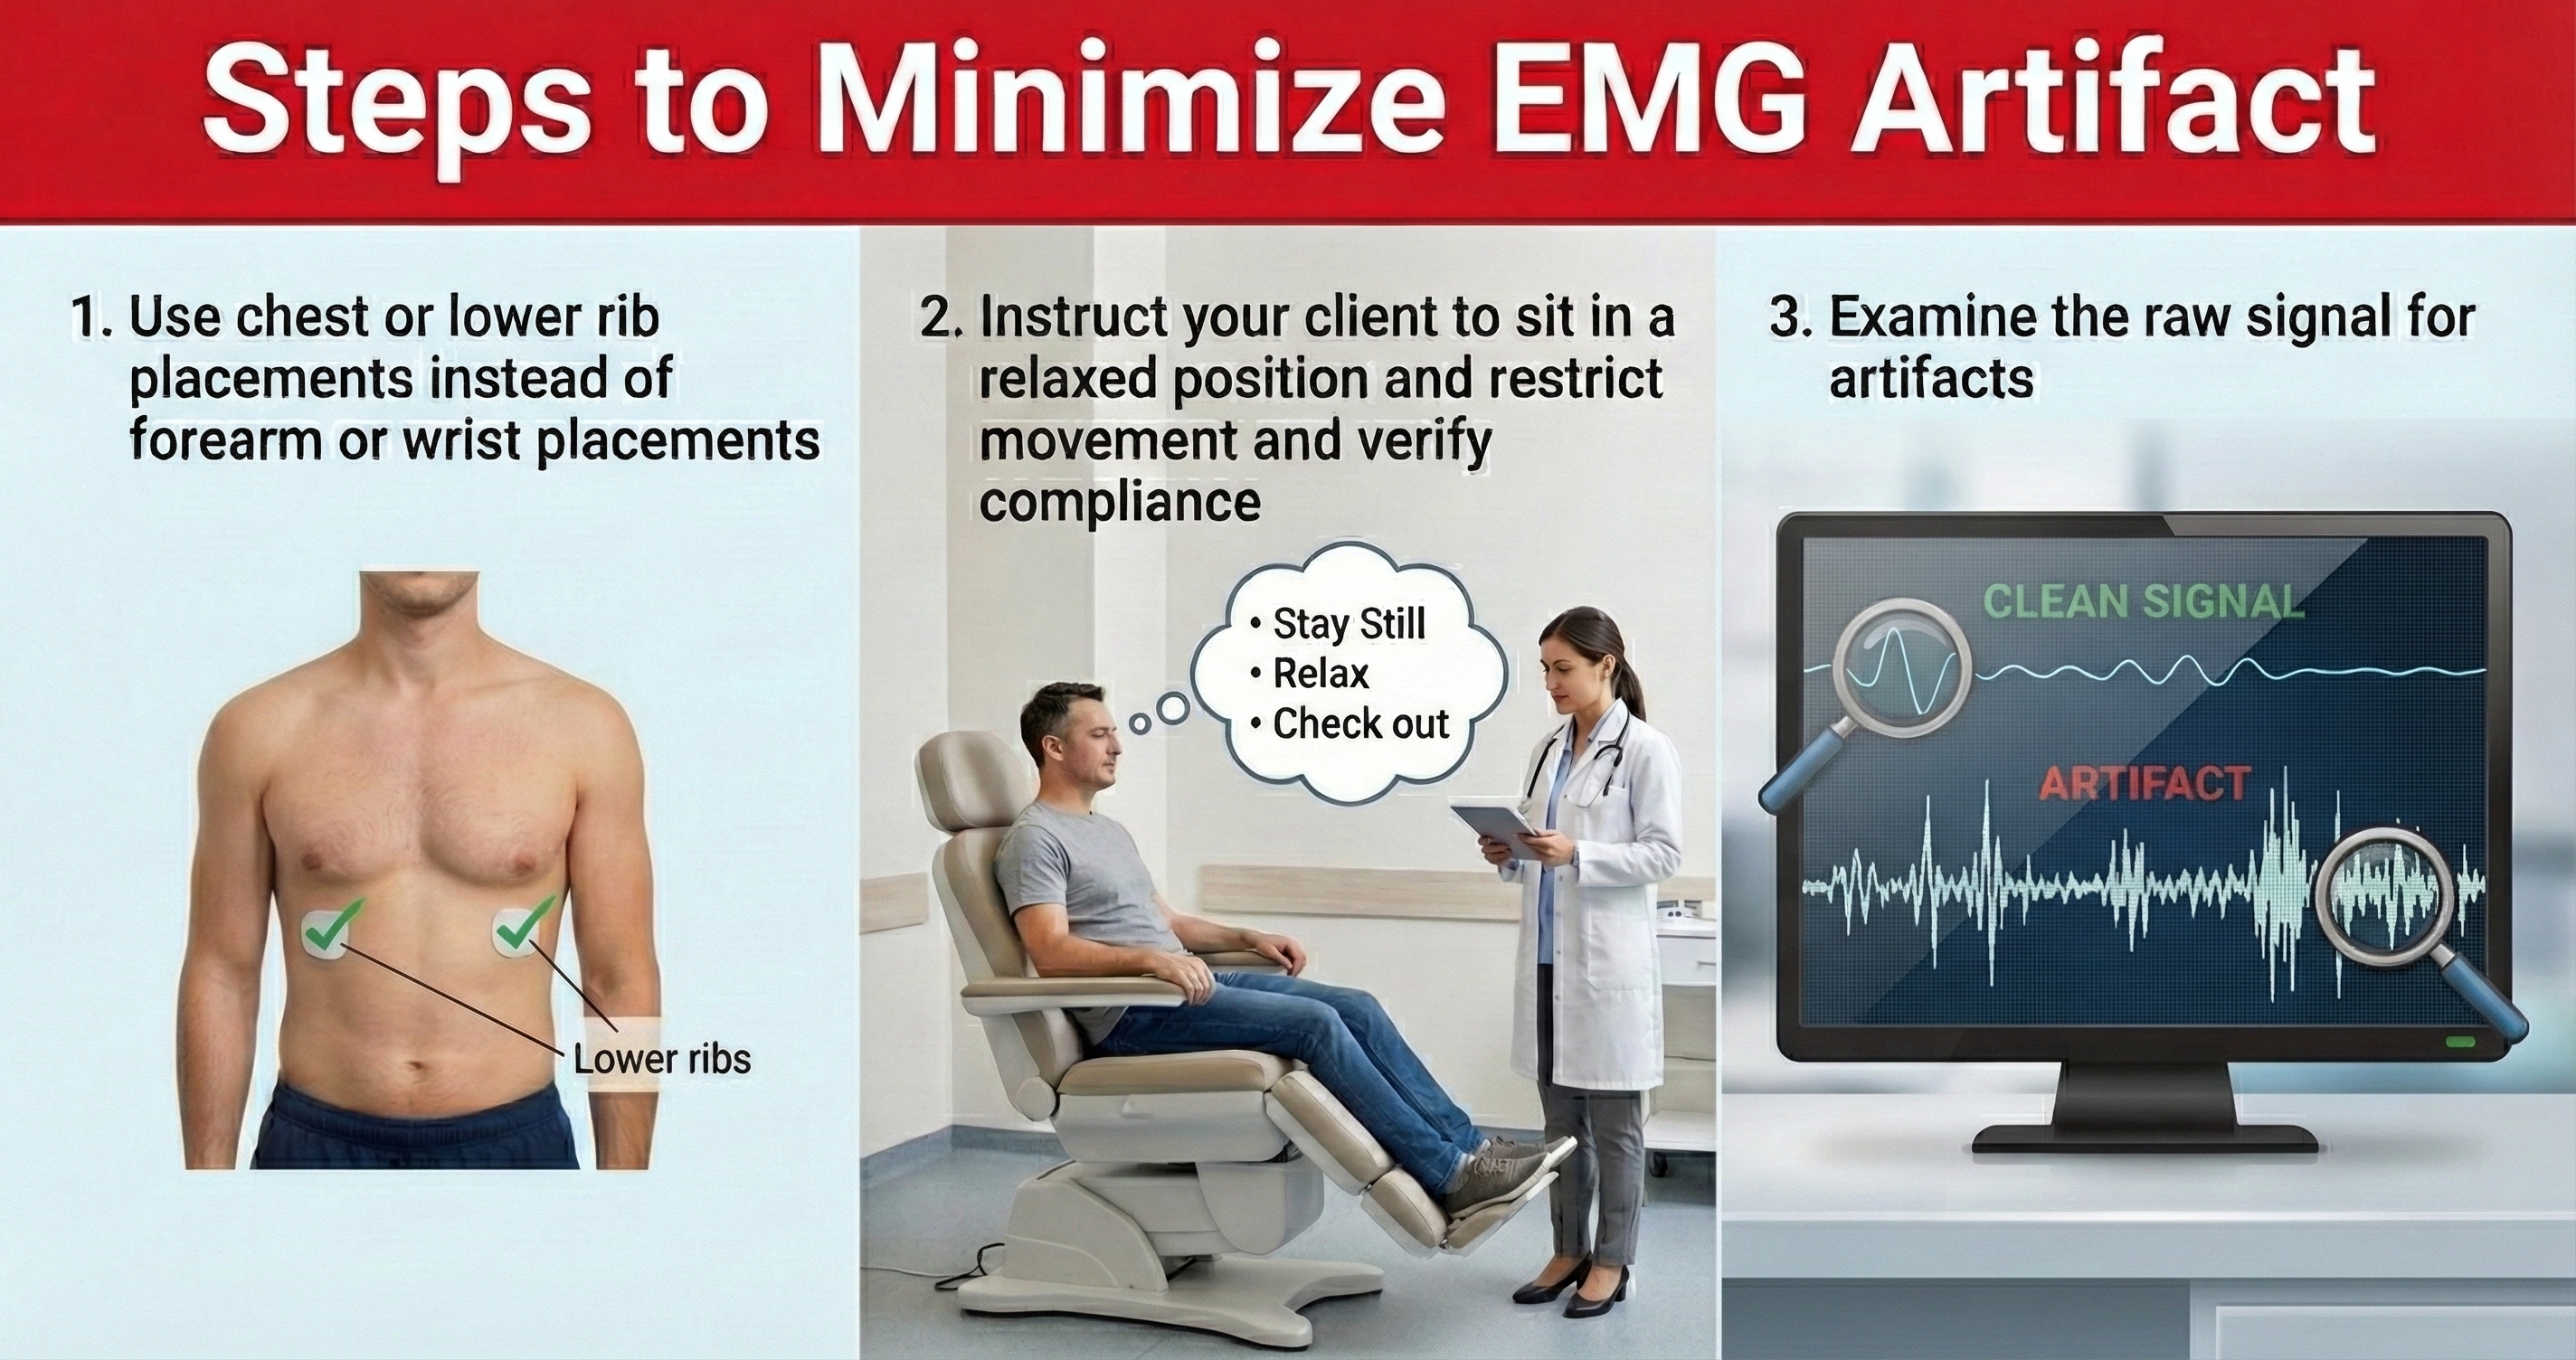
EMG artifact: an ECG artifact that shortens the IBI when signal contamination by the EMG causes the software to detect nonexistent beats.
epoch: a data collection period during which IBI measurements are recorded and analyzed.
extra beats: an ECG artifact that shortens the IBI when signal distortion causes the software to detect nonexistent beats.
heart rate: the number of heartbeats per minute, also called stroke rate.
heart rate variability (HRV): the beat-to-beat changes in heart rate, including changes in the RR intervals between consecutive heartbeats.
HR Max – HR Min: an index of heart rate variability that calculates the difference between the highest and lowest heart rates during each respiratory cycle.
impedance: opposition to alternating current (AC) flow, reduced by proper skin preparation before electrode application.
interbeat interval (IBI): the time interval between the peaks of successive R-spikes (initial upward deflections in the QRS complex). The IBI is also called the NN (normal-to-normal) interval.
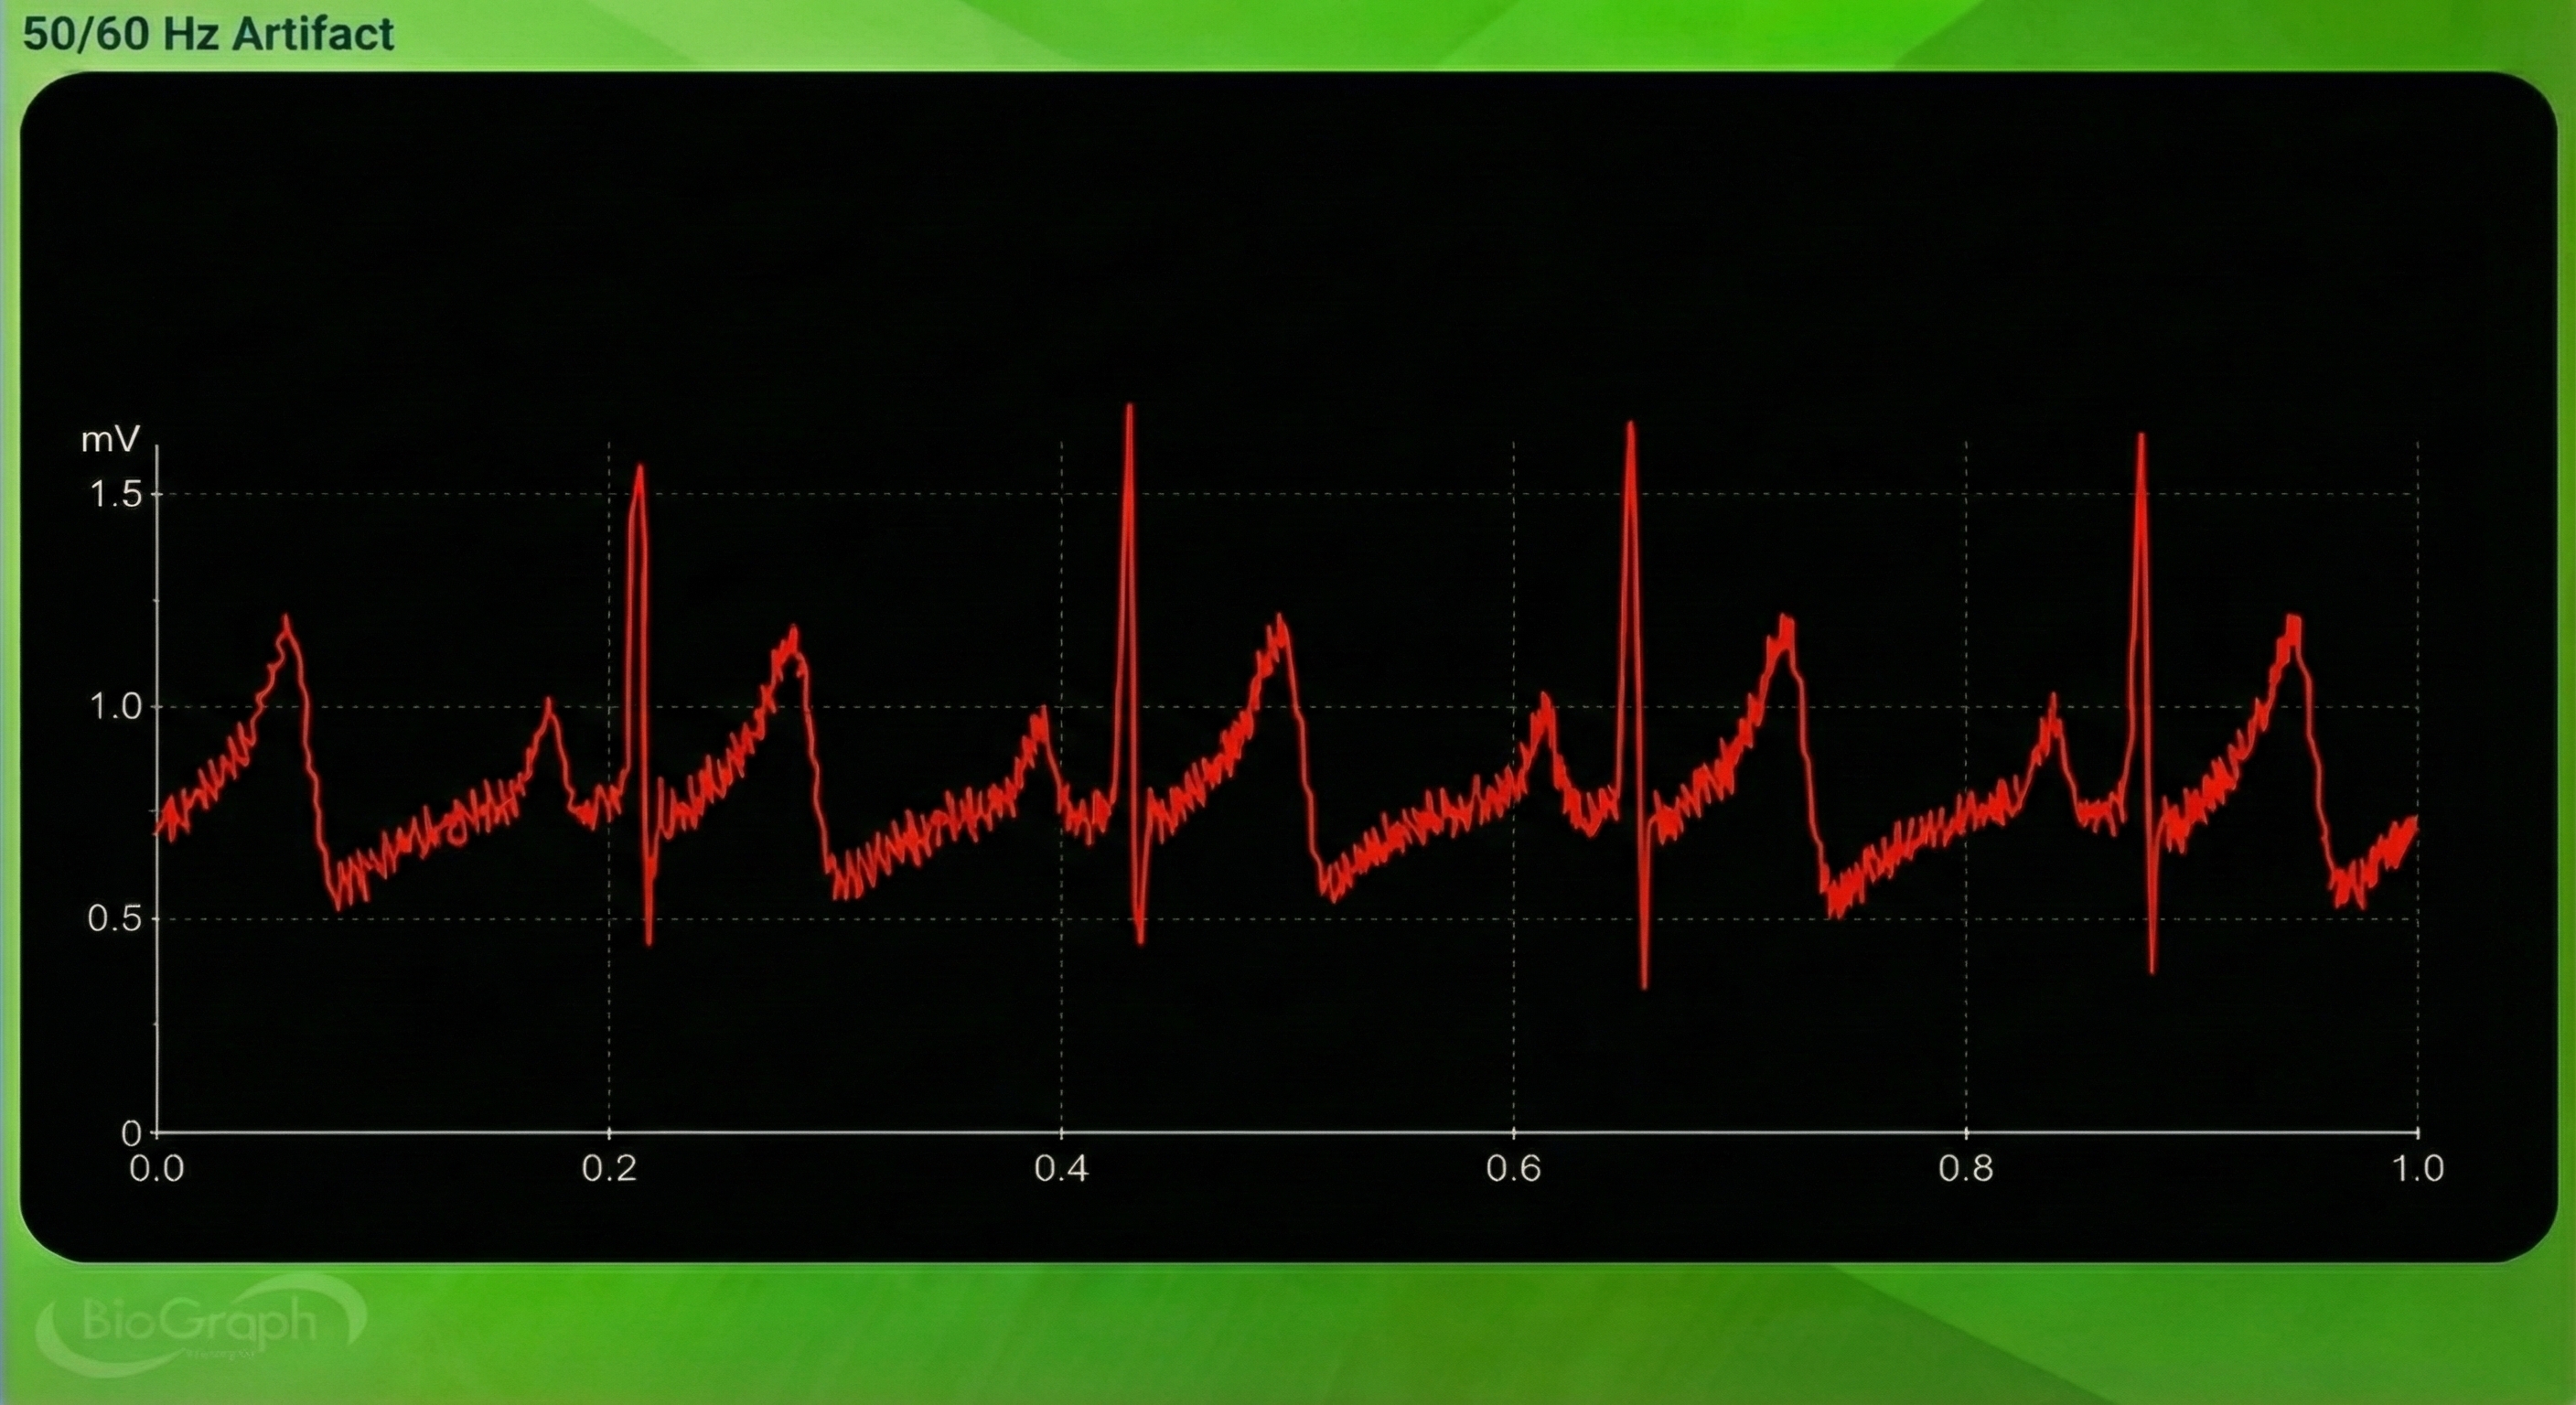
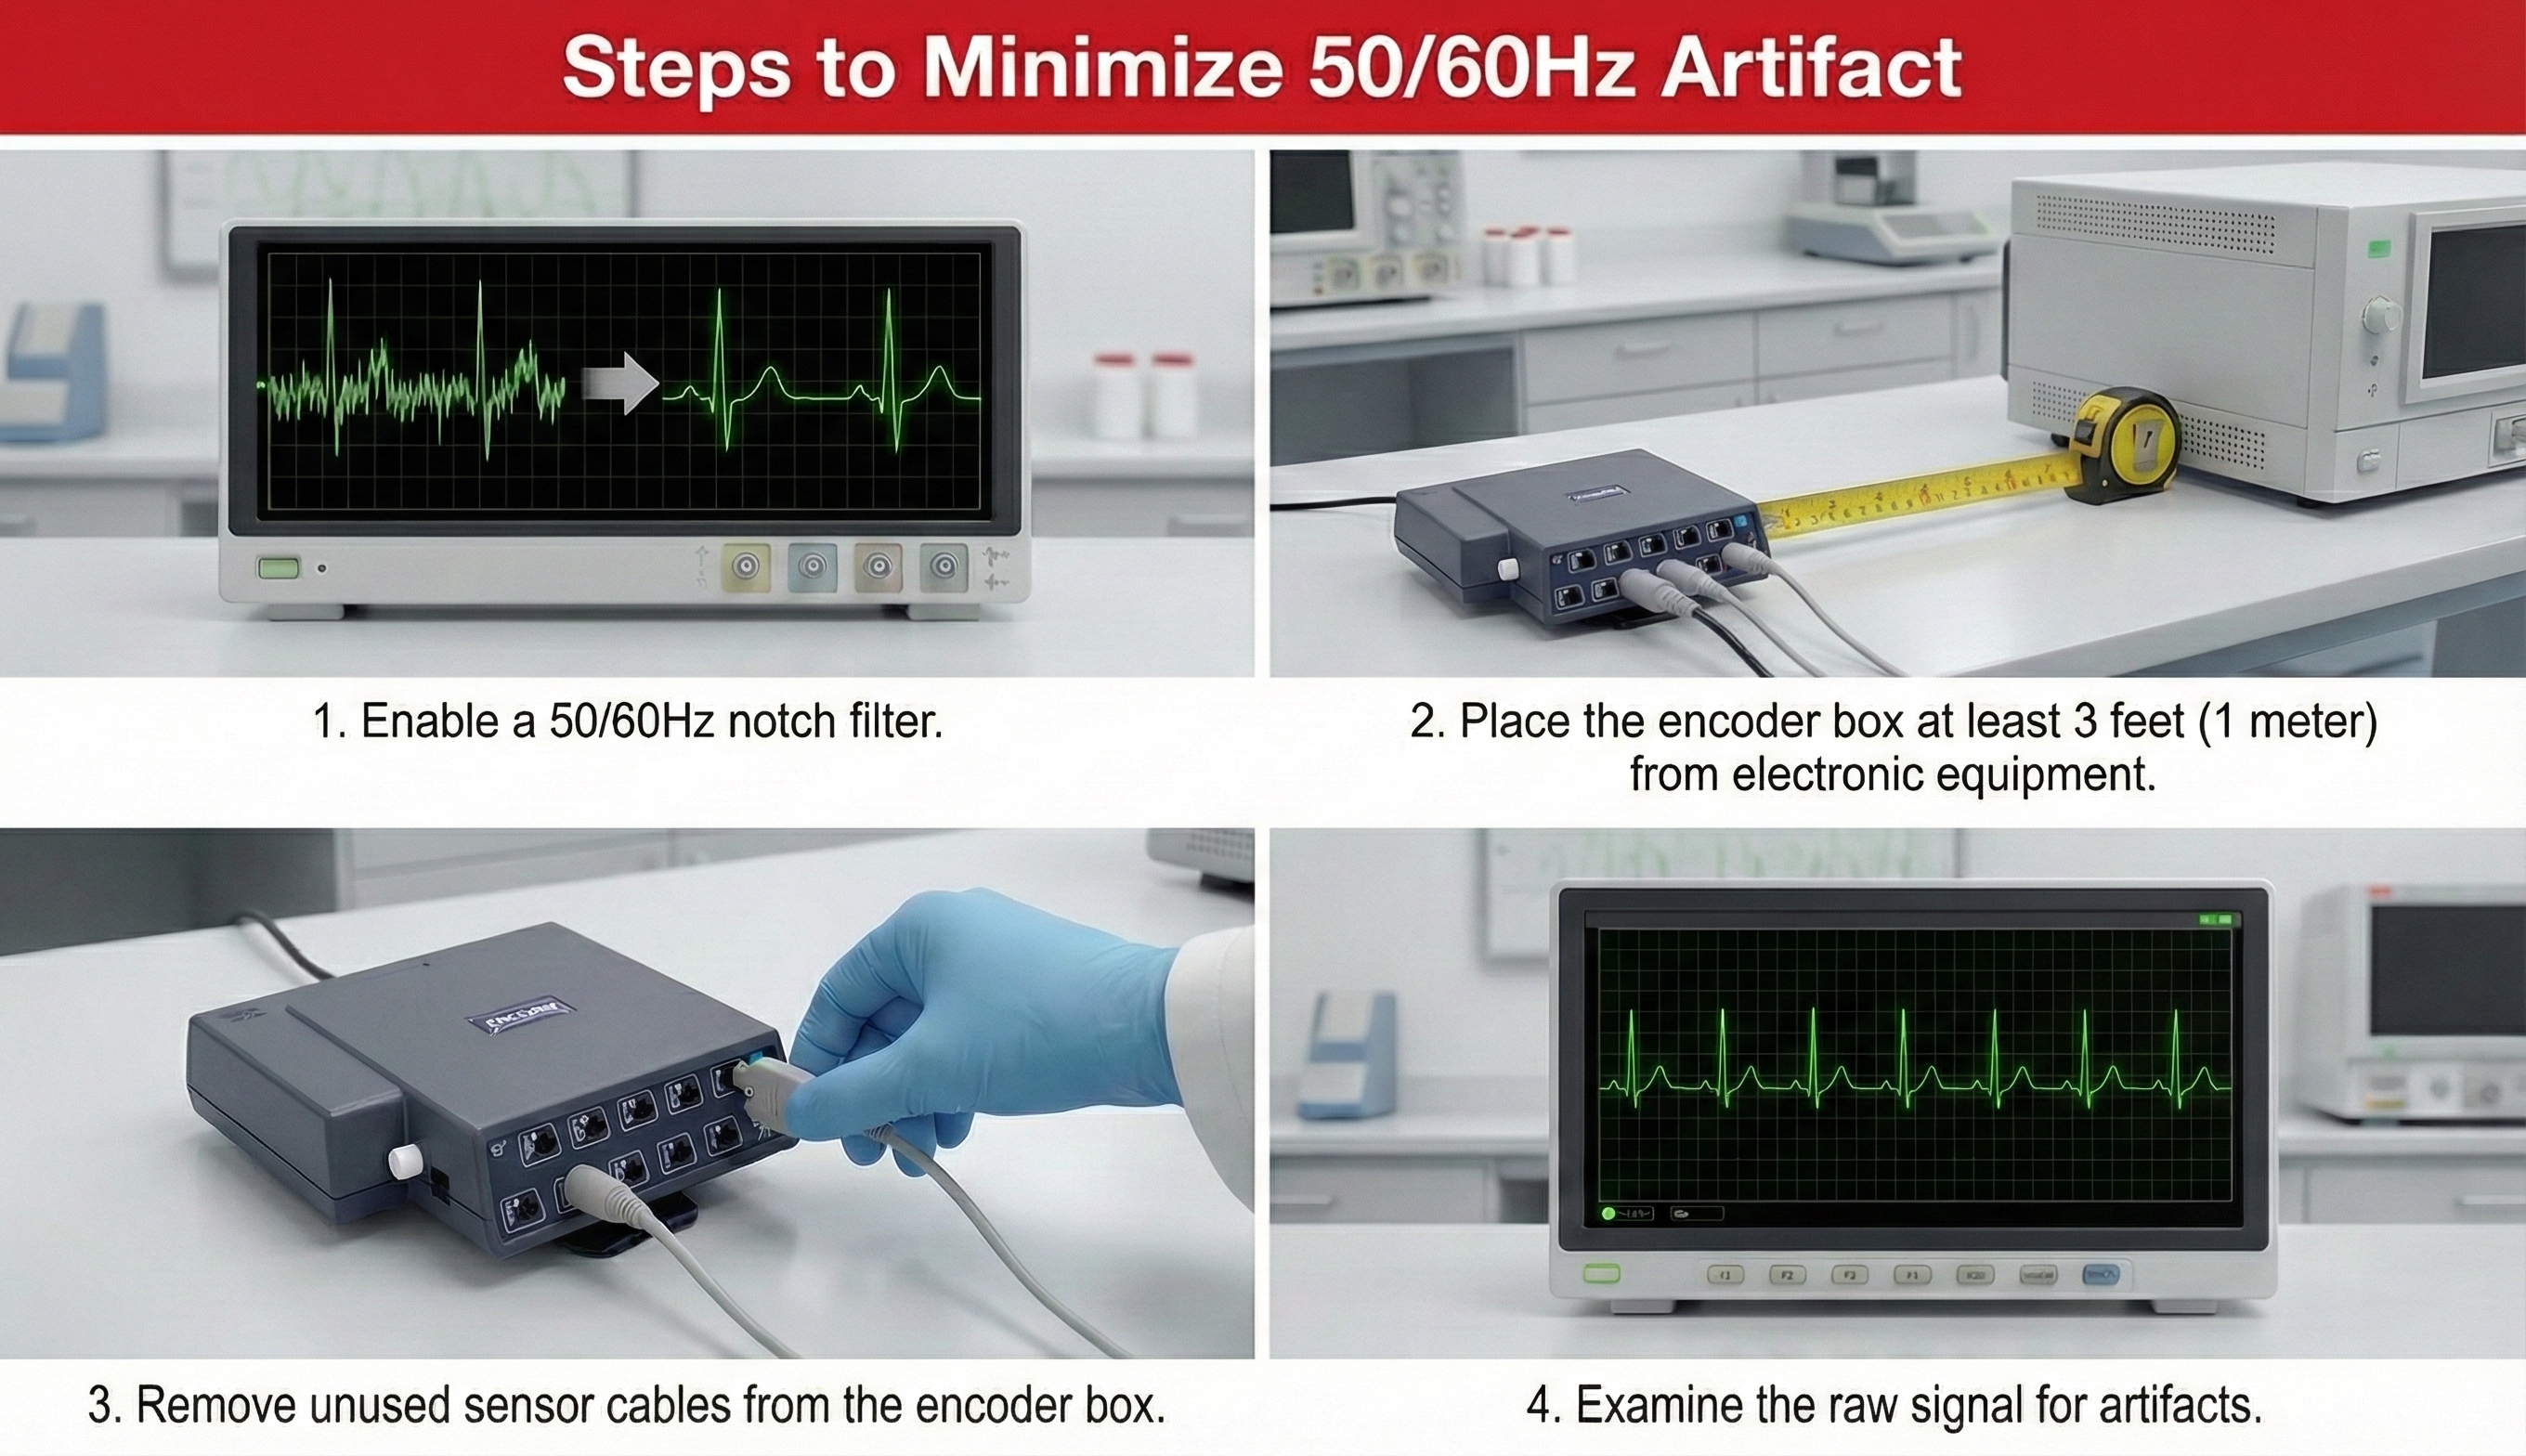
line interference artifact: ECG and PPG artifact when 50/60Hz contamination of signals causes the software to detect nonexistent beats and shorten the IBI.
missed beats: ECG artifact that lengthens the IBI when signal distortion causes the software to overlook a beat and use the next good beat.
movement artifact: ECG and PPG artifact that shortens the IBI when signal distortion from movement causes the software to detect nonexistent beats.
pNN50: the percentage of adjacent NN intervals that differ by more than 50 milliseconds.
polarity artifact: an ECG artifact when reversed electrode placement inverts the direction of the R-spike and causes the software to miss beats and lengthen the IBI.
radiofrequency (RF) artifact: electromagnetic interference generated by computer monitors, television screens, and other electronic equipment that contaminates the ECG signal.
reference electrode: ground ECG electrode that may be placed on the left upper chest, below the palmar aspect of the left elbow, or above the palmar aspect of the left wrist.
resolution: degree of detail in a biofeedback display (0.1 mV) or the number of voltage levels that an A/D converter can discriminate (16 bits or discrimination among 65,536 voltage levels).
respiratory sinus arrhythmia (RSA): respiration-driven heart rhythm that contributes to the high frequency (HF) component of heart rate variability. Inhalation inhibits vagal nerve slowing of the heart (increasing heart rate), while exhalation restores vagal slowing (decreasing heart rate).
RMSSD: the square root of the mean squared difference of adjacent NN intervals.
SDANN: the standard deviation of the average 5-minute NN intervals that estimates heart rate changes produced by cycles longer than 5 minutes.
SDNN: the standard deviation of the interbeat interval measured in milliseconds, which predicts morbidity and mortality.
SDRR: the standard deviation of the interbeat interval for all sinus beats measured in milliseconds, which predicts morbidity and mortality.
tracking test: checks of whether the biofeedback display mirrors client behavior. Instantaneous heart rate detected by ECG sensors should speed and slow as the client inhales and exhales.
References
Andreassi, J. L. (2000). Psychophysiology: Human behavior and physiological response. Lawrence Erlbaum and Associates, Inc.
Berntson, G. G., Quigley, K. S., & Lozano, D. (2007). Cardiovascular psychophysiology. In J. T. Cacioppo, L. G. Tassinary, & G. G. Berntson (Eds.), Handbook of psychophysiology (3rd ed.). Cambridge University Press.
Combatalade, D. (2010). Basics of heart rate variability applied to psychophysiology. Thought Technology Ltd.
Combatalade, D. (2013). CardioPro Infiniti: HRV analysis module for BioGraph Infiniti. Thought Technology Ltd.
Elgendi, M. (2012). On the analysis of fingertip photoplethysmogram signals. Current Cardiology Reviews, 8(1), 14-25. https://doi.org/10.2174/157340312801215782
Gevirtz, R. N. (2011). Cardio-respiratory psychophysiology: Gateway to mind-body medicine. BFE conference workshop.
Laborde, S., Mosley, E., & Thayer, J. F. (2017). Heart rate variability and cardiac vagal tone in psychophysiological research: Recommendations for experiment planning, data analysis, and data reporting. Frontiers in Psychology, 8, 213. https://doi.org/10.3389/fpsyg.2017.00213
Langner, P. H., & Geselowitz, D. B. (1960). Characteristics of the frequency spectrum in the normal electrocardiogram and in subjects following myocardial infarction. Circulation Research, 8(3), 577-584.
Lehrer, P. M. (2007). Biofeedback training to increase heart rate variability. In P. M. Lehrer, R. M. Woolfolk, & W. E. Sime (Eds.), Principles and practice of stress management (3rd ed.). The Guilford Press.
Lehrer, P. M. (2012). Personal communication.
Lehrer, P. M. (2018b). Heart rate variability biofeedback and other psychophysiological procedures as important elements in psychotherapy. International Journal of Psychophysiology, 131, 89-95.
Lehrer, P. M., Vaschillo, E., & Vaschillo, B. (2000). Resonant frequency biofeedback training to increase cardiac variability: Rationale and manual for training. Applied Psychophysiology and Biofeedback, 25(3), 177-191. https://doi.org/10.1023/a:1009554825745
Montgomery, D. (2004). Introduction to biofeedback. In D. Moss, A. McGrady, T. C. Davies, & I. Wickramasekera (Eds.), Handbook of mind-body medicine for primary care. Sage Publications.
Moss, D. (2004). Heart rate variability (HRV) biofeedback. Psychophysiology Today, 1, 4-11.
Nederend, I., Jongbloed, M. R. M., de Geus, E. J. C., Blom, N. A., & ten Harkel, A. D. J. (2016). Postnatal cardiac autonomic nervous control in pediatric congenital heart disease. Journal of Cardiovascular Development and Disease, 3(2), 16. https://doi.org/10.3390/jcdd3020016
Nunan, D., Sandercock, G. R. H., & Brodie, D. A. (2010). A quantitative systematic review of normal values for short-term heart rate variability in healthy adults. Pacing and Clinical Electrophysiology, 33(11), 1407-1417. https://doi.org/10.1111/j.1540-8159.2010.02841.x
Peper, E. (2010). Personal communication.
Peper, E., & Lin, I.-M. (2010). The effect of cell phone usage on heart rate variability and attention. Proceedings of the 41st Annual Meeting of the Association for Applied Psychophysiology and Biofeedback.
Shaffer, F., & Combatalade, D. C. (2013). Don't add or miss a beat: A guide to cleaner heart rate variability recordings. Biofeedback, 41(3), 121-130. https://doi.org/10.5298/1081-5937-41.3.04
Shaffer, F., & Neblett, R. (2010). Practical anatomy and physiology: The skeletal muscle system. Biofeedback, 38(2), 47-51. https://doi.org/10.5298/1081-5937-38.2.47
Stern, R. M., Ray, W. J., & Quigley, K. S. (2001). Psychophysiological recording (2nd ed.). Oxford University Press.
Task Force of the European Society of Cardiology and the North American Society of Pacing and Electrophysiology (1996). Heart rate variability: Standards of measurement, physiological interpretation, and clinical use. Circulation, 93, 1043-1065. PMID: 8598068
Tortora, G. J., & Derrickson, B. H. (2021). Principles of anatomy and physiology (16th ed.). John Wiley & Sons, Inc.
Return to Top