
Heart Rate Variability Assessment
What You Will Learn
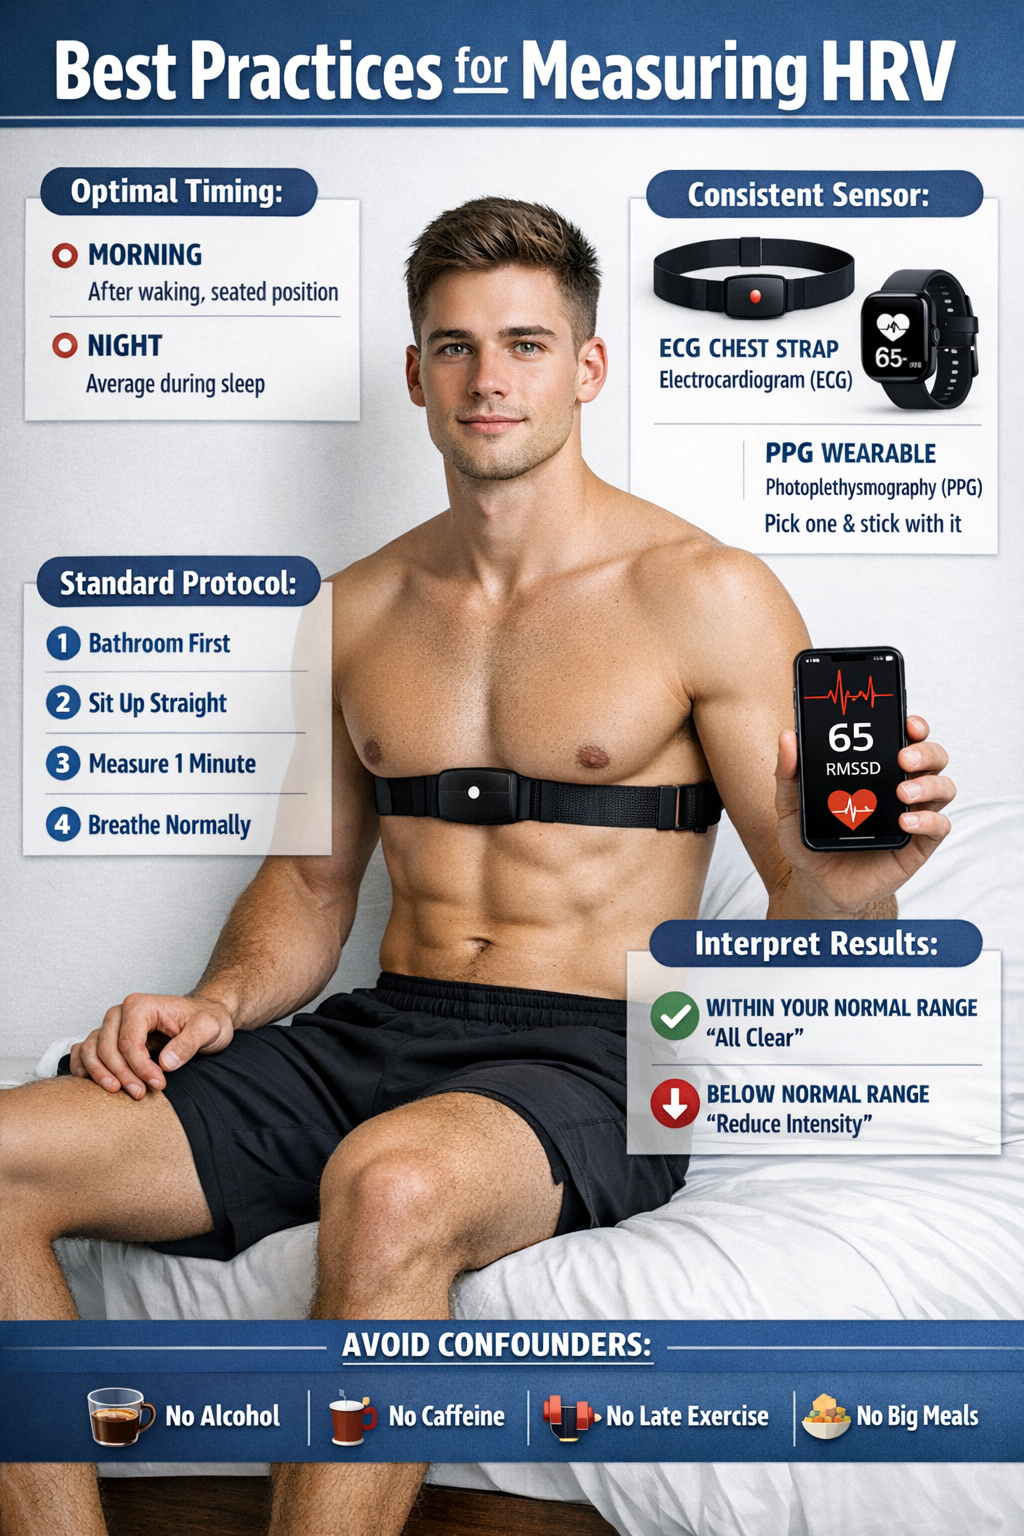
How do you know whether your client's HRV values are healthy, concerning, or exceptional? This chapter gives you the tools to make that determination with confidence. You will learn to measure the interbeat interval (IBI) using both electrocardiography (ECG) and photoplethysmography (PPG), understand when brief recordings are sufficient and when 24-hour monitoring is essential, and interpret time-domain and frequency-domain metrics by comparing them to age- and sex-related norms.
Whether you are conducting an initial assessment, tracking progress across sessions, or evaluating training outcomes, this chapter will help you ask the right questions, choose the right measurement strategies, and draw valid conclusions from the data your clients generate.
Measuring the Interbeat Interval
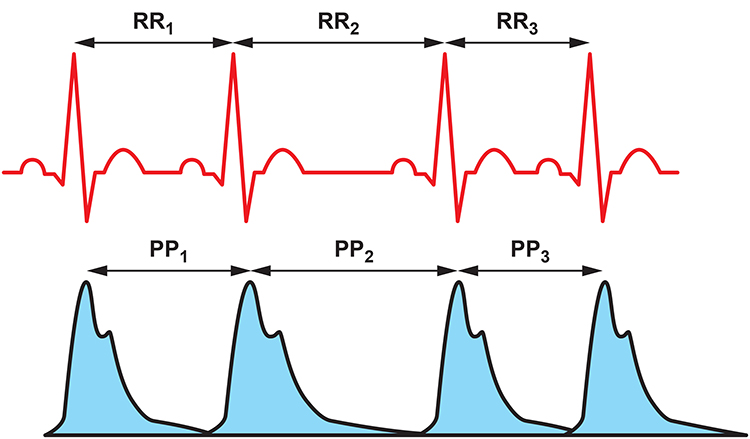
This section introduces the two primary methods for measuring the time between heartbeats and explains when each is appropriate. Clinicians can measure the interbeat interval (IBI), which is the time between successive heartbeats, using two sensor technologies. Electrocardiography (ECG) detects the electrical signal generated by the heart and identifies the R-spike in the QRS complex. Photoplethysmography (PPG) uses a light sensor placed on the earlobe or finger to detect the peak of the blood volume pulse (BVP) signal, which represents the mechanical arrival of the pulse wave as it travels through the arterial tree.
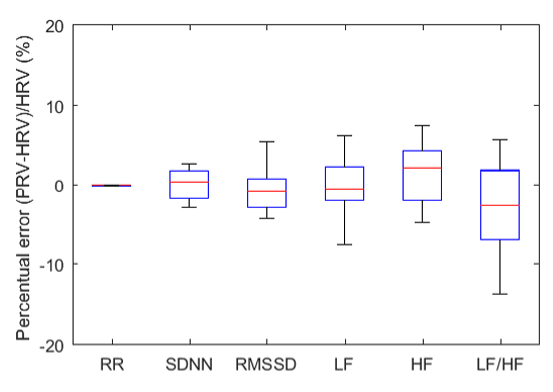
The ECG method calculates heart rate variability (HRV), while the PPG approach produces a related but distinct metric called pulse rate variability (PRV). Clinicians and consumers commonly use PRV to estimate HRV parameters like RMSSD, particularly with wearable devices. Under resting conditions, short-term ECG and PPG measurements are highly correlated. This means that for a quiet baseline assessment in your office, either method can provide useful data.
However, that strong correspondence breaks down in several clinically relevant situations. When clients engage in paced breathing or stand up, HRV and PRV metrics begin to diverge. The same dissociation occurs during movement or in response to stressors, because sympathetic nervous system (SNS) activation stiffens blood vessel walls and reduces pulse transit time, which is the interval required for the blood pressure wave to travel through the arteries. For practitioners conducting resonance frequency assessments or stress profiles that involve active challenges, ECG provides more accurate HRV data than PPG.
Choosing the Right Recording Duration
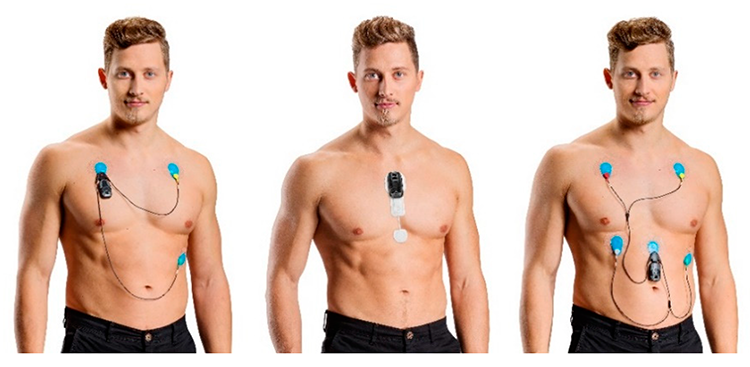
The duration of your recording directly affects the validity of your HRV data. Although 24-hour recordings remain the gold standard for health risk stratification, growing evidence shows that brief measurements (e.g., 5-minute) can also predict mortality (Bigger et al., 1993). The Bittium Faros™ 360 ambulatory ECG is one example of a device designed for extended monitoring.
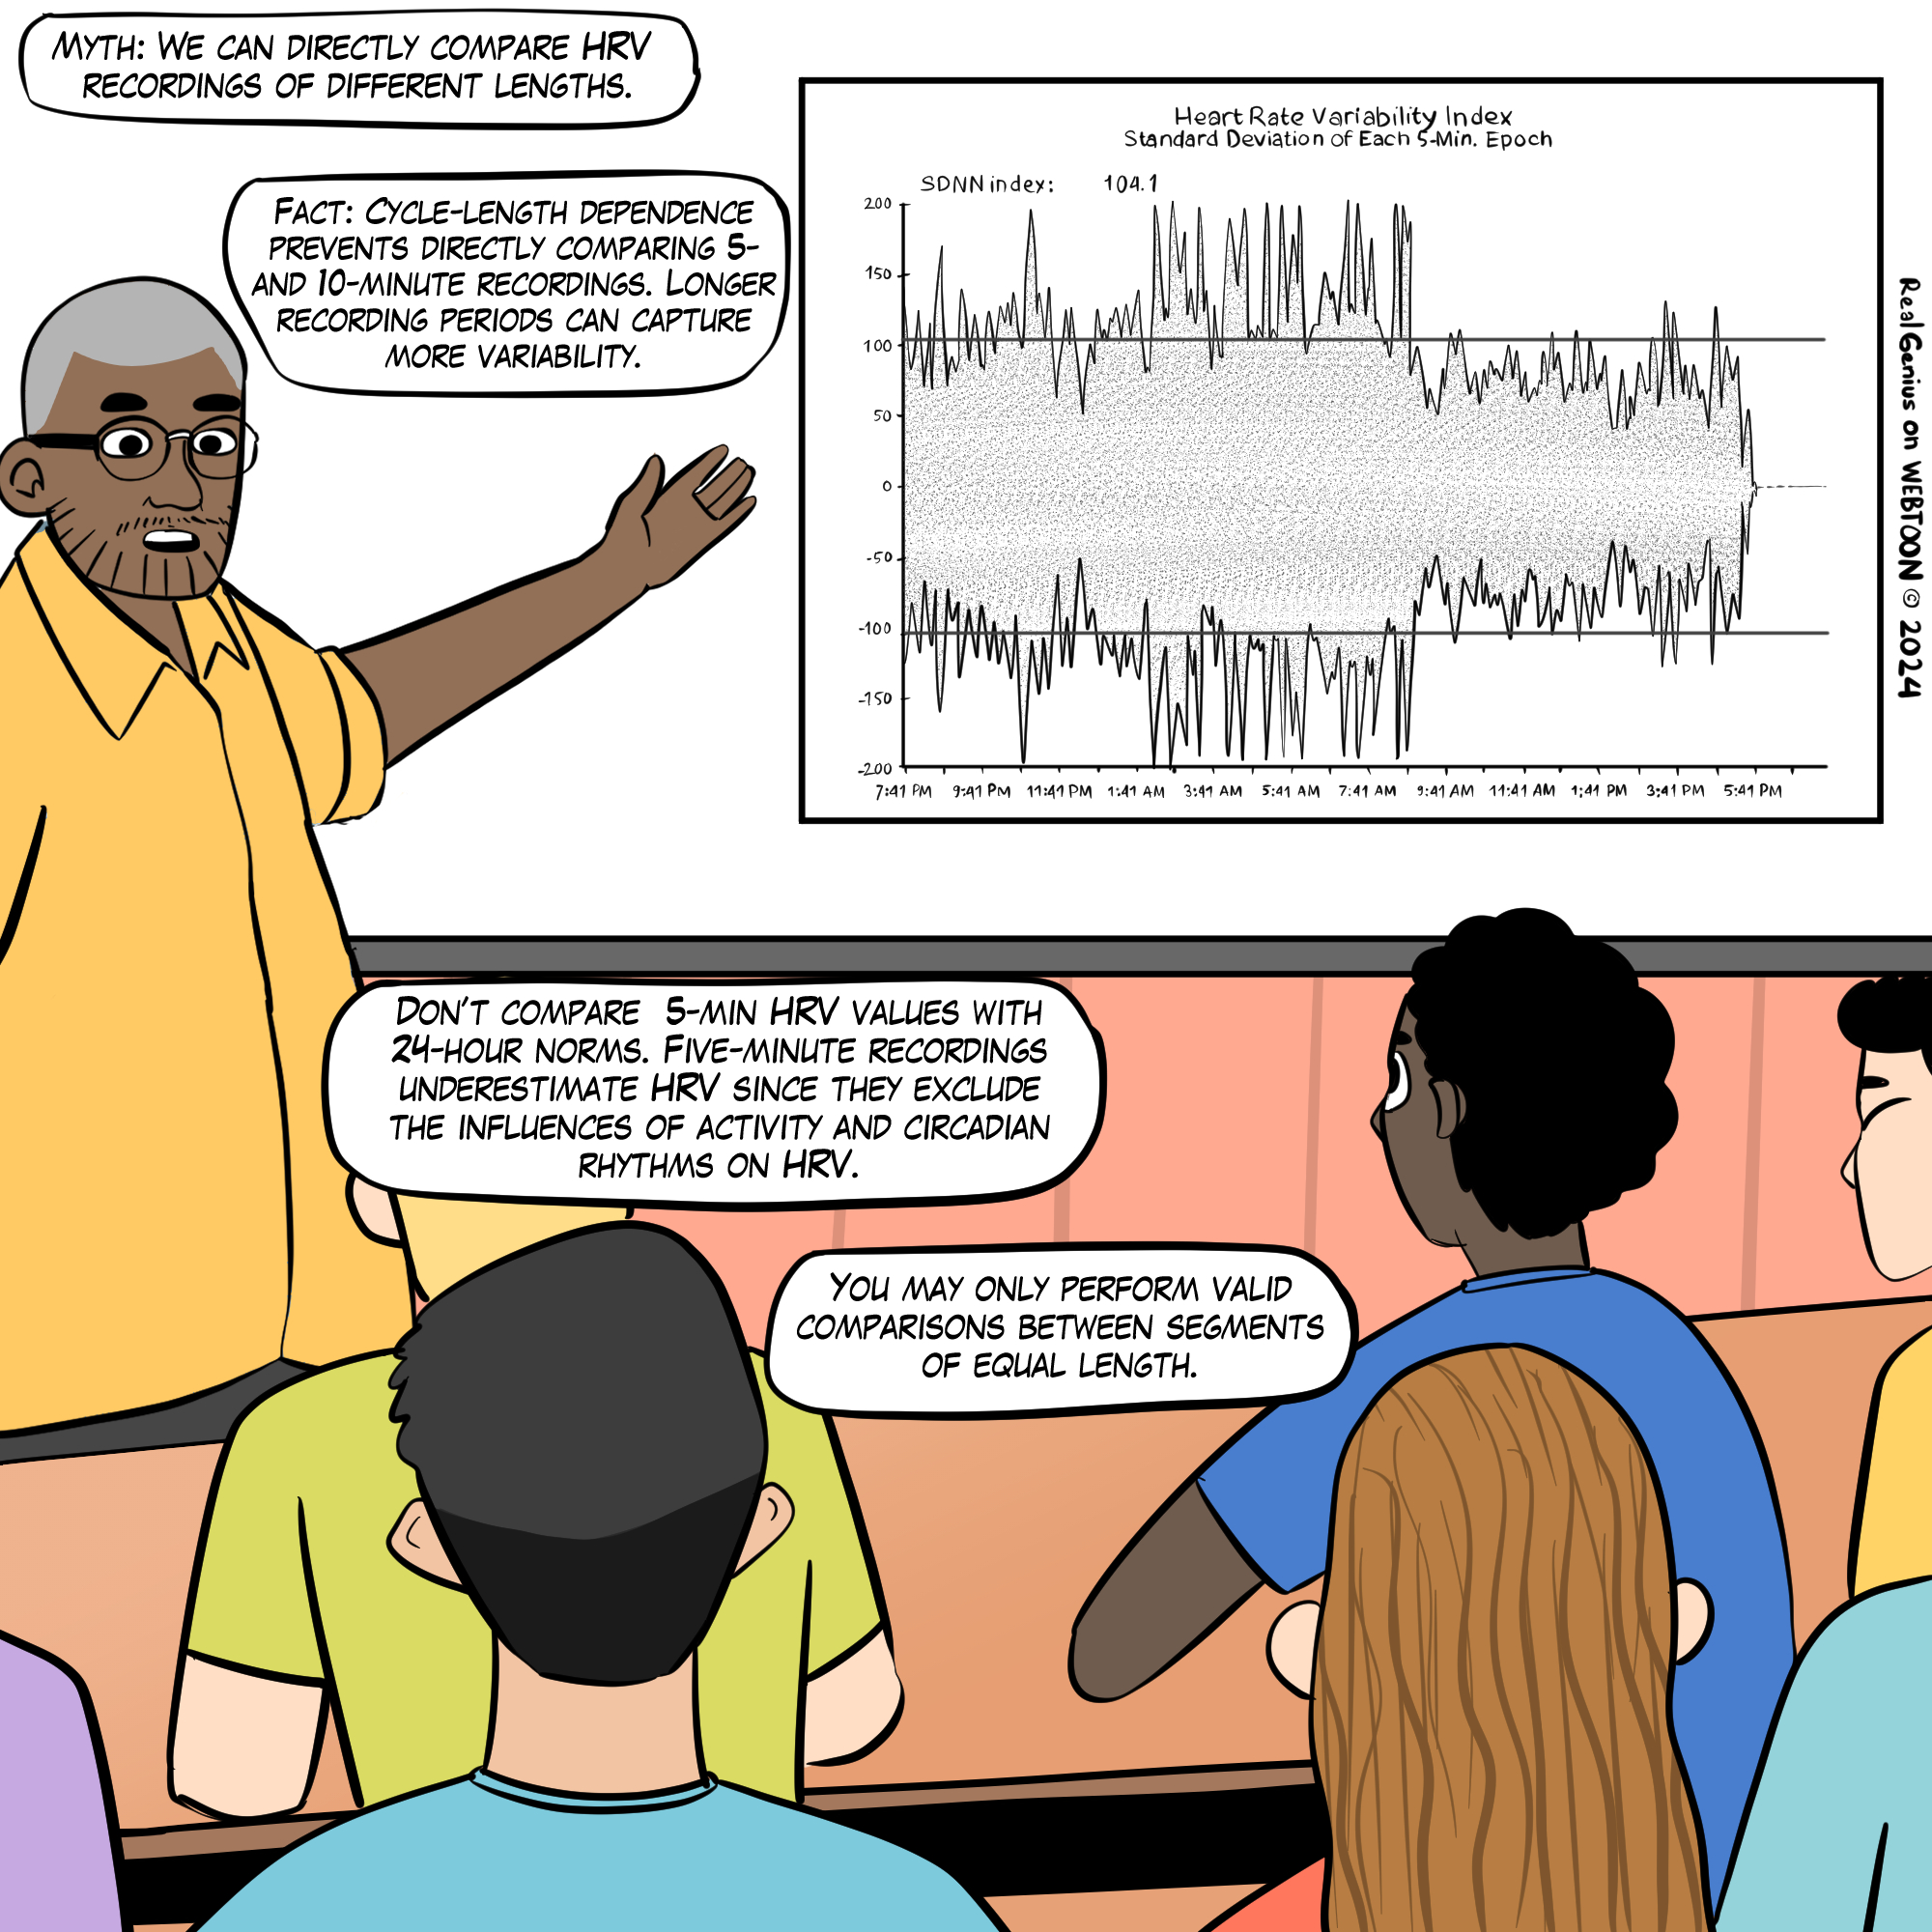
Regardless of duration, clinicians must consider context and client characteristics when interpreting HRV time- and frequency-domain measurements. Both sets of metrics must be referenced to age- and sex-related norms for the specific monitoring period used. A 5-minute SDNN value, for example, cannot be compared directly to 24-hour SDNN norms because the two capture fundamentally different windows of autonomic activity.
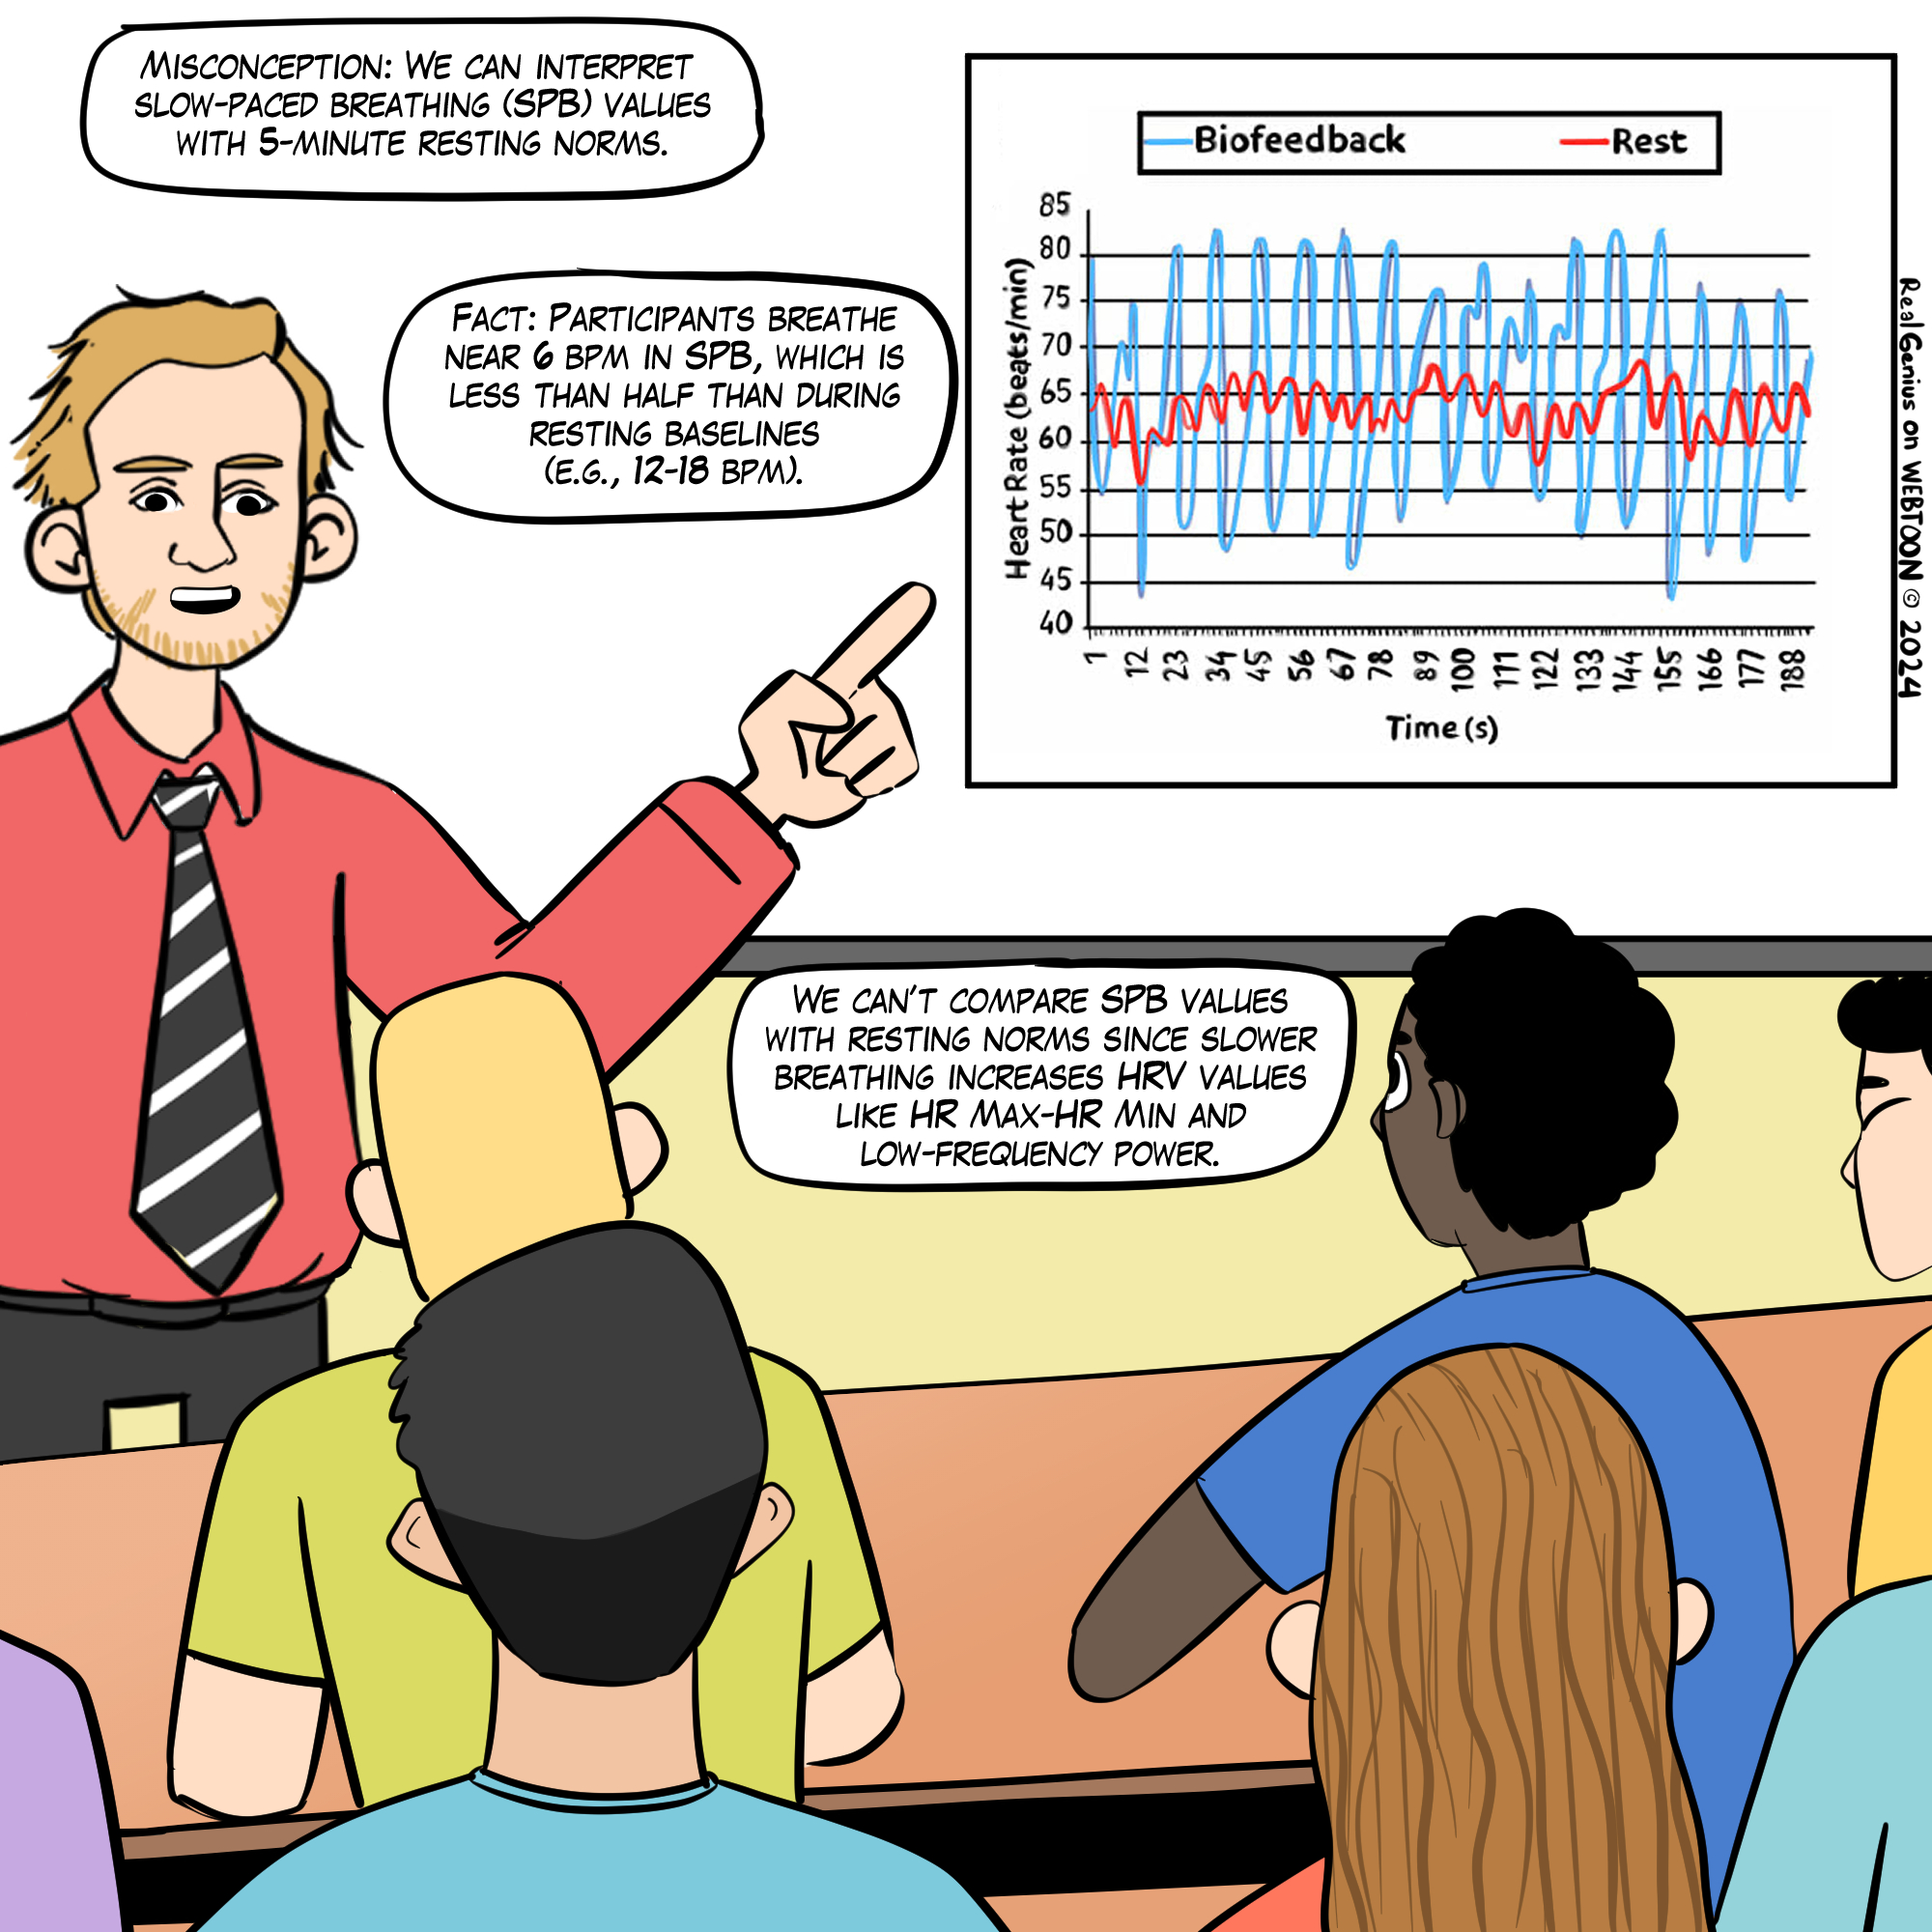
We cannot compare HRV time-domain values (e.g., RMSSD and SDNN) obtained during slow-paced breathing to resting norms. Moreover, very-low-frequency and high-frequency measurements are meaningless during slow-paced breathing.
This Real Genius episode was drawn by Dani S@unclebelang.
BCIA Blueprint Coverage
This unit addresses IV. HRV Measurements: C. Brief versus 24-hour monitoring and D. How to interpret HRV Measurements.
Professionals completing this unit will be able to discuss the advantages of 24-hour monitoring over brief measurement epochs, how to interpret HRV brief and 24-hour measurements, and HRVB training goals.
This unit covers Brief Versus 24-Hour Monitoring, The Validity of Ultra-Short-Term Measurements, 24-Hour Monitoring Captures Slower Rhythms, How To Interpret HRV Measurements, HRV Time-Domain, and Frequency-Domain Norms.
🎧 Listen to the Full Chapter Lecture
Brief Versus 24-Hour Monitoring
This section examines why recording duration matters and how it affects the two major categories of HRV metrics. Time-domain measures quantify the degree of variability in the interbeat intervals (IBIs) between adjacent heartbeats observed during monitoring periods ranging from 60 seconds to 24 hours (Shaffer, McCraty, & Zerr, 2014). Brief resting measurement periods systematically underestimate time-domain values compared to longer recordings. Nunan et al. (2010) confirmed this pattern, finding that published brief values for healthy adults were consistently lower than the Task Force (1996) norms derived from 24-hour recordings. For the clinician, this means that a client whose 5-minute SDNN looks borderline may actually have healthy 24-hour values that the brief window simply cannot capture.
Frequency-domain measures use power spectral analysis to decompose HRV into its component rhythms, including the ultra-low-frequency (ULF), very-low-frequency (VLF), low-frequency (LF), and high-frequency (HF) bands. Brief monitoring cannot accurately measure ULF power because the biological processes generating it, such as circadian rhythms and metabolic regulation, cycle over periods ranging from 5 minutes to 24 hours. These oscillations are so gradual that clinicians cannot provide real-time ULF biofeedback. Similarly, slow fluctuations contribute to VLF activity, so brief monitoring periods produce VLF values of questionable validity.
In summary, brief recordings provide a useful clinical snapshot but inevitably miss the slower autonomic rhythms that 24-hour monitoring captures. Understanding this tradeoff is essential when deciding how to assess a given client.
The Validity of Ultra-Short-Term Measurements
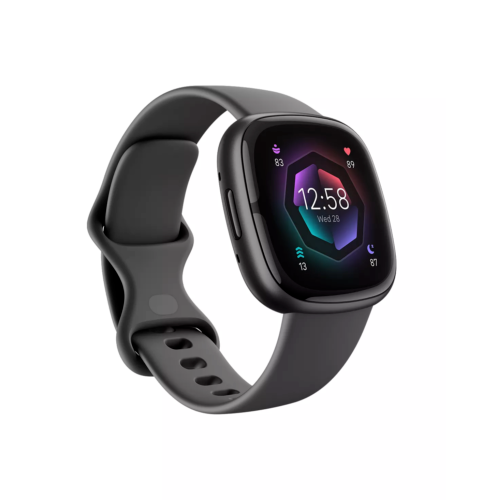
This section reviews the emerging evidence on ultra-short-term (UST) HRV measurements, which are based on less than 5 minutes of data, and explains why clinicians should interpret this literature cautiously. The explosion in ambulatory heart rate monitoring through consumer wearable devices has driven intense interest in whether recordings lasting seconds rather than minutes can yield valid HRV estimates. The Fitbit Sense 2, shown below, is one example of the devices fueling this trend.
Evaluate HRV UST Studies with Caution
The UST literature is still in its infancy, and many published studies contain a critical statistical flaw. UST studies typically compare samples as brief as 10 seconds with conventional 5-minute samples to evaluate their equivalence. However, several have mistakenly assumed that a strong correlation between two measurements proves that they agree. Correlation does not imply equality because it does not control for measurement bias (Bland & Altman, 1986). Eight of eleven studies reviewed by Shaffer, Meehan, and Zerr (2020) failed to address measurement bias, rendering their conclusions questionable.
Best Statistical Practices
To establish whether a UST recording is a valid substitute for a standard 5-minute measurement, researchers must follow a rigorous process. First, they should determine a priori, meaning before data collection, the largest acceptable difference between a UST and 300-second HRV value. Next, they should prepare difference plots such as Bland-Altman plots using a 95% confidence interval and then conduct an equality test (e.g., Student's t-test) to confirm that the UST and 300-second values are statistically identical. Only when a UST measurement passes this quality test can it be considered a valid surrogate, or acceptable substitute for the standard measurement (Shaffer, Meehan, & Zerr, 2020).
Summary of HRV UST Studies
Several research teams have investigated the minimum recording duration needed for reliable HRV estimates. McNames and Aboy (2006) compared 10-second to 10-minute resting ECG recordings with 5-minute recordings using archival data from PhysioNet and found that HF, the standard deviation of successive NN interval differences (SDSD), and RMSSD achieved the strongest correlations. However, as Fleming and DeMets (1996) cautioned, "A correlate does not a surrogate make" (p. 605), since correlation alone does not prove measurement equivalence. Salahuddin et al. (2007) obtained 5 minutes of resting ECG data from 24 healthy students and estimated how long each metric required to approximate 150-second values: mean heart rate and RMSSD needed only 10 seconds, while metrics like HRV Index and TINN required 90 seconds or more.
Nussinovitch et al. (2011) compared 10-second and 1-minute resting ECG recordings with 5-minute recordings from 70 healthy volunteers. While ultra-short-term RMSSD measurements achieved acceptable correlations, SDNN did not. Esco and Flatt (2014) acquired ECG measurements from 23 male collegiate athletes (aged 19 to 21 years) for 10 minutes while supine before a treadmill test and 30 minutes post-exercise. They analyzed the last 5 minutes of each rest period and compared log-transformed 10-, 30-, and 60-second values with 300-second RMSSD values using intra-class correlations (ICCs) and Bland-Altman plots (mean difference ± 1.96 SD). The 60-second epoch yielded the largest ICC and most stringent limits of agreement, and a Bland-Altman plot confirmed its criterion validity as a potential surrogate for 300-second RMSSD.
Baek et al. (2015) recorded 5 minutes of resting PPG data from 467 healthy volunteers and found that different metrics required different minimum durations: heart rate needed 10 seconds, RMSSD needed 30 seconds, and SDNN required 240 seconds. However, these minimum periods varied by age group, and although the authors illustrated their results with Bland-Altman plots, they did not use the plots to draw formal conclusions. Munoz et al. (2015) obtained beat-to-beat middle finger pressure recordings from 3,387 participants using a Portapres® device, analyzing the last 4 to 5 minutes that exhibited a stationarity pattern. They compared ICC, Pearson r values, and Bland-Altman plots across three UST periods and concluded that a minimum of 10 seconds was required for RMSSD and 30 seconds for SDNN.
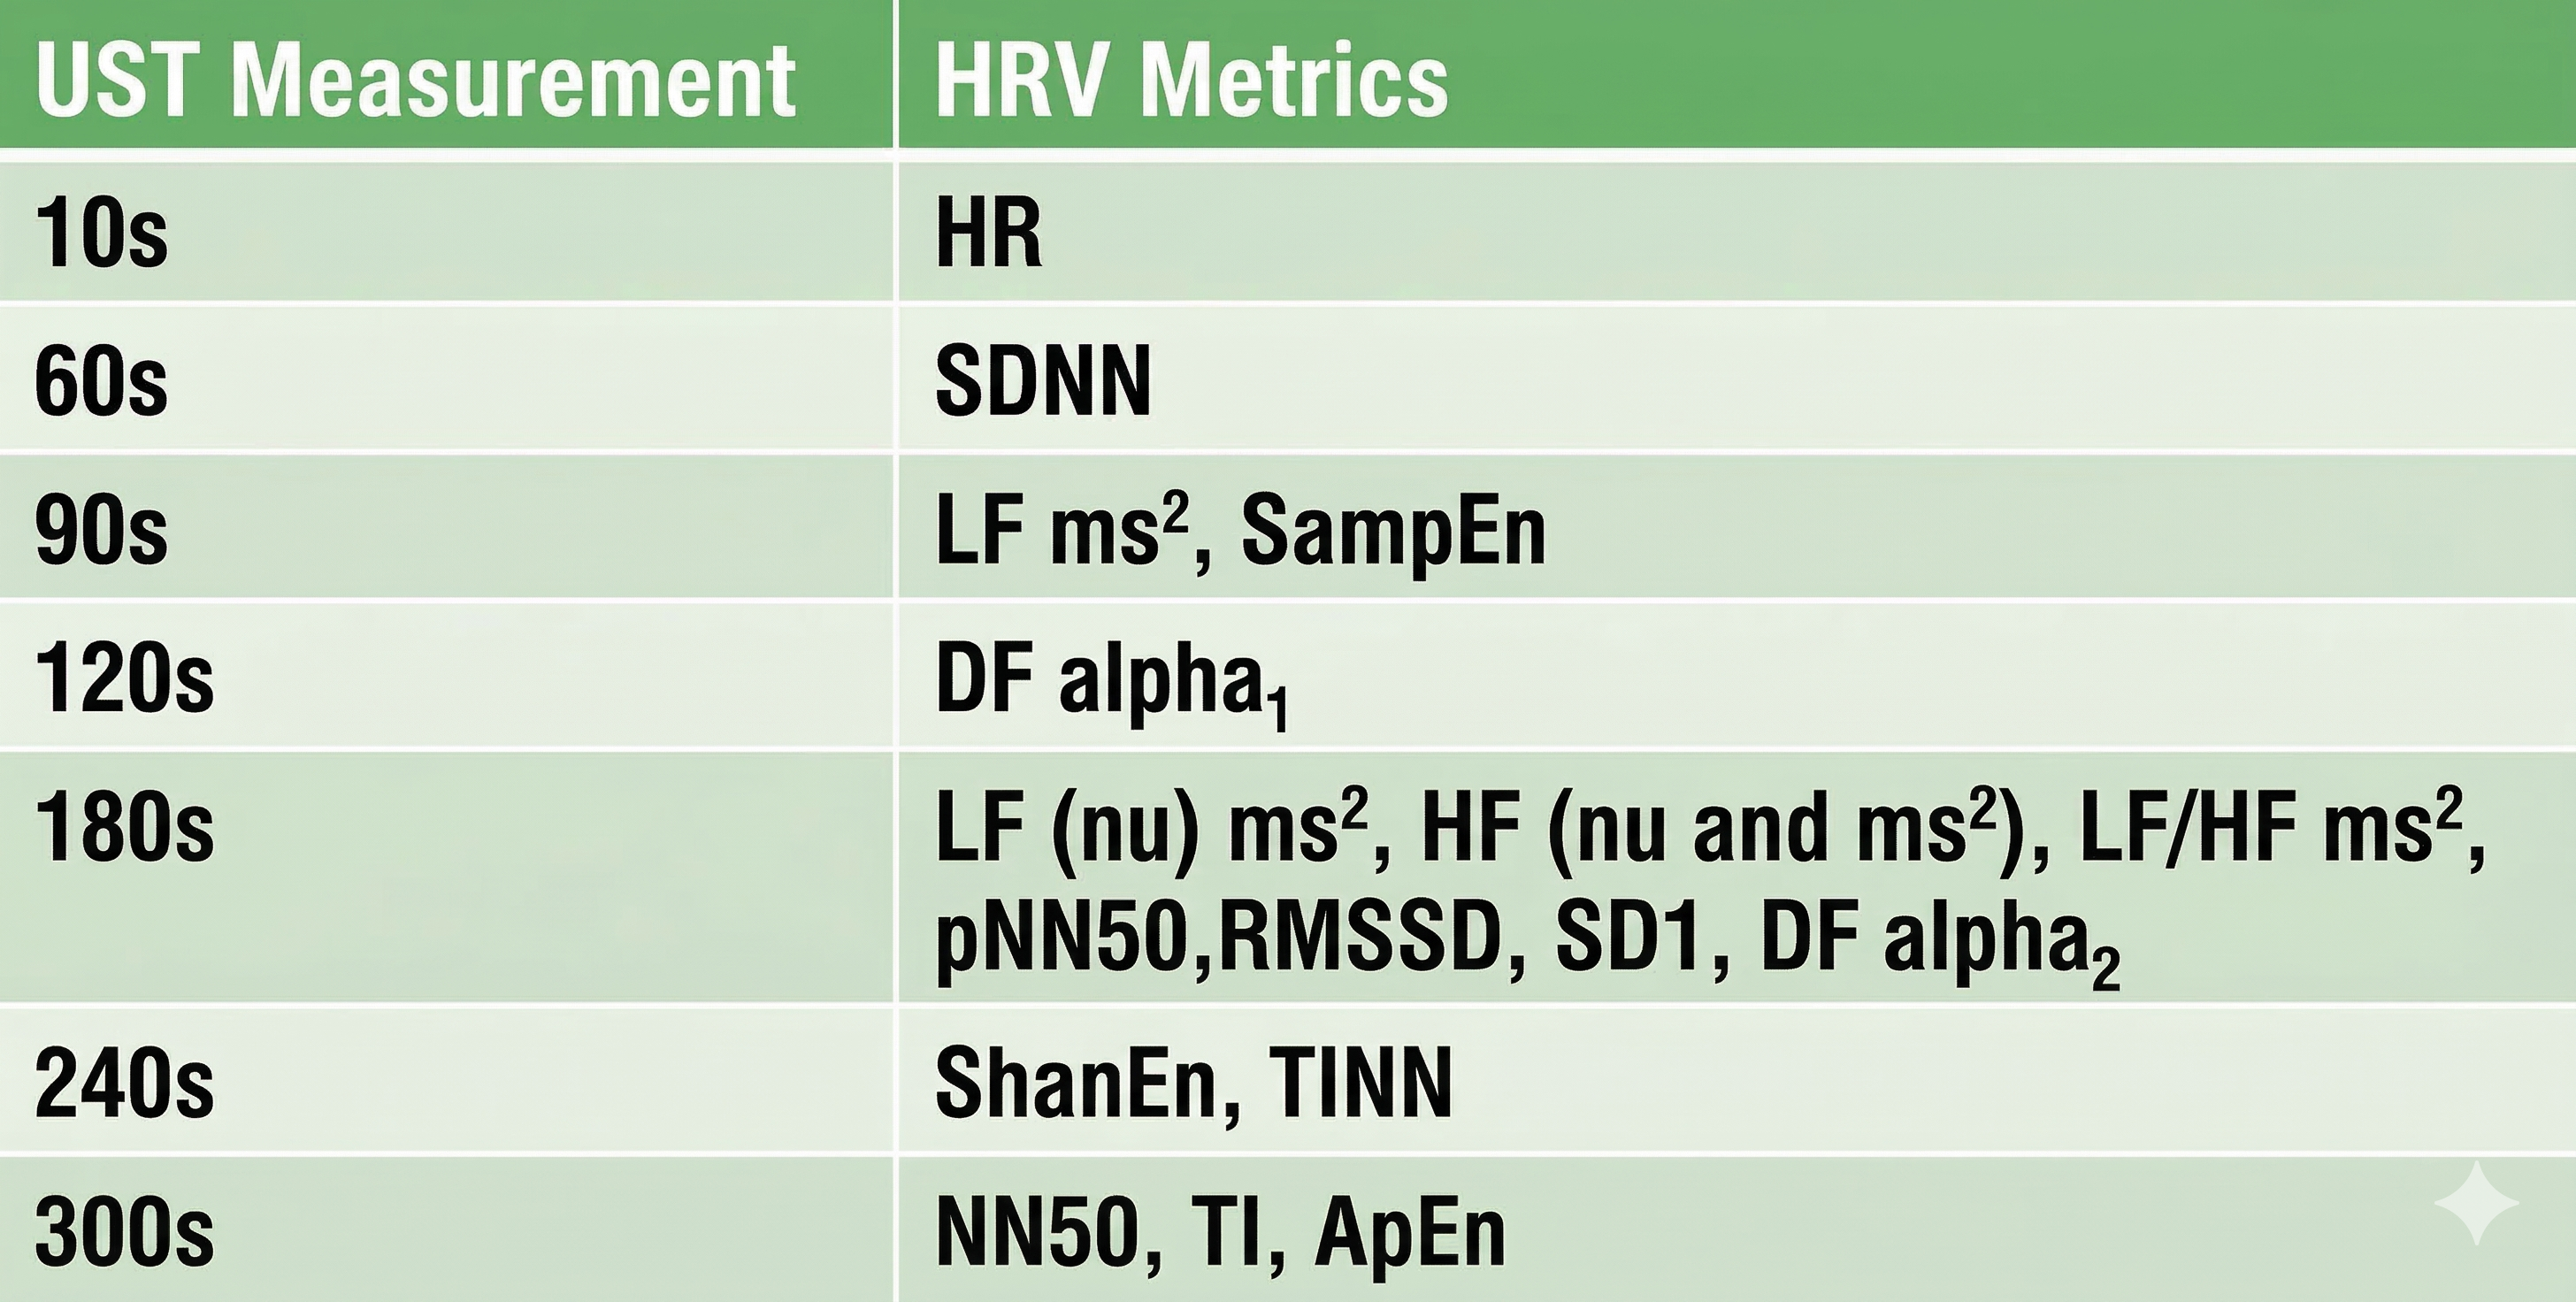
Shaffer et al. (2019) obtained 5-minute ECG recordings from 38 healthy undergraduates while sitting upright under resting conditions with their eyes open. They extracted epochs ranging from 10 to 240 seconds and applied a particularly rigorous equivalence test: a Pearson r with a conservative criterion (r ≥ 0.90), Bland-Altman limits of agreement using an allowable difference of ±5% of the 5-minute value's range, and a Student's t-test to confirm equality. The minimum UST values identified by this approach are shown in the table below.
Perspective
The varying minimum recording periods reported across studies likely reflect differences in recording method (BVP or ECG), participant age, health status, measurement conditions, artifacting procedures, and the statistical criteria used to establish equivalence. Clinicians should discount any study that did not specify a minimum acceptable difference a priori and conduct a Bland-Altman difference plot with an equality test. These are not optional statistical niceties but essential safeguards against concluding that two measurements agree when they do not.
For healthy individuals, resting baselines as brief as 1 minute should be sufficient to measure heart rate and SDNN, and 3 minutes to measure RMSSD, provided that the data are carefully artifacted. However, clinicians should not substitute these brief measurements for conventional 5-minute and 24-hour metrics until measurement protocols are standardized and normative values for healthy nonathletes, optimal performance populations, and clinical populations are established. At the VA, in hospital settings, and in sports performance labs, the safest approach remains using well-validated standard durations unless specific circumstances justify shorter recordings.
Comprehension Questions: Brief Monitoring and UST Measurements
- Why do brief resting measurement periods underestimate HRV time-domain values compared to 24-hour recordings?
- What statistical error have many UST studies committed, and what is the recommended approach for establishing measurement equivalence?
- Based on the reviewed research, what minimum recording periods appear necessary for reliable RMSSD and SDNN measurements in healthy individuals?
24-Hour Monitoring Detects Slower Rhythms
This section explains why 24-hour monitoring captures a more complete picture of autonomic function than brief recordings. Extended monitoring detects slower sources of variability and a wider range of autonomic activity, including circadian rhythms, core body temperature regulation, metabolism, the renin-angiotensin system, and parasympathetic and sympathetic contributions (Shaffer, McCraty, & Zerr, 2014). These biological processes operate over hours, not minutes, which is why they are invisible to a 5-minute office recording. For clients who present with elevated cardiovascular risk, this additional information can be the difference between a reassuring assessment and a clinically significant finding.
Services like the HeartMath Institute's Autonomic Assessment Report ® can artifact and analyze uploaded 24-hour data to provide a more comprehensive evaluation than is possible from in-office recordings alone. The following profile assesses a 51-year-old male at elevated risk for heart attack. © Institute of HeartMath.
Twenty-four-hour monitoring also provides a more complete assessment of frequency-domain measures, revealing day-to-night shifts in autonomic balance that brief recordings cannot capture. Clinicians should consider supplementing short-term pre- and post-assessment with 24-hour monitoring, particularly for clients with elevated heart attack risk.
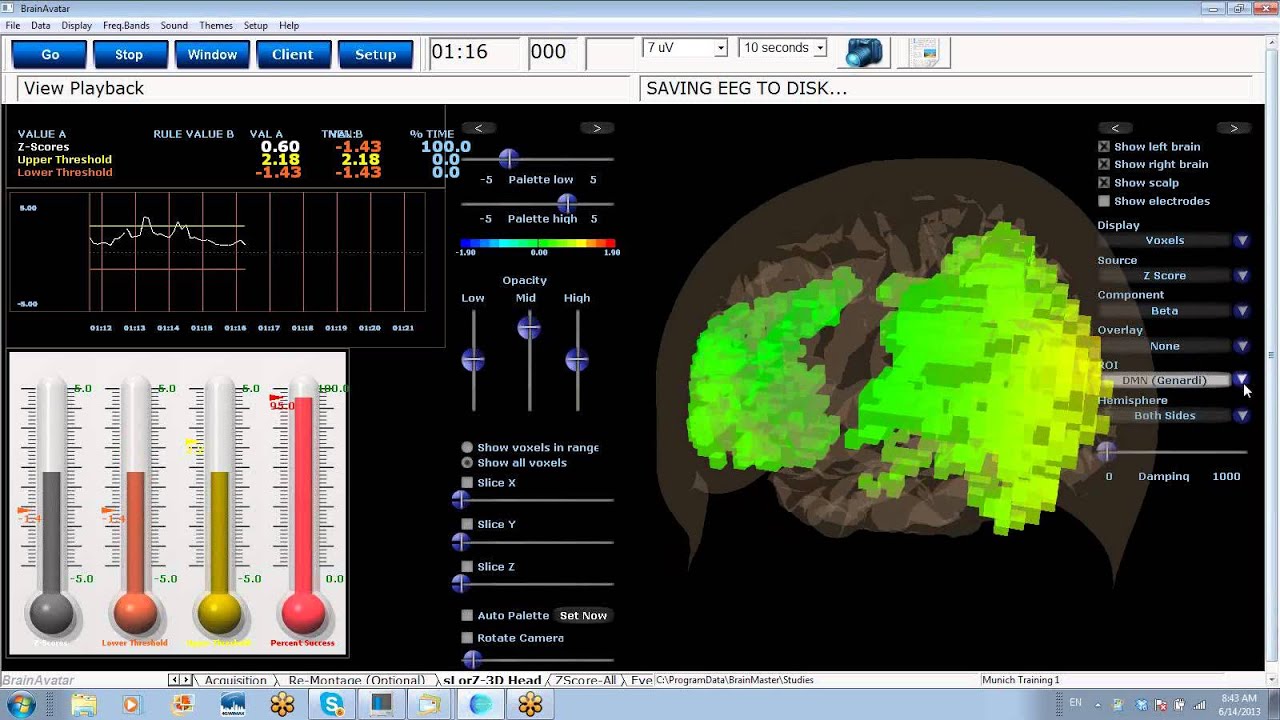
This model is analogous to the increased administration of a quantitative EEG (qEEG), which is a digitized statistical brain map using at least a 19-channel montage to measure EEG amplitude within specific frequency bins, to guide and evaluate improvement in neurofeedback. Just as neurofeedback practitioners use comprehensive qEEG baselines to design and track training protocols, HRV biofeedback clinicians can use 24-hour recordings to identify autonomic deficits and measure therapeutic progress.
How To Interpret HRV Measurements
This section covers the contextual and individual factors that shape HRV values, helping you avoid misinterpretation and draw valid clinical conclusions. Accurate interpretation requires attention to two categories of variables: the circumstances under which measurements were taken and the characteristics of the client being assessed.
Measurement Context
A wide range of contextual factors can influence HRV readings. These include monitoring period length (e.g., brief or 24-hour), detection method (ECG or PPG), the presence or absence of feedback and breathing pacing, whether monitoring was ambulatory or stationary, position (e.g., supine or sitting upright), intensity of physical activity, tasks performed during measurement, social demand characteristics within the monitoring situation, and the client's relationship with staff. Each of these variables can affect autonomic nervous system (ANS) activation, breathing mechanics, and emotional state, which in turn shape both time-domain and frequency-domain HRV values. Failing to control for these factors is one of the most common sources of invalid clinical comparisons.
Recording Period Length
The length of the recording period significantly affects both HRV time- and frequency-domain measurements. This Real Genius episode was drawn by Dani S@unclebelang.
Resting values obtained from brief monitoring periods can dramatically underestimate HRV, correlating poorly with 24-hour indices. To illustrate the magnitude of this discrepancy, Dr. Inna Khazan (2022) invites us to consider SDNN: the mean short-term value for healthy adults was 50 milliseconds (Nunan et al., 2010), for athletes it was 70 milliseconds (Berkoff et al., 2007), but the 24-hour mean for healthy 20- to 29-year-olds was 153 milliseconds (Umetani et al., 1998). This threefold difference underscores why recording period must always be considered when interpreting SDNN or any other HRV metric.
Detection Method
Under resting conditions, ECG and PPG methods yielded errors of less than 6% for most HRV measures and 29.9% for pNN50 in one study (Jeyhani et al., 2015). However, the PPG method may inflate HRV values and serve as a poor surrogate for ECG when participants stand, perform slow-paced breathing, or have low resting HRV (Constant et al., 1999; Hemon & Phillips, 2016; Jan et al., 2019; Medeiros et al., 2011). Clinicians working with cardiac rehabilitation patients or athletes performing active protocols should be especially cautious about relying on PPG-derived values for clinical decision-making.
Client Characteristics
Beyond measurement context, individual client factors substantially influence HRV. These include age, sex, health status, aerobic fitness, medication, recent or immediate physical activity, breathing pattern (e.g., respiration rate and inhalation-to-exhalation ratio), and cognitive and emotional activity (e.g., affect, expectancies, imagery, and self-statements). A thorough intake that documents these variables is essential for accurate baseline interpretation and for tracking meaningful change over the course of treatment.
Age
HRV time-domain measurements decline with age (Nunan et al., 2010; Abhishekh et al., 2013) and with decreased health (Agelink et al., 2002; Bigger et al., 1993). Almedia-Santos et al. (2016) obtained 24-hour ECG recordings from 1,743 subjects aged 40 to 100 and found a linear decline in SDNN, SDANN, and SDNN index. However, they discovered a U-shaped pattern for RMSSD and pNN50, which decreased from ages 40 to 60 and then increased after age 70, possibly reflecting survivor effects in the oldest cohort. Bonnemeier et al. (2003) recorded 24-hour data from 166 healthy volunteers ages 20 to 70 and found the most dramatic HRV decrease between the second and third decades of life, a finding with direct implications for setting normative expectations in younger versus older clients.
Sex
Sex differences in HRV are well documented and clinically relevant. A meta-analysis of 296,247 healthy participants examined 50 HRV measures (Koenig & Thayer, 2016) and found that women had higher mean heart rate (smaller RR intervals) and lower SDNN and SDNN index values, especially in 24-hour studies, compared to men. Women also showed lower total, VLF, and LF power but greater HF power. This pattern reflects relative vagal dominance in women despite their higher mean heart rate, whereas men demonstrate relative sympathetic dominance despite their lower heart rate, a distinction that matters when selecting sex-appropriate normative references.
Health
Health status is among the strongest influences on HRV. Cardiovascular disorders, conditions involving autonomic dysregulation such as anxiety and depression, and asthma are all associated with reduced HRV (Shaffer & Venner, 2013). For practitioners in VA settings, hospitals, and clinics, this means that many clients will present with HRV values that are suppressed not only by their primary condition but also by comorbid medical and psychiatric diagnoses.
Aerobic Fitness
Aerobic fitness has a well-established positive relationship with HRV. Time-domain measurements rise with increased aerobic fitness (Aubert et al., 2003; De Meersman, 1993). This finding is directly relevant to optimal performance practitioners working with athletes, who should expect higher baseline HRV values and may need to use athlete-specific norms rather than general population references.
Medication
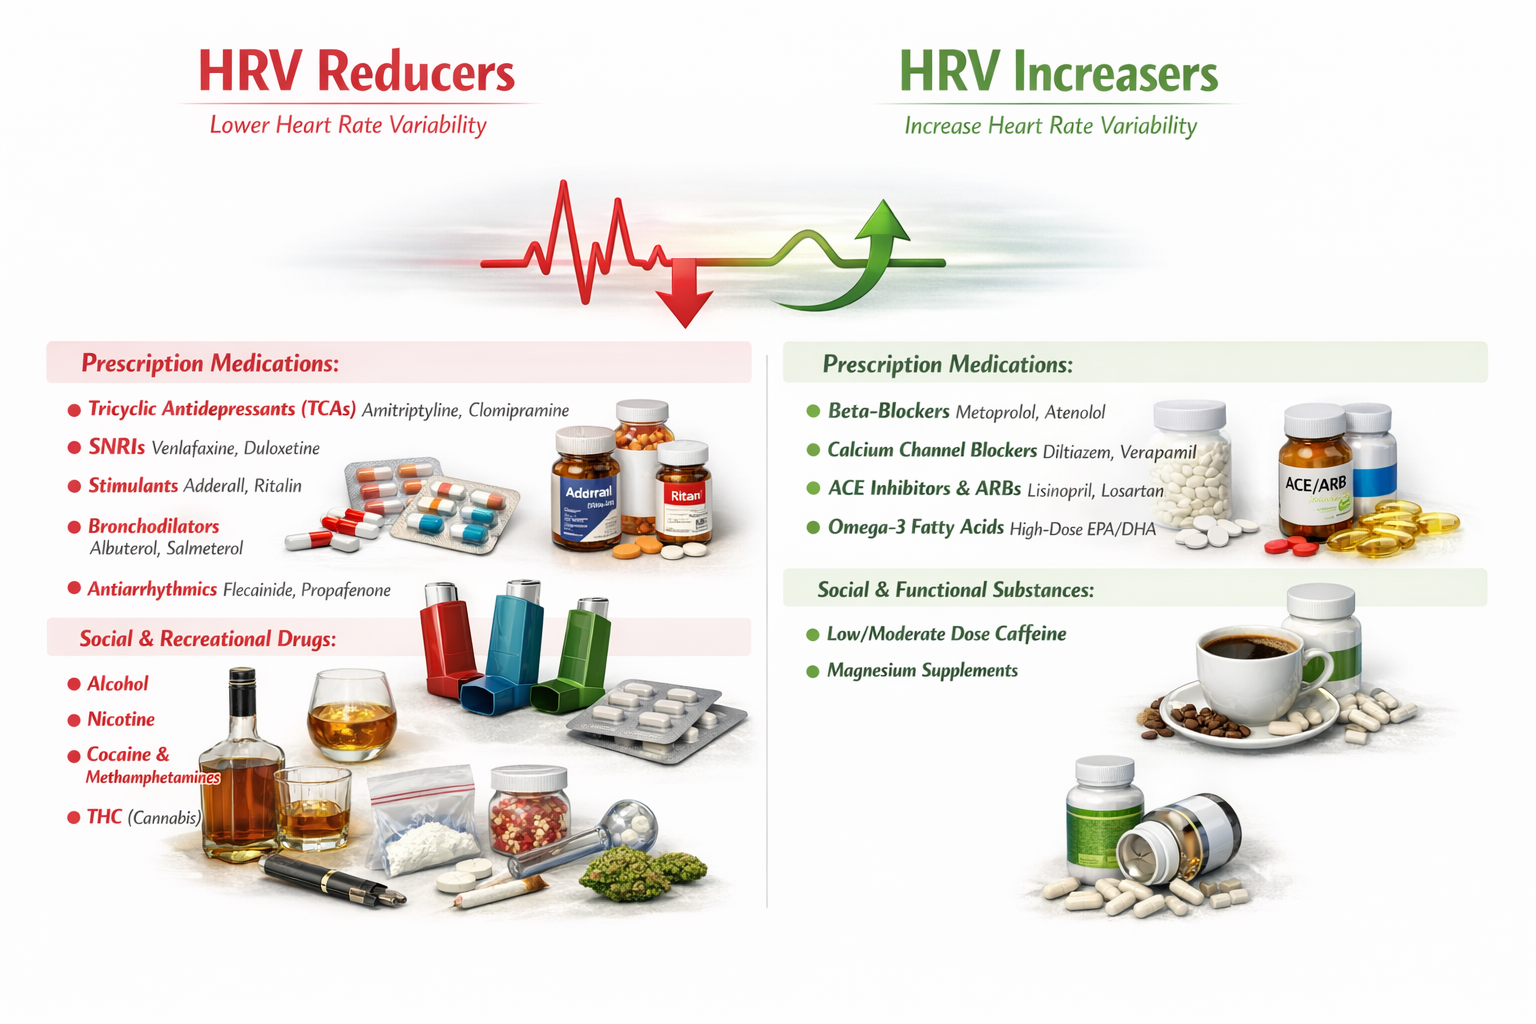
Medication can affect both time-domain and frequency-domain measurements in ways that complicate clinical interpretation. Reviewing a complete list of all medications your client is currently taking is essential before drawing conclusions from HRV data. Within a single drug class, different agents can produce different effects on HRV: for example, clozapine stands apart from other antipsychotics in its autonomic effects. The figure below summarizes known medication effects on HRV.
Breathing
Breathing rate and pattern exert powerful effects on HRV that clinicians must account for during assessment. Compared with breathing at typical rates, slow-paced breathing can increase time-domain measurements and render frequency-domain calculations meaningless (Gevirtz, 2021; Nunan et al., 2010). Paced breathing in the LF range increases respiratory sinus arrhythmia (RSA), exercises the baroreflex, and maximizes time-domain and LF band values (Shaffer & Meehan, 2020). Conversely, breathing at rates significantly above or below an individual's resonance frequency (RF) may diminish time-domain and LF band values, and overbreathing is often associated with shallow thoracic breathing at rates that are multiples of the RF (Khazan & Shaffer, 2019).
Emotions
HRV measurements are state-dependent, meaning they fluctuate with the client's emotional and cognitive experience at the time of recording. Stress, difficult emotions such as anger and anxiety, and higher cognitive loads all tend to lower HRV (R. McCraty, personal communication, 2013). Sympathetic nervous system activation may increase power in the ULF, VLF, and LF bands, resulting in a high LF/HF ratio (P. M. Lehrer, personal communication, 2012). For this reason, standardizing the emotional and cognitive conditions during assessment, for example by using a neutral distraction task during baselines, helps ensure that HRV data reflect autonomic capacity rather than momentary psychological state.
Comprehension Questions: Interpreting HRV Measurements
- Why is it essential to consider both measurement context and client characteristics when interpreting HRV values?
- How does slow-paced breathing affect HRV time-domain and frequency-domain measurements, and why does this matter clinically?
- Describe the age-related pattern that Almedia-Santos et al. (2016) found for RMSSD and pNN50, and explain why this U-shaped pattern is important for clinical assessment.
- Why might a PPG-derived HRV measurement differ from an ECG-derived measurement, and under what conditions is this divergence most pronounced?
HRV Time-Domain and Frequency-Domain Norms
This section presents the normative data you need to interpret your clients' HRV values and explains how to select the appropriate reference population. After you have artifacted client HRV data, meaning you have reviewed the recording for and removed measurement errors, you may compare these values to appropriate short-term or 24-hour norms. The essential principle is that short-term and 24-hour values are not interchangeable, and selecting the wrong reference set will lead to invalid conclusions.
Prediction of Mortality
The predictive power of 24-hour recordings to predict mortality is well-established.
Kleiger and colleagues (1987) demonstrated that 24-hour VLF and LF power predicted mortality years after myocardial infarction. The Task Force report (1996) further stratified heart attack risk using 24-hour SDNN measurements, and those norms are reproduced later in this unit. For clinicians working in cardiac rehabilitation or with post-MI patients at the VA or in hospital settings, these findings underscore the prognostic value of comprehensive HRV assessment.
Researchers have also shown that selected brief measures can predict mortality.
ECG frequency-domain values (VLF, LF, HF, and LF/HF) obtained from 2- to 15-minute recordings predicted death from all causes, myocardial infarction, arrhythmia, and sudden death over a 31-month follow-up (Bigger et al., 1993). Five-minute ECG HRV triangular index (HTI) recordings, which is a geometric measure based on the integral of the RR interval histogram's density divided by its height, predicted cardiovascular and all-cause death in atrial fibrillation patients with a mean follow-up from 1.6 to 3.6 years (Hämmerle et al., 2020). These findings confirm that even brief recordings carry prognostic weight, though they capture less autonomic information than 24-hour monitoring.
Compare Apples with Apples
Valid interpretation depends on matching your client's recording conditions to the norms you reference. To compare client data to short-term norms, you must match participant characteristics (e.g., age, fitness, and sex), recording method (e.g., ECG or PPG), position, tasks, feedback, and breathing rates. Comparing a PPG measurement taken during paced breathing to ECG norms obtained during spontaneous breathing at rest would yield misleading results, regardless of how sophisticated your analysis software may be.
Brief-Measurement Norms
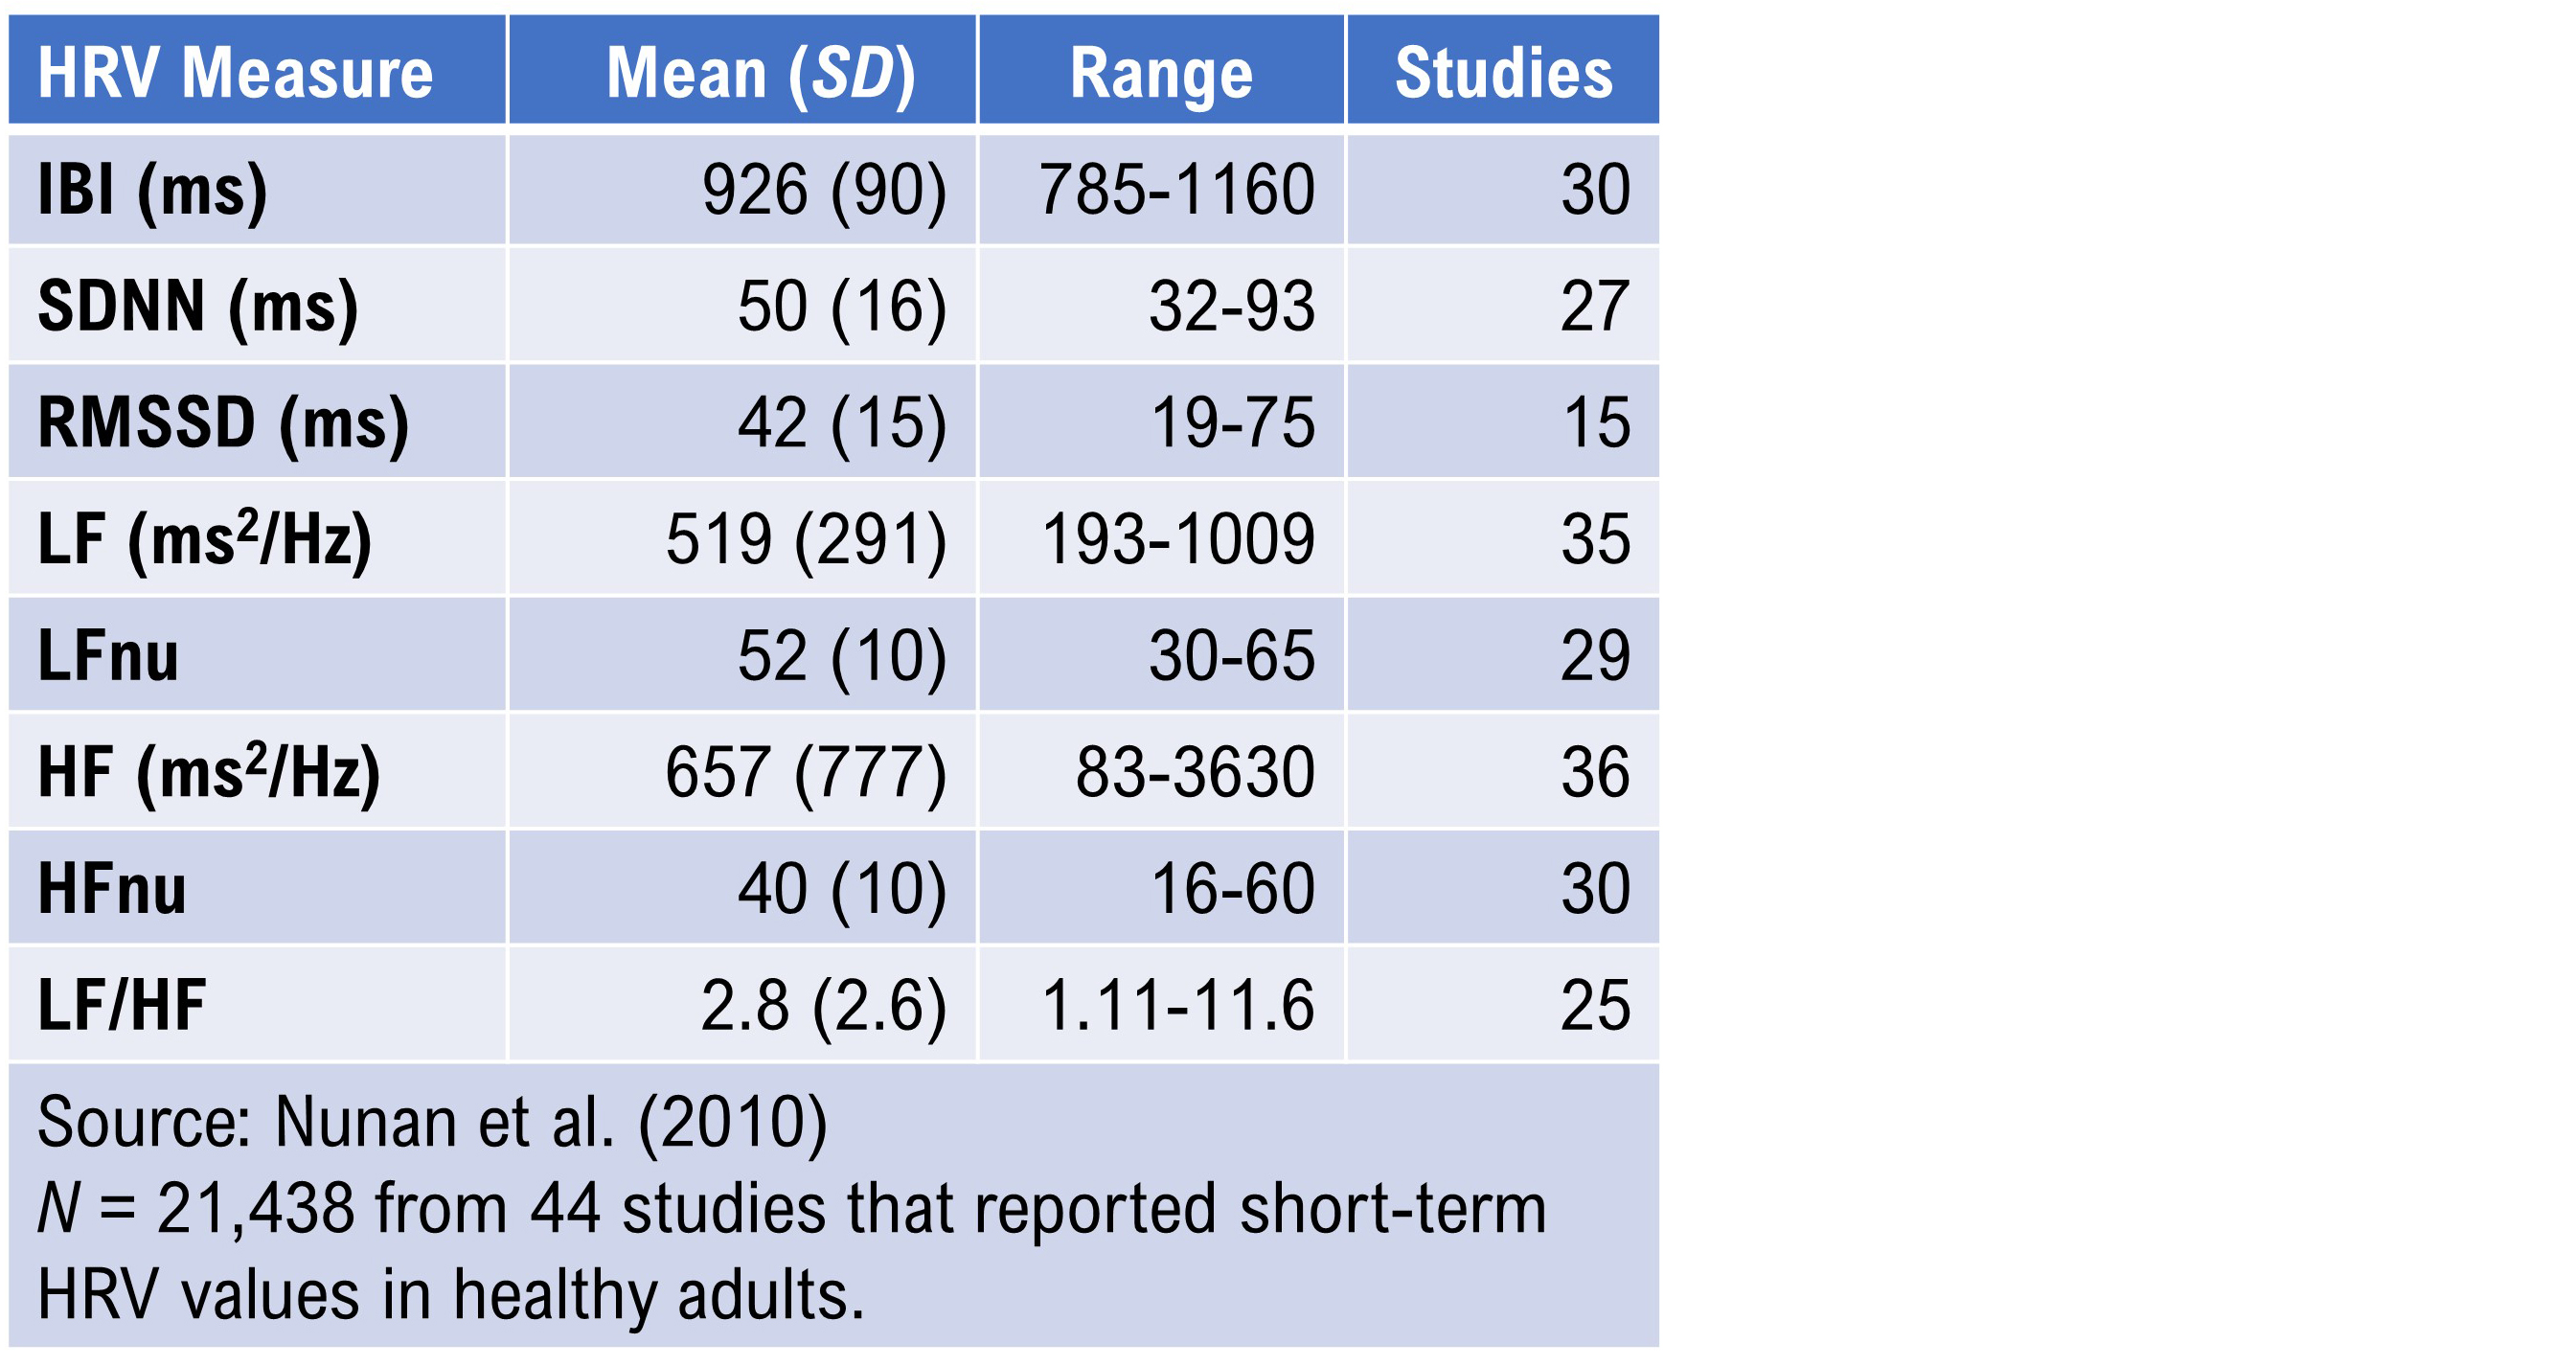
Nunan et al. (2010) conducted the most comprehensive review of normative data from short-term HRV studies published after the Task Force report (1996). The 44 selected studies meeting their criteria involved 21,438 healthy adult participants. The authors reported HRV values according to whether breathing was free or paced, by sex, and by spectral power analysis method (autoregression or Fast Fourier transformation). Recall that LFnu and HFnu are normalized values calculated for brief measurements by dividing LF power or HF power by the sum of LF power + HF power.
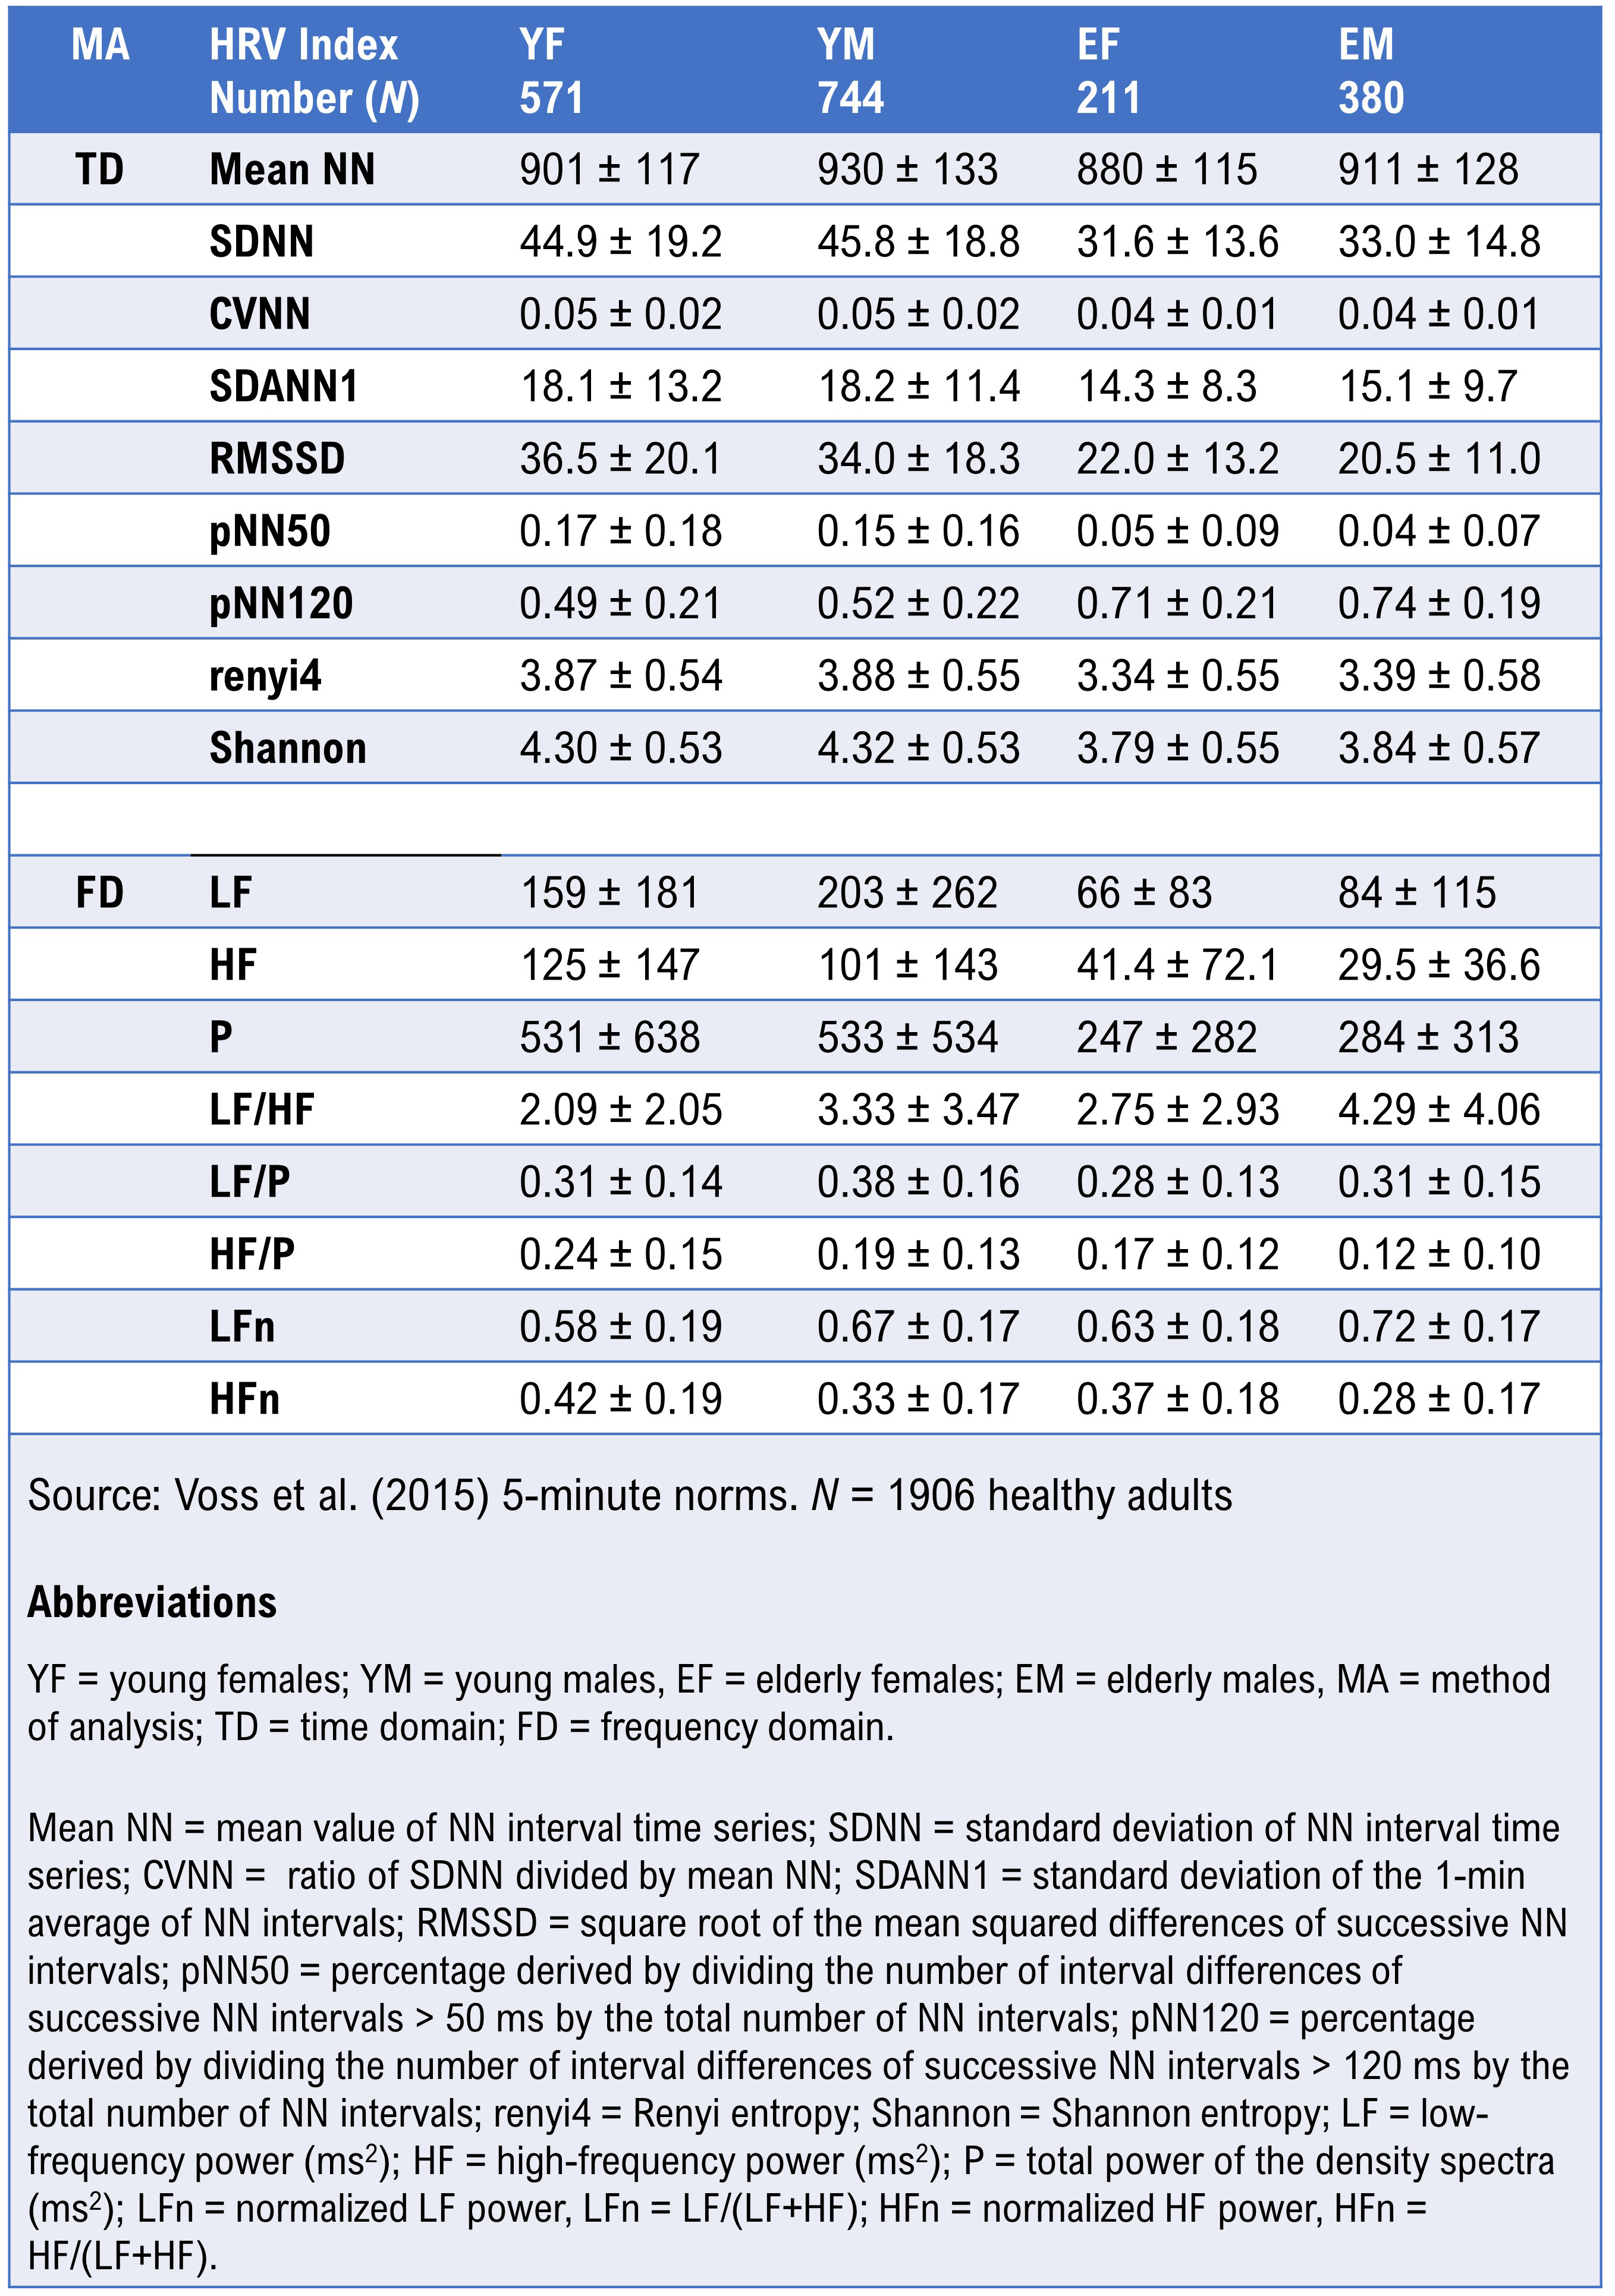
Voss et al. (2015) reported HRV metrics from 5-minute recordings from 1,906 healthy adults (782 women and 1,124 men) ages 25 to 49 and 50 to 74. Their data provide age- and sex-stratified norms that are particularly useful for clinicians working with middle-aged and older adult populations.
Children 6-8 Years of Age
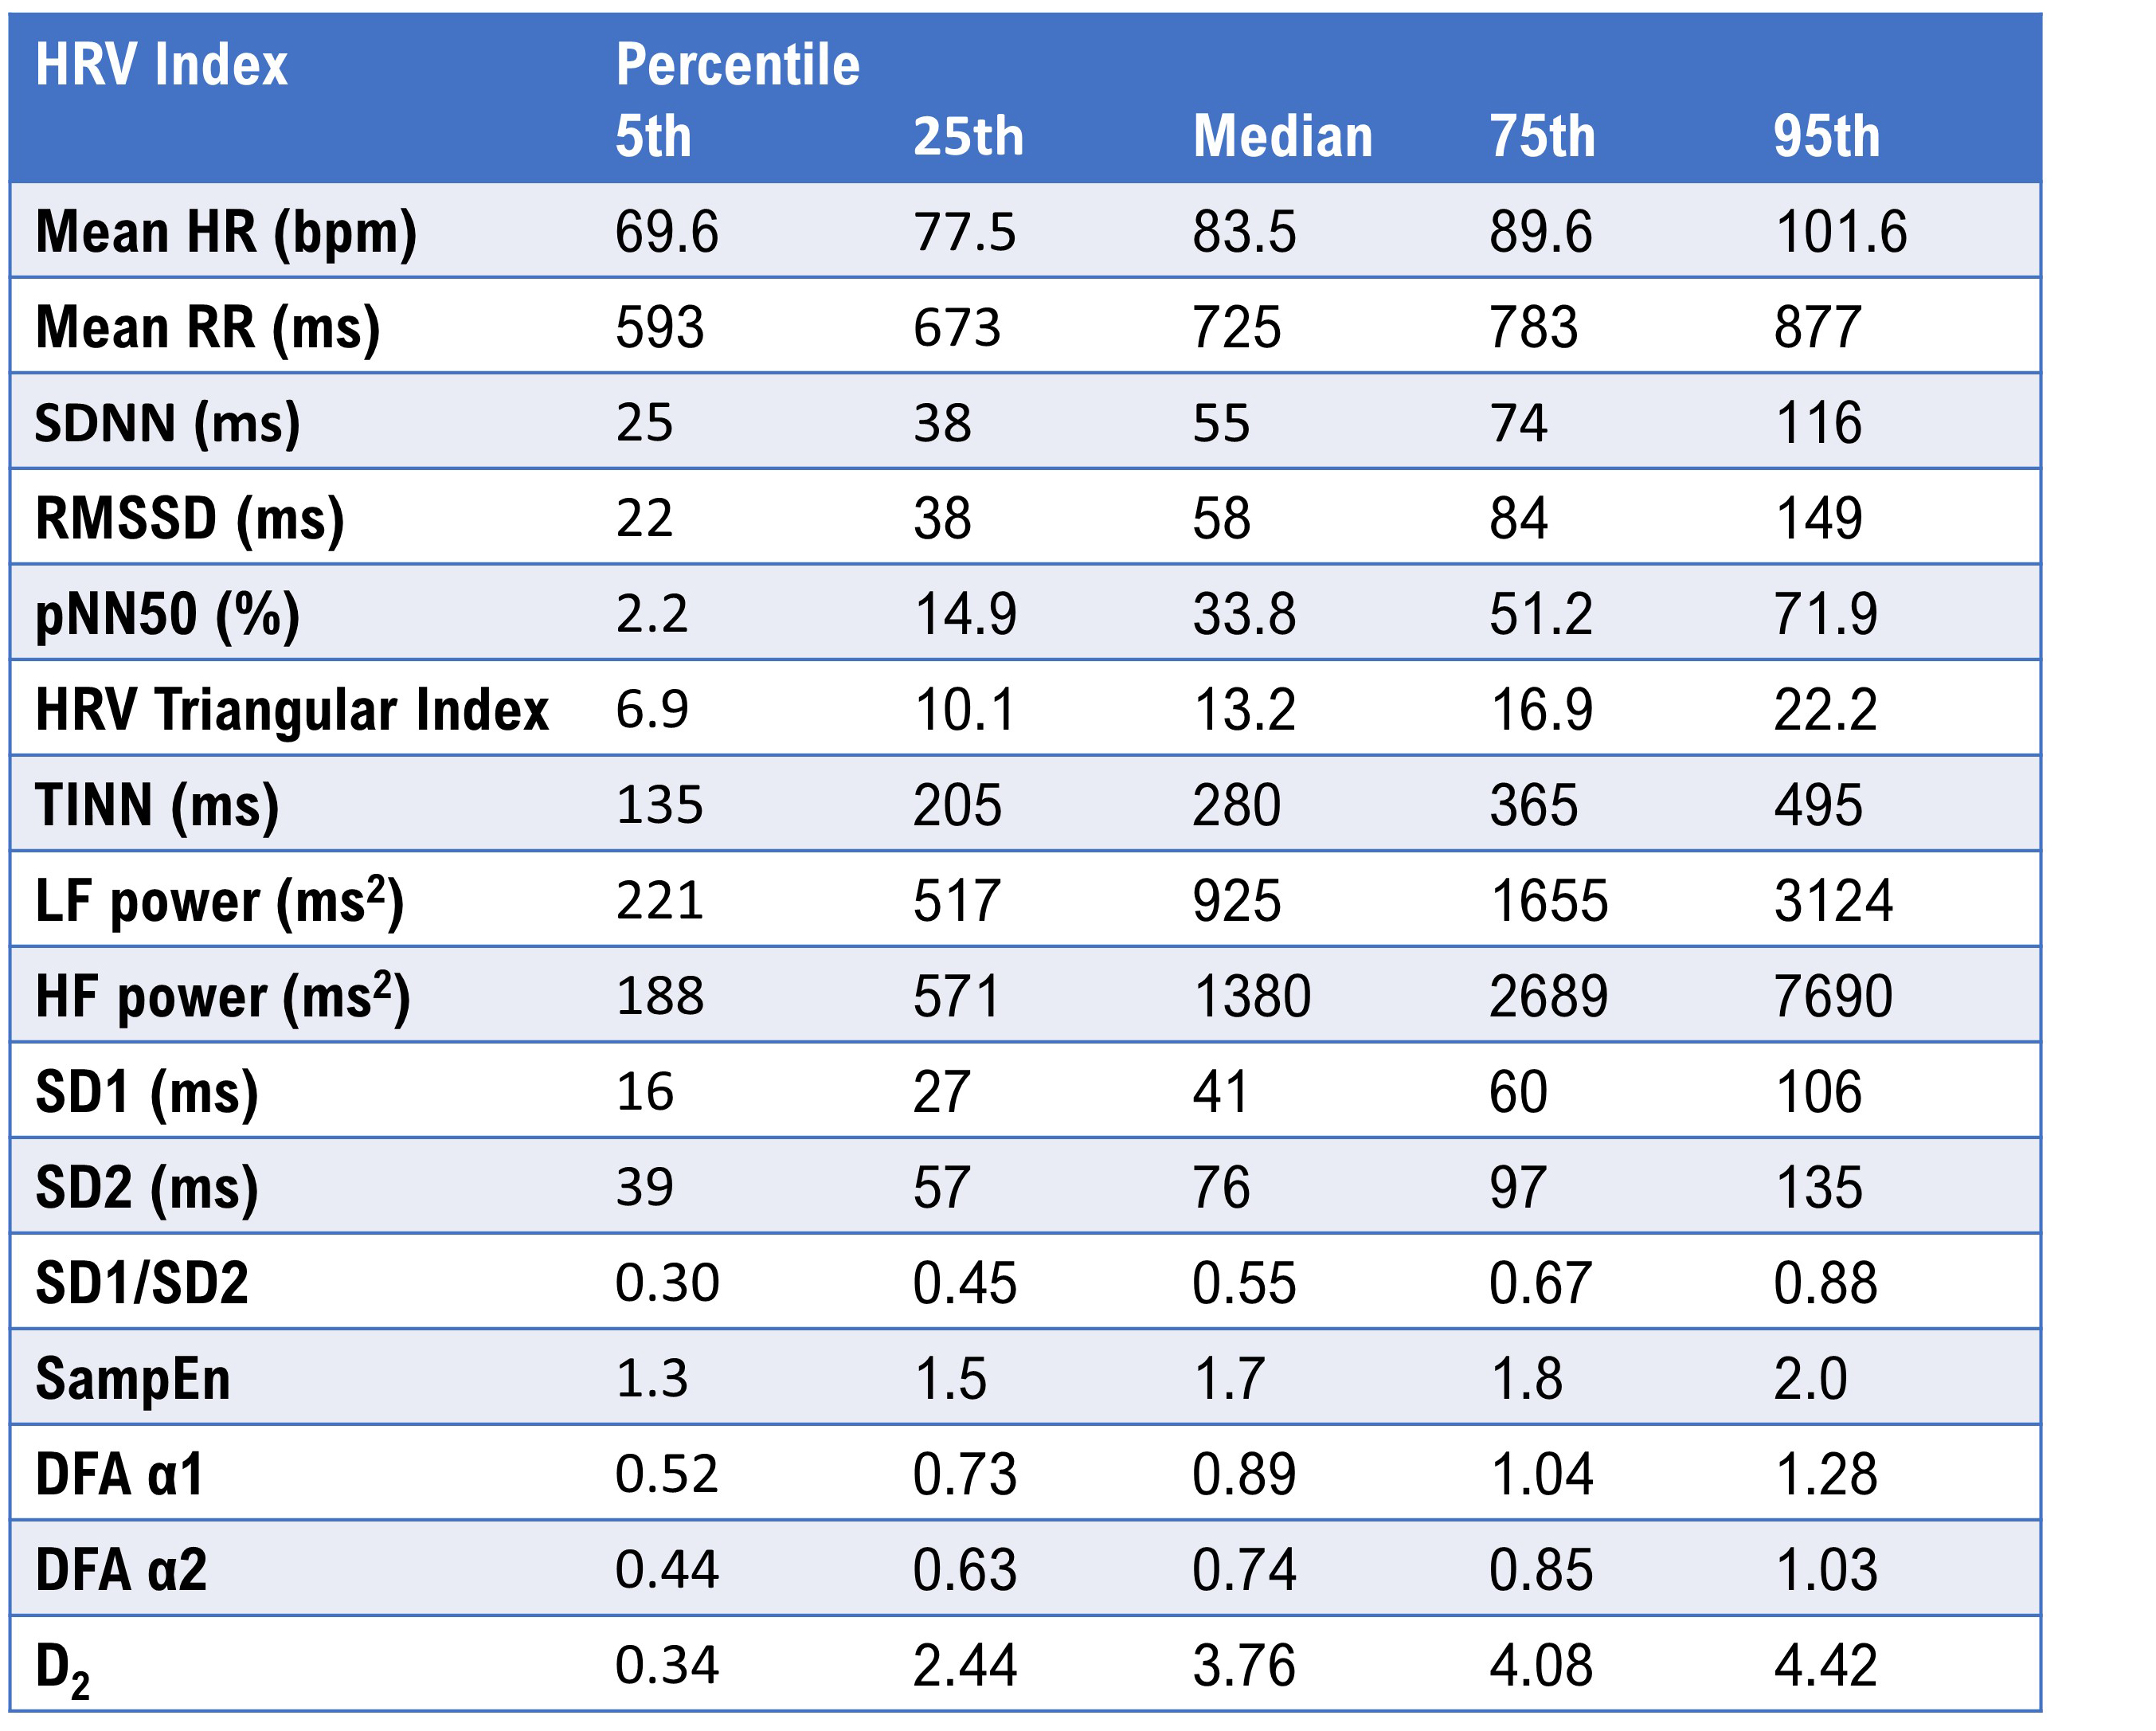
Seppälä et al. (2014) reported HRV metrics from 1- and 5-minute ECG recordings from 465 children ages 6 to 8. The table below reproduces the 5-minute percentiles for a majority of the parameters. Pediatric norms differ substantially from adult values, and clinicians who work with children should reference age-appropriate data rather than extrapolating from adult studies.
Undergraduate Norms
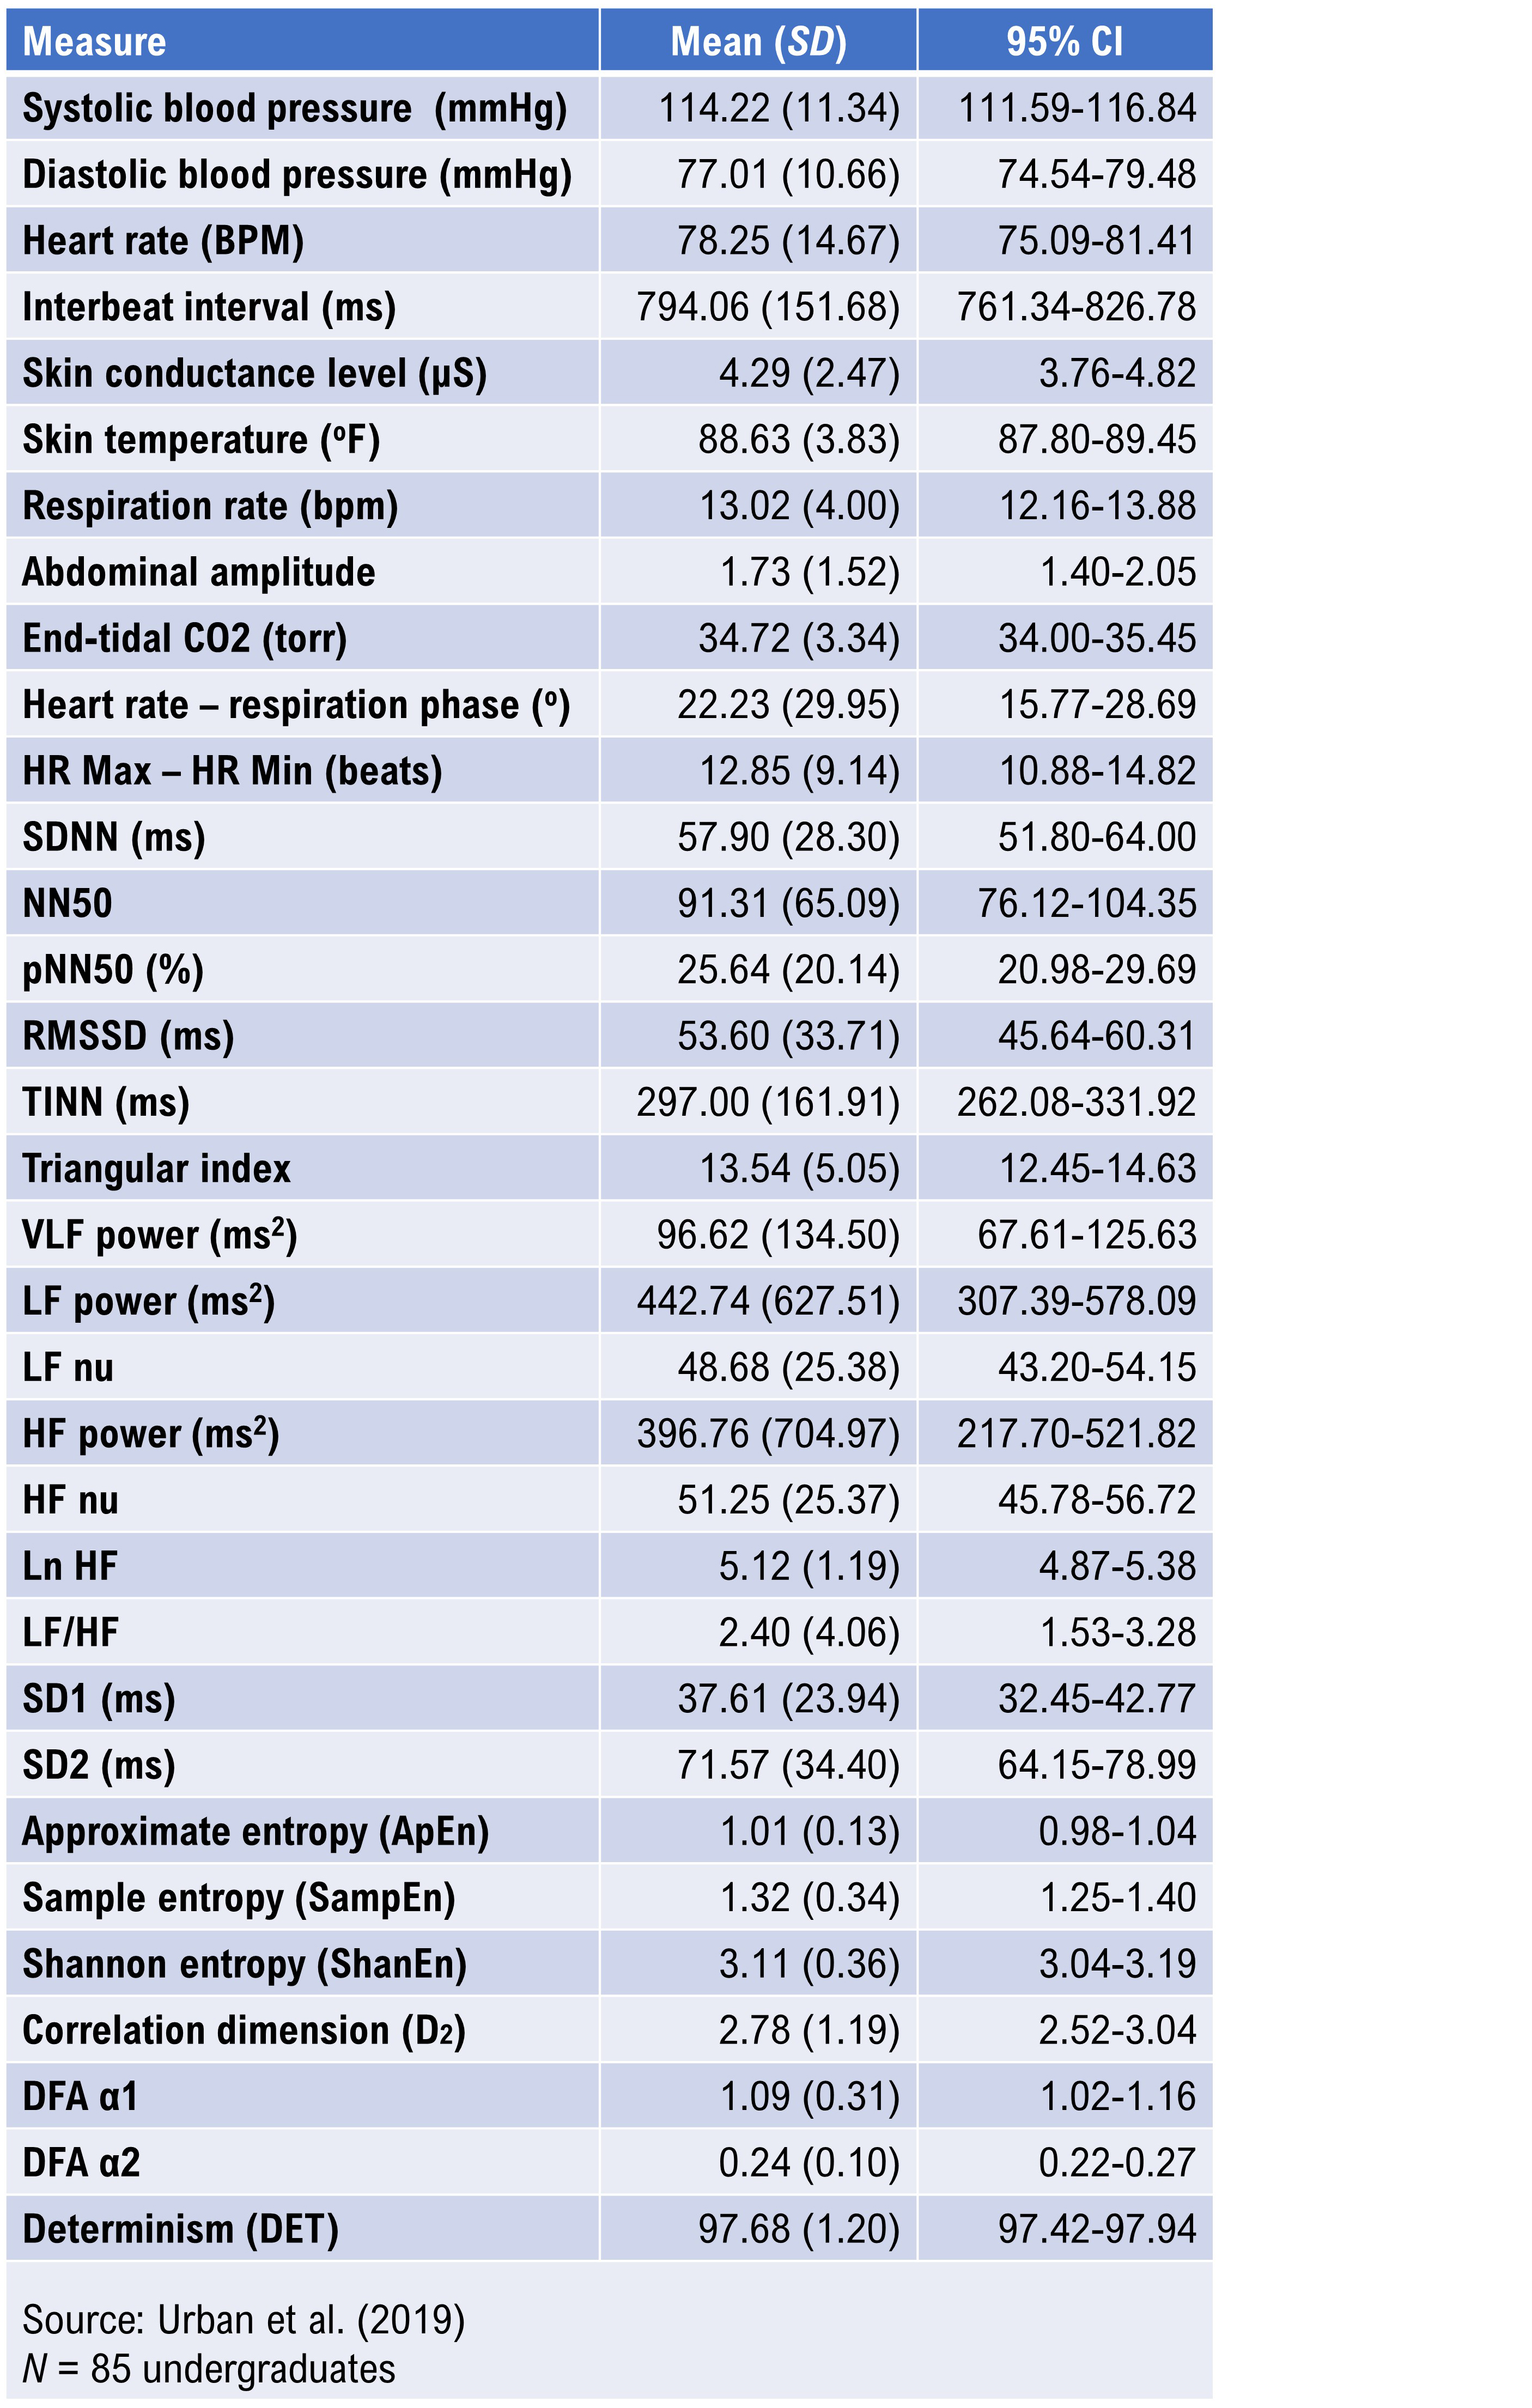
Urban et al. (2019) reported 5-minute baseline measurements on 85 undergraduates (59 women and 26 men), 18 to 28 years of age. Participants sat upright with eyes open, received no feedback, and were instructed to breathe normally. HRV data were obtained using ECG, detrended using a smoothness priors procedure, and analyzed with Welch's periodogram (FFT) technique. These norms provide a useful young-adult reference for clinicians and researchers working with college-age populations or military recruits in a similar age range.
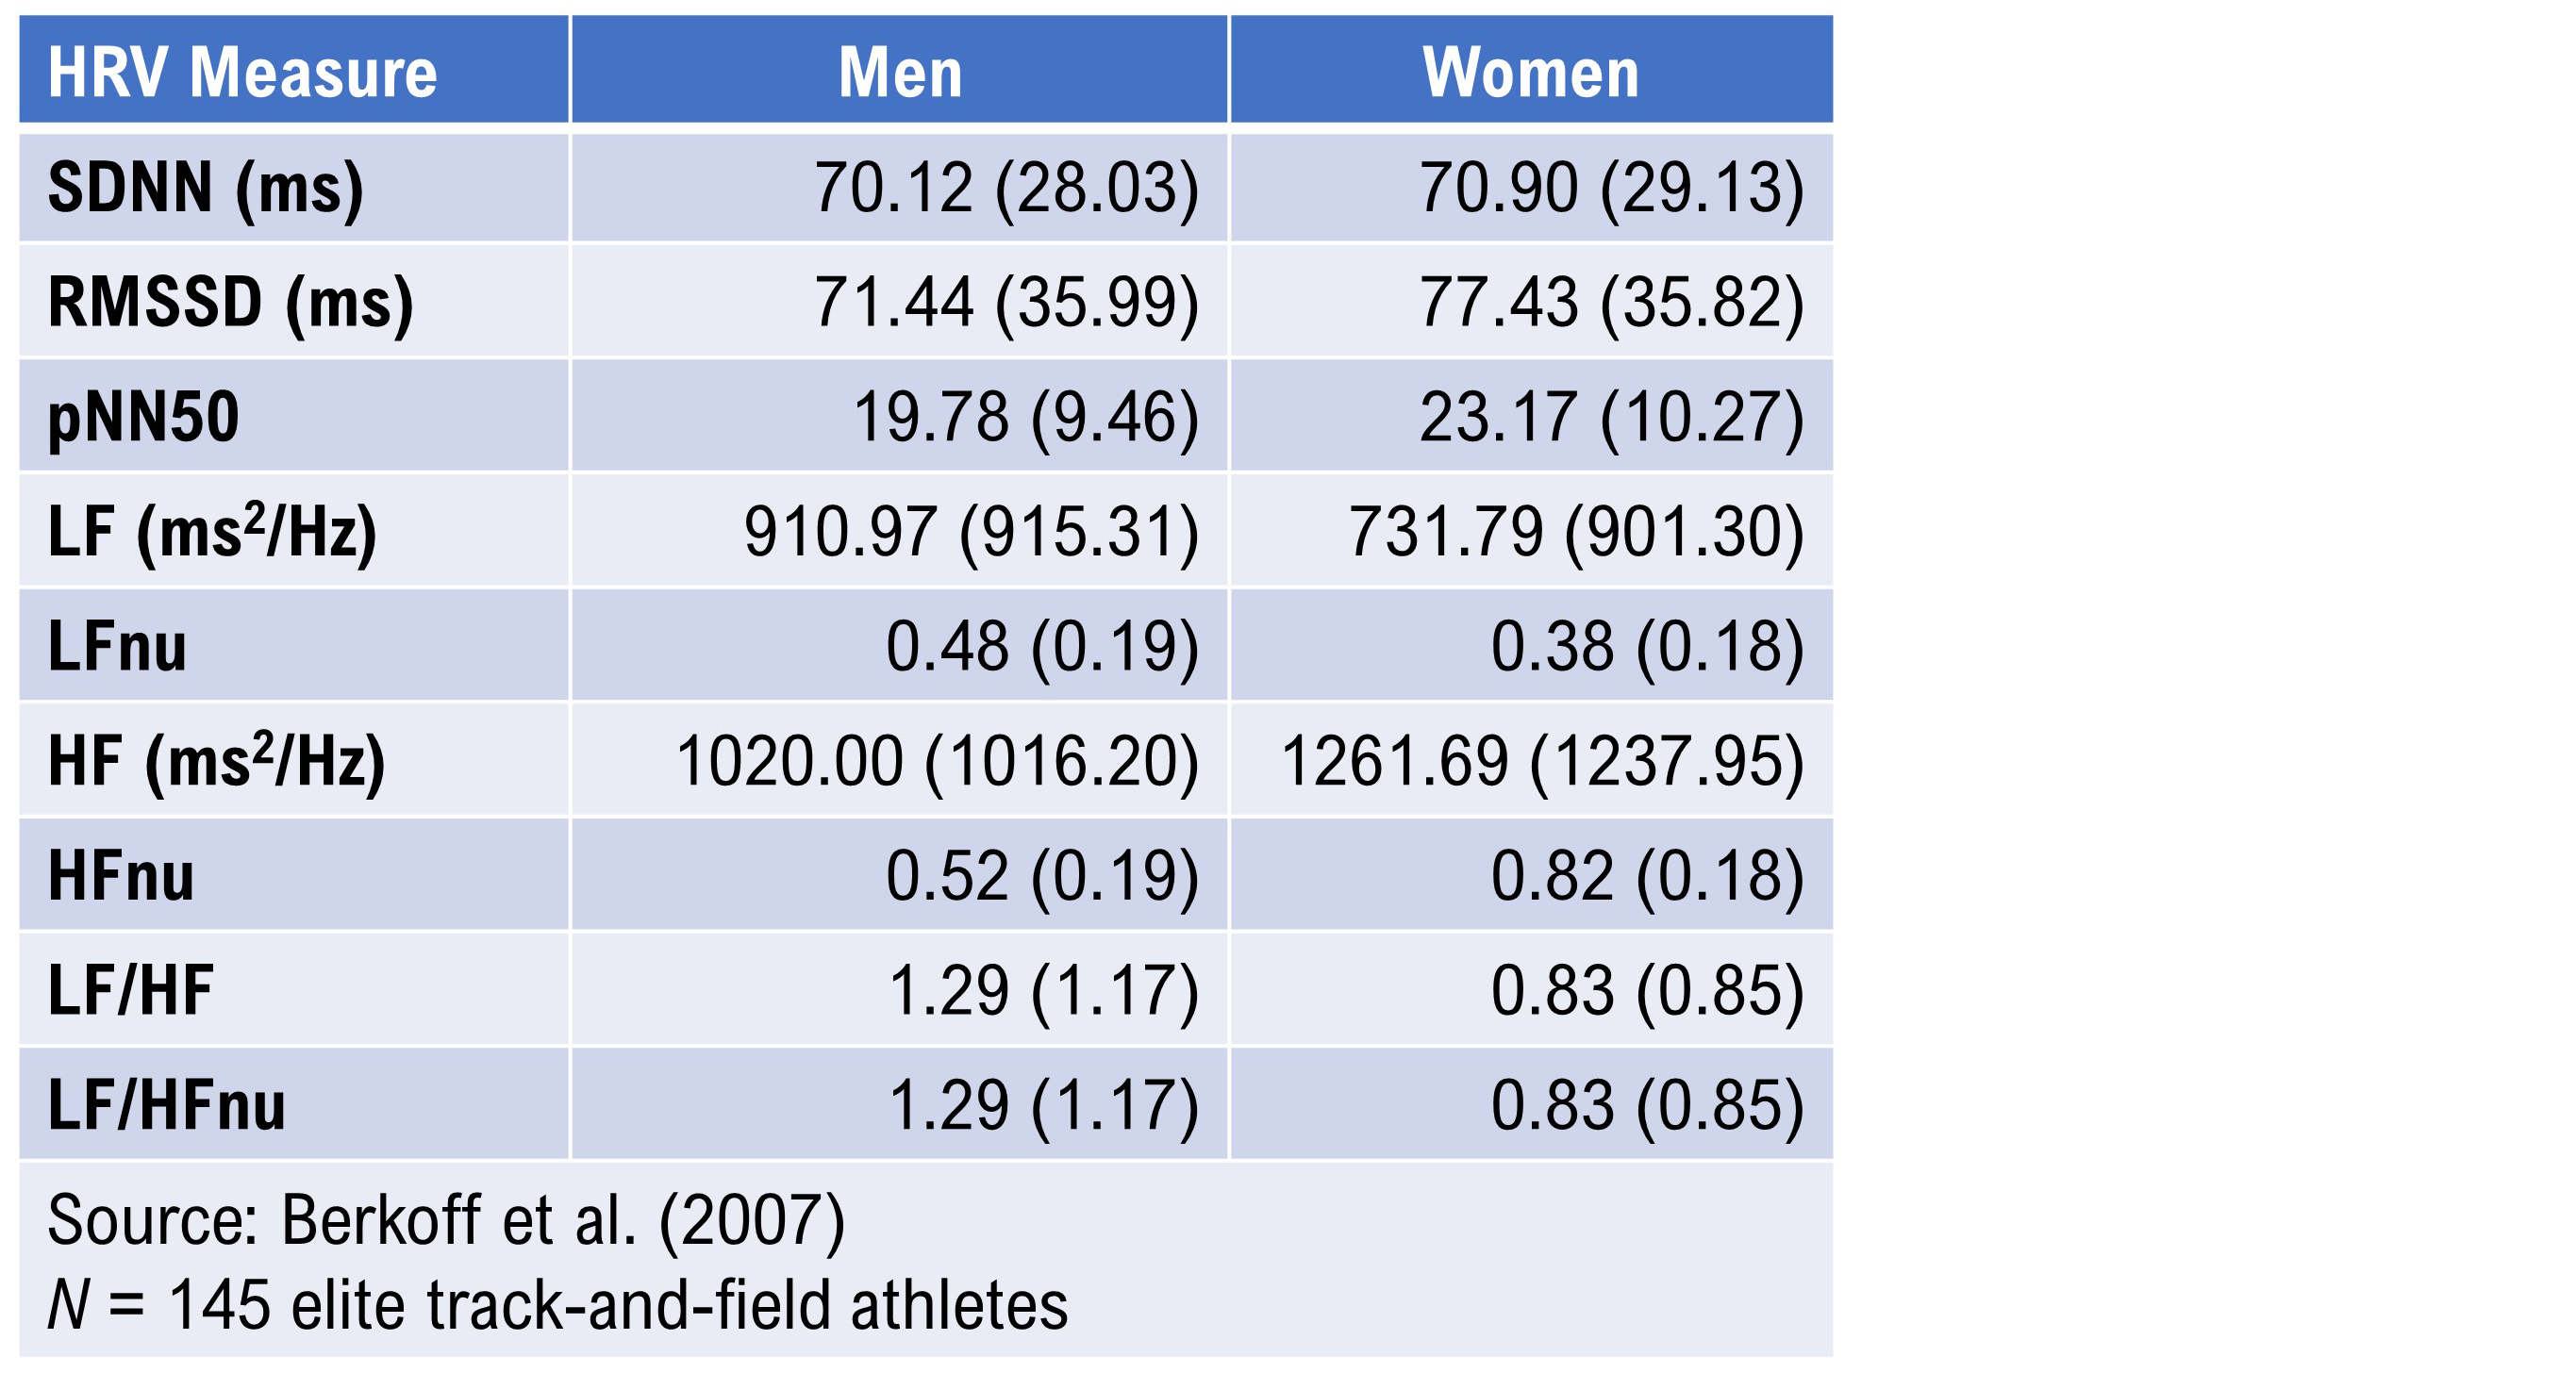
Elite Athletes
Optimal performance professionals should take particular note of the Berkoff et al. (2007) short-term norms derived from 145 elite track-and-field athletes measured before the 2004 U.S.A. Olympic Trials. The investigators monitored the athletes in the supine position using ECG after up to 5 minutes of rest to stabilize heart rate. These norms are essential for practitioners working with competitive athletes or military special operations personnel, whose baseline HRV values typically exceed general population references and require sport-specific or performance-specific benchmarks.
24-Hour Measurement Norms
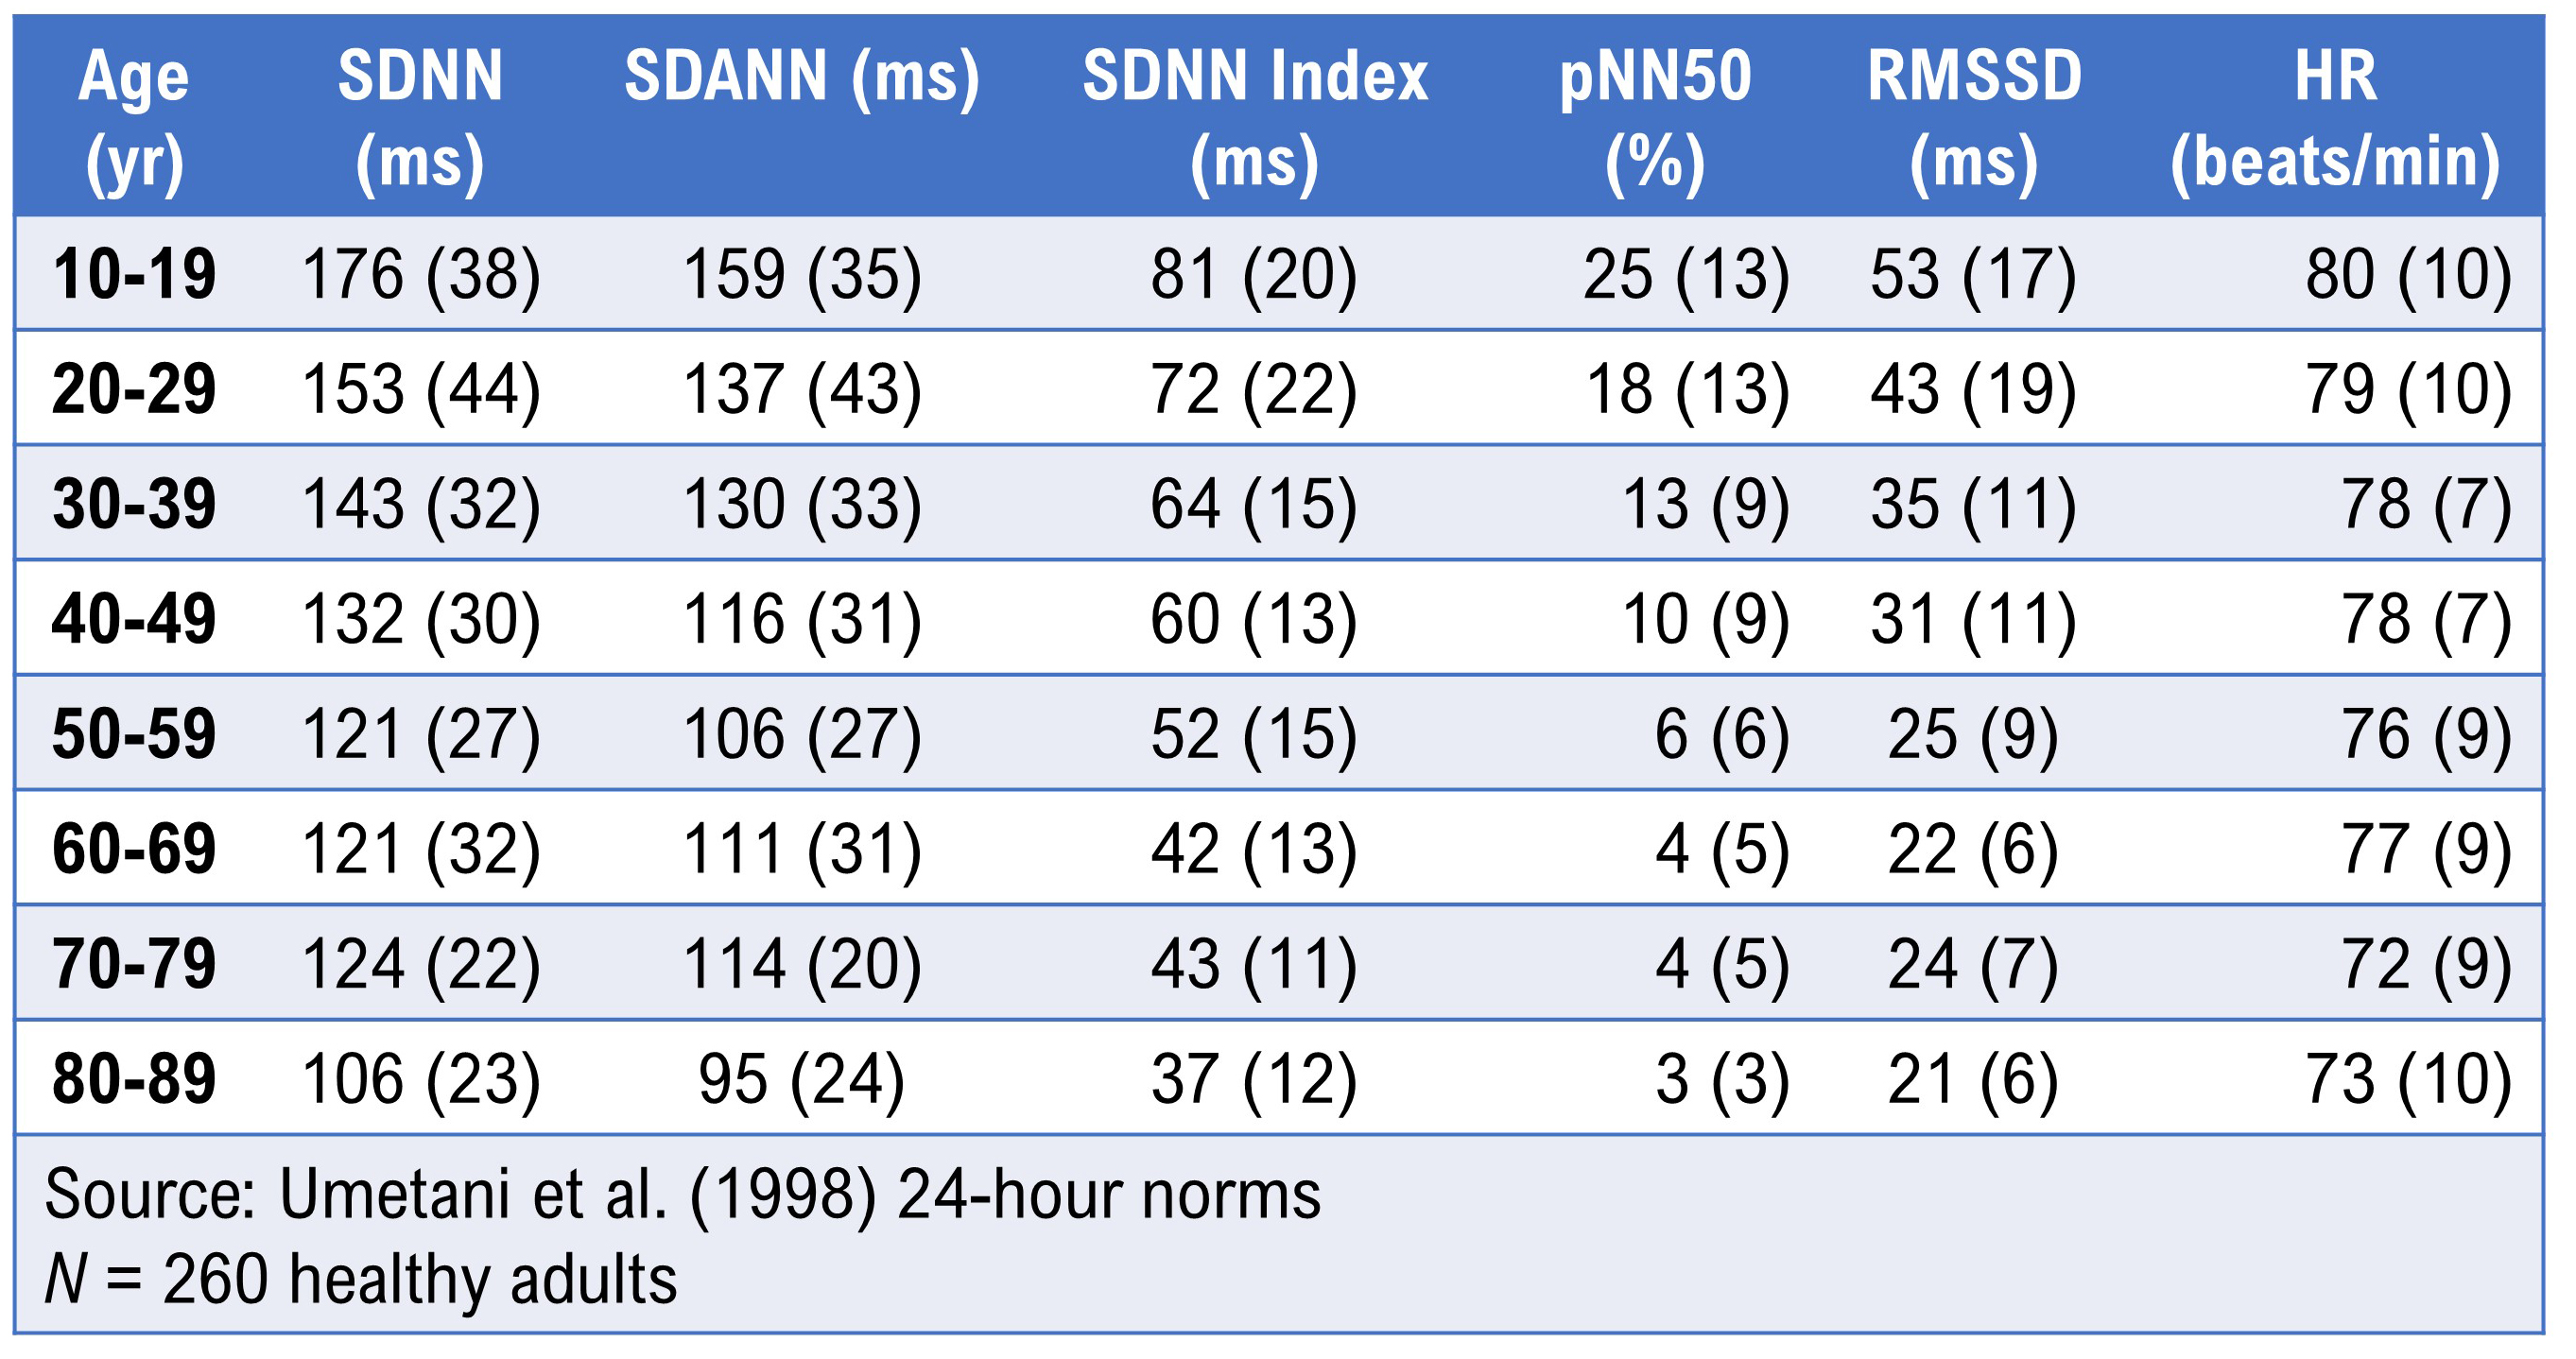
Umetani et al. (1998) published 24-hour norms for 260 healthy participants aged 10 to 99 years old. They reported that several HRV time-domain indices declined with age, and that after age 65, subjects fell below cutoffs associated with increased threat of mortality. Before age 30, female subjects had lower HRV measurements than their male counterparts, but this sex difference vanished after 50 years of age. These age- and sex-specific patterns are especially important for clinicians conducting cardiac risk assessments or designing HRV training protocols for older adults.
Institute of HeartMath Autonomic Assessment Reports
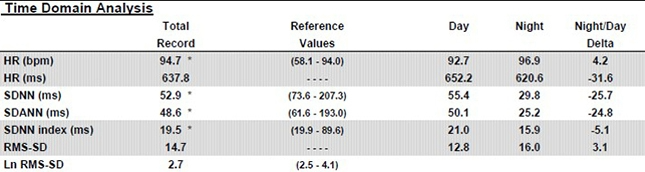
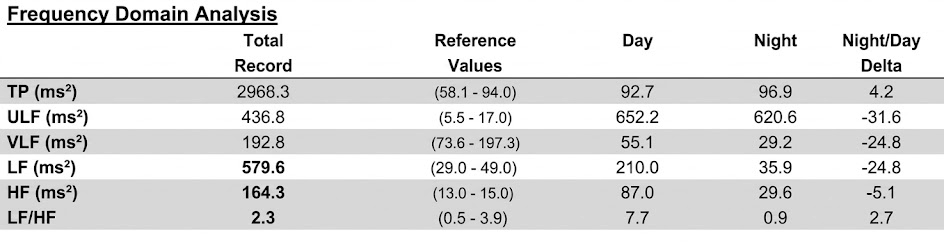
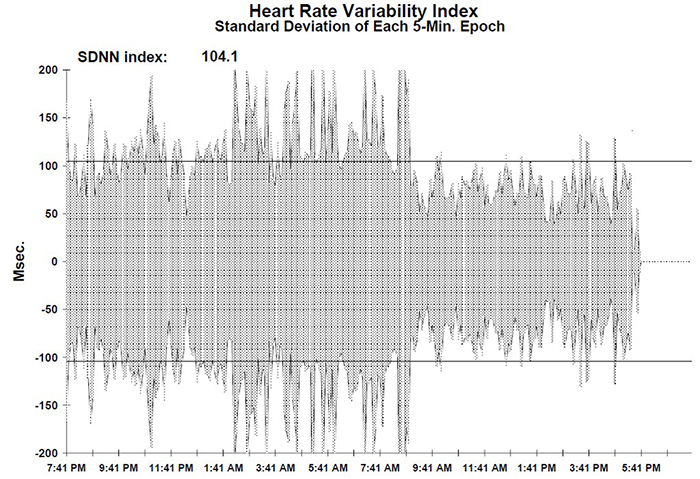
The Institute of HeartMath's Autonomic Assessment Reports evaluate 24-hour recordings using age-related norms, comparing a client's time-domain and normalized frequency-domain measurements to reference values for their age group. In the frequency-domain analysis summary below of a 51-year-old male with elevated heart attack risk, all indices fell significantly below the natural log values for his age. The accompanying 24-hour SDNN index time-domain plot reveals the diminished values in stark visual terms. The graphics below are © Institute of HeartMath.
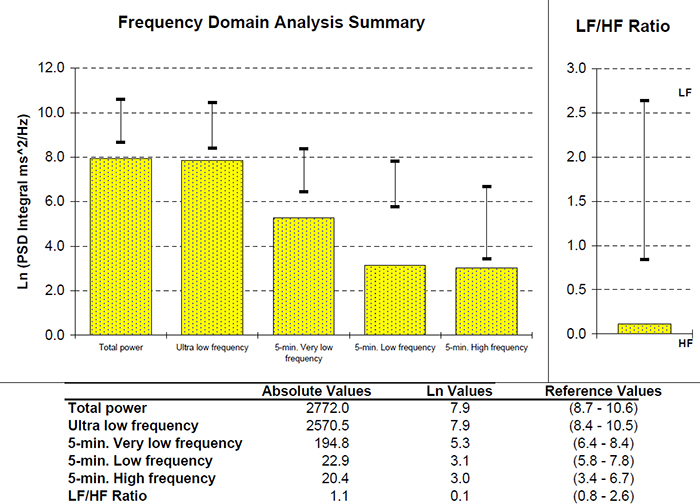

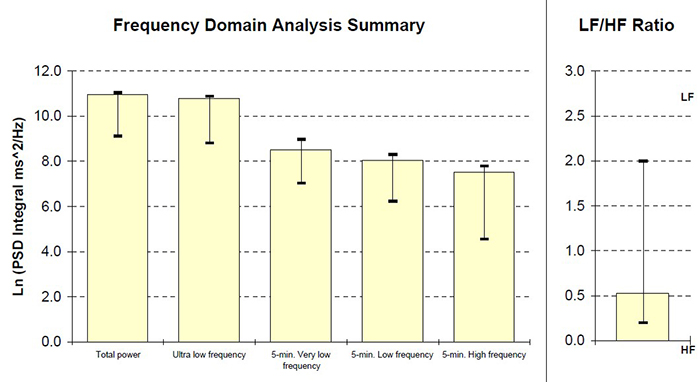
Low VLF power is a particularly important finding because it is associated with elevated heart attack risk (Bernardi et al., 1996). Compare that record with the 24-hour frequency-domain summary and SDNN index plot for a 25-year-old aerobically fit client shown below. The younger, healthier client exhibited greater total power and power in each of the four frequency bands, with an SDNN Index value of 104.1 that eclipsed the older client's SDNN Index of 19.5. These paired case studies illustrate how 24-hour monitoring can reveal clinically actionable differences that brief recordings would miss. Graphics © the Institute of HeartMath.
HRV Values During Baselines and HRV Biofeedback
This section covers what to expect and what to look for during resting baselines, within-session training trials, and across a series of training sessions. Understanding these expected patterns is essential for tracking client progress and troubleshooting when results fall outside normal ranges.
How to Measure HRV
Baseline Values
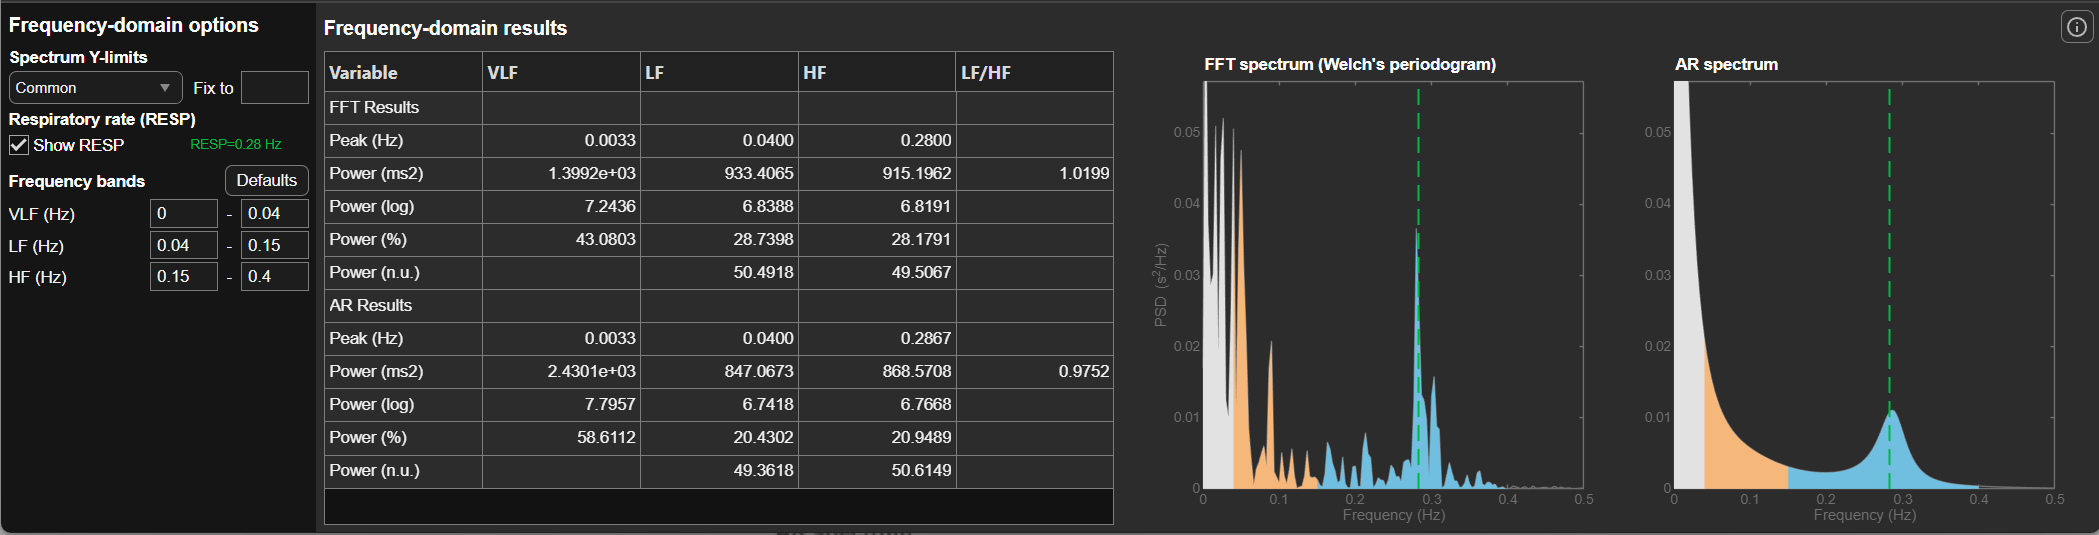
Baselines typically involve 3 to 5 minutes of resting activity without paced breathing (PB) or feedback. Since baseline length can affect HRV values, use identical recording epochs for pre-session and post-session measurements to ensure valid within-session comparisons. During a properly conducted resting baseline, most signal power should fall in the HF band (shown in blue in the figure below) rather than the LF band (sand), because the client is breathing at typical rates above 9 breaths per minute.
A practical tip: distract clients during post-training baselines, for example with reading material or a video, to prevent them from continuing paced breathing (Gevirtz, 2020). If a client keeps breathing slowly during the post-baseline, LF power will remain elevated and you will not get a valid comparison to the pre-baseline.
HRV measurements will be invalid if clients do not breathe at normal rates during baseline recordings.
Comparing Pre-Session to Post-Session Baseline Values
You can compare pre-baseline to post-baseline values within a session to evaluate progress. Look for increases in time-domain measures (HR Max-HR Min and RMSSD), HF power, and total power (VLF+LF+HF). You will only see greater LF power if breathing has slowed below 8 breaths per minute. Look for these same changes when you compare pre-baselines across sessions over the course of treatment, as these changes may reflect learning due to training in the clinic and home practice.
HRV Biofeedback Training Measurements
During active HRV biofeedback training trials, several metrics help you gauge whether the session is proceeding effectively. One important signal to watch for is increased VLF power, which can serve as a "red flag" similar to increased skin conductance level and decreased finger temperature. Greater VLF power during a training session may signal anxiety, excessive effort, or vagal withdrawal. A mindfulness approach that encourages passive volition, where the client allows rather than forces the breathing pattern, can reduce VLF power attributable to these causes.
RSA
Respiratory sinus arrhythmia (RSA), the natural fluctuation of heart rate with breathing, should increase when your clients breathe near their resonance frequency (Vaschillo et al., 2002). Increased RSA immediately "exercises" the baroreflex, which is the reflex mechanism that regulates blood pressure, without initially changing vagal tone or tightening blood pressure regulation. Those deeper physiological changes require weeks of consistent practice. Notably, HRV biofeedback can increase RSA 4 to 10 times compared to a resting baseline (Lehrer et al., 2020b; Vaschillo et al., 2002), making this one of the most dramatic acute effects in biofeedback practice.
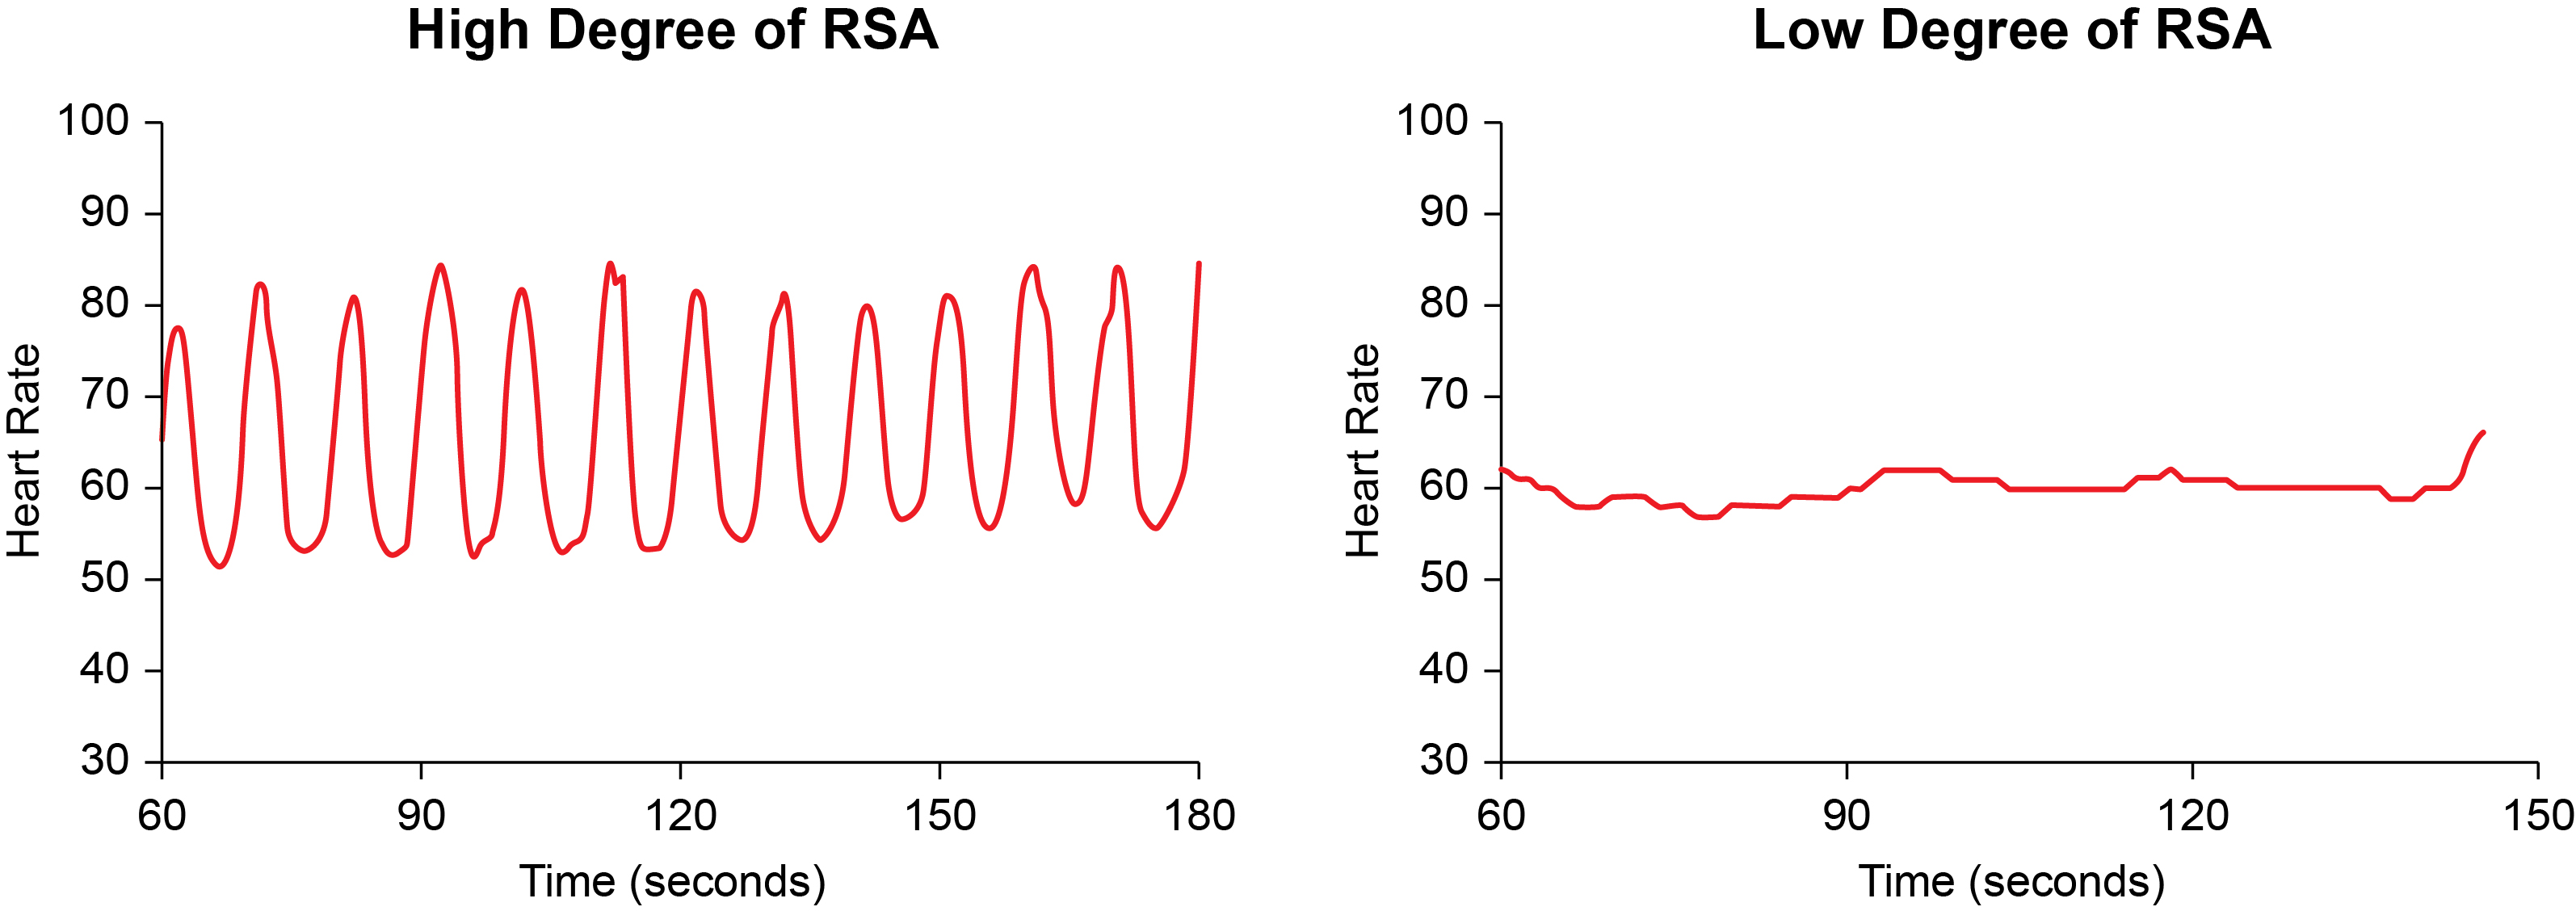
Graphic adapted from Gevirtz et al. (2016).
Time-Domain Measurements
Time-domain metrics such as pNN50, RMSSD, and SDNN should increase from baseline to training trials during each session. They may rise during the first minutes of training and then stabilize throughout the session. If time-domain values decline or fluctuate wildly across a session, this warrants troubleshooting, as the problem may involve breathing mechanics, anxiety, or artifact contamination. Baseline mean time-domain values should also increase across a series of training sessions, reflecting cumulative physiological learning.
A word of caution: HRV time- and frequency-domain values obtained from smartphone apps may be invalid due to their failure to control artifacts. This Real Genius episode was drawn by Dani S@unclebelang.

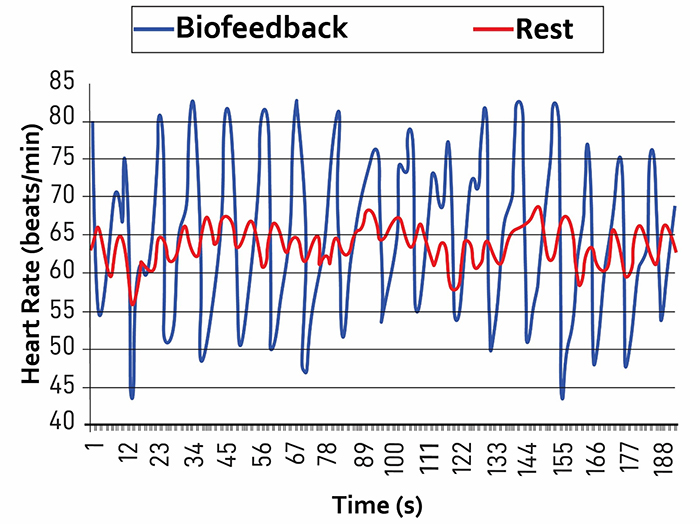
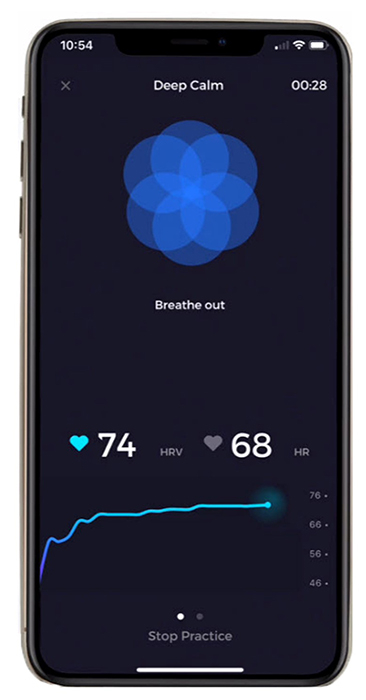
In the Elite HRV screenshot below, the bright blue line shows that LnRMSSD increased across the session. Note the breathing pacer at the top of the screen. Graphic © Elite Academy.
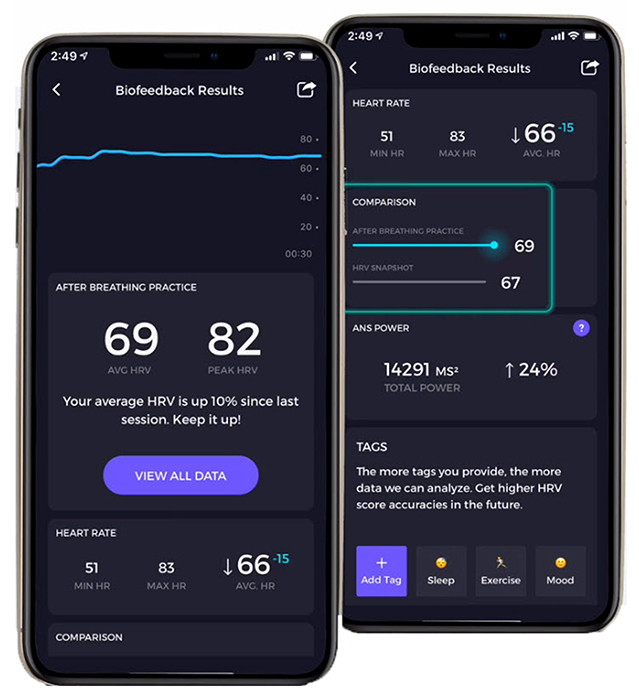
In the following Elite HRV screenshot, the left display shows that the average LnRMSSD increased 10% across sessions. Graphic © Elite Academy.
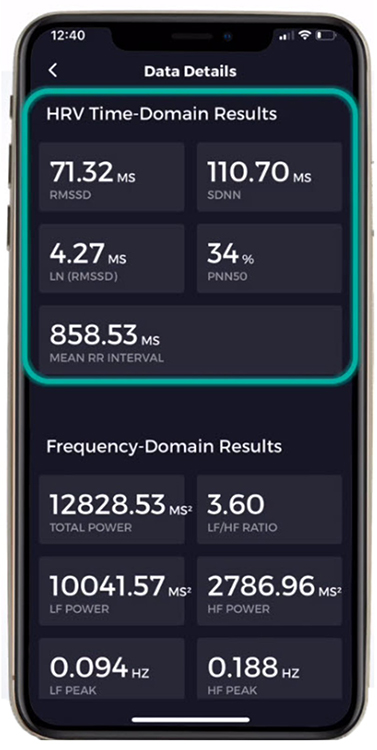
The following Elite HRV screenshot shows the average RMSSD, LnRMSSD, SDNN, pNN50, and interbeat interval duration. Graphic © Elite Academy.
Frequency-Domain Measurements
For healthy clients, high LF power should only appear during paced breathing at or near their resonance frequency. The rest of the time, when they breathe at typical rates, most power should fall in the HF range. A helpful analogy: slow-paced breathing during HRV biofeedback is like weightlifting. You do it during dedicated training sessions, not throughout the entire day. Graphic © pixelheadphoto digital skillet/Shutterstock.com.
.jpg)
Just as athletes confine weightlifting to their workouts, clients do not need to walk around breathing at 6 breaths per minute constantly. They do not have to continuously breathe at their resonance frequency to benefit from improved homeostatic regulation, regulatory capacity, and executive function. In fact, continuous RF breathing would jeopardize homeostasis because breathing rate and volume must adjust to changing physical workloads. The goal is to "exercise" the cardiovascular system during training and let the benefits carry over to everyday life.
HF power should increase across pre-training baselines over the course of training sessions when clients breathe at normal rates, providing evidence that training effects are transferring from the session to resting autonomic function. Graphic © Elite Academy.
Autonomic Changes
Successful HRV biofeedback often produces measurable changes in other autonomic channels beyond HRV itself. Although autonomic change may depend on the training protocol and the client's relationship with the practitioner, successful training may increase hand temperature and reduce skin conductance level (SCL). Zerr et al. (2014) reported that four 30-minute HRVB training sessions lowered SCL from 5.8 μS to 2.3 μS and raised hand temperature from 90.2 to 93.9 °F (32.3 to 34.4 °C) from session 1 to session 4. These peripheral autonomic changes provide convergent evidence that the training is producing genuine shifts in sympathetic-parasympathetic balance.
Frequency-Domain Changes Across a Training Session
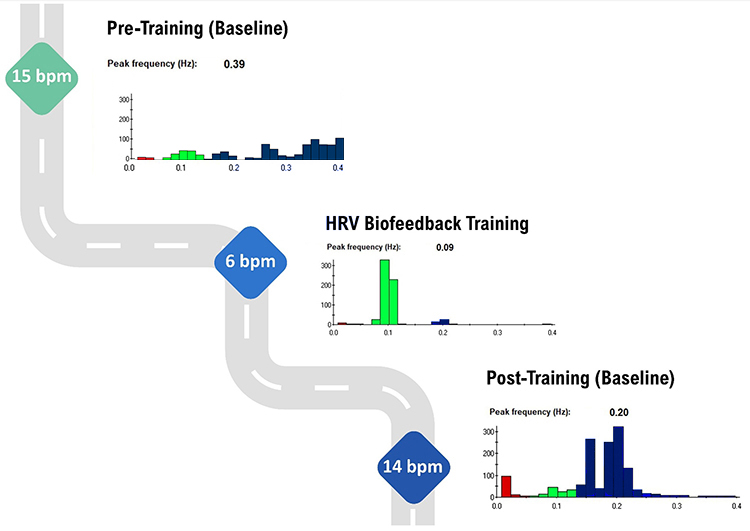
This subsection explains the expected pattern of frequency-domain shifts within a single training session. During pre-training and post-training baselines, the bulk of power should fall in the HF range when the client breathes at typical rates. Only during the active HRV biofeedback training portion, when a client breathes within the resonance frequency range, should most power shift to the LF range. The graphic below illustrates this expected three-phase pattern.
Note the greater LF power concentration post-training than pre-training, during which the client breathed at typical 15 and 14 bpm rates. Graphic © Inna Khazan.
A HRV Biofeedback Koan
One of the most counterintuitive aspects of HRV biofeedback is what might be called the "training koan": we train clients in the LF range to increase HF power at baseline (Khazan, 2021). Practitioners train clients to breathe at 6 bpm or their resonance frequency to increase LF power during the active training portion of the session. However, the cumulative effect of this training is increased HF power during resting baselines, when clients breathe above 9 bpm. It does not increase LF power during baselines because normal breathing at 12 to 14 bpm is faster than the 8.5-bpm upper cutoff of the LF range (Shaffer, McCraty, & Zerr, 2014). This seemingly paradoxical result makes sense when you recognize that the training strengthens vagal tone and baroreflex sensitivity, which manifest as enhanced HF power during spontaneous breathing.
24-Hour Monitoring Values
You can compare 24-hour HRV values obtained before the first training session and after the end of a training course to evaluate overall treatment effectiveness. Successful HRV biofeedback training should increase 24-hour time-domain indices, power within all four frequency bands, and total power. This comprehensive pre-post comparison provides the strongest evidence that training has produced lasting autonomic change.
VLF power should be low during a training session and moderate-to-high during 24-hour monitoring.
This is another apparent paradox that clinicians need to understand. Although we want to avoid increased VLF power during RF biofeedback sessions since this may signal increased sympathetic activity, we want to increase 24-hour VLF values because the VLF rhythm may be fundamental to health (Shaffer, McCraty, & Zerr, 2014). The clinical interpretation of VLF power therefore depends entirely on the context in which it is measured.
Training Outcomes Summary
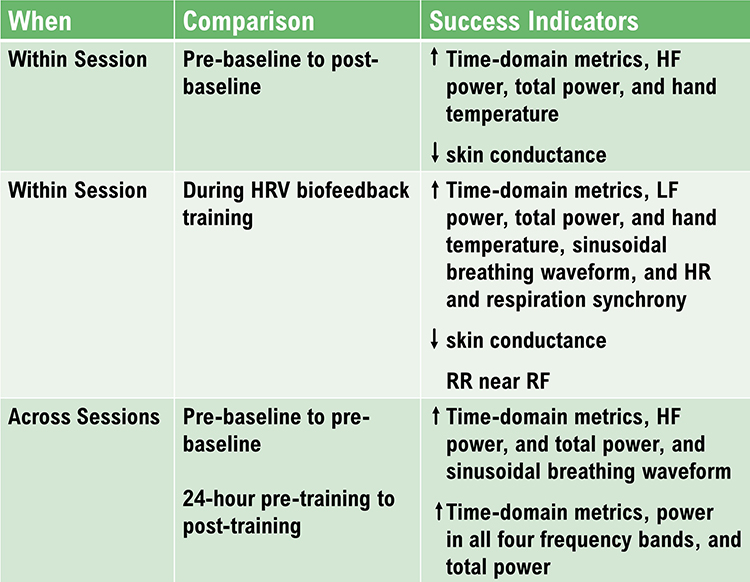
The figure below summarizes the expected training outcomes for HRV biofeedback across baselines, training sessions, and 24-hour monitoring. Use this as a reference when evaluating whether your clients are progressing as expected or when identifying areas that may require protocol adjustments.
Comprehension Questions: Baselines and HRV Biofeedback
- Why should clinicians distract clients during post-training baselines, and what problem does this prevent?
- Explain the "HRV biofeedback koan": why does training in the LF range ultimately increase HF power at baseline?
- What does elevated VLF power during an HRV biofeedback session suggest, and how might a clinician address this?
- Describe the expected pattern of frequency-domain changes across pre-training baseline, training, and post-training baseline within a single session.
Cutting Edge Topics
Wearable Technology and HRV Assessment
Consumer wearable devices like smartwatches and fitness trackers have made HRV monitoring accessible to millions of people outside clinical settings. These devices typically use PPG sensors to estimate HRV metrics such as RMSSD during sleep or brief rest periods. While this democratization of physiological data offers exciting possibilities for preventive health, clinicians should counsel clients about the limitations of consumer-grade measurements, including potential artifacts from movement, poor sensor contact, and proprietary algorithms that may not align with established clinical standards.
Machine Learning Approaches to HRV Interpretation
Researchers are increasingly applying machine learning algorithms to HRV data to improve diagnostic accuracy and predictive capabilities. These approaches can identify nonlinear patterns and complex feature interactions that traditional statistical methods may miss. Promising applications include early detection of cardiac events, automated screening for autonomic disorders, and personalized health risk profiles derived from multi-metric HRV analysis.
Ultra-Short-Term Measurement Standardization
The field is actively working toward standardized UST measurement protocols that would enable valid comparisons across studies and clinical settings. Key challenges include establishing consensus on minimum recording durations for different metrics, agreeing on appropriate statistical methods for equivalence testing, and developing age- and sex-stratified normative databases specifically for UST measurements. Until these standards are established, clinicians should interpret UST values with appropriate caution.
Assignment
Now that you have completed this module, does your clinic use 24-hour monitoring to assess HRV? Does it use age-related norms to interpret HRV measurements?
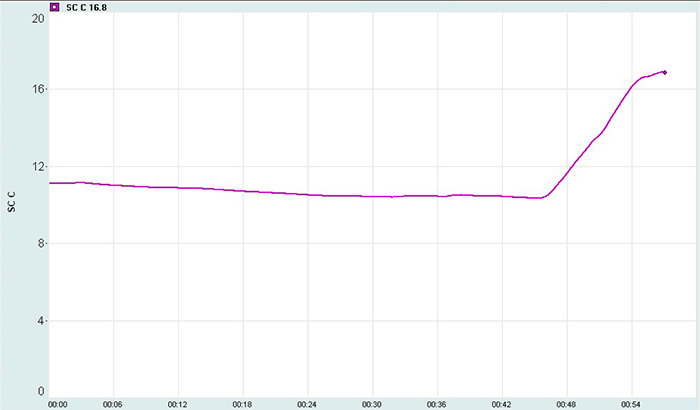
Skin conductance can provide invaluable information about a client's cognitive activity during HRV assessment. The clinician captured this skin conductance response (SCR) as the client began thinking about his mother, who had died 3 months earlier.
Which modalities do you monitor in addition to heart rate and breathing? What do they contribute to your understanding of your clients?
Glossary
absolute power: the magnitude of HRV within a frequency band measured in milliseconds squared divided by cycles per second (ms2/Hz).
approximate entropy (ApEn): a nonlinear index of HRV that measures the regularity and complexity of a time series.
concurrent validity: the degree to which a measurement procedure yields comparable results to an established procedure.
detrended fluctuation analysis (DFA): a nonlinear index of HRV that extracts the correlations between successive R-R intervals over different time scales and yields estimates of short-term (α1) and long-term (α2) fluctuations.
frequency-domain measures of HRV: the calculation of the absolute or relative power of the HRV signal within four frequency bands.
heart rate variability (HRV): the beat-to-beat changes in HR involving changes in the RR intervals between consecutive heartbeats.
high-frequency (HF) band: a HRV frequency range from 0.15-0.40 Hz that represents the inhibition and activation of the vagus nerve by breathing (respiratory sinus arrhythmia).
HR Max - HR Min: an index of heart rate variability that calculates the difference between the highest and lowest heart rates during each respiratory cycle.
HRV triangular index (HTI): a geometric measure based on 24-hour recordings, which calculates the integral of the RR interval histogram's density divided by its height.
interbeat interval (IBI): the time interval between the peaks of successive R-spikes (initial upward deflections in the QRS complex).
low-frequency (LF) band: a HRV frequency range of 0.04-0.15 Hz that may represent the influence of PNS and baroreflex activity (when breathing at the RF).
natural logarithm (Ln): the logarithm to the base e of a numeric value.
normal units (nu): the division of the absolute power for a specific frequency band by the summed absolute power of the LF and HF bands.
pNN50: the percentage of adjacent NN intervals that differ by more than 50 milliseconds.
pulse rate variability (PRV): a proxy of HRV derived from the BVP signal.
quantitative EEG (qEEG): digitized statistical brain mapping using at least a 19-channel montage to measure EEG amplitude within specific frequency bins.
relative power: the percentage of total HRV.
resonance frequency: the frequency at which a system, like the cardiovascular system, can be activated or stimulated.
RMSSD: the square root of the mean squared difference of adjacent NN intervals.
sample entropy (SampEn): a nonlinear index of HRV that was designed to provide a less-biased measure of signal regularity and complexity than ApEn.
SD1: the standard deviation of the distance of each point from the y = x-axis that measures short-term HRV.
SD2: the standard deviation of each point from the y = x + average RR interval that measures short- and long-term HRV.
SD1/SD2: a ratio that measures the unpredictability of the R-R time series and autonomic balance under appropriate monitoring conditions.
SDANN: the standard deviation of the average NN intervals (mean heart rate) for each of the 5-minute segments during a 24-hour recording.
SDNN: the standard deviation of the normal (NN) sinus-initiated IBI measured in milliseconds.
SDNN index: the mean of the standard deviations of all the NN intervals for each 5-minute segment of a 24-hour HRV recording.
spectral analysis: the division of heart rate variability into component rhythms that operate within different frequency bands.
time-domain measures of HRV: indices like SDNN that measure the degree to which the IBIs between successive heartbeats vary.
total power: the sum of power (ms2) in the ULF, VLF, LF, and HF bands for 24-hour recording and the VLF, LF, and HF bands for brief recording.
ultra-low-frequency (ULF) band: an ECG frequency range below 0.003 Hz that may represent very slow biological processes that include circadian rhythms, core body temperature, metabolism, the renin-angiotensin system, and possible PNS and SNS contributions.
ultra-short-term HRV measurements: HRV metrics based on recording periods shorter than 5 minutes.
very-low-frequency (VLF) band: a HRV frequency range of 0.003-0.04 Hz that may represent temperature regulation, plasma renin fluctuations, endothelial and physical activity influences, and possible intrinsic cardiac, PNS, and SNS contributions.
References
Abhishekh, H. A., Nisarga, P., Kisan, R., Meghana, A., Chandran, S., Raju, T., & Satyaprabha, T. N. (2013). Influence of age and gender on autonomic regulation of heart. Journal of Clinical Monitoring and Computing, 27, 259-264. https://doi.org/10.1007/s10877-012-9424-3
Agelink, M., Boz, C., Ullrich, H., & Andrich, J. (2002). Relationship between major depression and heart rate variability. Clinical consequences and implications for antidepressive treatment. Psychiatry Research, 113(1), 139-149. https://doi.org/10.1016/s0165-1781(02)00225-1
Aubert, A. E., Seps, B., & Beckers, F. (2003). Heart rate variability in athletes. Sports Medicine, 33(12), 889-919. https://doi.org/10.2165/00007256-200333120-00003
Baek, H. J., Cho, C. H., Cho, J., & Woo, J. M. (2015). Reliability of ultra-short-term analysis as a surrogate of standard 5-min analysis of heart rate variability. Telemedicine and e-Health, 21(5), 404-414. https://doi.org/10.1089/tmj.2014.0104
Berkoff, D. J., Cairns, C. B., Sanchez, L. D., & Moorman, C. T. (2007). Heart rate variability in elite American track-and-field athletes. Journal of Strength and Conditioning Research, 21(1), 227-231. https://doi.org/10.1519/00124278-200702000-00041
Bernardi, L., Valle, F., Coco, M., Calciati, A., & Sleight, P. (1996). Physical activity influences heart rate variability and very-low-frequency components in Holter electrocardiograms. Cardiovascular Research, 32(2), 234-237. https://doi.org/10.1016/0008-6363(96)00081-8
Bigger, J. T., Fleiss, J. L., Rolnitzky, L. M., & Steinman, R. C. (1993). The ability of several short-term measures of RR variability to predict mortality after myocardial infarction. Circulation, 88(3), 927-934. https://doi.org/10.1161/01.CIR.88.3.927
De Meersman, R. E. (1993). Heart rate variability and aerobic fitness. American Heart Journal, 125(3), 726-731. https://doi.org/10.1016/0002-8703(93)90164-5
Gevirtz, R. N. (2017). Cardio-respiratory psychophysiology: Gateway to mind-body medicine.
Hämmerle, P., Eick, C., Blum, S., Schlageter, V., Bauer, A., Rizas, K. D., Eken, C., Coslovsky, M., Aeschbacher, S., Krisai, P., Meyre, P., Vesin, J.-M., Rodondi, N., Moutzouri, E., Beer, J., Moschovitis, G., Kobza, R., Di Valentino, M., Corino, V. D. A., . . . Swiss-AF Study Investigators (2020). Heart rate variability triangular index as a predictor of cardiovascular mortality in patients with atrial fibrillation. Journal of the American Heart Association, 9(15). https://doi.org/10.1161/JAHA.120.016075
Jeyhani, V., Mahdiani, S., Peltokangas, M., & Vehkaoja, A. (2015). Comparison of HRV parameters derived from photoplethysmography and electrocardiography signals. Conference Proceedings of the IEEE Engineering in Medicine and Biology Society, 2015, 5952-5955. https://doi.org/10.1109/EMBC.2015.7319747
Khazan, I. Z. (2022). HRV biofeedback bootcamp [Workshop]. Association for Applied Psychophysiology and Biofeedback.
Khazan, I. Z., & Shaffer, F. (2019). Practical strategies for teaching your clients to breathe [Conference presentation]. Association for Applied Psychophysiology and Biofeedback 50th Annual Meeting, Denver, CO.
Lehrer, P. M., Vaschillo, E., & Vaschillo, B. (2000). Resonant frequency biofeedback training to increase cardiac variability: Rationale and manual for training. Applied Psychophysiology and Biofeedback, 25(3), 177-191. https://doi.org/10.1023/a:1009554825745
McNames, J., & Aboy, M. (2006). Reliability and accuracy of heart rate variability metrics versus ECG segment duration. Medical and Biological Engineering and Computing, 44(9), 747-756. https://doi.org/10.1007/s11517-006-0097-2
Nunan, D., Sandercock, G. R. H., & Brodie, D. A. (2010). A quantitative systematic review of normal values for short-term heart rate variability in healthy adults. Pacing and Clinical Electrophysiology, 33(11), 1407-1417. https://doi.org/10.1111/j.1540-8159.2010.02841.x
Nussinovitch, U., Elishkevitz, K. P., Nussinovitch, M., Segev, S., Volovitz, B., & Nussinovitch, N. (2011). Reliability of ultra-short ECG indices for heart rate variability. Annals of Noninvasive Electrocardiology, 16(2), 117-122. https://doi.org/10.1111/j.1542-474X.2011.00417.x
Salahuddin, L., Cho, J., Jeong, M. G., & Kim, D. (2007). Ultra short term analysis of heart rate variability for monitoring mental stress in mobile settings. Conference Proceedings of the IEEE Engineering in Medicine and Biology Society, 2007, 4656-4659. https://doi.org/10.1109/iembs.2007.4353378
Shaffer, F. (in press). HRV metrics and norms. In D. Moss & F. Shaffer (Eds.), Physiological recording technology in biofeedback and neurofeedback. Association for Applied Psychophysiology and Biofeedback.
Shaffer, F., McCraty, R., & Zerr, C. L. (2014). A healthy heart is not a metronome: An integrative review of the heart's anatomy and heart rate variability. Frontiers in Psychology, 5, Article 1040. https://doi.org/10.3389/fpsyg.2014.01040
Shaffer, F., Shearman, S., & Meehan, Z. M. (2016). The promise of ultra-short-term (UST) heart rate variability measurements. Biofeedback, 44, 229-233. https://doi.org/10.5298/1081-5937-44.3.09
Task Force of the European Society of Cardiology and the North American Society of Pacing and Electrophysiology (1996). Heart rate variability: Standards of measurement, physiological interpretation, and clinical use. Circulation, 93(5), 1043-1065. https://doi.org/10.1161/01.CIR.93.5.1043
Umetani, K., Singer, D. H., McCraty, R., & Atkinson, M. (1998). Twenty-four hour time domain heart rate variability and heart rate: Relations to age and gender over nine decades. Journal of the American College of Cardiology, 31(2), 593-601. https://doi.org/10.1016/s0735-1097(97)00554-8
Urban, H., Gravett, N., Pecoraro, J., & Shaffer, F. (2019). Updated heart rate variability norms for healthy undergraduates [Conference presentation]. Association for Applied Psychophysiology and Biofeedback Annual Meeting, Denver, CO.
Vaschillo, E., Lehrer, P., Rishe, N., & Konstantinov, M. (2002). Heart rate variability biofeedback as a method for assessing baroreflex function: A preliminary study of resonance in the cardiovascular system. Applied Psychophysiology and Biofeedback, 27, 1-27. https://doi.org/10.1023/a:1014587304314
Zerr, C., Kane, A., Vodopest, T., Allen, J., Fluty, E., Gregory, J., DeBold, M., Schultz, D., Robinson, G., Golan, R., Hannan, J., Bowers, S., Cangelosi, A., Korenfeld, D., Jones, D., Shepherd, S., Burklund, Z., Spaulding, K., Hoffman, W., & Shaffer, F. (2014). HRV biofeedback training raises temperature and lowers skin conductance. Applied Psychophysiology and Biofeedback, 39(3), 299. https://doi.org/10.1007/s10484-014-92549
Return to Top