
Abnormal EEG Waveforms and Rhythms
What You Will Learn in This Chapter
Some of the most consequential findings in an EEG are the ones that never make it into the report. A pattern of intermittent spikes in a child referred for inattention, a diffuse slowing in an adult labeled treatment-resistant, a run of spindle-shaped beta in someone who reacts badly to every medication they are given: each of these points to a mechanism, and each changes what you should do next. Learning to name them is the first step toward acting on them.
This unit surveys the abnormal patterns you will meet in clinical records. You will study abnormal slow activity in its generalized, focal, and persistent forms, the paroxysmal epileptogenic abnormalities including interictal and ictal discharges and secondary bilateral synchrony, and the epileptiform patterns of doubtful significance that look alarming but are not. You will also examine the abnormal periodic paroxysmal patterns, the generally benign activity that imitates them, and the descriptive vocabulary in which findings are reported, and you will work through three EEG biomarkers in depth: diffuse slowing as a marker of encephalopathy, intermittent epileptiform discharges as a marker of cortical hyperexcitability, and spindling excessive beta as a marker of cortical hyperarousal.
IQCB Blueprint Coverage: This unit addresses Abnormal EEG Waveforms and Rhythms (IV.E) within EEG (IV), and supports Normal Waveform Patterns (IV.C).
Learning Objectives
After completing this section, you will be able to:
Distinguish generalized intermittent slow activity, focal and lateralized intermittent slow activity, and persistent slow activity.
Describe interictal and ictal epileptiform discharges and identify secondary bilateral synchrony.
Recognize the epileptiform patterns of doubtful significance and explain why each is benign.
Compare generalized and lateralized periodic paroxysmal patterns.
Distinguish POSTS and SREDA from the abnormalities they imitate.
Describe amplitude and duration on the American Clinical Neurophysiology Society scales, and recognize which older acronyms name the same pattern under a newer label.
Explain how diffuse slowing signals encephalopathy and what its topographic distribution tells you about symptoms.
Describe the prevalence and clinical significance of intermittent epileptiform discharges in psychiatric and neurodevelopmental populations.
Identify spindling excessive beta and distinguish it from physiologic beta activity.
Listen to the Full-Length Lecture
EEG Patterns of Concern and Generally Benign Patterns
Abnormal EEG patterns include abnormal slow activity, paroxysmal epileptogenic abnormalities, and abnormal periodic paroxysmal patterns.
Abnormal Slow Activity
Abnormal slow activity includes generalized intermittent slow activity, focal and lateralized intermittent slow activity, and persistent slow activity.
Generalized intermittent slow activity is asynchronous, under 8 Hz, and involves the majority or all of both hemispheres. These bursts typically consist of polymorphic delta (Benbadis & Rielo, 2018). Alerting and opening the eyes reduce, whereas hyperventilation challenge and relaxation increase these slow waves (Fisch, 1999).
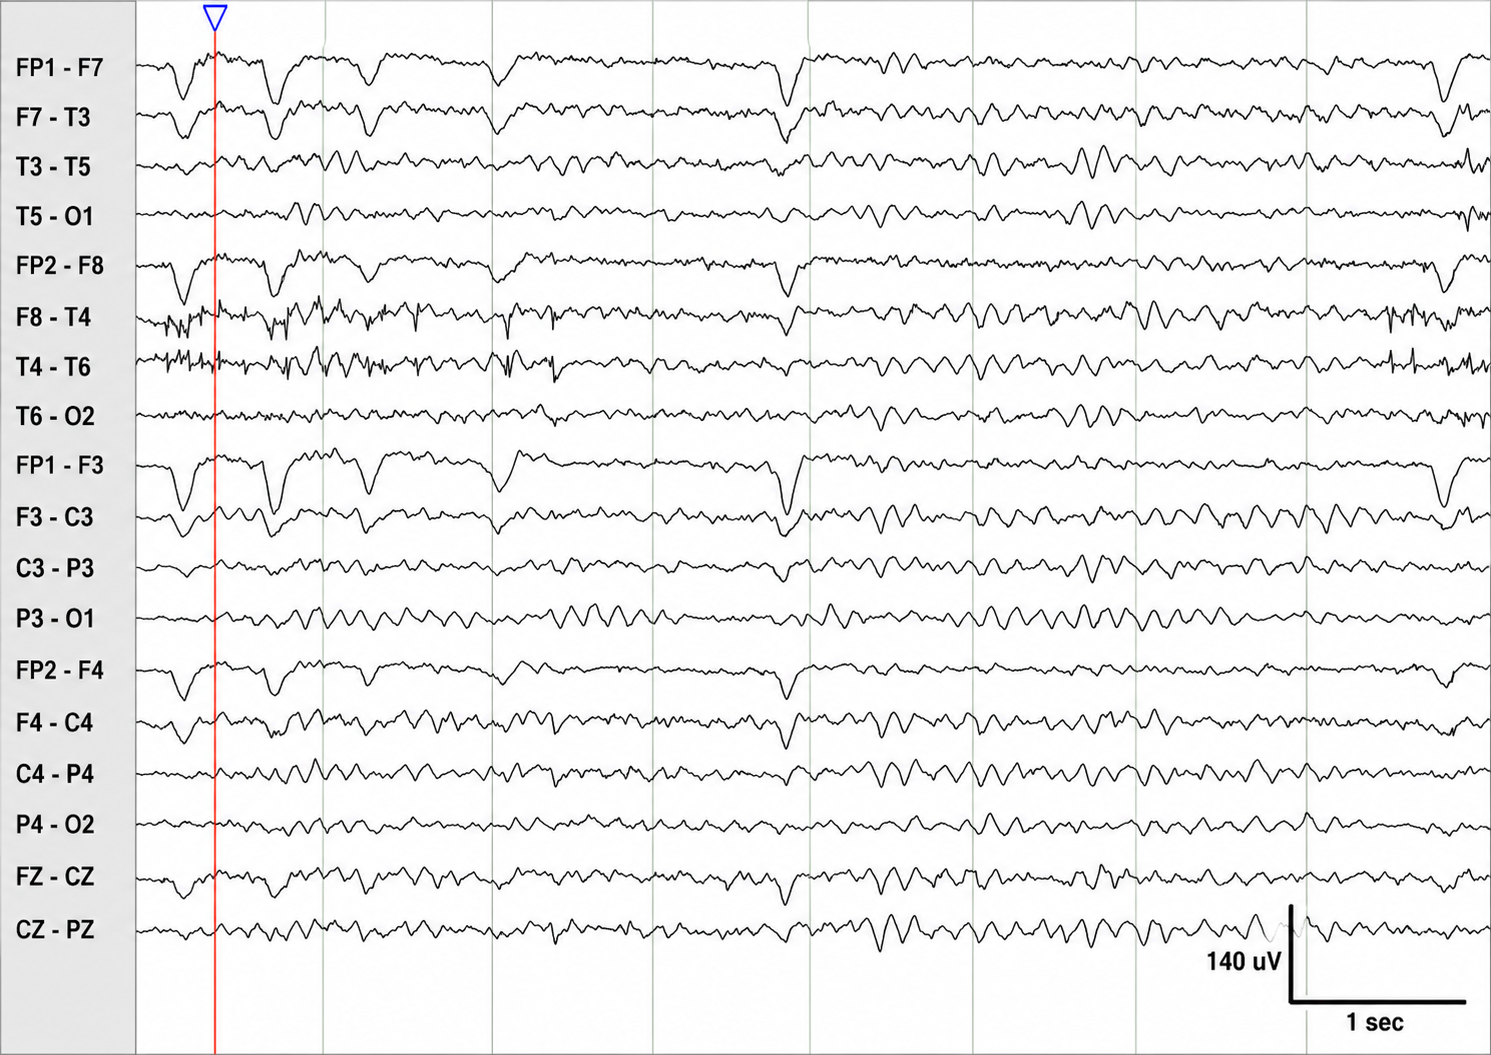
Graphic © Medscape.
Focal and lateralized intermittent slow activity is under 8 Hz and is usually confined to a single or a couple of adjacent electrodes. These bursts have an irregular appearance, are composed of several frequencies, and rarely involve an entire hemisphere (Fisch, 1999).
Graphic © eegatlas-online.com.
Persistent slow activity consists of theta and delta waveforms. Distribution may be anterior or widespread in encephalopathies (Richardson & Benbadis, 2019).
Graphic © Medscape.
Paroxysmal Epileptogenic Abnormalities
Paroxysmal epileptogenic abnormalities include interictal epileptiform discharges (focal, generalized), ictal, secondary bilateral synchrony, and epileptiform patterns of doubtful significance.
Interictal epileptiform discharges typically consist of individual spikes and sharp waves and complexes that contain both waveforms that last less than 2 seconds (Fisch, 1999).
Graphic courtesy of Teppei Matsubara.
Ictal epileptiform discharges may consist of prolonged interictal activity. These may include 3-Hz spike-and-wave discharges, slow spike-and-wave discharges, sharp-and-slow-wave discharges, amplitude and frequency fluctuations in rhythms of 10 Hz or higher, and irregular multiple spike-and-wave or spike-and-wave discharges (Fisch, 1999).
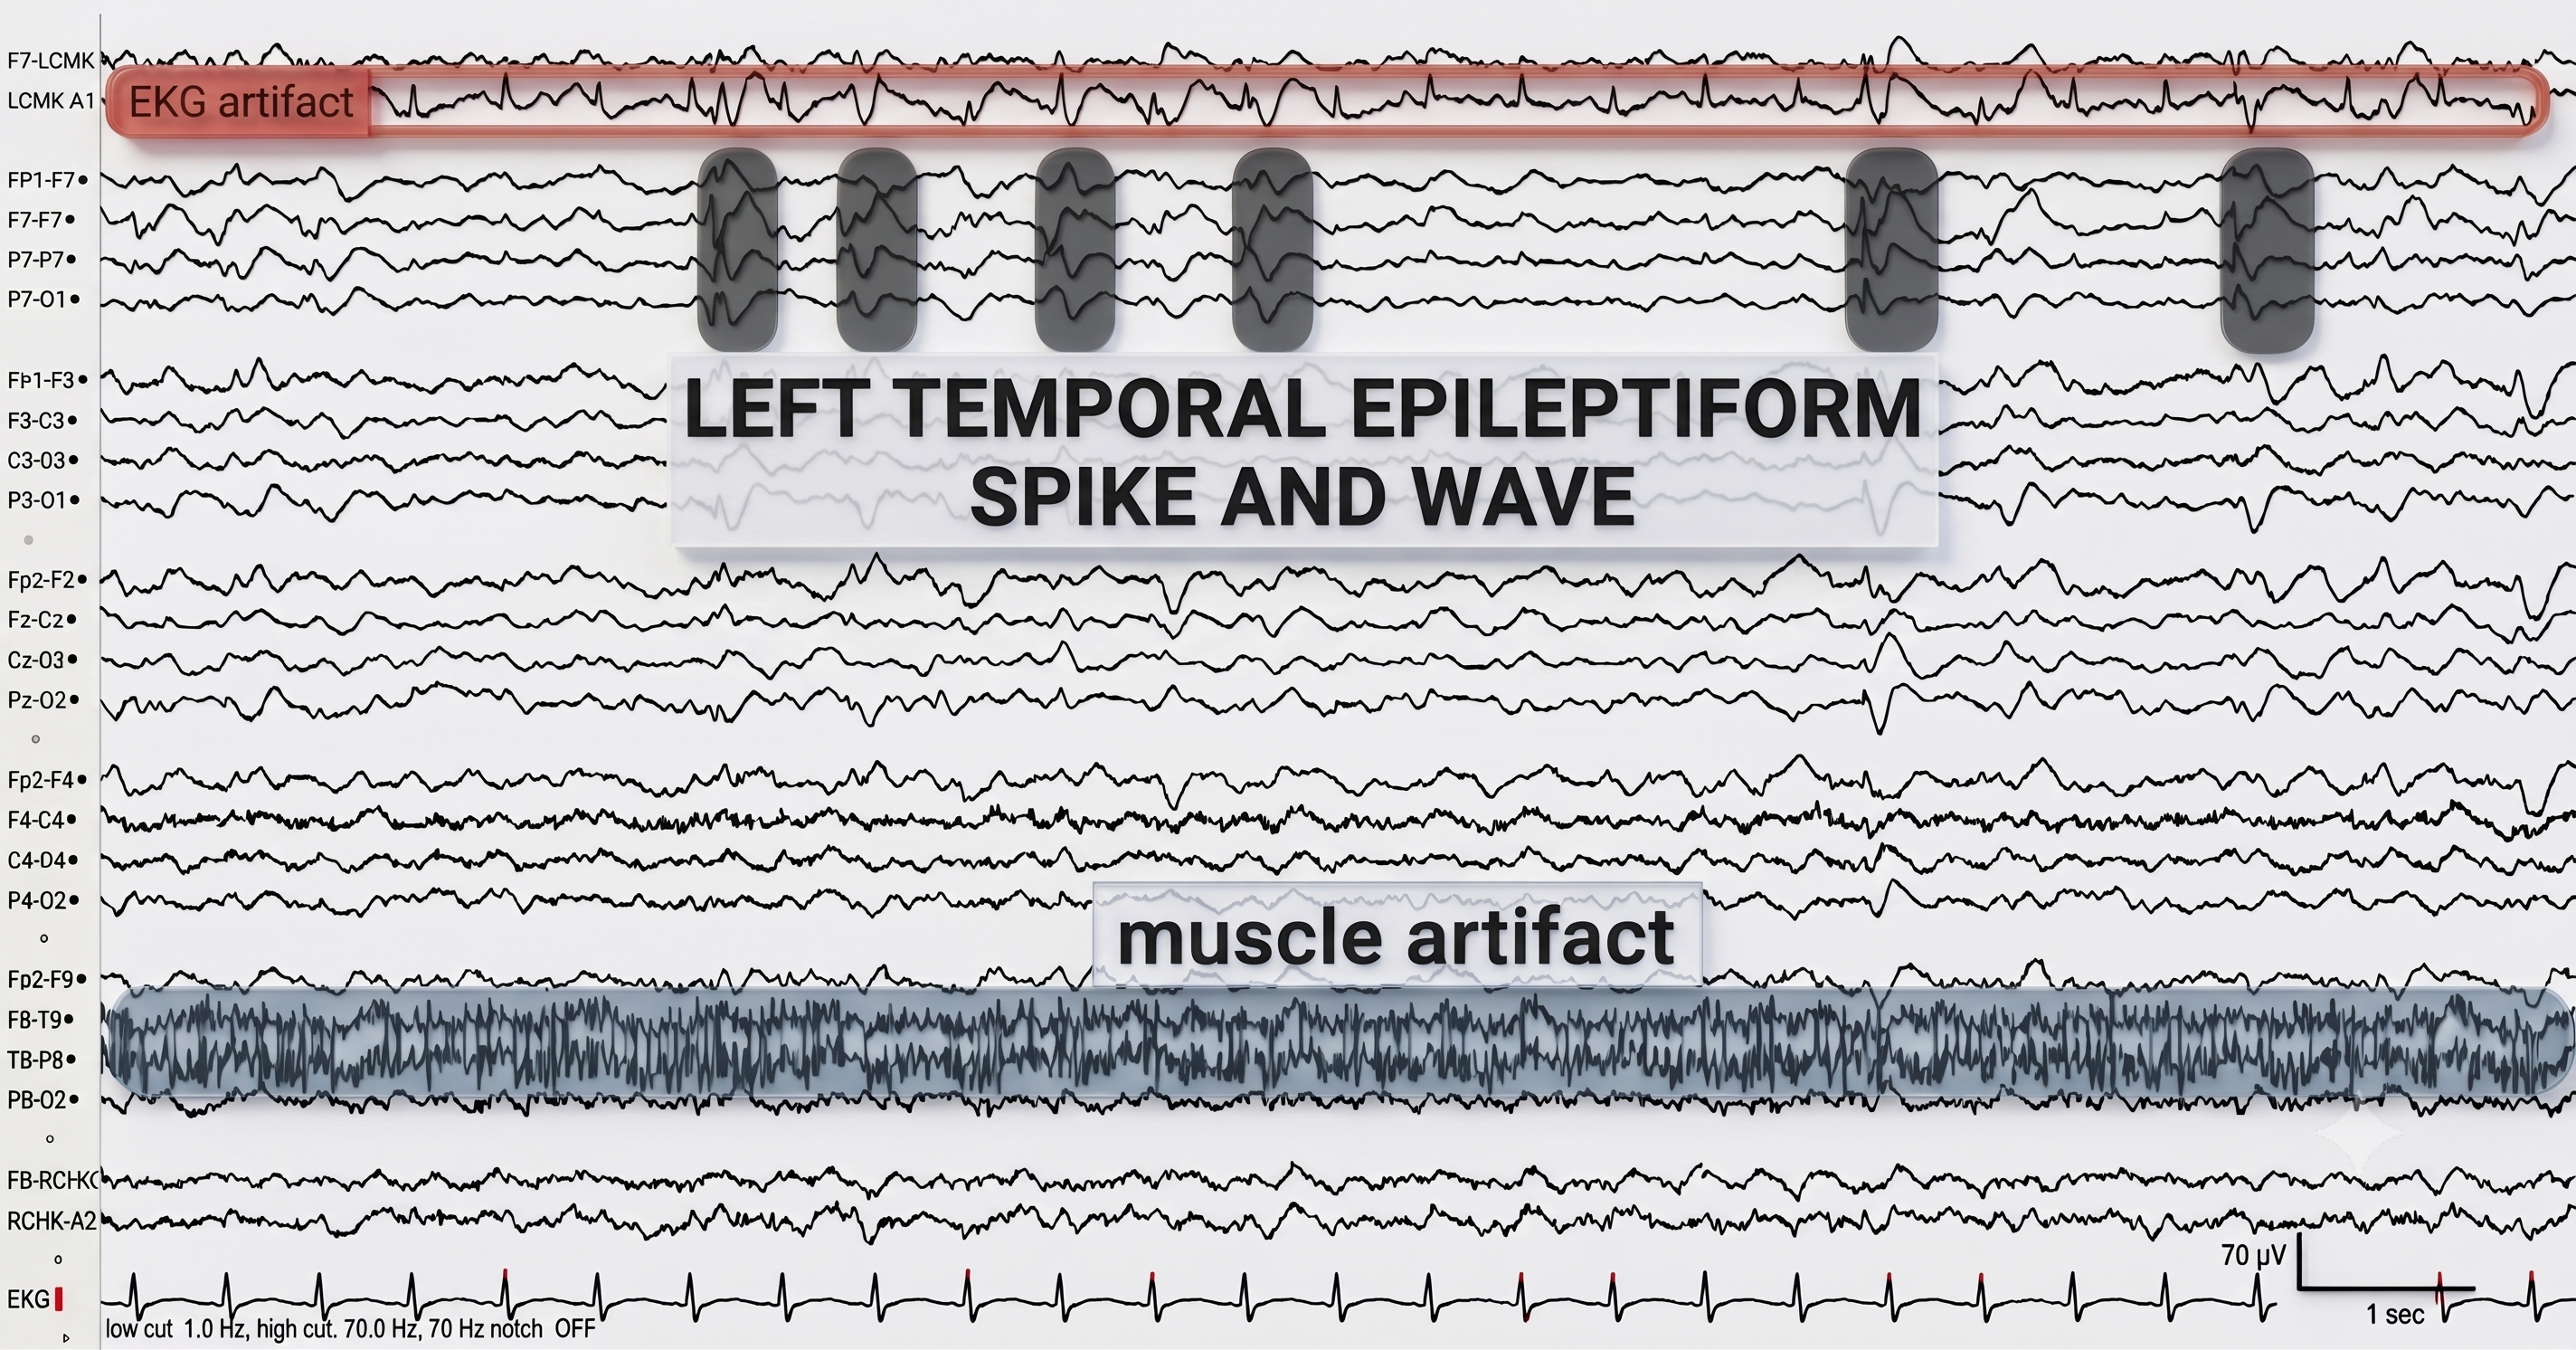
Graphic © eegatlas-online.com.
Secondary bilateral synchrony (SBS) involves spikes with a single phase reversal around the midline (Jin, 2007).
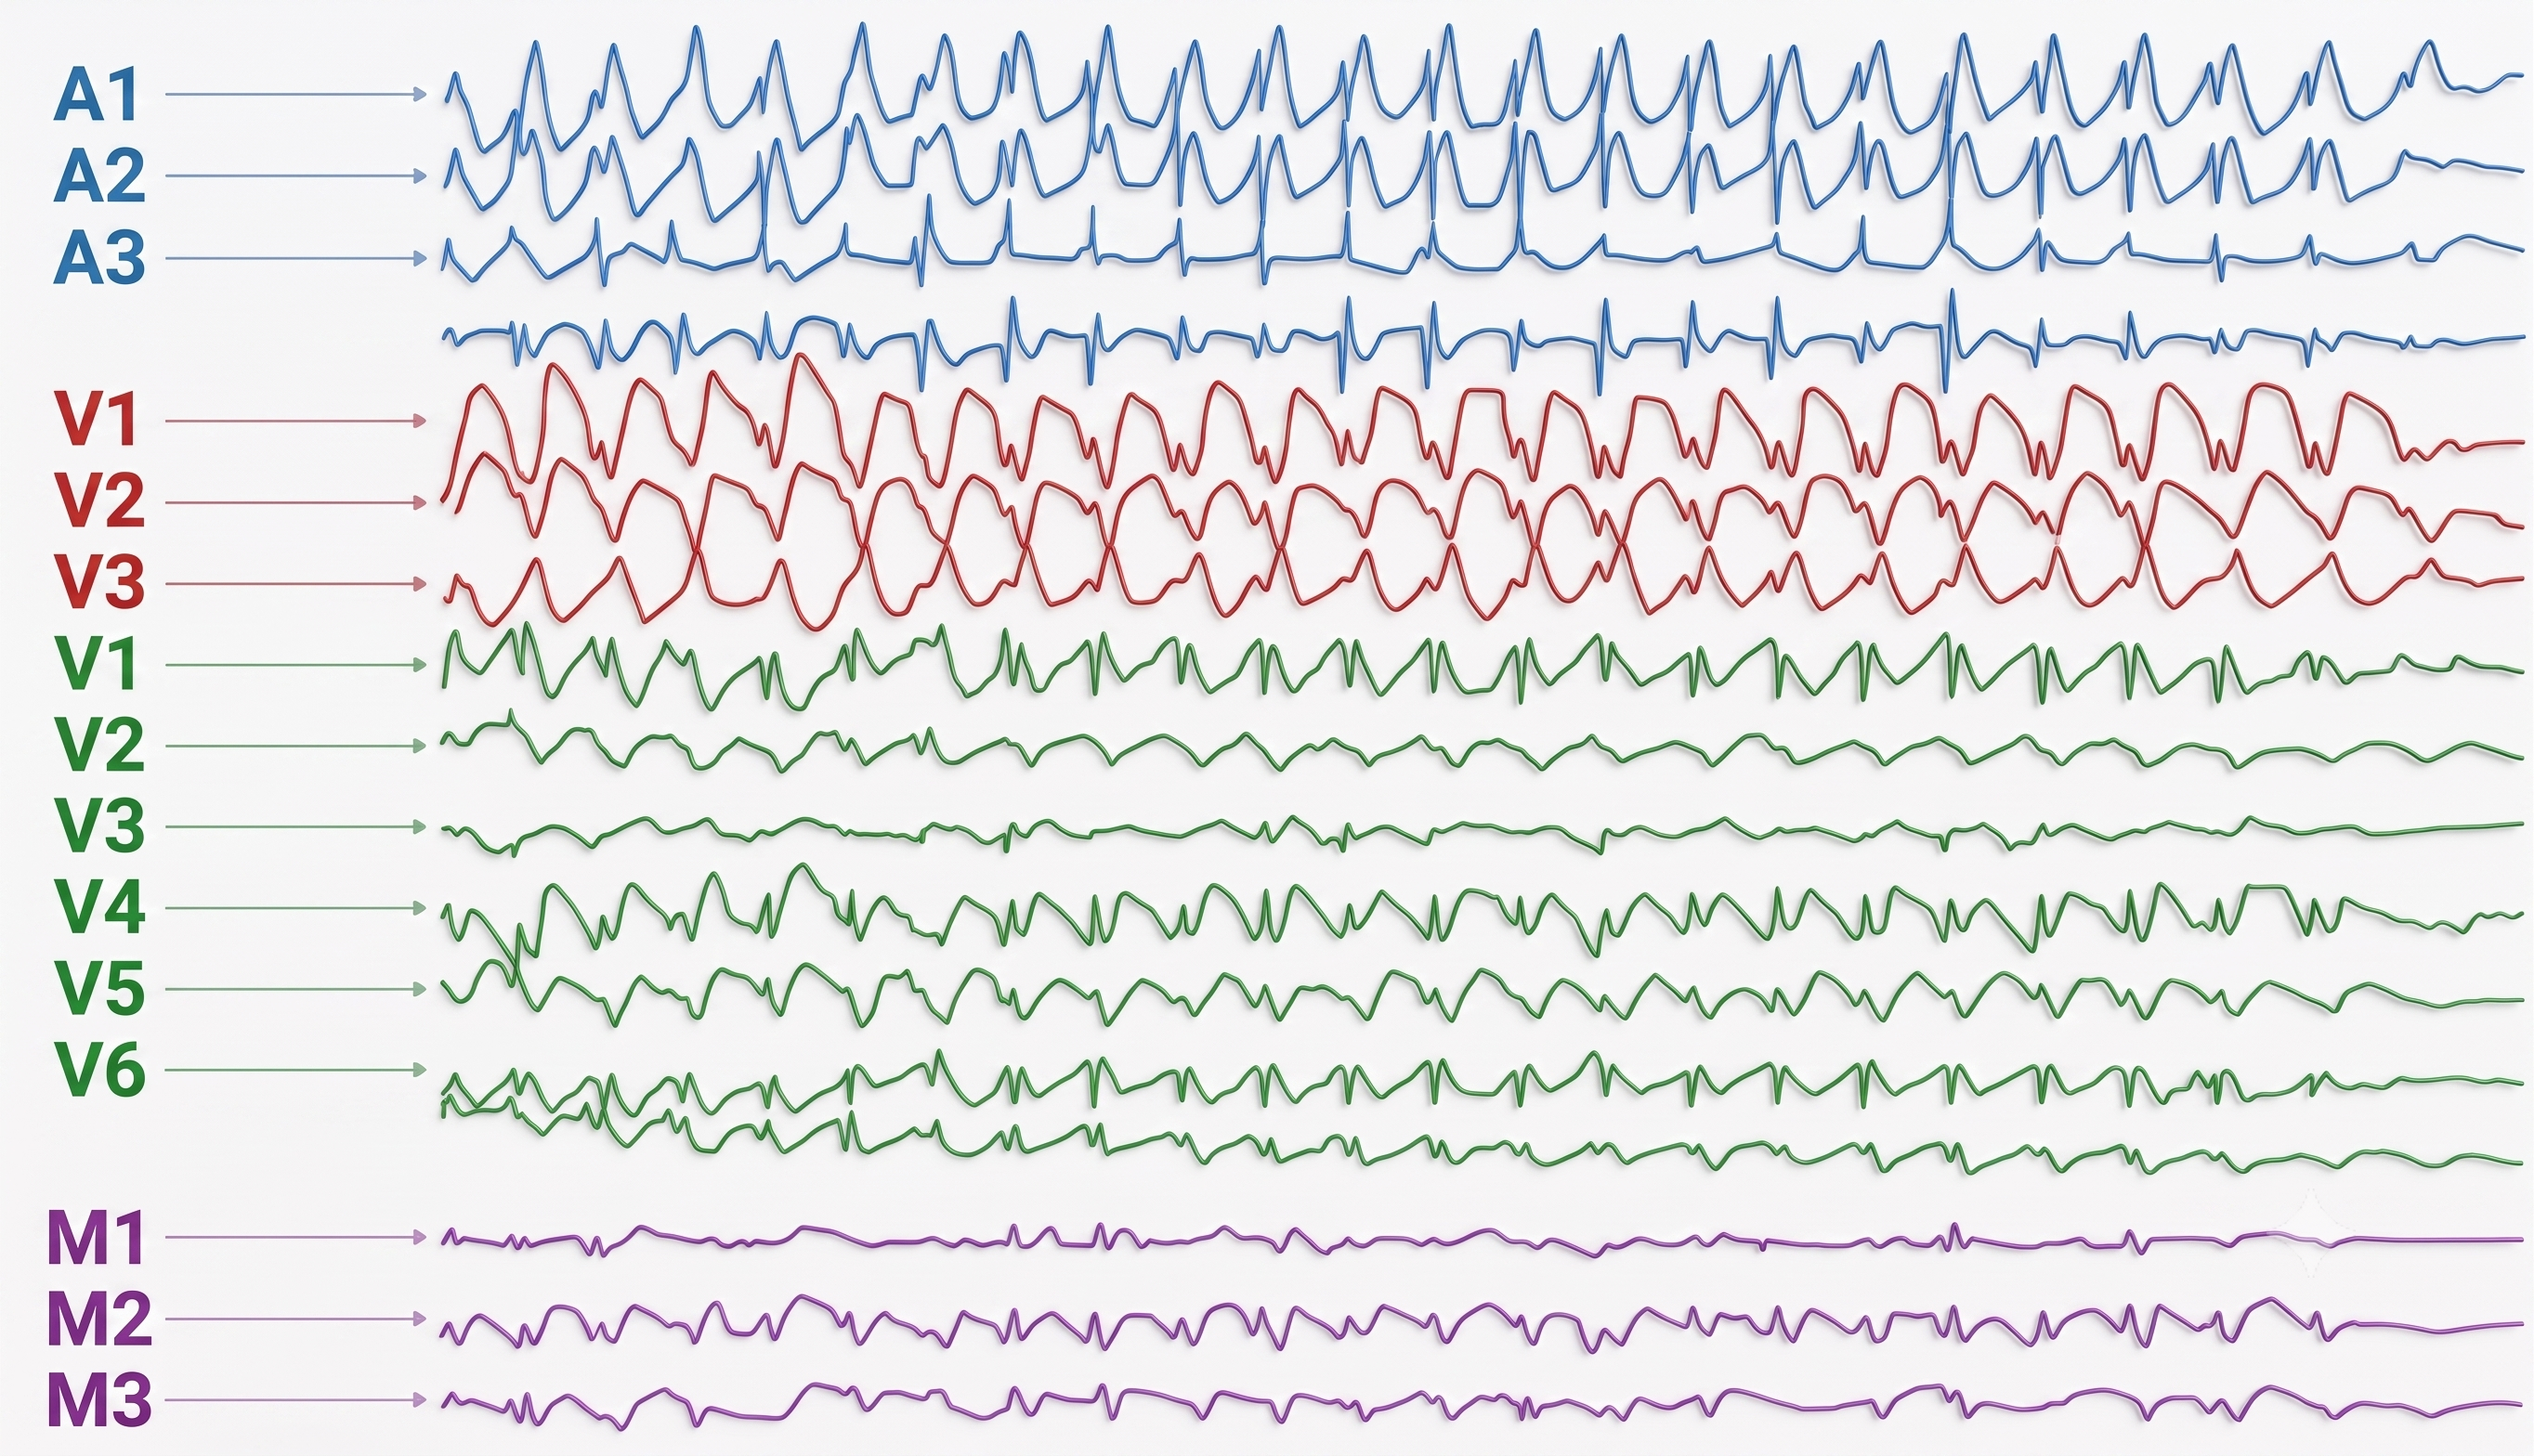
Graphic © Neurology Asia.
Epileptogenic patterns of doubtful significance are brief and not associated with seizures or neurological disorders. Examples are 6-Hz spike-and-slow-wave, 14- and 16-Hz positive bursts, benign epileptiform transients of sleep (BETS), rhythmical mid-temporal discharge (RMTD), small sharp spikes (SSS), and wicket spikes (Fisch, 1999).
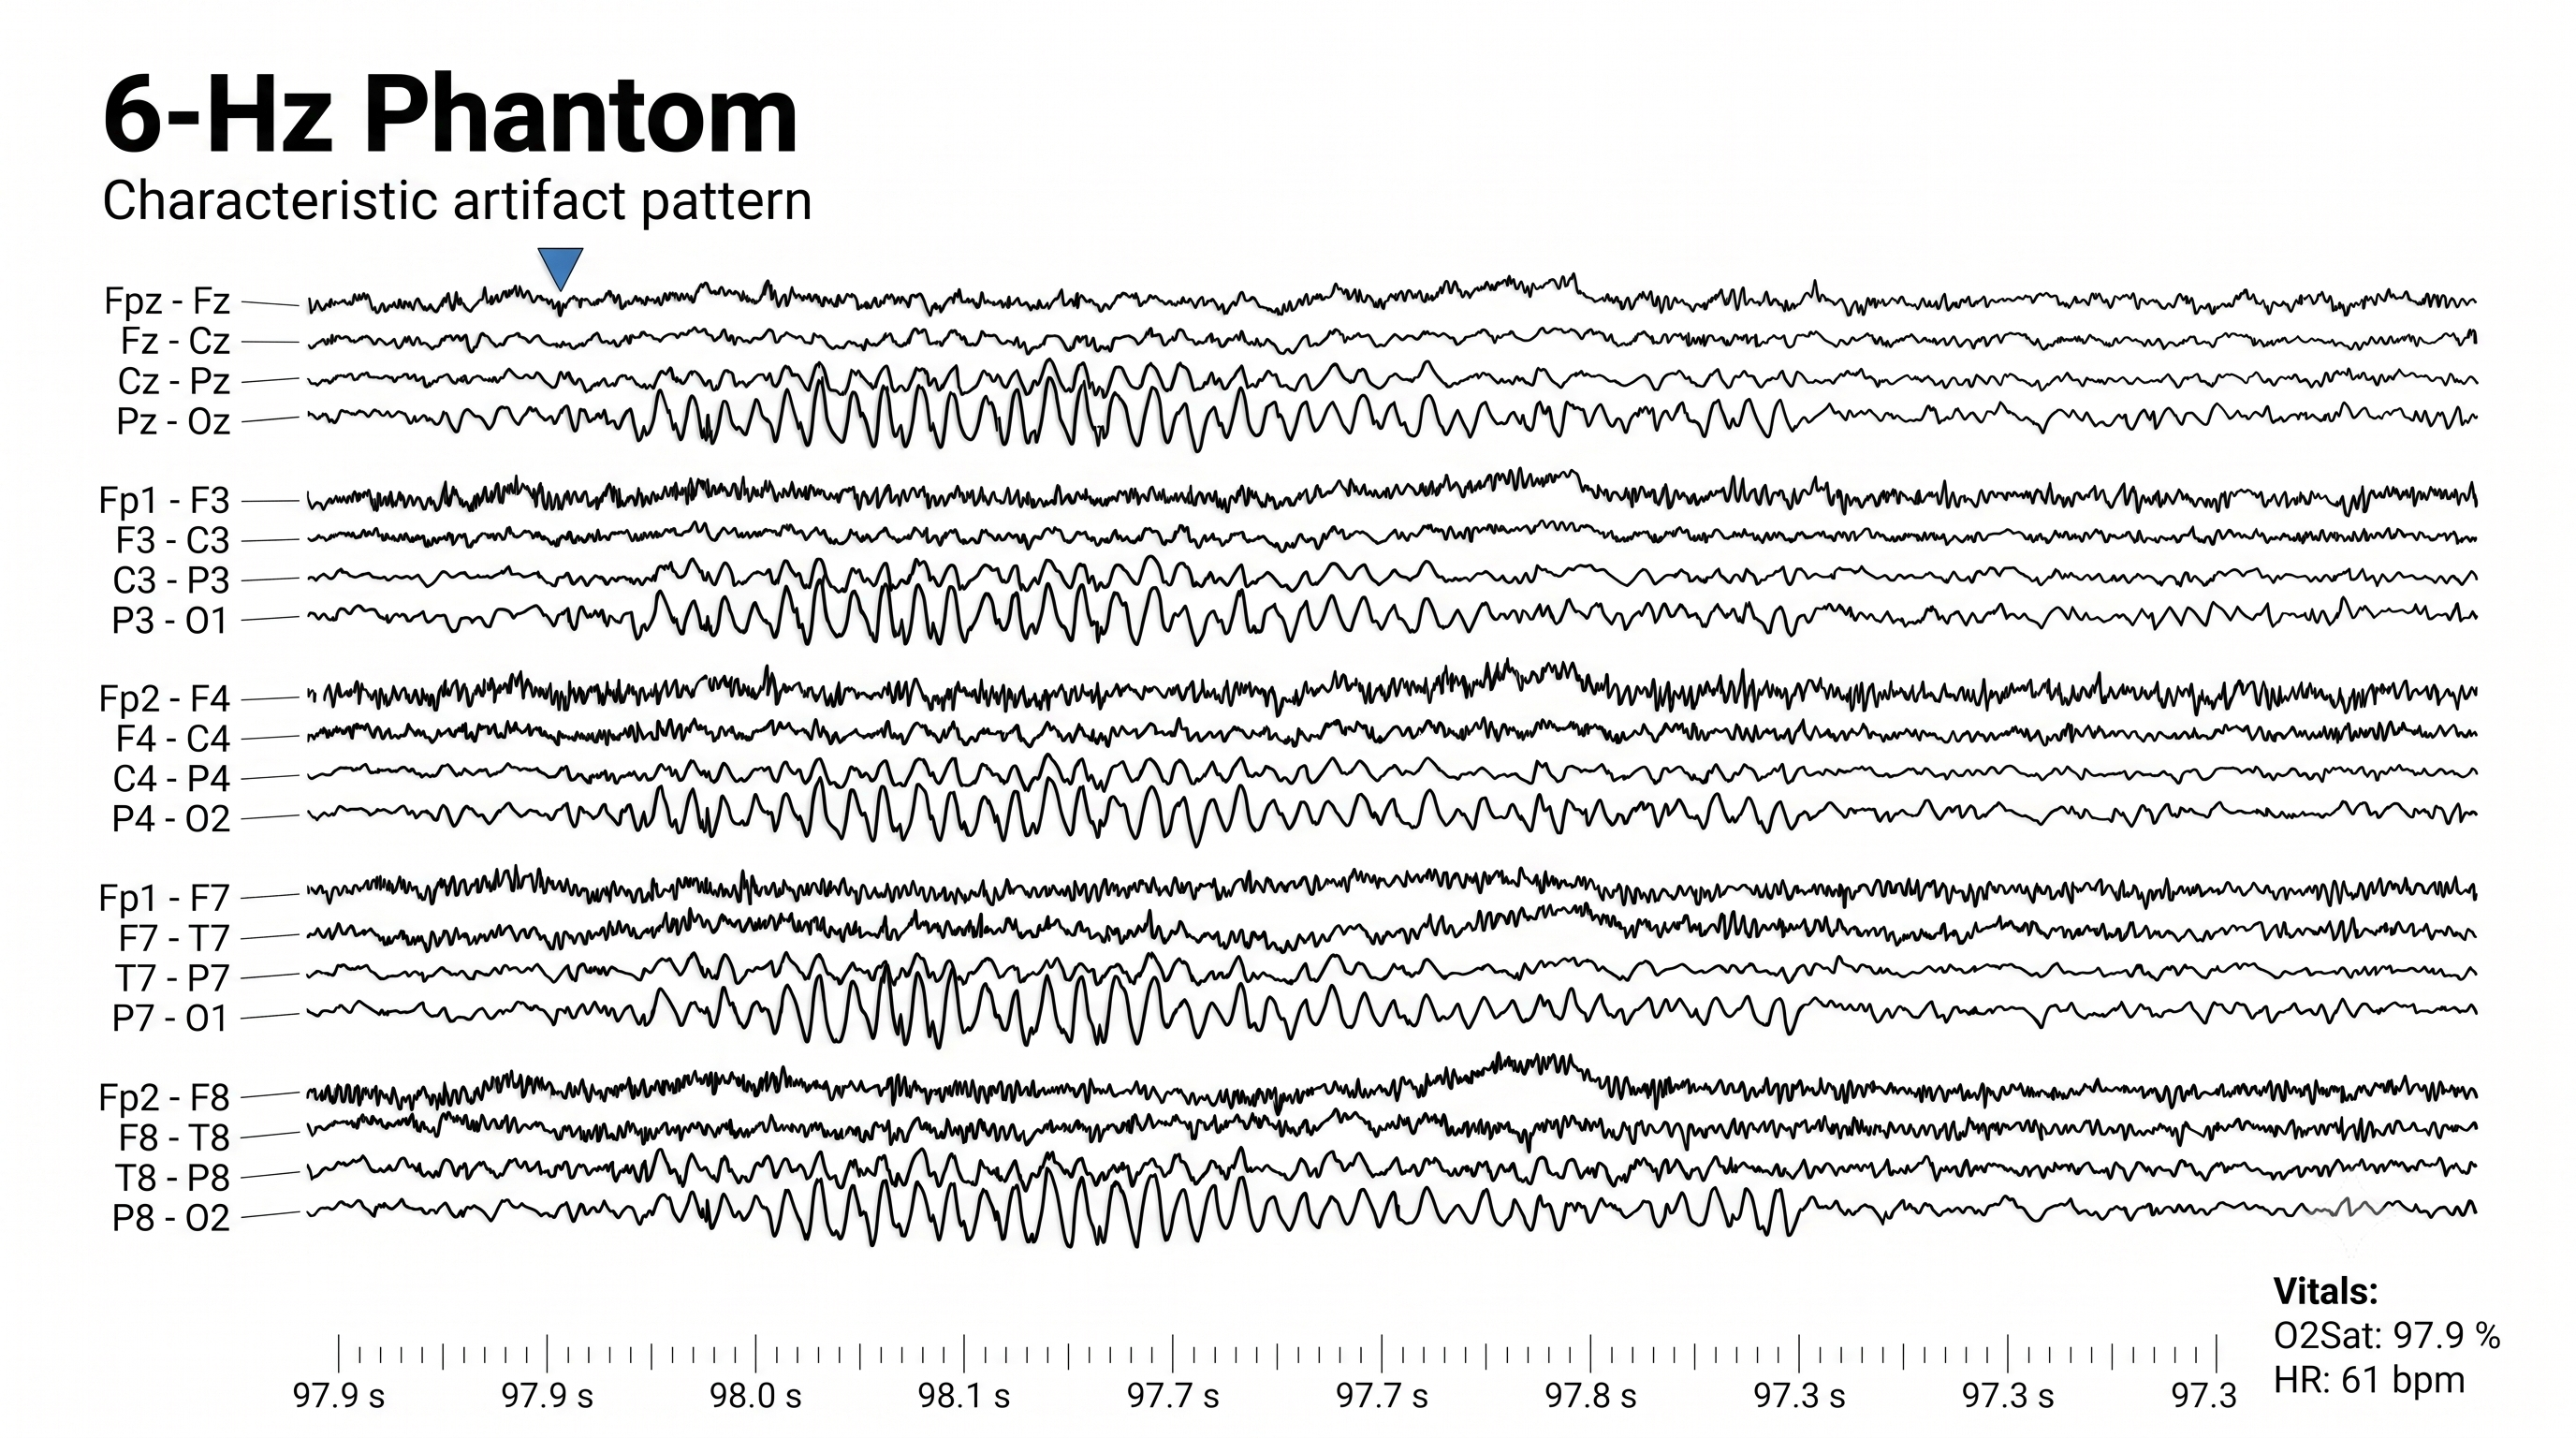
Six-Hz graphic © Mayo Foundation for Medical Education.
Abnormal Periodic Paroxysmal Patterns
Abnormal periodic paroxysmal patterns include generalized periodic paroxysmal patterns and lateralized periodic paroxysmal patterns. Generalized periodic paroxysmal patterns involve the same areas of both hemispheres. The waveforms exhibit similar composition, amplitude, and phase in each hemisphere but may slightly vary within a hemisphere (Fisch, 1999).
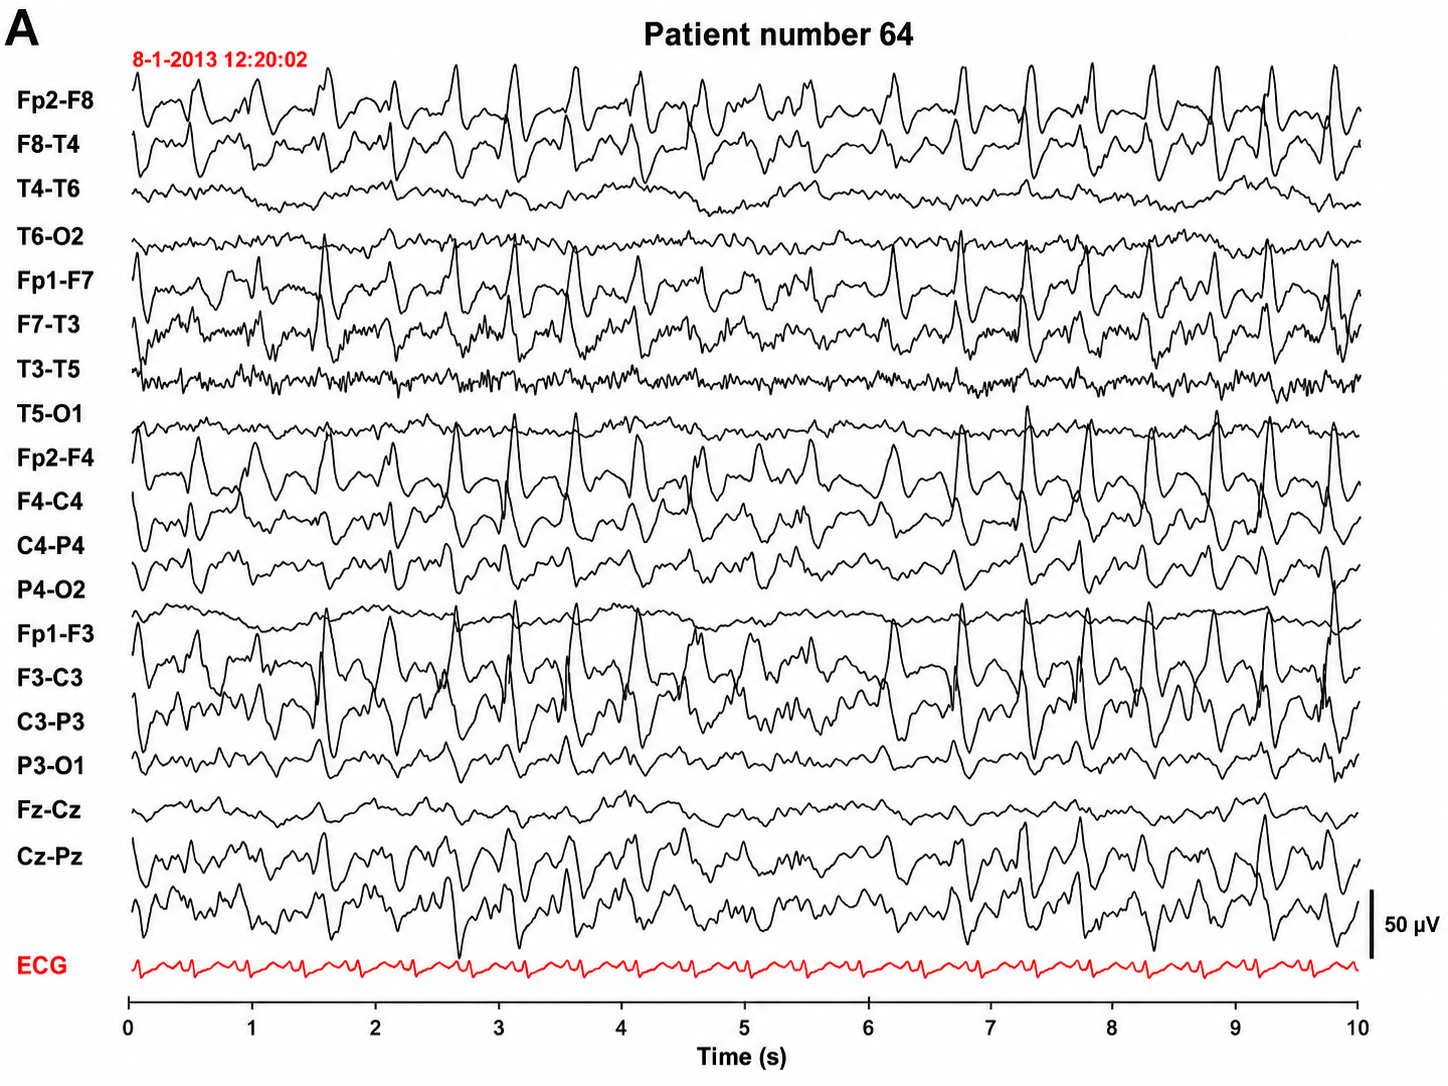
Graphic © Epilepsy & Behavior.
Lateralized periodic paroxysmal patterns differ from generalized periodic paroxysmal patterns in their unilateral distribution. Both patterns share the same waveform morphology (Fisch, 1999).
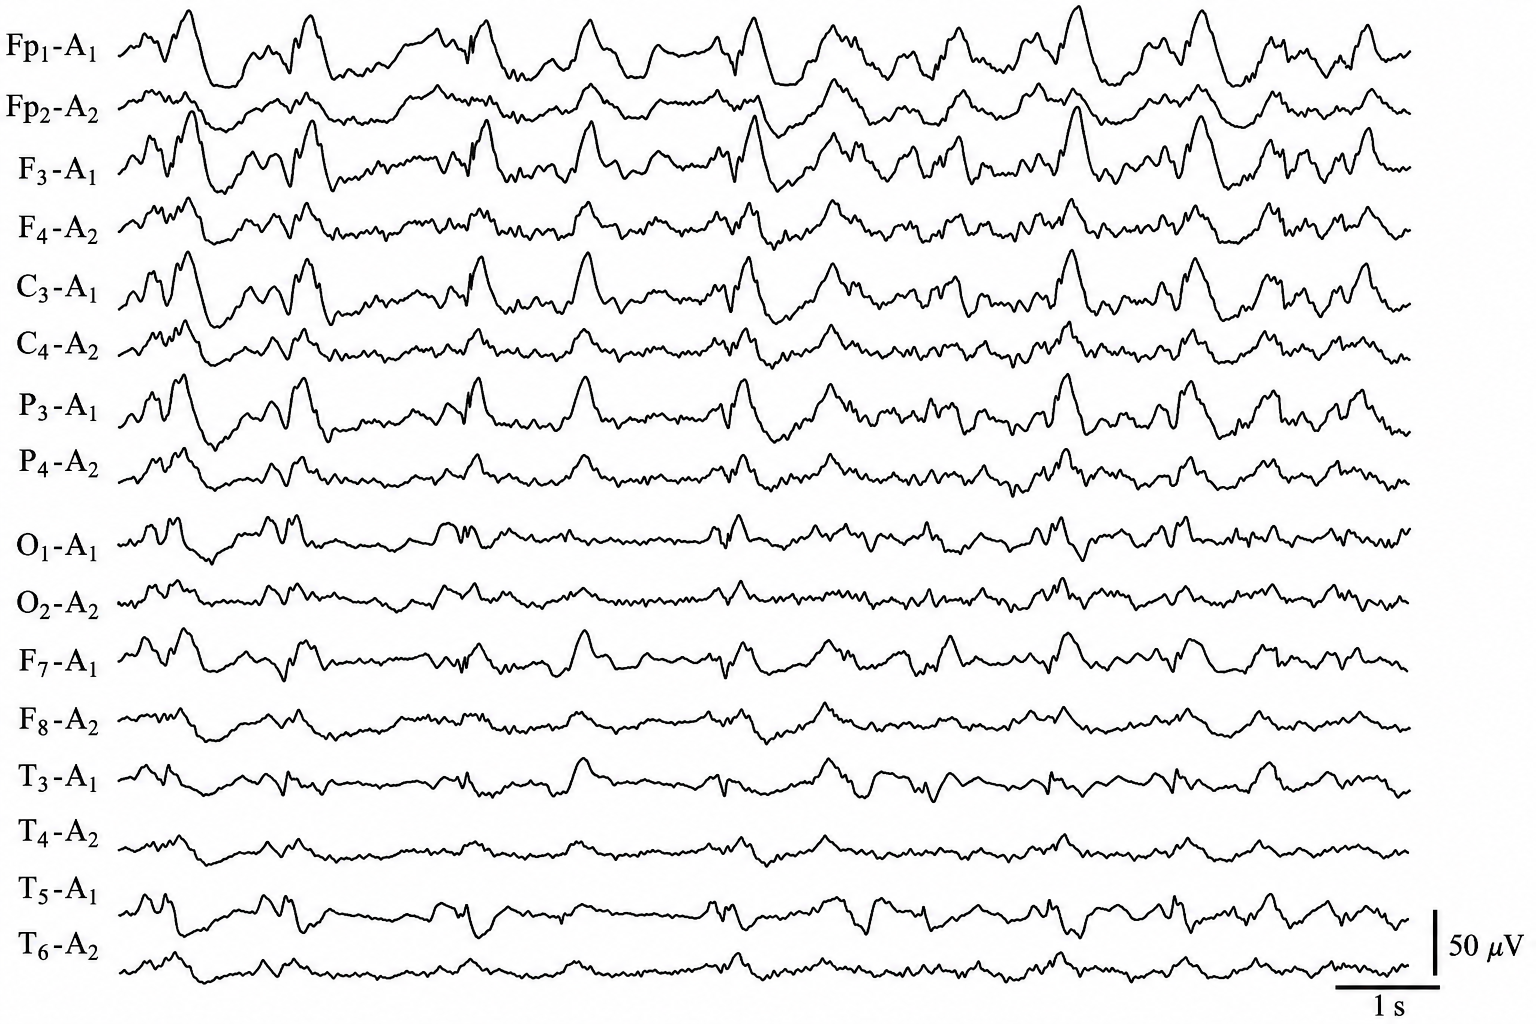
Graphic © Internal Medicine.
Clinical Application
Imagine recording a hyperactive child whose constant movement contaminates every channel. Because a valid brain map needs at least a minute of artifact-free data, and ideally 2 to 5 minutes, drawn from a substantially longer recording, you may find that none of the channels is usable and that the assessment must be repeated. When only a few channels are contaminated, you can base the assessment on the clean channels instead (Demos, 2019). Talking to the client every minute or two, and mentioning how much time remains, helps maintain alertness and reduces drowsiness artifact during longer recordings. Planning for artifact in advance, rather than discovering it afterward, protects the validity of everything built on the raw EEG.
Key Takeaways
A valid brain map depends on clean raw EEG: at least 1 minute of artifact-free data and ideally 2 to 5 minutes, selected separately for eyes-open and eyes-closed conditions from a much longer raw record. Learn to recognize and reproduce common artifacts so you can prevent them, disable low-pass and high-pass filters while editing, and watch for the subtle shift into Stage 1 sleep marked by decreasing alpha and increasing theta. Abnormal EEG patterns fall into abnormal slow activity, paroxysmal epileptogenic abnormalities, and abnormal periodic paroxysmal patterns. These patterns are distinguished by their frequency, distribution, symmetry, and whether they are intermittent or persistent, focal or generalized. Recognizing them, and distinguishing them from benign activity, is essential for valid assessment and safe practice.
Check Your Understanding
- How much artifact-free data do the published qEEG guidelines require for a valid brain map, and how long should the raw recording be?
- What EEG changes signal that a client has drifted into Stage 1 sleep?
- What are the three broad categories of abnormal EEG patterns?
- How do focal and generalized intermittent slow activity differ?
- Why is it useful to intentionally reproduce common artifacts during training?
Descriptive Terms
Use the American Clinical Neurophysiology Society scales, since these are the terms a trained reviewer expects to read. Amplitude is classified as very low (less than 20 µV), low (20-49 µV), medium (50-149 µV), and high (150 µV or greater). Duration is described as very brief (less than 10 s), brief (10-59 s), intermediate duration (1-9.9 min), long (10-59 min), and very long (1 hour or more). Both scales are exhaustive by design, with no gap between adjacent bins (Hirsch et al., 2021).
Common EEG Acronyms for Rhythmic and Periodic Patterns
The common EEG acronyms reviewed in this section include LPDs, BIPDs, GPDs, GRDA, IRDA, LRDA, PLEDs, BIPLEDs, FIRDA, GPEDs, Mf, SIRPIDs, and SW. Read the list with one thing in mind: several of these are not different patterns but the same pattern under two names. When the American Clinical Neurophysiology Society standardized critical-care terminology, PLEDs became LPDs, BIPLEDs became BIPDs, GPEDs became GPDs, and FIRDA was absorbed into a described form of GRDA (Hirsch et al., 2013, 2021). The revision deliberately removed the word epileptiform from purely descriptive labels, because it smuggled an unproven ictal interpretation into what was meant to be a neutral description. The older acronyms are retained here because you will still encounter them in charts and in the literature.
LPDs are lateralized periodic discharges. These unilateral discharges appear as sharp waves or spikes, 100-300 µV, and recur at rates up to 3 Hz (Johnson & Kaplan, 2017).
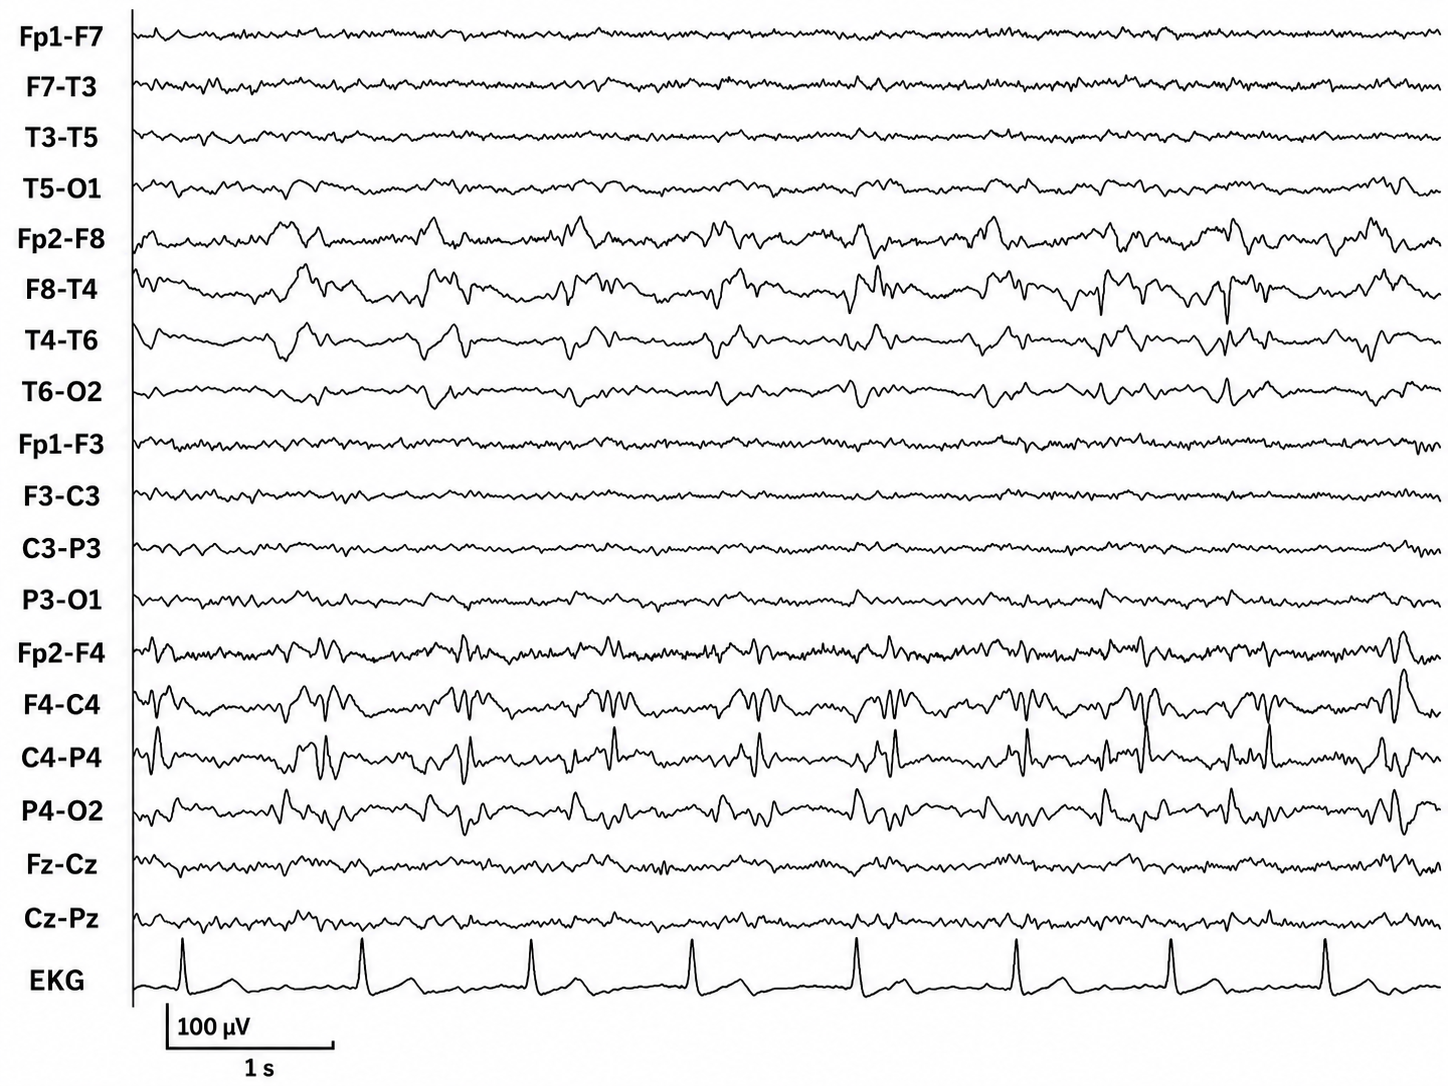
Graphic © ScienceDirect.
BIPDs are bilateral independent periodic discharges. These asynchronous discharges occur independently in the left and right hemispheres, appear as sharp waves or spikes, 100-300 µV, and recur at rates up to 3 Hz (Johnson & Kaplan, 2017).
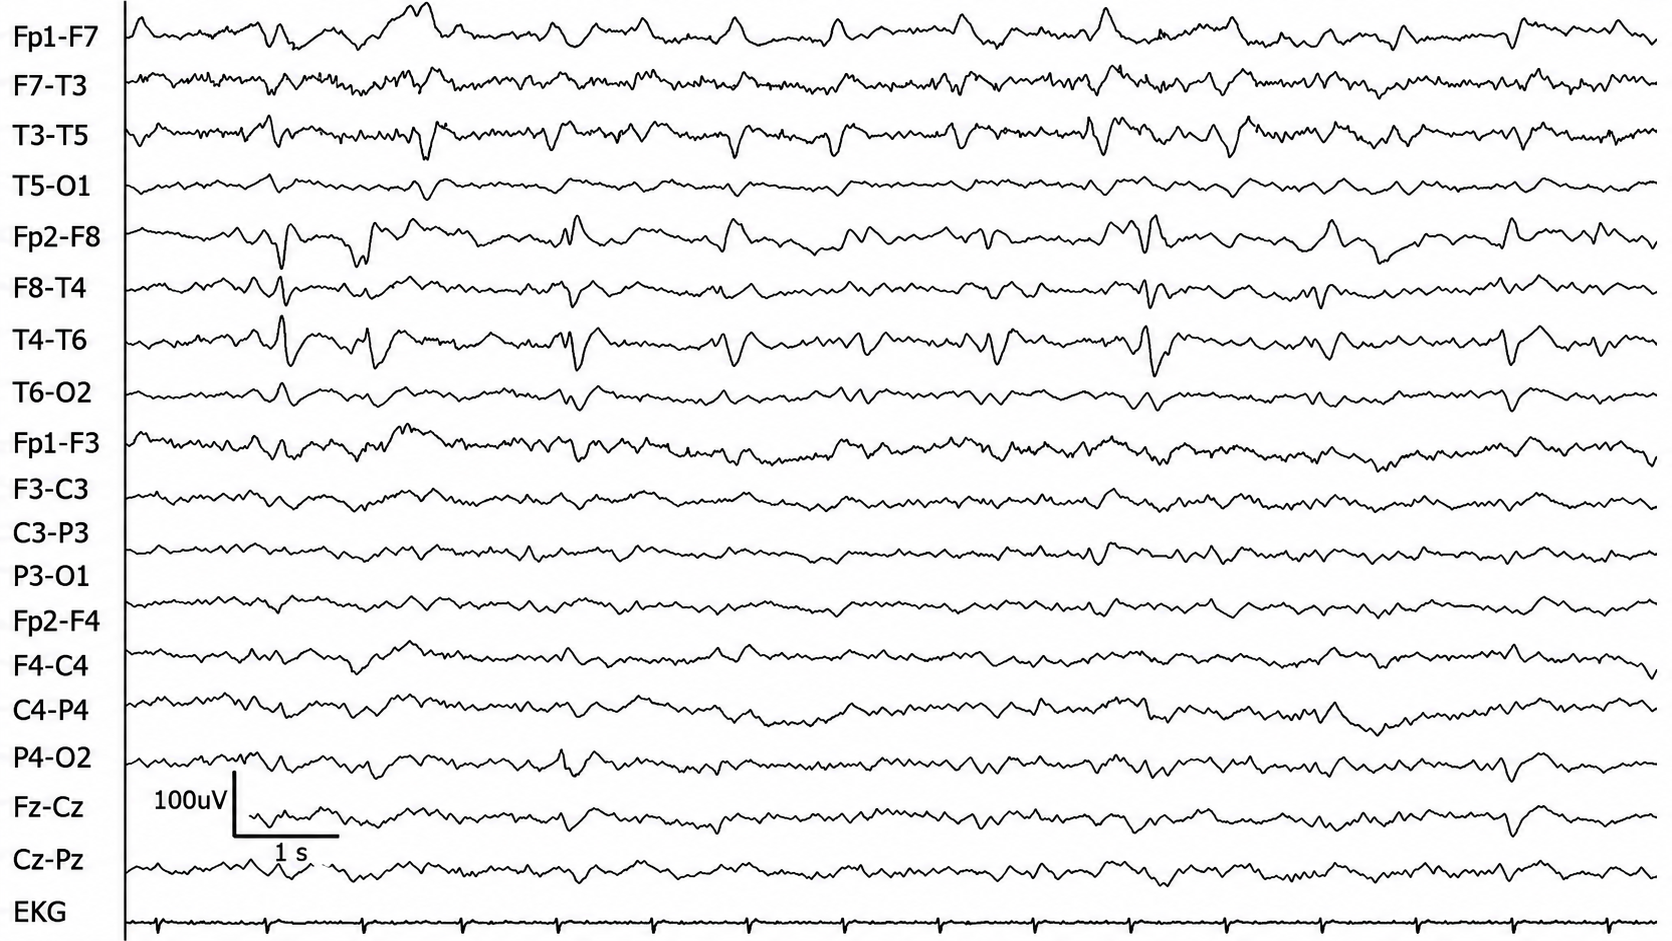
Graphic © ScienceDirect.
GPDs are generalized periodic discharges. These discharges synchronously occur in both hemispheres, appear as sharp waves or spikes, amplitudes exceed 100 µV, and recur at rates up to 3 Hz (Johnson & Kaplan, 2017).
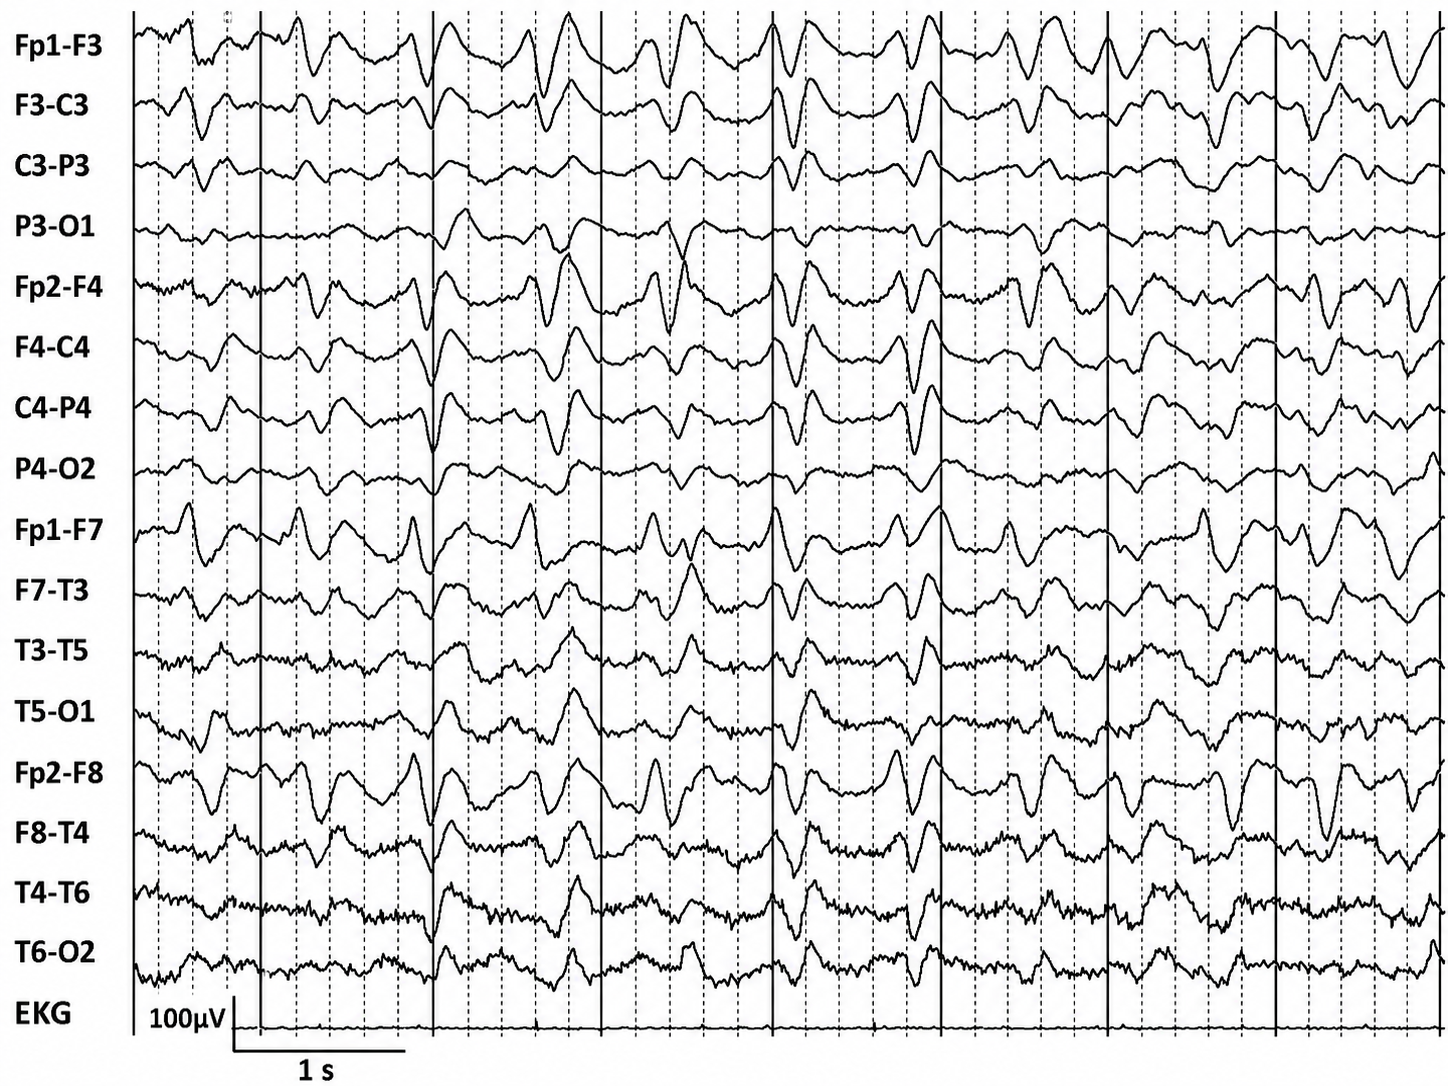
Graphic © ScienceDirect.
GRDA is generalized rhythmic delta activity. The term frontal intermittent rhythmic delta activity (FIRDA) was used before ACNS standardization in 2012. These bilateral and synchronous discharges exceed 100 µV and recur at rates up to 3 Hz (Johnson & Kaplan, 2017).
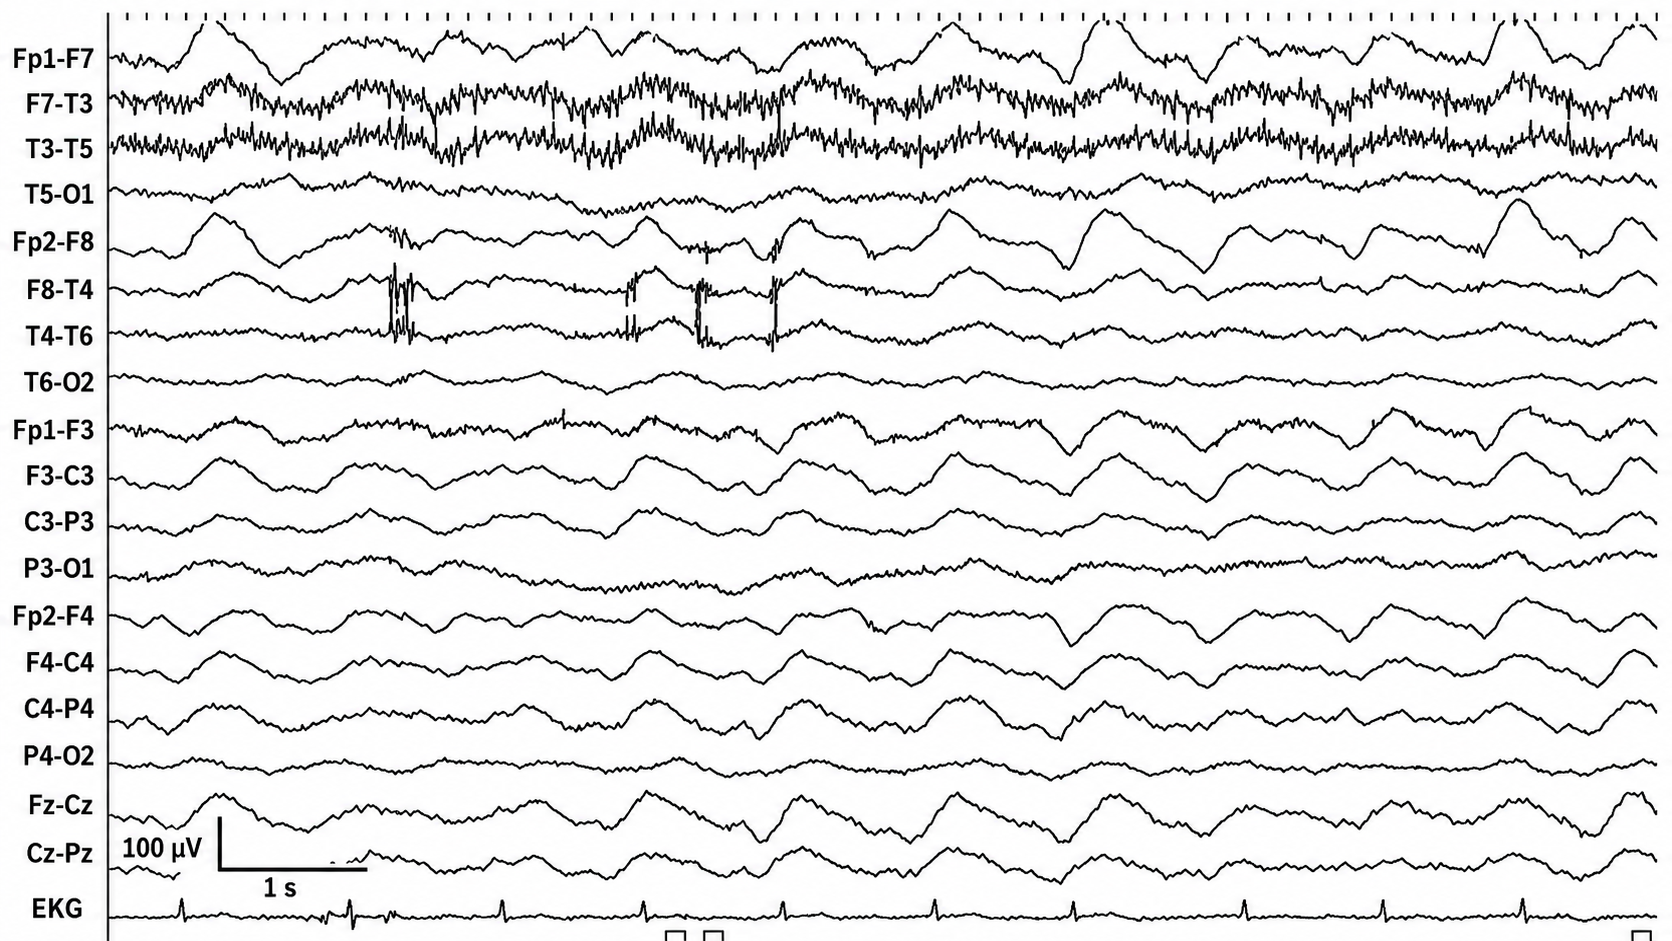
Graphic © ScienceDirect.
For focal patterns, describe the location with R (right), L (left), A (anterior), and P (posterior).
IRDA is intermittent rhythmic delta activity. These bilateral synchronous discharges recur between 2-2.5 Hz and appear in brief bursts.
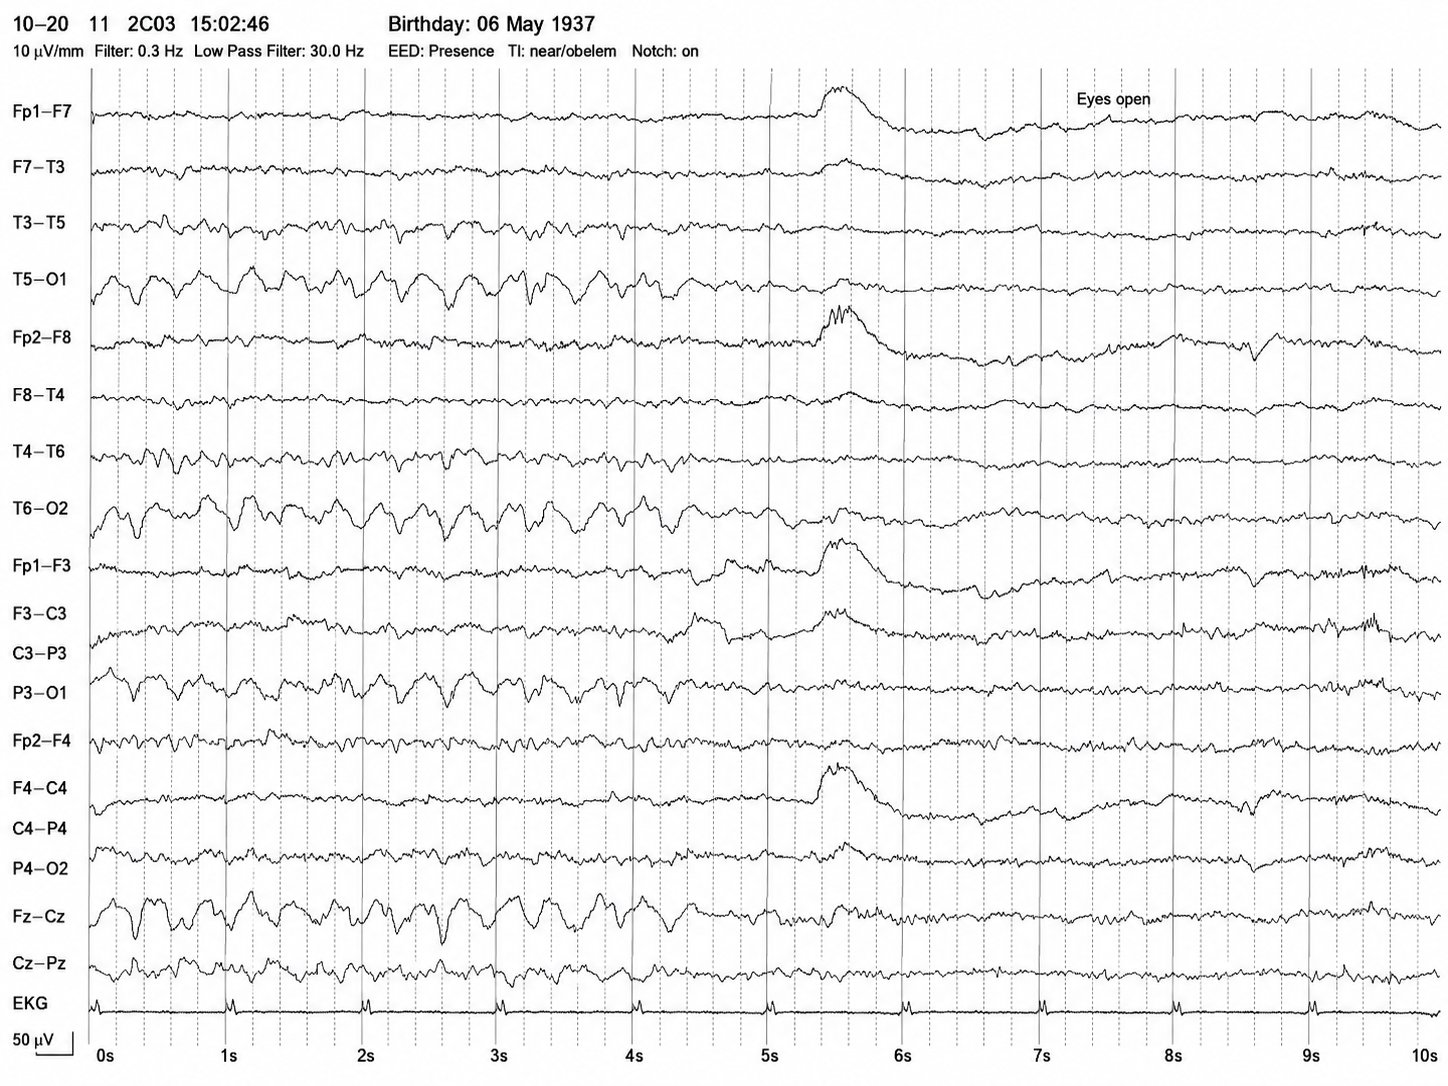
We adapted this graphic from © Richardson and Benbadis (2019). A 10-second page of longitudinal bipolar EEG from an older adult. Rhythmic slow activity appears in the posterior and midline chains (T5-O1, T6-O2, P3-O1, P4-O2, Fz-Cz, Cz-Pz) during the first five seconds. The smooth, frontally maximal deflection just after the 5-second mark is an eye-movement artifact marking the “Eyes open” annotation, and the rhythmic slowing attenuates once the eyes are open. Note that this is not a posterior dominant rhythm: a PDR lies in the alpha band, whereas this activity is far slower. A slow rhythm that reacts normally to eye opening is easy to mistake for alpha, so judge the frequency against the time axis rather than by the reactivity alone.
LRDA is lateralized rhythmic delta activity. These unilateral discharges recur at rates up to 3 Hz. LRDA runs typically last less than 1 minute and are shorter than LPDs (Johnson & Kaplan, 2017).
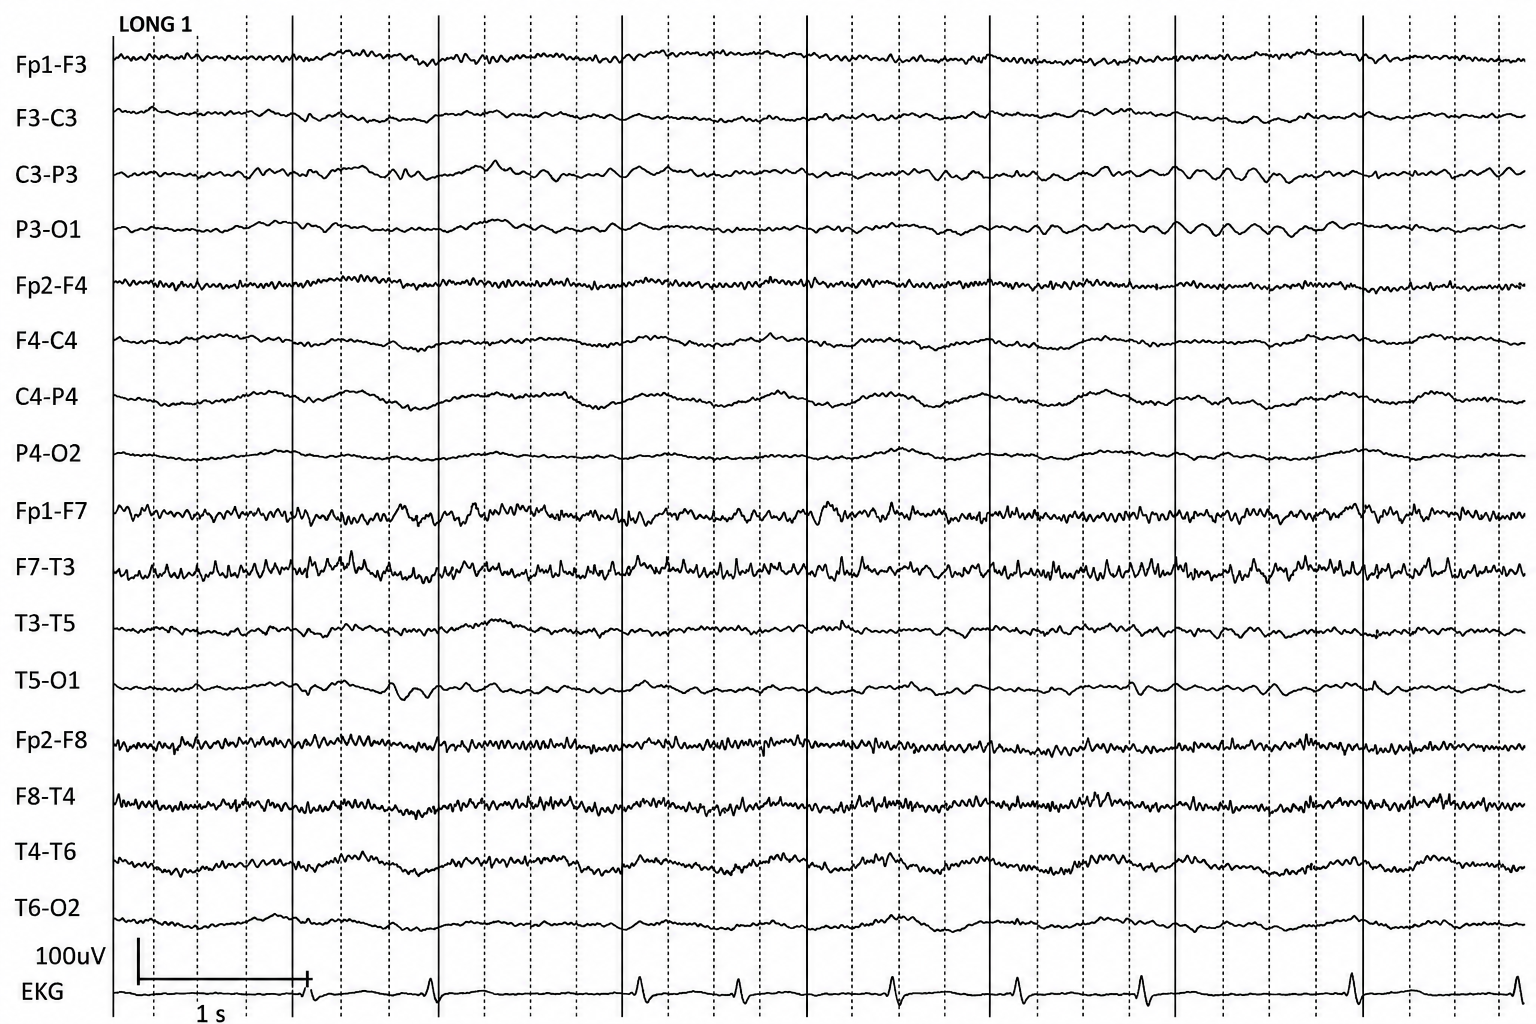
Graphic © ScienceDirect.
PLEDs are periodic lateralized epileptiform discharges. They are lateralized or focal and exhibit regular periodic, negative spike-and-sharp wave patterns with a 20-1000 ms duration and 50-300 µV amplitude.
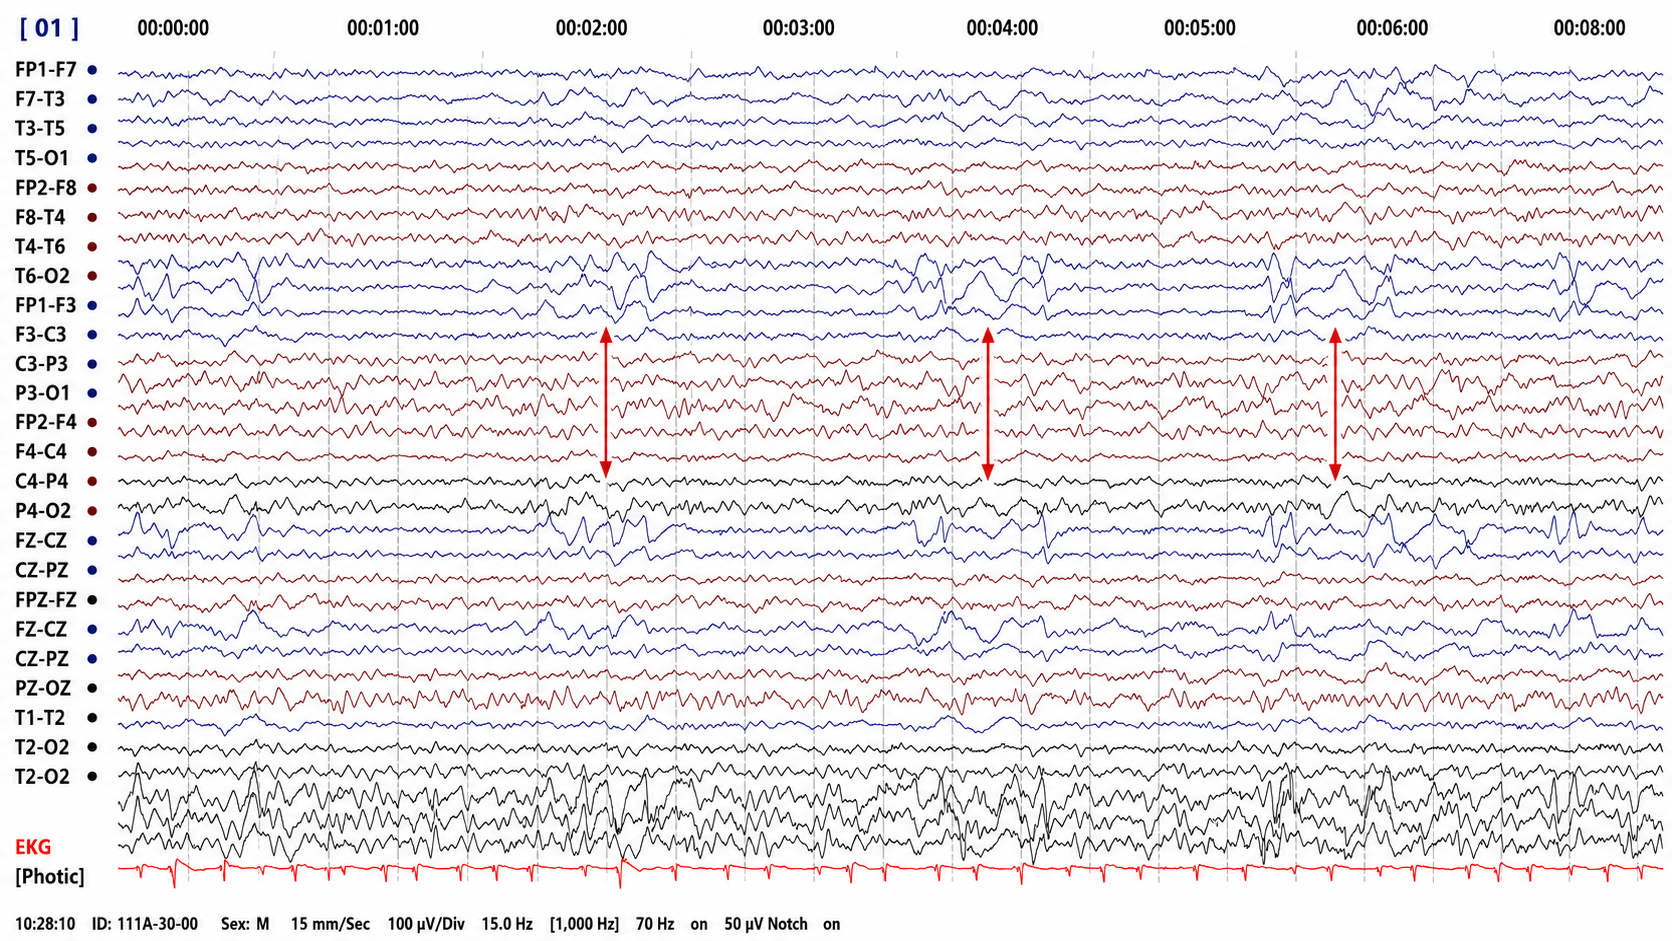
A compressed-timebase recording (15 mm/s) with vertical arrows marking the derivations of interest. Read the timebase before the waveforms. Periodic discharges are defined by a repetition rate of roughly 0.5 to 3 Hz and must persist for at least six cycles, so individual discharges cannot be resolved at this scale, and the spacing between arrows does not represent the discharge interval. Confirm periodicity on a conventional page of a few seconds before applying the label.
BIPLEDs are bilateral independent periodic lateralized epileptiform discharges. They are asynchronous discharges that occur independently in both hemispheres, appear as sharp waves or spikes, 40-100 µV in bipolar montages, and recur at rates from 0.5-1.5 Hz.
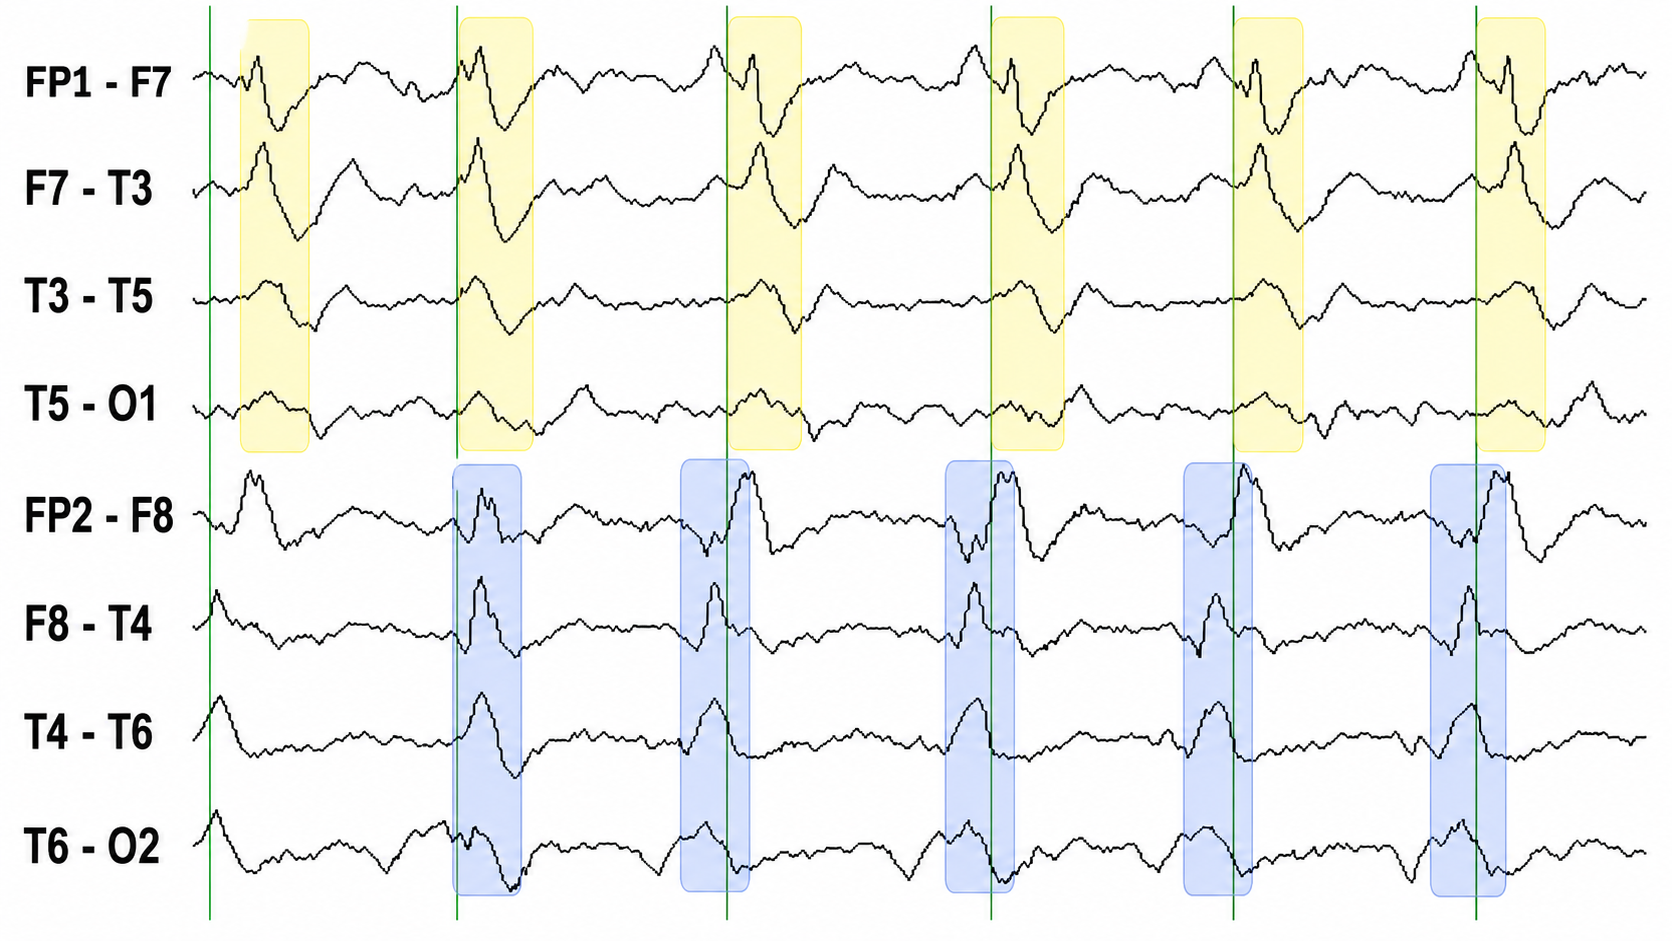
Left temporal discharges are boxed in yellow and right temporal discharges in blue, with vertical lines as timing markers. The defining feature of a bilateral independent pattern is that the two sides are periodic but not synchronous: each temporal region discharges on its own schedule, so left-sided and right-sided events fall at different instants. Checking the timing of one side against the other, rather than simply noting that both sides have discharges, is what separates two independent foci from a single bilaterally synchronous event.
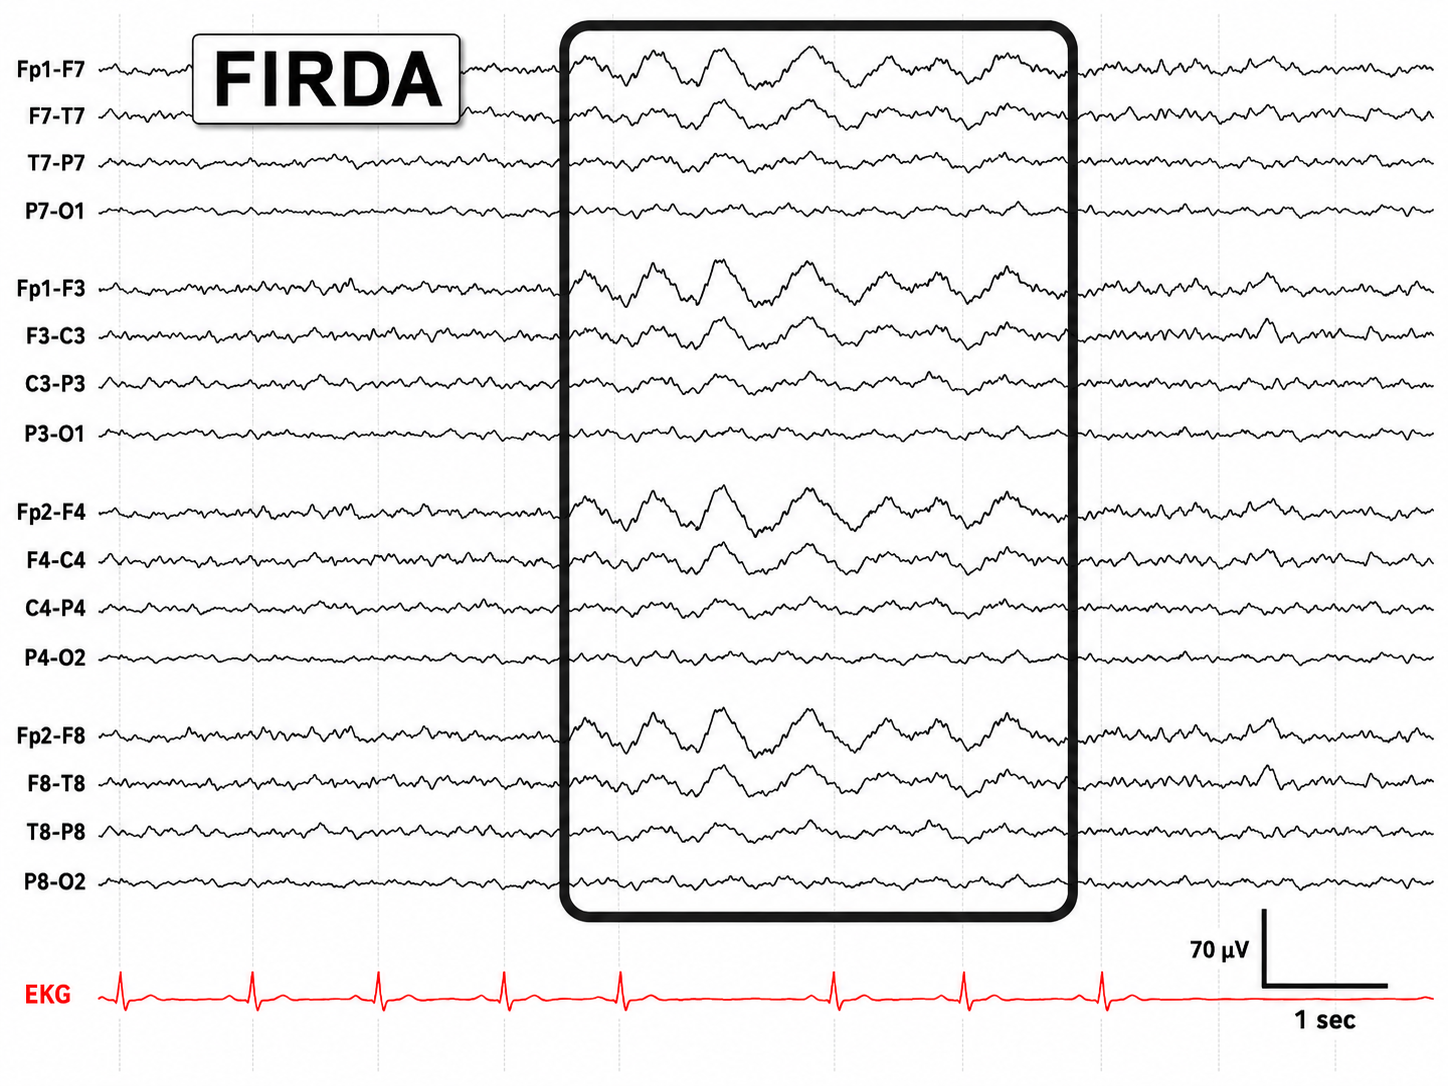
FIRDA is frontal intermittent rhythmic delta activity. Structural brain lesions and encephalopathy are independently associated with the occurrence of FIRDA. Asymmetric FIRDA may be associated with an underlying brain lesion.
FIRDA appears more common than previously reported and is associated with various lesions and encephalopathic conditions. However, FIRDA may also occur in otherwise healthy subjects during hyperventilation. FIRDA occurrence should prompt investigations for toxic-metabolic disturbances and structural lesions (particularly if asymmetric) but does not suggest an epileptic risk.
Graphic © eegatlas-online.com.
GPEDs (or GPDs) are generalized periodic epileptiform discharges.
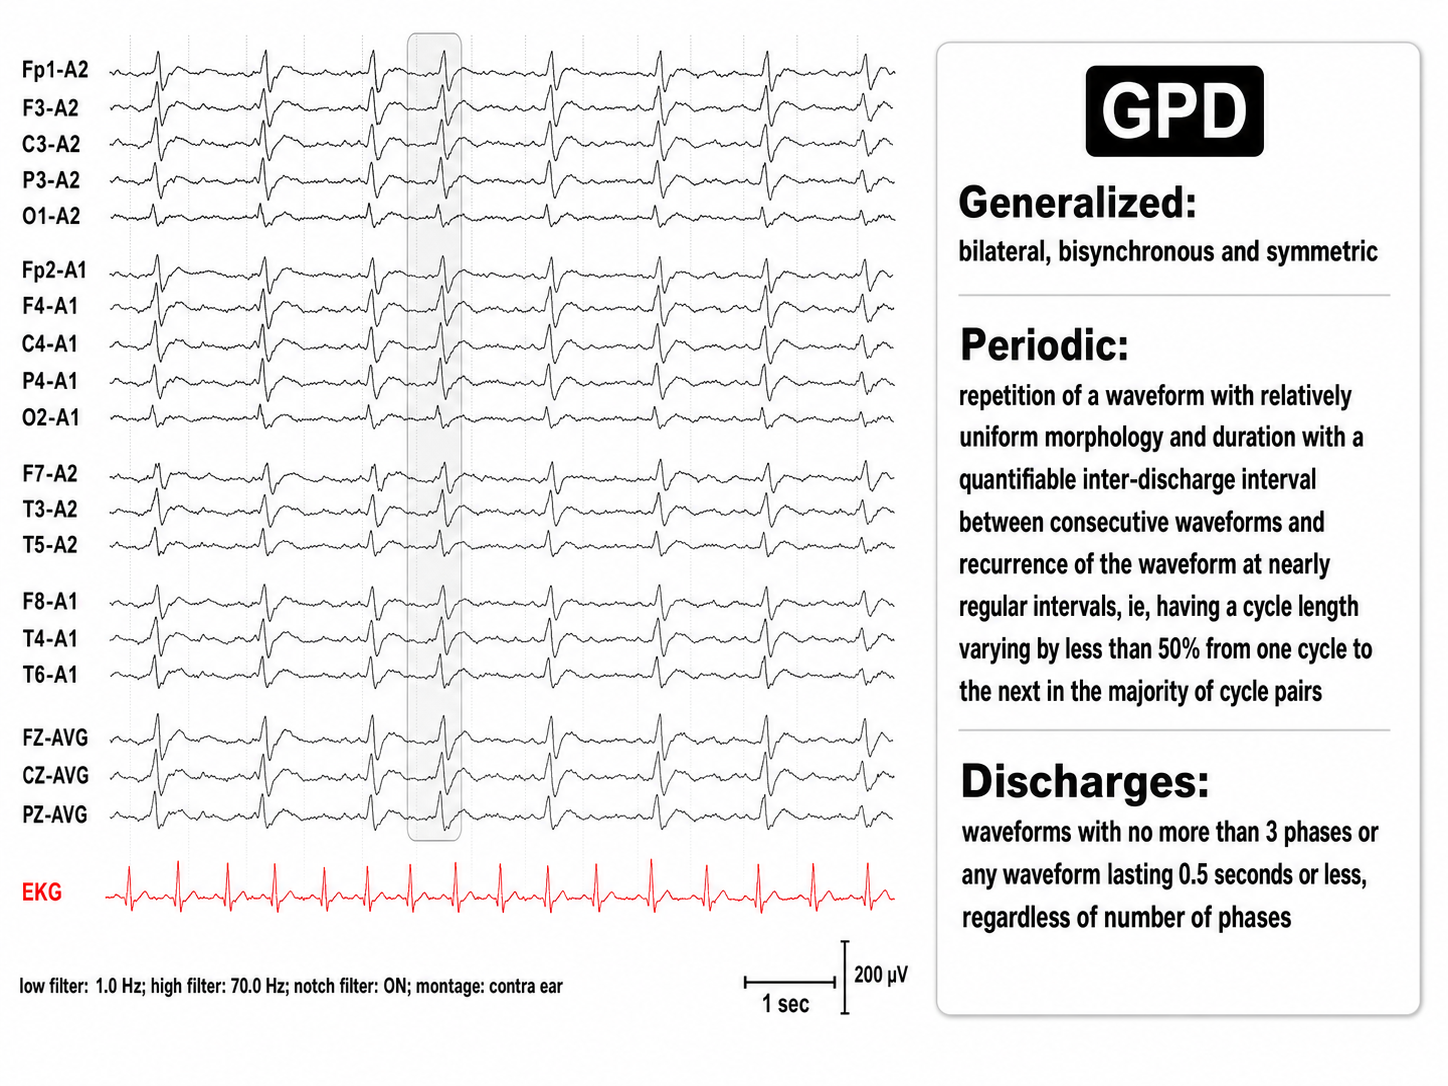
Graphic © eegatlas-online.com.
Multifocal (Mf)
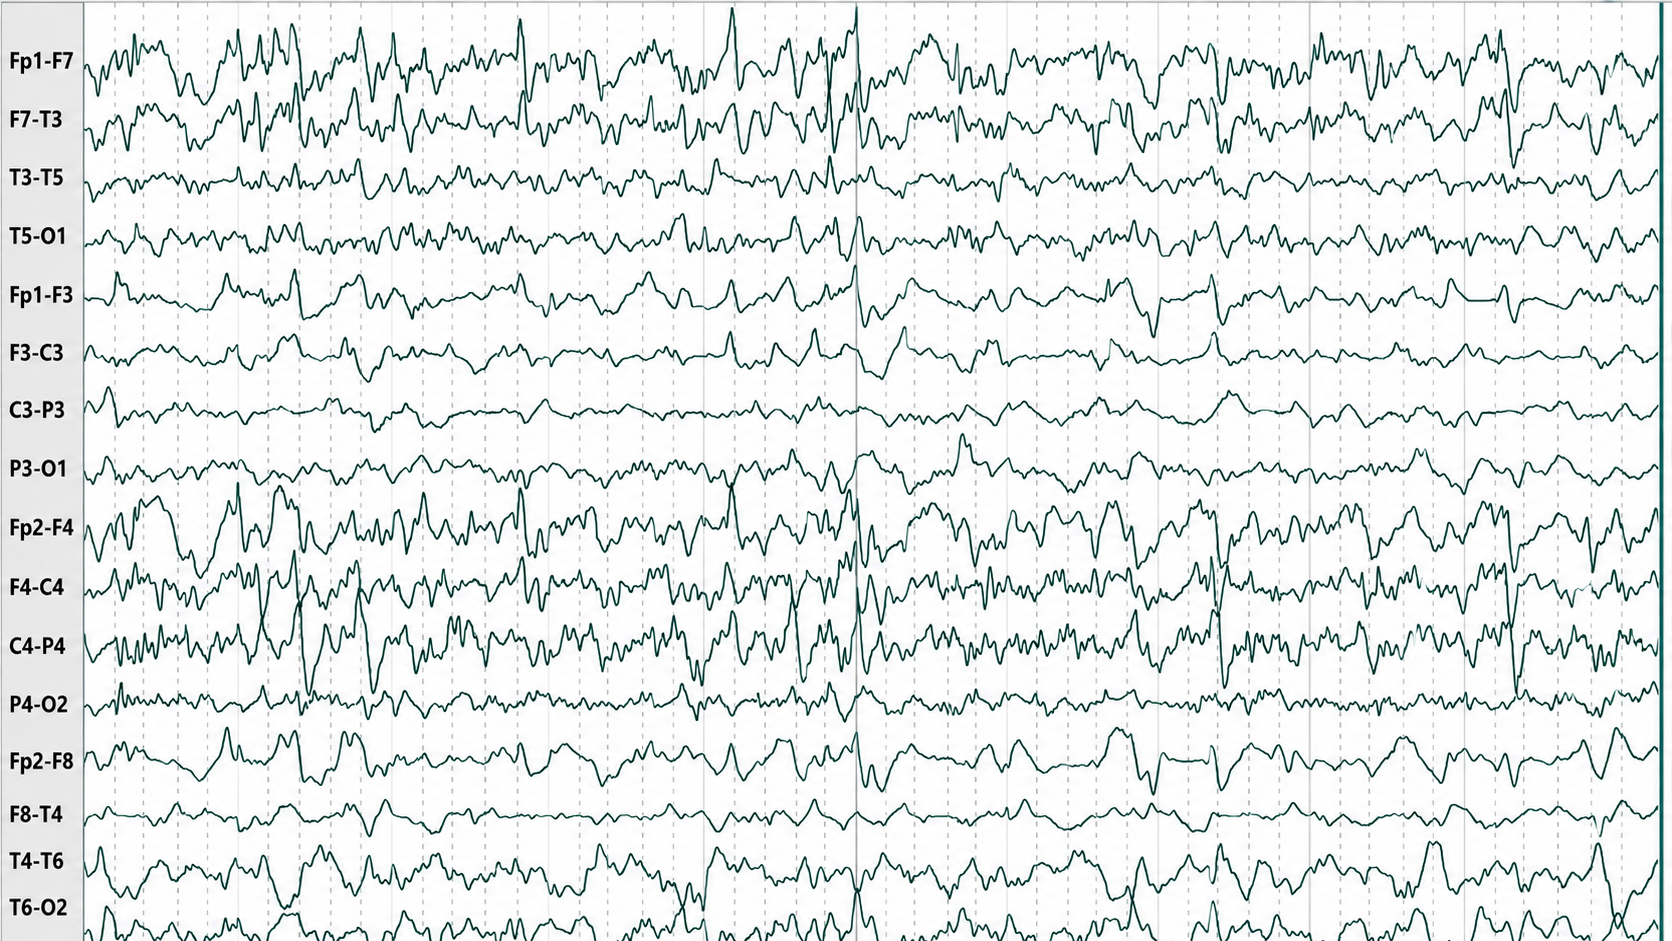
Graphic © Tai-Tong Wong.
SIRPIDs are stimulus-induced rhythmic, periodic, or ictal discharges.
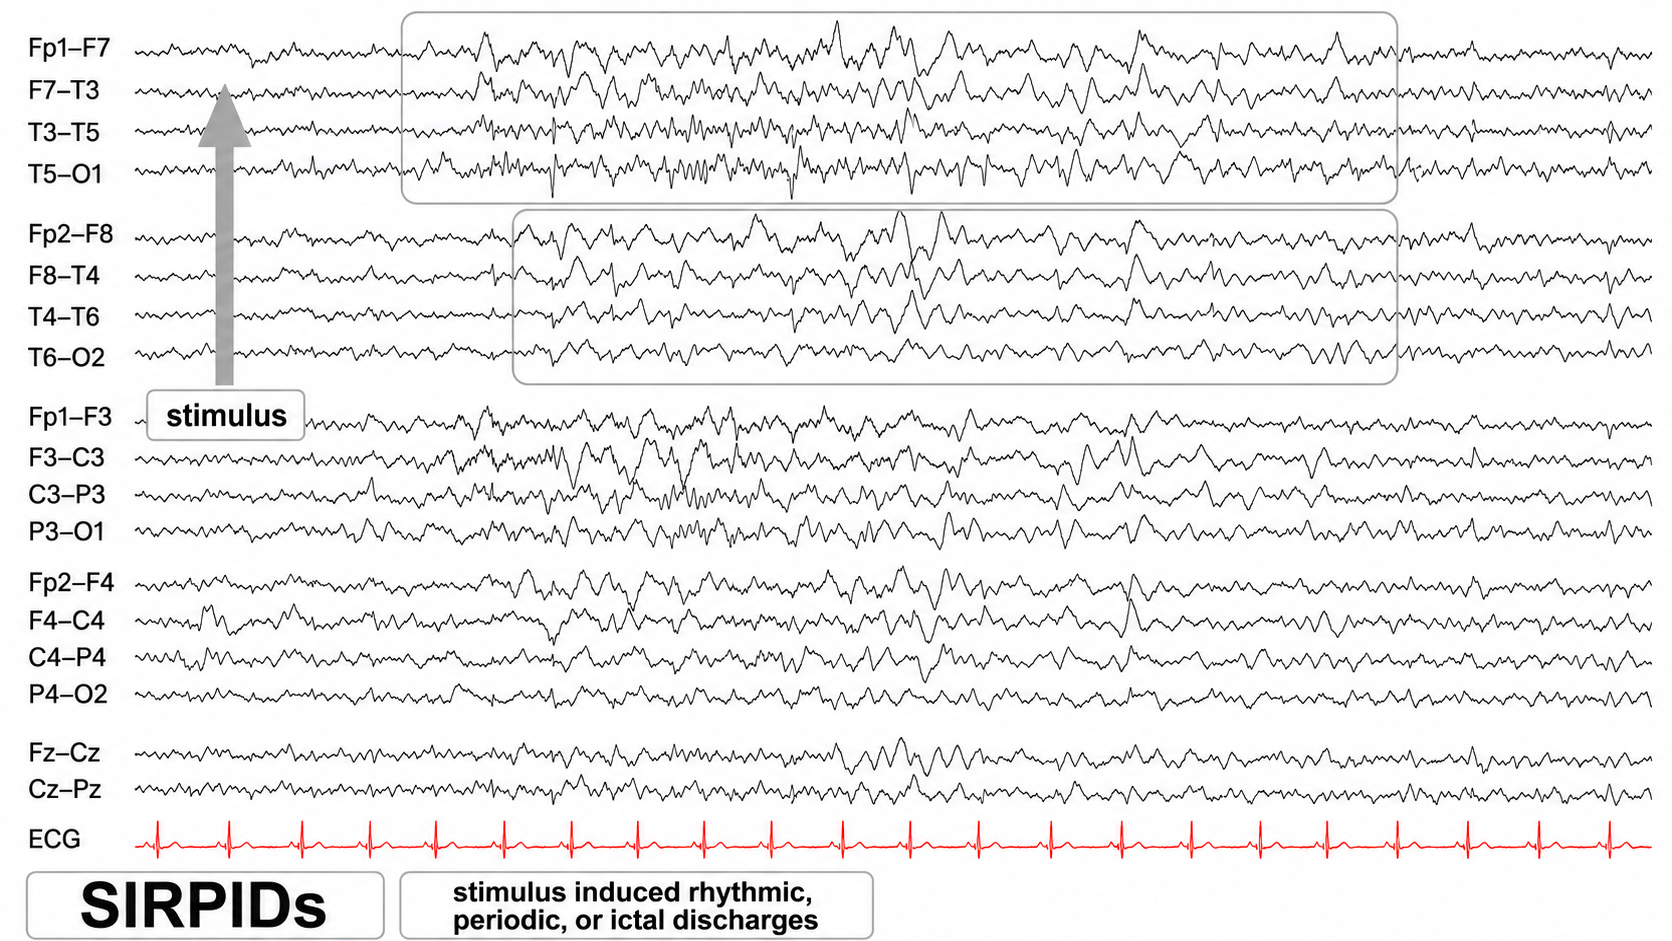
Graphic © eegatlas-online.com.
SW is spike-wave or sharp-wave.
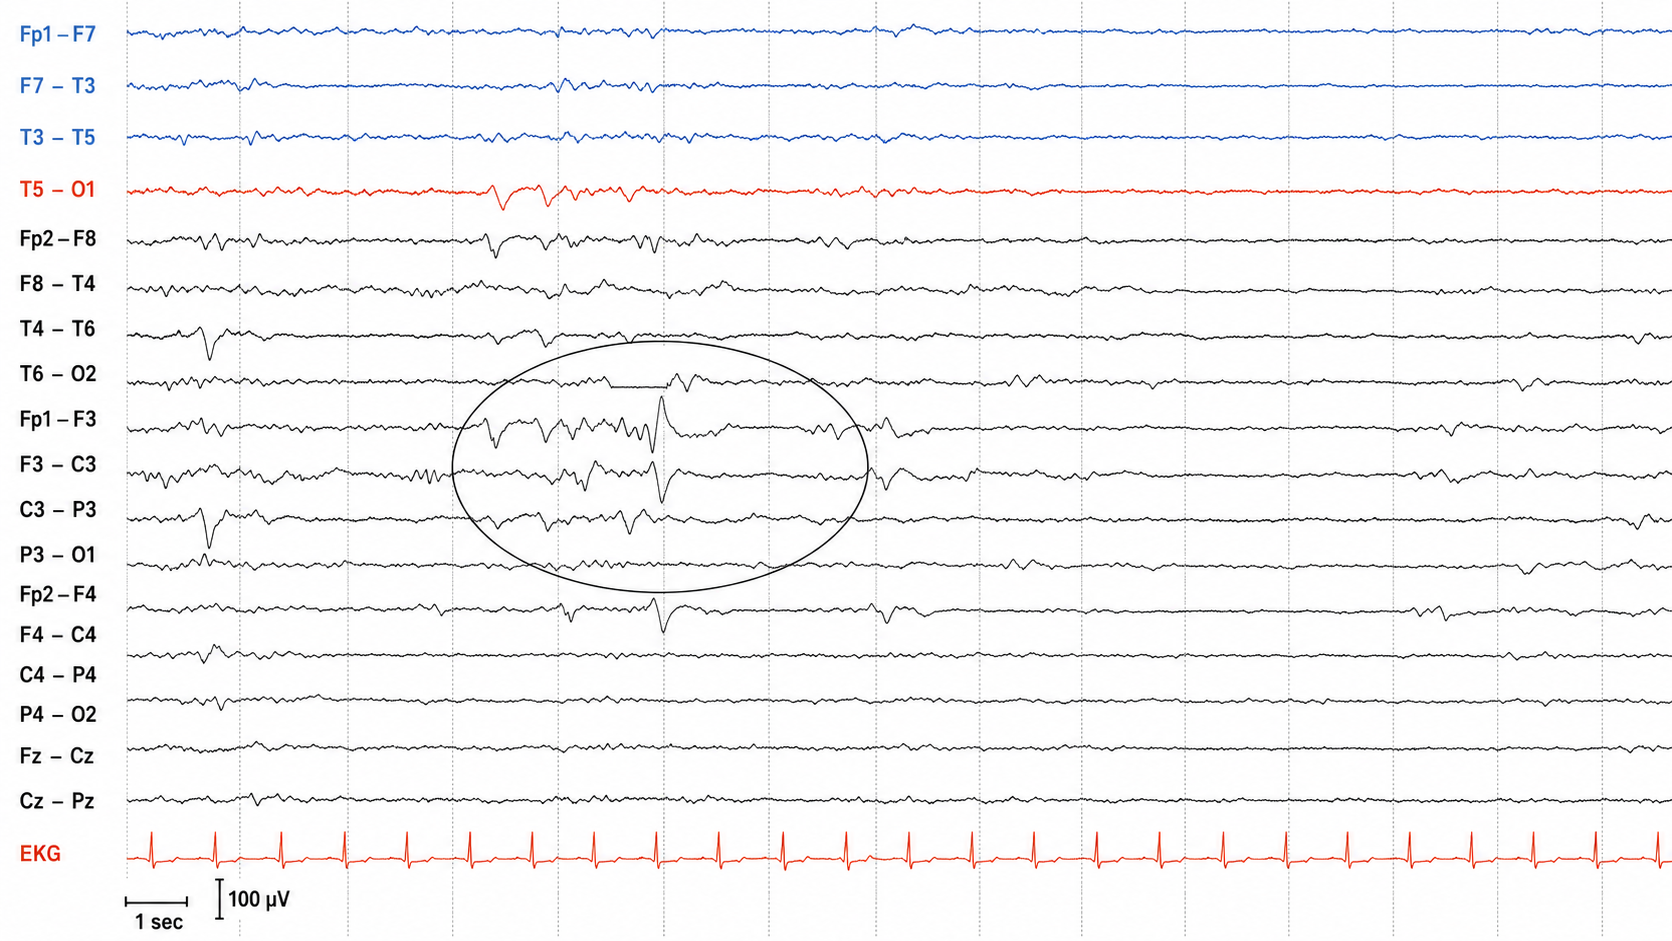
We adapted this graphic from © eegatlas-online.com. A longitudinal bipolar page in which a brief run of sharp, higher-amplitude activity is circled against an otherwise low-voltage background, maximal over the left central and parasagittal chains. Duration is what separates the two transients this acronym covers: a spike lasts 20 to under 70 ms and a sharp wave 70 to 200 ms, so measure the waveform against the 1-second marker rather than judging by how pointed it looks.
Generally Benign EEG Activity
Generally benign EEG activity includes BETS, POSTS, RMTD, SREDA, and wicket waves.
BETS are benign epileptiform transients of sleep. This activity is also called BSSS for benign small sharp spikes or benign sporadic sleep spikes. Sharp waves are seen alone or as a low-amplitude spike and a smaller after-going slow wave. BETS can be monophasic or diphasic and occur during light sleep. There is no disturbance of background activity, and it does not progress. BETS often appears in an ear reference, and when seen elsewhere, it is due to reference contamination. BETS are seen in adults during drowsiness, but they disappear in deeper sleep.
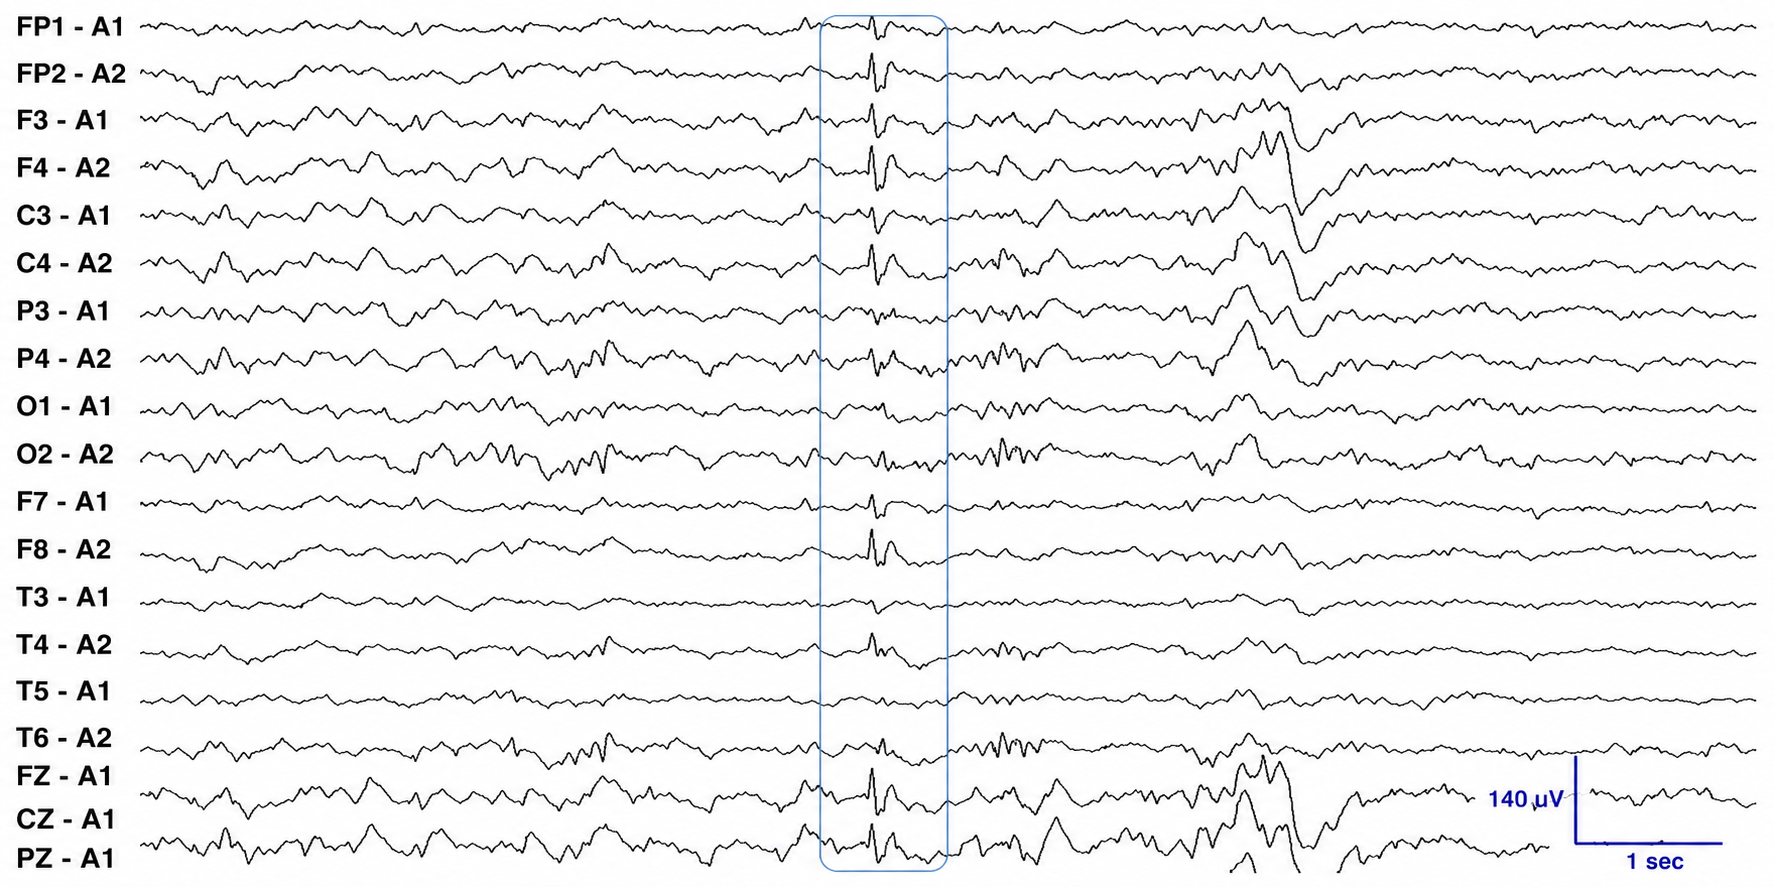
A referential montage in which every channel is referred to an earlobe (A1 or A2); the boxed transient appears in nearly all channels at once. That apparent whole-head distribution is the teaching point, and it is a montage effect rather than a generalized discharge. Because the transient arises at or near the ear, and the ear is the reference for every channel, it propagates into all of them; recorded in a bipolar montage the same event would appear as the small, brief, temporally maximal spike it is. Two features distinguish it from an epileptiform discharge: its low amplitude, and the absence of a prominent aftergoing slow wave.
POSTS are positive occipital sharp transients of sleep. They are sharply contoured surface-positive transients with a frequency of 4-5 Hz, seen alone or in groups over occipital areas. POSTS are bilaterally synchronous though frequently asymmetric in amplitude between the two sides; in bipolar chains they produce a phase reversal at O1 or O2.
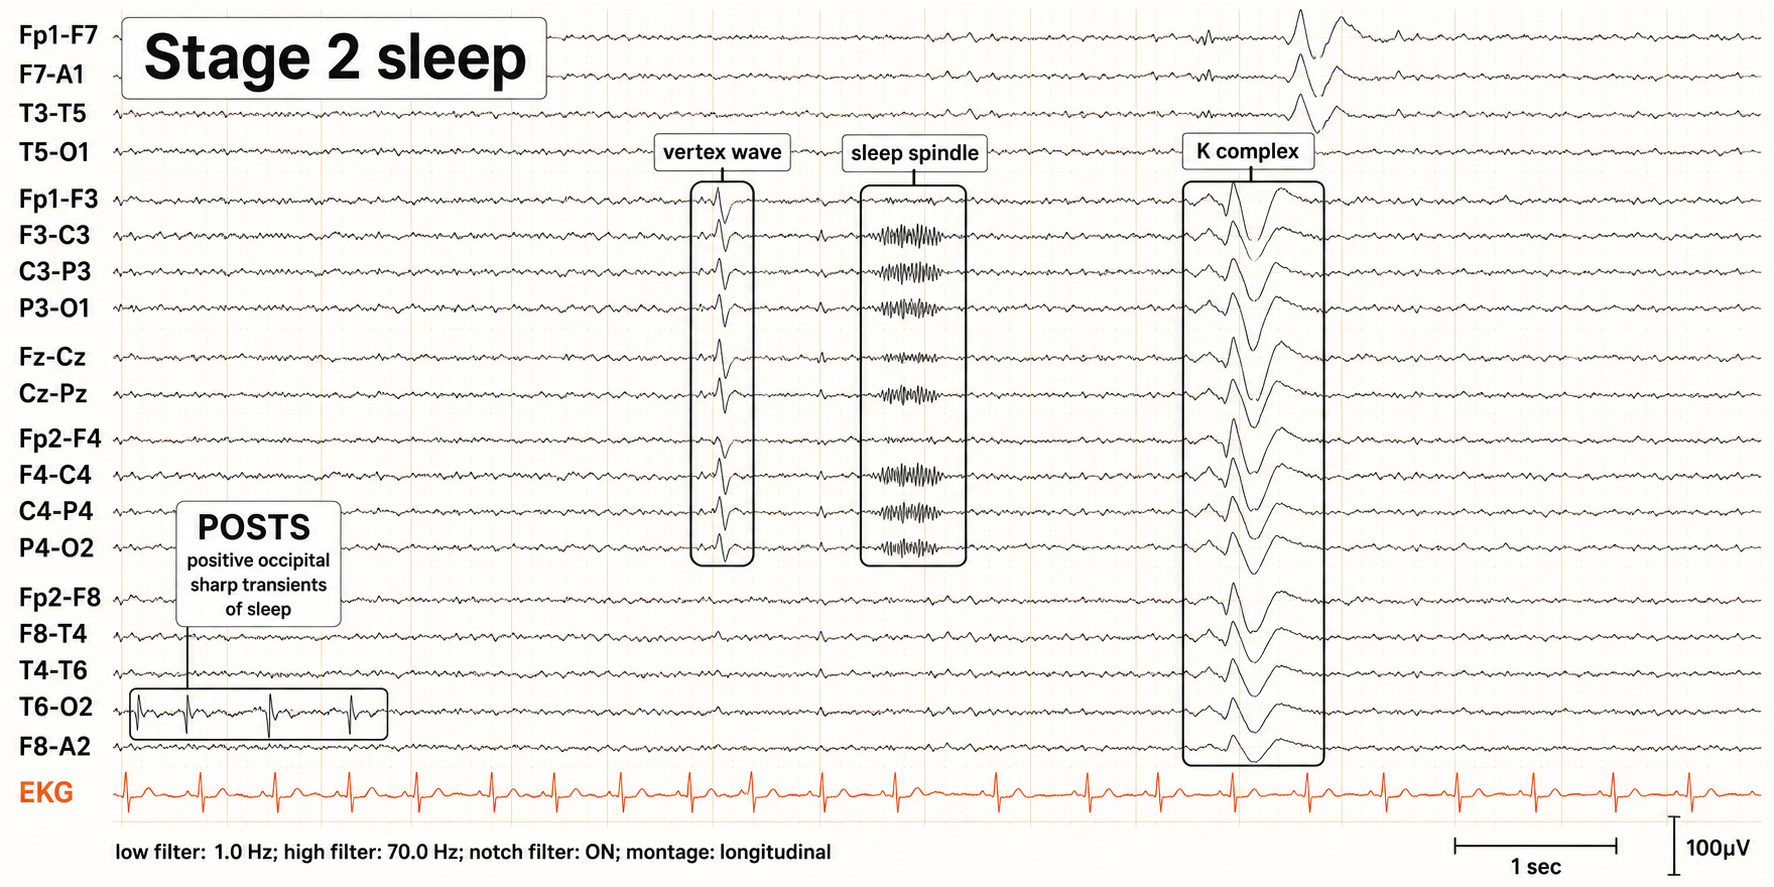
Graphic © eegatlas-online.com. A Stage 2 sleep page labeling four features at once: POSTS in the occipital derivations at lower left, plus a vertex wave, a sleep spindle, and a K complex. Locate the POSTS box before reading the rest.
RMTD is the rhythmic temporal theta of drowsiness. Bitemporal left is greater than right in this longitudinal bipolar montage. Noted are notched rhythmic waveforms localized to the temporal regions, some of which are sharply contoured. This rhythm was formerly referred to as the “psychomotor variant,” which can be differentiated from an epileptiform discharge by its relatively monomorphic appearance, lack of clinical accompaniment, and lack of spatiotemporal evolution.
Graphic © Mayo Foundation for Medical Education and Research. Figure courtesy of Jeffrey W. Britton, MD.
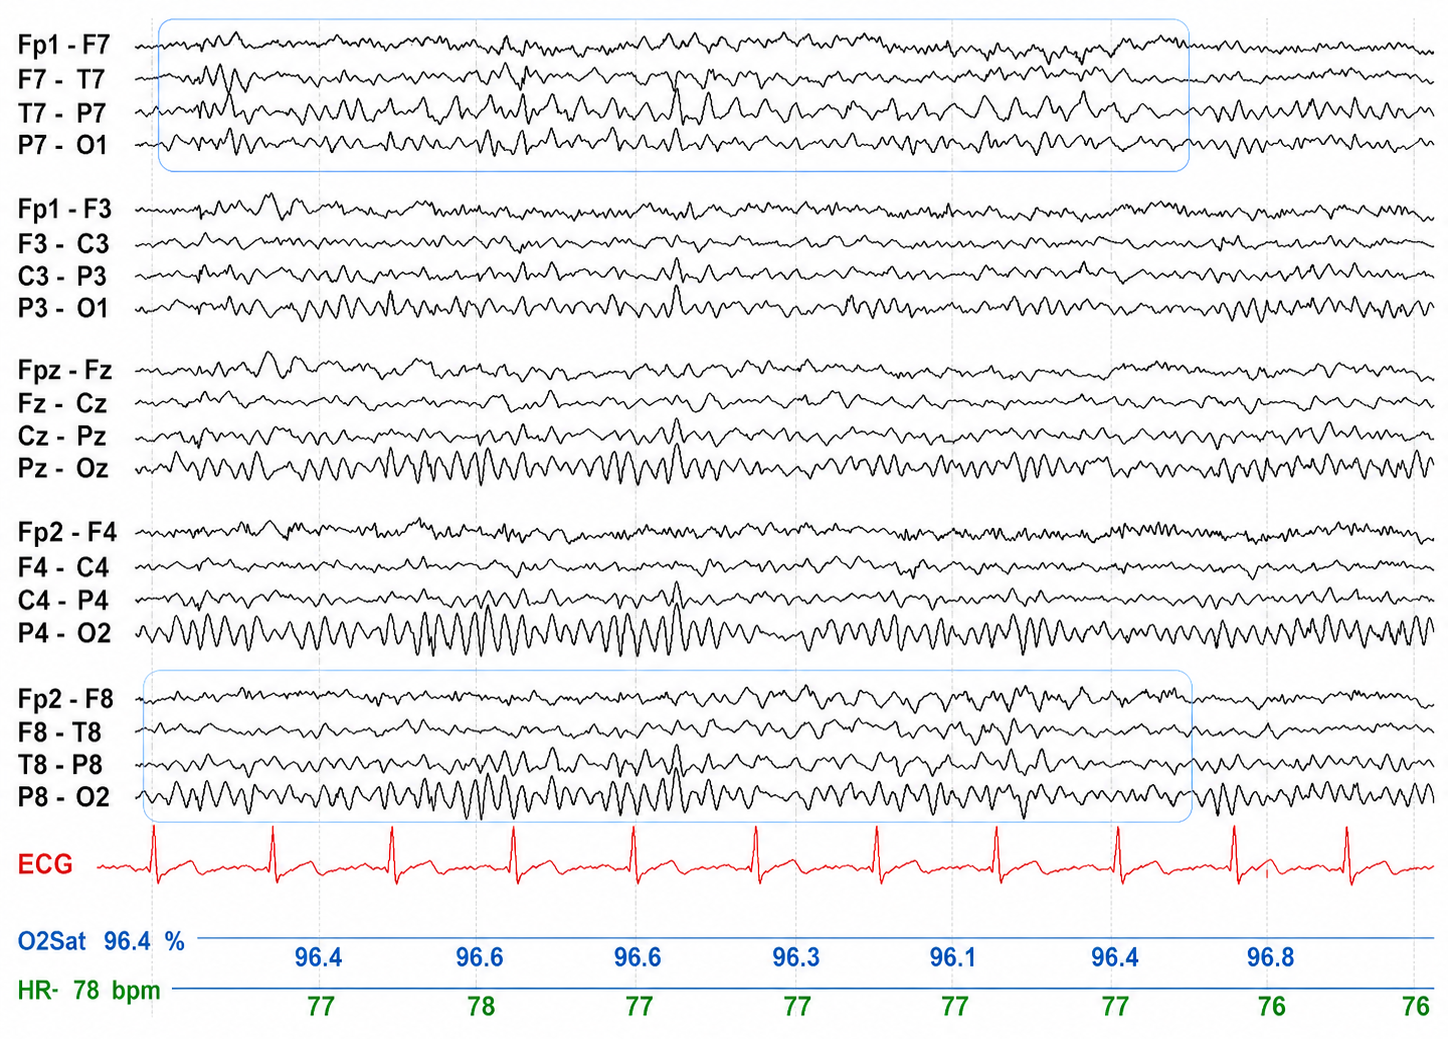
SREDA (or SCREDA) is sub-clinical rhythmic electrographic discharges in adults. In the bilateral synchronous parieto-temporal sharp theta rhythm graphic below, black arrows show the onset of periodic posterior-predominant sharply contoured waveforms. The waveforms become rhythmic and then resolve at the latter portion of the figure.
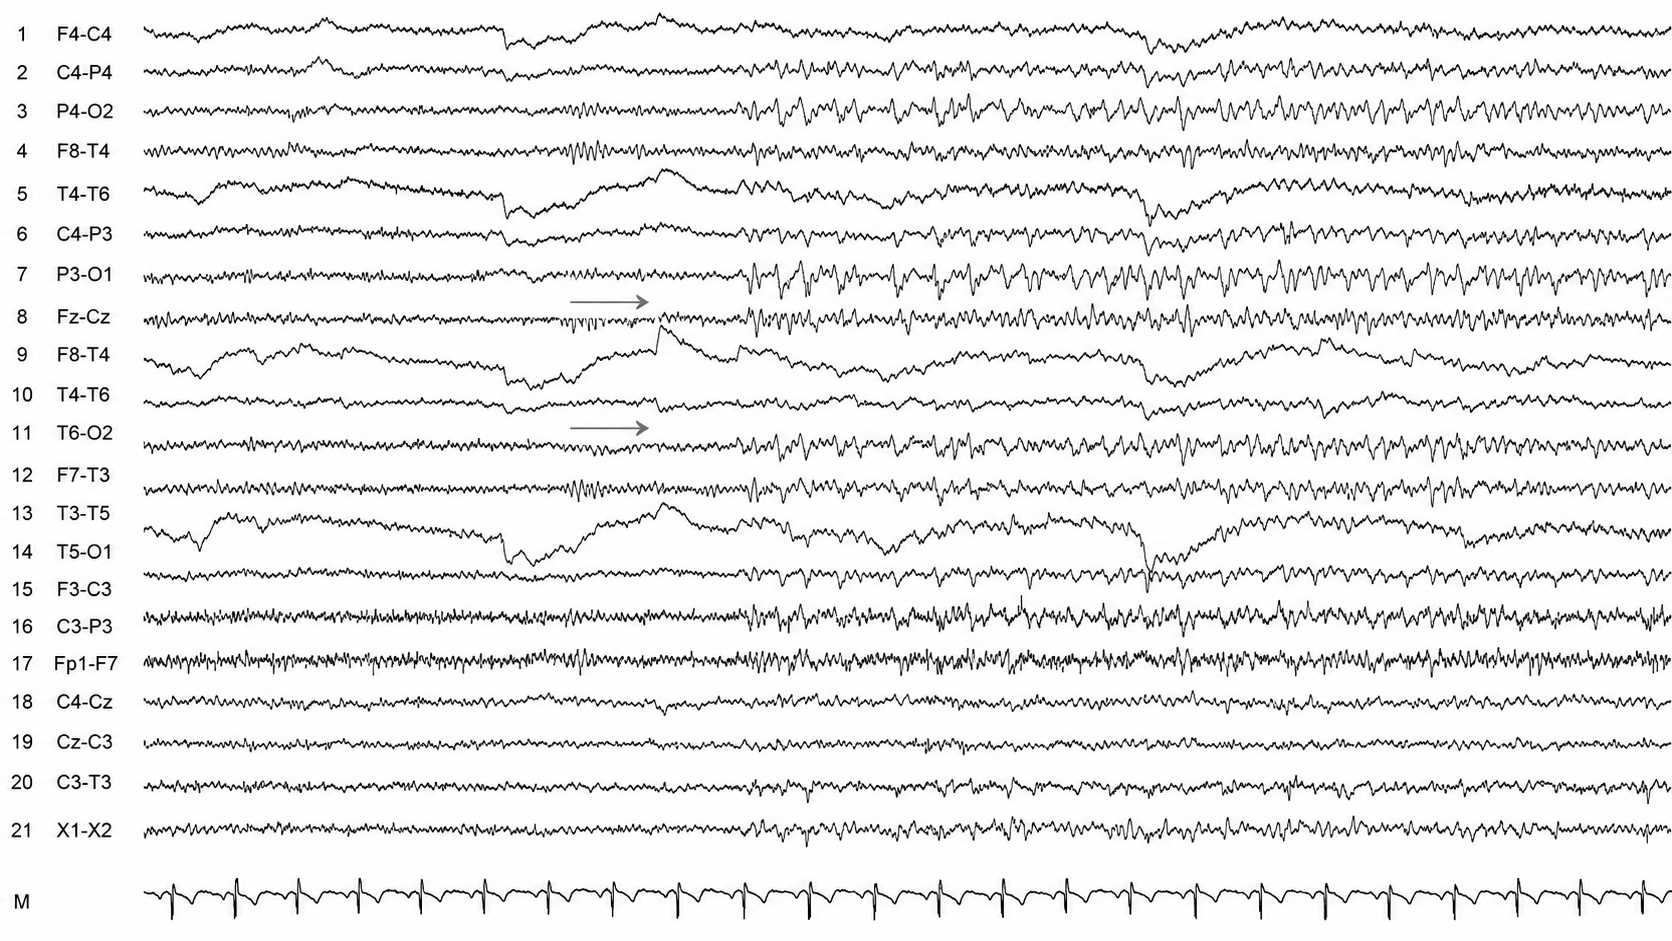
Arrows mark the onset of a sharply contoured, posterior-predominant rhythmic theta discharge that builds across the page. This is SREDA, and it is benign. It is worth studying precisely because it mimics an electrographic seizure and is frequently mistaken for one. Three features separate them: SREDA shows some change in frequency but no spatial or topographic evolution, it produces no clinical change on response testing, and it is not followed by postictal slowing. Calling this tracing a seizure is exactly the error the pattern exists to teach you to avoid.
Wicket waves exhibit an arciform appearance, no after-going slow wave, and no background disruption or disturbance. The wicket waves in the graphic below are seen in the left temporal region with phase-reversal at T7 in seconds 3 and 4 of the tracing using longitudinal bipolar montage.
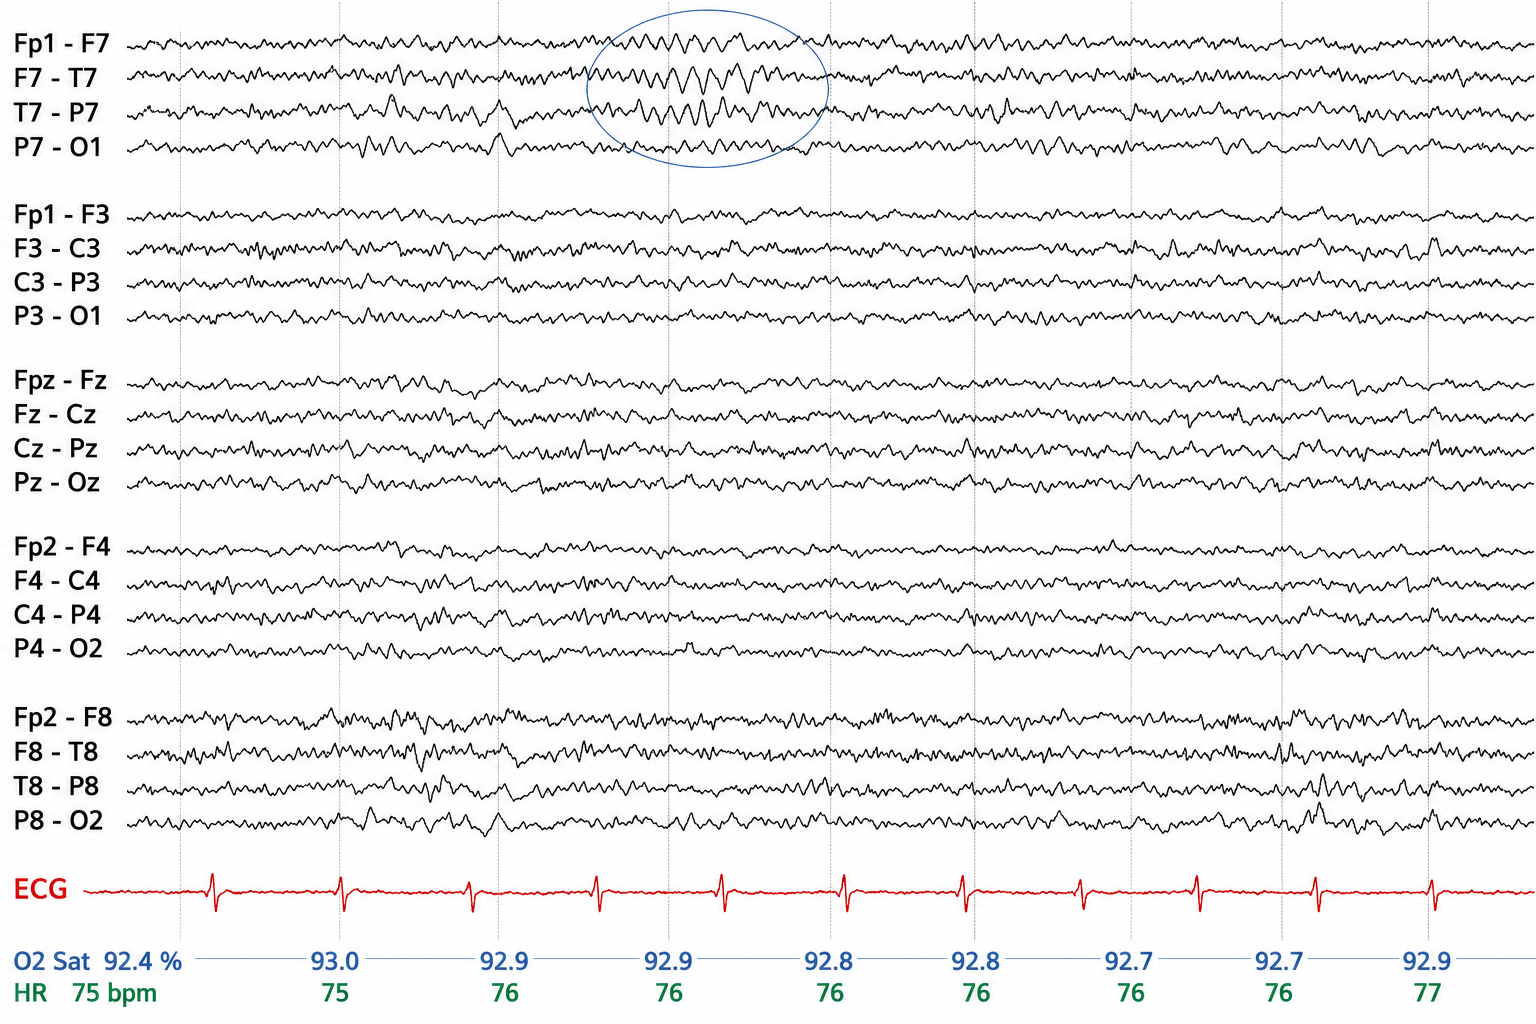
Graphic © Mayo Foundation for Medical Education and Research. Figure courtesy of Jeffrey W. Britton, MD.
Descriptive Terms
Describe what you find in the terms of the American Clinical Neurophysiology Society scales, since these are the terms a trained reviewer expects to read in a report. Amplitude is classified as very low (less than 20 µV), low (20-49 µV), medium (50-149 µV), and high (150 µV or greater). Duration is described as very brief (less than 10 s), brief (10-59 s), intermediate duration (1-9.9 min), long (10-59 min), and very long (1 hour or more). Both scales are exhaustive by design, with no gap between adjacent bins (Hirsch et al., 2021).
Several of the acronyms you will meet in charts and in the literature are not different patterns but the same pattern under two names. When the American Clinical Neurophysiology Society standardized its critical care terminology, PLEDs became LPDs, BIPLEDs became BIPDs, GPEDs became GPDs, and FIRDA was absorbed into a described form of GRDA (Hirsch et al., 2013, 2021). The revision deliberately removed the word epileptiform from purely descriptive labels, because it smuggled an unproven ictal interpretation into what was meant to be a neutral description. The older acronyms are retained here because you will still encounter them in charts and in the literature, and a report that mixes the two vocabularies can be read as describing two findings where there is one. For focal patterns, describe the location with R (right), L (left), A (anterior), and P (posterior).
EEG Biomarkers and Clinical Utility
The EEG is a critical tool for identifying electrophysiological biomarkers that reflect diverse patterns of cortical and subcortical dysfunction. Diffuse slowing is the hallmark of encephalopathy, a reversible condition caused by metabolic, hypoxic, or toxic disturbances. Other EEG biomarkers, such as intermittent epileptiform discharges and spindling excessive beta, indicate cortical hyperexcitability or dysregulation that frequently presents in psychiatric and neurodevelopmental populations (Boutros et al., 2016; Johnstone et al., 2005; Swatzyna et al., 2022, 2024).
This section examines these three biomarkers individually, tracing their defining electrophysiological signatures, associated behavioral presentations, underlying neurophysiology, and implications for differential diagnosis and targeted treatment. By distinguishing between these biomarkers and avoiding the overgeneralization of their significance, you can adopt a more nuanced, physiologically grounded approach to complex psychiatric and neurological presentations.
Diffuse Slowing as a Marker of Encephalopathy
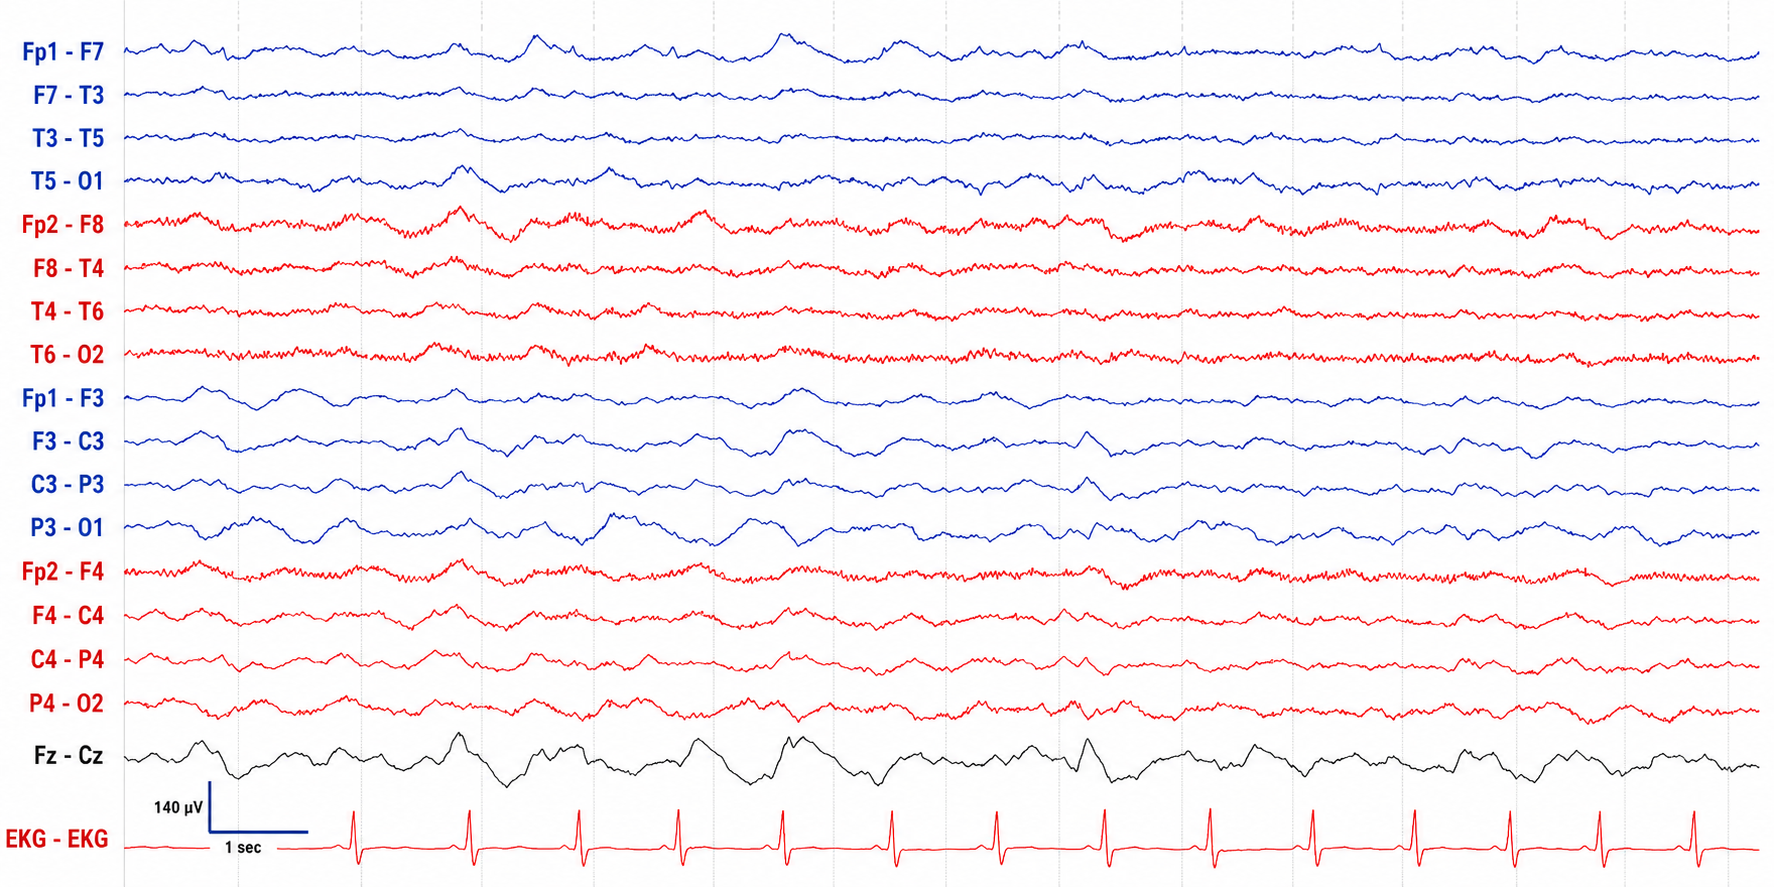
Diffuse slowing is the canonical EEG indicator of encephalopathy, defined by the replacement of the normal alpha rhythm (8-12 Hz) with widespread delta (0.5-4 Hz) or theta (4-7 Hz) activity.
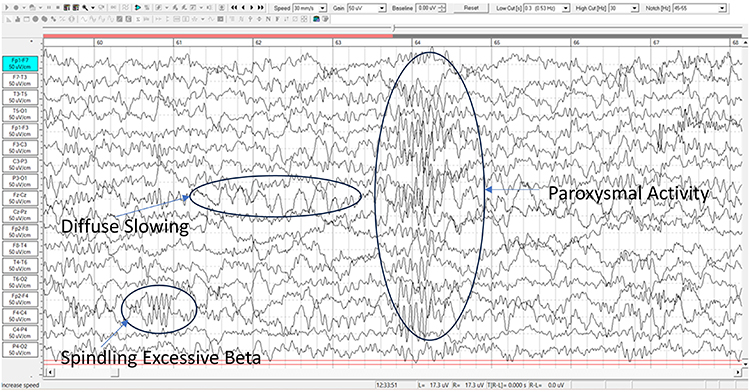
Encephalopathy: 13-year-old male with lead toxicity. Generalized mild slow pattern consistent with metabolic, toxic, or anoxic encephalopathy. Graphic courtesy of Dr. Swatzyna.
This pattern reflects disruption of thalamocortical circuits and diminished cortical responsiveness due to systemic metabolic, toxic, or hypoxic insults (Brenner, 2021; Swatzyna et al., 2024). Unlike focal slowing, which is restricted to a single cortical region and may indicate localized structural pathology, diffuse slowing signifies widespread cortical and subcortical disconnection or dysfunction (Swatzyna et al., 2024; Yamada & Meng, 2018). This pattern often emerges in systemic medical conditions such as metabolic encephalopathy, hypoxic injury, or toxic exposure.
From a physiological perspective, disruptions to thalamocortical relay loops and diminished cholinergic or mitochondrial function drive the shift from alpha resonance to lower-frequency oscillations. In the clinical EEG, diffuse slowing presents with a posterior dominant rhythm below 8 Hz, reduced reactivity to eye opening, and blunted engagement with mental tasks. EEGs showing diffuse slowing often lack reactivity to eye opening or auditory commands, particularly in the posterior dominant rhythm.
Clinically, diffuse slowing is highly significant and predictive of poor outcomes. Large-scale cohort studies have shown that its presence on an EEG is associated with a twofold increase in 30-day mortality among hospitalized patients, independent of age or comorbidity burden. In outpatient psychiatric populations, particularly those with refractory symptoms or abrupt onset of behavioral changes, diffuse slowing appears in approximately 11 percent of adults and up to 14 percent of children.
The morphological presentation varies. In hepatic or renal encephalopathies, slowing is typically frontally maximal and may present as waxing-and-waning frontal intermittent rhythmic delta activity. A theta-delta fusion pattern is more common following diffuse axonal injury. Sedative-induced beta activity may obscure slow-wave patterns unless appropriate low-frequency filters, such as 0.3 Hz, are employed (Swatzyna et al., 2024). Inter-rater agreement for detecting diffuse slowing is modest, with kappa near 0.46, but it improves significantly when quantitative spectral overlays and low-frequency montages are used.
Routine EEG captures mild encephalopathy in only 40 to 60% of cases, with sensitivity increasing substantially through extended monitoring or activation techniques such as hyperventilation or sleep deprivation (Grant et al., 2020). Quantitative EEG improves detection through spectral analysis, enabling topographic mapping of slow-wave distribution and amplitude asymmetries. Anterior-predominant slowing correlates with executive dysfunction, while posterior slowing is linked to visuospatial deficits and emotional detachment (Rios & Sousa, 2020).
Topographic analysis of diffuse slowing reveals amplitude gradients that correspond with distinct symptom profiles. Frontal-predominant slowing often correlates with executive dysfunction, impulsivity, and apathy, symptoms linked to frontostriatal and default-mode network hypoactivation. Posterior-dominant slowing, by contrast, is associated with visuospatial deficits and emotional blunting. Studies using sLORETA and magnetoencephalography support these associations, showing maximal delta current density in the midline thalamus and precuneus. These findings emphasize the importance of noting spatial distribution in EEG reports, which allows for tailored psychiatric and neurocognitive interventions.
Misinterpretation of diffuse slowing can lead to significant clinical error. Dismissing it as nonspecific may result in the unnecessary escalation of dopamine-blocking agents, worsening catatonia or confusion, while mislabeling age-related slowing as encephalopathy can prompt unnecessary diagnostics. Educational gaps among neurologists and psychiatrists further complicate interpretation, since most neurology residencies devote fewer than 15 hours to non-epileptic EEG interpretation. Structured narrative EEG reports that describe background frequency, symmetry, and reactivity, along with clinical correlations, can mitigate misinterpretation and promote interdisciplinary communication.
Functionally, diffuse slowing affects processing speed, working memory, and sustained attention. Patients may present with vague complaints of brain fog, cognitive inefficiency, or emotional dysregulation. In children, this may mimic attention-deficit/hyperactivity disorder but without stimulant response. In adults, symptoms are often misattributed to personality disorders or treatment-resistant depression.
Identifying and treating reversible causes such as sleep apnea, hypothyroidism, or substance exposure can reverse EEG slowing and lead to symptomatic improvement. Diffuse slowing therefore serves as a biomarker for cortical inefficiency and a signal to reevaluate pharmacologic and systemic treatment strategies. Structured EEG reports that frame findings within a behavioral context improve communication and reduce unnecessary psychotropic escalation, making diffuse slowing a key target in precision psychiatric practice.
A 46-year-old is referred after two failed antidepressant trials and a working diagnosis of treatment-resistant depression. His EEG shows a posterior dominant rhythm at 7.4 Hz with poor reactivity to eye opening and frontally maximal slowing. Read as nonspecific, this record produces a third medication trial. Read as diffuse slowing, it produces a different question: what systemic process is driving it? A sleep study, thyroid panel, and medication and exposure review are the reasonable next steps, because a reversible cause found here can resolve both the EEG finding and the mood presentation that has resisted treatment.
Intermittent Epileptiform Discharges as a Marker of Cortical Hyperexcitability
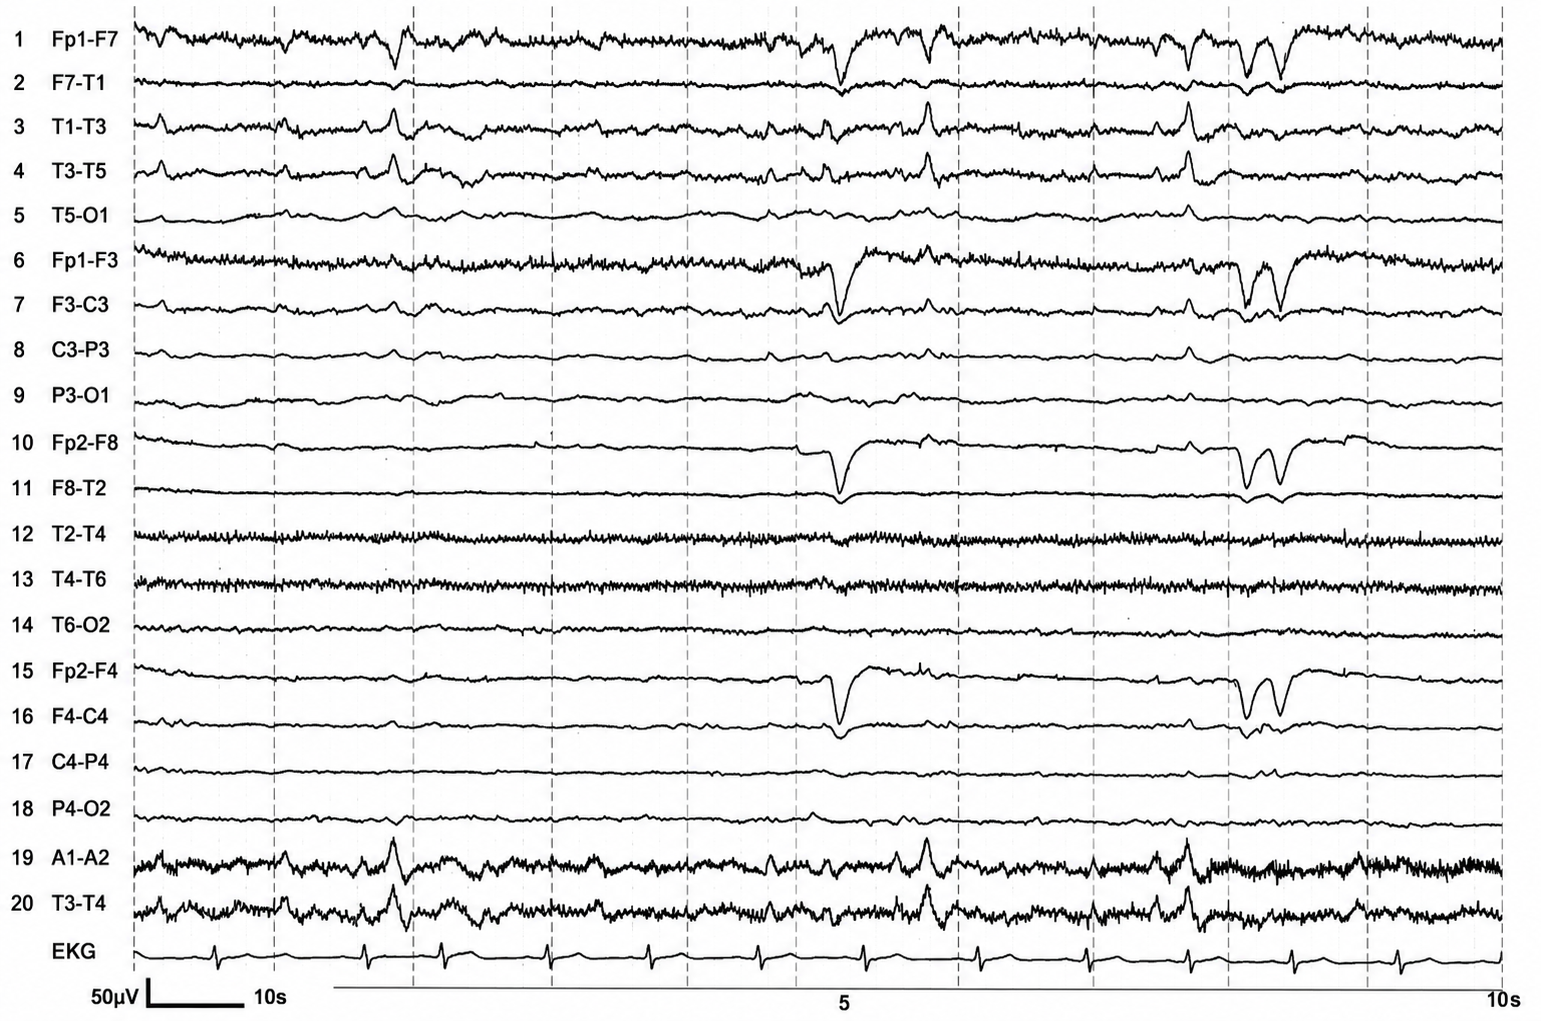
Intermittent epileptiform discharges (IEDs) are paroxysmal waveforms, typically spikes, sharp waves, or spike-and-wave complexes, lasting under 200 milliseconds and reflecting transient cortical hyperexcitability.
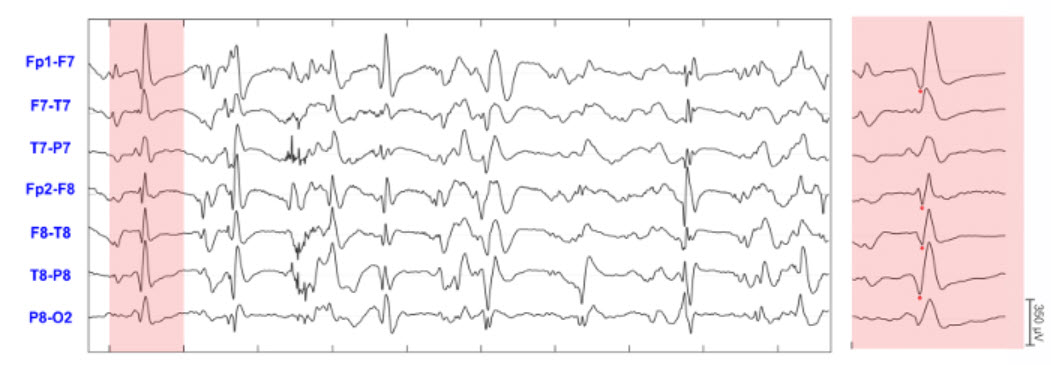
One second of the highlighted section, containing one sharp wave, is presented on the right panels in an extended time scale display. Red dots indicate the peak of the IEDs. The convention for displaying EEG activity in this figure is for up to represent negative while down represents positive (compare Greenfield et al., 2010, pp. 8-9). Pediatric IED graphic courtesy of Papadelis et al. (2016).
Though classically linked to epilepsy, IEDs are also found in neurodevelopmental and psychiatric populations without seizures, where they signal neuronal instability and may contribute to cognitive and emotional dysregulation (Boutros et al., 2016; Swatzyna et al., 2022). IEDs may be focal, multifocal, or generalized, and they are especially prevalent during drowsiness or early non-REM sleep, which is why routine EEG often fails to detect them. Sleep-deprived or overnight EEG increases sensitivity, particularly in children with ADHD or autism spectrum disorder, where prevalence can exceed 25% (Hara, 2007; Swatzyna et al., 2017).
Swatzyna and colleagues (2022) further explored the prevalence of isolated epileptiform discharges across psychiatric conditions. Their systematic review and cross-sectional analysis found that IEDs occurred in 25.2% of ADHD cases and 63.3% of ASD cases. Rates for mood and anxiety disorders were lower but still significant, with cross-sectional data suggesting rates of approximately 39%.
These findings underscore the value of EEG as a tool for guiding medication selection, especially in refractory psychiatric cases where a trial-and-error approach can be harmful. Identifying IEDs may prevent inappropriate use of psychotropics that exacerbate cortical excitability. Isolated discharges have also been observed in Alzheimer's disease and other cognitive impairments, raising important implications for broader diagnostic strategies. EEG may even help determine driving safety in patients with subclinical discharges.
The clinical relevance of IEDs depends on their anatomical location. Frontal IEDs are associated with disinhibition and irritability, temporal discharges with memory impairment and mood lability, and parietal discharges with sensory integration deficits. When misattributed to primary psychiatric conditions, such as mood or personality disorders, IEDs may lead to pharmacologic mismanagement. Selective serotonin reuptake inhibitors, stimulants, and antipsychotics can lower seizure threshold and exacerbate cortical instability in susceptible individuals (Swatzyna et al., 2022).
Conversely, EEG-guided interventions, including low-dose anticonvulsants or targeted neurofeedback, can reduce discharge frequency and improve behavioral outcomes. In patients with treatment resistance, IEDs should be considered a red flag prompting extended EEG evaluation and reconsideration of diagnosis. Their identification reflects the potential for subclinical electrophysiological contributors to cognitive and affective dysfunction, separate from encephalopathy.
Spindling Excessive Beta as a Marker of Cortical Hyperarousal
Spindling excessive beta (SEB) is defined as rhythmic beta activity (13-30 Hz) with a spindle-shaped morphology that occurs diffusely in awake EEG recordings.
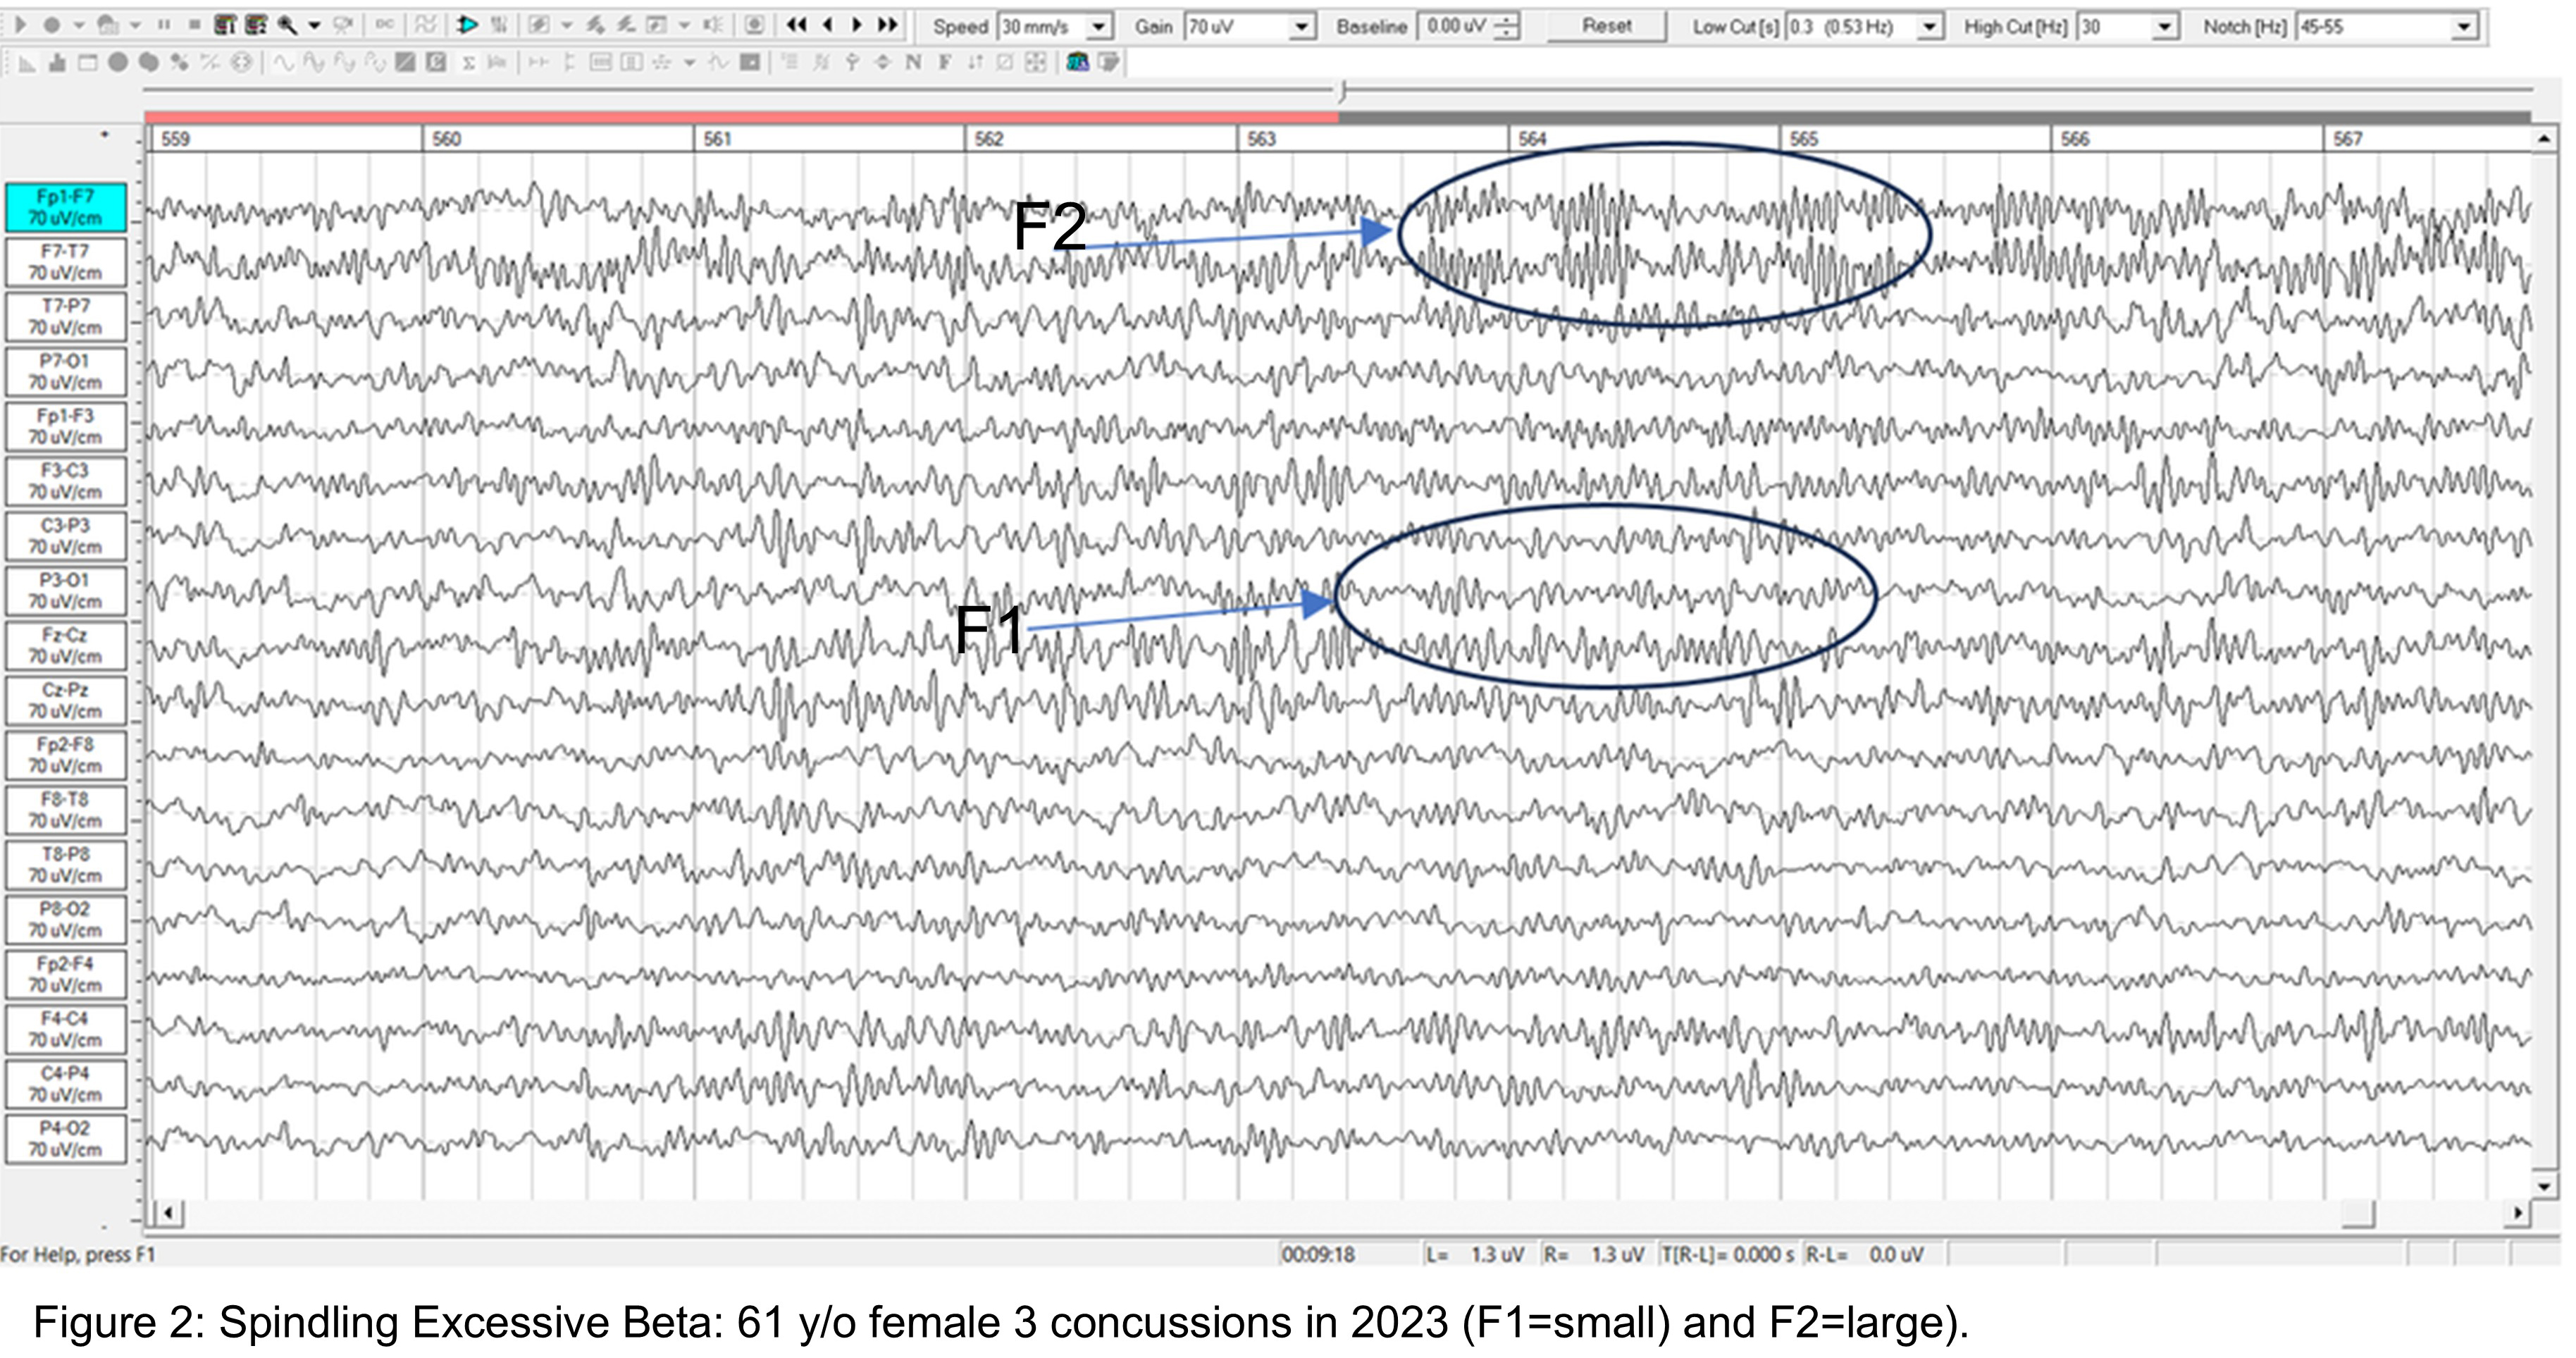
Spindling excessive beta in a 61-year-old female. Graphic courtesy of Dr. Swatzyna.
Unlike physiologic beta, SEB has a waxing-and-waning pattern resembling sleep spindles but appears during wakefulness in individuals with cortical hyperarousal (Gibbs & Gibbs, 1950; Johnstone et al., 2005). SEB has been described as a non-specific transdiagnostic marker of cortical dysregulation and is frequently observed in patients with ADHD, PTSD, generalized anxiety disorder, and ASD, particularly in refractory presentations (Swatzyna et al., 2015, 2024). In a study of over 1,200 medication-refractory patients, SEB was present in more than 25% of cases and was often associated with treatment intolerance and paradoxical medication reactions (Swatzyna et al., 2024).
SEB is thought to arise from dysfunctional GABAergic modulation and disrupted thalamocortical feedback, sometimes precipitated or exacerbated by chronic benzodiazepine use, stimulant exposure, or environmental toxins such as lead and mercury (Krepel et al., 2021; Swatzyna et al., 2024). Behavioral correlates include insomnia, anxiety, irritability, and a heightened startle reflex, while functional EEG analysis often reveals elevated beta power frontocentrally.
SEB does not indicate encephalopathy but represents a distinct electrophysiological phenotype of cortical overactivation. Clinical misinterpretation of SEB as a sign of vigilance or medication responsiveness may lead to inappropriate stimulant or sedative use, worsening symptoms. When SEB is identified, assess for hyperarousal syndromes and consider down-training protocols via neurofeedback, medication tapering, or detoxification strategies. As with IEDs, SEB should prompt broader evaluation for underlying contributors to neuropsychiatric instability and guide individualized, physiology-informed treatment.
Distinct Biomarkers, Divergent Mechanisms
Diffuse slowing, intermittent epileptiform discharges, and spindling excessive beta are three well-established EEG biomarkers with distinct physiological origins and clinical implications. Diffuse slowing is a marker of encephalopathy and global cortical underactivation caused by systemic dysfunction (Brenner, 2021; Swatzyna et al., 2024). IEDs signify localized cortical hyperexcitability, often observed in seizure-prone or neurodevelopmentally vulnerable individuals (Swatzyna et al., 2022). SEB represents excessive beta synchrony linked to cortical hyperarousal and dysregulated thalamocortical gating (Johnstone et al., 2005; Krepel et al., 2021).
Though these markers may coexist in complex cases, they require different diagnostic and therapeutic approaches. Recognizing their unique signatures and pathophysiological underpinnings enables you to reframe treatment-resistant psychiatric presentations through a neurophysiological lens. EEG biomarkers thus provide a bridge between subjective symptoms and objective brain function, guiding precision medicine across neurology, psychiatry, and integrative care.
Three biomarkers, three mechanisms, three responses. Diffuse slowing replaces alpha with delta or theta, reflects systemic metabolic, toxic, or hypoxic insult, doubles 30-day mortality in hospitalized patients, and should send you looking for a reversible cause. Intermittent epileptiform discharges last under 200 ms, mark focal cortical hyperexcitability, appear in 25.2% of ADHD and 63.3% of ASD cases, and warn against psychotropics that lower seizure threshold. Spindling excessive beta is waxing-and-waning beta during wakefulness, marks cortical hyperarousal rather than encephalopathy, appears in over 25% of medication-refractory patients, and calls for down-training rather than more stimulation.
Check Your Understanding
- What EEG features define diffuse slowing, and how does it differ from focal slowing?
- How does the topographic distribution of slowing relate to the symptom profile you should expect?
- Why does routine EEG often miss intermittent epileptiform discharges, and what changes that?
- What prevalence rates did Swatzyna and colleagues (2022) report for IEDs in ADHD and in ASD?
- How would you distinguish spindling excessive beta from physiologic beta, and what treatment direction does SEB suggest?
Cutting-Edge Topics in qEEG Research
EEG as a Guide to Medication Selection
The traditional path for a refractory psychiatric patient is another medication trial, then another. Swatzyna and colleagues (2015, 2022, 2024) have argued for inserting a routine EEG into that sequence, on the grounds that IEDs and SEB predict which patients will tolerate which agents. The practical claim is modest but consequential: an EEG that shows cortical hyperexcitability tells you which drug classes are likely to make things worse, which is information no rating scale provides.
Transdiagnostic Markers Versus Diagnostic Categories
SEB appears across ADHD, PTSD, generalized anxiety disorder, and autism spectrum disorder without belonging to any of them. That pattern fits the Research Domain Criteria framework, which organizes psychopathology around biological and psychological processes rather than DSM categories. If markers like SEB continue to cut across diagnoses, EEG may prove more useful for selecting a treatment mechanism than for confirming a diagnostic label.
Improving Inter-Rater Reliability for Diffuse Slowing
Agreement between reviewers on the presence of diffuse slowing sits near a kappa of 0.46, which is modest for a finding tied to a twofold mortality increase. Quantitative spectral overlays and low-frequency montages improve that agreement measurably. The emerging standard is co-review: at centers like the Houston Neuroscience Brain Center, a neuropsychiatrist and an EEG-certified neurologist read the same record, and structured narrative reporting of background frequency, symmetry, and reactivity carries the finding into the clinical record in a form the referring clinician can act on.
Toxic Exposure and the Hyperaroused Cortex
Lead and mercury exposure, chronic benzodiazepine use, and stimulant exposure have all been implicated in SEB, which places environmental and pharmacologic history squarely inside the EEG interpretation. This is a reminder that an abnormal record is a question rather than an answer. When SEB appears, the exposure history may explain more than the presenting complaint does.
Assignment
Now that you have completed this module, describe how you would respond to each of the three biomarkers covered here if you found it in a client referred for treatment-resistant symptoms. For each biomarker, state the next assessment step you would take and the treatment direction you would avoid.
Glossary
abnormal periodic paroxysmal patterns: EEG discharges that recur at nearly regular intervals, either generalized or lateralized to one hemisphere, signaling acute cerebral dysfunction; current terminology calls these generalized and lateralized periodic discharges.
abnormal slow activity: delta or theta activity appearing during wakefulness where faster rhythms are expected, occurring intermittently or persistently and either generalized or focal, and indicating cerebral dysfunction.
amplitude: the magnitude of a signal's excursion from a specified reference level, reported using a stated convention such as peak, peak-to-peak, or RMS.
benign epileptiform transients of sleep (BETS): sharp waves seen alone or as a low-amplitude spike with a smaller after-going slow wave, monophasic or diphasic, that occur during light sleep without disturbing background activity and do not progress.
benign small sharp spikes (BSSS): another name for benign epileptiform transients of sleep.
bilateral independent periodic discharges (BIPDs): asynchronous discharges that occur independently in the left and right hemispheres, appear as sharp waves or spikes, measure 100-300 µV, and recur at rates up to 3 Hz.
bilateral independent periodic lateralized epileptiform discharges (BIPLEDs): asynchronous sharp waves or spikes recurring independently over each hemisphere at 0.5-1.5 Hz and 40-100 µV in bipolar montages; renamed bilateral independent periodic discharges (BIPDs) in the ACNS 2021 terminology.
brief duration: the ACNS duration category for rhythmic or periodic EEG patterns lasting 10-59 seconds.
diffuse slowing: the replacement of the normal alpha rhythm with widespread delta or theta activity, reflecting global cortical and subcortical dysfunction and serving as the canonical EEG indicator of encephalopathy.
encephalopathy: any diffuse disease of the brain that alters brain function or structure, often characterized by altered mental states and various neurological symptoms.
epileptogenic patterns of doubtful significance: brief EEG patterns not associated with seizures or neurological disorders, such as 6-Hz spike-and-slow-wave, 14- and 6-Hz positive bursts, benign epileptiform transients of sleep (BETS), rhythmical mid-temporal discharge (RMTD), small sharp spikes (SSS), and wicket spikes.
focal and lateralized intermittent slow activity: EEG activity under 8 Hz usually confined to a single electrode or a couple of adjacent electrodes. These bursts have an irregular appearance, are composed of several frequencies, and rarely involve an entire hemisphere.
focal slowing (FS): slow-wave activity, typically delta (1-4 Hz) or theta (4-7 Hz), confined to one brain region and indicating localized cerebral dysfunction.
frontal intermittent rhythmic delta activity (FIRDA): a waxing-and-waning pattern of rhythmic delta waves appearing intermittently over the frontal regions, termed frontally predominant generalized rhythmic delta activity under current ACNS terminology; it most often signals metabolic encephalopathy.
generalized intermittent slow activity: asynchronous EEG activity under 8 Hz that involves the majority or all of both hemispheres. These bursts typically consist of polymorphic delta.
generalized periodic discharges (GPDs): repetitive, broadly distributed epileptiform-appearing waveforms that recur at regular intervals, often with a triphasic morphology. They are common in toxic and metabolic encephalopathies and require clinical correlation rather than a presumption of epilepsy.
generalized periodic epileptiform discharges (GPEDs): the pre-2012 name for generalized periodic discharges (GPDs); periodic sharp waves or spikes occurring synchronously in both hemispheres. Not a separate pattern from GPDs.
generalized periodic paroxysmal patterns: epileptiform discharges in the same areas of both hemispheres. The waveforms exhibit similar composition, amplitude, and phase in each hemisphere but may vary slightly within a hemisphere.
generalized rhythmic delta activity (GRDA): rhythmic delta waves under 4 Hz occurring bilaterally and synchronously over both hemispheres; the frontally predominant form replaced the older label FIRDA in the 2012 ACNS nomenclature.
hertz (Hz): the SI unit of frequency equal to one cycle per second.
high amplitude: 150 µV or greater on the ACNS scale.
ictal epileptiform discharges: discharges occurring during a seizure, which may include 3-Hz spike-and-wave, slow spike-and-wave, sharp-and-slow-wave discharges, amplitude and frequency fluctuations in rhythms of 10 Hz or higher, and irregular multiple spike-and-wave discharges.
interictal epileptiform discharges: individual spikes and sharp waves, and complexes containing both waveforms, that last less than 2 s and occur between seizures.
intermediate duration: 1-9.9 minutes on the ACNS scale.
intermittent epileptiform discharges (IEDs): brief paroxysmal EEG waveforms, typically spikes, sharp waves, or spike-and-wave complexes, lasting under 200 ms and reflecting transient cortical hyperexcitability, more properly called interictal epileptiform discharges.
intermittent rhythmic delta activity (IRDA): bilateral synchronous discharges that recur between 2-2.5 Hz and appear in brief bursts.
lateralized periodic discharges (LPDs): unilateral discharges that appear as sharp waves or spikes, measure 100-300 µV, and recur at rates up to 3 Hz.
lateralized periodic paroxysmal patterns: epileptiform discharges that differ from generalized periodic paroxysmal patterns in their unilateral distribution. Both patterns share the same waveform morphology.
lateralized rhythmic delta activity (LRDA): unilateral discharges that recur at rates up to 3 Hz. LRDA runs typically last less than 1 minute and are shorter than LPDs.
long duration: 10-59 minutes on the ACNS scale.
low amplitude: 20-49 µV on the ACNS scale.
medium amplitude: 50-149 µV on the ACNS scale.
microvolt (µV): a unit of electric potential equal to 10⁻⁶ volt.
multifocal (Mf): an EEG abnormality detected at several scalp locations.
paroxysmal epileptogenic abnormalities: interictal epileptiform discharges, both focal and generalized, ictal discharges, secondary bilateral synchrony, and epileptiform patterns of doubtful significance.
periodic lateralized epileptiform discharges (PLEDs): lateralized or focal discharges with regular periodic negative spike-and-sharp wave patterns of 20-1000 ms duration and 50-300 µV amplitude, now termed lateralized periodic discharges (LPDs) in ACNS terminology.
persistent slow activity: continuous theta and delta waveforms whose distribution may be anterior or widespread in encephalopathies.
positive occipital sharp transients of sleep (POSTS): sharply contoured surface-positive transients at 4-5 Hz, seen alone or in groups over occipital areas.
posterior dominant rhythm (PDR): the dominant occipital rhythm during relaxed wakefulness with eyes closed, usually in the alpha range in healthy adults and attenuated by eye opening.
quantitative EEG (qEEG): the numerical analysis of digitized EEG features, such as spectral power, asymmetry, and connectivity, sometimes compared with normative databases; no universal minimum channel count defines it.
Research Domain Criteria (RDoC): a National Institute of Mental Health research framework that integrates genetics, neuroscience, and behavioral science to study biological and psychological processes cutting across traditional diagnostic categories.
rhythmical mid-temporal discharge (RMTD): notched rhythmic theta waveforms localized to the temporal regions, some of which are sharply contoured, appearing during drowsiness and carrying no association with epilepsy.
secondary bilateral synchrony (SBS): generalized, bilaterally synchronous epileptiform discharges driven by a unilateral focal cortical generator, most often frontal, that spread through transcallosal and subcortical pathways.
sharp wave: an epileptiform transient with a pointed peak and duration of approximately 70 to 200 ms under standard EEG display conditions.
spike: a transient with a pointed peak and a 20 to under 70 ms duration.
spindling excessive beta (SEB): an EEG pattern of fast beta activity with a spindle-like appearance and an anterior emphasis, with a reported mean frequency of 20.6 Hz (SD = 4.1 Hz) spanning roughly 14-30 Hz.
SREDA (or SCREDA): subclinical rhythmic electrographic discharges in adults; a benign posterior-predominant rhythmic sharp theta pattern that mimics an electrographic seizure but shows no spatial evolution, no clinical change on response testing, and no postictal slowing.
stimulus-induced rhythmic, periodic, or ictal discharges (SIRPIDs): EEG discharges reliably produced by alerting stimuli.
theta-delta fusion pattern: an EEG background in which a slowed posterior dominant rhythm in the theta range blends continuously with lower-frequency delta activity across widespread regions. It typically follows diffuse axonal injury and can be mistaken for drowsiness or medication effects.
transient (EEG): an isolated waveform or brief sequence that is distinguishable from the ongoing EEG background.
typical amplitude: 20-50 µV, depending on age.
very brief duration: less than 10 s on the ACNS scale.
very long duration: longer than 1 hour on the ACNS scale.
very low amplitude: less than 20 µV on the ACNS scale.
wicket spikes: EEG activity with an arciform appearance, no after-going slow wave, and no background disruption or disturbance.
Test Yourself on ClassMarker
Click the button below to take a 10-question exam over this entire unit. There is no password.
Review Flash Cards on Quizlet
Click the button below to review our chapter flash cards.
References
Benbadis, S. R., & Rielo, D. A. (2018). Encephalopathic EEG patterns. Medscape. https://emedicine.medscape.com/article/1140530-overview
Fisch, B. J. (1999). Fisch and Spehlmann's EEG primer (3rd ed.). Elsevier.
Gibbs, F. A., & Gibbs, E. L. (1950). Atlas of electroencephalography (Vol. 1). Addison-Wesley.
Greenfield, L. J., Carney, P. R., & Geyer, J. D. (2010). Reading EEGs: A practical approach (2nd ed.). Wolters Kluwer.
Hirsch, L. J., Fong, M. W. K., Leitinger, M., LaRoche, S. M., Beniczky, S., Abend, N. S., Lee, J. W., Wusthoff, C. J., Hahn, C. D., Westover, M. B., Gerard, E. E., Herman, S. T., Haider, H. A., Osman, G., Rodriguez-Ruiz, A., Maciel, C. B., Gilmore, E. J., Fernandez, A., Rosenthal, E. S., . . . Gaspard, N. (2021). American Clinical Neurophysiology Society's standardized critical care EEG terminology: 2021 version. Journal of Clinical Neurophysiology, 38(1), 1–29. https://doi.org/10.1097/WNP.0000000000000806
Hirsch, L. J., LaRoche, S. M., Gaspard, N., Gerard, E., Svoronos, A., Herman, S. T., Mani, R., Arif, H., Jette, N., Minazad, Y., Kerrigan, J. F., Vespa, P., Hantus, S., Claassen, J., Young, G. B., So, E., Kaplan, P. W., Nuwer, M. R., Fountain, N. B., & Drislane, F. W. (2013). American Clinical Neurophysiology Society's standardized critical care EEG terminology: 2012 version. Journal of Clinical Neurophysiology, 30(1), 1–27. https://doi.org/10.1097/WNP.0b013e3182784729
Jin, L. (2007). A reappraisal of secondary bilateral synchrony. Neurology Asia, 12, 29–35. http://www.neurologyasia.org/articles/20071_029.pdf
Johnstone, J., Gunkelman, J., & Lunt, J. (2005). Clinical database development: Characterization of EEG database. Journal of Neurotherapy, 9(3), 27–44. https://doi.org/10.1300/J184v09n03_04
Krepel, N., van Dijk, H., Sack, A. T., Swatzyna, R. J., & Arns, M. (2021). To spindle or not to spindle: A replication study into spindling excessive beta as a transdiagnostic EEG feature associated with impulse control. Biological Psychology, 165, 108188. https://doi.org/10.1016/j.biopsycho.2021.108188
Richardson, C. A., & Benbadis, S. R. (2019). Generalized EEG waveform abnormalities. Medscape. https://emedicine.medscape.com/article/1140075-overview
Swatzyna, R. J., Arns, M., Tarnow, J. D., Turner, R. P., Barr, E., MacInerney, E. K., Hoffman, A. M., & Boutros, N. N. (2022). Isolated epileptiform activity in children and adolescents: Prevalence, relevance, and implications for treatment. European Child & Adolescent Psychiatry, 31(4), 545–552. https://doi.org/10.1007/s00787-020-01597-2
Swatzyna, R. J., Brown, T., Henrich, H., & Arns, M. (2024). Evidentiary significance of routine EEG in refractory psychiatric cases. Clinical EEG and Neuroscience. Advance online publication. https://doi.org/10.1177/15500594241234567
Swatzyna, R. J., Kozlowski, G. P., & Tarnow, J. D. (2015). Pharmaco-EEG: Individualized medicine in clinical practice. Clinical EEG and Neuroscience, 46(3), 192–199. https://doi.org/10.1177/1550059414555932
Return to Top