
Editing and Identifying Artifacts
What You Will Learn in This Chapter
Let us be honest about something the textbooks understate: most of what goes wrong in a qEEG happens before anyone opens the analysis software. A clenched jaw, a fluttering eyelid, a cable brushing a chair arm, a client sliding into stage 1 sleep without noticing. Every one of these writes voltage into your record that has nothing to do with the brain, and a database comparison cannot tell the difference.
This unit teaches you to see those intrusions and remove them. You will work through the two families of artifact, physiological and exogenous, and learn the visual signature of each one: the high-frequency buzz of muscle, the frontal deflections of eye movement, the once-per-second march of the ECG, the slow frontal drift of sweat, the flat channel of a bridge, the sudden step of an electrode pop.
You will also learn the practical craft that surrounds artifacting. How much clean data you actually need, why longer recordings are not automatically better, how to keep a client alert, what impedance values are acceptable for clinical work versus publishable research, and what to do when a channel is simply unusable. By the end you should be able to look at a raw tracing and say not only that something is wrong, but what it is and how to prevent it next time.
IQCB Blueprint Coverage: This unit addresses IV. EEG, specifically B. Editing and Identifying Artifacts.
Learning Objectives
After completing this section, you will be able to:
Distinguish physiological artifacts from exogenous artifacts and name the members of each family.
Identify EMG, electro-ocular, cardiac, pulse, sweat, bridging, drowsiness, and evoked potential artifacts from a raw EEG tracing.
Identify movement, 50/60 Hz, field, radiofrequency, impedance, and electrode pop artifacts from a raw EEG tracing.
Explain how high-frequency filter selection changes the apparent amount of muscle contamination in a record.
Describe the amount of clean data required for a valid brain map and explain why longer recordings carry their own risk.
State acceptable skin-electrode impedance values for research and for clinical training, and explain why balance matters as much as magnitude.
Apply preventive strategies that reduce artifact production before recording begins.
Contamination of the EEG by physiological and exogenous artifacts requires that clinicians take extensive precautions, examine the raw EEG record, and remove contaminated epochs through artifacting. Impedance tests and behavioral tests help ensure the fidelity of EEG recording.
Click the button below to hear a full-length lecture over Section B.
BCIA's Neurofeedback Essential Skills List requires applicants to identify and remove artifact sources in EEG recordings. Review the Technical unit to recognize normal EEG patterns and identify and correct noncerebral origin signals like bridging artifacts. Once you understand the mechanics and appearance of common artifacts, Peper and colleagues (2008) recommend that you intentionally reproduce them so that you learn to recognize and prevent them.
How Much Clean Data Do You Need?
Brain map validity depends on the integrity of the raw EEG, and the published requirements are more demanding than clinical habit sometimes assumes. The International QEEG Certification Board and the EEG and Clinical Neuroscience Society specify a minimum of 1 minute of artifact-free data for database comparison, ideally 2 to 5 minutes, with no selected segment shorter than 1 second. They assume a raw record of roughly 10 minutes each of eyes-open and eyes-closed recording (International QEEG Certification Board, n.d.; Sinha et al., 2016). Select that clean data separately for each condition rather than pooling the two.
Realize that longer recordings risk increased drowsiness artifacts and sleep. Therefore, speaking to the client occasionally to help them maintain alertness is helpful. Simply saying how much time is left every 1-2 minutes is usually enough.
Stage 1 sleep is a subtle, drowsy state that clients often do not recognize. This state change is seen as a decrease in alpha and an increase in theta amplitudes. Slow eye-rolling movements and decreased EMG and beta will be observed. Note the increased theta amplitudes in the spectral displays for channels 1 and 2.
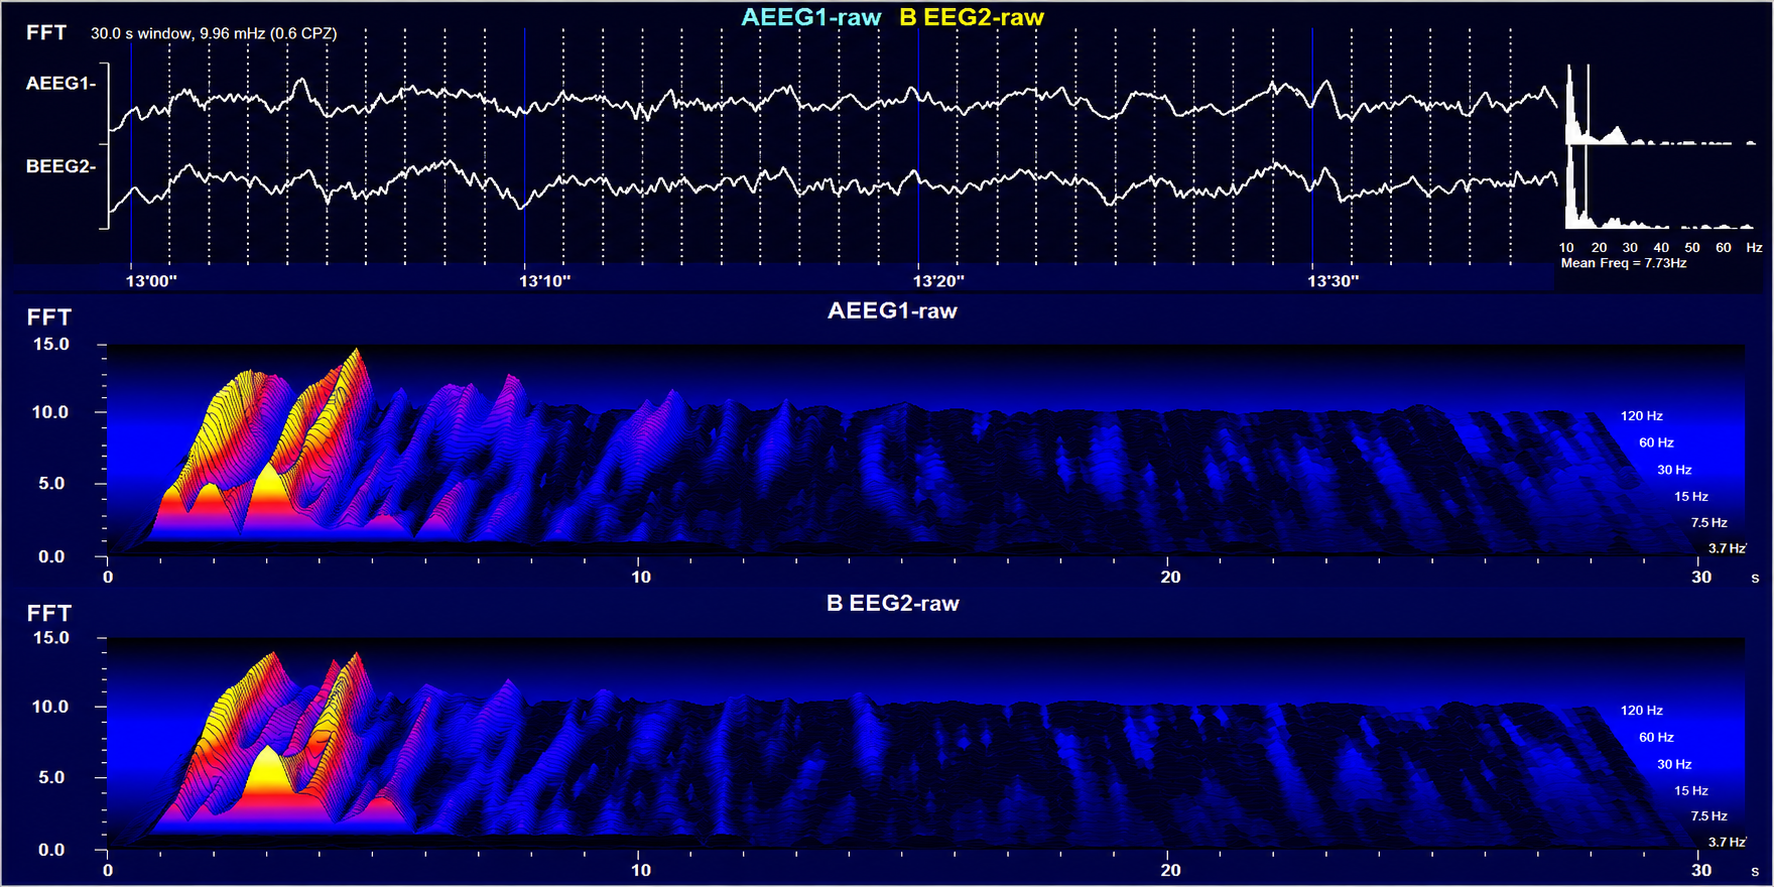
Stage 1 sleep graphic © John S. Anderson. A two-channel display: raw EEG from AEEG1 and BEEG2 across a 30-second window, above waterfall spectrograms for each channel whose logarithmic frequency axis runs from about 3.7 Hz to 120 Hz. The high-power peaks cluster at the low end of that axis and the two channels track each other closely, showing the rise in theta amplitude that marks the drift into Stage 1 sleep. The reported mean frequency of 7.73 Hz sits at the theta-alpha boundary; read the peaks rather than the mean, because it is the shift of power down into theta, not a burst of alpha, that identifies this state.
The less frequent the artifact, the shorter the required recording period. Disable low-pass and high-pass filters before editing to visualize electro-ocular and SEMG artifacts better.
Worst case, as with a hyperactive child, none of the EEG channels may contain usable data, and you will need to repeat the assessment. Where artifact only contaminates a few channels, you may base the assessment on the clean channels (Demos, 2019).
Strategies to Reduce Artifacts
Demos (2019) recommends several precautions to reduce artifacts in raw EEG recordings:
Demonstrate how to create artifacts for your clients using screen displays while they clench their teeth, move their eyes, blink, swallow, and fidget.
Confirm the cap fits properly.
Use reclining chairs with negligible neck cushioning that can force the head downward, to minimize SEMG artifacts.
Limit eyelid movement with cotton balls gently touching the closed eyelids, secured by a loose sleep mask, flexible band, or tape in the eyes-closed recording. There should be no pressure against the eyes.
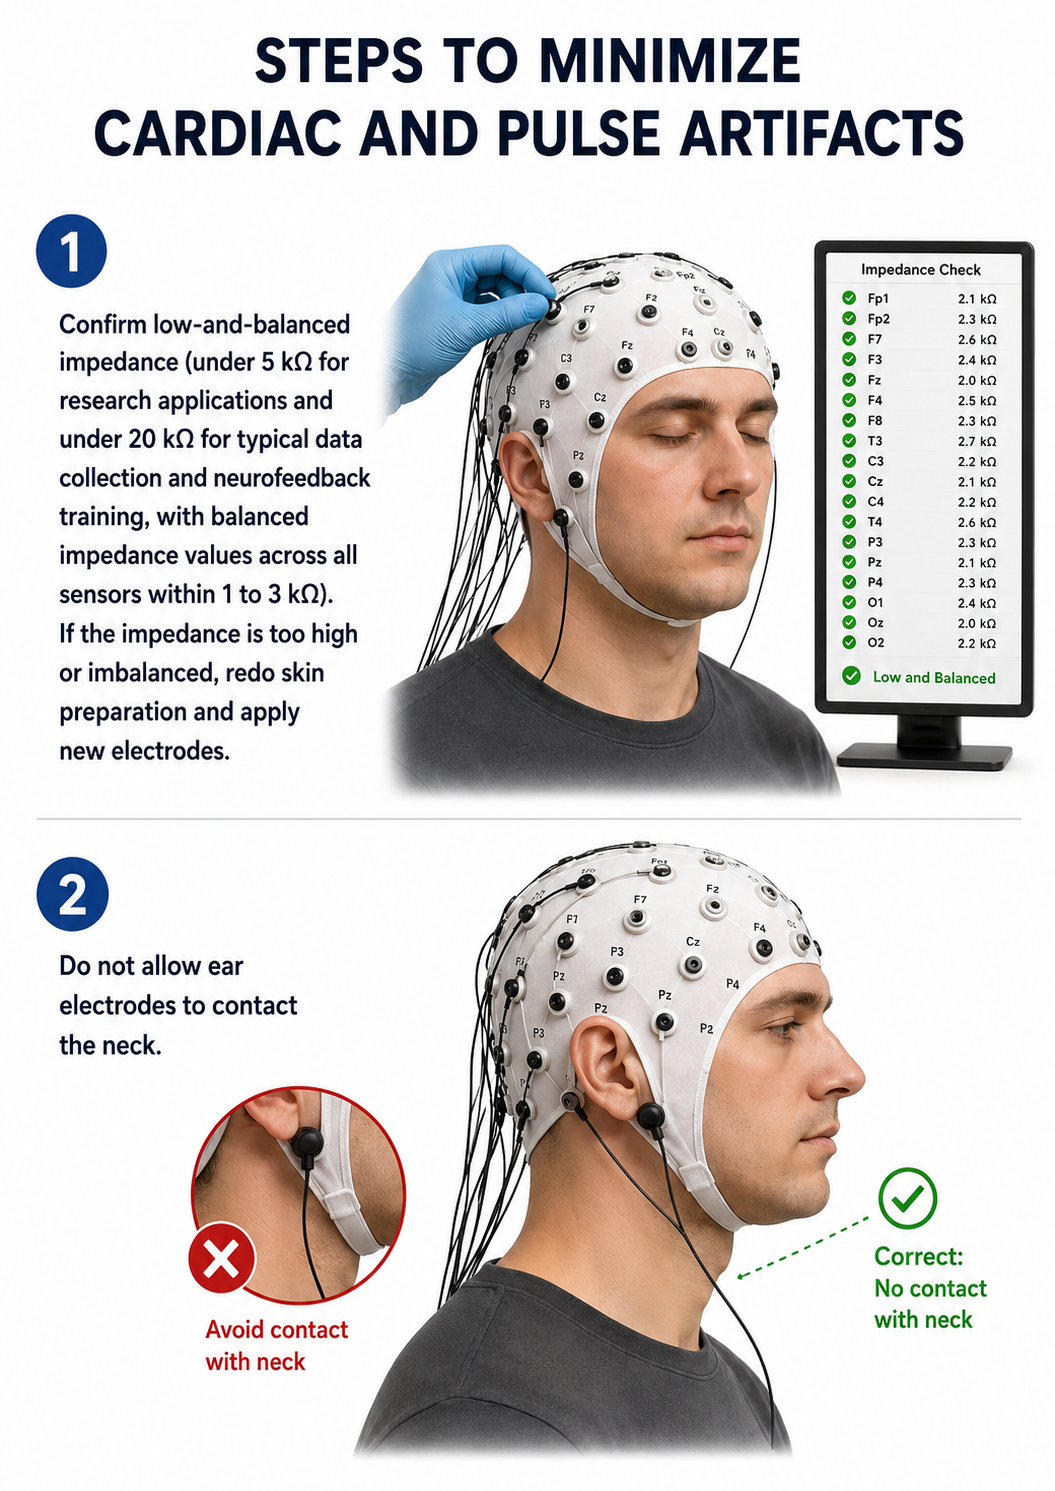
Ensure that impedance values or DC offset values are appropriate for your amplifier. Values under 5 Kohms are expected for publishable research, but values of less than 20 Kohms are acceptable for general clinical sessions and do not require excessive skin abrasion.
Only record qEEG data when the raw waveforms appear clean.
The movie features a 19-channel BioTrace+/NeXus-32 display of EEG artifacts © Mary Tracy.
EEG artifacts, consisting of noncerebral electrical activity, can be divided into physiological and exogenous artifacts. Physiological artifacts include electromyographic, electro-ocular (eye blink and eye movement), cardiac (pulse), sweat (skin impedance), drowsiness, and evoked potential. Exogenous artifacts include movement, 60 Hz and field effect, and electrode (impedance, bridging, and electrode pop) artifacts.
Artifacting is not a cleanup step you tack on at the end. It begins with how you prepare the client, fit the cap, and set impedances, and it continues through how you keep the client alert during acquisition. The published minimum is 1 minute of artifact-free data for database comparison, ideally 2 to 5 minutes, drawn from a raw record of roughly 10 minutes each of eyes-open and eyes-closed recording, so expect to discard a good deal of what you collect. Two families of artifact will account for nearly everything you discard: physiological signals generated by the body and exogenous signals generated by the environment and the equipment.
Physiological Artifacts
Electromyographic (EMG) Artifact
EMG artifact is interference in EEG recording caused by volume-conducted signals from skeletal muscles. This artifact appears as a high-frequency "buzz" during muscle contraction and shows up as elevated beta and gamma activity in the qEEG. Surface EMG power is distributed across roughly 20 to 500 Hz, with most of the energy concentrated between about 50 and 150 Hz. Critically, the low end of that distribution overlaps the EEG beta band, so EMG cannot be separated from cerebral fast activity by frequency alone.
The graphic below shows how the choice of high-frequency filter (HFF), a filter that attenuates frequencies above a specified cutoff, affects contamination by this artifact. All channels on the left side of the tracing show EMG artifact admitted by a 55-Hz high-frequency filter. The right tracing appears clean because its 15-Hz filter attenuates the higher frequencies where most of this artifact resides. Note that filtering changes only the appearance of the tracing; the contamination remains in the underlying data and will still affect quantitative measures computed from it.
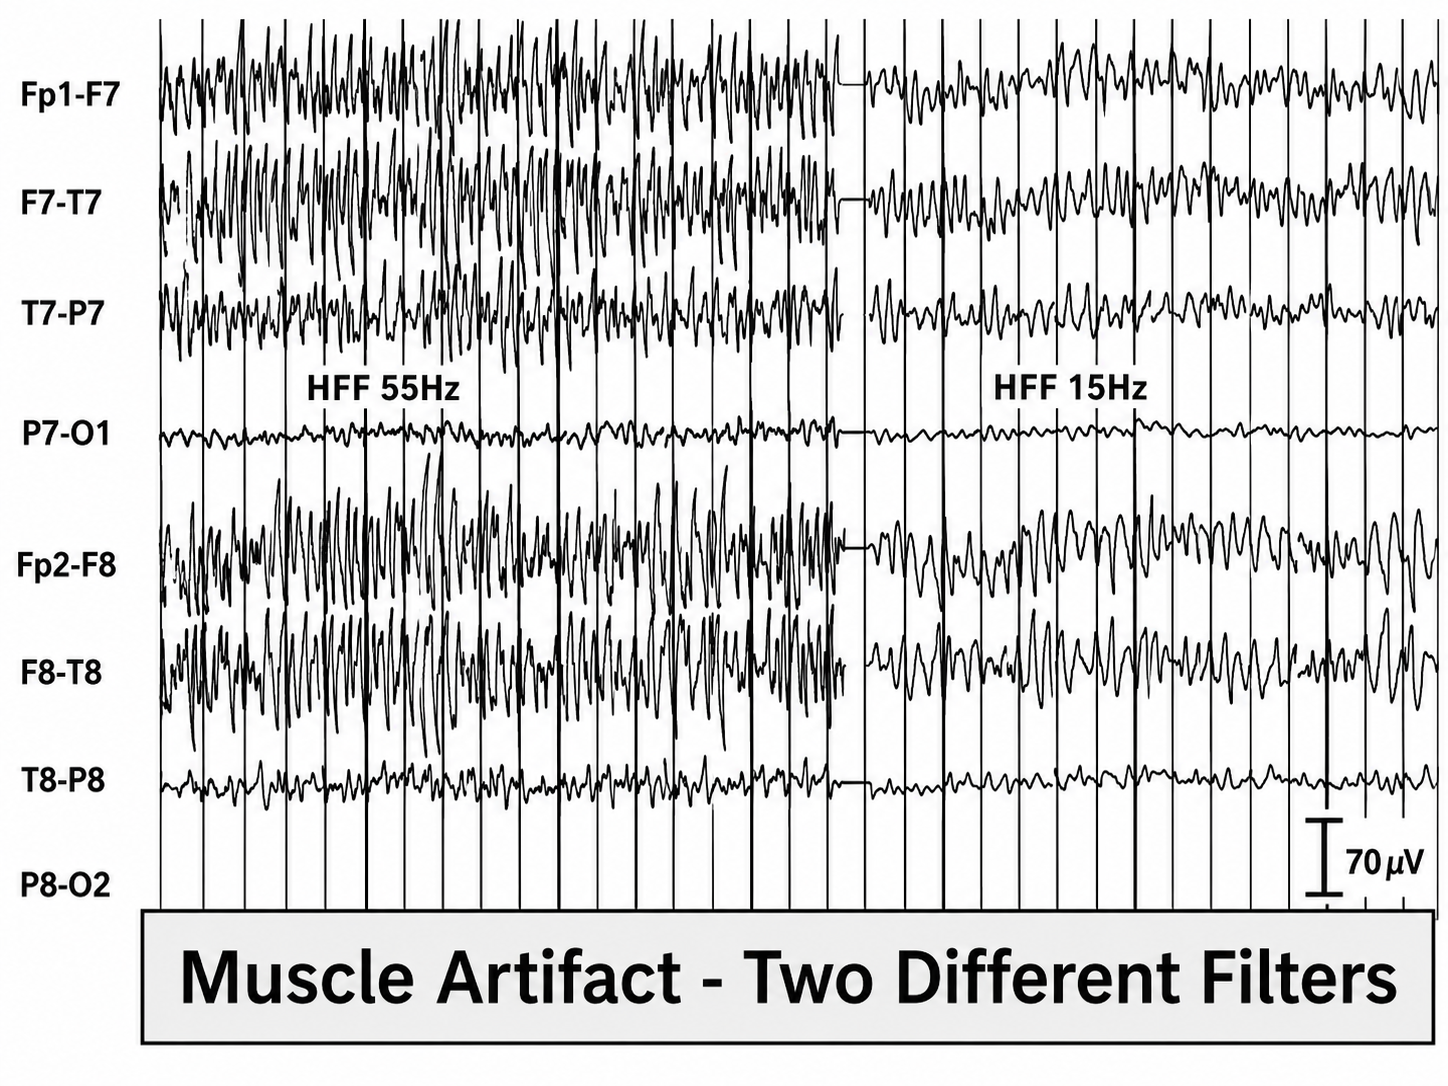
This image contrasts the same EEG segment under two filter conditions: HFF 55 Hz on the left and HFF 15 Hz on the right. The higher filter setting preserves more high-frequency EMG activity, while the lower setting attenuates it. The longitudinal bipolar temporal EEG channels show prominent, irregular high-frequency activity consistent with myogenic artifact when the high-frequency filter is set to 55 Hz. Reducing the high-frequency filter to 15 Hz markedly attenuates and smooths the fast activity, demonstrating how filtering can suppress the visual appearance of muscle artifact without removing the underlying contamination from the recording.
The next graphic shows how gum chewing can generate EMG artifact by contracting the muscles of mastication. While strong muscular contraction can contaminate every frequency band, including the alpha range near 10 Hz, the beta band (roughly 13–30 Hz) and the gamma range above 30 Hz are most affected. This means EMG artifact may create the appearance of greater beta activity than is actually present, a critical consideration when interpreting qEEG maps.
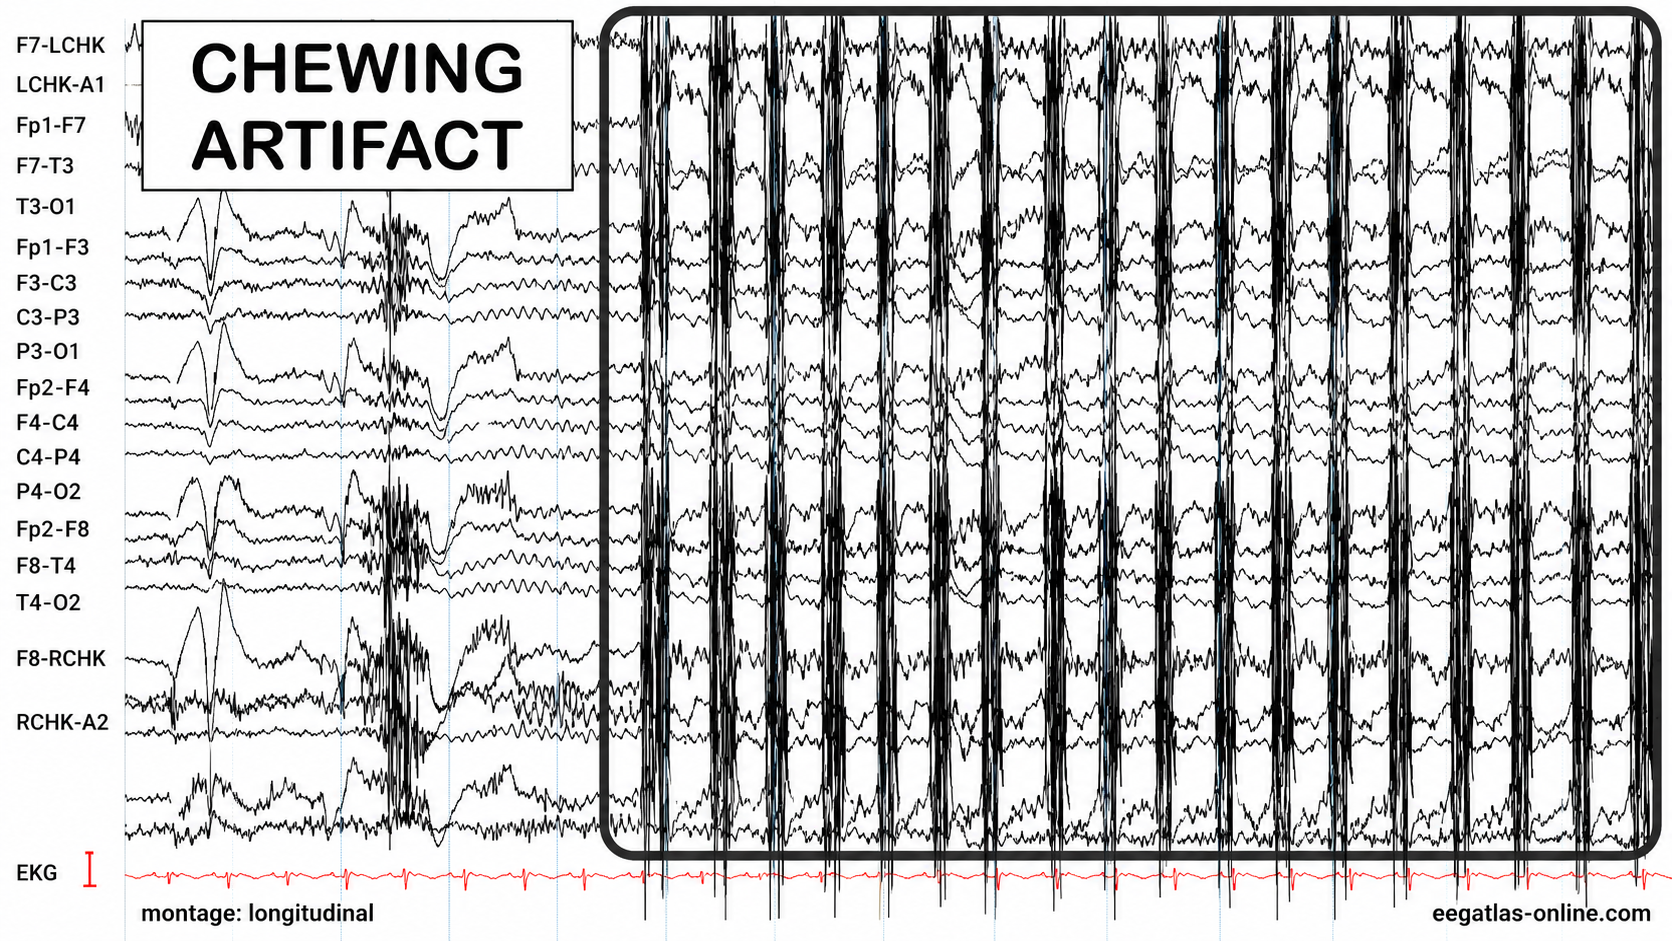
Graphic adapted from © eegatlas-online.com. This EEG recording captures chewing artifact in a longitudinal bipolar EEG montage, showing rhythmic, high-amplitude EMG bursts from jaw muscle activity that obscure the underlying cerebral signal, especially across anterior and temporal leads.
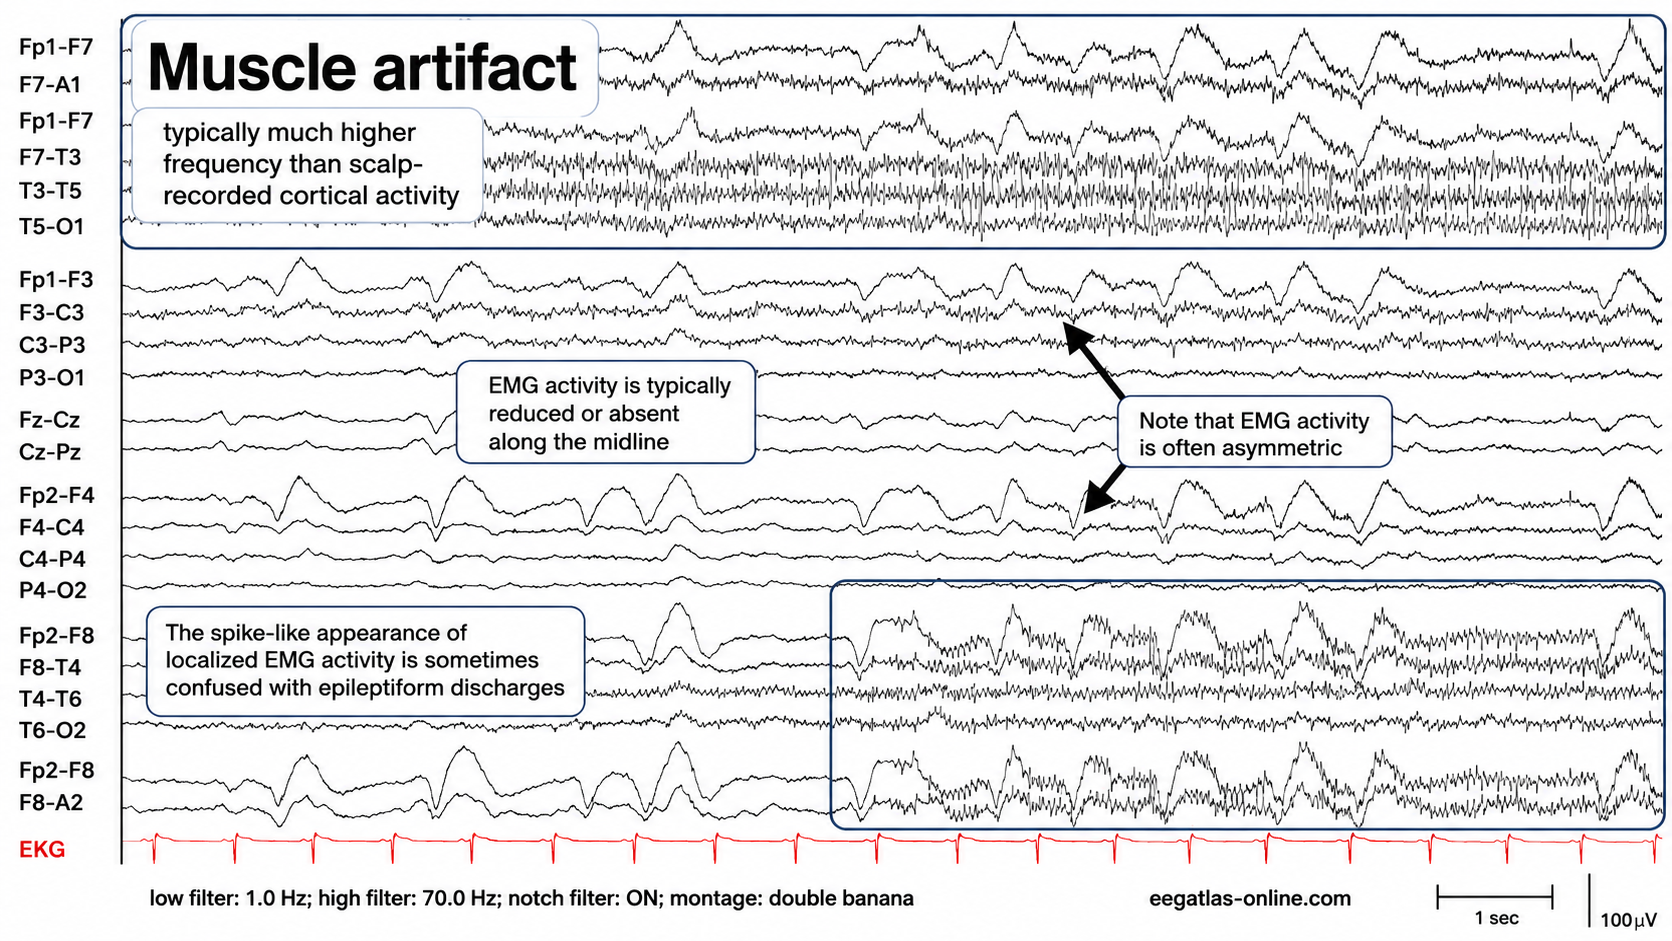
Graphic adapted from © eegatlas-online.com. This recording illustrates muscle artifact in a double-banana EEG montage. This tracing demonstrates irregular, high-frequency EMG activity superimposed on scalp-recorded EEG, most prominent over the anterior and temporal derivations and relatively reduced along the midline. The artifact is asymmetric, intermittent, and sharply contoured in places, producing spike-like waveforms that may be mistaken for epileptiform discharges if interpreted without attention to frequency content, distribution, field, and temporal context. The preserved high-frequency components are emphasized by the 70 Hz high-frequency filter setting, while the red EKG channel provides cardiac timing for comparison. Overall, the pattern is consistent with myogenic contamination rather than primary cortical activity.
Below is a BioGraph ® Infiniti EMG artifact display. Note how the amplitude of the EEG spectrum increases with each contraction.
Thompson and Thompson (2015) observed that EMG artifact is often readily detected because it may affect only one or two channels, particularly at T3 and T4 at the periphery, and less often at O1, O2, Fp1, and Fp2. Generalized tension, however, can contaminate the entire array, so a focal distribution should be treated as a helpful clue rather than a defining feature. You can identify EMG artifact by visually inspecting the raw signal, as shown in the next graphic using a 70-Hz high-frequency filter.
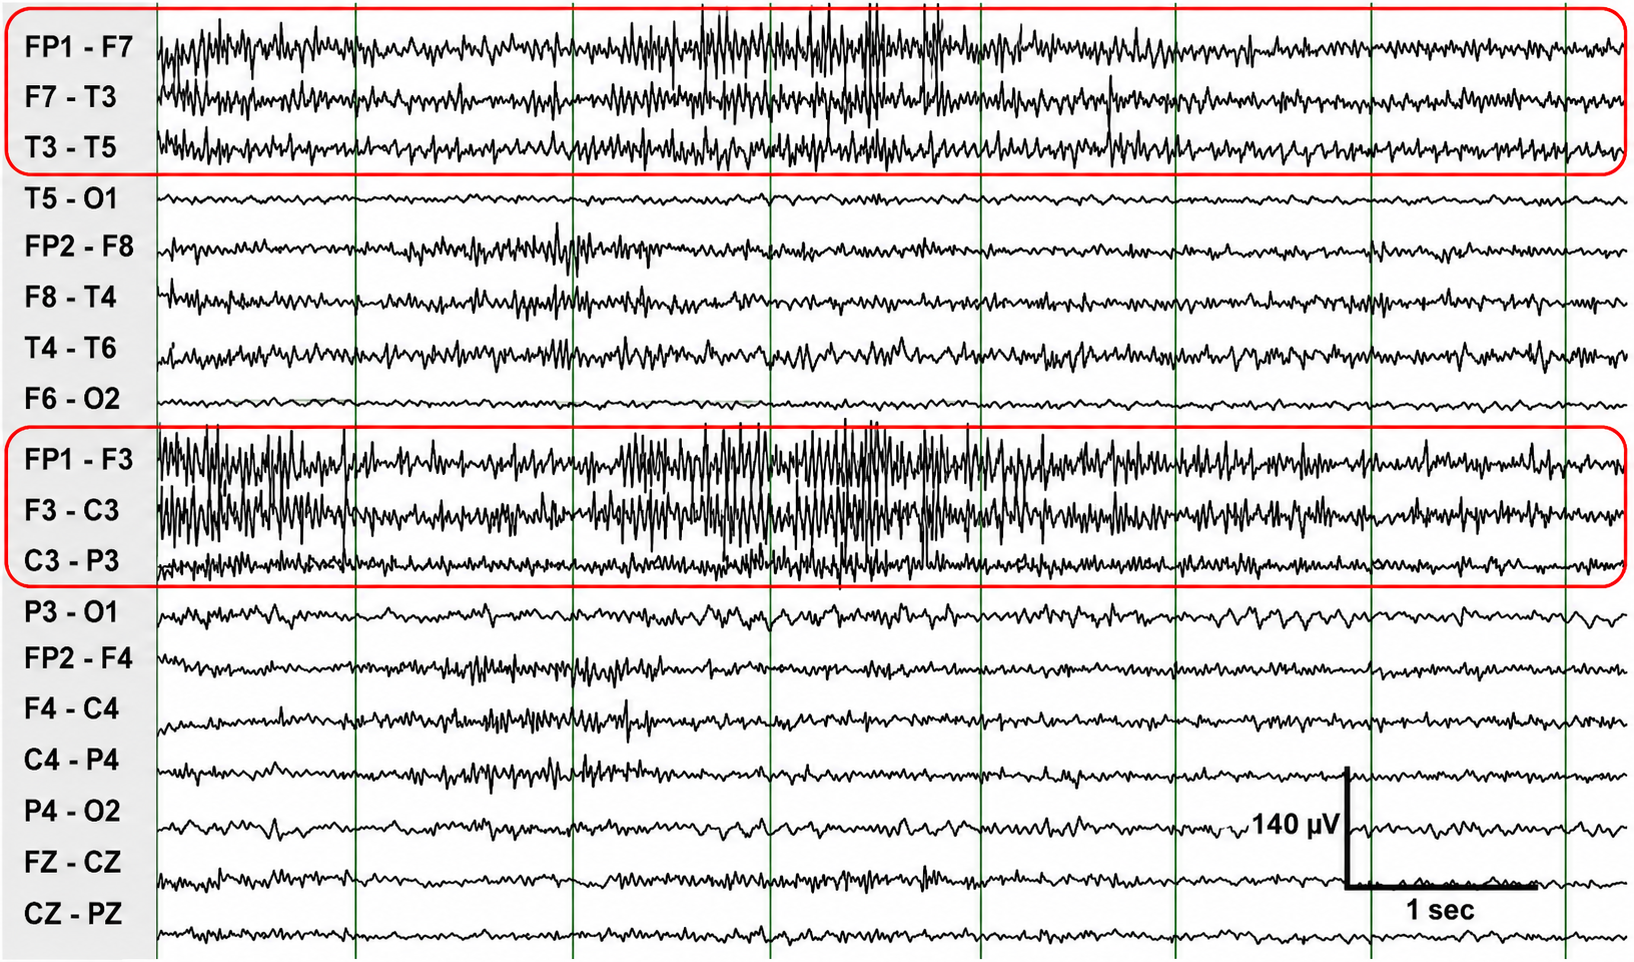
Graphic adapted from © eegatlas-online.com. This graphic illustrates focal EMG artifacts contaminating a longitudinal bipolar EEG montage. The red-outlined regions highlight irregular, high-frequency muscle activity superimposed on the EEG, most prominent in the left anterior temporal and left parasagittal derivations, including FP1–F7, F7–T3, T3–T5, FP1–F3, F3–C3, and C3–P3. The activity is asymmetric, anteriorly weighted, and relatively reduced in posterior and midline channels, a distribution consistent with focal myogenic contamination from scalp, facial, temporalis, or jaw muscle activity. The sharply contoured bursts and fast rhythmic components may obscure the underlying cerebral background and can be mistaken for pathologic fast activity or spike-like transients if interpreted without considering artifact morphology, spatial distribution, and lack of a consistent physiologic cortical field. Calibration markers indicate a 1-second time base and 140 µV amplitude scale.
Electro-Ocular Artifact
Electro-ocular artifact contaminates EEG recordings with potentials generated by eye blinks, eye flutter, and other eye movements. For example, anxious patient eyelid flutter may cause deflections at Fp1 and Fp2 (Klass, 1995). This artifact arises because the eye acts as an electrical dipole—the corneoretinal potential, electropositive at the cornea and electronegative at the retina—whose orientation relative to the frontal electrodes changes when the eye rotates. Eyelid movement across the cornea contributes as well. Bell's phenomenon refers to the upward and outward rotation of the eye during lid closure, which drives the corneal positivity toward the frontopolar electrodes and produces a large frontal deflection.
Both types of eye artifact can mimic meaningful EEG patterns, particularly for untrained readers, and may distort assessment results when using normative database comparisons. Slow lateral eye movements during an eyes-closed recording can be mistaken for delta activity, since they produce deflections in the delta range of roughly 0.5–4 Hz or slower. Blink artifact can resemble the sharp spike-and-wave patterns associated with seizure activity, especially when repetitive, as with eye flutter.
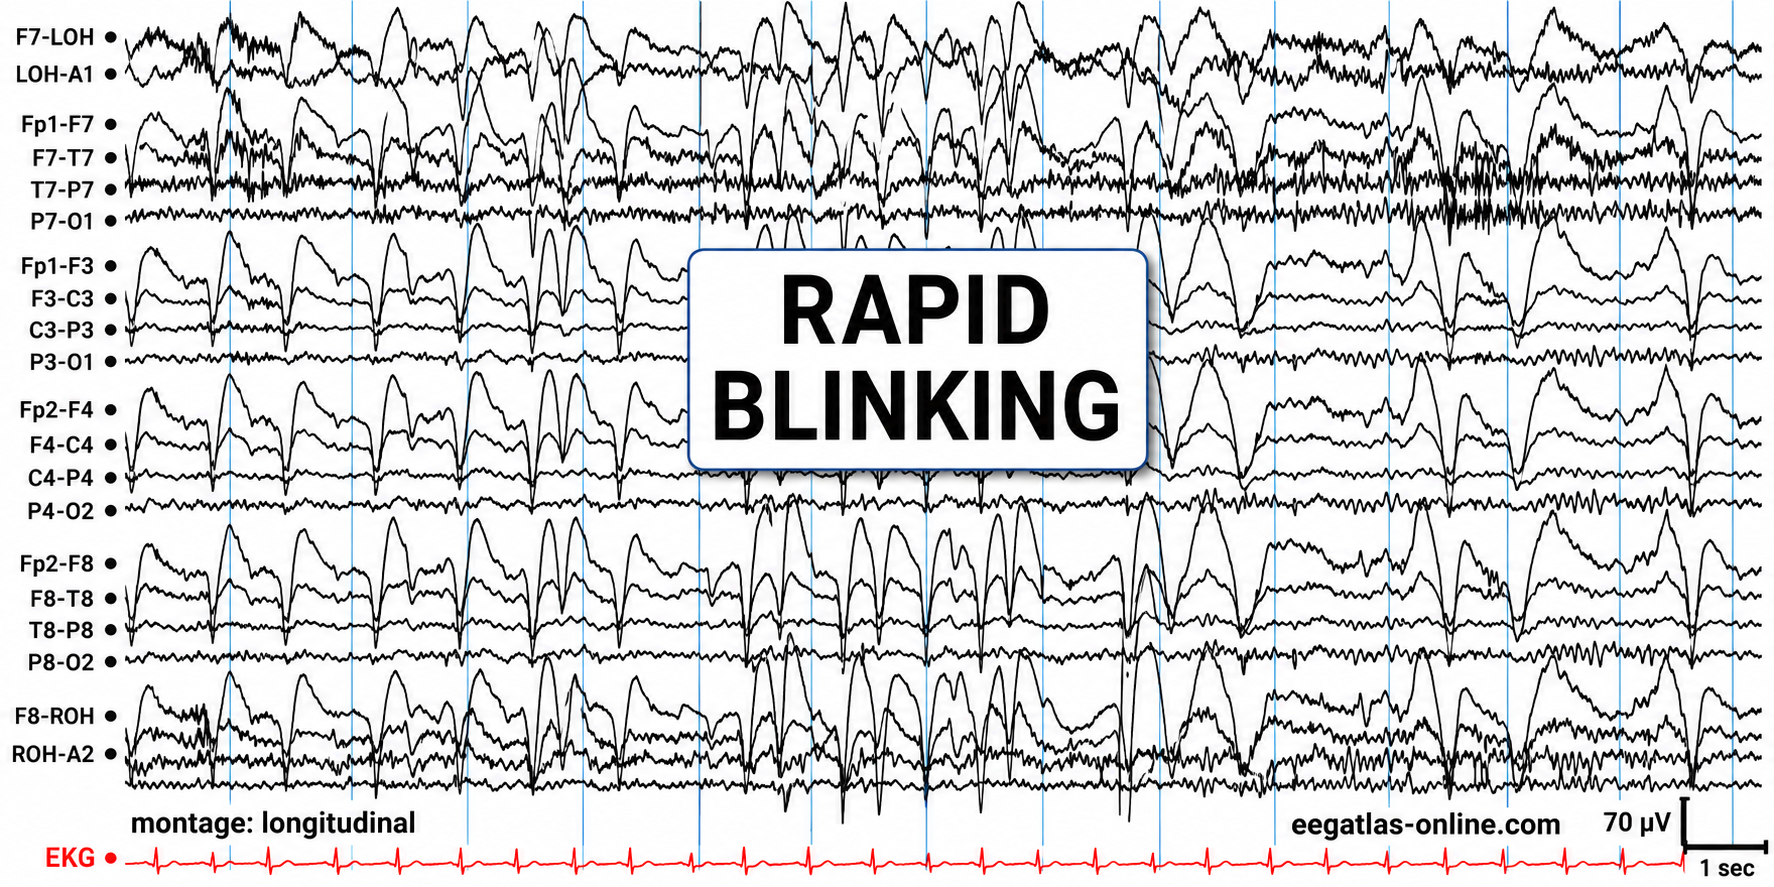
Graphic adapted from © eegatlas-online.com. This graphic captures rapid blinking artifact in a longitudinal bipolar EEG montage. This tracing shows repeated, high-amplitude, sharply contoured anterior slow transients occurring in rapid succession, maximal in the frontal and frontopolar derivations and spreading posteriorly with decreasing amplitude. The pattern is broadly synchronous across anterior chains and is time-locked to repeated eyelid movements, consistent with rapid blinking artifact. Although eyelid and facial muscle activity may contribute high-frequency EMG components, the dominant waveform morphology reflects ocular/blink artifact rather than cerebral activity. The artifact obscures the underlying EEG background, especially in FP1–F7, FP1–F3, FP2–F4, and FP2–F8 channels, and could be mistaken for frontal rhythmic or sharply contoured activity if interpreted without attention to its stereotyped anterior distribution, repetitive blink timing, and lack of a physiologic cortical field. The EKG channel is displayed separately at the bottom, with calibration markers indicating 1 second and 70 µV.
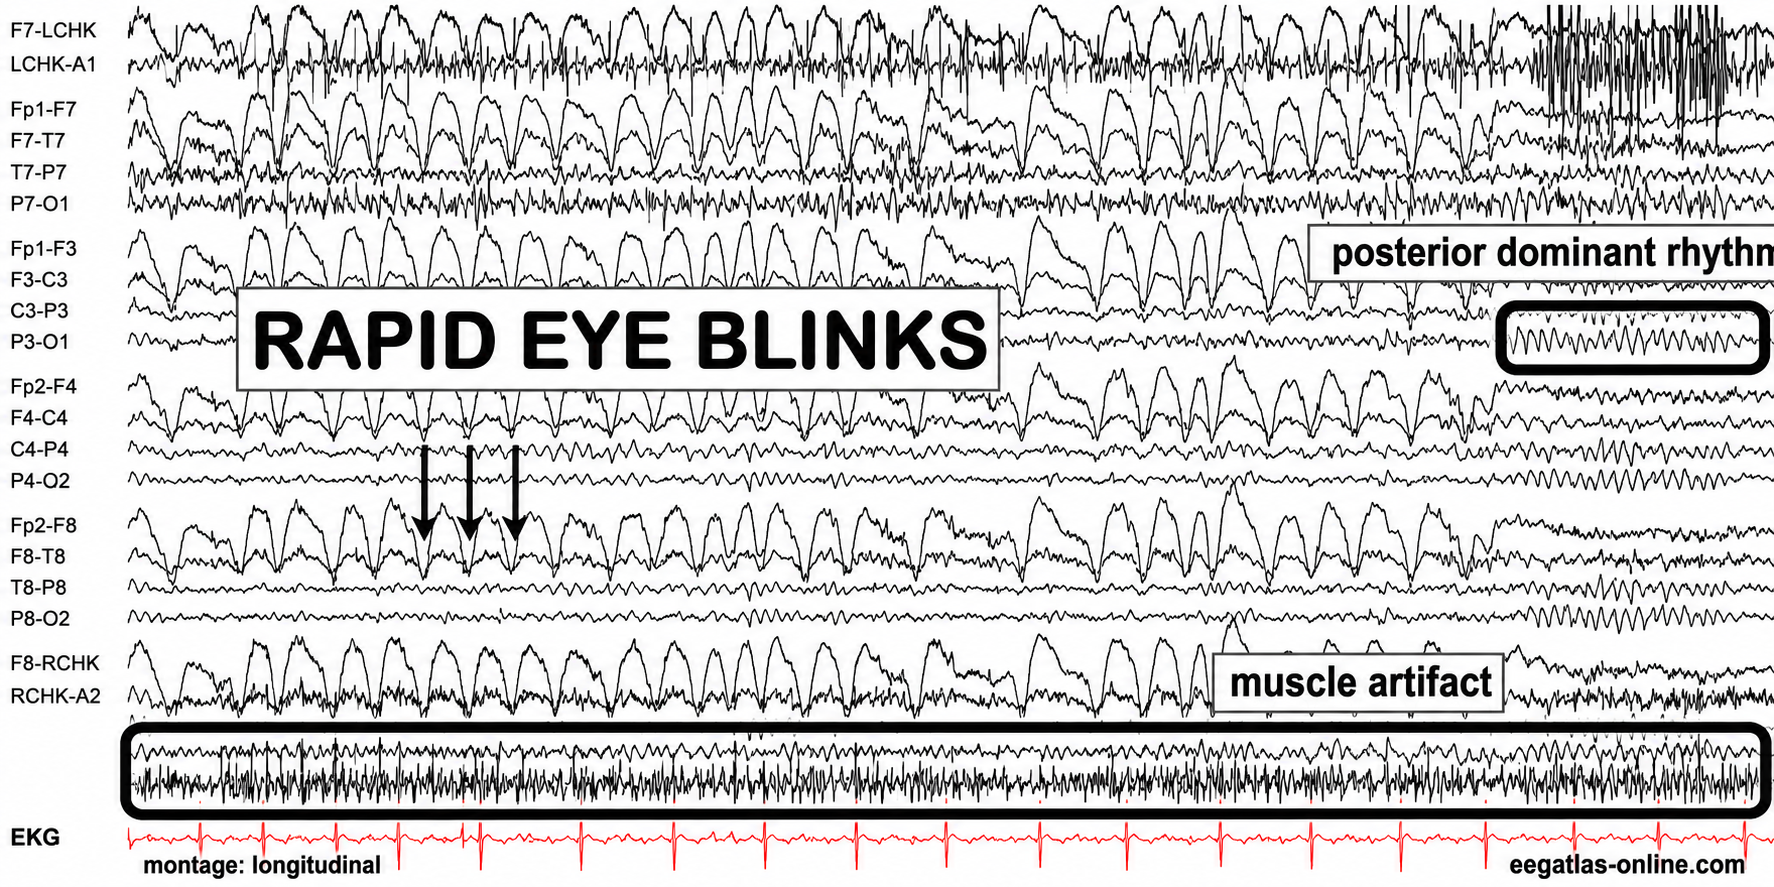
Graphic adapted from © eegatlas-online.com. This recording captures rapid eye-blink artifact with superimposed muscle artifact in a longitudinal bipolar EEG montage. The tracing shows repetitive, high-amplitude, sharply contoured anterior transients produced by rapid blinking, maximal in the frontopolar and frontal derivations and diminishing posteriorly. These stereotyped blink waveforms recur in close succession and obscure the underlying EEG background, particularly across FP1–F7, FP1–F3, FP2–F4, and FP2–F8 chains. A separate band of irregular high-frequency activity labeled muscle artifact is visible near the lower portion of the recording, consistent with concurrent facial, scalp, or jaw EMG contamination. In contrast, the labeled posterior dominant rhythm is seen over posterior channels as a more regular occipital rhythm, helping distinguish physiologic cerebral activity from ocular and myogenic artifact. The EKG channel at the bottom provides cardiac timing and is not time-locked to the blink or muscle bursts.
The next graphic shows eye blinks, sharp lateral eye movement, and slow lateral eye movement.
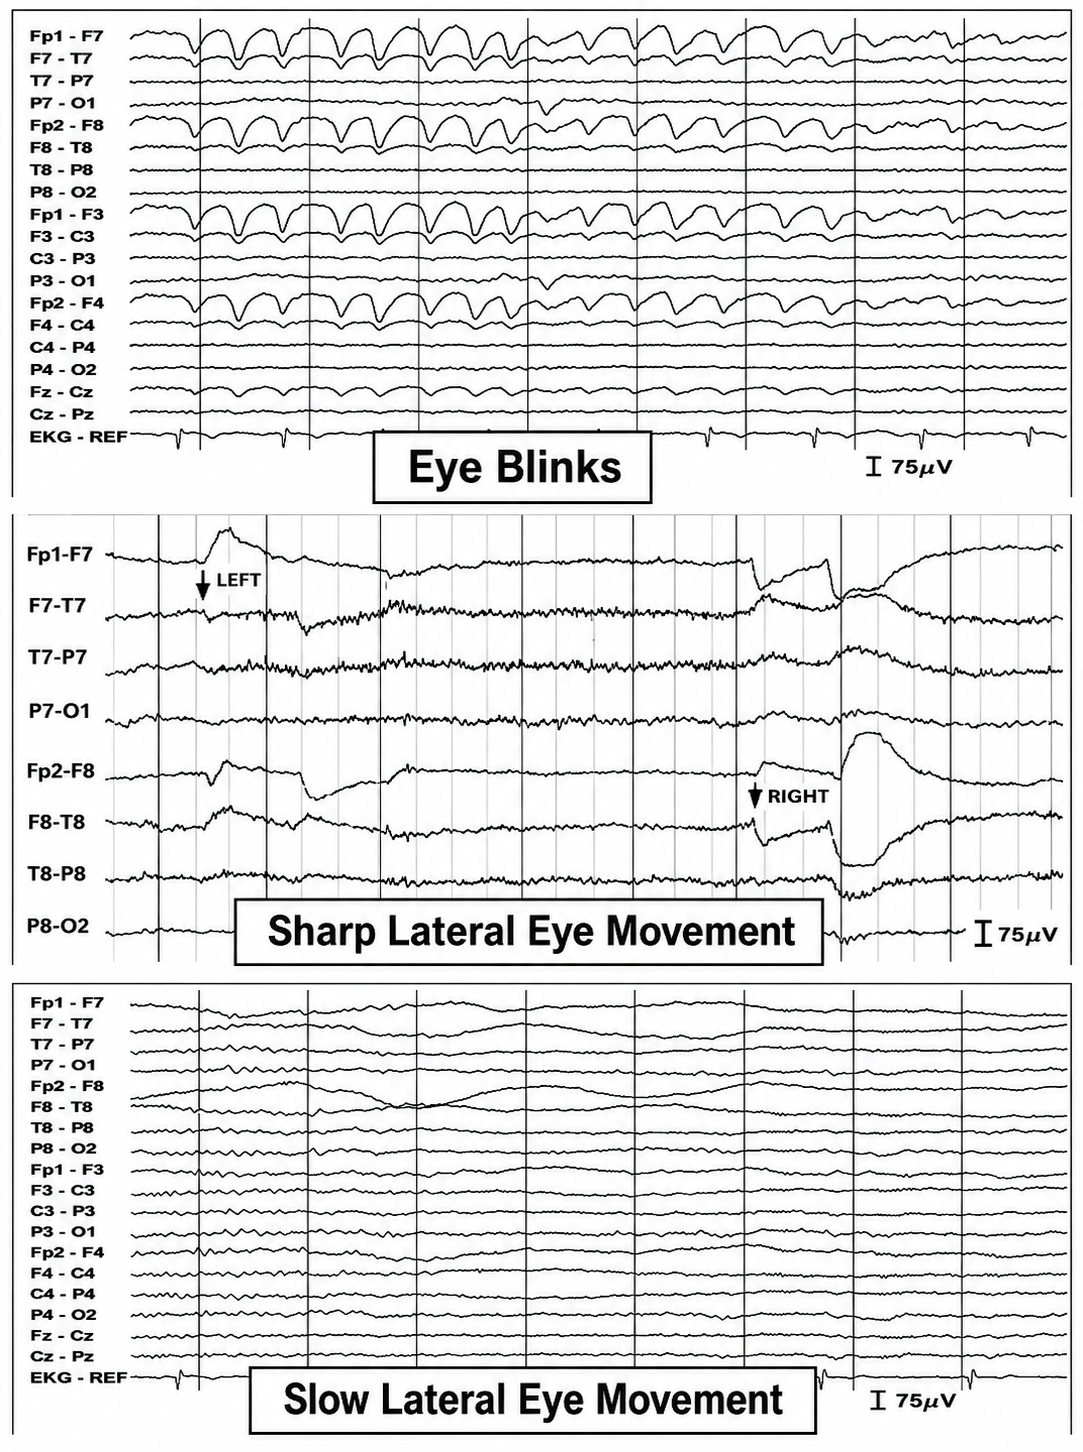
This recording captures eye blinks and lateral eye movements. This longitudinal bipolar EEG graphic contrasts three common ocular artifacts. The upper panel shows repeated eye-blink artifacts, appearing as large, stereotyped, frontally maximal slow deflections that are most prominent in FP1–F7, FP2–F8, FP1–F3, and FP2–F4, with attenuation posteriorly. The middle panel demonstrates sharp lateral eye movements, with asymmetric frontal-temporal deflections corresponding to leftward and rightward gaze shifts. The lower panel shows slow lateral eye movement, producing broader, lower-frequency drifting potentials across anterior derivations. Although eyelid and periocular muscle activity may add small fast components, the dominant pattern is ocular rather than primary EMG artifact, reflecting corneoretinal and eyelid-movement potentials that can obscure or mimic frontal cerebral activity. Calibration markers indicate 75 µV amplitude scaling.
Below is a BioGraph ® Infiniti EEG display of eye movement artifact.
Below is a NeXus display of eye blink and EMG © John S. Anderson.An upward eye movement makes Fp1 and Fp2 electrically positive, while a downward movement makes them electrically negative. Remember that clinical EEG is displayed with negative-up polarity, so a frontal positivity appears as a downward pen deflection. In a longitudinal sequential montage, the artifact appears most prominently in the frontopolar derivations (Fp1-F3, Fp2-F4, Fp1-F7, and Fp2-F8). A leftward eye movement carries the positive cornea toward F7, producing a positivity at F7 and a corresponding negativity at F8 (Thompson & Thompson, 2015). Rapid eye flutter may closely resemble seizure activity.
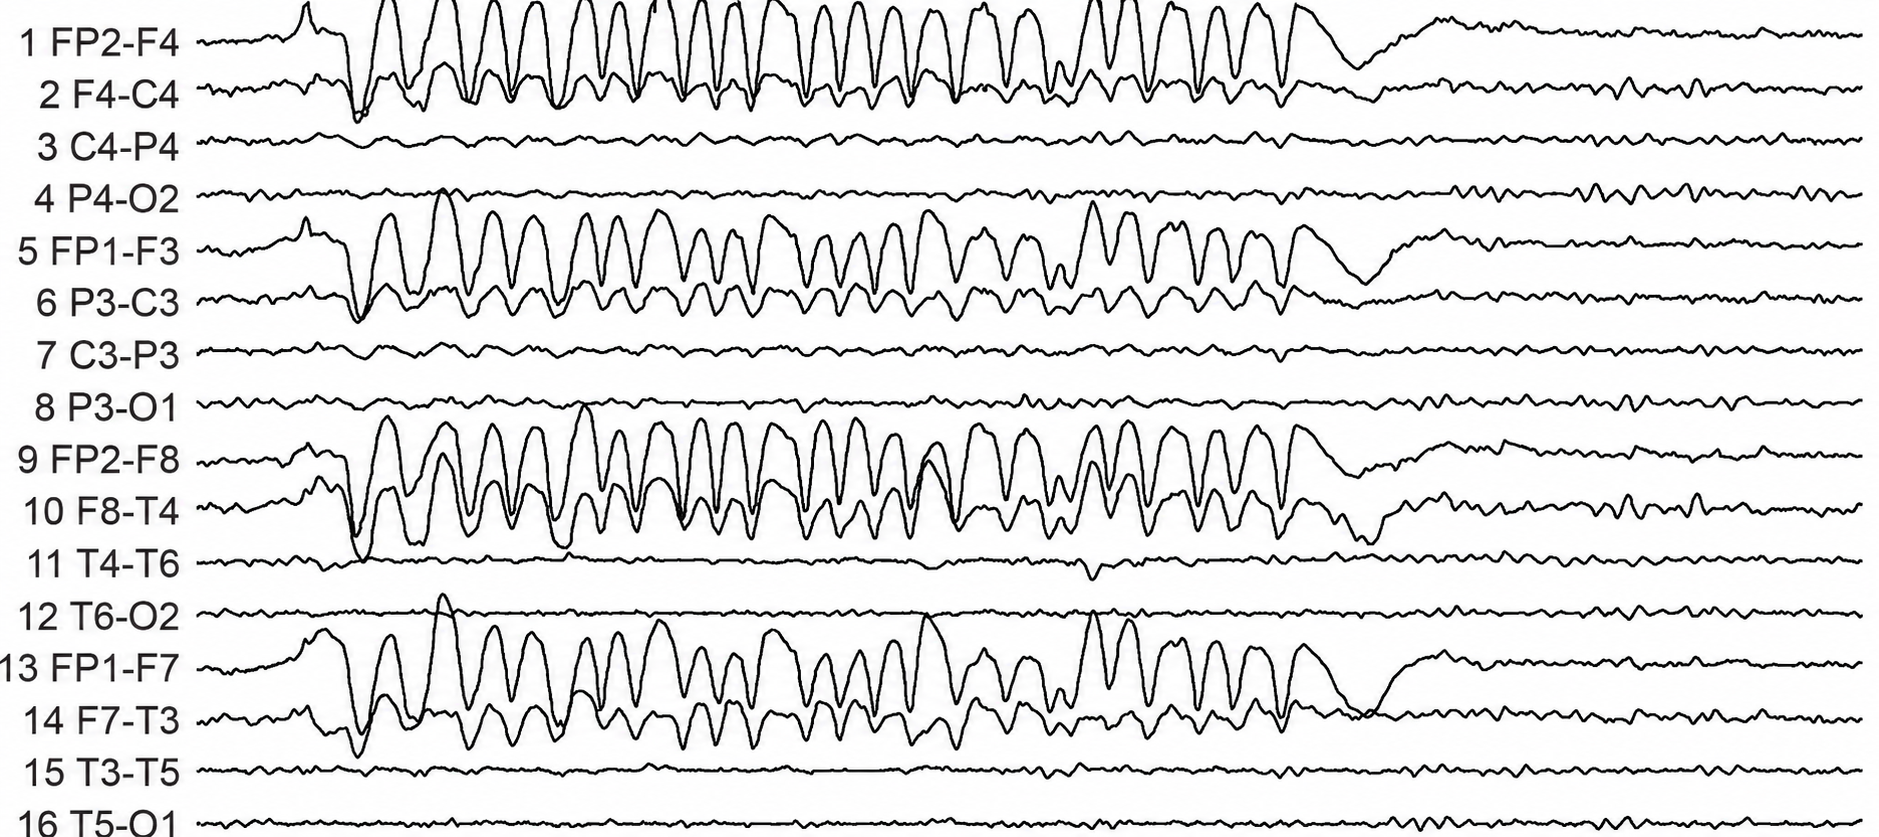
This recording captures rapid blinking artifact in a bipolar EEG montage. This tracing shows a burst of repetitive, high-amplitude anterior deflections maximal in the frontopolar and frontal derivations, including FP2–F4, FP1–F3, FP2–F8, and FP1–F7. The waveforms are stereotyped, rhythmic, and sharply contoured, with clear attenuation in central, parietal, temporal-posterior, and occipital channels. The morphology and distribution are most consistent with rapid eye-blink artifact, reflecting ocular potentials with possible superimposed periocular muscle activity, rather than primary cortical activity. Because the repeated frontal transients are large and sharply contoured, they may obscure the underlying EEG and could be misread as frontal rhythmic slowing or epileptiform-appearing activity unless their anterior predominance, blink-like repetition, and lack of a physiologic cortical field are recognized.
Cardiac and Pulse Artifacts
Cardiac artifact occurs when the ECG signal appears in the EEG (Jiang et al., 2019). This artifact may be produced when electrode impedance is imbalanced or too high, or when an ear electrode contacts the neck. It is also more common in patients with short, wide necks. The ECG signal spans roughly 0.05–100 Hz, so its artifact can contaminate the delta through beta bands, although the sharp QRS complex contributes most of its distinctive appearance. Because multiple electrodes detect this artifact simultaneously and in near-perfect time-lock, it can create the false appearance of elevated coherence, a particularly misleading finding when evaluating brain connectivity.
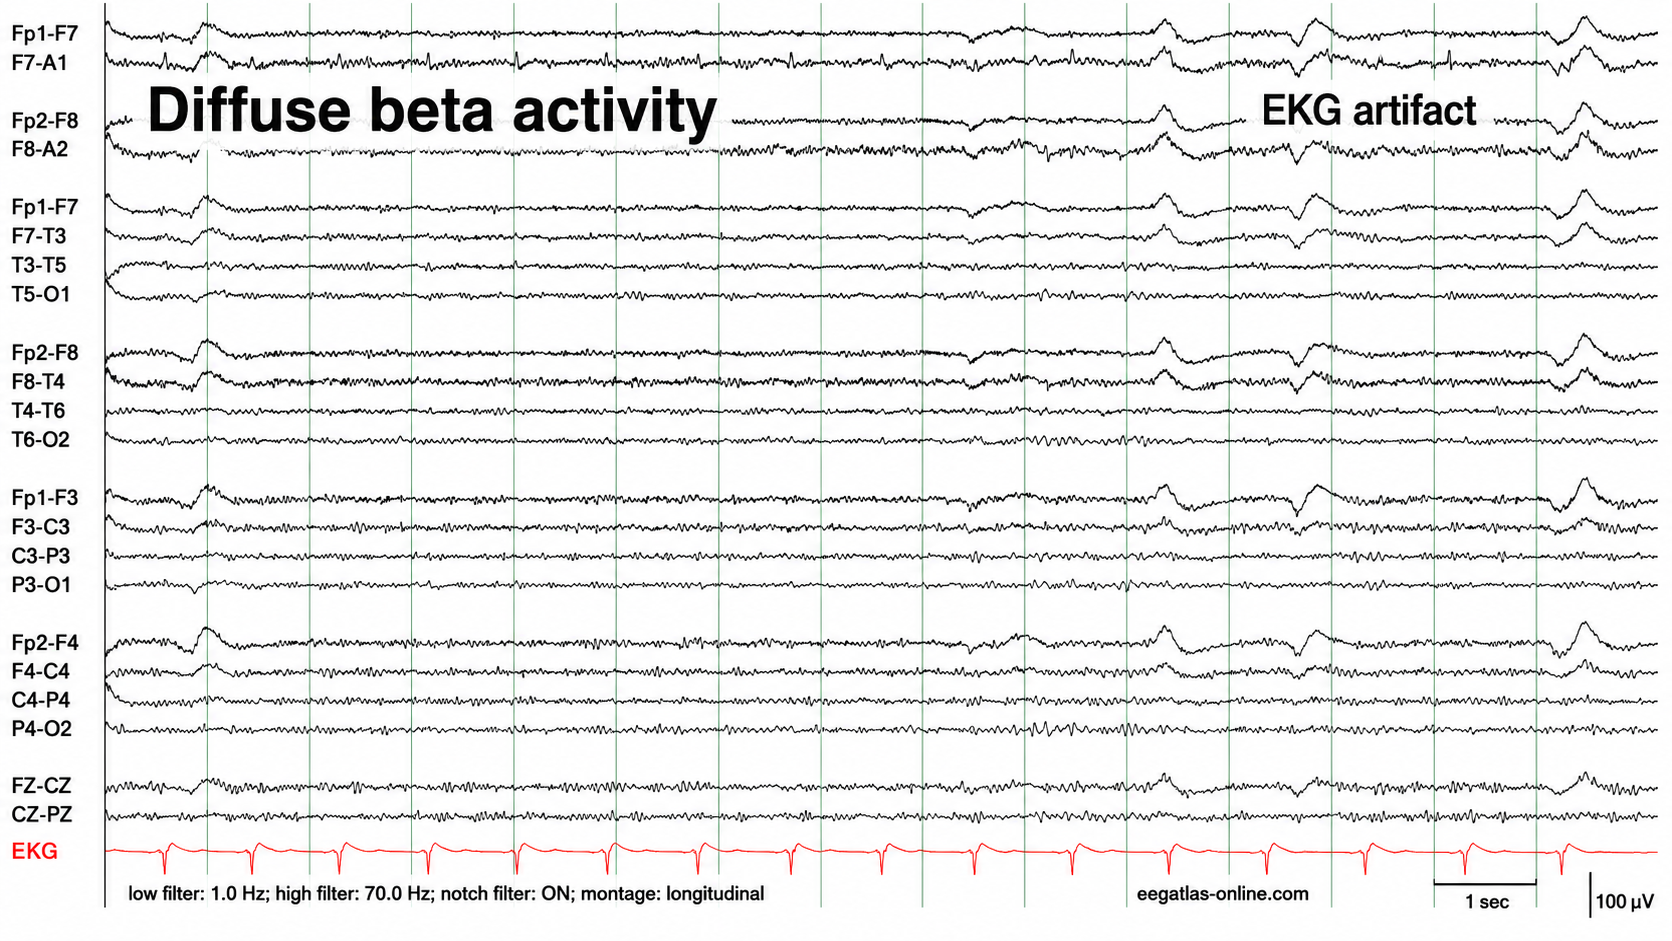
Graphic adapted from © eegatlas-online.com. This EEG segment is displayed in a longitudinal bipolar montage with a low-frequency filter of 1.0 Hz, a high-frequency filter of 70.0 Hz, the notch filter turned on, and a simultaneous EKG channel recorded at the bottom. Historically, fast beta activity has been understood in clinical EEG as a low-amplitude, high-frequency background feature that is often most visible over frontal and central scalp regions. It is generally interpreted cautiously because it is highly sensitive to patient state, medication effects, muscle activity, and recording conditions. Cardiac artifact has an equally long-standing role in EEG interpretation as an extracerebral signal that can project into scalp channels and mimic sharply contoured cerebral transients if the EKG channel is not reviewed carefully.
The dominant feature in this tracing is diffuse beta activity. The fast activity is low in amplitude, broadly distributed, and present across multiple bilateral derivations rather than being confined to a single focal region. It appears most conspicuous in frontal, frontotemporal, and central chains, but it is not limited to one hemisphere or one electrode pair. The activity does not show a focal phase reversal, does not organize into an evolving rhythmic discharge, and does not have the morphology of a definite epileptiform pattern in this isolated sample. In clinical terms, this would be described as diffuse excessive beta or diffuse fast activity, while recognizing that the finding is nonspecific.
You can detect cardiac artifacts by inspecting chart recorder, data acquisition, or oscilloscope displays of the raw EEG waveform. Cardiac artifact appears as a sharp, regularly repeating wave recurring at the heart rate—roughly once per second at a resting rate of about 60 beats per minute (Thompson & Thompson, 2015). ECG artifacts are most easily recognized when a separate ECG tracing is available for direct comparison, and they are observed best in referential montages using earlobe electrodes A1 and A2 or mastoid electrodes M1 and M2.
Below is a BioGraph ® Infiniti ECG artifact display.
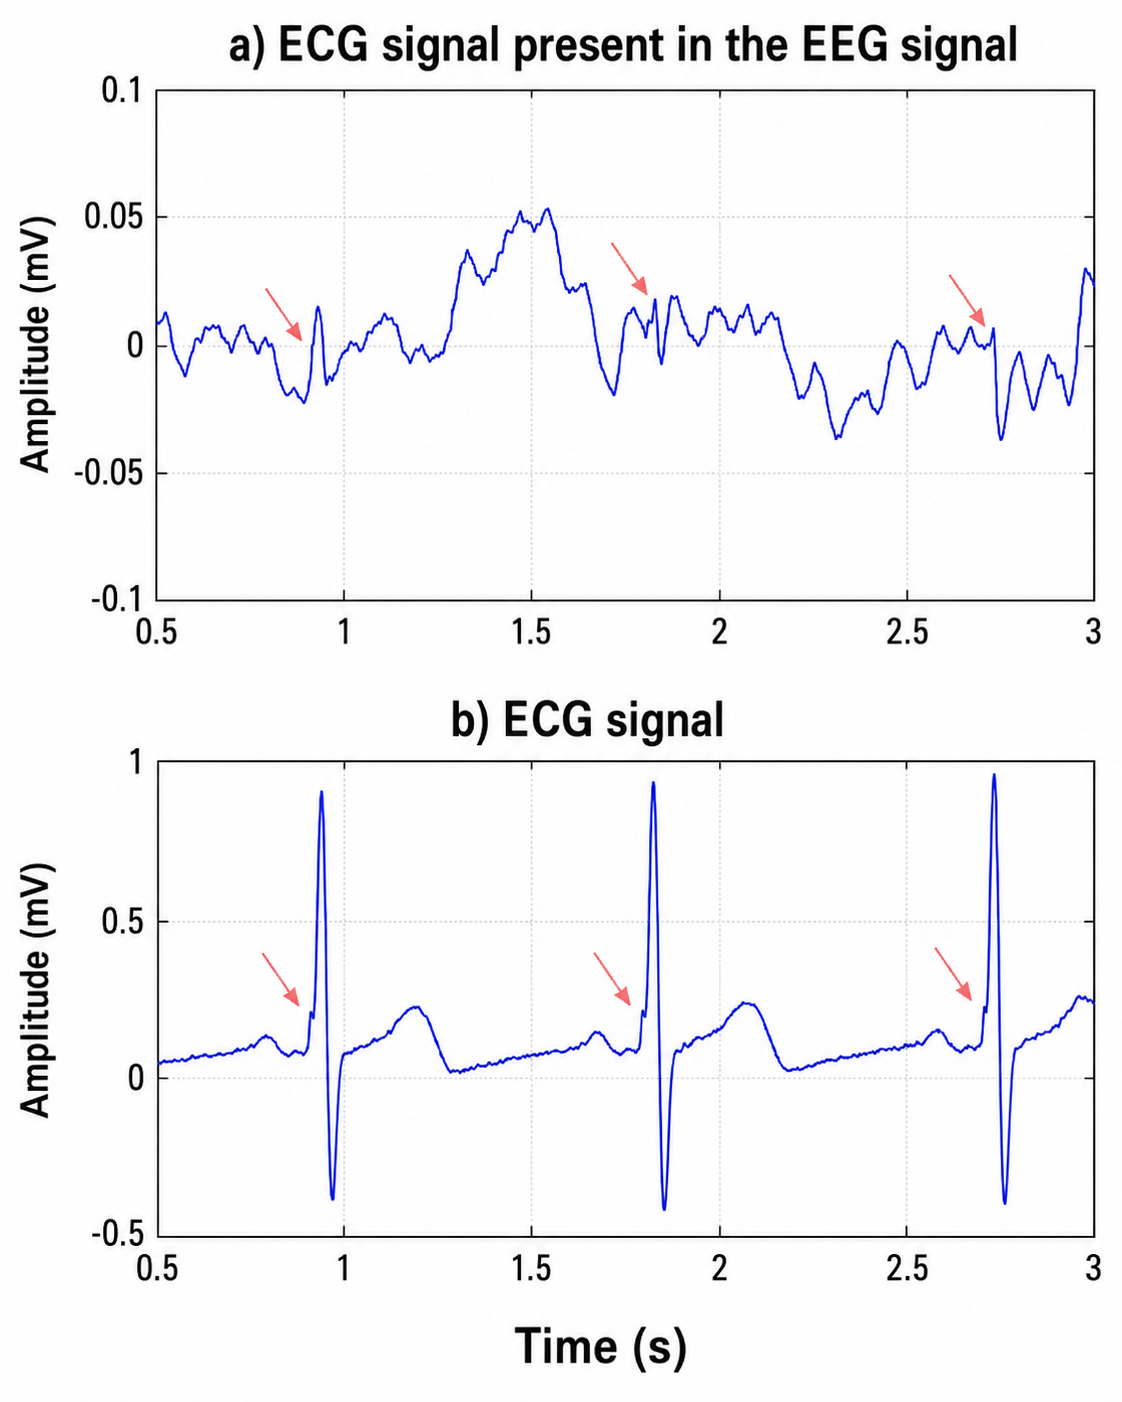
We adapted an ECG artifact graphic by Garces et al. (2007). The upper trace is labeled as an EEG signal containing ECG activity. Its amplitude is much smaller than the ECG trace, ranging approximately from −0.1 to +0.1 mV, which corresponds to about −100 to +100 µV. Across the 0.5-to-3.0 second epoch, the signal shows an irregular low-amplitude EEG background with superimposed deflections. The red arrows identify small waveform components in the EEG trace that occur at the same times as cardiac events in the lower ECG trace. These deflections are not large compared with the background, but their repeated temporal alignment with the ECG complexes makes them suspicious for cardiac artifact rather than independent cerebral activity.
The lower trace is the ECG signal itself. It has a larger amplitude range, extending roughly from −0.5 to +1.0 mV, and shows three prominent cardiac complexes over the displayed interval, occurring at approximately 0.95, 1.82, and 2.73 seconds. Each complex has a steep, high-amplitude QRS morphology, followed by slower recovery components. The red arrows point to earlier portions of the cardiac cycle immediately preceding the large QRS peaks. These same time points correspond to subtle deflections in the upper EEG trace, demonstrating that components of the cardiac signal are being transmitted into, or recorded by, the EEG channel.
Another cardiac-related artifact is the pulse artifact, which occurs when an EEG electrode is placed directly over a blood vessel. The mechanical movement of the electrode as the vessel expands and contracts with each heartbeat produces a slow-wave pattern that can be mistaken for delta activity. Pulse artifact in particular tends to appear in topographic EEG maps as excess delta at the affected site, leading to false positive findings; ECG artifact, being sharper, contributes across a wider range of bands. Both are time-locked to the cardiac cycle, which is why a simultaneous ECG channel is the most reliable way to identify them.
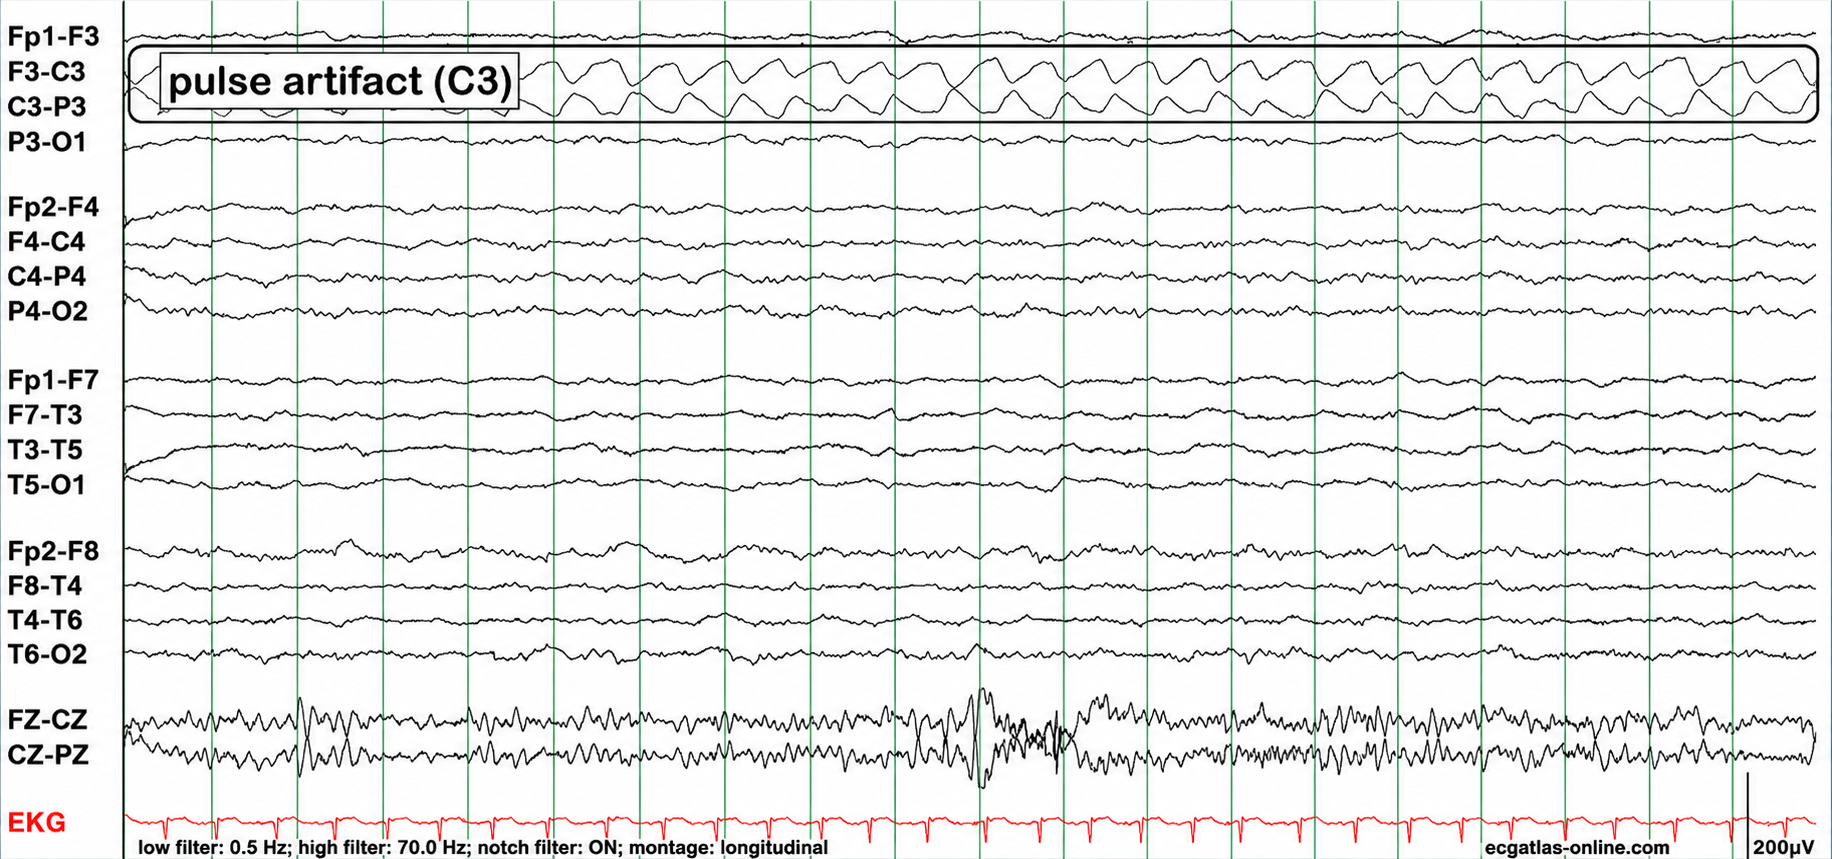
Graphic adapted from © eegatlas-online.com. This EEG segment is displayed in a longitudinal bipolar montage with a low-frequency filter of 0.5 Hz, a high-frequency filter of 70 Hz, the notch filter turned on, and a simultaneous EKG channel shown in red at the bottom. The calibration marker indicates 200 µV, so the prominent activity in the upper left parasagittal channels is relatively high in amplitude compared with much of the remaining background. Historically, this is the type of recording in which careful montage-based reasoning is essential, because a localized electrode artifact can produce a striking apparent abnormality unless one asks whether the waveform is generated by cortex or by a single contaminated electrode.
The most conspicuous abnormal-looking activity is the rhythmic waveform labeled pulse artifact (C3). It is confined almost entirely to the two bipolar derivations that share the C3 electrode, namely F3-C3 and C3-P3. The waveform has a repetitive, rounded, mechanical quality rather than the morphology of a cerebral rhythm. It recurs at a fairly regular interval and appears in opposite polarity across the two adjacent channels, creating a phase-reversal-like pattern at C3. In a true cerebral discharge, a phase reversal can sometimes help localize a cortical voltage maximum, but in this case the localization to a single electrode shared by two channels, the regular pulse-like repetition, and the absence of a physiologic field into neighboring left parasagittal or homologous right-sided channels strongly favor artifact.
Sweat (Skin Potential) Artifact
Sweat artifact arises from two related mechanisms: the sodium chloride in perspiration alters the electrical properties of the skin under and near the electrode, and sweat gland activity generates its own very slow skin potentials. Sweat artifact and bridging artifact are related but distinct: heavy perspiration can create a conductive path between neighboring electrodes and so cause bridging, but the two produce different appearances and are treated separately below.
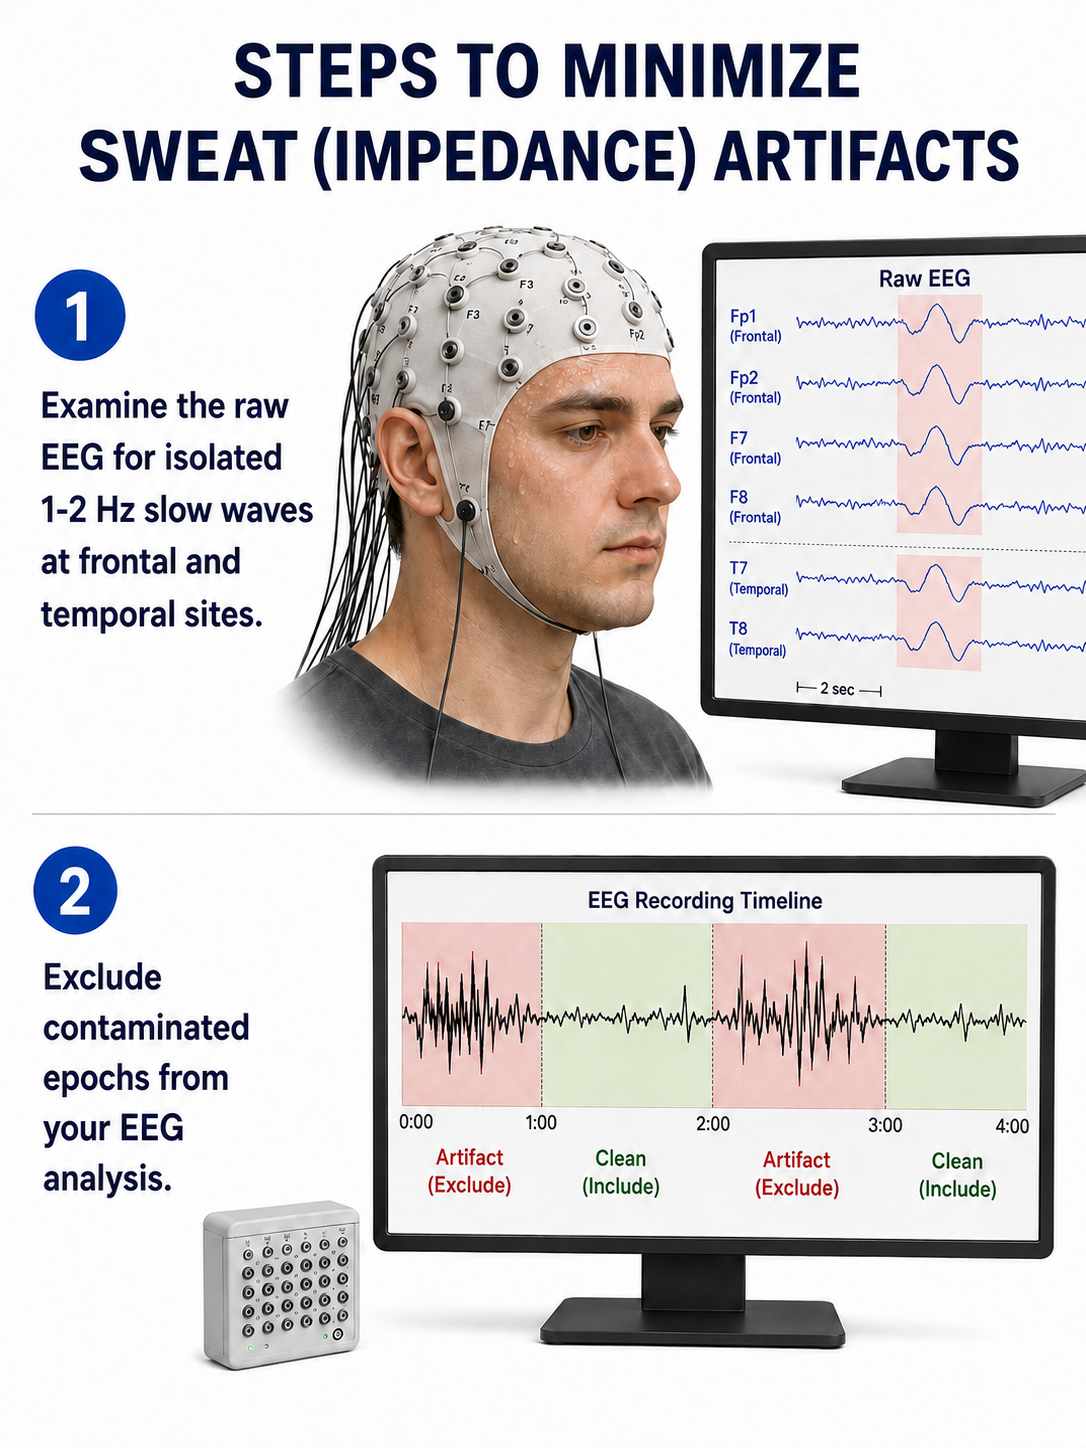
The classic sweat artifact is a large, very slow, rolling undulation of the baseline—typically below 0.5–1 Hz, and therefore slower than delta activity—appearing across several channels, most often frontal and temporal sites. Because these undulations are so slow, they are attenuated by raising the low-frequency filter cutoff, although the underlying skin condition should be corrected rather than filtered. Sweating may be provoked by anxiety, a warm room, or abrupt unexpected stimuli (Thompson & Thompson, 2015). See the Impedance Artifact section below for an illustration of the electrode-interface instability that heavy sweating can produce.
Bridging Artifact
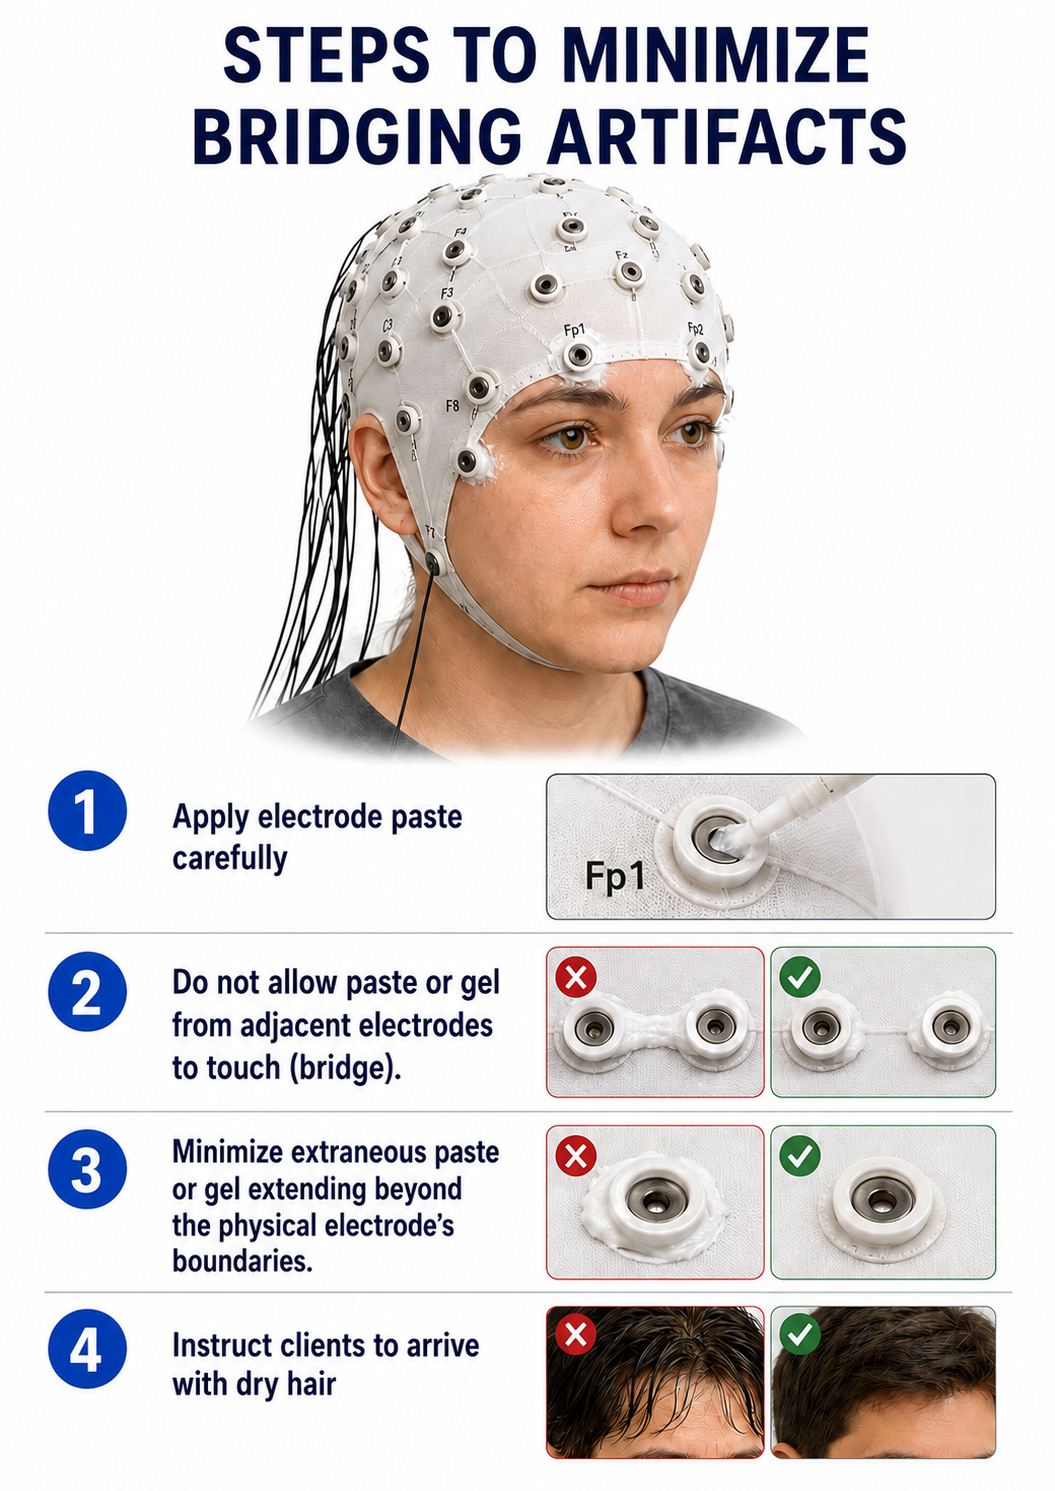
Bridging artifact (also called a salt bridge) occurs when a low-resistance conductive path forms between adjacent electrodes—typically from excessive electrode paste or gel, heavy perspiration, or a wet scalp—so that the two electrodes record nearly the same potential. Bridged electrodes produce nearly identical tracings in a referential montage and a flat or markedly attenuated channel in a bipolar montage, because there is almost no voltage difference left for the differential amplifier to display. The Fp1-F3 channel's reduced amplitude and frequency in the graphic below illustrate this artifact.
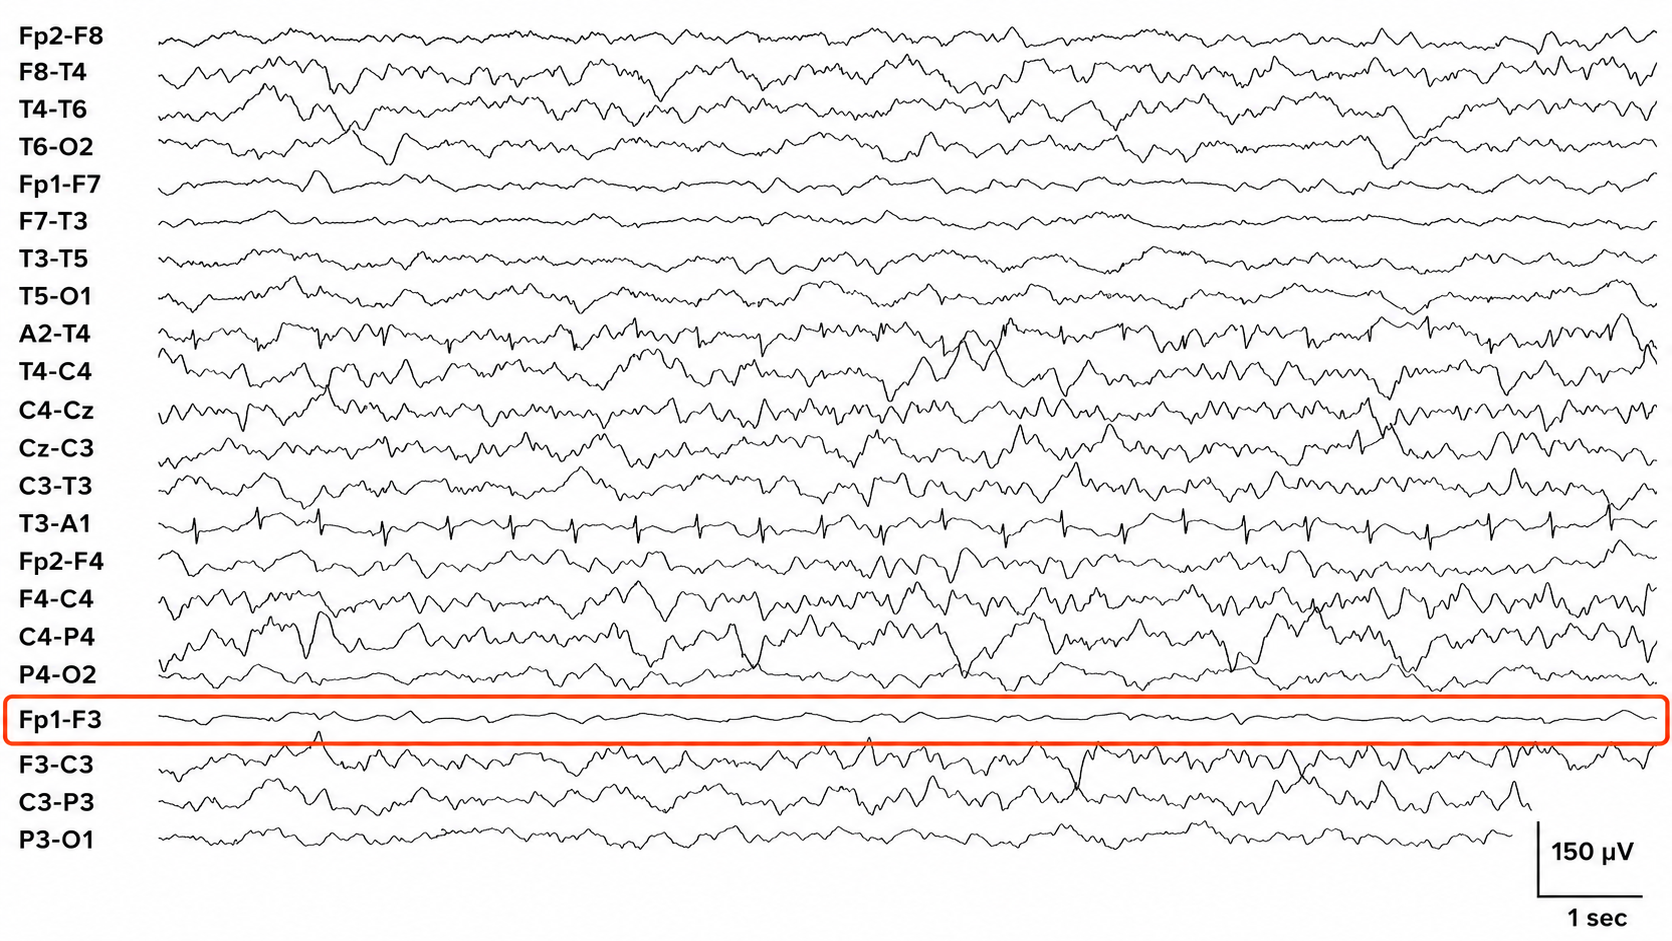
This EEG segment demonstrates a bridging artifact involving the left anterior frontal electrodes, most clearly seen in the highlighted Fp1-F3 derivation. Historically, bridging artifact has been recognized as an important technical pitfall in scalp EEG because it can make two nearby electrodes behave as though they are electrically shorted together. When conductive paste, sweat, saline, gel spread, or another low-resistance pathway connects two electrodes, the voltage difference between them becomes artificially reduced. In a bipolar montage, this can produce an abnormally flat or attenuated channel between the bridged electrodes, even while surrounding channels continue to show normal or artifact-contaminated EEG activity.
In this tracing, the highlighted Fp1-F3 channel is strikingly low in amplitude compared with adjacent and homologous derivations. It appears relatively flat and featureless across the displayed epoch, while the neighboring F3-C3, C3-P3, and P3-O1 channels show substantially larger mixed-frequency activity. This pattern is not physiologically plausible as an isolated absence of cerebral activity only between Fp1 and F3. Instead, it suggests that Fp1 and F3 are recording nearly the same electrical potential, leaving little voltage difference for the bipolar amplifier to display in the Fp1-F3 channel.
Drowsiness Artifact
Drowsiness artifact appears when drowsiness or stage N1 or N2 sleep intrudes into the EEG recording. Drowsiness is not an artifact in the strict sense—it is a normal physiologic state change, not a noncerebral signal—but it is treated as one here because it contaminates a recording intended to sample waking activity. This is most likely during eyes-closed conditions, though clients may drift into sleep even during an ostensibly "awake" recording. Recognizing drowsiness matters because it changes the EEG in ways that can be mistaken for pathology or that render portions of the recording unrepresentative of the client's waking brain state.
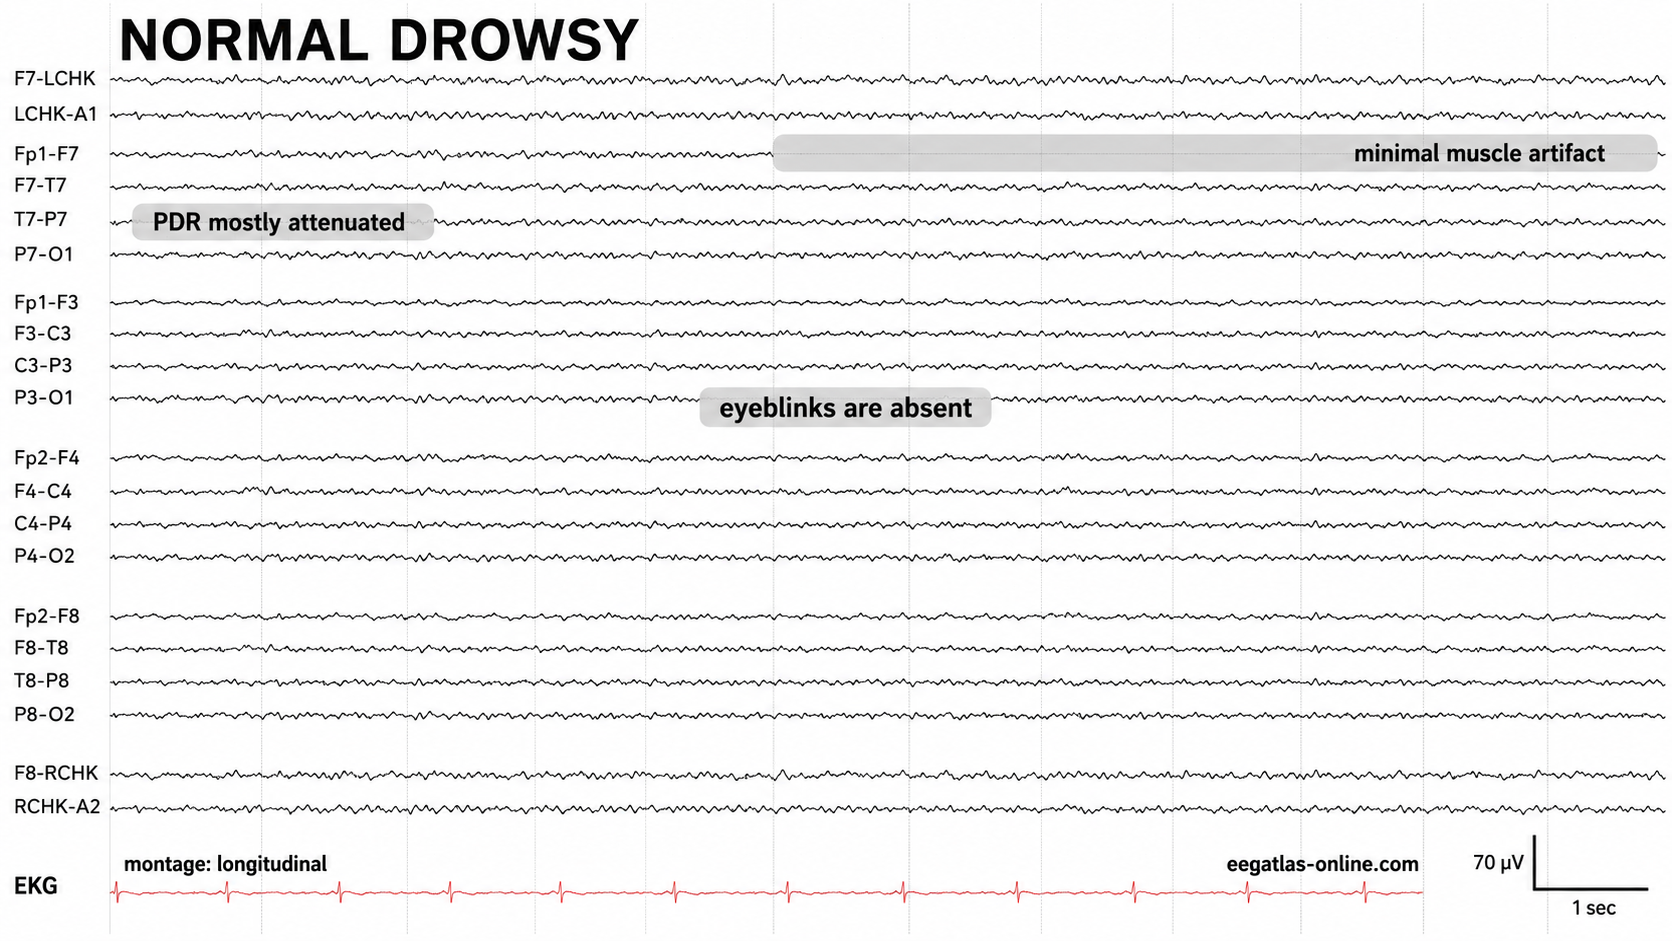
Graphic adapted from © eegatlas-online.com. This EEG segment shows a physiologic drowsy state in a longitudinal montage, with an EKG channel recorded at the bottom and a calibration of approximately 70 µV with a 1-second time marker. In the historical development of clinical EEG interpretation, drowsiness became important because the transition from relaxed wakefulness into stage N1 sleep changes the background in predictable ways: the posterior dominant rhythm loses persistence, eye blinks diminish or disappear, muscle activity often decreases, and the tracing becomes lower in sustained alpha organization with more mixed low-amplitude activity.
The most important feature in this recording is the attenuation of the posterior dominant rhythm. In a fully awake, relaxed, eyes-closed adult, one would expect a more sustained posterior alpha rhythm, usually maximal over the posterior head regions. In this segment, the posterior rhythm is mostly attenuated, especially across the posterior temporal and occipital derivations, consistent with the transition away from relaxed wakefulness. The tracing is not flat or suppressed; rather, it shows a low-amplitude mixed background in which the organized posterior alpha rhythm is no longer prominent.
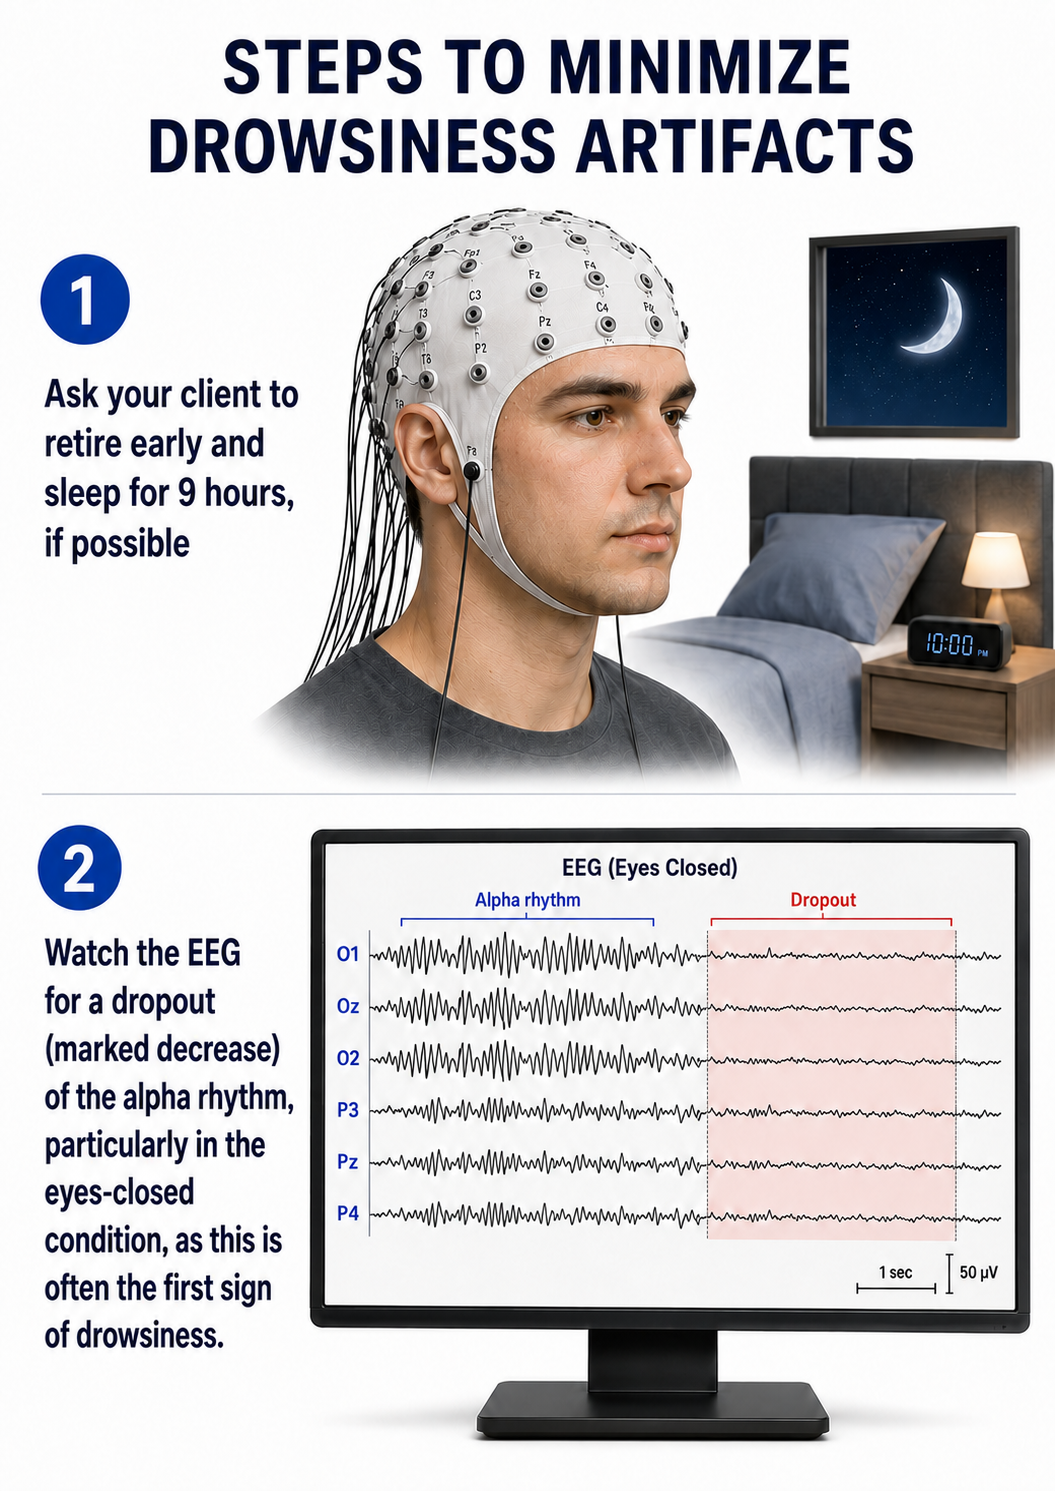
The first example below shows a brief episode of drowsiness lasting about 5 seconds, with a dropout of the alpha rhythm (the posterior dominant rhythm, or PDR) followed by its return. The second example shows the end of a longer period of light sleep with a K-complex indicated in the F3-C3 derivation, followed by a return to a typical alpha rhythm.
This EEG recording is most consistent with a normal drowsy state. The tracing is shown in a longitudinal bipolar montage with a simultaneous EKG channel at the bottom, and the overall appearance is that of a low-amplitude, relatively symmetric background during the transition from relaxed wakefulness toward early sleep. In clinical EEG interpretation, drowsiness is recognized not as a pathologic state but as a physiologic change in background organization. As the patient becomes drowsy, the posterior dominant rhythm that is usually most evident during relaxed eyes-closed wakefulness becomes less sustained or attenuates, eye blinks diminish or disappear, and muscle activity often decreases as facial and scalp tone relax.
In this segment, the posterior dominant rhythm is mostly attenuated. The posterior derivations do not show a robust, continuous alpha rhythm, and instead the tracing contains lower-amplitude mixed-frequency activity distributed across the scalp. This is an expected feature of drowsiness, especially during the transition from wakefulness into stage N1 sleep. The background does not appear globally suppressed; rather, it has lost the organized posterior alpha pattern typical of fully alert relaxed wakefulness.
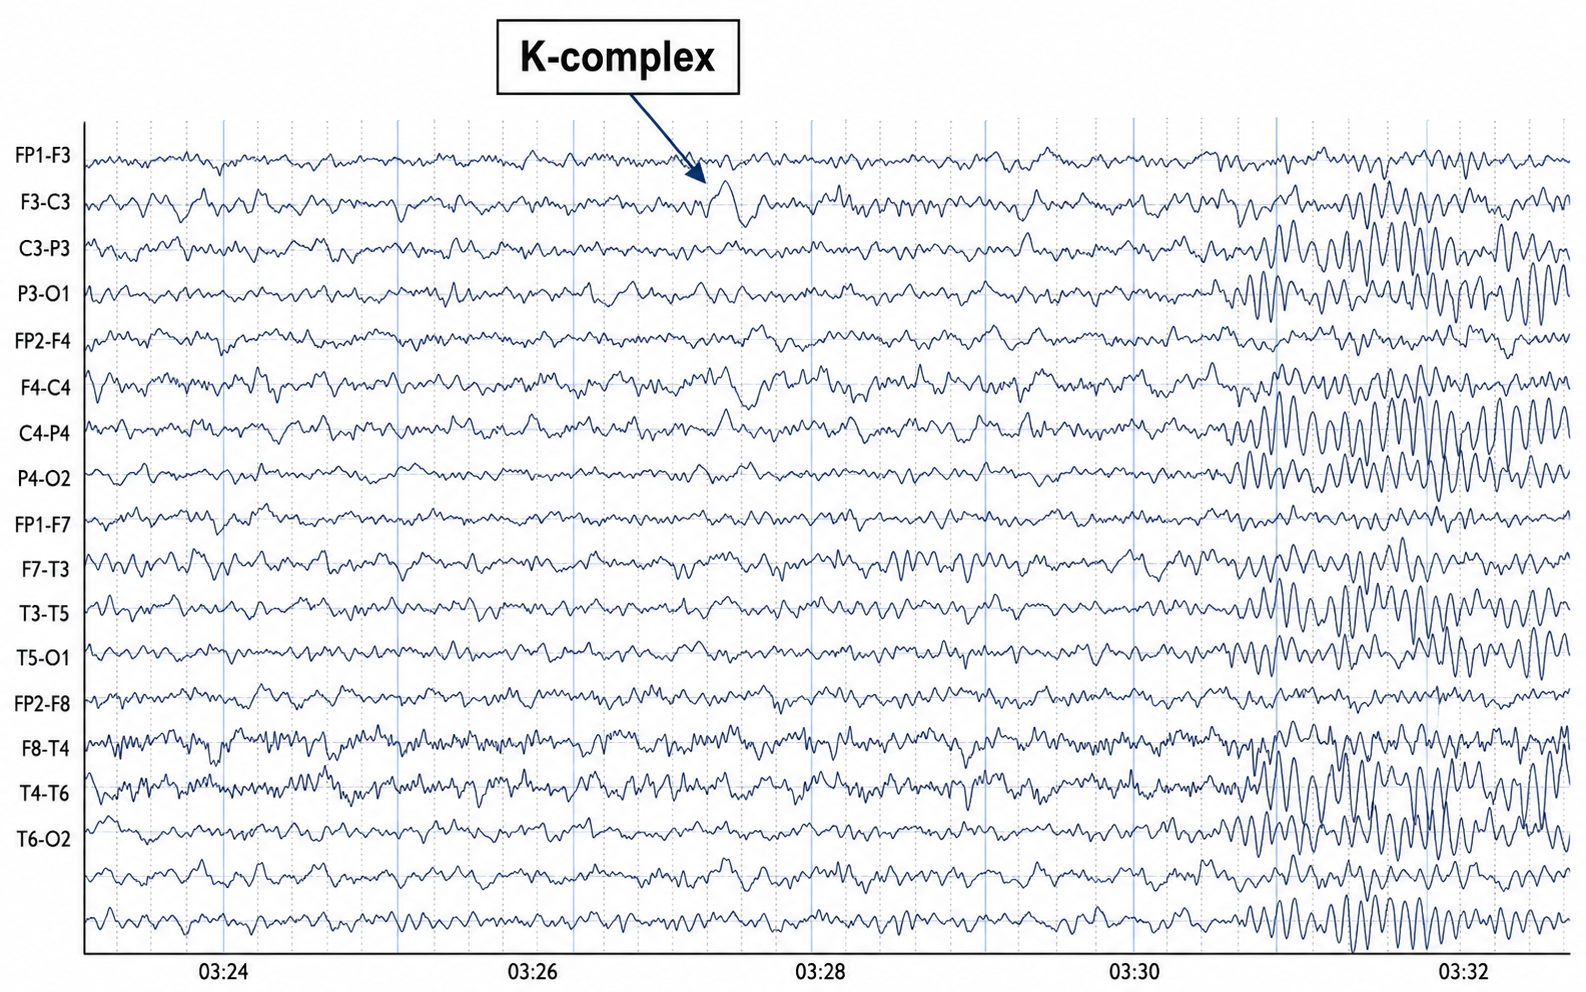
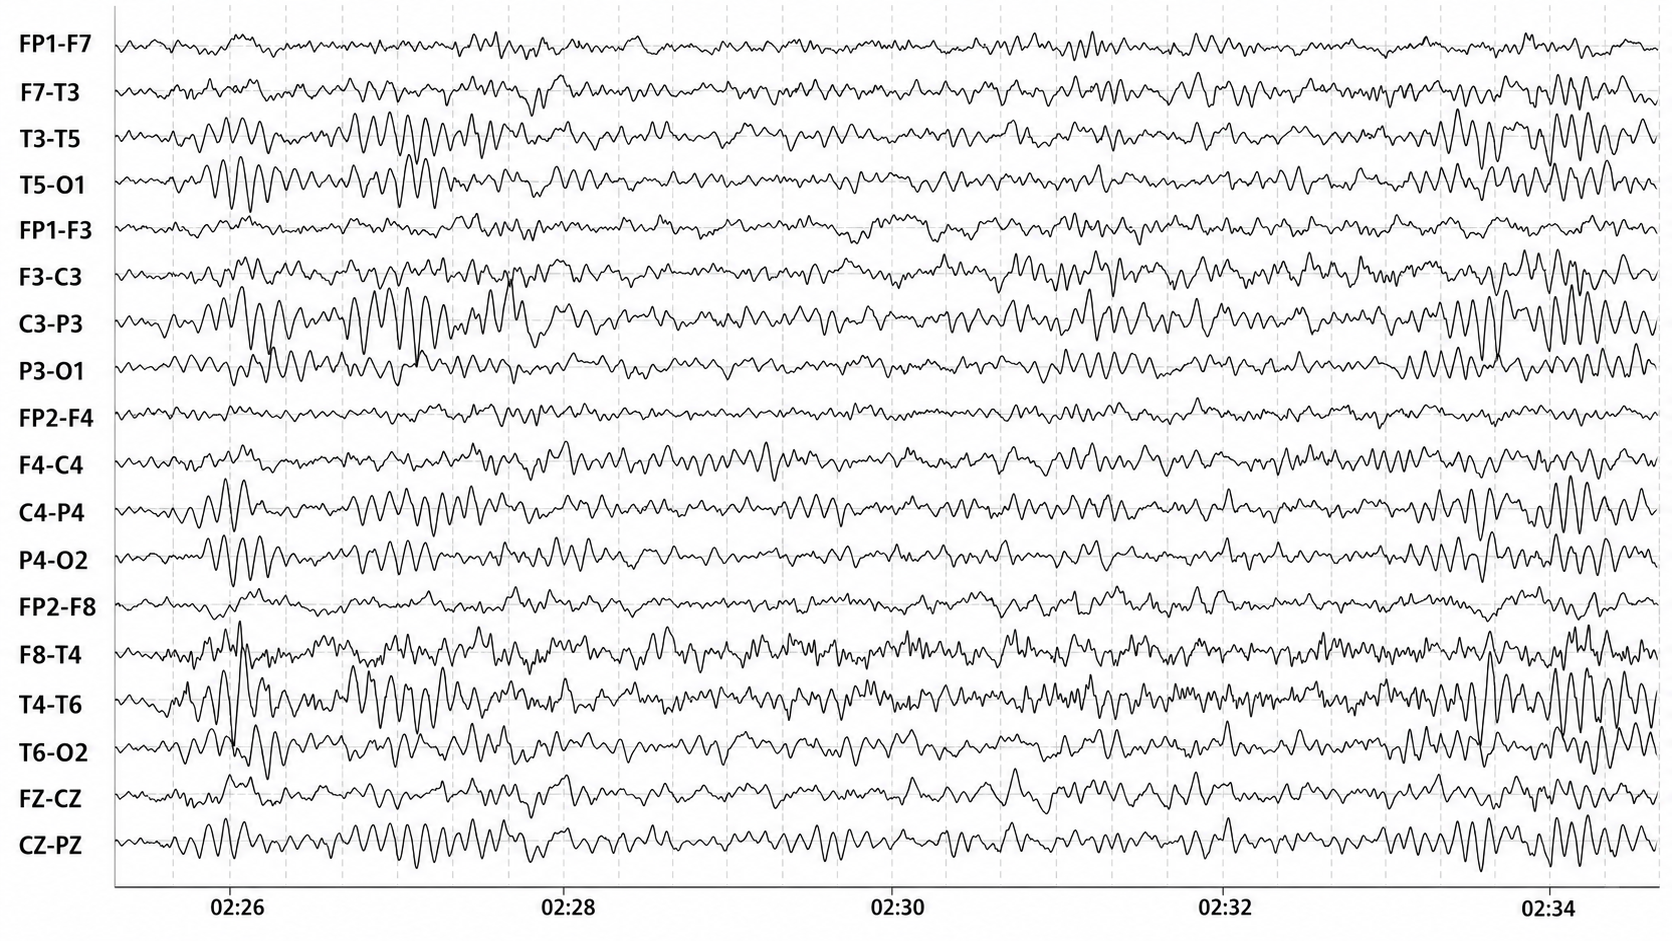
This EEG segment shows a normal sleep-transition pattern with clear features of drowsiness progressing into stage N2 sleep. The recording is displayed in a longitudinal bipolar montage, with bilateral anterior-posterior chains that allow comparison of frontal, central, temporal, parietal, and occipital regions. Historically, drowsiness in EEG was recognized by attenuation of the posterior dominant rhythm and the emergence of low-amplitude mixed-frequency activity, while stage N2 sleep became defined by the appearance of characteristic graphoelements such as K-complexes and sleep spindles. This image contains both the subdued, mixed background expected with reduced wakefulness and more specific stage N2 features.
The most conspicuous labeled event is a K-complex near the middle of the displayed epoch, around 03:27. It appears as a relatively high-amplitude, sharply contoured slow complex with a broad field, most evident over the frontocentral derivations. Its morphology is consistent with a normal sleep-related K-complex rather than an epileptiform discharge, because it is broad, state-dependent, not followed by an evolving ictal rhythm, and occurs in a background that otherwise shows sleep architecture. The field is not restricted to one electrode or one channel, which argues against a focal electrode artifact.
Later in the segment, beginning around 03:30 and continuing toward 03:32, there are prominent rhythmic waxing-and-waning bursts consistent with sleep spindles. These are most apparent over central and parasagittal derivations, with bilateral expression and a frequency visually compatible with the sigma range, typically around 12–14 Hz. Their morphology is regular and spindle-like, with gradual buildup and decline rather than abrupt onset and termination. This is a normal physiologic sleep pattern and supports classification as stage N2 sleep rather than simple quiet wakefulness.
Stage 1 (N1) sleep is a subtle, drowsy state that clients often fail to recognize. Alpha amplitude—especially over occipital sites—decreases markedly, while theta activity increases. Slow, rolling eye movements are accompanied by reductions in EMG amplitude, and the onset of sleep may bring sharply contoured transients known as vertex sharp waves (V-waves), which are maximal at the vertex and are a normal finding rather than epileptiform activity.
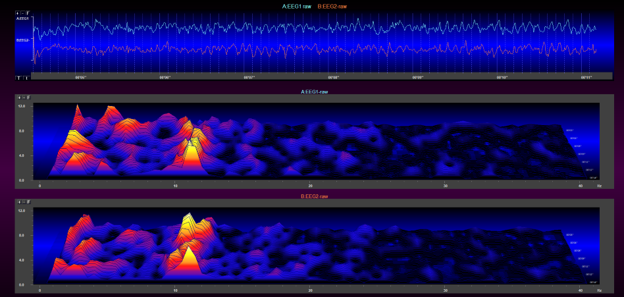
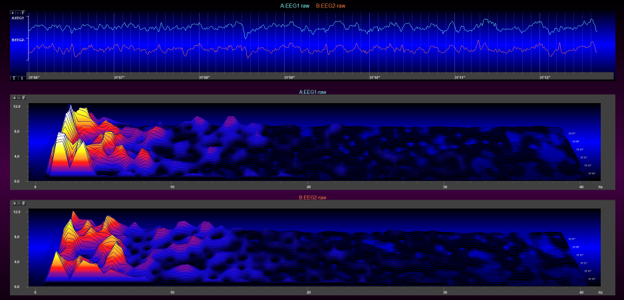
Graphics © John S. Anderson. The two images above each contain raw EEG tracings from two scalp electrodes: A (EEG1) shows P3–A1, and B (EEG2) shows P4–A2. The raw tracings are displayed with a 0–60 Hz bandpass and a 50 µV vertical scale. Below each set of raw tracings are compressed spectral arrays (CSA) presenting the same information as a three-dimensional image: frequency on the x-axis (here 0–40 Hz), power on the y-axis (0–12.0 in units of µV², which this software labels picowatts), and time on the z-axis (10 seconds).
Note that the top image, recorded during the initial eyes-closed period, shows an active posterior rhythm of about 10 Hz; the spectral display clearly renders bright yellow (higher-amplitude) peaks at 10 Hz. The lower image shows a much slower pattern in the raw tracing, with clear lateral eye-movement artifacts along with some theta and delta activity. The CSA reflects the same change, including the loss of the 10 Hz posterior rhythm. Together, these two images detail the transition from an awake, eyes-closed EEG to a drowsy, Stage 1 pattern.
When you detect drowsiness artifact during a training session, suspend recording and instruct your clients to move their hands and legs to increase wakefulness. To reduce the likelihood of this artifact, ask clients to obtain a full night's sleep—7 to 9 hours for most adults—before the recording, and schedule sessions away from the post-lunch dip when possible (Thompson & Thompson, 2015).
Evoked Potential
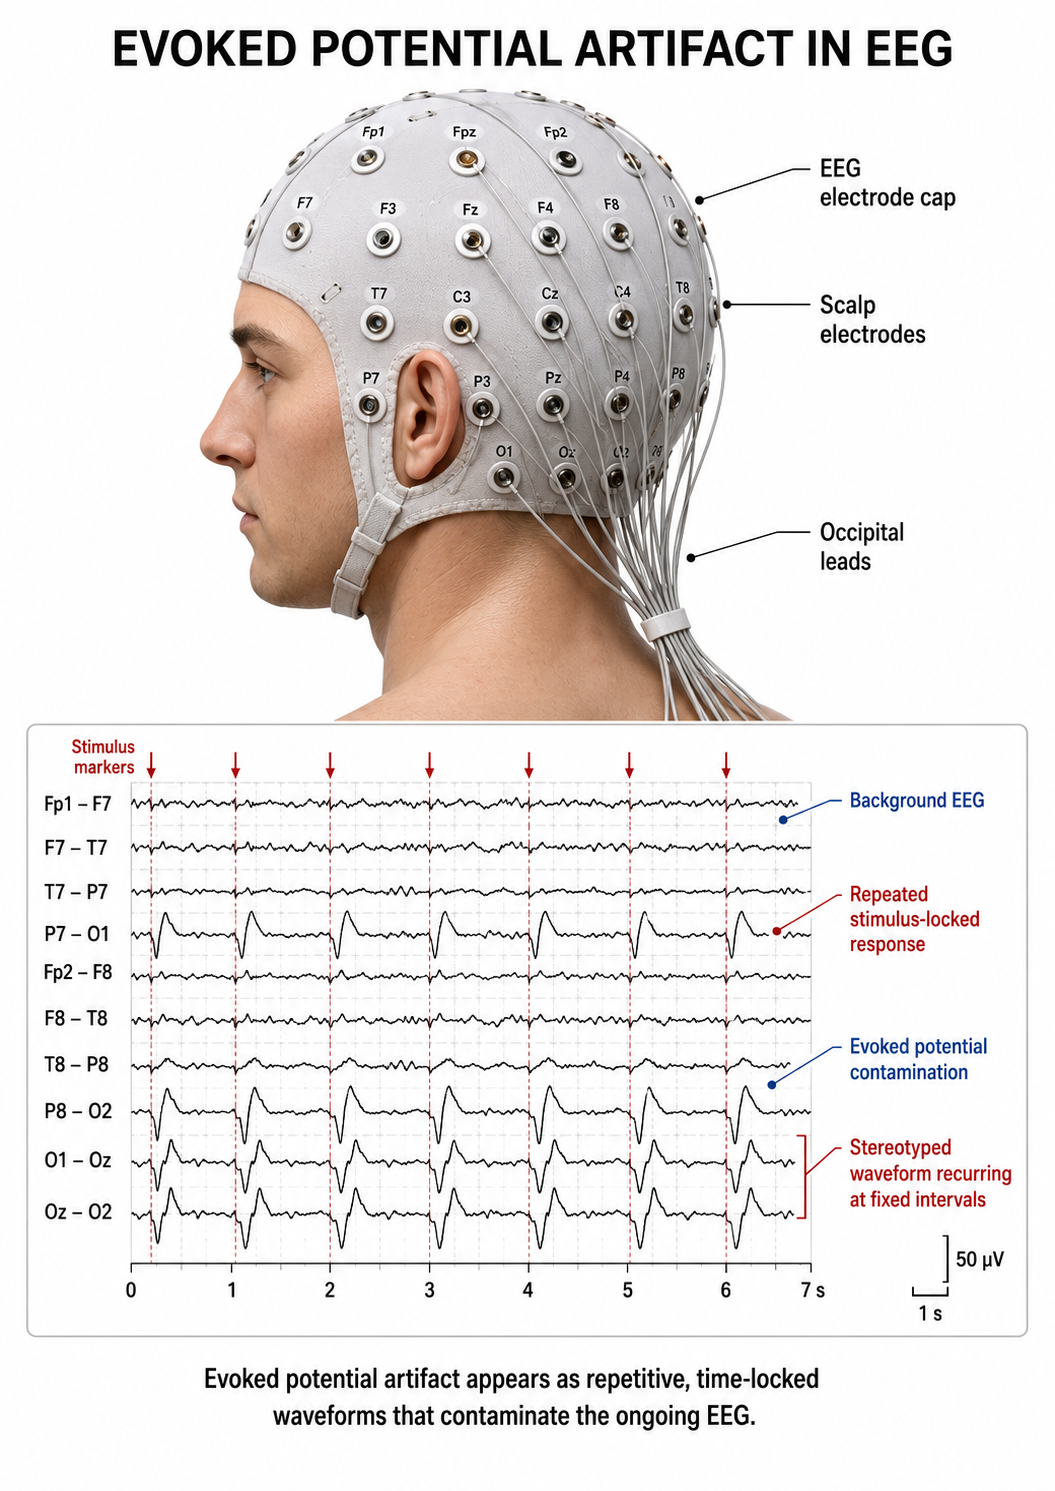
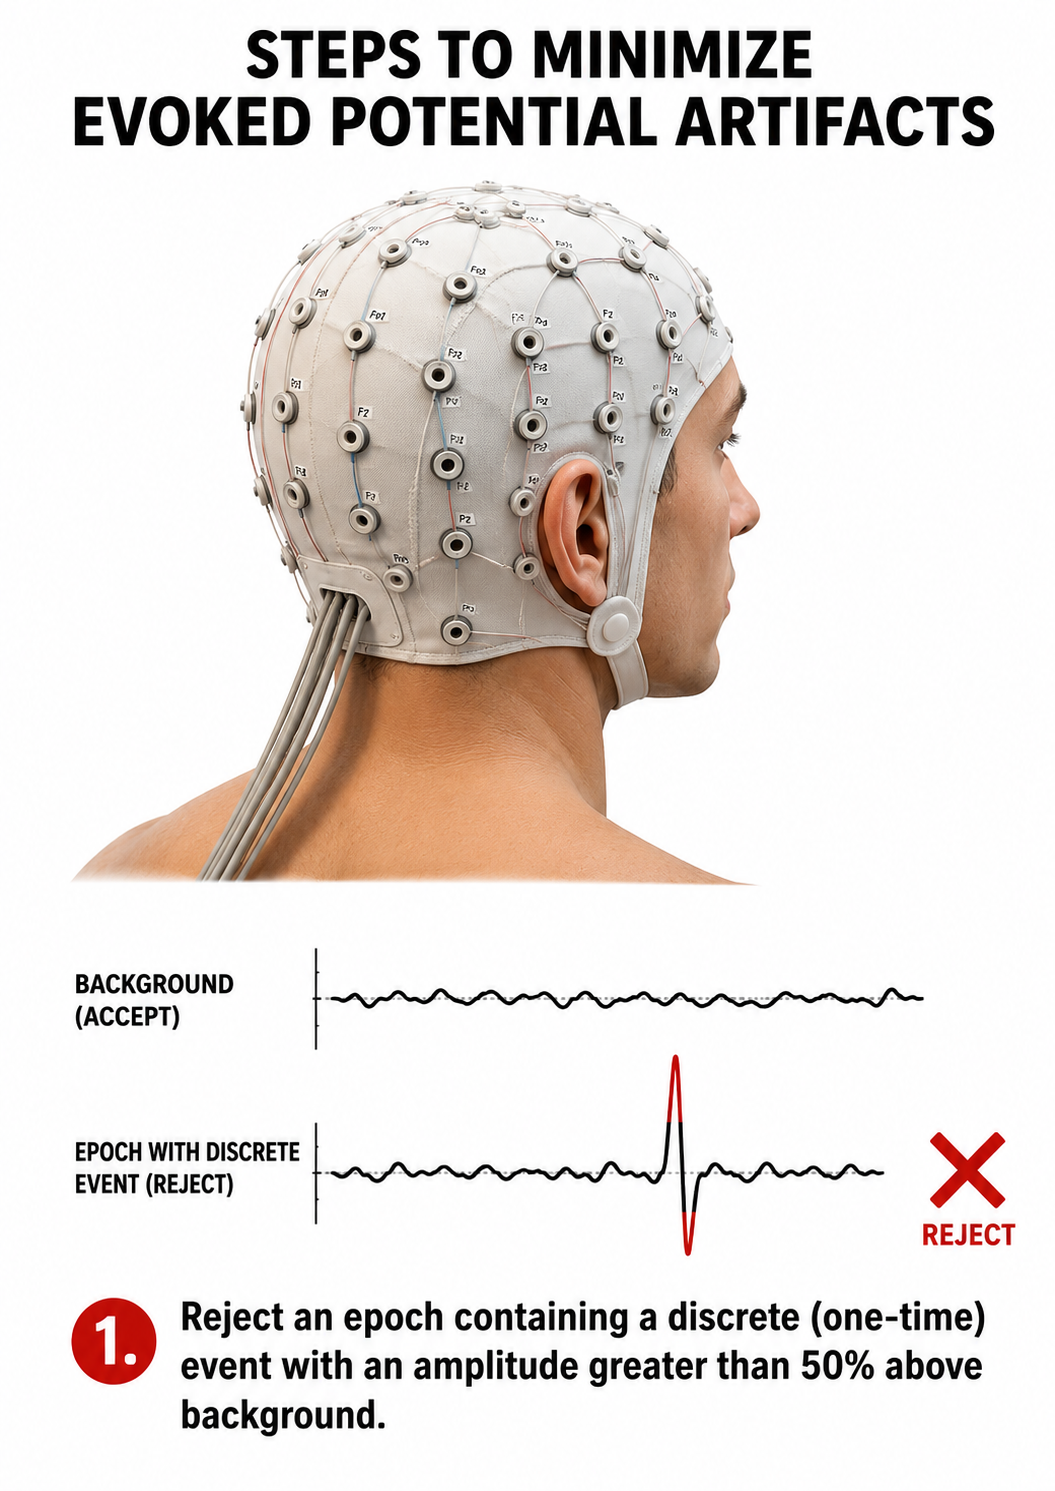
Evoked potential artifact (also called event-related potential artifact) consists of somatosensory, auditory, and visual signal processing-related transients that may contaminate multiple channels of an EEG record. While evoked potentials increase recording variability and reduce its reliability, they minimally affect averaged data (Thompson & Thompson, 2015).
Watch BPM Biosignals' YouTube video EEG: Visually evoked potentials (VEP).
Movement Artifact
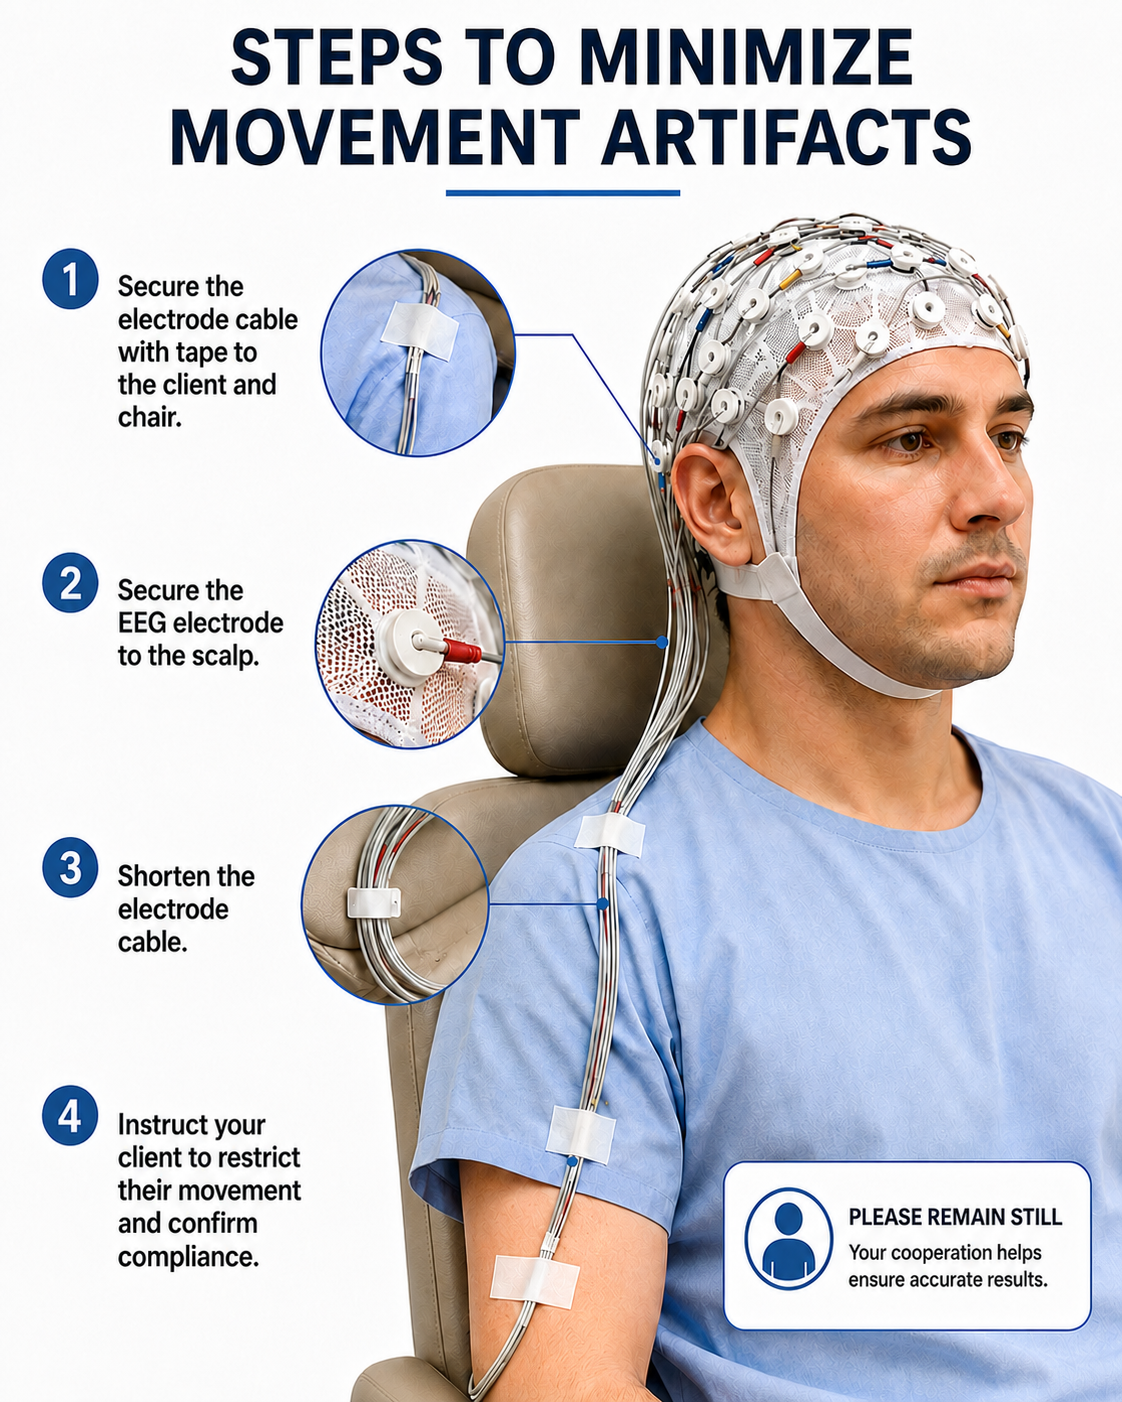
Movement artifact is caused by client movement or the movement of electrode wires by other individuals. Most of these artifacts result from brief changes in the electrode-skin surface connection. Cable movement is specifically called cable sway. Movement artifacts can produce high-amplitude voltages that are difficult to distinguish from genuine EEG and EMG signals on a single channel, although their abrupt onset, nonphysiologic morphology, and simultaneous appearance across many channels usually give them away. While the delta band is most affected, this artifact may also contaminate the theta band (Thompson & Thompson, 2015).
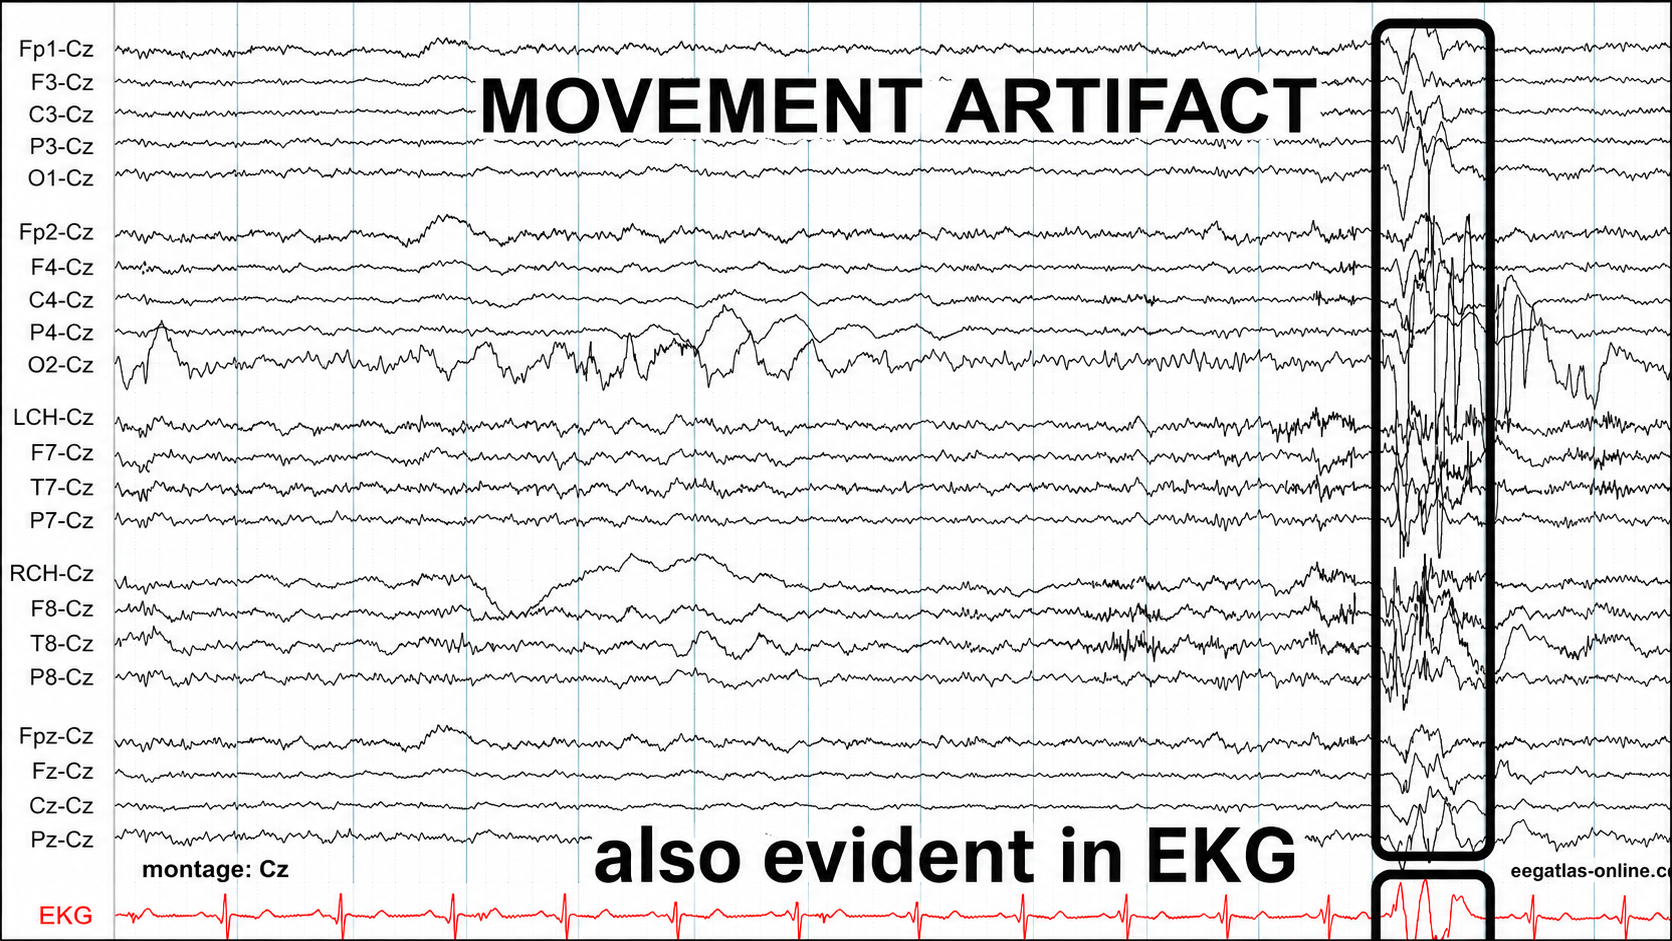
Graphic adapted from © eegatlas-online.com. This EEG segment shows a prominent movement artifact in a Cz-referential montage, with the most obvious contaminated interval highlighted near the right side of the tracing. The recording shows multiple scalp derivations referenced to Cz, with a simultaneous EKG channel at the bottom. Before the highlighted event, the EEG background consists of relatively lower-amplitude mixed-frequency activity with intermittent slower fluctuations. During the highlighted interval, however, there is an abrupt, large-amplitude, irregular disturbance that appears nearly simultaneously across many EEG channels.
The artifact has the typical appearance of movement contamination: the waveforms are large, abrupt, jagged, and nonphysiologic, with sudden baseline shifts and superimposed irregular faster components. The activity does not resemble a normal cerebral rhythm, a focal epileptiform discharge, or an evolving seizure pattern. Instead, it appears as a broad mechanical disruption of the recording. The morphology varies from channel to channel, but the timing is shared across much of the montage, which suggests movement of the patient, electrodes, leads, or reference pathway rather than a localized cortical generator.
The simultaneous disturbance in the EKG channel is especially important. The red EKG tracing at the bottom shows a clear disruption during the same interval as the EEG artifact, with large noncardiac deflections superimposed on or replacing the usual cardiac rhythm. When a large EEG disturbance is also evident in the EKG channel, the finding strongly supports a non-cerebral source, because true cortical activity would not be expected to produce a simultaneous large artifact in the cardiac lead. This temporal correspondence indicates that the event likely reflects body movement, cable movement, electrode displacement, or generalized mechanical disturbance affecting multiple recording channels.
The graphic below shows movement artifacts due to head movement (left), respiration (center), and tongue movement (right).
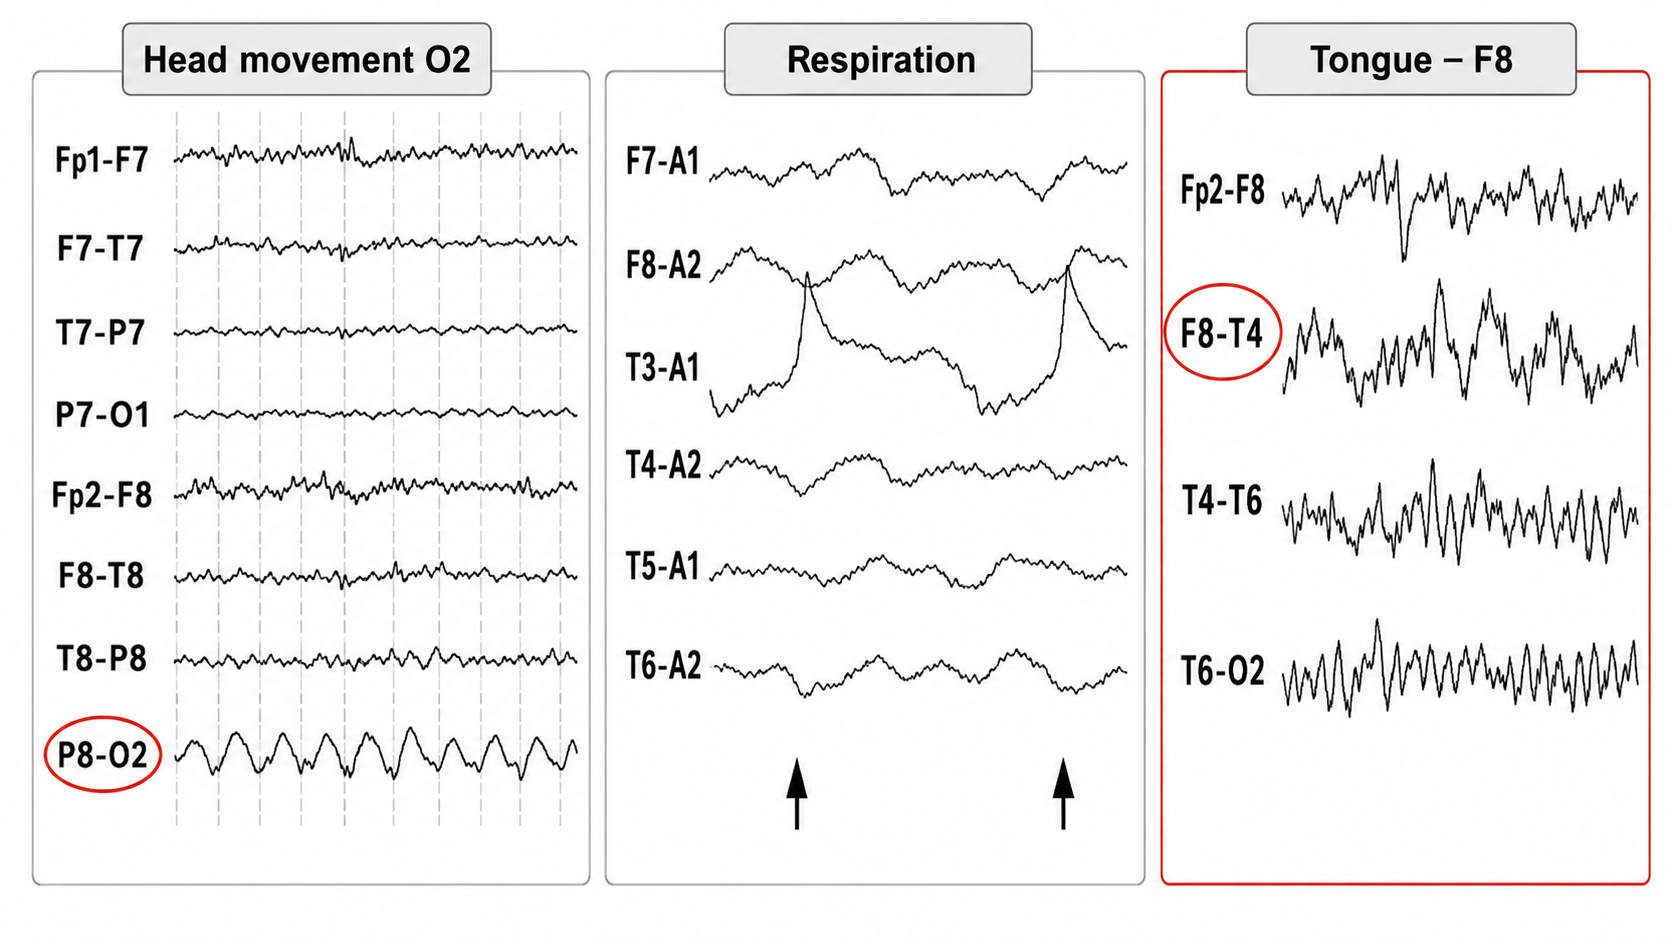
In the left panel, labeled “Head movement O2,” the most conspicuous abnormality is in the P8-O2 derivation. This channel shows a repetitive, relatively large-amplitude, slow rhythmic waveform that is not seen with comparable amplitude in the neighboring right temporal or left-sided channels. Because the affected channel includes O2, the pattern suggests movement or mechanical instability involving the right occipital electrode region. The waveform has a smooth, repetitive, mechanical quality rather than the spatially distributed field expected from a physiologic posterior rhythm. Its confinement to a posterior derivation and its regular movement-like morphology favor head movement or electrode motion near O2 rather than a focal occipital cerebral discharge.
The middle panel, labeled “Respiration,” shows slower rhythmic baseline fluctuations that correspond to breathing-related movement. The arrows mark respiratory cycles, and several channels show broad, slow deflections that rise and fall in a pattern compatible with chest, neck, head, or cable movement during respiration. This type of artifact may be more prominent in temporal or referential derivations, depending on electrode placement, wire tension, body position, and reference configuration. Unlike cerebral rhythmic activity, respiratory artifact tends to have a slow, periodic cadence tied to the breathing cycle, often with broad baseline shifts rather than organized cortical waveforms.
The right panel, labeled “Tongue – F8,” demonstrates a more irregular movement and muscle-related artifact, maximal in the F8-T4 derivation. The highlighted channel contains high-amplitude, jagged, irregular activity, with additional contamination in adjacent right anterior and temporal channels such as Fp2-F8 and T4-T6. This distribution suggests a source near the right anterior temporal/frontotemporal region, compatible with tongue movement, jaw activation, or nearby facial muscle activity affecting the F8 electrode region. The waveform is not sinusoidal or physiologically organized; instead, it is abrupt, uneven, and sharply irregular, which is typical of orofacial movement or electromyographic contamination.
Below is a BioGraph ® Infiniti cable movement artifact display. Note the two voltage spikes at the beginning of the recording.
50/60 Hz and Field Artifacts
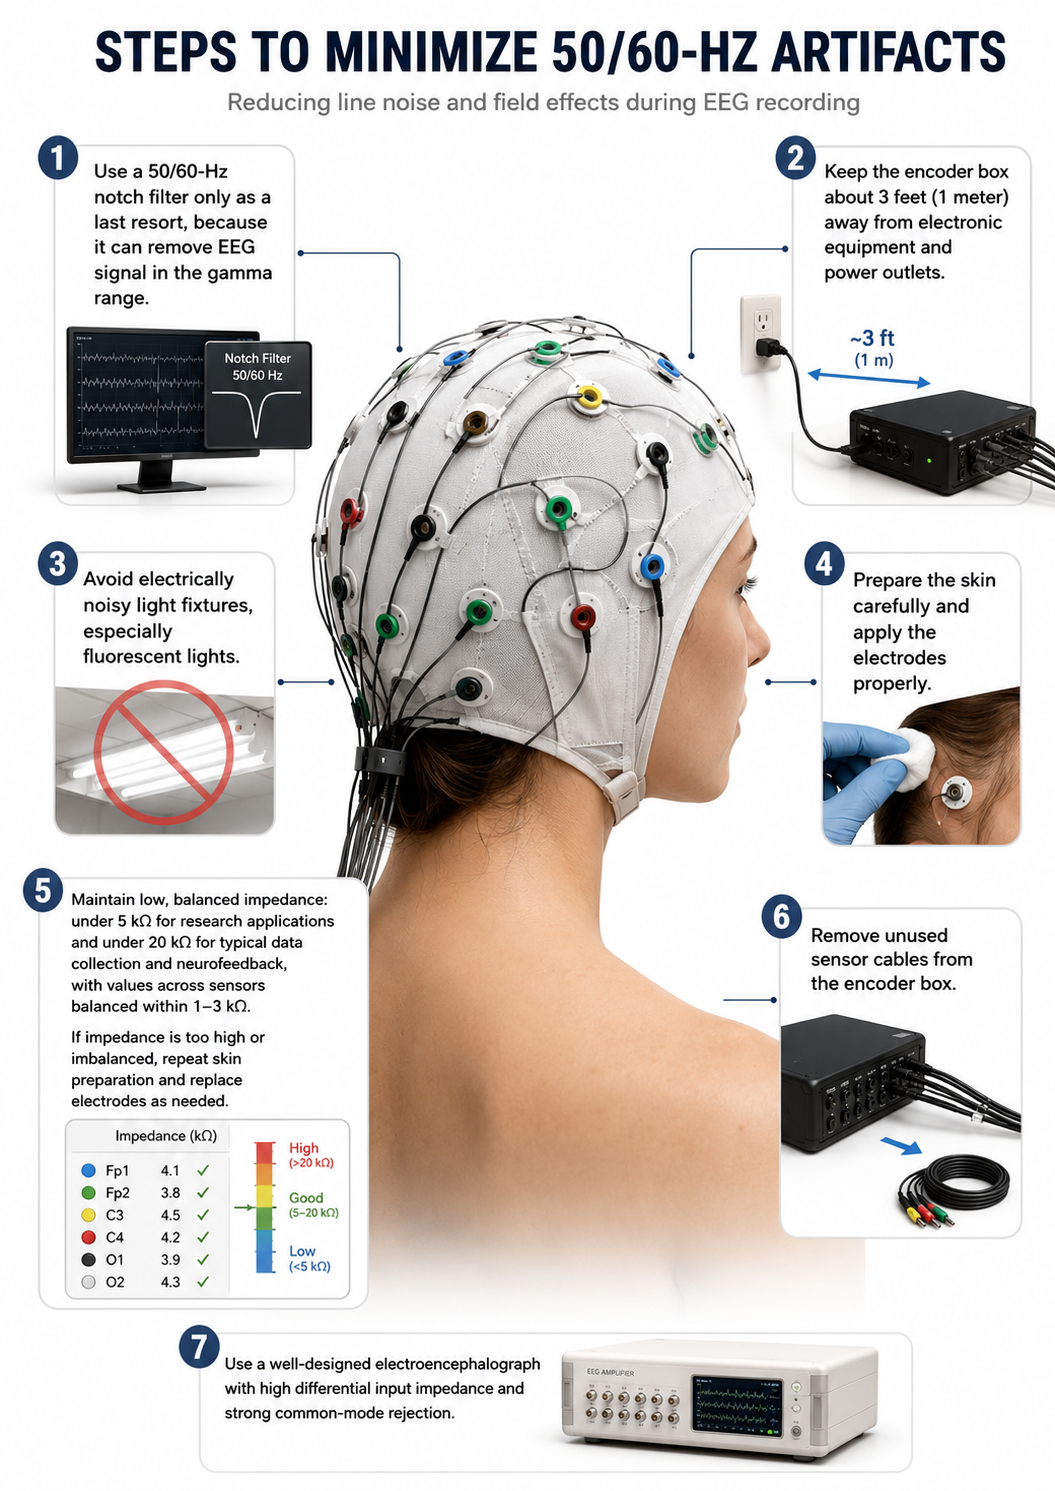
Both 50/60 Hz and field artifacts are external artifacts transmitted by nearby electrical sources such as power adapters for laptop computers or other electronic devices. While 60-Hz artifact is the primary concern in North America where AC voltage is transmitted at 60 Hz, 50-Hz artifact is the equivalent problem in regions that generate power at 50 Hz. Their fundamental frequency is 50 or 60 Hz, with harmonics at 100/120 Hz, 150/180 Hz, and 200/240 Hz.
An important complication is that a notch filter (a filter that suppresses a narrow band of frequencies) does not eliminate the problem. A notch centered at 50 or 60 Hz attenuates the fundamental but leaves the harmonics at 100/120 Hz and above untouched unless additional notches are applied, and the filter itself removes genuine cerebral activity within its stopband and can distort the phase and amplitude of nearby frequencies. Sharp notch filters can also produce ringing artifacts around abrupt transients. Separately, if the sampling rate and anti-aliasing filter are inadequate, line noise and its harmonics can be aliased down into lower frequencies where they masquerade as beta or even alpha activity. What a linear amplifier does not do is generate true subharmonics at half or a quarter of the line frequency; contamination reported at 25 Hz or 30 Hz is better explained by aliasing, intermodulation, or filter artifacts than by subharmonic generation. Because imbalanced electrode impedances defeat common-mode rejection, they increase an amplifier's vulnerability to line noise, which is why the durable fix is good, balanced electrode contact and removal of the interference source rather than reliance on the notch filter.
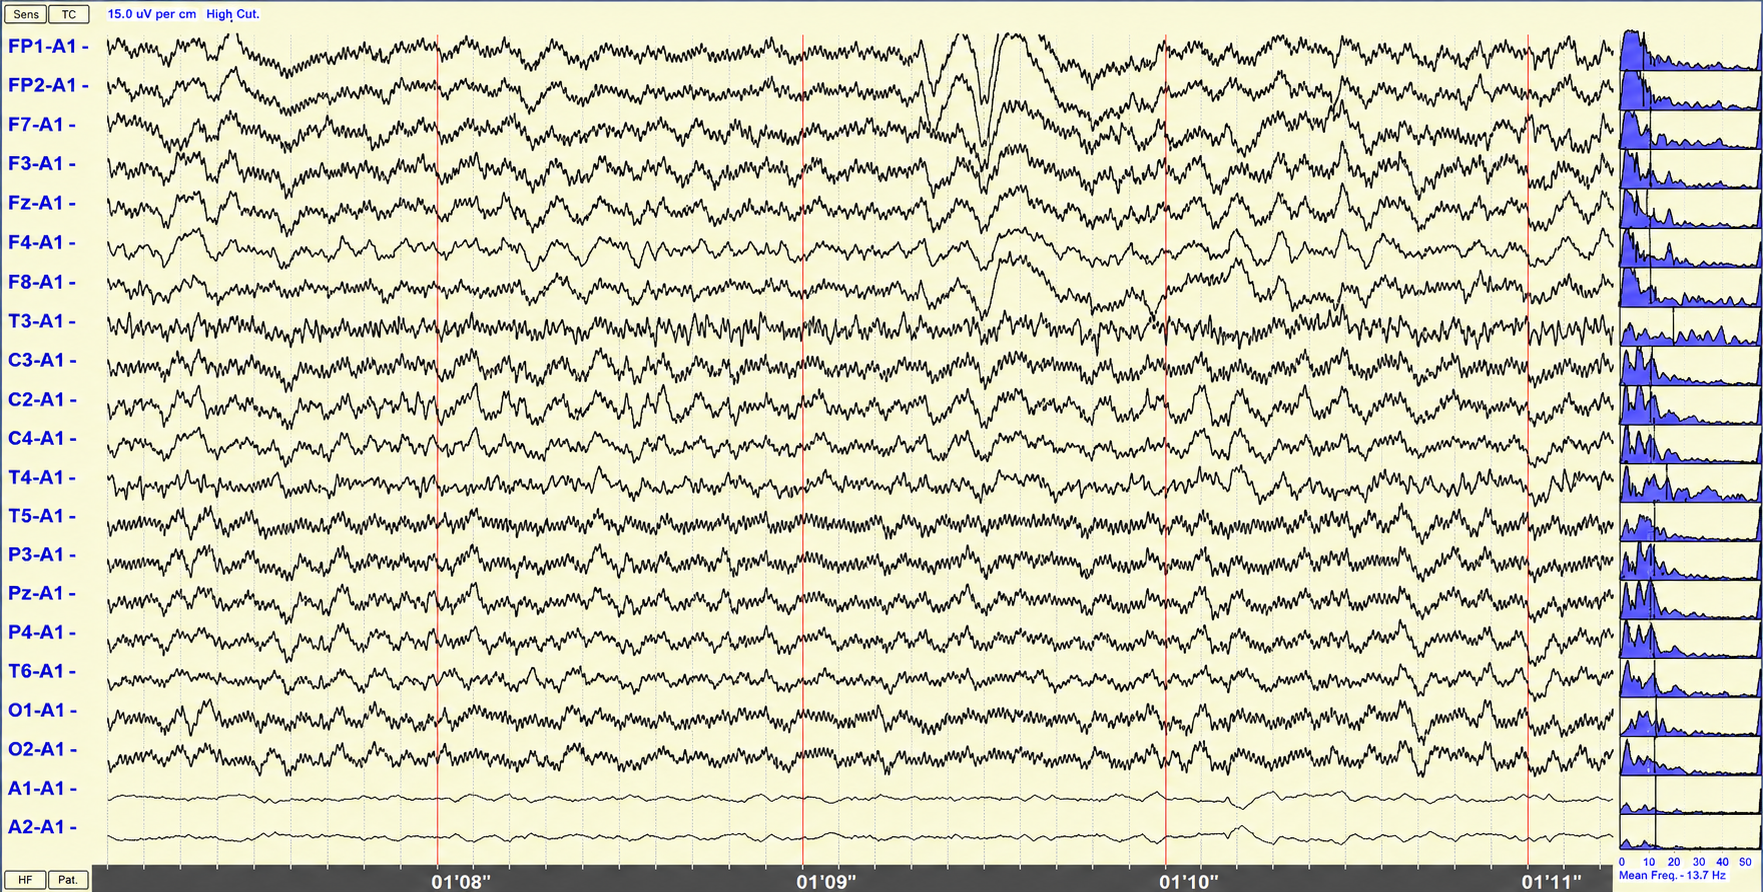
The 60-Hz artifact graphic © John S. Anderson. This EEG segment is shown in a referential montage in which the scalp electrodes are referenced primarily to A1, with a sensitivity of 15 µV/cm. The recording is heavily contaminated by a widespread, regular, high-frequency signal consistent with 60-Hz line-frequency artifact. The artifact appears as a fine, tightly spaced, nearly sinusoidal oscillation riding on top of the slower EEG background across many channels. Its uniformity and persistence distinguish it from physiologic beta activity, which is usually less mechanically regular, more variable over time, and more dependent on state, medication, or regional scalp muscle activity.
The contamination is broadly distributed across the montage rather than limited to one physiologic field. Channels from frontal, central, temporal, parietal, and occipital regions all show varying degrees of this fast regular activity. Because the montage is referential, a problem involving the reference, ground, electrode impedance balance, environmental electrical interference, or amplifier shielding can project the artifact widely across the recording. The A1-referenced layout is important because contamination affecting the reference pathway can make a technical problem appear generalized.
A BioGraph ® Infiniti display of 60-Hz artifact is shown below in red. Note the cyclical voltage fluctuations and 60-Hz peak in the power spectral display.
Radiofrequency Artifact
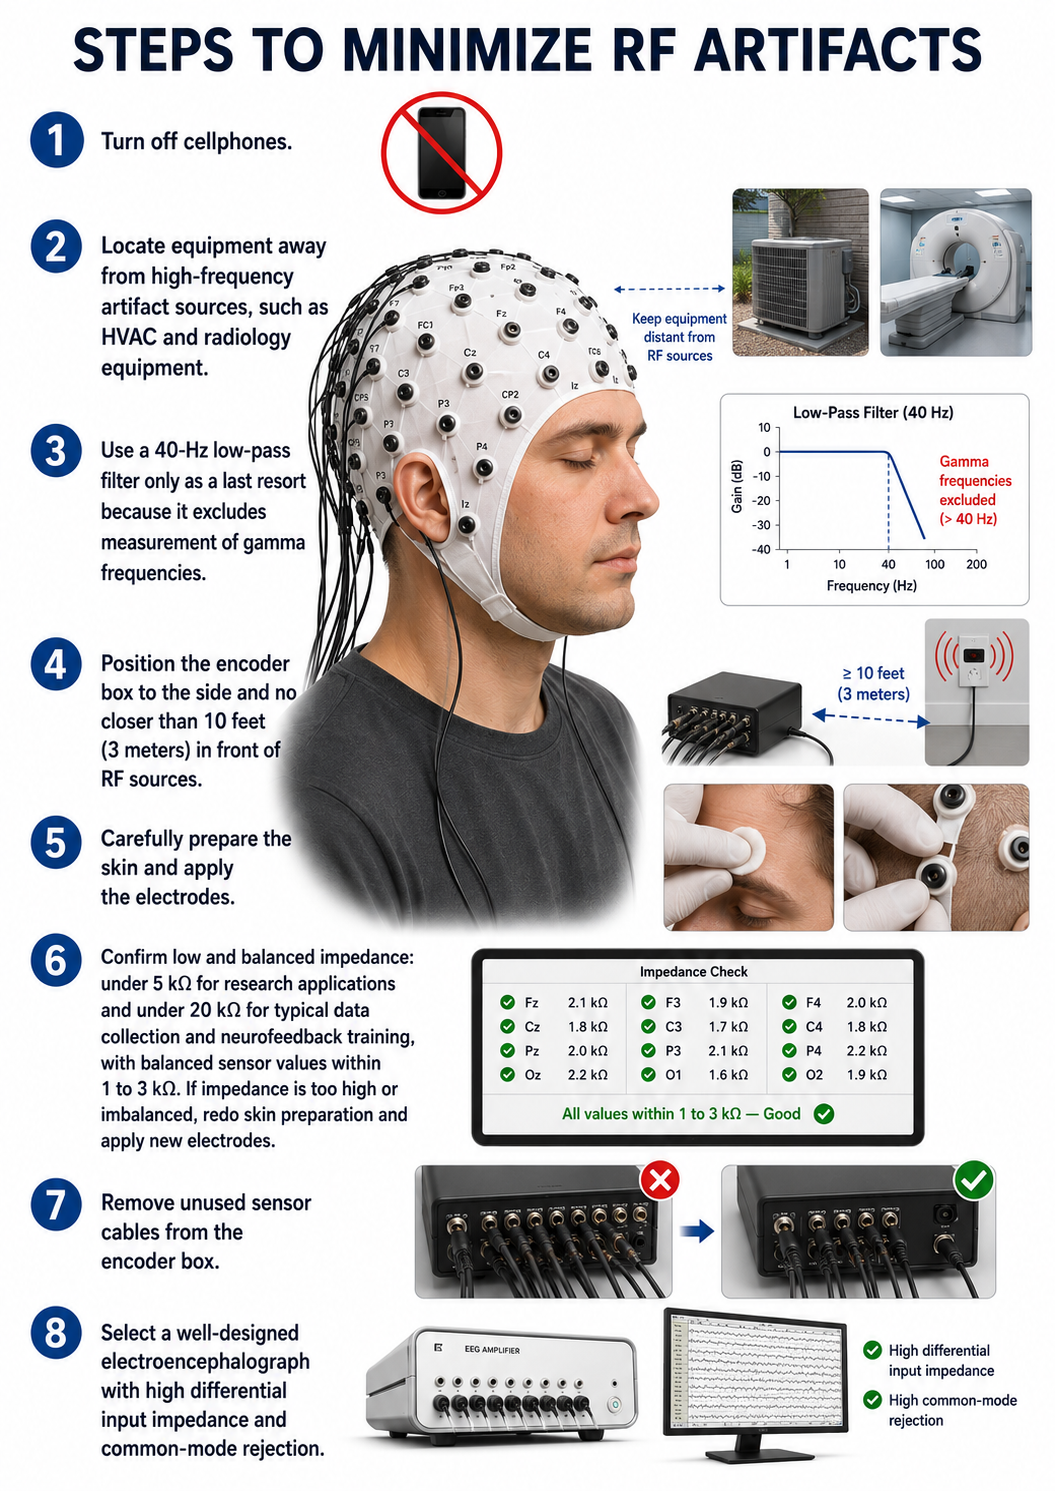
Radiofrequency (RF) artifact is contamination from external electromagnetic sources. The classic teaching that it radiates outward in a cone from the front of a display describes cathode-ray-tube televisions and monitors, which are now rare; contemporary LCD and LED displays do not emit in this way. In a modern clinic the practical RF sources are mobile phones and their transmitters, cordless phones, Wi-Fi and Bluetooth devices, wireless microphones, elevator and HVAC motors, and nearby medical equipment. The artifact typically appears and disappears abruptly, is mechanically regular, and does not respect physiologic fields, as the recording below illustrates.
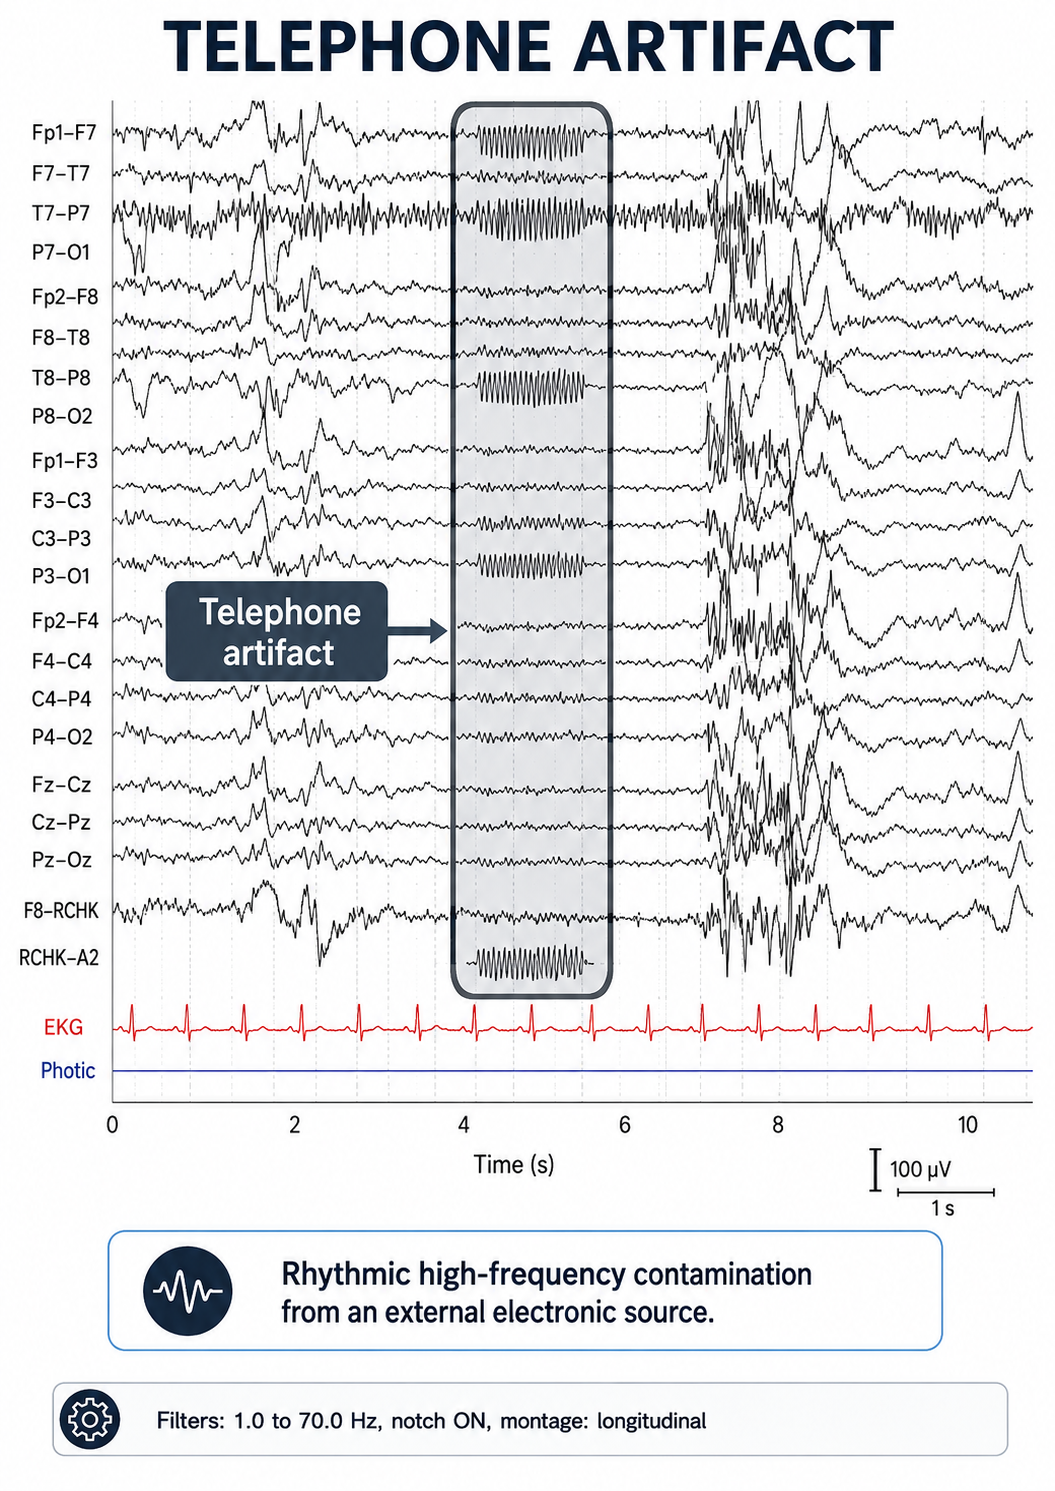
Graphic adapted from © eegatlas-online.com. This EEG segment demonstrates radiofrequency contamination, labeled here as a telephone artifact, in a longitudinal bipolar montage. The recording uses filters from 1.0 to 70.0 Hz with the notch filter turned on, and includes simultaneous EKG and photic channels. The artifact is most clearly visible in the boxed interval between approximately 4 and 6 seconds, where a rhythmic, tightly packed, high-frequency oscillation appears abruptly in several channels. Its sudden onset, nearly mechanical regularity, and abrupt disappearance strongly favor contamination from an external electronic source rather than physiologic cerebral activity.
Electrode Artifacts
EEG recordings can be contaminated by several sources of electrode artifact. Even with proper care, electrode surfaces corrode and leads and connectors sustain damage over time. Electrodes are also subject to polarization, a chemical process at the electrode–electrolyte interface in which separated regions of positive and negative charge build up and reduce ion exchange. Polarization occurs at the electrode, not in the amplifier; what reaches the amplifier is a shifting DC offset and an unstable, elevated impedance. Using two different metals for the two inputs of a channel compounds the problem, because dissimilar metals have different half-cell potentials and generate a standing DC voltage difference that the differential amplifier cannot reject. Silver–silver chloride electrodes are preferred precisely because they are relatively nonpolarizing.
A common source of this problem is electrodes built on a base substrate—such as 3-D-printed plastic, brass, or copper—that is then electroplated with gold, silver, or a silver–silver chloride coating. Once repeated use and cleaning wear the coating through, the exposed circuit contains dissimilar metals (copper, brass, gold, silver, and so on), producing circuit and impedance problems (Kaveh et al., 2022).
Impedance Artifact
Unless skin-electrode impedance (the frequency-dependent opposition to an AC signal, measured in ohms and conventionally reported in kilohms) is low and balanced across sites, artifacts such as 50/60 Hz interference and movement can contaminate the EEG signal, as seen in the P3 and Pz electrodes in the graphic below. Published targets differ by application: ACNS Guideline 1 for clinical EEG specifies impedances between 100 Ω and 5 KΩ, research and evoked potential work commonly aims for under 5 KΩ, and neurofeedback practice guidance often accepts up to about 10–20 KΩ with modern high-input-impedance amplifiers, provided the values are matched within roughly 1–3 KΩ between sites. Regular impedance checks during setup and again at the end of a session ensure consistent contact quality.
It helps to understand why this balance matters, not just the target values. Recall that the differential amplifier removes shared noise such as 50/60 Hz interference through common-mode rejection, but it can do so only when the active and reference inputs present nearly identical impedances. When the two impedances differ, the same line noise produces slightly different voltages at each input, and that difference survives as a signal the amplifier treats as though it were genuine EEG (Demos, 2019). Low absolute impedance reduces overall noise pickup, while balanced impedance preserves the amplifier's ability to cancel it, which is why both conditions appear in the targets above. This mechanism is what the impedance question in the Assignment at the end of this unit asks you to explain.
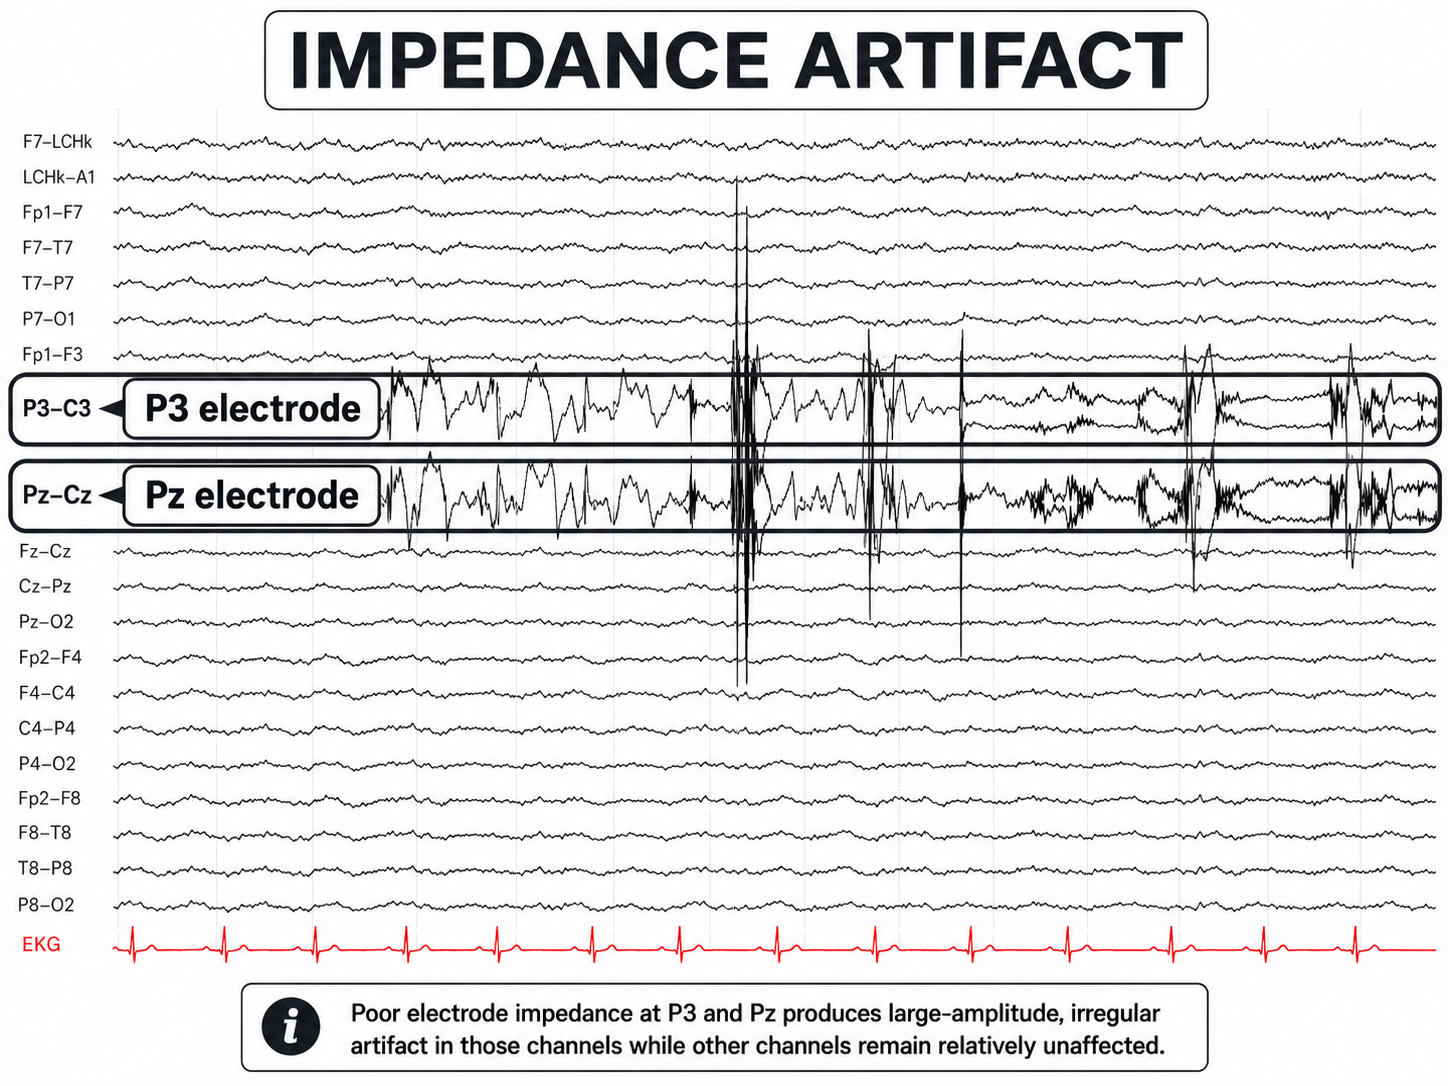
Graphic adapted from © eegatlas-online.com. The recording is displayed in a longitudinal bipolar arrangement with an EKG channel at the bottom. The red EKG tracing is regular and does not account for the large irregular activity in the highlighted EEG channels. The key abnormal-looking activity appears in the P3-C3 derivation and the Pz-Cz derivation, where the waveforms are much larger, more irregular, and more sharply unstable than the surrounding EEG background. These discharges fluctuate abruptly, with jagged high-amplitude deflections and intermittent vertical transients. Their morphology is not consistent with a normal cerebral rhythm, an evolving seizure pattern, or a reproducible epileptiform field.
Using abrasive gels or prepping the skin to reduce impedance is important, particularly in long-duration studies where skin conditions may change over time. However, infection control procedures must be enhanced whenever electrode attachment methods breach intact skin, due to the risk of disease transmission from bodily fluids. Modern high-input-impedance amplifiers have reduced the need for vigorous abrasion in many applications, but they have not eliminated the need for careful skin preparation: high absolute impedance still increases noise pickup, and impedance imbalance still defeats common-mode rejection regardless of how high the amplifier's input impedance is.
Electrode Pop Artifact
Even when impedance is low and balanced, mechanical disturbance can produce a distinctive artifact. Electrode pop artifact is a sudden, large deflection—classically a steep upstroke followed by a slower return to baseline—confined to the channels sharing a single electrode. It reflects an abrupt change in the electrode–electrolyte–skin junction, such as a loose or partially detached electrode, a bubble or void in the gel or paste, drying paste, or a tug on the lead wire. The defining feature is that the junction's standing potential shifts suddenly; despite the name, no spark or electrical discharge occurs. Its diagnostic hallmark is the complete absence of a physiologic field: the deflection appears only in derivations containing the offending electrode and does not spread to neighboring sites.
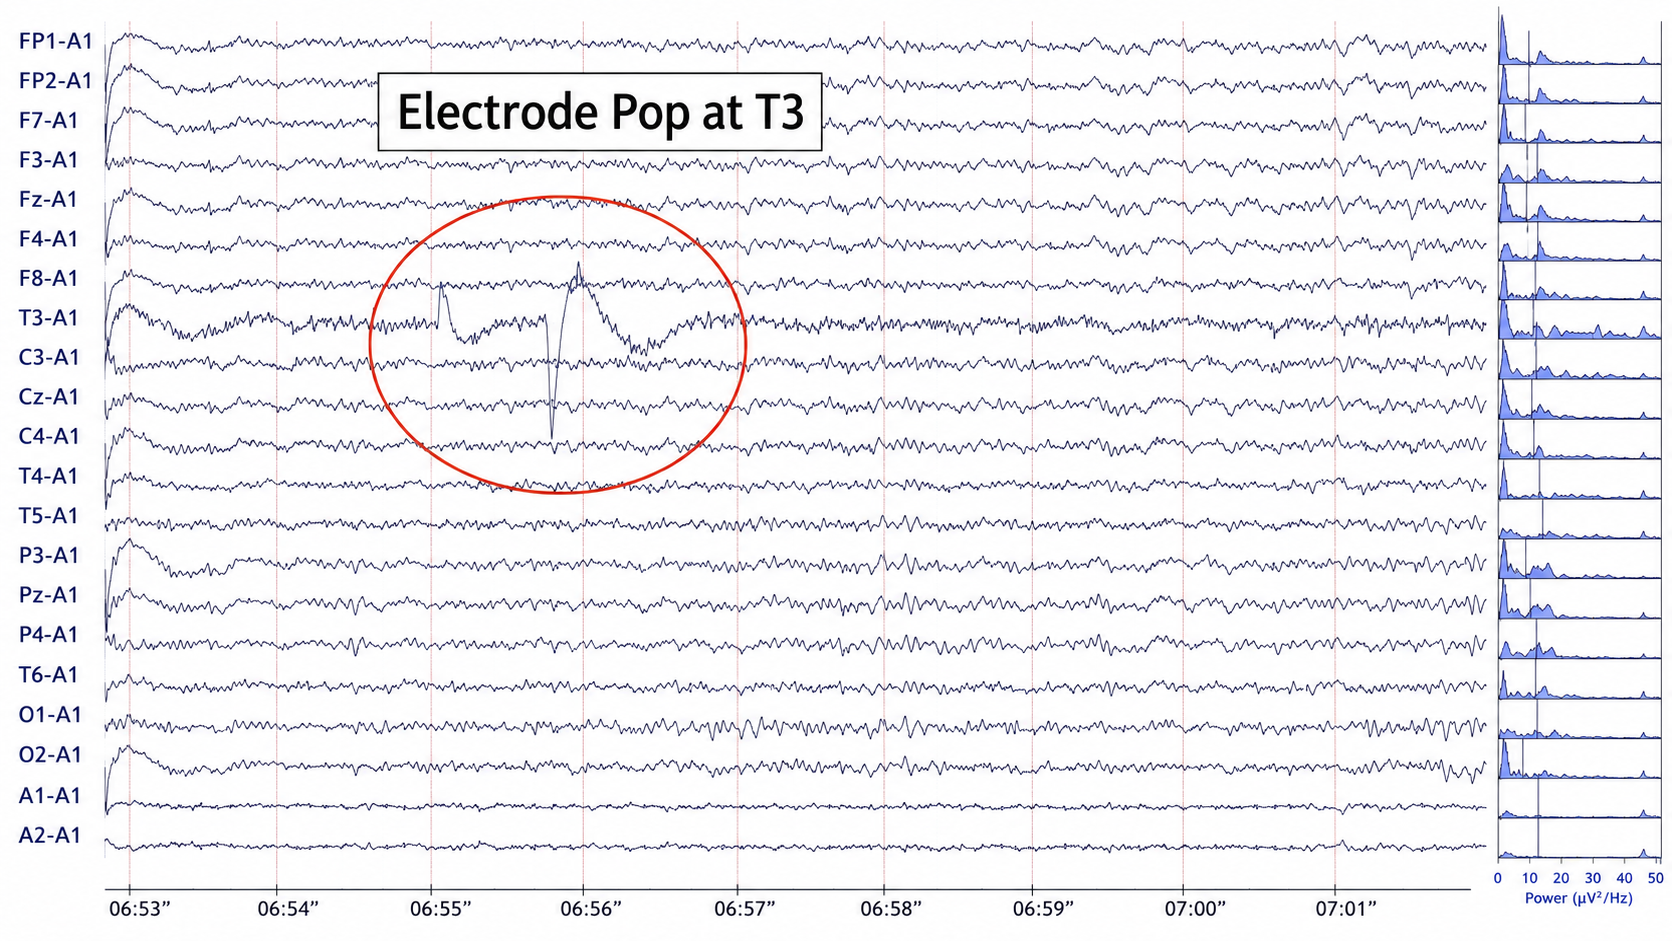
Graphic © John S. Anderson. This EEG segment shows an electrode-pop artifact localized to the T3 electrode, displayed in a referential montage with most channels referenced to A1. The circled event occurs around 06:55 to 06:56 and is most conspicuous in the T3-A1 channel, where there is an abrupt, high-amplitude, sharply contoured voltage excursion followed by slower baseline recovery. Historically, this type of artifact has been recognized as a common technical pitfall in EEG because sudden changes at the electrode–scalp interface can create waveforms that look strikingly sharp or paroxysmal, yet are not generated by cerebral cortex.
The morphology is typical of an electrode pop. The waveform begins suddenly, has a steep vertical component, and is followed by a slower, irregular return toward baseline. This combination of an abrupt transient and subsequent baseline drift suggests a sudden impedance change or intermittent loss and recovery of electrode contact. Common technical causes include drying conductive paste, a loose electrode, tugging on the lead wire, sweat or motion at the electrode site, or a brief mechanical shift at the scalp–electrode interface. Because the affected electrode is T3, the artifact appears most prominently in the T3-A1 derivation.
Exogenous artifacts come from the room and the equipment rather than the client. Movement and cable sway load the delta and theta bands. Mains interference appears at 50 or 60 Hz with predictable harmonics, and imbalanced impedances are what let it in. Radiofrequency sources project from display screens. Impedance and electrode pop artifacts both trace back to the electrode-skin junction, which is why low, balanced impedance is the single most effective preventive measure you control.
A clinic moves to a new suite and every subsequent record shows a 60-Hz ridge that was never there before. The temptation is to reach for a notch filter and move on. Resist it, because a notch filter hides the symptom, leaves the cause in place, and removes real gamma-range activity along with the noise.
Check impedance balance first, since an amplifier rejects common-mode interference only as well as its inputs are matched. Then look for the new variable in the room: a power strip behind the recording chair, a monitor at the client's shoulder, a phone charging near the cable bundle. In most cases you can drop mains interference below the noise floor without filtering anything.
Check Your Understanding
- Why do imbalanced electrode impedances increase an amplifier's vulnerability to 50/60 Hz artifact?
- State the acceptable impedance values for publishable research and for general clinical sessions, and explain why balance matters as well as magnitude.
- Distinguish an electrode pop artifact from a movement artifact in a raw tracing.
- Which frequency bands are most affected by movement artifact, and why?
- Name three preventive steps you would take before recording to reduce exogenous artifact.
Cutting-Edge Topics in qEEG Research
Automated Artifact Removal is Maturing, Not Replacing You
Jiang and colleagues (2019) reviewed the artifact removal literature and found that no single method handles every artifact class well. Regression works for ocular artifact when a reference channel is available, blind source separation methods such as independent component analysis handle mixed contamination, and wavelet approaches suit transients. Their practical conclusion is that hybrid pipelines outperform any single technique, and that every automated method still needs a human who can recognize what it removed.
Adaptive Filtering in Cascade
Garces and colleagues (2007) demonstrated that cascaded adaptive filters can strip ocular and cardiac contamination from the EEG while preserving the underlying cerebral signal. The appeal for clinical work is that adaptive filters adjust their coefficients as the contamination changes, rather than applying one fixed correction to a whole record. The constraint is that they need a clean reference for the artifact being removed, which is a good argument for recording a dedicated ECG or EOG channel alongside your montage.
Why Prevention Still Beats Correction
Every removal method, however sophisticated, is an estimate of what the signal would have looked like without the artifact. Peper and colleagues (2008) argued for teaching clients to produce artifacts deliberately so they learn to suppress them, and that logic has aged well. A record acquired with low, balanced impedances from an alert, comfortable client requires less correction, and less correction means fewer assumptions standing between the raw voltage and the report you sign.
Assignment
Now that you have completed this module, explain why low and balanced skin-electrode impedances are important in neurofeedback training. Describe the precautions you take to achieve acceptable impedance values. How do you measure impedance with your neurofeedback system?
Glossary
50/60 Hz: electrical line noise that contaminates the EEG at the local mains frequency, 60 Hz in North America and 50 Hz in most other regions.
Bell's phenomenon: the upward and outward rotation of the eye during lid closure, which carries the positive cornea toward the frontopolar electrodes and produces a large frontal deflection.
bridging artifact: electrical coupling between adjacent electrodes caused by conductive gel, sweat, or moisture, reducing their independence and distorting recorded voltage differences.
cable sway: voltage fluctuations produced when EEG leads move through the electromagnetic field of the recording environment.
cardiac artifact: ECG or pulse-related activity that appears in an EEG channel through electrical or mechanical coupling. It should not be interpreted as cerebral activity or as a cardiac diagnosis.
dipole: an electrical source with separated regions of positive and negative charge; for example, the eye is electropositive at the front and electronegative at the back.
drowsiness artifact: the intrusion of drowsiness or light sleep into a recording intended to sample wakefulness, marked by attenuation of the posterior dominant rhythm, slow rolling eye movements of opposite polarity at F7 and F8, and 1-2 Hz alpha slowing.
EEG artifacts: noncerebral electrical activity in an EEG recording, which can be divided into physiological and exogenous artifacts.
electro-ocular artifact: contamination of EEG recordings by potentials generated by eye blinks, eye flutter, and eye movements.
electrode-pop artifact: an abrupt high-amplitude transient caused by a sudden change in electrode-skin contact potential or impedance.
EMG artifact (ECG): false or obscured ECG events caused by skeletal-muscle electrical activity, potentially producing spurious or missed beat detections.
evoked potential artifact (event-related potential artifact): somatosensory, auditory, and visual signal processing-related transients that may contaminate multiple channels of an EEG record.
exogenous artifact: signal contamination originating outside the organism, such as electromagnetic interference, vibration, or recording-equipment noise.
field artifacts: external artifacts transmitted by nearby electrical sources.
high-frequency filter: a legacy electrophysiology term for a low-pass filter that attenuates frequencies above its cutoff.
impedance artifacts: distortion or disruption of the EEG signal caused by high or imbalanced impedance between the scalp electrodes and the skin, affecting the accuracy of the recorded brain activity.
movement artifact: signal distortion caused by movement of the person, sensor, electrode, cable, or tissue interface; its appearance and effects depend on recording modality.
notch filter: a band-stop filter that strongly attenuates a narrow frequency range, commonly centered on 50 or 60 Hz.
physiological artifact: contamination generated by biological activity other than the target signal, such as eye, muscle, cardiac, respiratory, or sweat activity.
polarization (electrophysiology): the separation or change of electrical charge across a cell membrane or electrode interface; hyperpolarization makes membrane potential more negative and depolarization makes it less negative.
pulse artifacts: noncerebral voltages due to the mechanical movement of an electrode in relation to the skin surface caused by the pressure wave of each heartbeat.
radiofrequency artifact: signal contamination produced when electromagnetic energy in the radiofrequency range, conventionally 3 kHz to 300 GHz, enters recording hardware or leads.
subharmonic: a frequency component at an integer fraction of a fundamental (e.g., 30 Hz from 60 Hz). Linear amplification does not generate subharmonics; apparent low-frequency residue after notch filtering is better explained by aliasing, intermodulation, or filter artifacts.
sweat artifact (EEG): slow, often irregular EEG baseline shifts produced by sweating and changes in electrode-skin potentials, commonly prominent frontotemporally.
Test Yourself on ClassMarker
Click the button below to take a 10-question exam over this entire unit. There is no password.
Review Flash Cards on Quizlet
Click the button below to review our chapter flash cards.
References
Demos, J. N. (2019). Getting started with neurofeedback (2nd ed.). W. W. Norton & Company.
Garces, A., Laciar, E., Patiño, H., & Valentinuzzi, M. (2007). Artifact removal from EEG signals using adaptive filters in cascade. Journal of Physics: Conference Series, 90(1), 012081. https://doi.org/10.1088/1742-6596/90/1/012081
International QEEG Certification Board. (n.d.). Guideline: Minimum technical requirements for performing quantitative EEG. EEG and Clinical Neuroscience Society. https://qeegcertificationboard.org
Jiang, X., Bian, G. B., & Tian, Z. (2019). Removal of artifacts from EEG signals: A review. Sensors, 19(5), 987. https://doi.org/10.3390/s19050987
Klass, D. W. (1995). The continuing challenge of artifacts in the EEG. American Journal of EEG Technology, 35(4), 239-269. https://doi.org/10.1080/00029238.1995.11080524
Peper, E., Gibney, K. H., Tylova, H., Harvey, R., & Combatalade, D. (2008). Biofeedback mastery: An experiential teaching and self-training manual. Association for Applied Psychophysiology and Biofeedback.
Sinha, S. R., Sullivan, L. R., Sabau, D., San-Juan, D., Dombrowski, K. E., Halford, J. J., Hani, A. J., Drislane, F. W., & Stecker, M. M. (2016). American Clinical Neurophysiology Society Guideline 1: Minimum technical requirements for performing clinical electroencephalography. Journal of Clinical Neurophysiology, 33(4), 303-307. https://doi.org/10.1097/WNP.0000000000000308
Thompson, M., & Thompson, L. (2003). The neurofeedback book: An introduction to basic concepts in applied psychophysiology. Association for Applied Psychophysiology and Biofeedback.
Thompson, M., & Thompson, L. (2015). The biofeedback book: An introduction to basic concepts in applied psychophysiology (2nd ed.). Association for Applied Psychophysiology and Biofeedback.