
Electrodes and Acquisition Systems
What You Will Learn in This Chapter
Everything downstream depends on what happens at the scalp. A polarized electrode, a mismatched pair, a cap one size too large, or a sampling rate set too low will corrupt every map, every z-score, and every training decision that follows, and no amount of processing will recover what the front end threw away.
This chapter follows the signal from the cortex to the screen. You will see how postsynaptic potentials volume-conduct through tissue to the electrode, how the electrode converts a current of ions into a current of electrons, and what goes wrong when polarization or bias potentials interrupt that exchange. You will compare electrode materials and wet and dry cap designs, and learn what the active, reference, and ground electrodes each contribute to a three-lead recording.
The chapter then moves from theory to your hands. You will measure a head the way the International 10-20 system requires, locating the nasion, inion, and preauricular points and working outward in fixed percentages to find Cz and every site that follows. You will decide when three separate electrodes serve your goal and when a full cap does, prepare a site and seat a paste-filled cup electrode without creating a salt bridge, fit and align a wet or dry cap, and judge impedance and signal quality before you record. You will also learn to prevent, recognize, and remove the artifacts that contaminate raw EEG, along with the infection-control practices that current guidance actually recommends.
You will then work through the rest of the acquisition chain: differential amplification, common-mode rejection, input impedance, and analog-to-digital conversion. The chapter ends with the three properties every EEG signal has, frequency, amplitude, and phase, and the four ways an integrator can calculate amplitude.
IQCB Blueprint Coverage: This unit addresses EEG Electrodes and Signal Acquisition (III. Technical), Electrode Placement and the International 10-20 System (III. Technical), Site Preparation, Impedance, and Artifact Management (III. Technical), Differential Amplification and Common-Mode Rejection (III. Technical), and Analog-to-Digital Conversion and Signal Properties (III. Technical).
Learning Objectives
After completing this section, you will be able to:
Explain how volume conduction carries postsynaptic potentials from cortical pyramidal neurons to scalp electrodes.
Describe how an electrode acts as a transducer, converting ionic current into electronic current.
Compare wet and dry electrode caps, and state what each design costs and buys in impedance, setup time, and artifact.
Identify polarization and bias potentials, explain what causes each, relate both to the half-cell potential, and describe how to prevent them.
Describe the roles of the active, reference, and ground electrodes in a three-lead recording, and distinguish monopolar (referential) from bipolar (sequential) montages.
List the equipment setup and operation competencies in BCIA's Neurofeedback Essential Skills List, from scalp measurement through troubleshooting and infection mitigation.
Locate the nasion, inion, preauricular points, and vertex, and explain how the International 10-20 system derives every site from percentages of the distances between them.
Interpret 10-20 electrode labels, including regional letters, odd and even numbering, and the z subscript, and translate between 10-20 and Modified Combinatorial Nomenclature labels.
Measure a head and mark the 10-20 sites step by step, confirming Cz from both the nasion-inion and preauricular measurements.
Decide when to record with three separate electrodes and when to fit a full cap, and distinguish channels from electrodes when specifying a montage.
Prepare a scalp site and seat a paste-filled cup electrode, apply dry electrodes, and explain how a salt bridge forms and how to prevent it.
Apply risk-based infection-control measures during site preparation, and explain why routine skin abrasion is no longer recommended.
Size, fit, and align a wet or dry electrode cap, and describe how a poor fit degrades every site.
Evaluate impedance against clinical and neurofeedback targets, explain why balance matters more than any single value, and verify a setup from the live trace.
Identify common EEG artifacts, apply strategies to reduce them, and state the minimum artifact-free data requirements for database comparison.
Explain how a differential amplifier boosts the difference between two inputs and rejects what they share.
Define common-mode rejection ratio, interpret the decibel figures manufacturers publish, and explain what limits the rejection a recording actually achieves.
Explain why differential input impedance must be at least 100 times skin-electrode impedance.
Apply the Nyquist-Shannon sampling theorem and predict when aliasing will occur.
Explain how bit depth determines resolution in an analog-to-digital converter.
Distinguish frequency, amplitude, and phase, and compare the four integrator methods for calculating amplitude.
Electrodes and Acquisition Systems
Listen to the Full-Length Lecture
Electrodes detect biological signals. They are also transducers since they convert energy from one form to another. Four types of EEG electrodes are shown below: gold cup, gold flat, silver cup, and silver/silver-chloride ring.
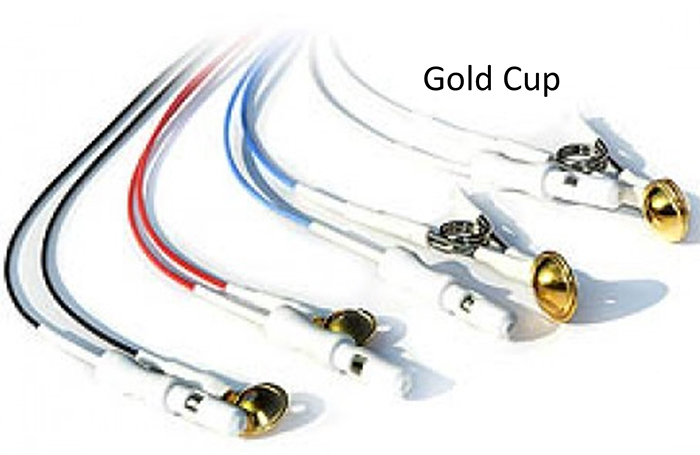
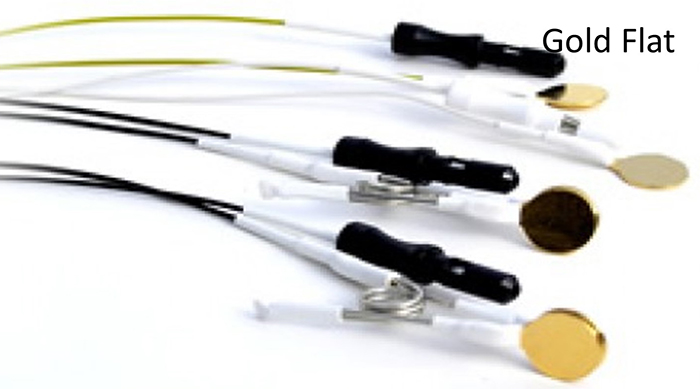
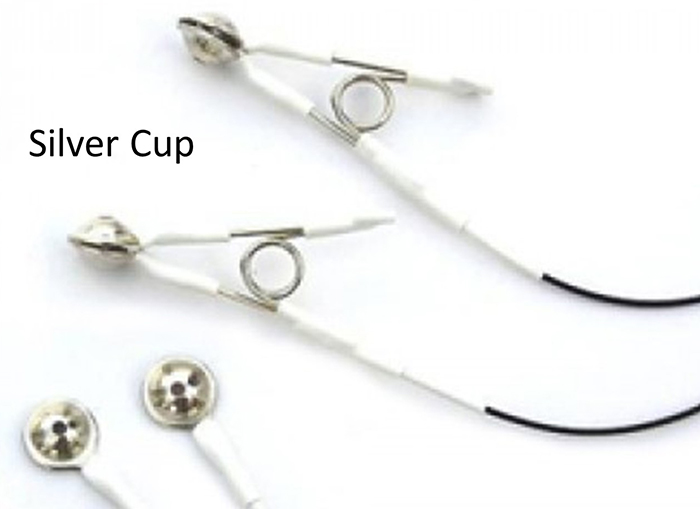
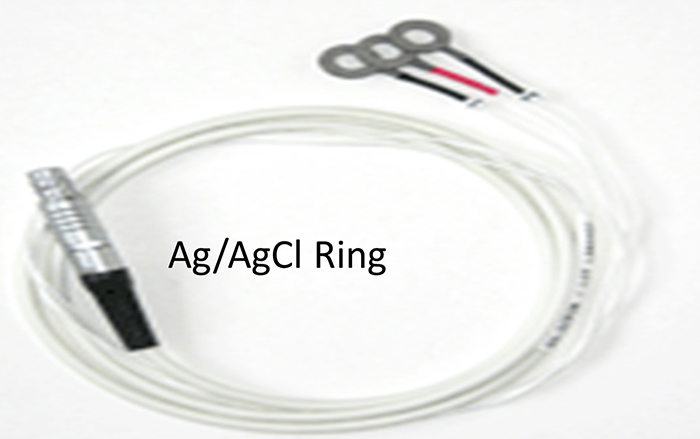
Common electrode materials for EEG recording include gold-plated, silver, silver/silver-chloride, and tin. Sintered silver/silver-chloride electrodes are used for recording slow cortical potentials. All electrodes in a single EEG recording must be made of the same material (e.g., all tin, all silver, all gold, all silver/silver-chloride, or all sintered silver/silver-chloride).
Sintered means the silver and silver-chloride particles are fused together under heat and pressure into a solid electrode material, rather than being plated or coated onto a base metal. This produces a more stable, lower-noise electrode surface, which is why sintered silver/silver-chloride is preferred for recording slow cortical potentials.
Electrode materials may be flat or formed into rings or cups, some of which have holes at the top. Electrodes are sometimes formed into disposable pellets, with or without a housing, onto which a cable can be snapped. When the earlobe is used as a reference or ground site, electrodes are mounted in a snap or spring-loaded clip.
Here are examples of tin and silver/silver-chloride electrodes. Tin cup electrodes and tin earclip electrodes are shown below.
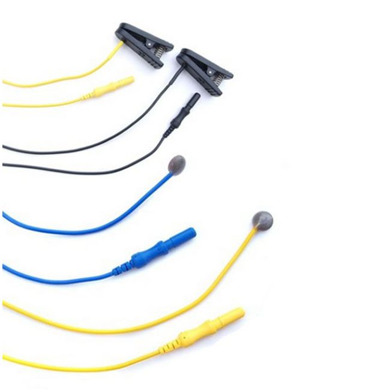
Bio-Medical Instruments provided this photograph.
Silver/silver-chloride electrodes are shown below.
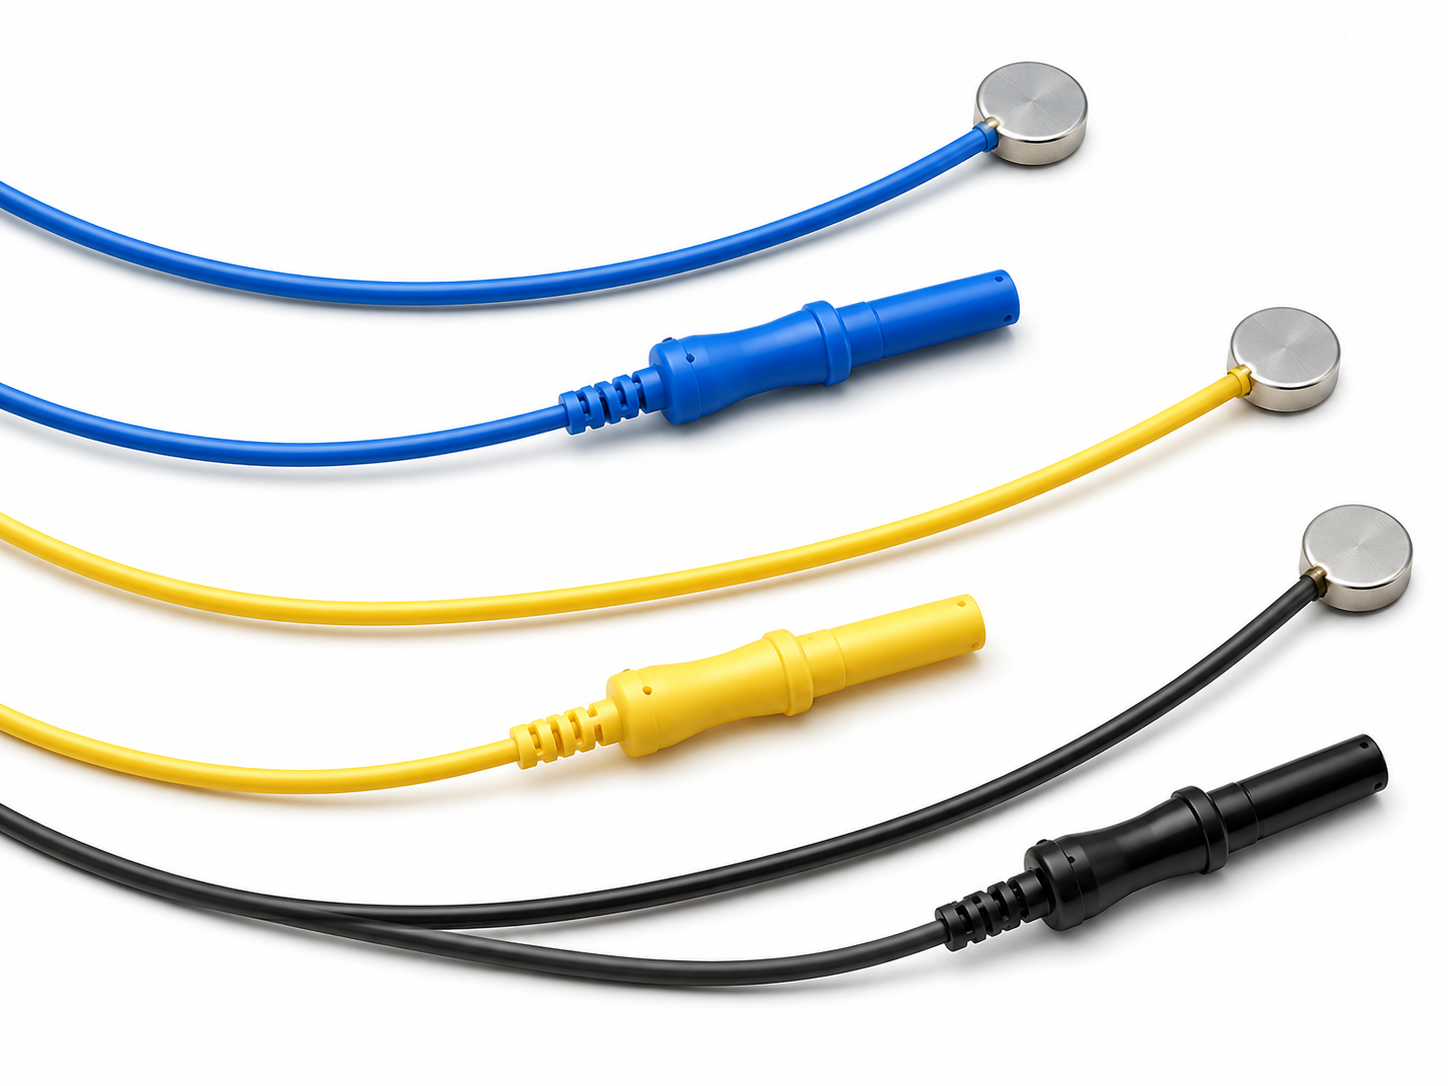
Bio-Medical Instruments provided this photograph.
Sintered silver/silver-chloride electrodes are shown below.
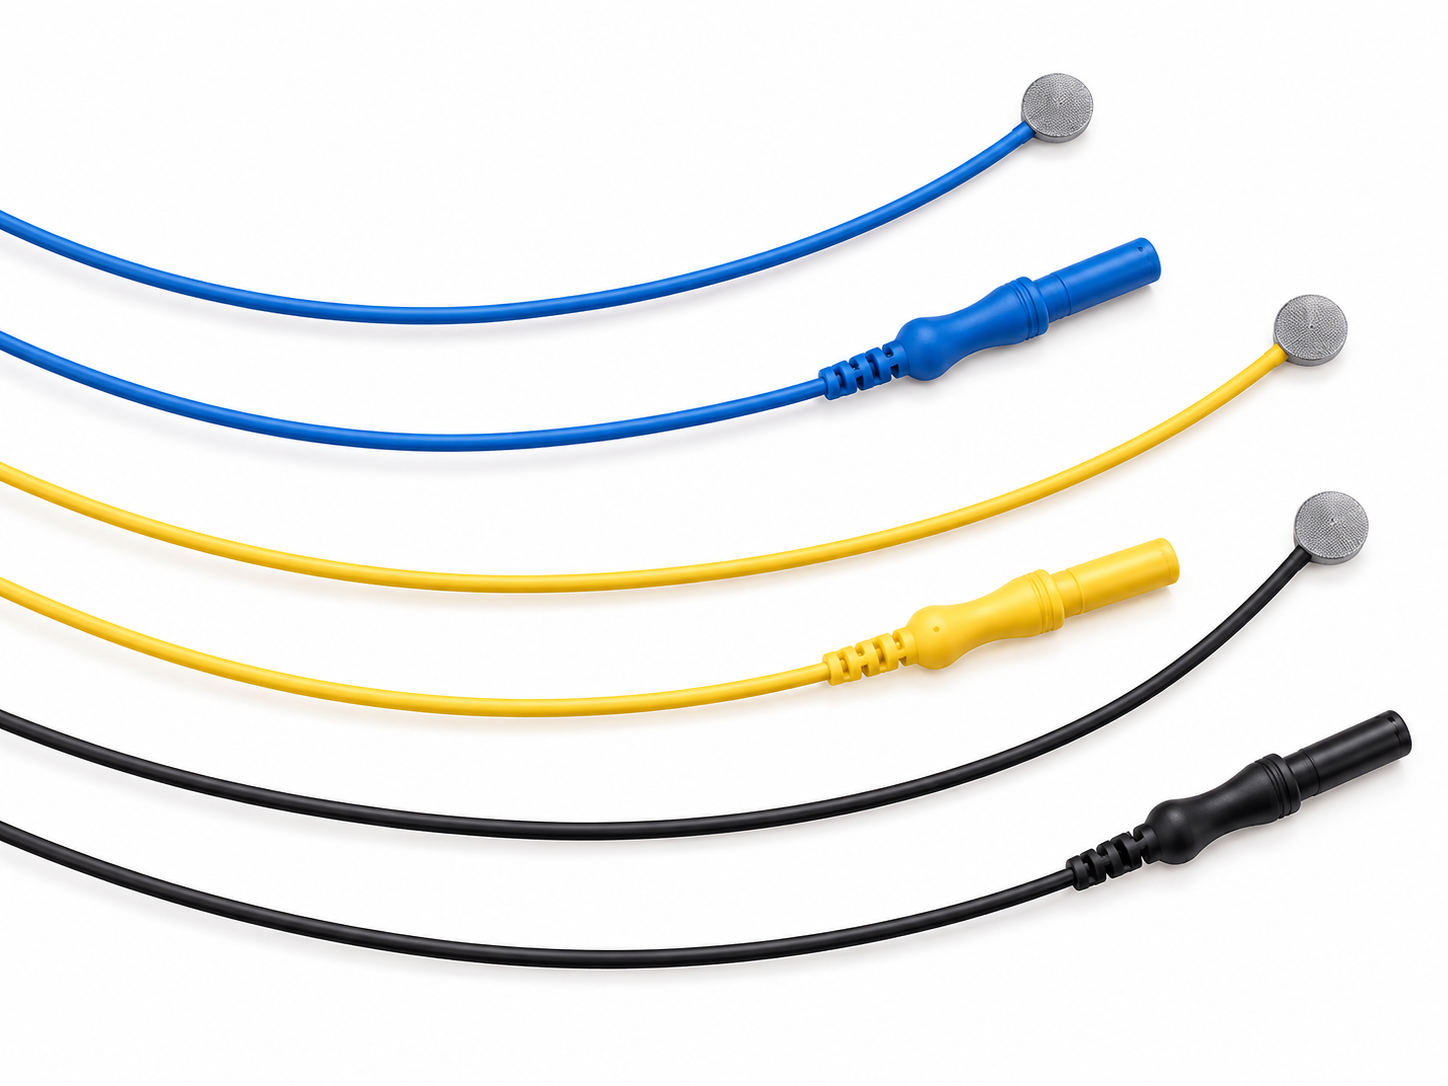
Bio-Medical Instruments provided these photographs.
Tin disposable pellet electrodes are shown below.
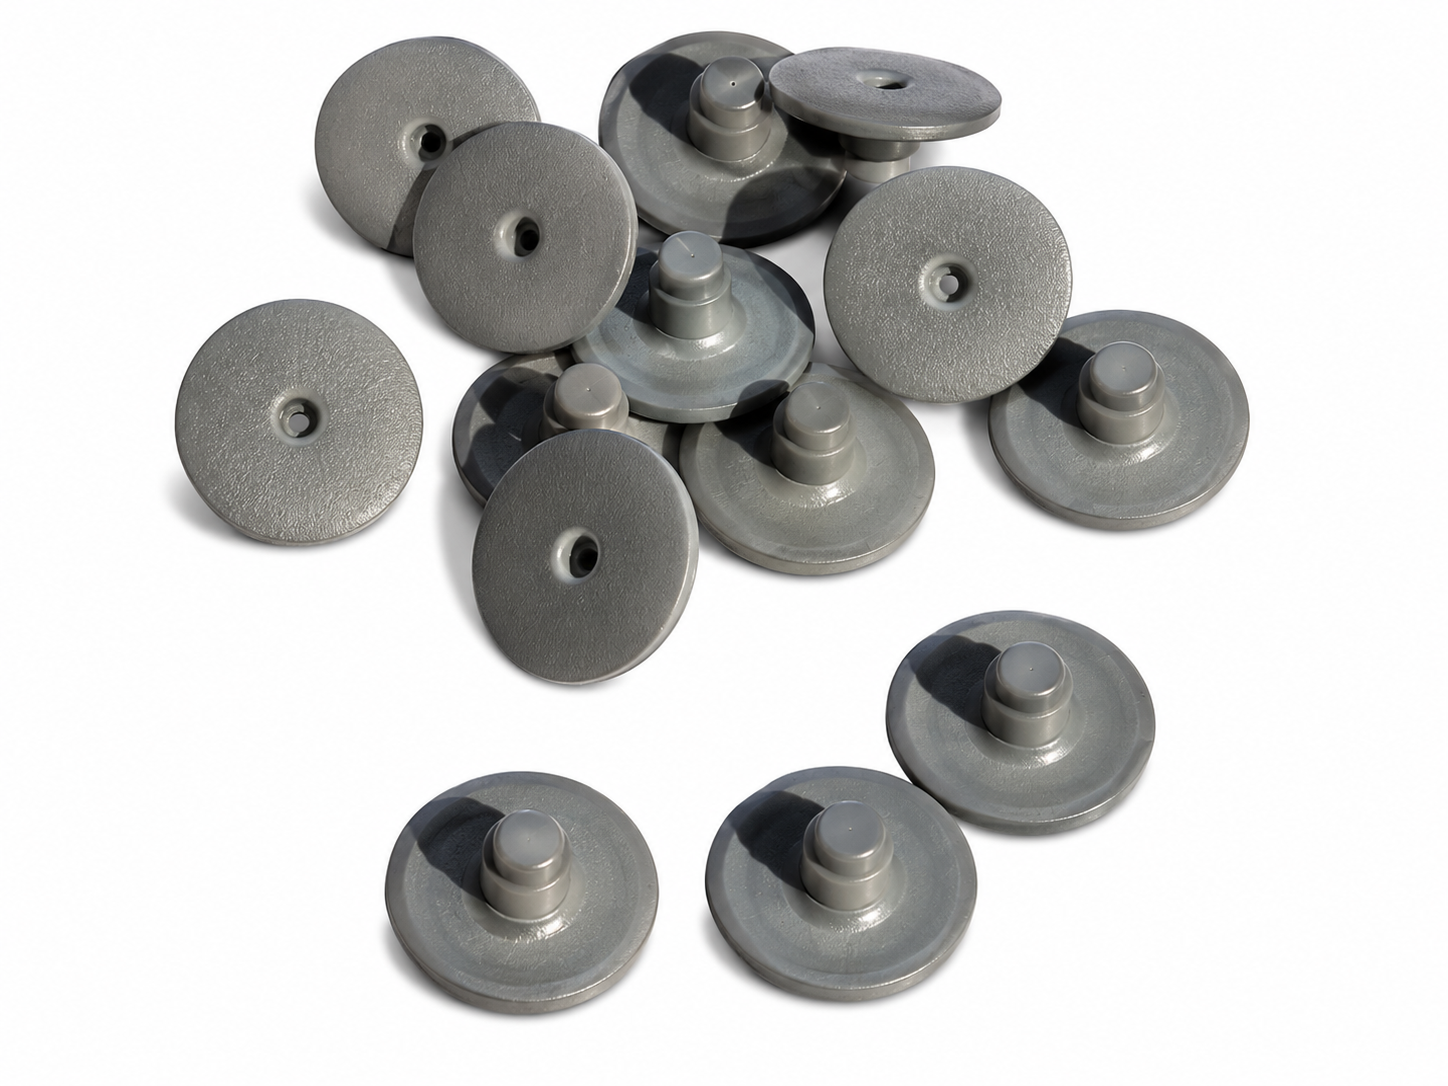
Bio-Medical Instruments provided this photograph.
Electrode Caps
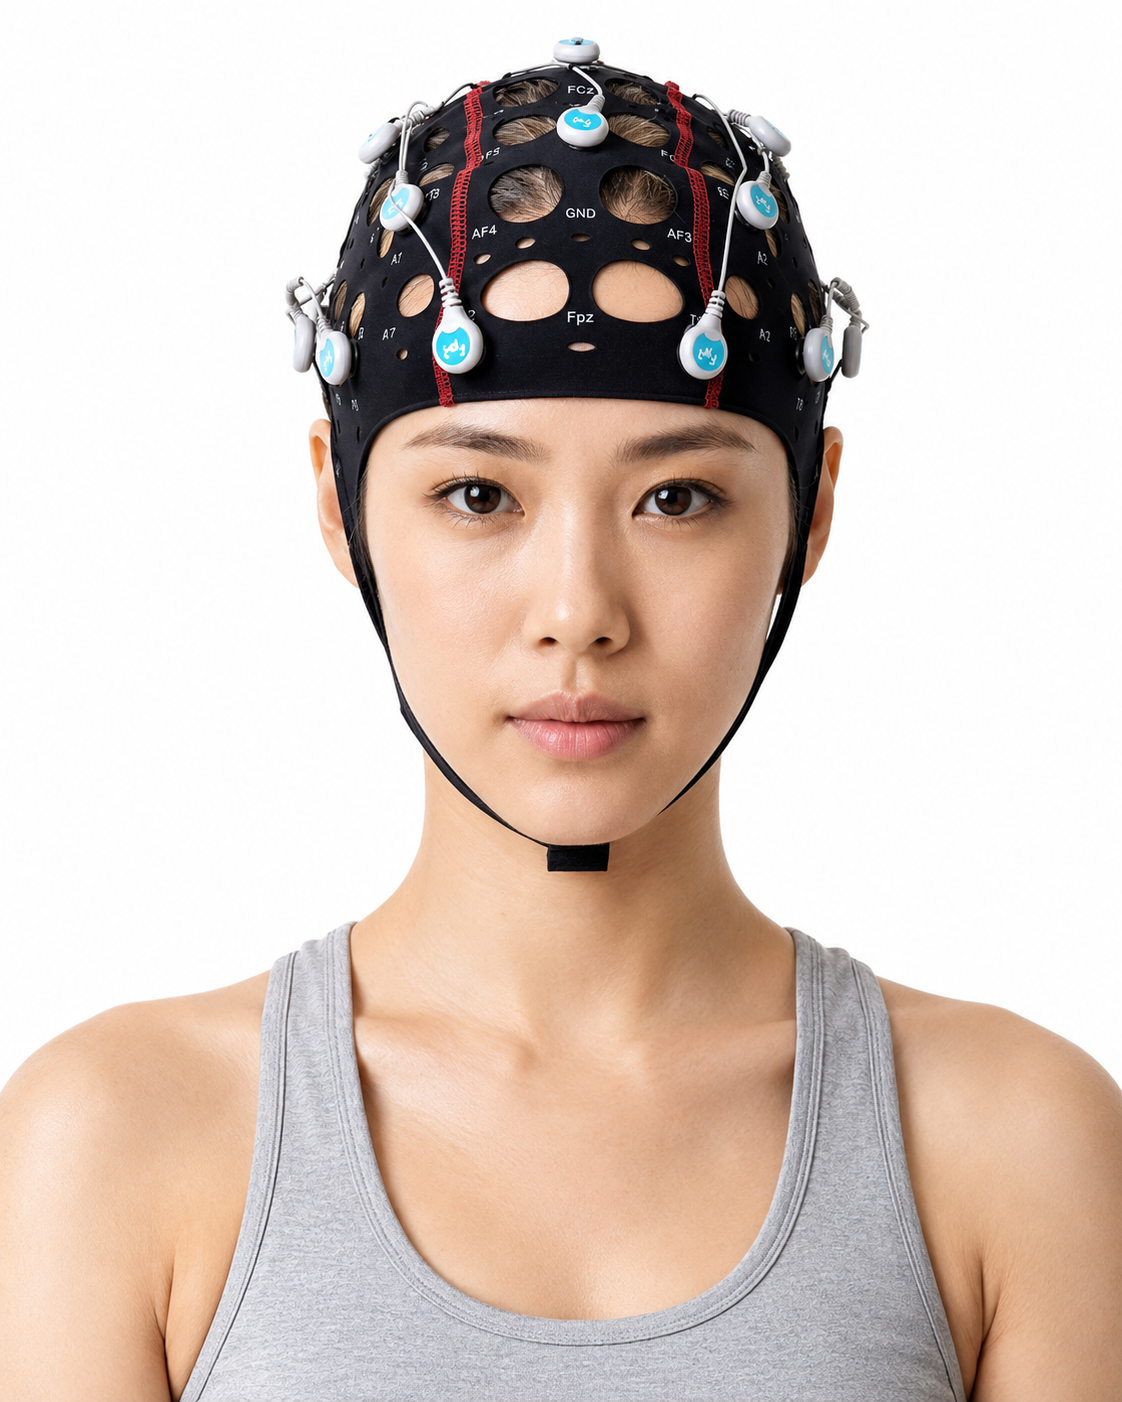
Rather than positioning individual electrodes one at a time, most multichannel recordings use an electrode cap. Caps come in two broad designs, wet and dry, and the choice between them shapes preparation time, client comfort, and signal quality.
Wet Cap Design
An electrode cap is a stretchable garment, usually made of an elastic spandex or Lycra fabric, that holds recording sensors at fixed scalp locations. Manufacturers position the electrode holders according to the international 10-20 system, so that once you fit the cap to your client's head, every sensor lands at a standardized site. In a wet cap, each holder seats a silver/silver chloride (Ag/AgCl) electrode or a tin electrode, and you fill the small well with a conductive gel or paste using a blunt-tipped syringe. That gel bridges the gap between the scalp and the metal, carrying the brain's ionic signals to the amplifier while you gently abrade the skin to lower resistance. Technicians typically aim for an impedance below 5 to 10 kΩ before recording begins (Bayat et al., 2025).
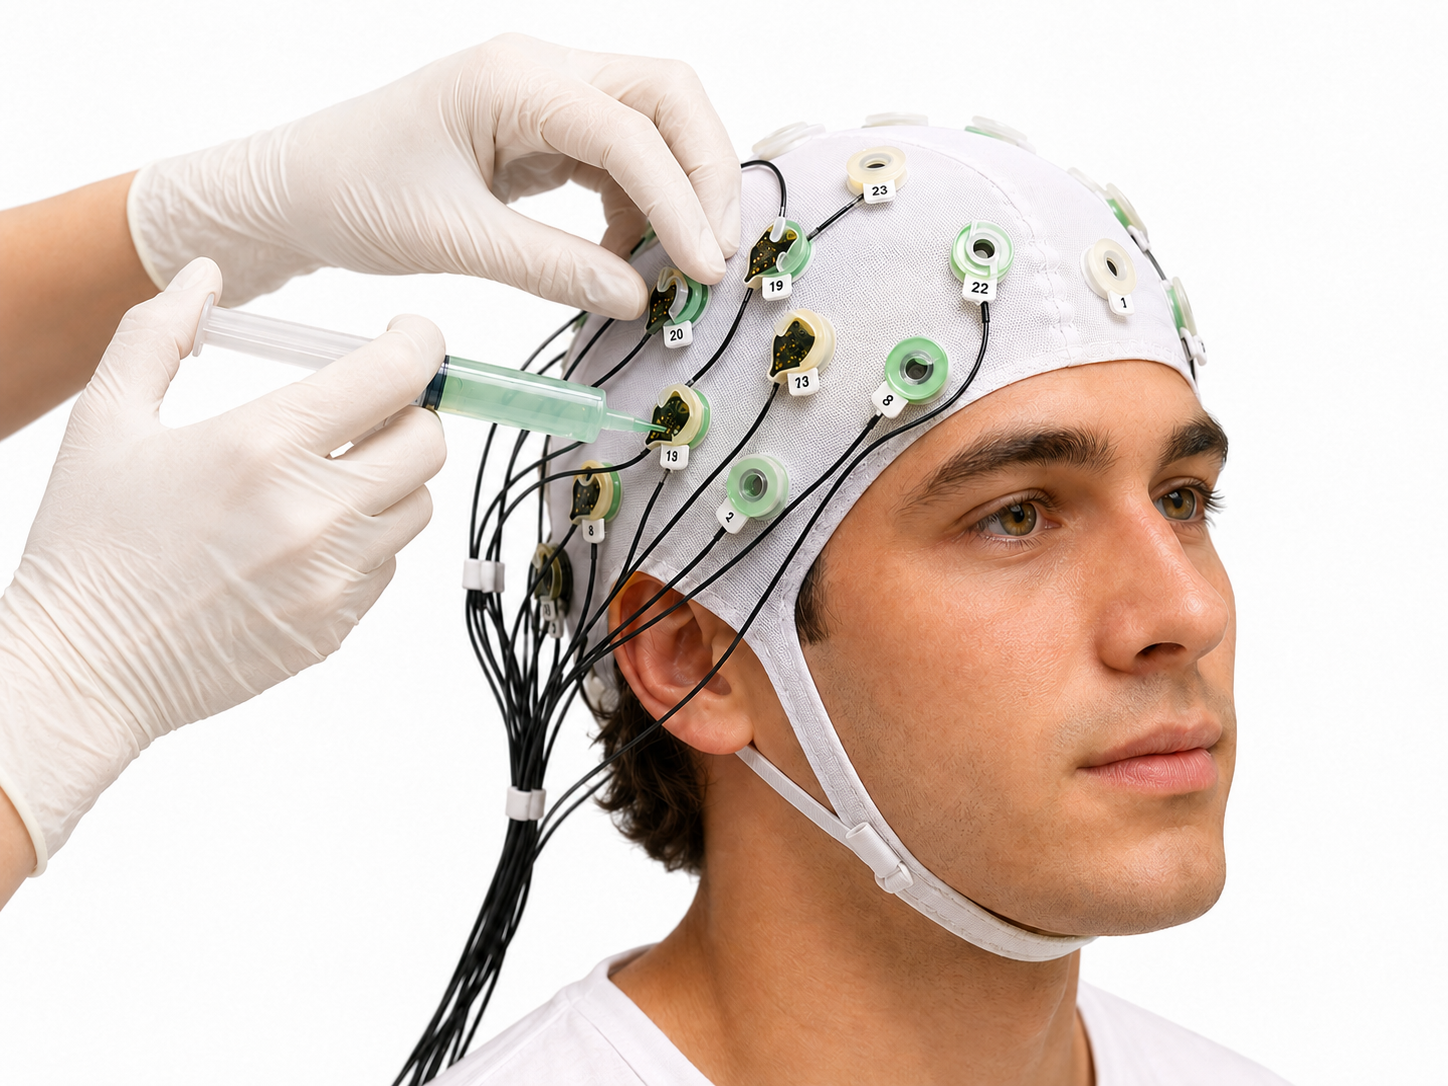
Advantages and Disadvantages of Wet Caps
Wet caps remain the gold standard for a good reason. The gel forms a stable electrochemical bridge that produces low, uniform impedance and an excellent signal-to-noise ratio, which is why clinical and research laboratories have trusted them for decades (Hinrichs et al., 2020). When Kam and colleagues (2019) compared a wet system against a dry alternative, the wet electrodes held a small advantage in single-trial classification, reflecting their cleaner signal. The gel also flows around hair and conforms to the scalp, so it reaches skin that rigid contacts struggle to touch. For long clinical montages where data fidelity is paramount, this reliability is hard to beat.
The costs of that fidelity show up in time and comfort. Preparing a full wet montage is slow and messy, requires a trained technician, and involves scrubbing each site, injecting gel, and rechecking impedance one electrode at a time (Kam et al., 2019). Your client leaves with gel in their hair and must wash it out, which discourages repeated or at-home sessions. Over long recordings the gel slowly dries, so impedance climbs and signal quality degrades after several hours unless someone refreshes each site (Hinrichs et al., 2020). Tight chin straps and the weight of a gelled cap can also become uncomfortable, which many clients find limiting during multi-hour sessions.
Dry Cap Systems
Dry caps were engineered to remove the gel from the equation. Instead of a gel-filled well, each site carries a dry electrode built as a cluster of fingers or pins, often coated with gold, silver, or Ag/AgCl, that push through hair to touch the scalp directly. Many designs are spring-loaded, so the pins retract and adjust as they slide past hair to reach skin (Kam et al., 2019).
Dry electrodes rely on the scalp's natural moisture to establish an adequate electrical connection. Some time may pass before scalp impedance falls to acceptable levels.
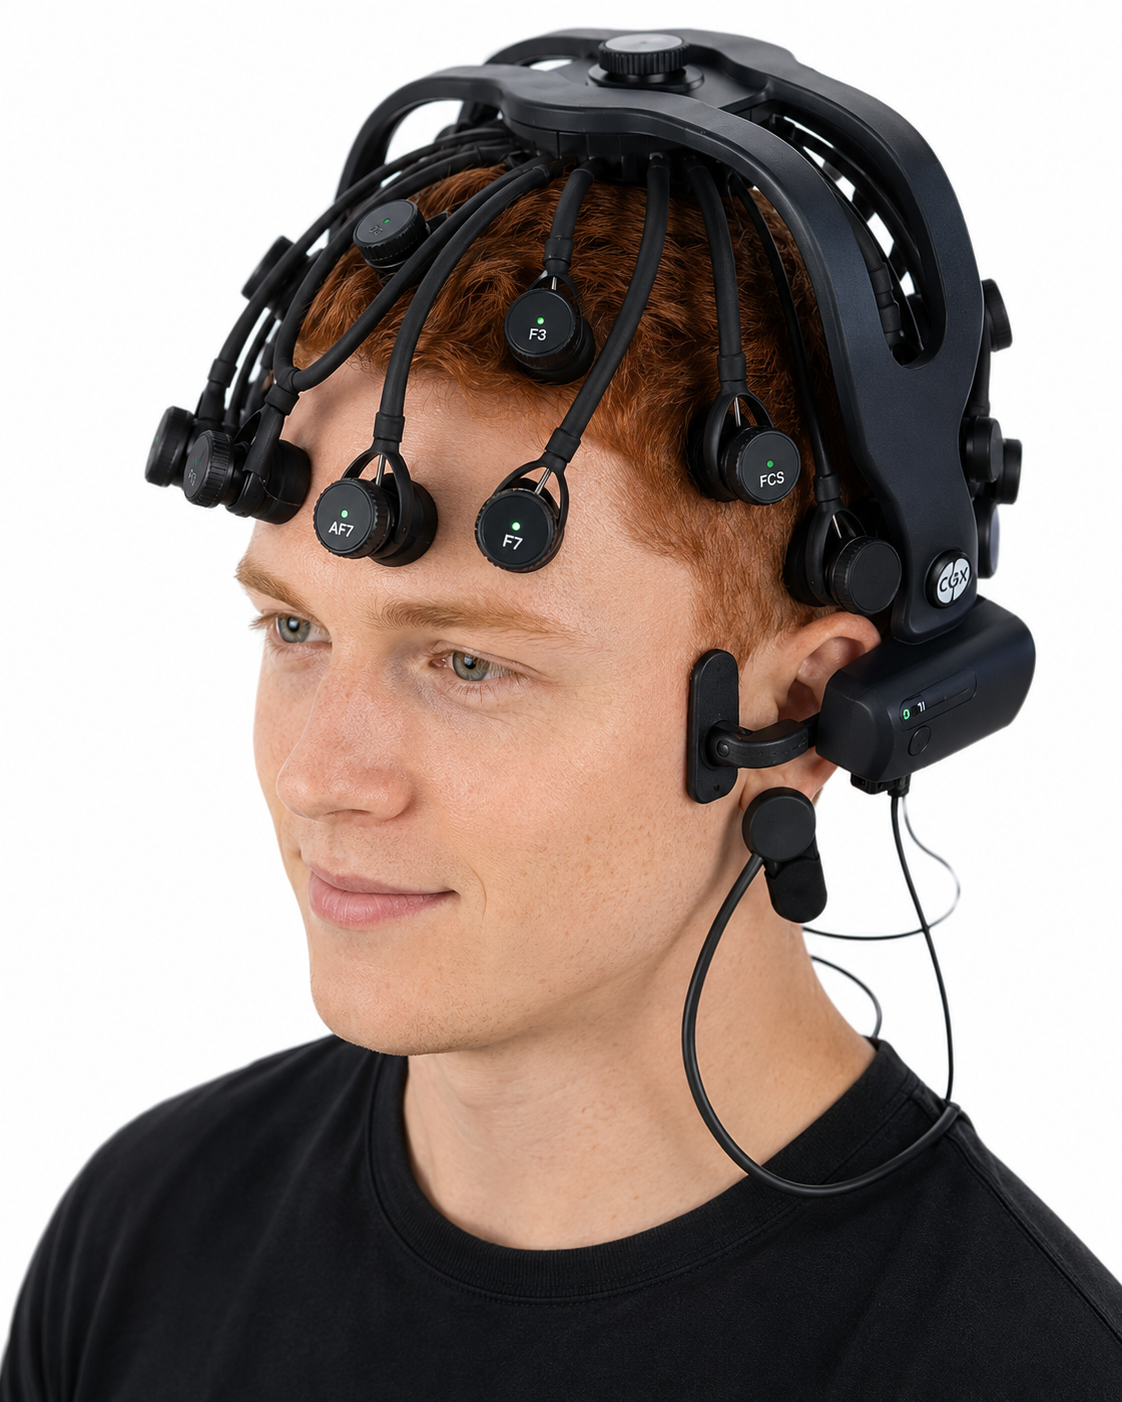
Some are passive electrodes that send the raw signal down a wire, while others are active electrodes with a tiny pre-amplifier at the site that buffers the high-impedance contact before noise can creep in (Di Flumeri et al., 2019). Because they need no gel, no abrasion, and no trained technician, dry caps set up in a fraction of the time and suit home monitoring, ambulatory recording, and real-world settings such as sports and military field use.
The tradeoff is a noisier interface. Without gel, dry contacts show higher and more variable impedance, which makes them more susceptible to motion artifact from head movement, cable sway, and shifting pins (Bayat et al., 2025). Sharp or firmly sprung pins can also press uncomfortably on the scalp during longer wear.
In addition, the scalp is richly supplied with superficial arteries—including branches of the supraorbital, superficial temporal, and occipital vessels—that run in the subcutaneous layer close to the skin surface. When the pins or fingers of a dry electrode press firmly over one of these vessels, the electrode can move slightly with each arterial pulsation and introduce pulse artifact at that site. Practitioners report this most often at frontal and temporal locations, though the risk follows an individual client's vascular anatomy rather than any fixed electrode label.
Even so, controlled comparisons are encouraging, because Kam and colleagues (2019) found that dry and wet systems produced comparable resting spectra and P3b responses, with metrics correlating strongly across the two (r = 0.54 to 0.89), and Hinrichs and colleagues (2020) reached similar conclusions in a clinical sample. The practical lesson for your practice is to match the tool to the task, reaching for a wet cap when you need maximum fidelity for a diagnostic or research montage, and a dry cap when speed, comfort, and mobility matter more than the last decibel of signal.
Imagine a veteran at a VA clinic who needs weekly neurofeedback but dreads the gel and the post-session hair wash. Switching this client to a dry cap can cut preparation to a few minutes and remove the cleanup that made him skip appointments, provided you watch impedance and motion artifact and accept slightly noisier data. For his baseline qEEG assessment, though, you would still choose a wet cap to secure the cleanest possible recording.
EEG electrode caps position sensors at 10-20 sites and come in wet and dry designs. Wet caps use gel-filled Ag/AgCl electrodes for low impedance and gold-standard signal quality, at the cost of slow, messy setup and gel that dries over time. Dry caps use coated pins that need no gel, enabling fast setup and mobile use, but with higher impedance and more motion artifact. Research shows the two produce comparable data for many applications, so the best choice depends on whether fidelity or convenience matters most for the session.
EEG Electrode Operation
Consider how EEG electrodes work in practice. In response to chemical and electrical synaptic messages, the dendrites of cortical pyramidal neurons develop excitatory postsynaptic potentials (EPSPs) and inhibitory postsynaptic potentials (IPSPs). These potentials travel a short distance, on the order of 1 to 2 centimeters, as a current of ions through the cortex, interstitial and cerebrospinal fluid, glial cells, meninges, skull, and scalp to electrodes on the surface—a process called volume conduction. The electrodes then transform this ionic current into an electronic current that flows through the cable into the electroencephalograph's input jack.
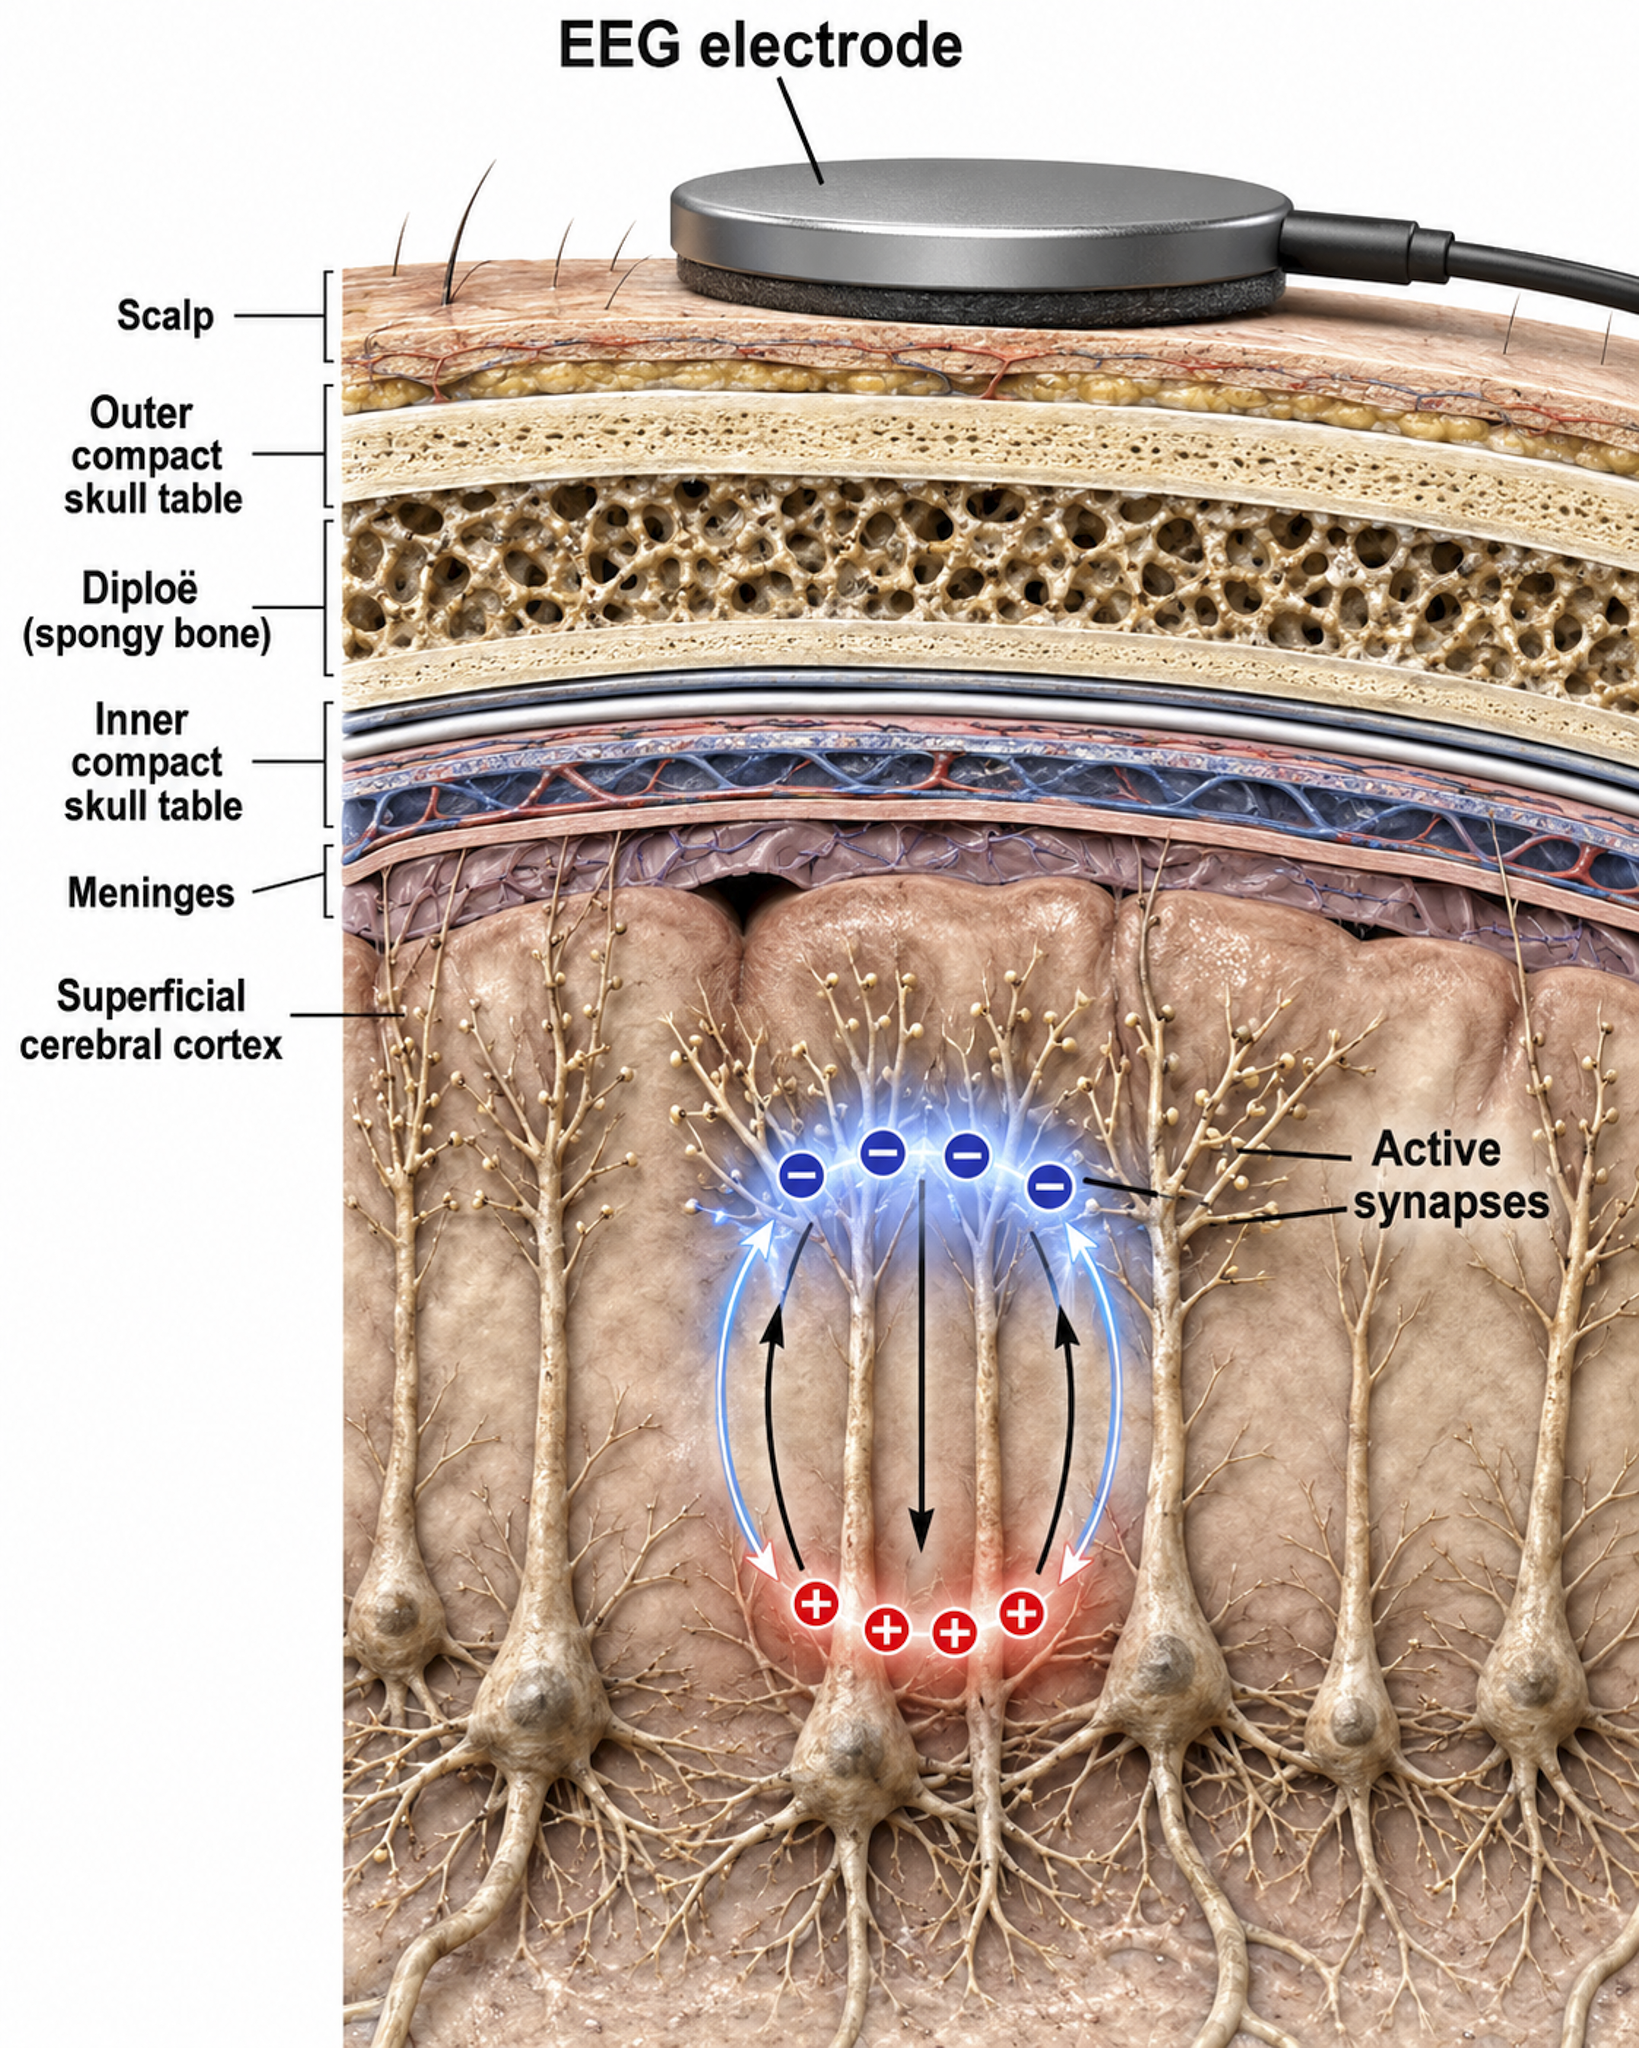
The EEG signal is substantially attenuated during volume conduction, which is why the signal that reaches scalp electrodes is measured in microvolts—millionths of a volt. When an EEG electrode is filled with conductive gel or paste, the electrode metal donates ions to the electrolyte while the electrolyte contributes ions to the metal surface. This creates a DC voltage between the electrode metal and the gel or paste, and signal conduction succeeds as long as electrode and electrolyte ions are freely exchanged.
Recording Problems
Two key problems can degrade electrode performance: polarization and bias potentials. Both stem from the half-cell potentials introduced earlier, which stay stable and cancel out only when the two electrodes are made of the same material and remain in good condition.
Polarization disturbs a half-cell potential over time, whereas a bias potential reflects a mismatch between two electrodes, and either one adds a false voltage to the recording. Understanding these issues helps clinicians choose the right electrode materials and recognize when electrodes need replacement.
Conduction breaks down during polarization, which occurs when chemical reactions produce separate regions of positive and negative charge at the junction between electrode and gel. DC flows across this connection, carrying positive ions to the more negative region and negative ions to the more positive region.
This ion buildup polarizes the electrode, favoring current flow in one direction and resisting it in the other—reducing ion exchange, increasing impedance, and weakening the signal. Electrode manufacturers control this problem by using silver/silver-chloride or gold electrodes that resist polarization.
Bias potentials are a second recording problem, resulting from the exchange of metal ions between electrodes and electrolytes in the absence of a biological current. These spurious voltages can be prevented by using electrodes with intact surfaces and identical materials—for example, all gold or all silver—so that no artificial voltage difference exists between recording sites.
Recording the EEG with Three Leads
When recording a single EEG channel (montage or derivation), three electrodes are used. Understanding the role of each electrode is essential for accurate recordings and effective troubleshooting.
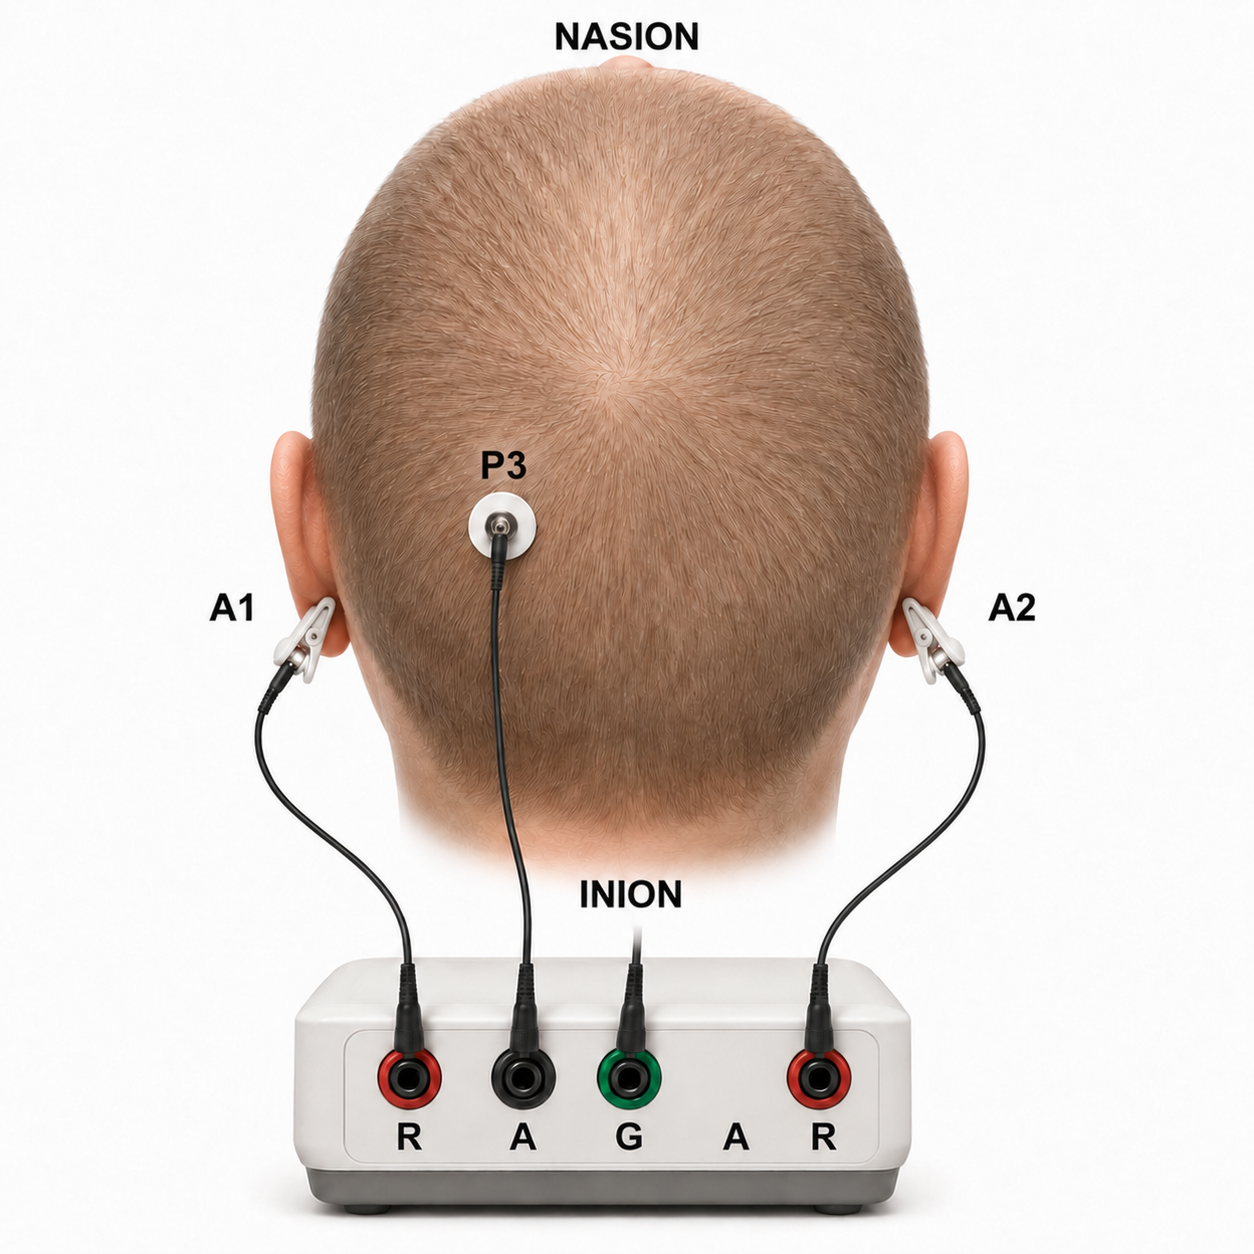
Scalp electrical activity is recorded using three electrodes: active, reference, and ground. In the so-called monopolar (referential) montage, the active electrode is placed over a scalp site that is a known EEG voltage source. The reference electrode is located at a neutral site (minimally active electrically) like the earlobe. The ground electrode can be placed anywhere, but is commonly placed on an earlobe or mastoid process (Demos, 2019).
Active and reference sensors are identical in construction and serve as balanced inputs—they are interchangeable. However, some technologies require that you designate a specific sensor as the reference, for example, in a linked-ears reference configuration.
In the so-called bipolar, or sequential, montage, two electrodes are placed on the scalp.
In both montage types, the recording measures the difference in electrical activity between two electrodes, excluding the ground electrode. The monopolar montage therefore provides a measure of the electrical activity beneath the active electrode, whereas the bipolar montage provides a measure that represents the difference between the two scalp electrodes.
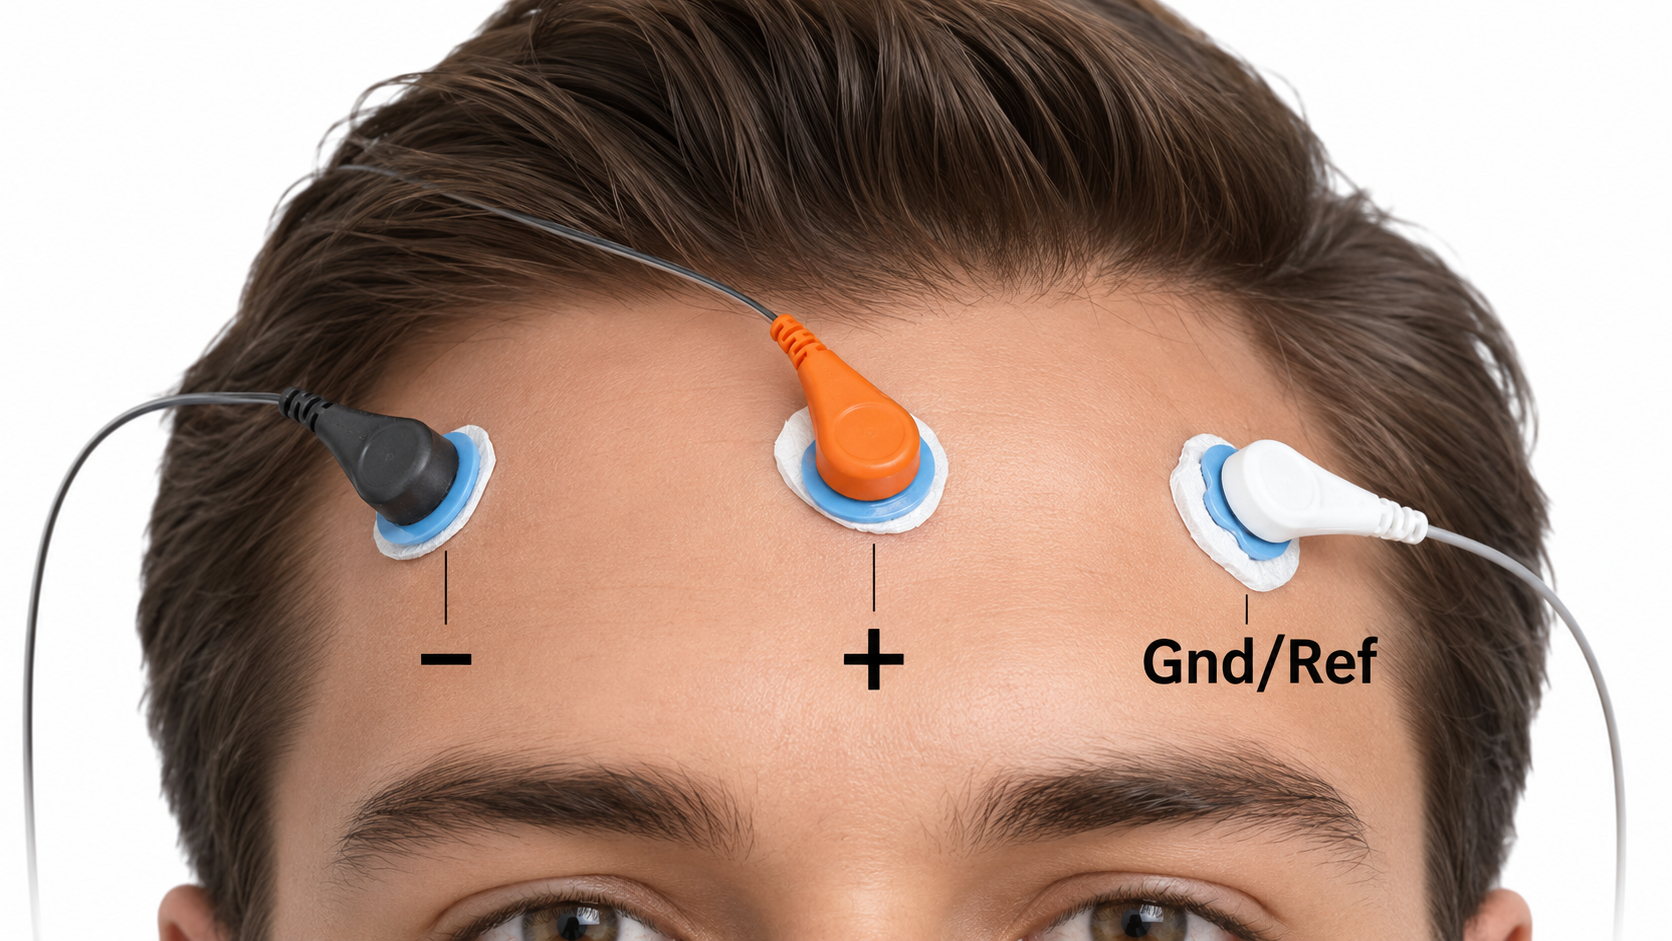
In the graphic below, which shows a bipolar montage, the active (+) is red, the reference (-) is black, and the ground electrode (Gnd/Ref) is white. The voltages of the active and reference inputs are measured relative to the ground.
The graphic below of a monopolar montage shows two earlobe references and an active electrode at P3. A ground electrode is not shown.
Basic Set-up and Operation of EEG Equipment
BCIA's Neurofeedback Essential Skills List identifies several competencies in EEG equipment setup and operation (Biofeedback Certification International Alliance, 2020). These include measuring the scalp and locating each International 10-20 system placement site; correctly preparing the scalp and ears and attaching electrodes to assessment sites or attaching an electrode cap for a full-cap qEEG; applying conductive gel to the sensor; making correct hardware connections to the computer; and making correct electrode connections to the EEG amplifier.
They also include performing all steps required for multi-channel or qEEG recording, such as checking impedance, performing a tracking test, detecting and removing artifact, and obtaining eyes-open and eyes-closed data; performing a continuity test to ensure electrode integrity; identifying and removing or controlling sources of common artifacts that contaminate the raw EEG signal; and troubleshooting common equipment failures following the manufacturer's recommendation.
Finally, they include demonstrating a basic understanding of multi-channel and qEEG assessment reports as well as components of qEEG databases (absolute power, relative power, phase, coherence, comodulation, and z-score comparisons); showing how to start the software, set NFT protocol parameters, and run basic feedback functions; demonstrating how to set initial training thresholds and adjust as needed; and describing how to mitigate the transmission of infection, including scalp measurement, skin preparation, electrode attachment, application of gel, and cleaning of cables, sensors, caps, and exposed surfaces.
Proper Electrode Attachment and Location of 10-20 Sites
Review of 10-20 Site Locations
The International 10-20 system is a standardized procedure for placing electrodes at reproducible sites across the scalp. The classic array locates 19 recording electrodes on the scalp plus two auricular reference electrodes, for 21 standard positions (Acharya et al., 2016), with a separate ground. A scalp-detectable signal requires at least about 6 cm2 of cortex to be synchronously active, so no electrode reports a neat patch of its own: because current spreads through brain, cerebrospinal fluid, skull, and scalp before it reaches the sensor, adjacent electrodes sample overlapping cortical territory. That spread, called volume conduction, is also why the site where a signal is largest can lie some distance from the tissue that generated it.
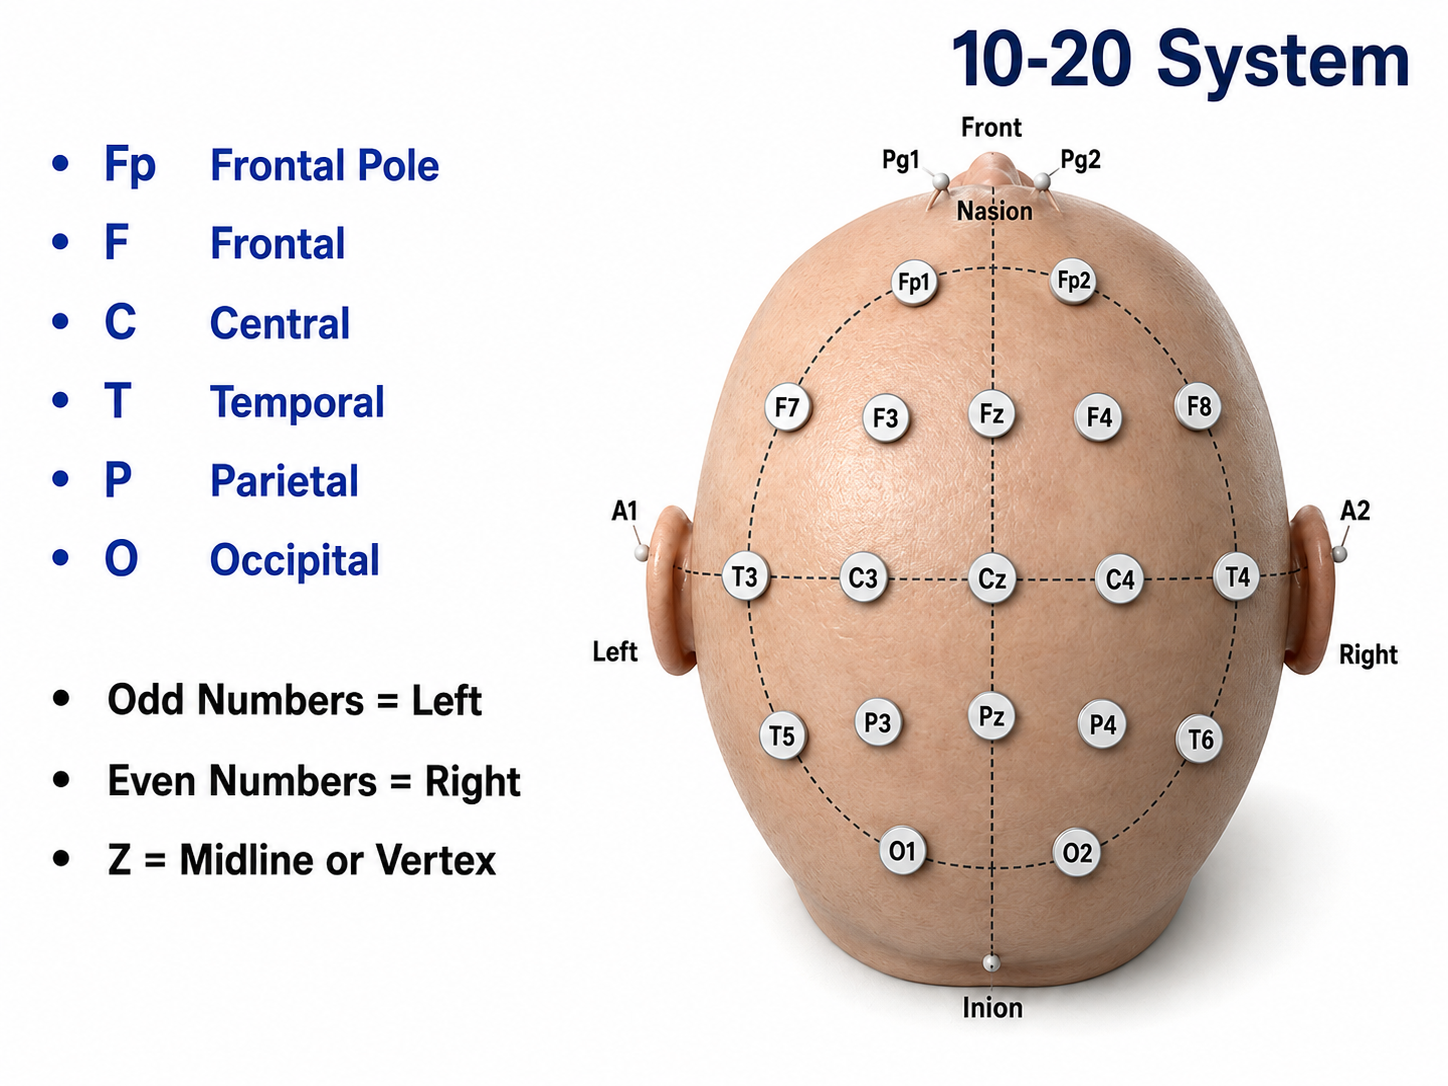
The International 10-20 system calculates the distance from the nasion to the inion and from the left preauricular notch to the right preauricular notch. The 19 active electrode positions are found taking either 10% or 20% of these distances. Check out the YouTube video The International 10-20 System. Four crucial landmarks are the nasion, inion, preauricular points, and vertex.
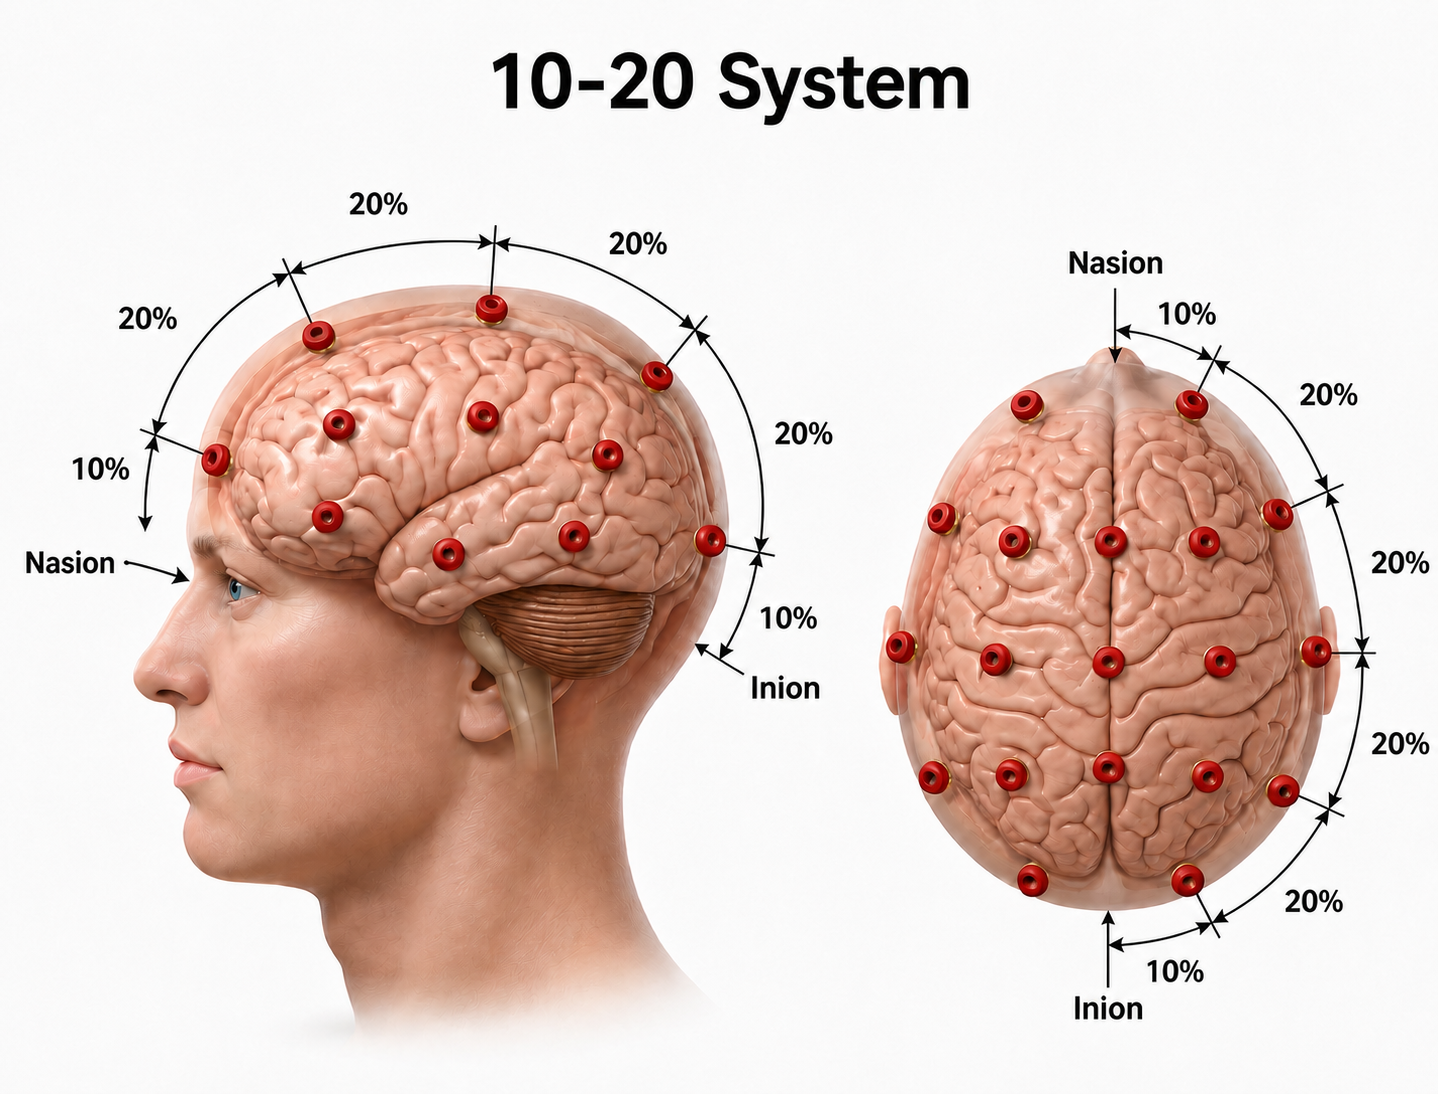
We adapted this graphic from © Alila Medical Media/Shutterstock.com.
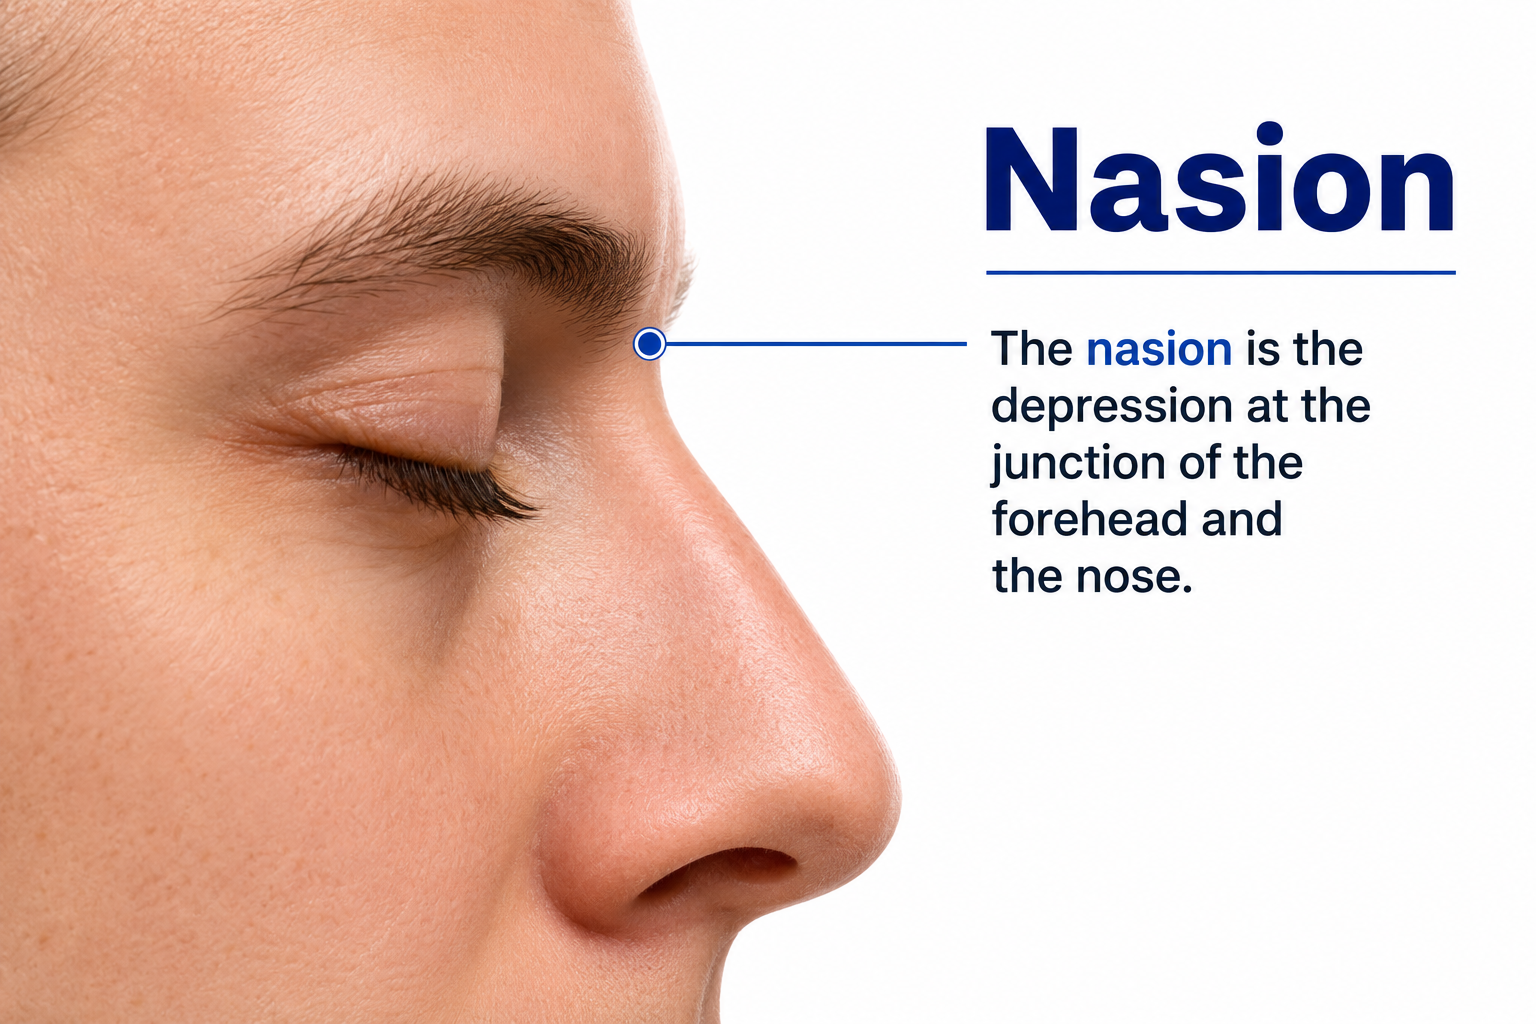
The nasion is the depression at the bridge of the nose.
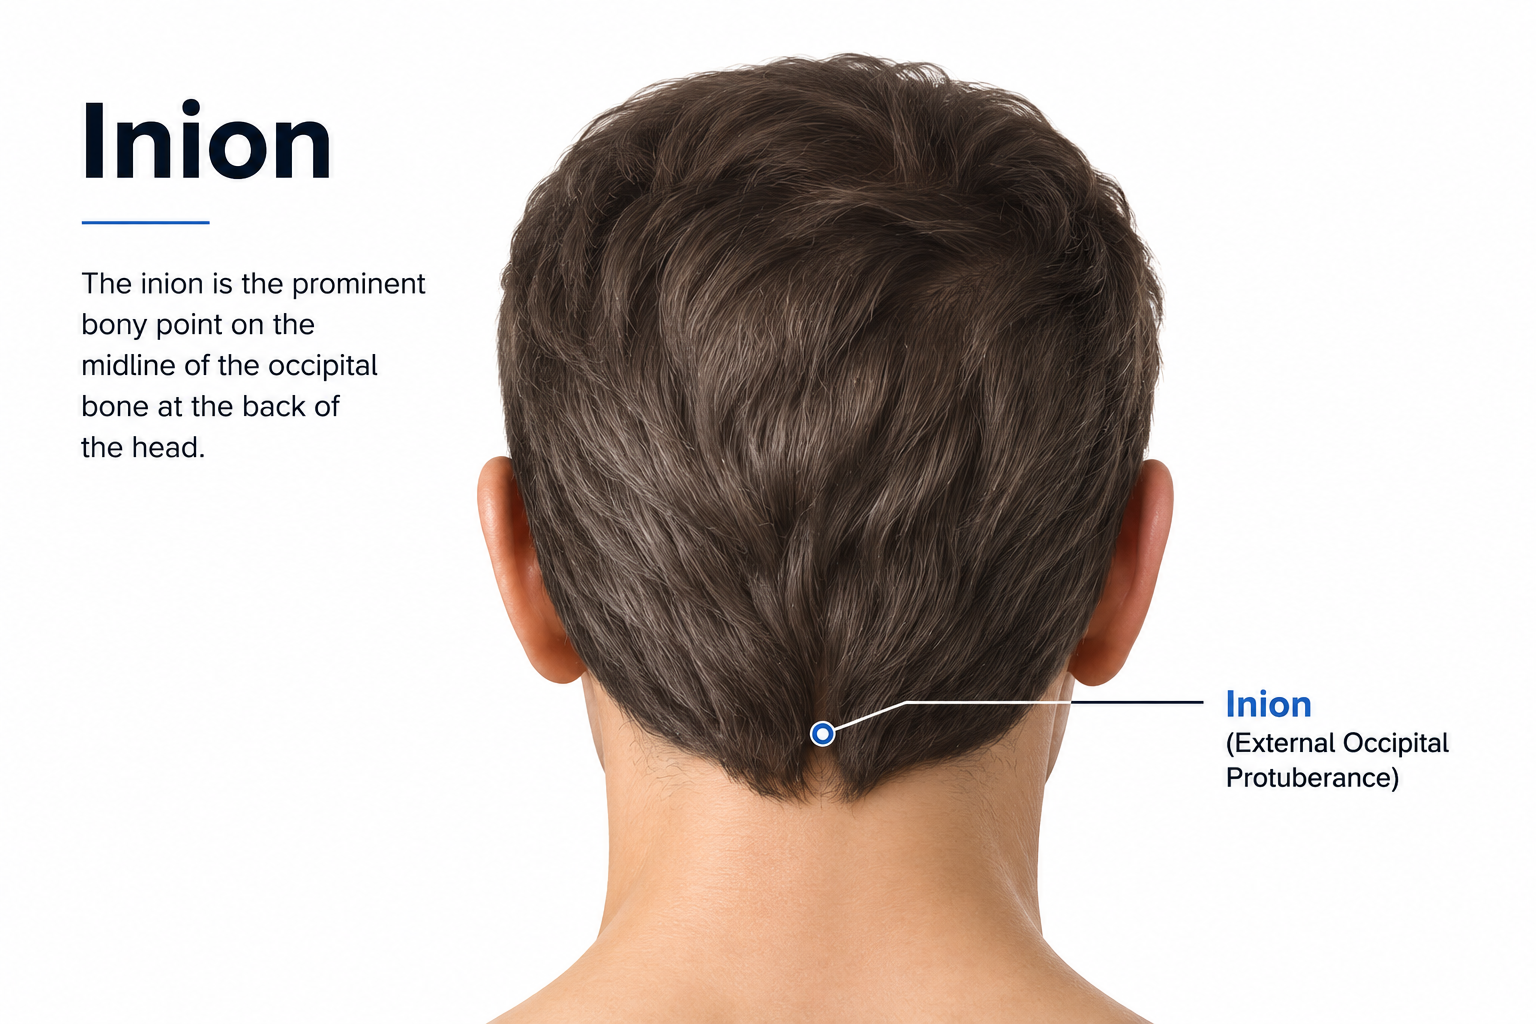
The inion is the external occipital protuberance, the bony prominence in the midline at the back of the skull along the occipital ridge.
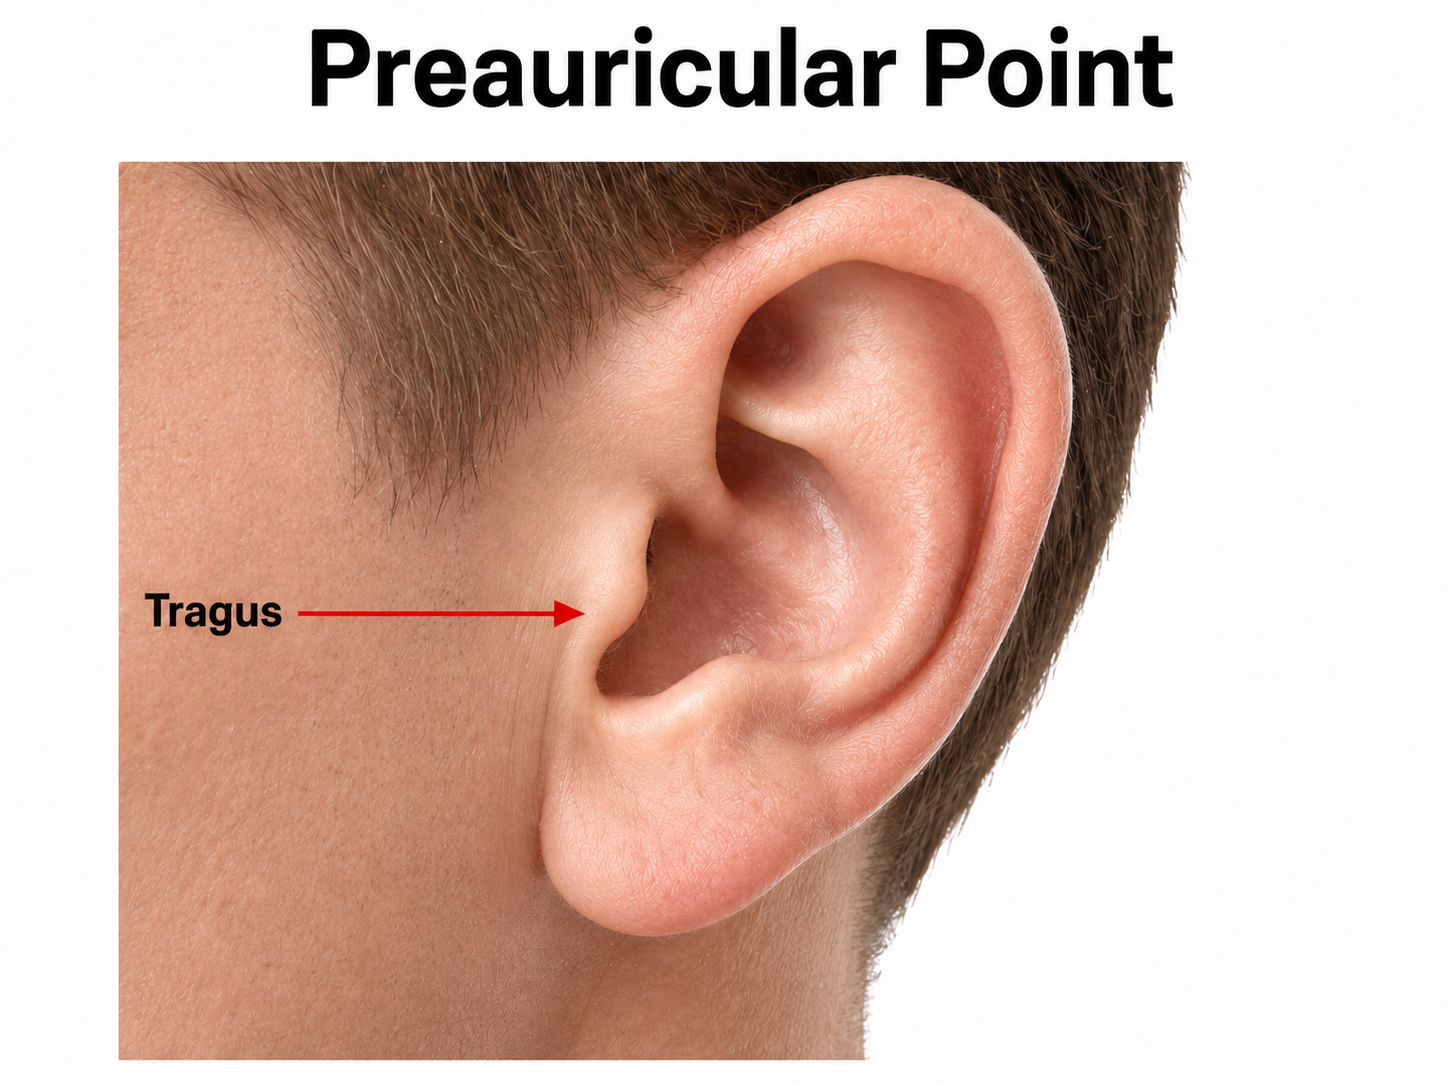
The left and right preauricular points are slight depressions located in front of the ears and above the earlobe. The flap at the opening of the ear is called the tragus.
The vertex (Cz) intersects imaginary lines drawn from the nasion to inion and between the two preauricular points. Cz is 50% of the total distance between the nasion and inion and 50% between the two preauricular points.
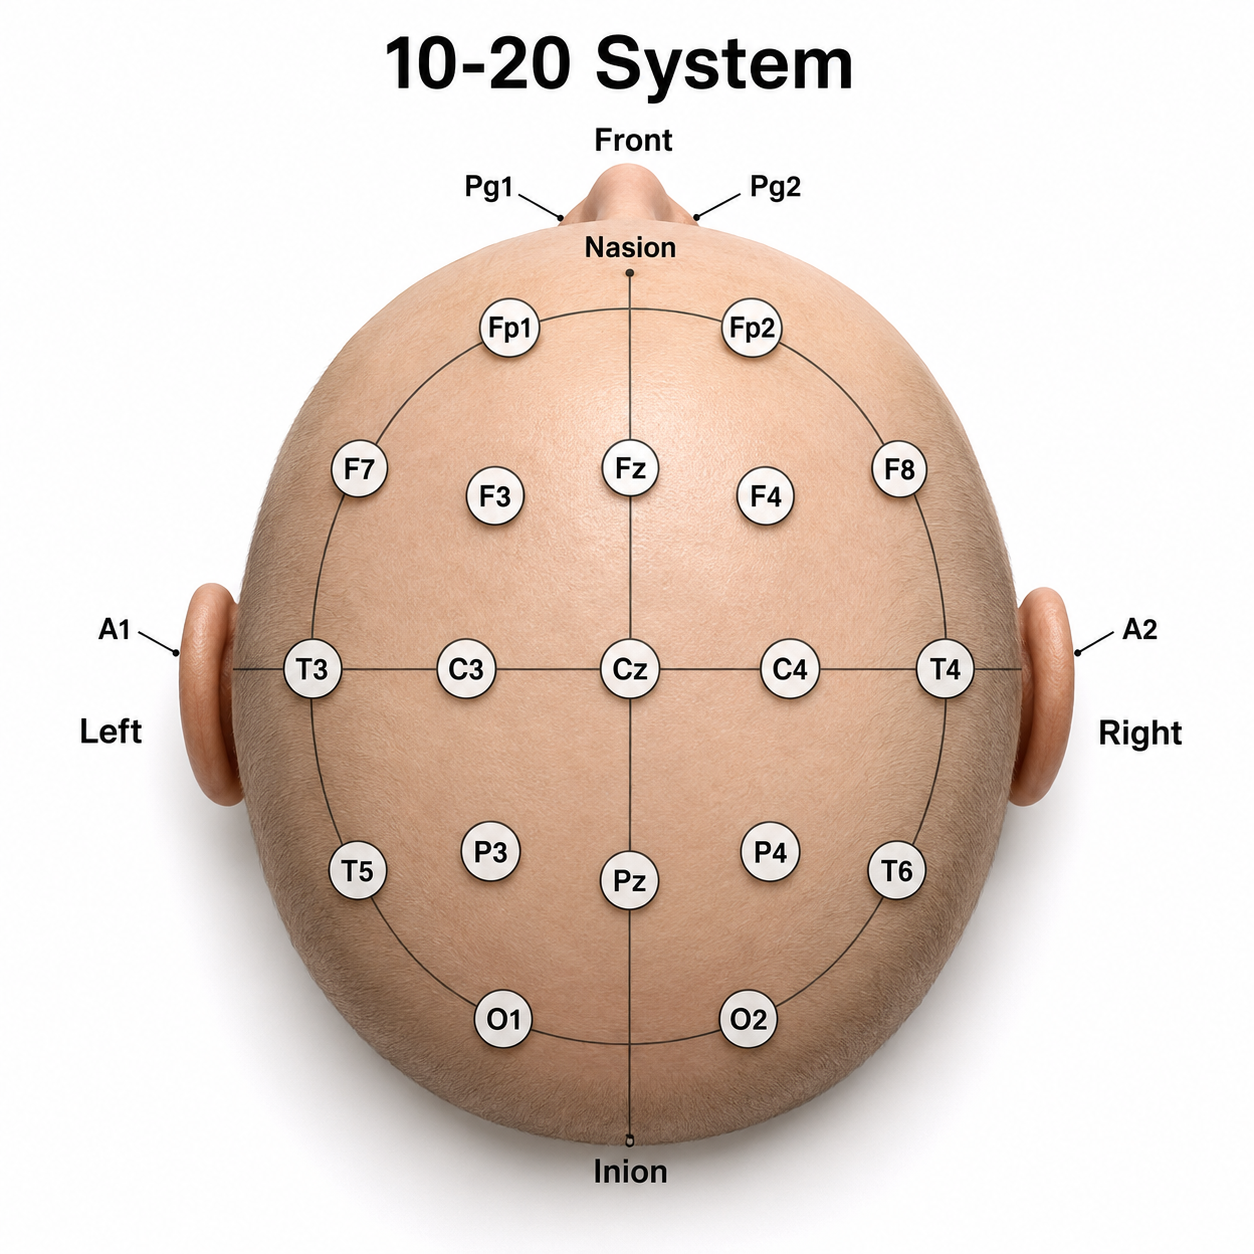
We adapted this diagram from Fisch (1999).
The 10-20 system received its name because electrode sites are separated by 10% or 20% of the distance between two corresponding anatomical landmarks. In the graphic below, each midline site is 10% or 20% of the distance from the nasion to the inion.
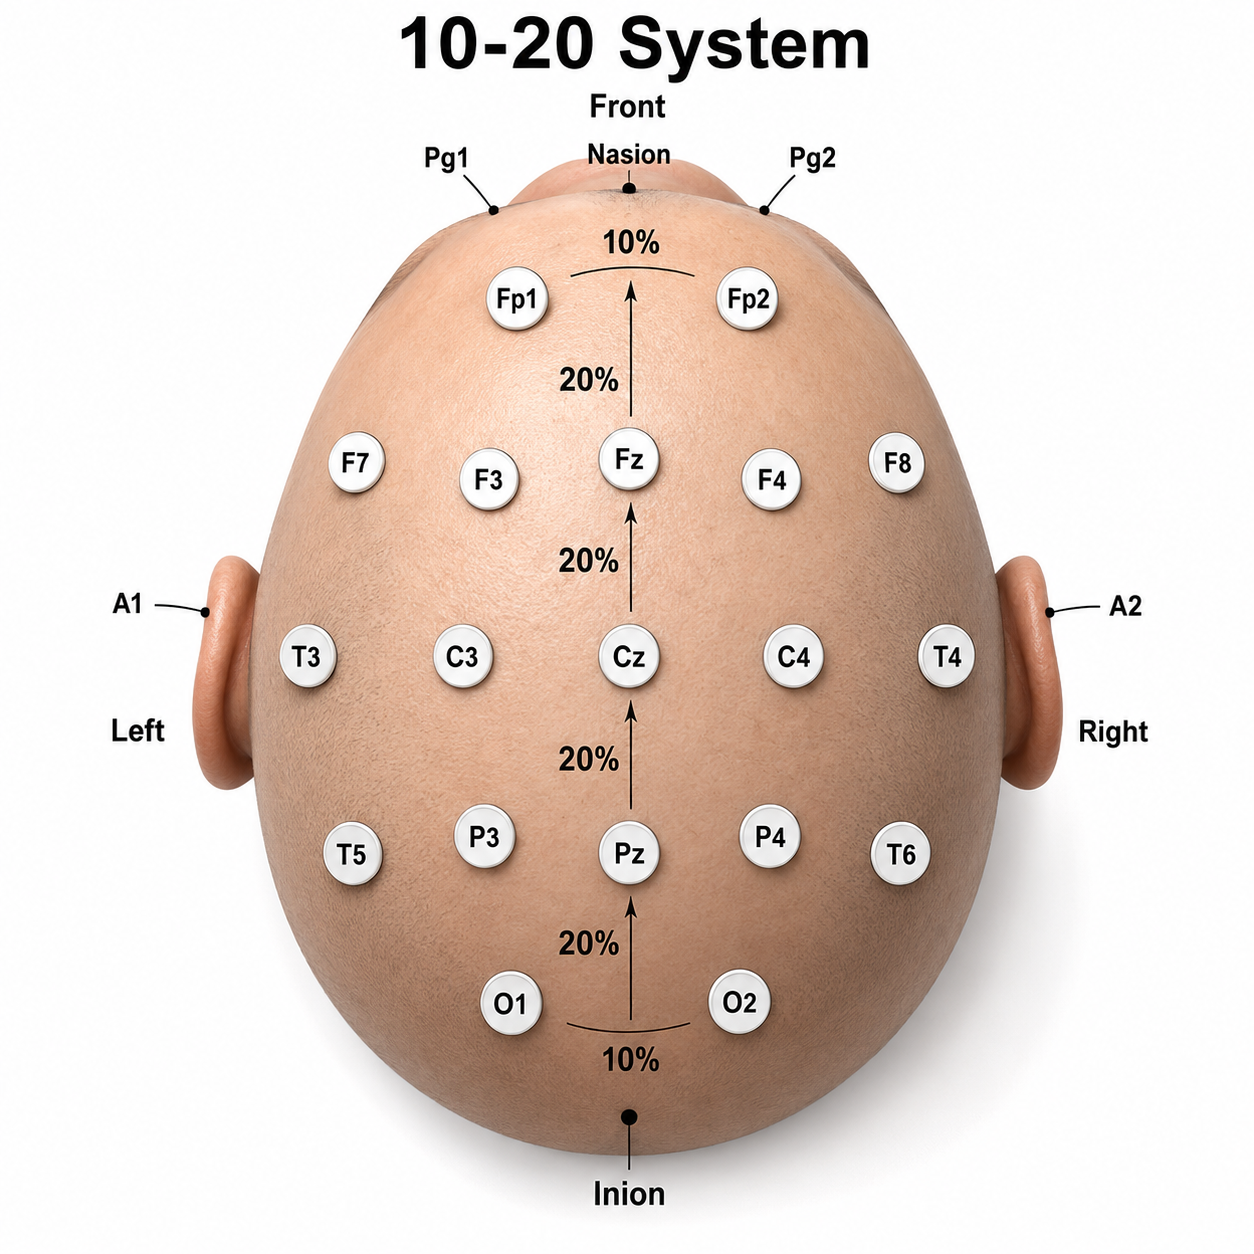
We adapted this graphic from Fisch (1999).
Each horizontal axis site is 10% or 20% of the distance from the two preauricular points.
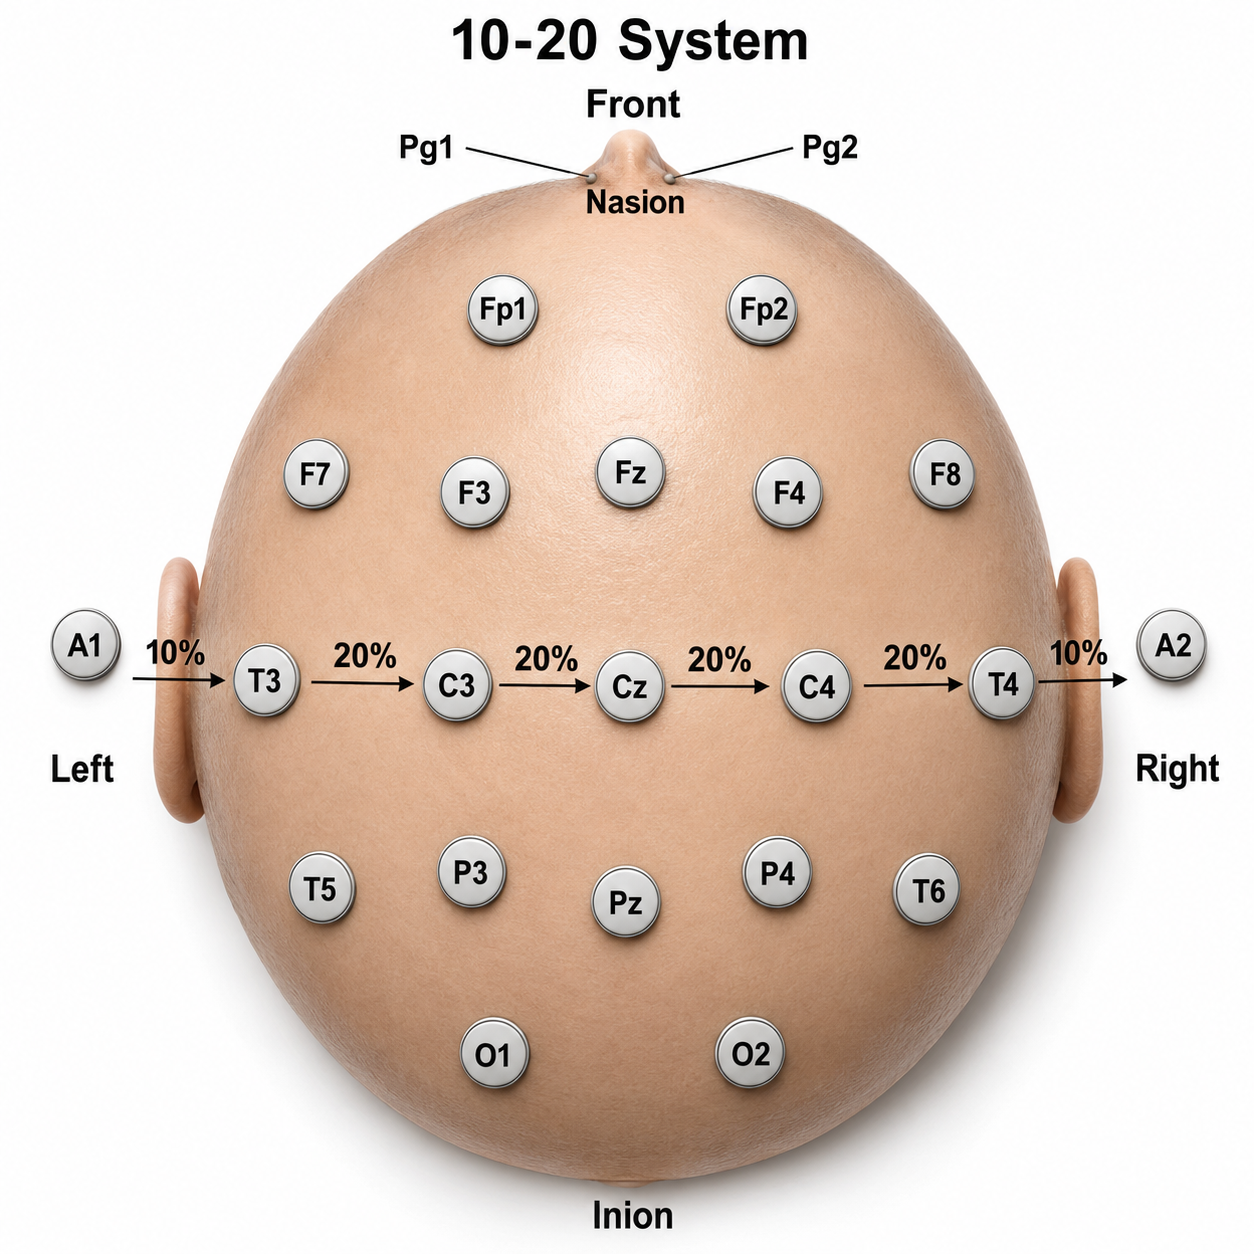
We adapted this graphic adapted from Fisch (1999).
Each circumferential site is 10% of the total circumference, excluding Fpz or Oz.
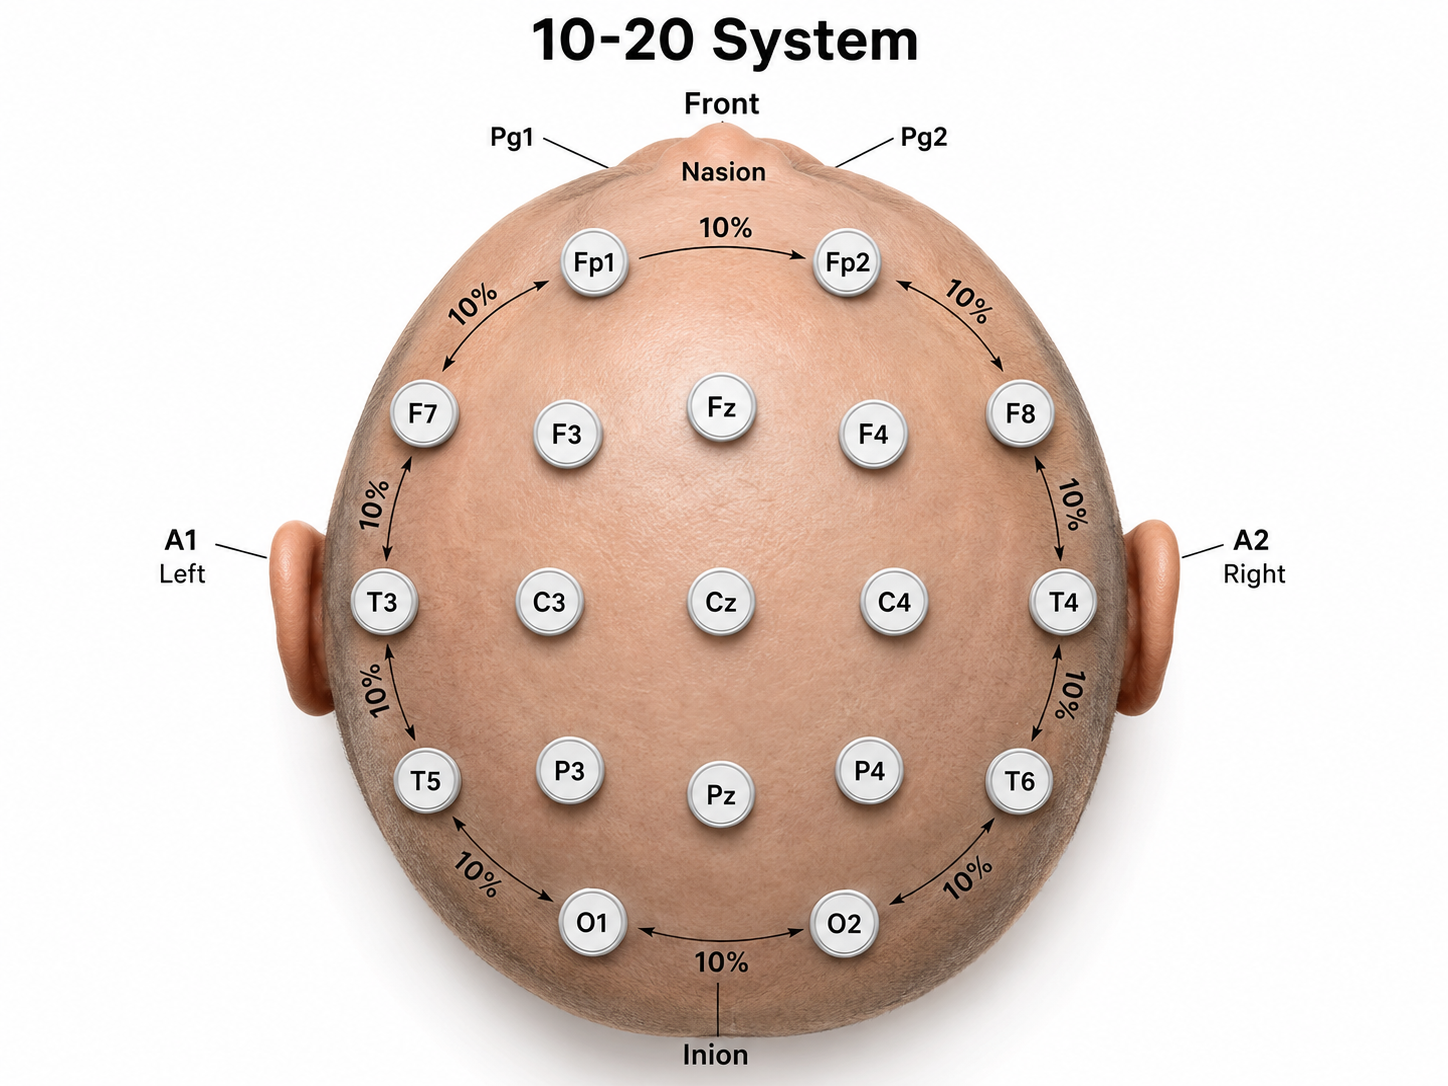
We adapted this graphic from Fisch (1999).
Intermediate sites are halfway between sets of adjacent sites.
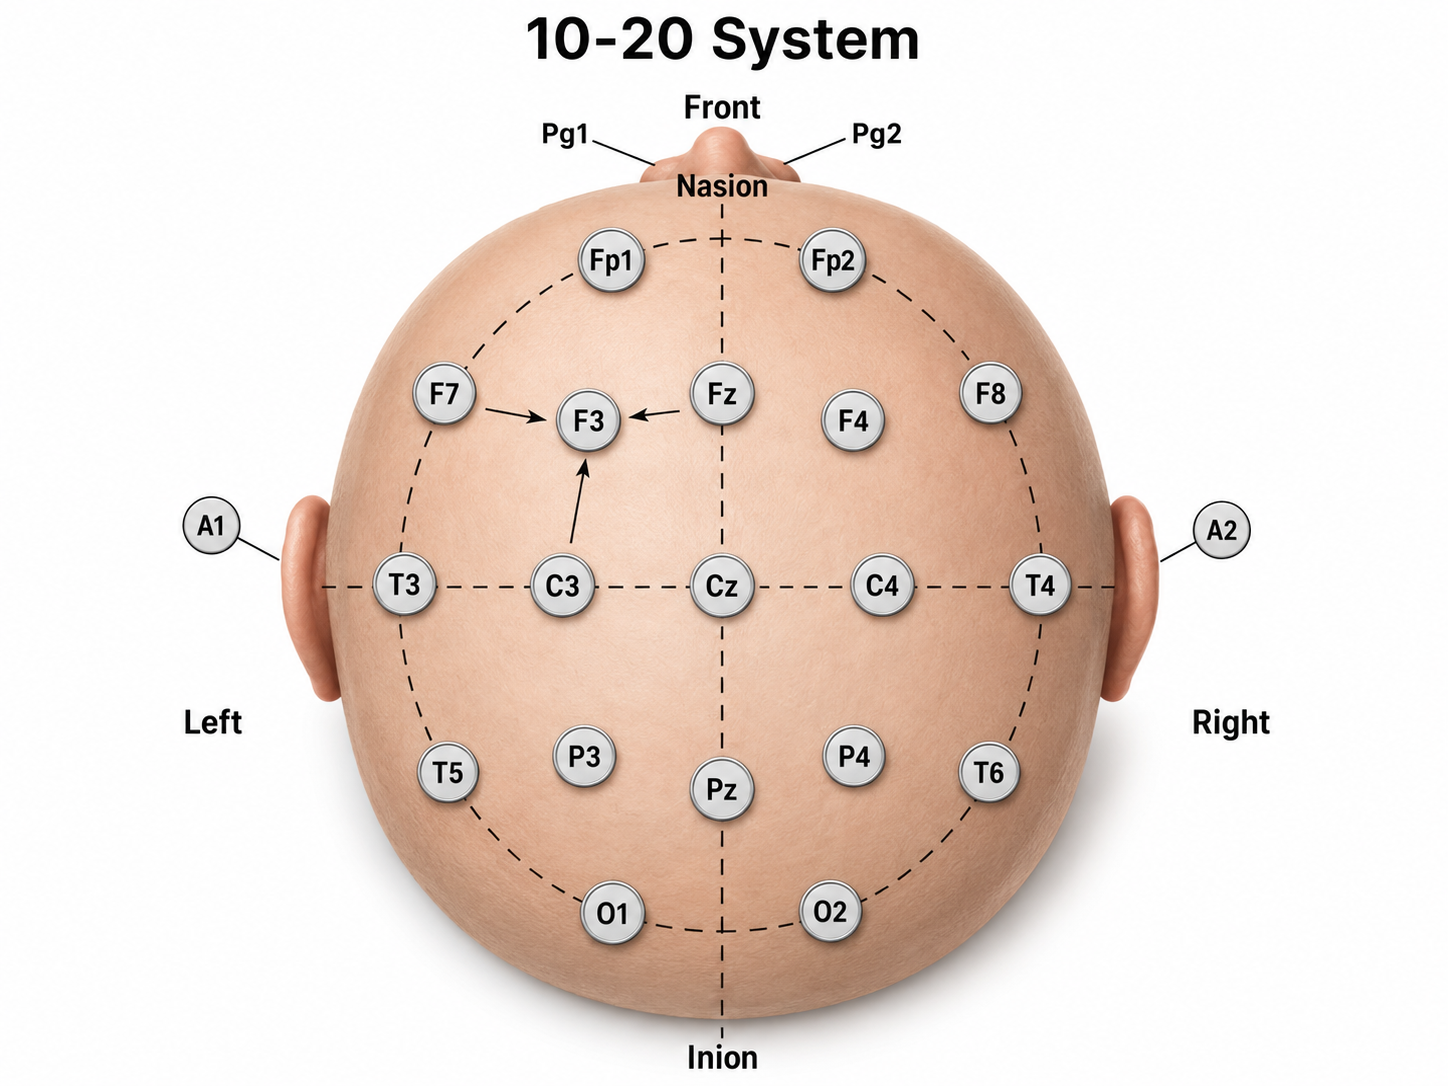
Graphic adapted from Fisch (1999).
The graphic below shows the correspondence between 10-20 sites and Brodmann areas.
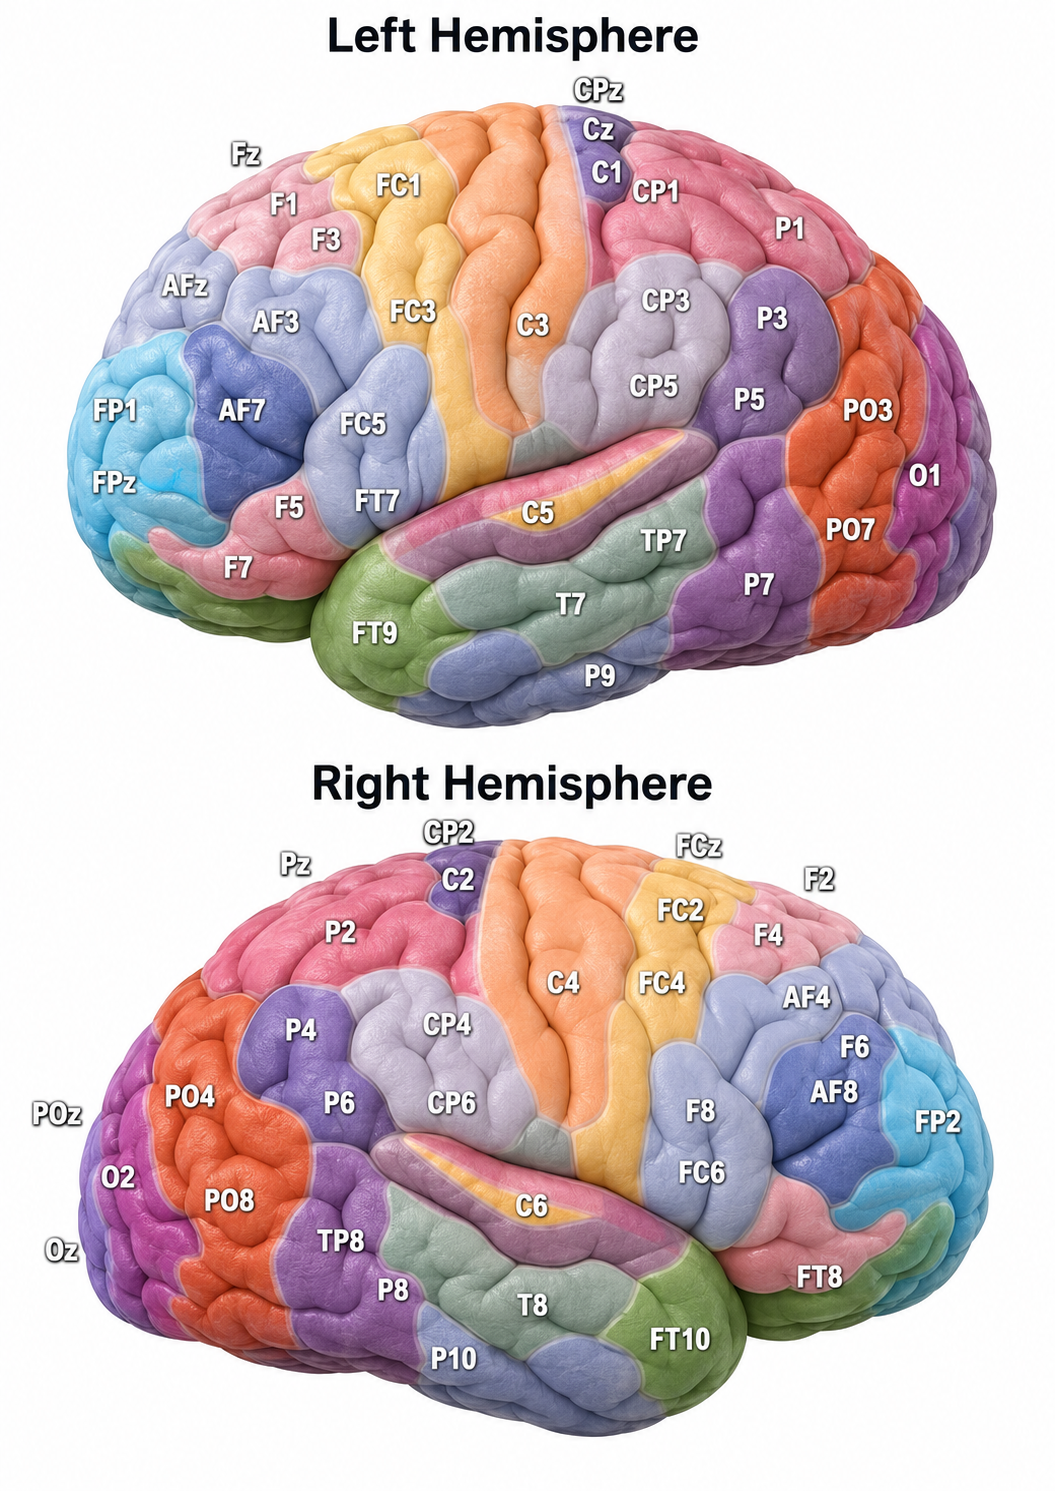
The 10-20 system assigns recording electrodes a letter and subscript. The letters represent the underlying region and include Fp (frontopolar or prefrontal), F (frontal), C (central), P (parietal), O (occipital), and A (auricular). A subscript of z represents a midline (central axis from nasion to inion) placement.
Numerical subscripts range from 1-8 and increase with distance from the midline. The 10-20 system assigns odd-numbered recording electrodes on the left and even-numbered electrodes on the right side of the head. Two reference electrodes are usually placed on the earlobe.
As EEG technology advanced, clinicians extended the classic system into the denser 10-10 array, known as the Modified Combinatorial Nomenclature. This update renames four temporal sites so their labels match their true positions: T3 and T4 became T7 and T8, and T5 and T6 became P7 and P8 (Acharya et al., 2016). You will still meet the older labels in many clinics, so it helps to recognize both. The Signal Acquisition unit describes the 10-10 system in more detail.
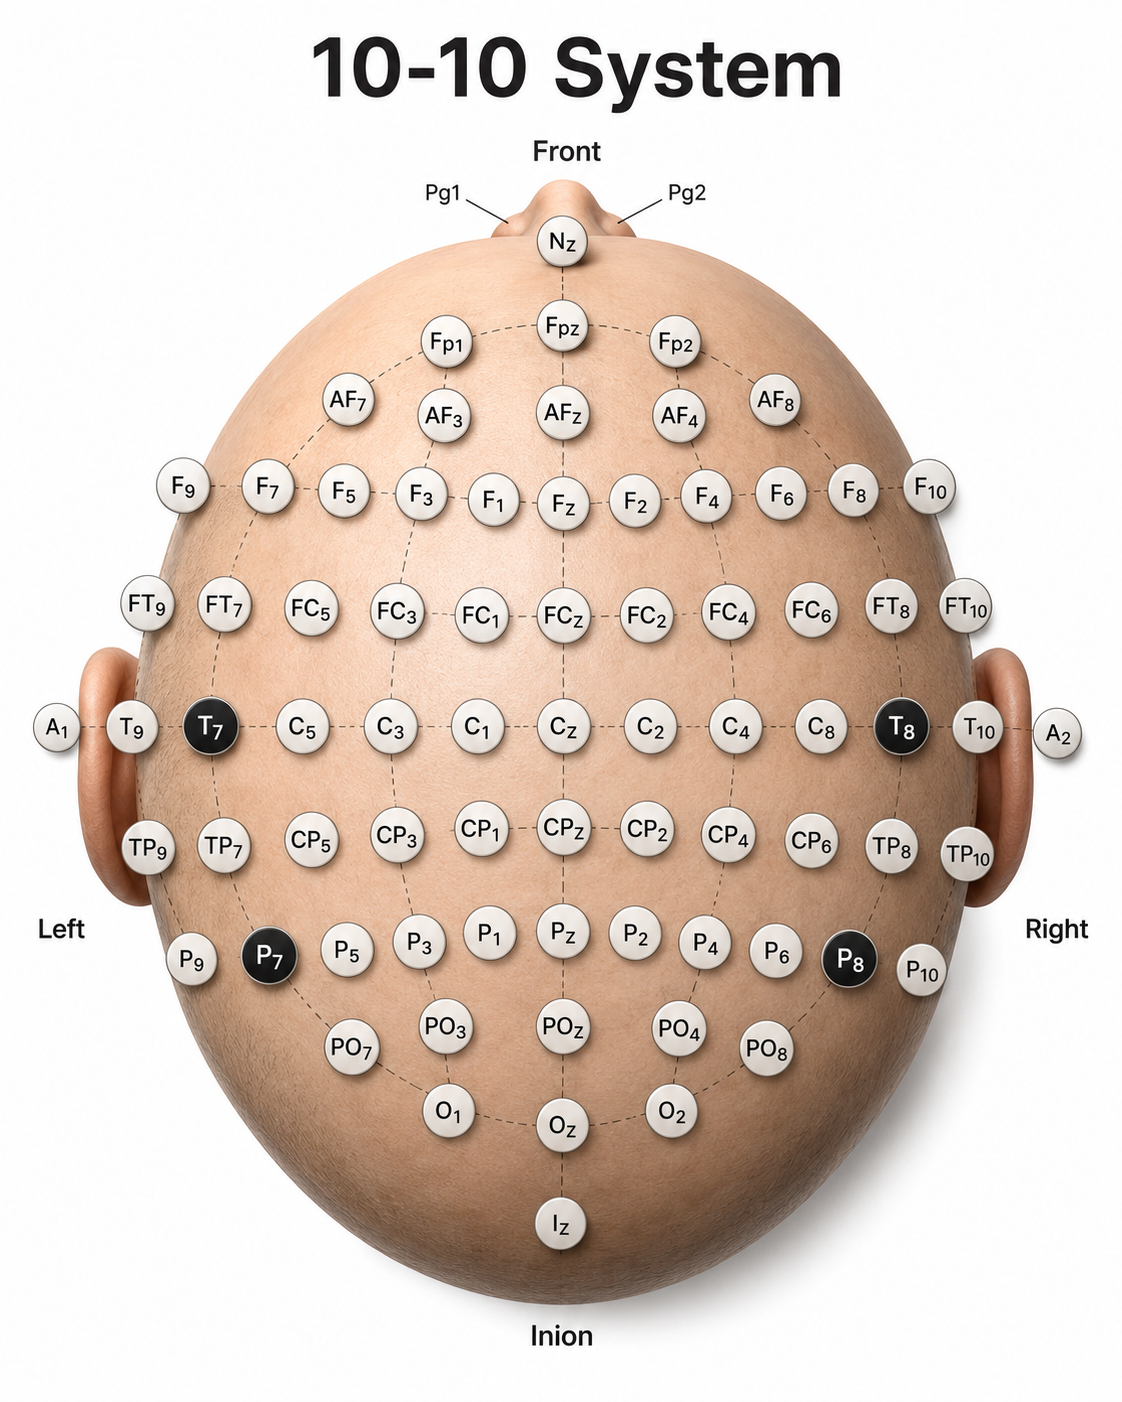
We adapted this diagram from Fisch (1999).
Key Concepts
The International 10-20 system is the shared language of electrode placement. Every site is located by measuring set percentages, either 10% or 20%, of the distance between fixed anatomical landmarks: the nasion, the inion, and the two preauricular points. Because the same landmarks and proportions are used for every client, a site such as Cz refers to the same functional location on any head, large or small. This standardization is what lets clinicians compare recordings across sessions, clients, and normative databases.
Competence in EEG setup spans measuring the scalp, locating and preparing 10-20 sites, attaching electrodes or a cap, applying conductive gel, and making correct hardware and amplifier connections. It also includes checking impedance, running tracking and continuity tests, detecting and removing artifact, obtaining eyes-open and eyes-closed data, and troubleshooting equipment. The International 10-20 system locates 19 active sites plus reference and ground by taking 10% or 20% of the distance between the nasion, inion, and preauricular points. Electrode labels encode region and side, with letters for frontopolar, frontal, central, parietal, occipital, and auricular areas, odd numbers on the left and even numbers on the right, and z for midline. Understanding these conventions lets you place sensors accurately and interpret assessment reports.
Check Your Understanding
- Which four anatomical landmarks anchor the International 10-20 system, and how are they used?
- How does the 10-20 system get its name?
- What do the letters and numerical subscripts in an electrode label such as F3 or P4 tell you?
- Why are checking impedance and detecting artifact part of basic EEG competence?
- How is Cz located, and why is it a useful starting point for other placements?
10-20 System Electrode Placements
Short Cuts for Electrode Placement
Most sites do not require all the steps outlined below. Calculate Cz by marking 50% of the nasion-inion distance and 50% of the left-right preauricular distance. You can obtain Fz, Pz, C3, C4, T3, and T4 from these two measurements. The Biofeedback Foundation of Europe generously provided the site location, preparation instructions, and graphics.
Step-By-Step Guide for Electrode Placement
Consistently mark perpendicularly on the same side of the measuring tape.
Nasion to Inion – Anterior to Posterior
- Measure from nasion to inion. Note the total and keep the tape measure on this line.
- Mark 50% (or halfway). This is Cz.
- Mark 20% forward from Cz. This is Fz.
- Mark 20% forward from Fz. This is FPz. This should be 10% up from the nasion.
- Mark 20% back from Cz. This is Pz.
- Mark 20% back from Pz. This is Oz. This should be 10% up from the inion.
Ear to Ear (Pre-Auricular)
- Measure from pre-auricular notch to pre-auricular notch. Find the tragus (the flap at the opening of the ear). Move forward to the indention between the skull and jaw. Place the end of the tape measure at this notch and pass it over Cz and to the pre-auricular notch on the opposite ear. Record this measurement.
- Mark 50% (or halfway). This should intersect with Cz and form a “+.”
- From Cz, mark 20% on each side toward the tragus. These will be C3 and C4.
- From C3 and C4, mark 20% toward the tragus. These will be T3 and T4. These sites will be 10 percent up from the pre-auricular notch, directly above the ear.
Circumferential Measurements
- Place the tape measure on FPz, T3, Oz, T4, and back to FPz. Record the total circumference.
- From FPz, mark 5% on either side. These will be FP1 and FP2.
- From Oz, mark 5% on either side. These will be O1 and O2.
- Mark at 10% increments from FP1 and FP2. These will be F7 and F8.
- Mark at 10% increments from O1 and O2. These will be T5 and T6.
Final Measurements
- Measure from Fz to F7: 50% between these points is F3.
- Measure from Fz to F8: 50% between these points is F4.
- Measure from Pz to T5: 50% between these points is P3.
- Measure from Pz to T6: 50% between these points is P4.
The 10-20 system is measured, not eyeballed. Find your four anchors first, the nasion, inion, and the two preauricular points, then work outward in set percentages from those landmarks. Confirm Cz from both the front-to-back and the side-to-side measurements, because if the two marks do not meet, the whole grid drifts. Mark consistently on the same side of the tape so small errors do not accumulate. Estimating positions rather than measuring them is discouraged; the American Clinical Neurophysiology Society notes that a placement is only truly 10-20 when head measurements have actually been made (Sinha et al., 2016).
Check Your Understanding
- Which four anatomical landmarks do you locate before any other site, and why?
- How do you find Cz, and why must you confirm it from two measurements?
- Why should you always mark on the same side of the measuring tape?
- What is the difference between a measured 10-20 placement and an estimated one?
- Starting from Cz, which nearby sites can you derive from your first two measurements?
Choosing Your Electrodes: Separate Sensors or a Full Cap
Before you prepare a single site, decide how you will record, because two setups dominate neurofeedback practice. You can attach three separate electrodes for a focused, single-channel recording, or you can fit a full cap that holds nineteen or more electrodes for a whole-head qEEG. The choice should follow your goal rather than your convenience.
Every basic recording uses three electrodes, each with a distinct job. The active electrode sits over the site of interest, such as O1 for occipital alpha or Cz for a vertex protocol. The reference electrode, usually on an earlobe or mastoid, is the comparison point for the measurement. The ground electrode, sometimes called the bias electrode, gives the amplifier's input stage a common voltage reference and stabilizes the connection between client and equipment (Collura, 2014). The cancelling of shared noise is done by the differential amplifier itself, through common-mode rejection; the ground makes that rejection possible rather than performing it.
Key Concepts
The EEG trace is not the voltage at a single electrode. It is the voltage difference between the active electrode and the reference, stabilized by the ground. This one idea explains a great deal of what you will see. It is why moving the reference changes the waveform, why a poor ground can contaminate every channel at once, and why a single failing electrode can distort what looks like brain activity. Keep it in mind whenever a recording surprises you.
Three separate electrodes are ideal for teaching, for single-site training, and for demonstrating artifacts, because they are quick to place and easy to inspect. A full cap is the right tool when you need a montage of many sites at once, as in qEEG assessment, where nineteen scalp electrodes plus references and ground are recorded together. The American Clinical Neurophysiology Society specifies that “sixteen channels of simultaneous recording are considered the minimum number required to show the areas producing most normal and abnormal EEG patterns,” and separately that all 21 electrode positions of the 10-20 system should be used (Sinha et al., 2016). Channels and electrodes are different quantities, and conflating them understates what a routine clinical EEG requires. More electrodes mean more setup time but a far richer picture of the brain.
Both separate electrodes and caps come in wet and dry versions. A wet electrode uses conductive gel or conductive paste to bridge scalp and sensor, which lowers and steadies impedance but takes longer and leaves a mess.
A dry electrode uses pins, combs, or firm pads that press through the hair to touch the scalp, so it skips the gel and speeds up setup, but its impedance runs higher and less stable and comfort becomes the limiting factor.
Choose wet for the cleanest signal and research-grade data, and dry for speed and convenience when the task tolerates a noisier trace. Note that needle electrodes are not recommended for routine clinical use, because of patient discomfort, risk of injury to personnel, and higher impedance that raises noise; the guideline makes a narrow exception for subdermal needle or wire electrodes in stuporous or comatose patients when cup electrodes are not feasible (Sinha et al., 2016).
Every basic recording uses three electrodes with distinct jobs: an active electrode over the site of interest, a reference for comparison, and a ground or bias electrode for noise control and stability. The EEG you see is the voltage difference between active and reference, not a reading from one point, so both the reference and the ground shape the trace. Use three separate electrodes for focused single-channel work and teaching, and a full cap of nineteen or more electrodes for qEEG and whole-head assessment. Wet electrodes give lower, steadier impedance at the cost of time and mess, while dry electrodes trade some signal quality for speed and convenience. Match the setup to your clinical goal, not to whichever is fastest.
Check Your Understanding
- What are the three electrode roles in a basic recording, and what does each one do?
- Why is it accurate to call the EEG a voltage difference rather than a reading from a single electrode?
- When would you choose three separate electrodes over a full cap, and when the cap?
- How do wet and dry electrodes differ in preparation, impedance, and signal quality?
- Where are reference and ground electrodes usually placed, and why those sites?
Site Preparation
Infection control is now part of site preparation, and the level of protection should follow a risk assessment rather than a fixed routine. For routine training on intact skin, hand hygiene before and after client contact is the essential measure; gloves are indicated when you anticipate contact with non-intact skin, bodily fluids, or contaminated equipment, such as handling used sensors or abraded sites. Masks and eye protection are indicated when you work within two metres of a client with respiratory symptoms or when splashes are possible, and disposable masks should be available for clients who want them. Applying gloves, a mask, and a face shield to every contact regardless of risk is not what current guidance recommends, and indiscriminate glove use has itself been linked to pathogen transmission. See the unit on Aseptic Techniques for a more comprehensive review of infection mitigation.
The steps below prepare a site for a wet cup electrode filled with conductive paste, the setup you will use most often for single-channel and three-electrode recordings. Dry separate electrodes follow at the end of this section, and full caps have their own section.
Once a site is identified and marked, site preparation and sensor placement when using individual sensors follow these steps:
- Instruct clients to wash their hair and not use any conditioner or hair-styling products. A recent haircut is helpful (particularly for children), and hair must be brushed or combed.
- Prepare the scalp by cleaning with alcohol. Let the alcohol dry before applying the electrodes.
- The following is a typical recommendation when using older amplifiers. Modern amplifiers with high input impedance do not require this step. Additionally, the following step is controversial because the old standard of achieving skin-electrode impedance below 5 Kohms has been challenged as unnecessary and risks infection transmission (Ferree et al., 2001; Kappenman & Luck, 2010). The authors of this work do not recommend this step, especially during the COVID-19 pandemic. Still, we included it because it remains an accepted standard in the field of electroencephalography: slightly abrade the skin with a blunted needle that you must discard after use to remove dead skin, dirt, and oil that can weaken the EEG signal.
- Ask your client to remove jewelry. If your client has pierced ears, do not place the electrode over the hole.
- Scoop up a small quantity of NuPrep™ skin preparation gel or a similar product on a cotton swab or tissue.
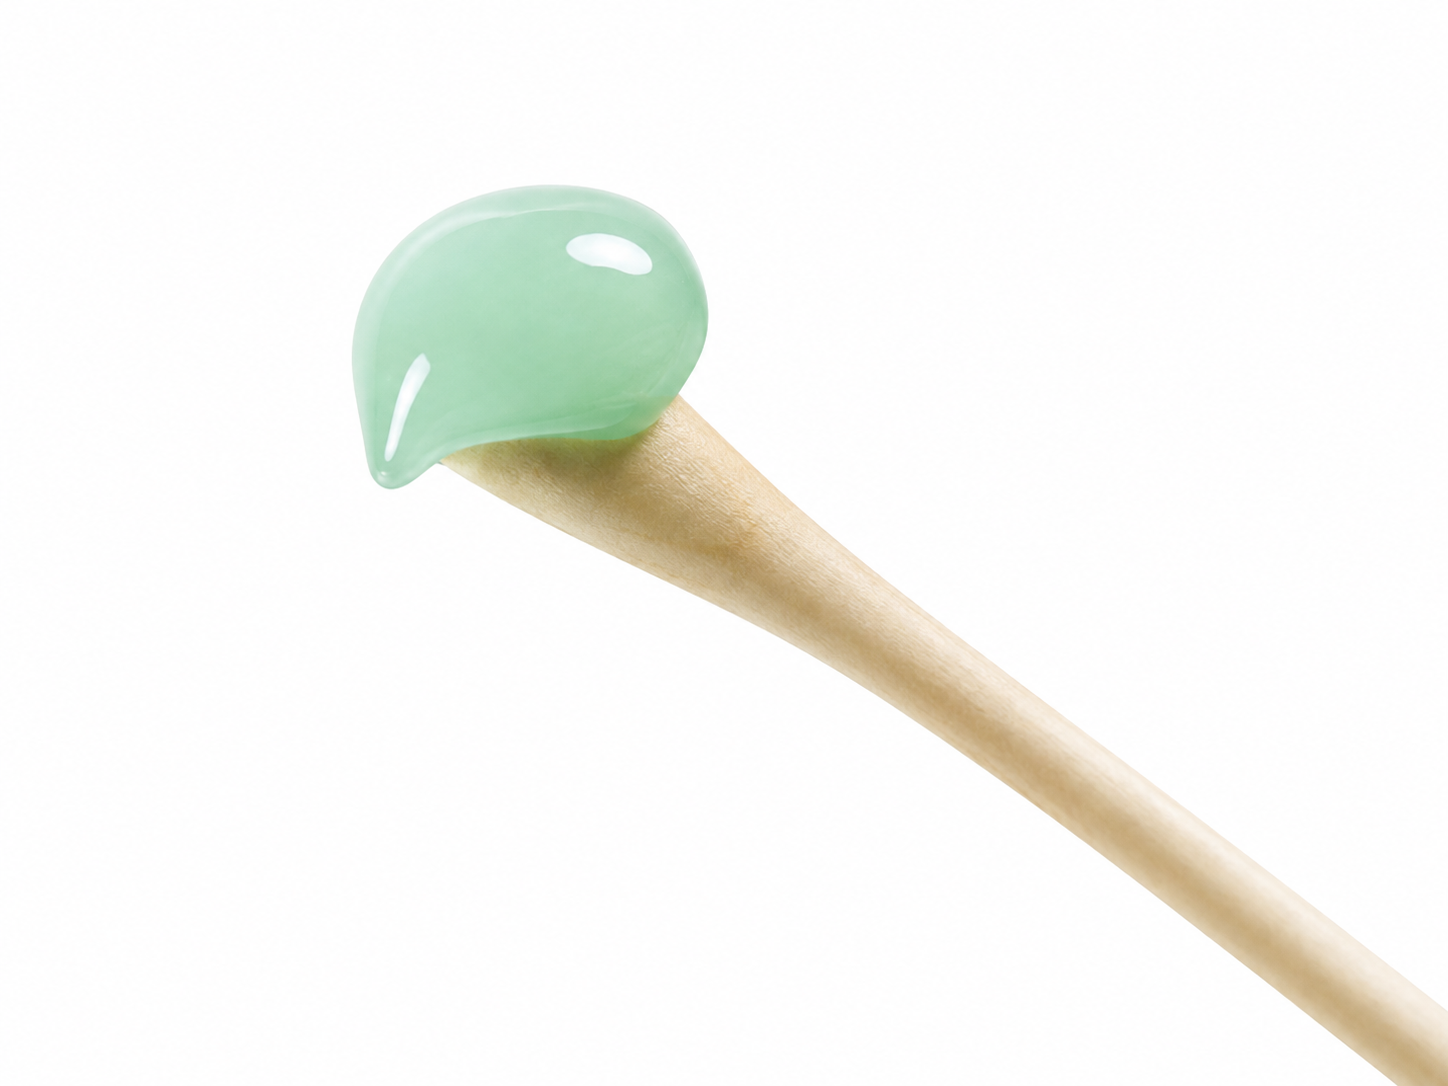
- Be careful to avoid contaminating the gel tube by avoiding direct contact with the Q-tips®.

- With the thumb and index finger of one hand, separate the hair around the electrode site that was previously found and marked.
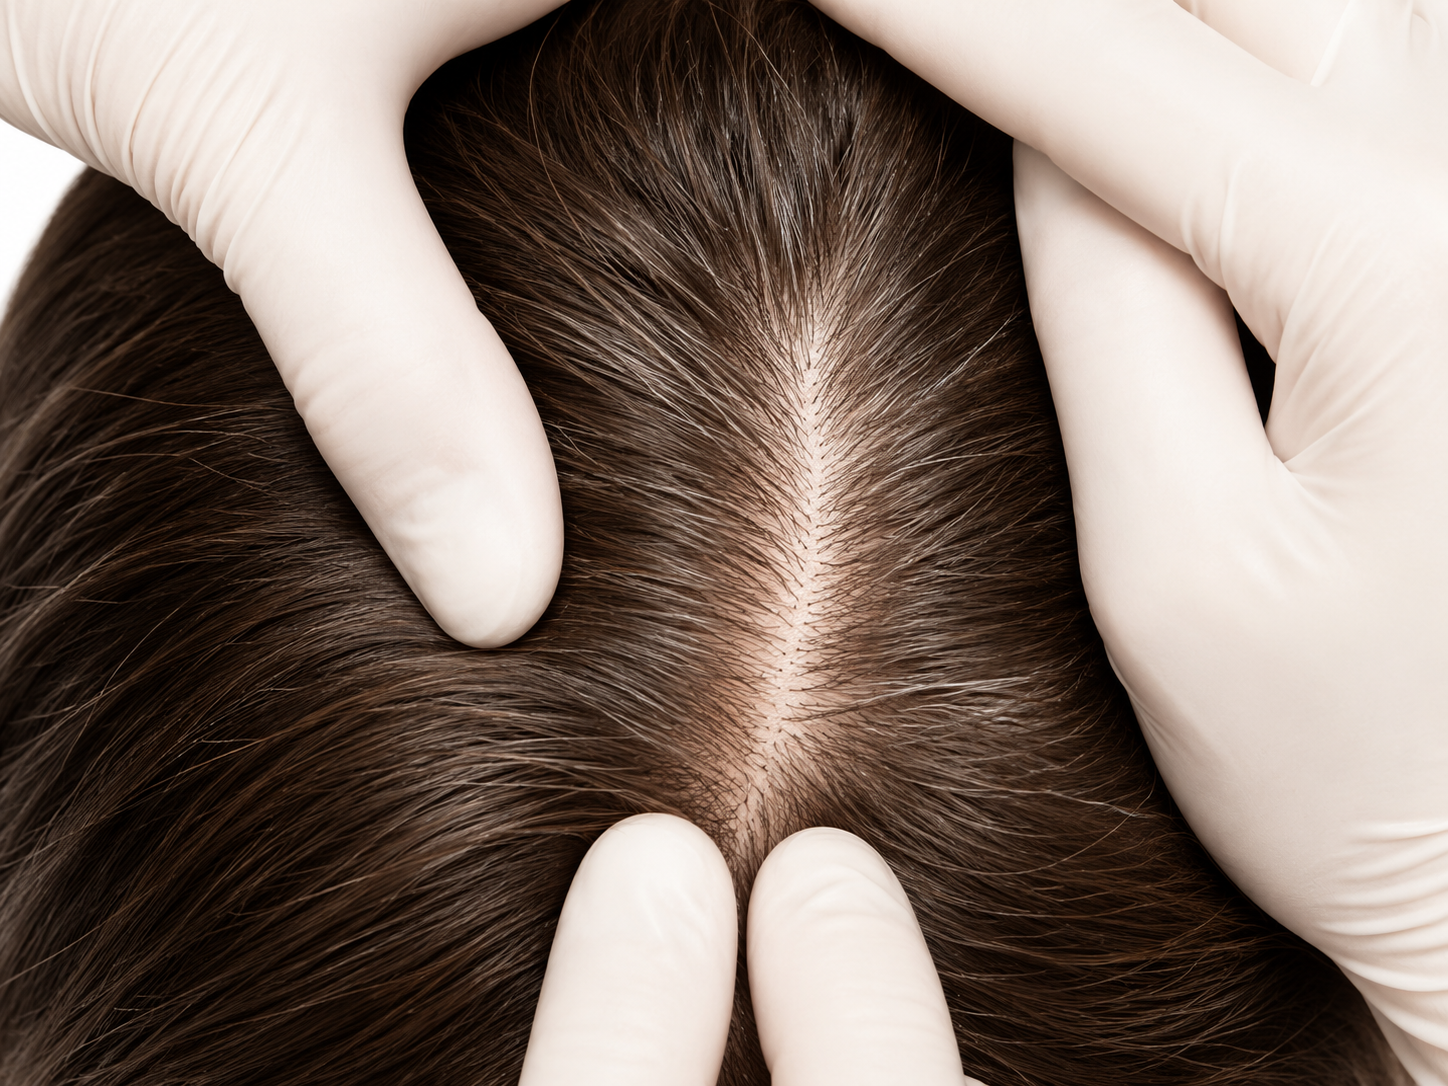
- Run the gel in the direction of the natural line formed along the scalp by the split hair. Some light force must be used, enough to redden the scalp slightly (again, not recommended but an accepted standard), but not enough to break the skin.
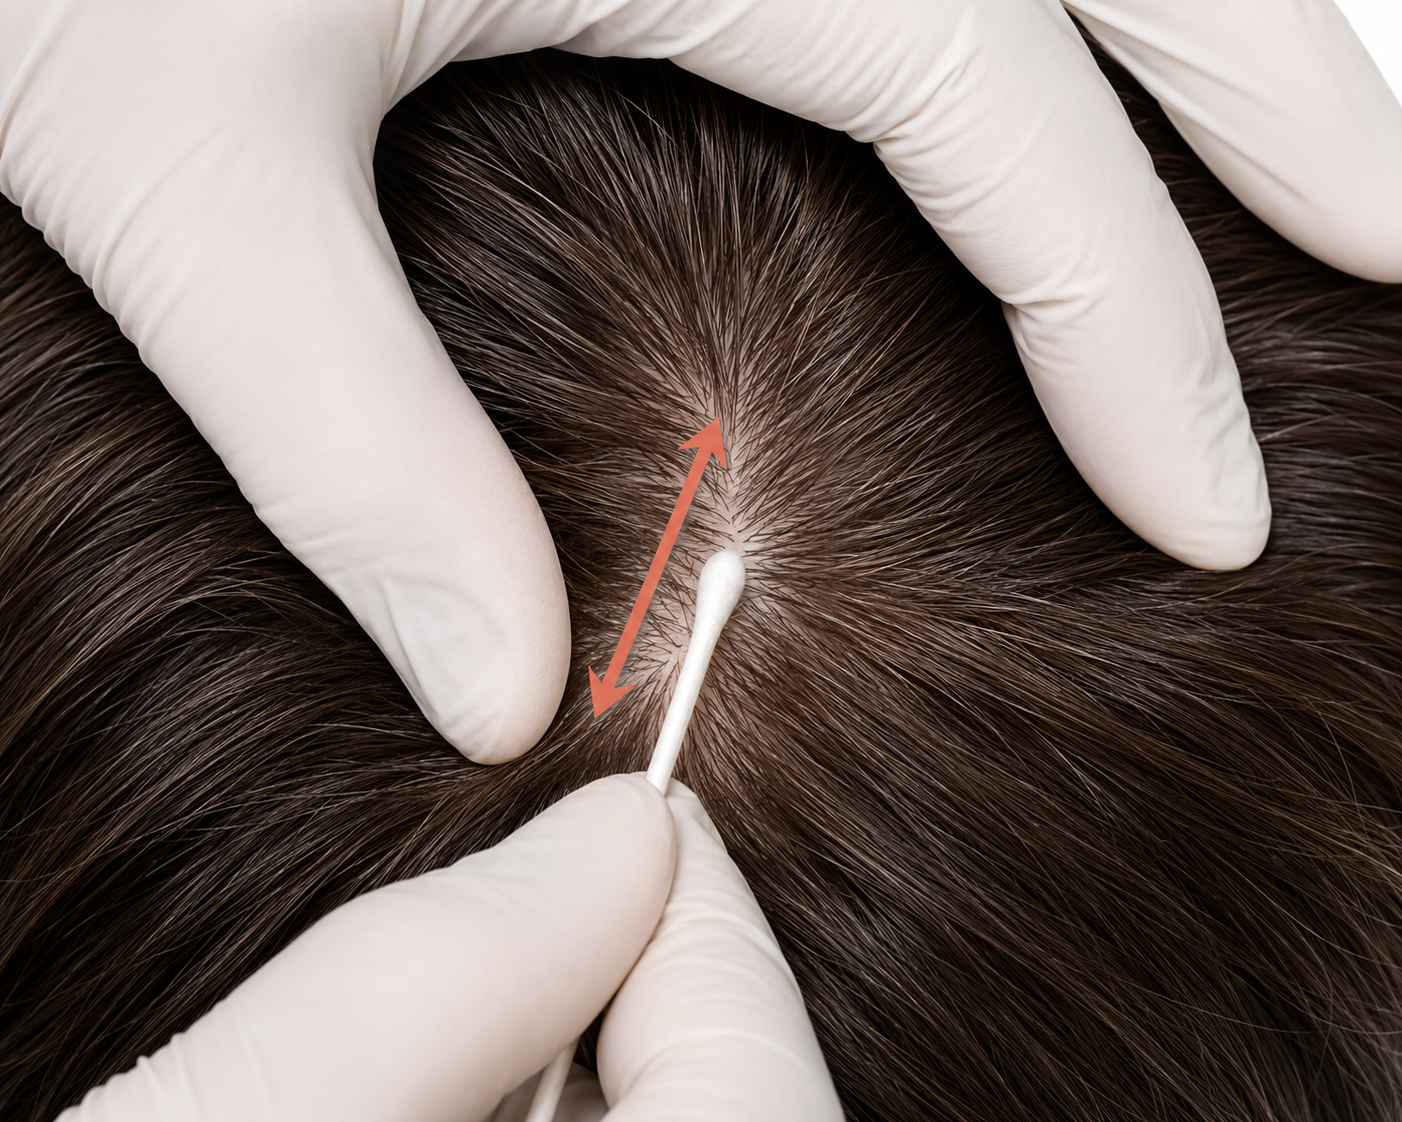
- Wipe away the excess prepping gel with a dry, lint-free cloth. Take care to keep the hair parted and keep track of the site after wiping clean.
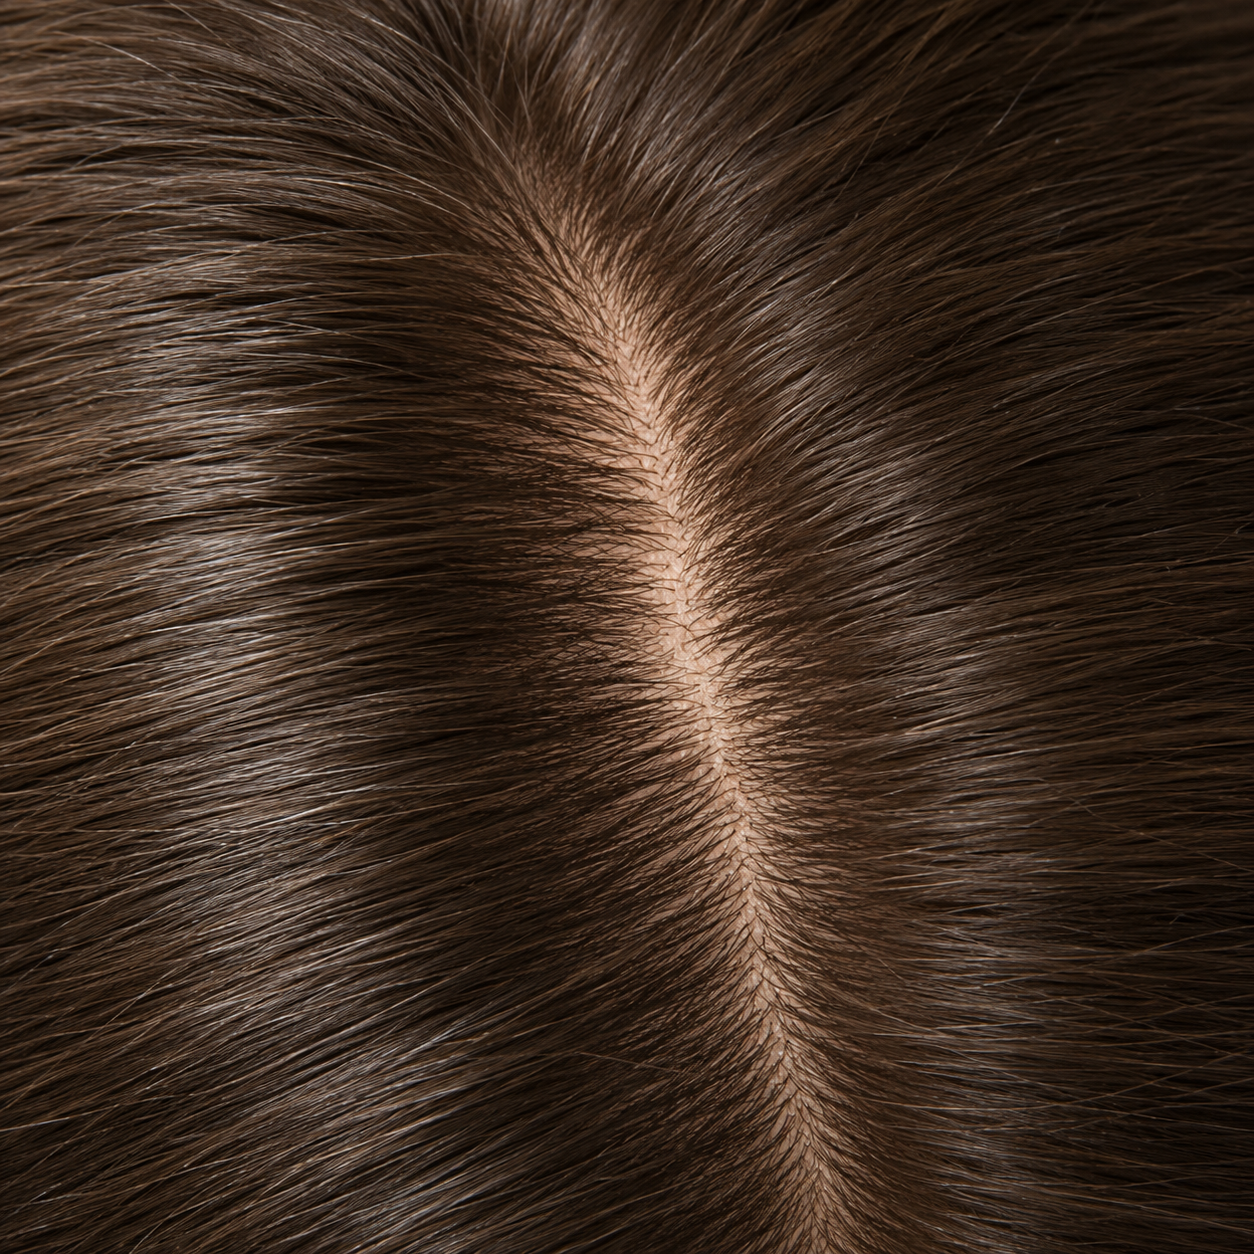
- Use a popsicle or craft stick to cover the electrode with a 1/4-inch layer of Ten20™ conductive paste. Gently press the electrode onto the skin surface until the paste flattens out under the electrode.

- Secure the electrode cables to the client and ensure strain relief.
- Fill the electrode cup with Ten20™ conductive paste so that no air bubbles exist in the cup.
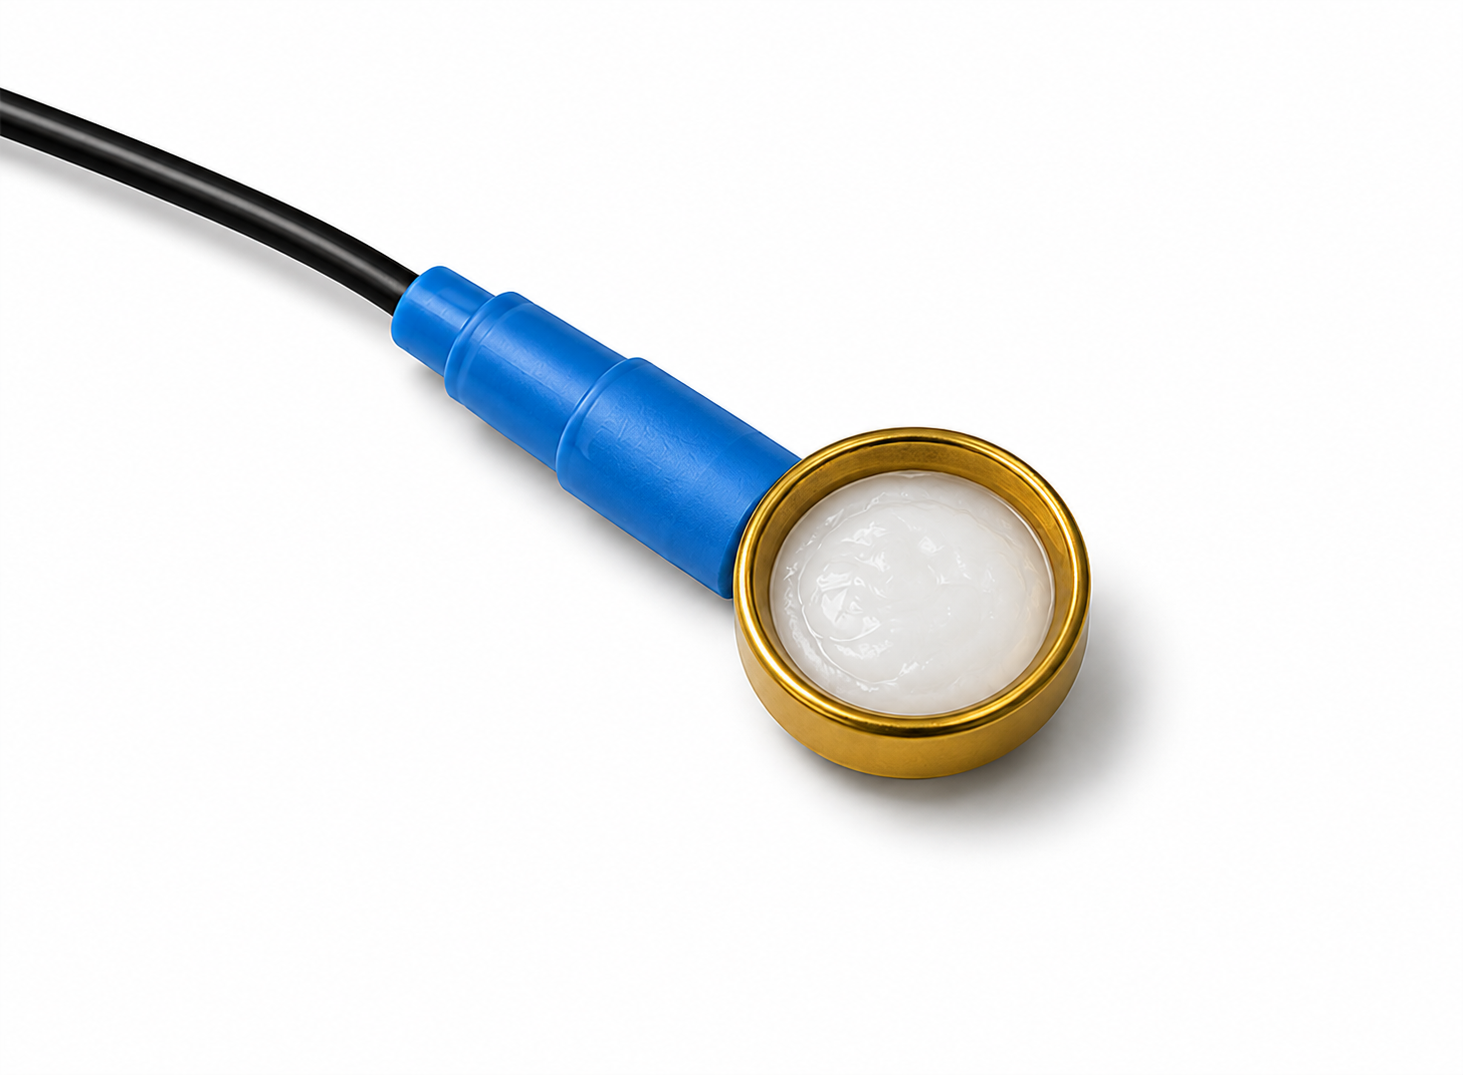
- Add more Ten20™ conductive paste onto the cup electrode, just enough to form a ball on the cup, not so much that it spills over the edge. The ideal amount of paste is shown.
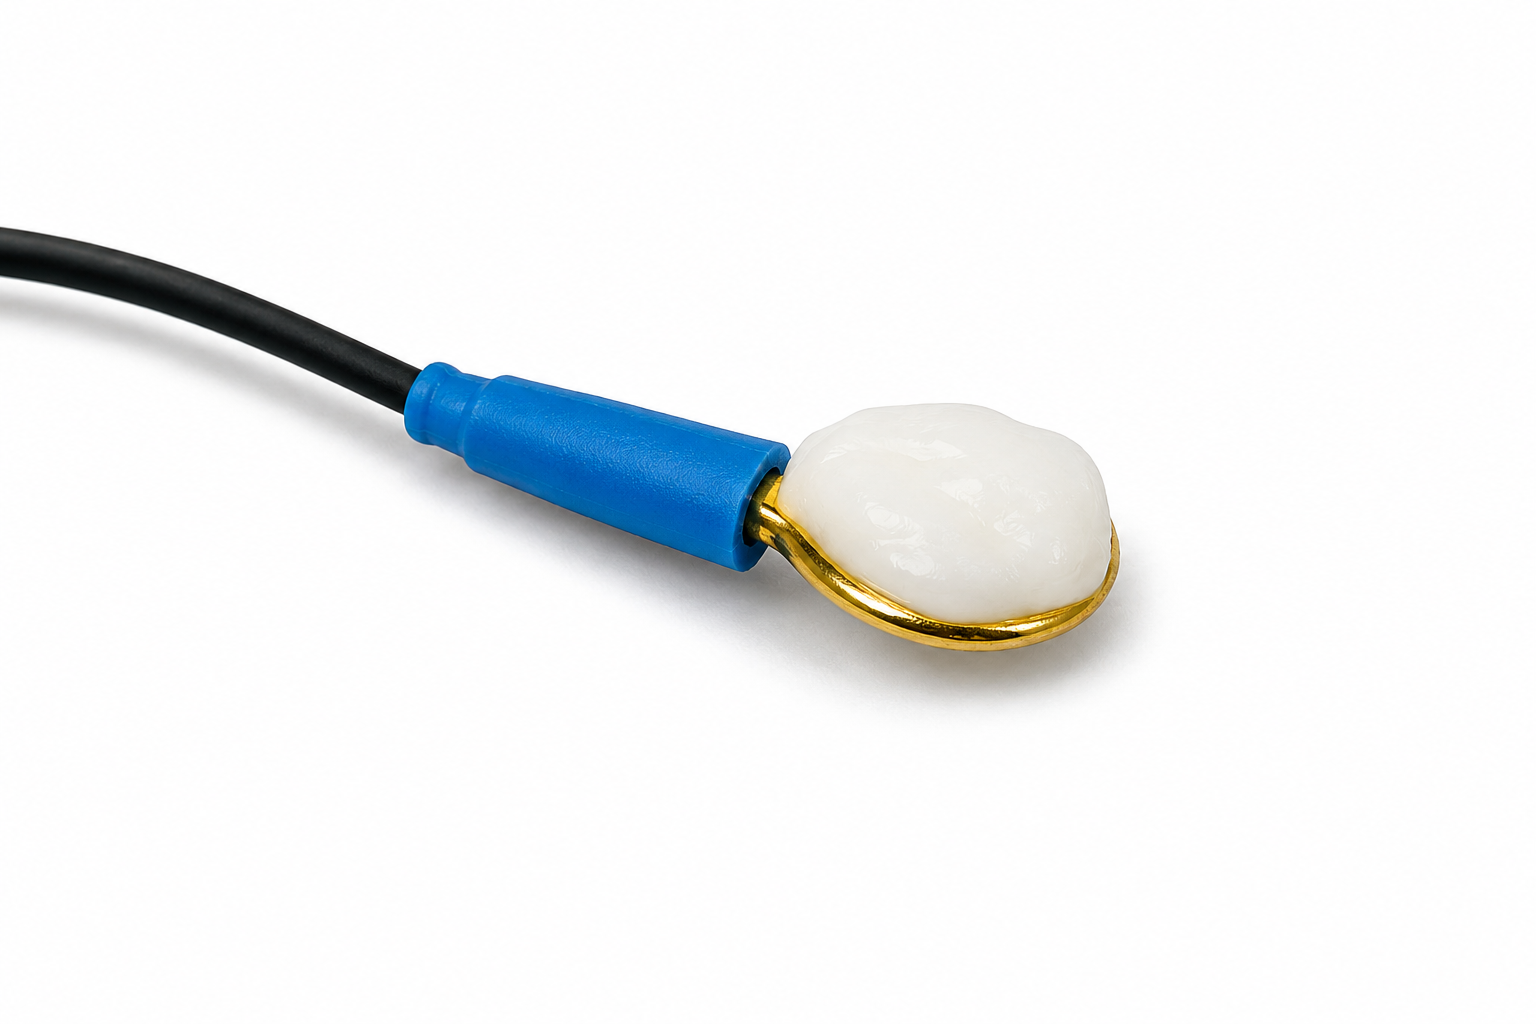
- Place the cup face down on the landing pad previously prepared. Gently push the electrode down to fix it to the scalp. A little bit of paste should run out along the edge of the cup to form a thin ring around it. Place the electrode so that the direction of the cable does not place undue stress on the cup, so that it does not get pulled, lifted, or twisted off. The cable should hang naturally and towards the plastic clip, and enough slack should be left to allow for comfortable head movement.
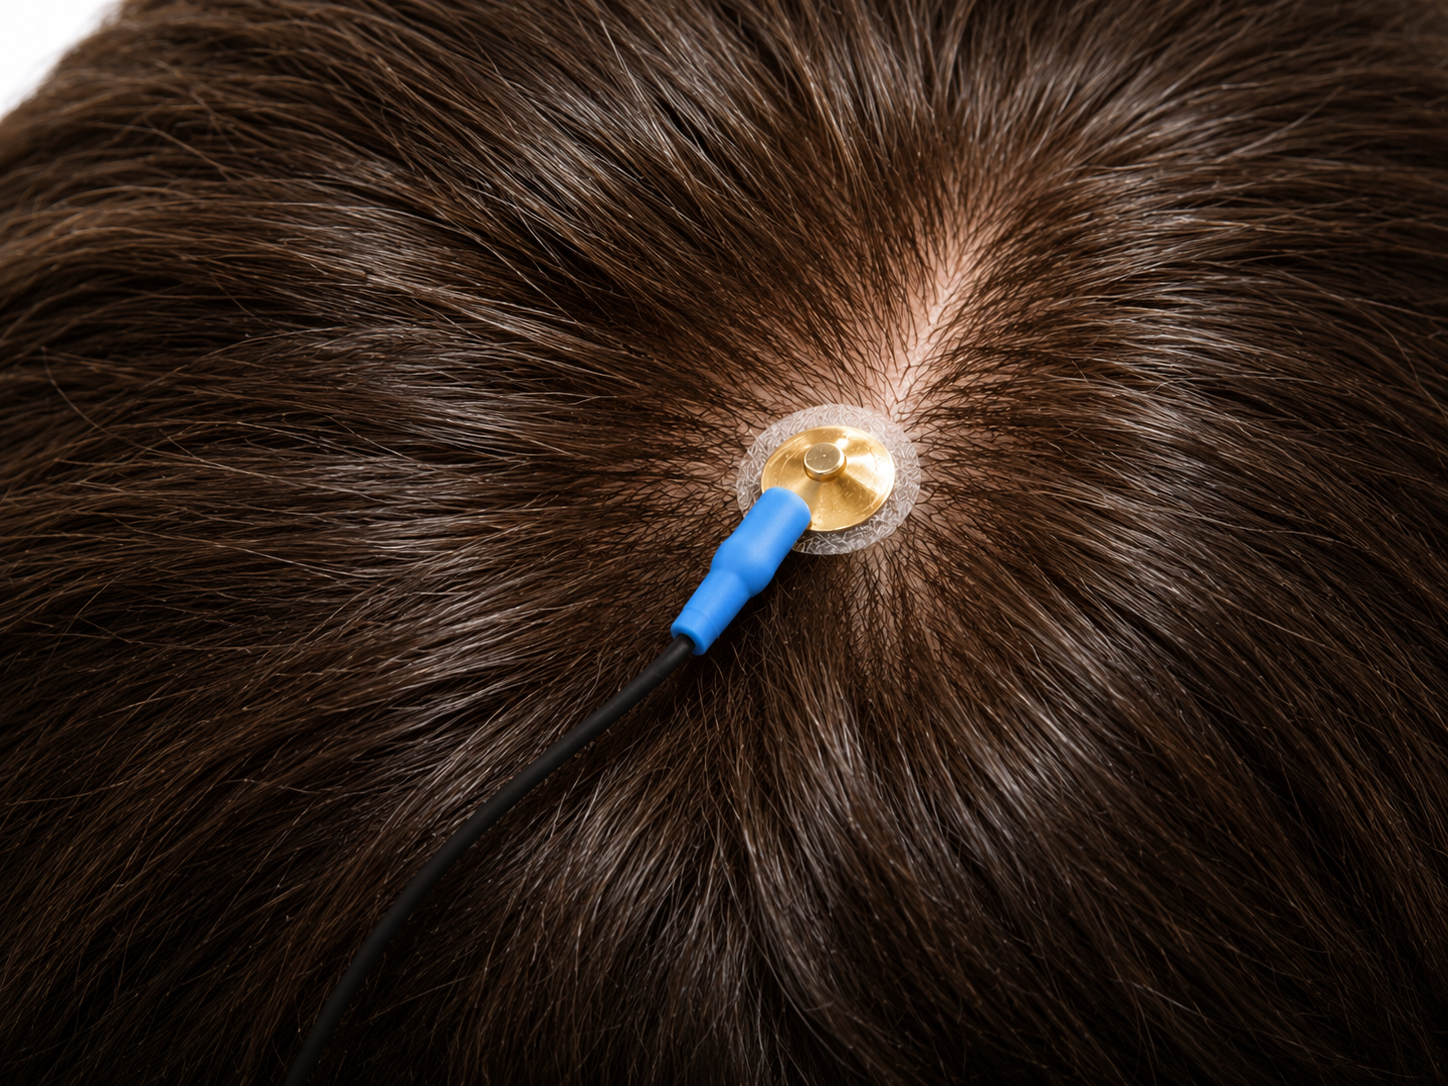
- Repeat the above preparation and placement steps on the earlobes. Do not put too much paste on the ear clip electrode, but ensure that the gold disc is completely covered.
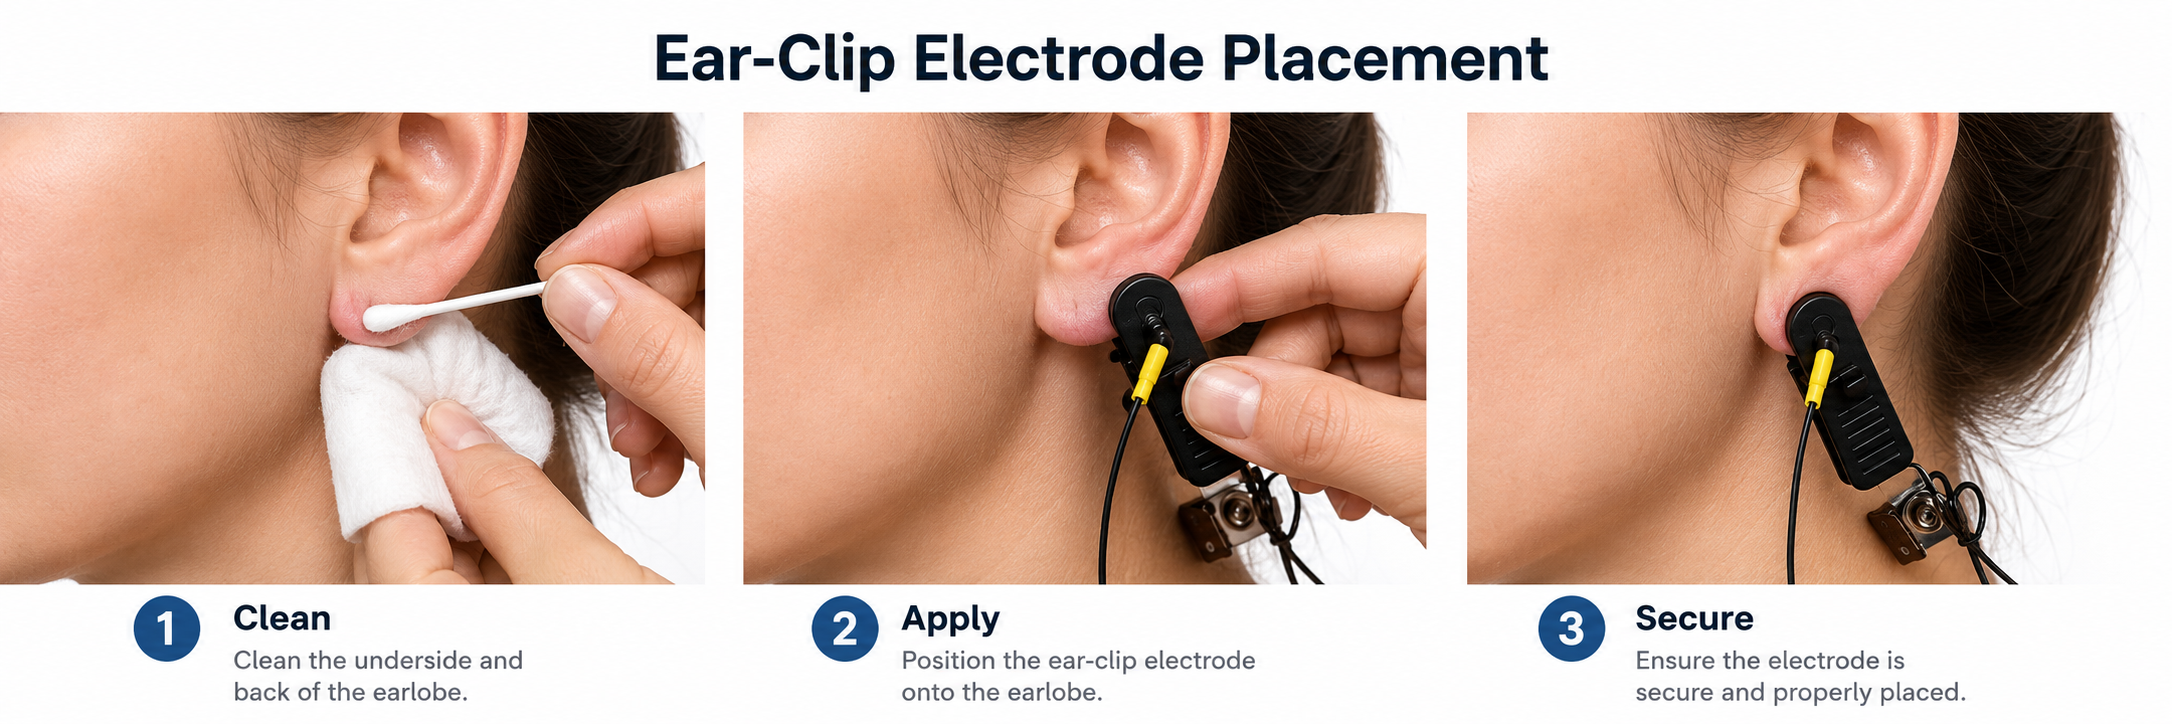
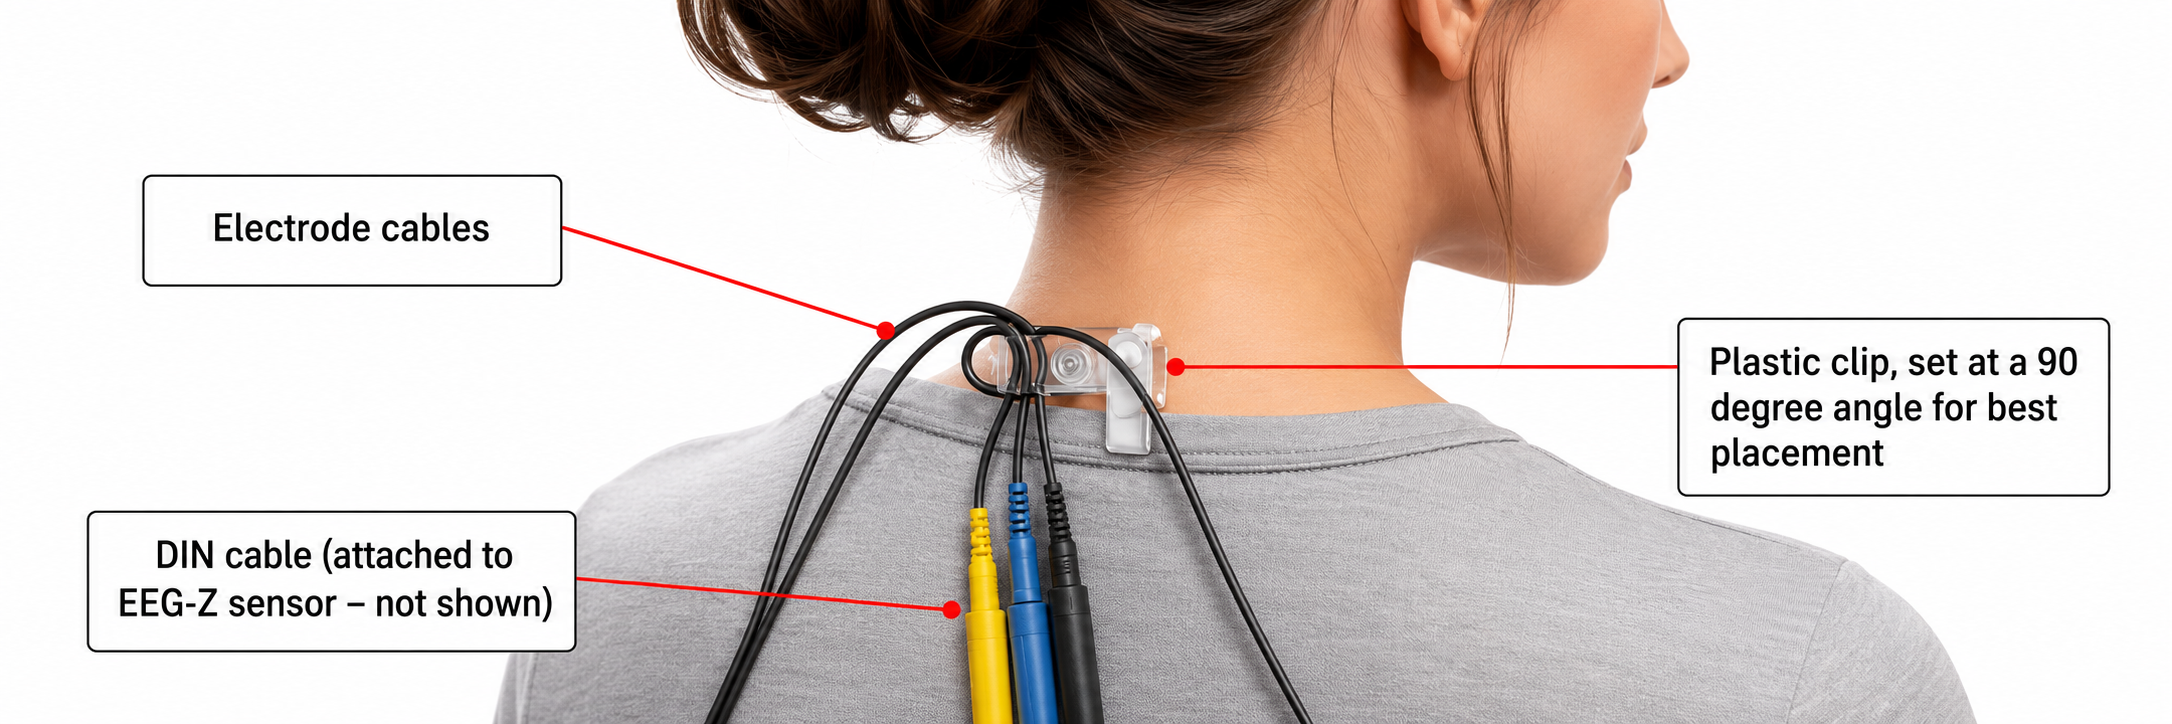
- Leave enough slack in the cable to allow the patient to turn their head easily, but not too much that it can get caught. Think about the angle of the cable from the ear clip to the neck clip so that no extra tension is placed on the ear clip. Note the position of the clip, the direction of the cables, and the slack left to provide mobility. The final configuration should look like the photograph below when viewed from behind.
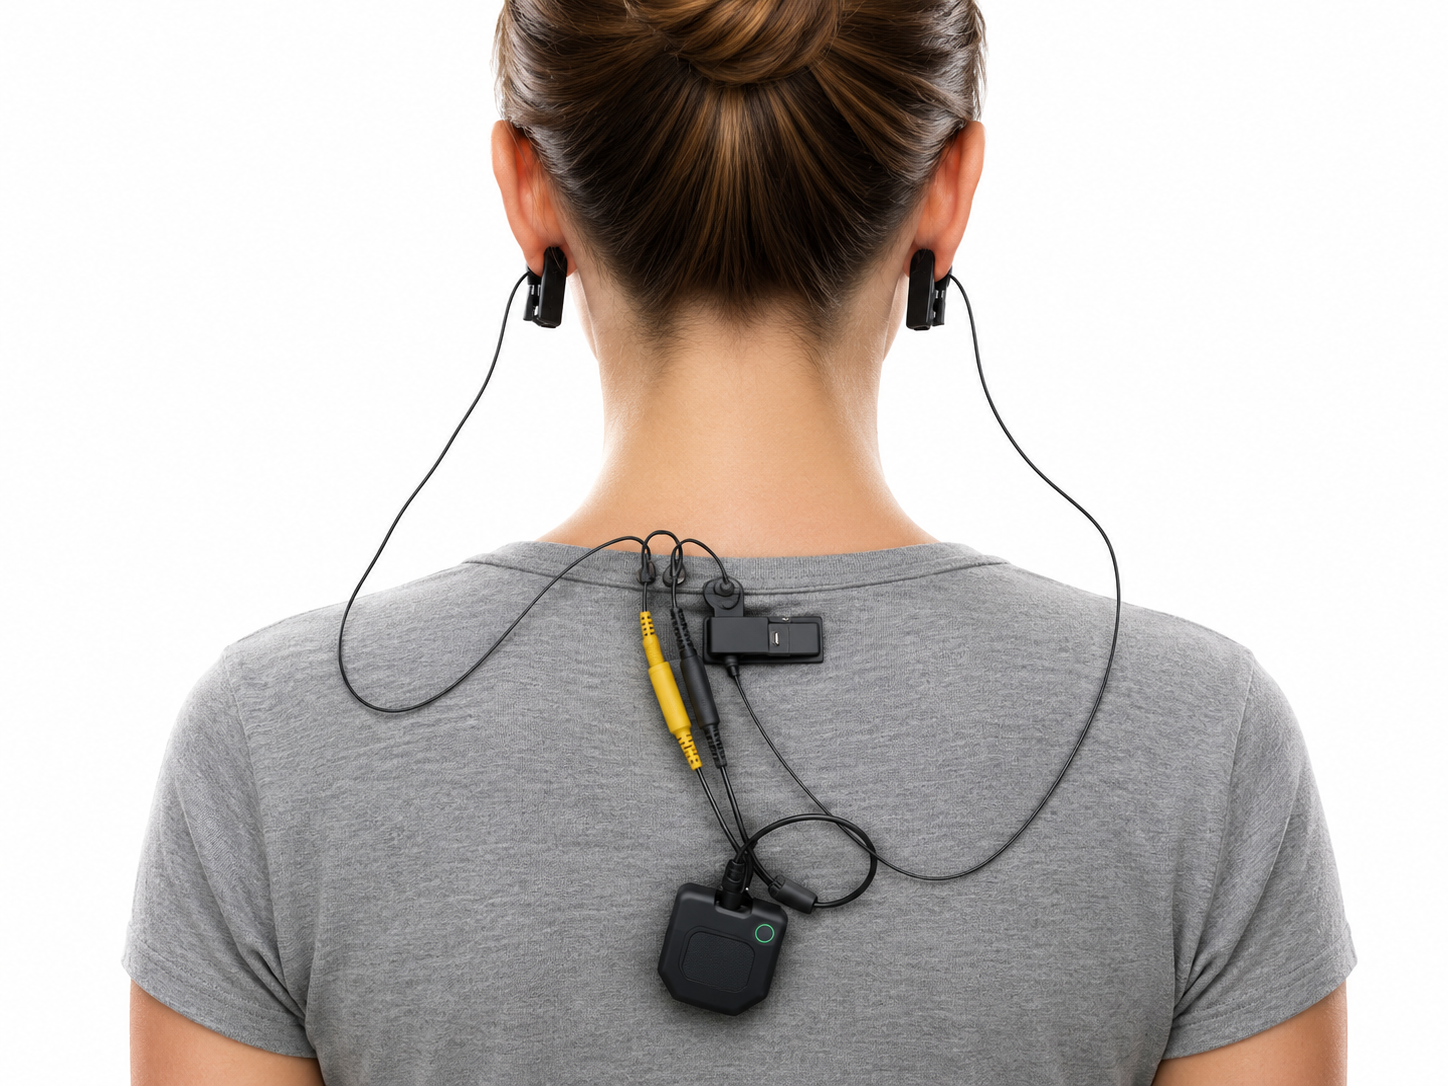
Use enough paste to complete the path from scalp to sensor, but no more. Excess paste that spreads from one electrode to the next forms a salt bridge, an unintended conductive path that merges two channels into one and makes their data useless. This is the same mechanism behind the bridging artifact, so wipe away any excess before it reaches a neighboring site (Sinha et al., 2016).
This movie is a 19-channel BioTrace+ /NeXus-32 display of EEG recording © John S. Anderson.
Applying Three Dry Electrodes
Dry electrodes skip the gel, so the setup is faster but the mechanics matter more. With no electrolyte to steady the interface, a dry electrode depends on direct contact and gentle mechanical pressure, which means hair, motion, and fit have a larger effect on the signal. Prepare three dry electrodes as follows.
- Confirm the client's hair is dry and free of styling product.
- Choose the sensor shape for each site: a flat pad for the forehead, earlobe, or mastoid, and a pin or comb sensor for hair-covered scalp.
- Tell the client to expect gentle pressure, never sharp pain.
- Place the active dry electrode at the marked site, parting the hair so the contact points reach skin rather than resting on hair.
- Place the reference and ground electrodes on the earlobe, mastoid, or forehead.
- Secure the sensors with a headband, elastic wrap, adhesive holder, or spring frame.
- Increase pressure gradually until the trace is stable and the client stays comfortable, and reposition at once if there is pinching, headache, or lingering discomfort.
Do not hold a dry electrode to the impedance target you use for wet electrodes. Dry contacts read much higher and less stable impedances because no electrolyte stabilizes the interface, so judge them by the manufacturer's contact-quality scale and the live trace rather than a wet-electrode pass or fail number.
Site preparation begins with a clean, product-free scalp and, in the era of COVID-19, appropriate masks, a face shield, and gloves for the clinician. For a wet electrode, part the hair, apply a small amount of preparation gel along the part, wipe away the excess, and seat a paste-filled cup so a thin ring of paste forms around it without spreading to a neighbor. For a dry electrode, skip the gel and rely on gentle mechanical pressure, adjusting contact until the trace is stable and the client stays comfortable. Route each cable with strain relief and enough slack for comfortable head movement, and repeat the process on the earlobe references. Modern high-input-impedance amplifiers make aggressive skin abrasion unnecessary, so it is now discouraged for both comfort and infection control.
Check Your Understanding
- What infection-control measures does current practice recommend during site preparation?
- What are the key steps in preparing a site and seating a wet cup electrode with conductive paste?
- How does preparing three dry electrodes differ from preparing wet electrodes?
- Why should you leave slack in the electrode cable and provide strain relief?
- How does earlobe reference preparation differ from scalp site preparation?
Applying a Full Electrode Cap
When you need many sites at once, a full electrode cap replaces dozens of separate placements with a single fitted garment. A well-fitted cap holds each electrode close to its 10-20 target, so sizing is not a step to rush. An ill-fitting cap shifts electrodes away from the regions they are meant to record and quietly undermines every site.
Fitting a Wet Cap
- Measure head circumference with a flexible tape around the widest part of the head, passing just above the eyebrows and over the inion.
- Match the measurement to the manufacturer's sizing chart, and when a client falls between sizes, choose the snugger cap if it stays comfortable.
- Have the client hold the front edge against the forehead while you stretch the cap back over the head.
- Align Cz at the intersection of the nasion-to-inion and preauricular-to-preauricular midpoints, exactly as you would for a single vertex placement.
- Check symmetry so that Fp1 and Fp2 are level and equidistant from the midline, and secure any chin strap snugly without restricting the jaw or airway.
With the cap seated, prepare each site through its electrode well. Part the hair with a blunt applicator until the scalp shows, then fill the well with conductive gel so a solid column connects scalp to sensor with no air gap. Fill just enough to make contact. Overfilling lets gel spread from one well to the next and form a salt bridge that merges neighboring channels, the same problem you guard against with separate electrodes.
Fitting a Dry Cap
A dry cap carries the same 10-20 logic but no gel. Its electrodes reach the scalp through pins or spring-loaded contacts that part the hair under gentle tension, so fit and pressure do the work that gel does in a wet system. Size and seat the cap the same way, aligning Cz and checking symmetry, then adjust the tension until the trace is stable and the client stays comfortable. Expect higher and less stable impedances than a wet cap, and judge contact by the system's own quality scale rather than a wet-electrode target.
Checking Impedance and Signal Quality
Whatever electrodes you use, check impedance before you record. For clinical EEG, aim for balanced impedances; modern digital amplifiers accept values up to about 10 Kohms when they are balanced, although values below 100 ohms usually signal a short or a salt bridge and should be corrected (Sinha et al., 2016). Neurofeedback practice is more lenient, accepting values under 20 Kohms for general clinical sessions while reserving the stricter targets for research (Demos, 2019). Balance matters more than any single number, because unbalanced impedances weaken the amplifier's ability to reject shared noise.
Impedance tells you the connection is sound; the live trace tells you the recording is usable. Seat the client comfortably, ask them to relax the jaw, and watch the raw signal while you confirm the setup works. With an occipital site, alpha should rise when the eyes close and fall when they open, a blink should produce a large slow frontal deflection, a jaw clench should add fast muscle activity, and touching a cable should produce a movement artifact. Reproducing these on purpose, as you learned earlier, is the fastest way to prove your electrodes are reporting brain activity rather than noise.
Cap sizing is not a minor detail: an ill-fitting cap moves every electrode off its target, so measure the head and match the sizing chart before anything else. Seat a cap by aligning Cz at the nasion-inion and preauricular midpoints and checking left-right symmetry, exactly as for a single placement. For wet caps, fill each well with a solid, air-free column of gel, and never overfill, since spreading gel bridges neighboring channels. Dry caps use pressure instead of gel and read higher, less stable impedances, so judge them by the system's contact scale rather than the wet-electrode target. Always confirm that impedances are balanced and above 100 ohms before recording, then watch the live trace respond to eyes open and closed, blinks, and jaw clenches.
Check Your Understanding
- Why does cap size affect the validity of every electrode's recording?
- How do you align and check a cap once it is on the head?
- What is a salt bridge, and how do you prevent one when gelling a wet cap?
- How should your impedance expectations differ between a wet cap and a dry cap?
- What should you see in the live trace when the eyes close, when the client blinks, and when the client clenches the jaw?
Elimination of Artifact from EEG Recording
BCIA's Neurofeedback Essential Skills List requires that applicants identify and remove artifact sources appearing in EEG recordings (Biofeedback Certification International Alliance, 2020). Review the Signal Acquisition unit to recognize normal EEG patterns and identify and correct noncerebral origin signals like bridging artifacts. Once you understand the mechanics and appearance of common artifacts, Peper et al. (2008) recommend that you intentionally reproduce them to recognize and prevent them.
Brain map validity depends on the integrity of the raw EEG, and the published requirements are more demanding than clinical habit sometimes assumes. The International QEEG Certification Board and the EEG and Clinical Neuroscience Society specify a minimum of 1 minute of artifact-free data for database comparison, ideally 2 to 5 minutes, with no selected segment shorter than 1 second; they assume a raw record of roughly 10 minutes each of eyes-open and eyes-closed recording (International QEEG Certification Board, n.d.; Sinha et al., 2016). Select that clean data separately for each condition rather than pooling the two. Realize that longer recordings risk increased drowsiness artifacts and sleep. Therefore, it is helpful to speak to the client occasionally to help them maintain alertness, and simply saying how much time is left every 1-2 minutes is usually enough to accomplish this.
Stage 1 sleep is a subtle drowsy state that clients often do not recognize. This state change is seen as a decrease in alpha and an increase in theta amplitudes. There will be slow eye-rolling movements and decreased EMG and beta. Note the increased theta amplitudes in the spectral displays for channels 1 and 2.
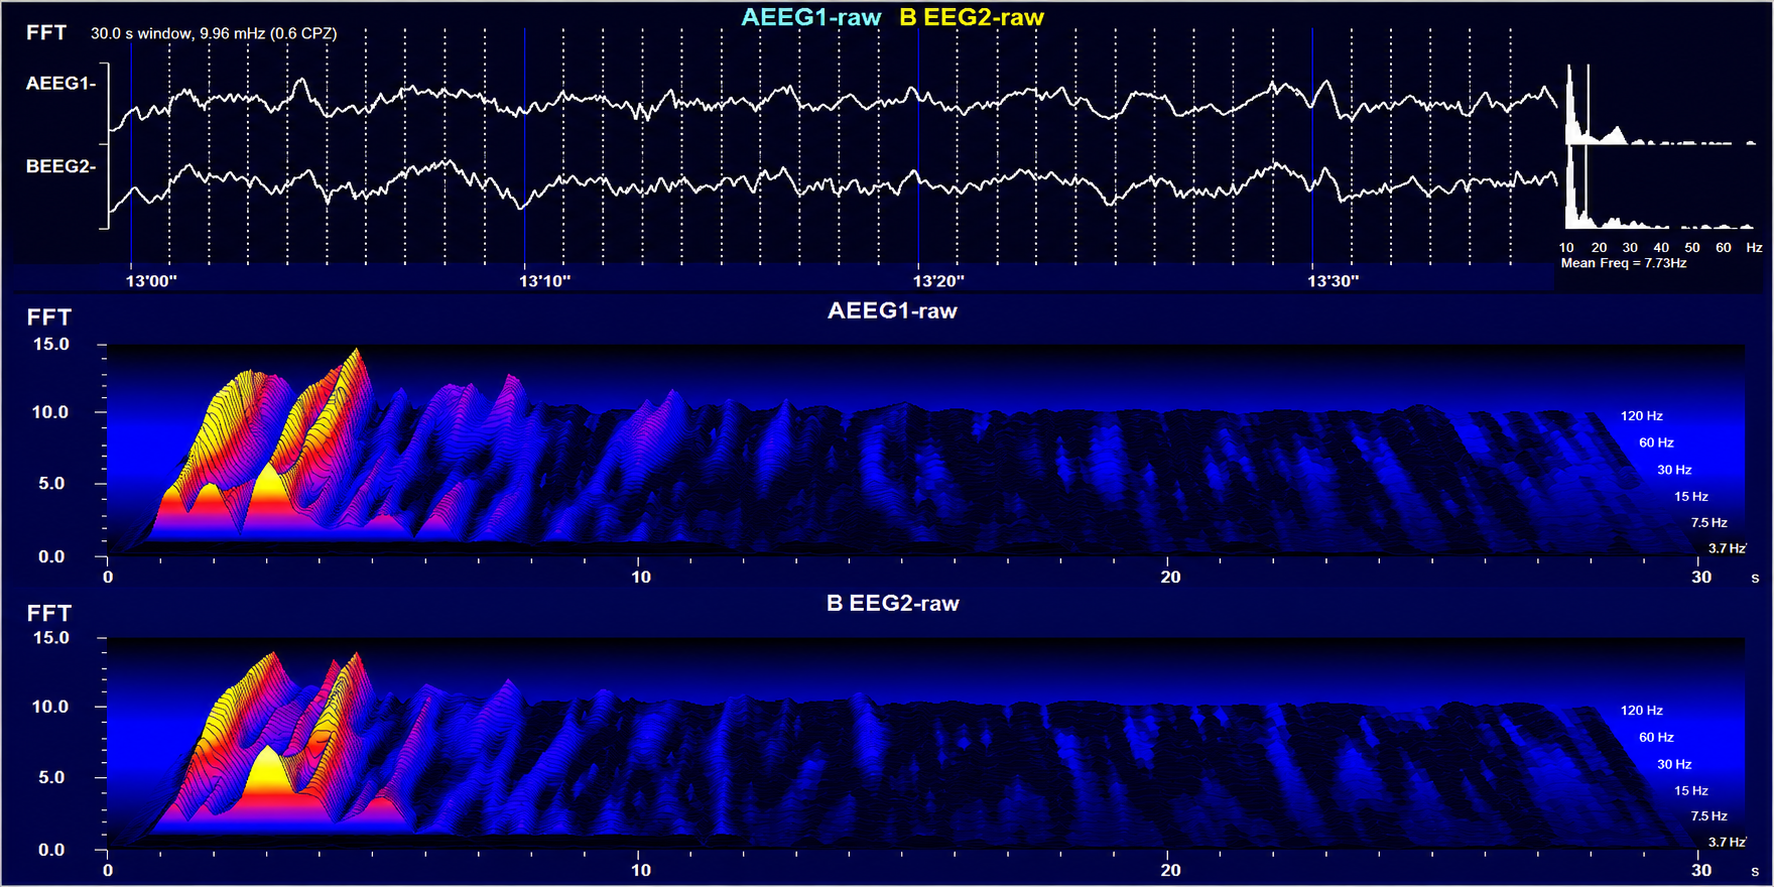
Stage 1 sleep graphic © John S. Anderson. A two-channel display: raw EEG from AEEG1 and BEEG2 across a 30-second window, above waterfall spectrograms for each channel whose logarithmic frequency axis runs from about 3.7 Hz to 120 Hz. The high-power peaks cluster at the low end of that axis and the two channels track each other closely, showing the rise in theta amplitude that marks the drift into Stage 1 sleep. The reported mean frequency of 7.73 Hz sits at the theta-alpha boundary; read the peaks rather than the mean, because it is the shift of power down into theta, not a burst of alpha, that identifies this state.
The less frequent the artifact, the shorter the required recording period. Disable low-pass and high-pass filters before editing to better visualize electro-ocular and SEMG artifacts.
Worst case, as with a hyperactive child, none of the EEG channels may contain usable data, and you will need to repeat the assessment. Where artifact only contaminates a few channels, you may base assessment on the clean channels (Demos, 2019).
Strategies to Reduce Artifact
Demos (2019) recommends several precautions to reduce artifact in raw EEG recordings. Demonstrate how to create artifacts for your clients using screen displays while they clench their teeth, move their eyes, blink, swallow, and fidget. Confirm the cap fits properly, and use reclining chairs with negligible neck cushioning that can force the head downward to minimize SEMG artifact. Limit eyelid movement with cotton balls gently touching the closed eyelids, secured by a loose sleep mask, flexible band, or tape in the eyes-closed recording, ensuring there is no pressure against the eyes.
Ensure that impedance values or DC offset values are appropriate for your amplifier, since values under 5 Kohms are expected for publishable research, while values of less than 20 Kohms are acceptable for general clinical sessions and do not require excessive skin abrasion. Only record qEEG data when the raw waveforms appear clean.
EEG Apparatus
An electroencephalograph consists of several stages that work in sequence: a differential amplifier, gain amplifier, analog-to-digital converter, digital and FFT filters, and optical isolator. Each stage performs a specific function in the signal chain, and a problem at any stage can compromise the quality of your recording.
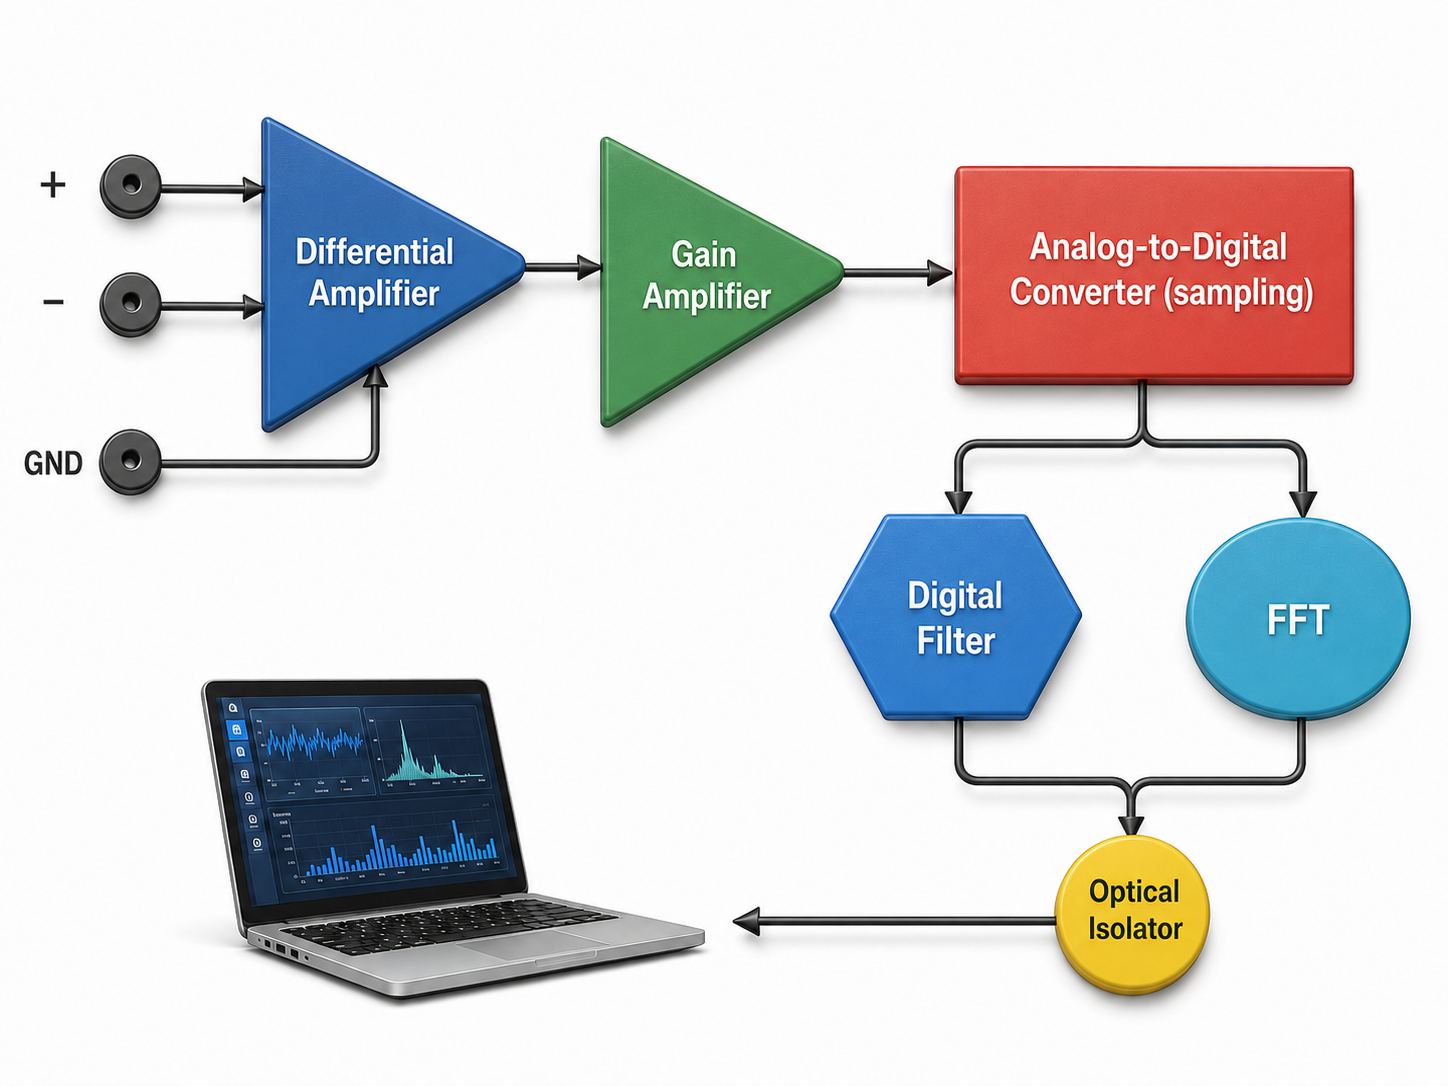
Signal Amplification
The biological signals monitored in biofeedback are extremely weak—EEG signals, for example, are measured in microvolts (millionths of a volt). These signals must be amplified over several stages to isolate the signal of interest and then drive visual or auditory displays. Think of a stereo amplifier that boosts an audio signal above the noise floor to levels that can power loudspeakers—your EEG amplifier performs essentially the same task.
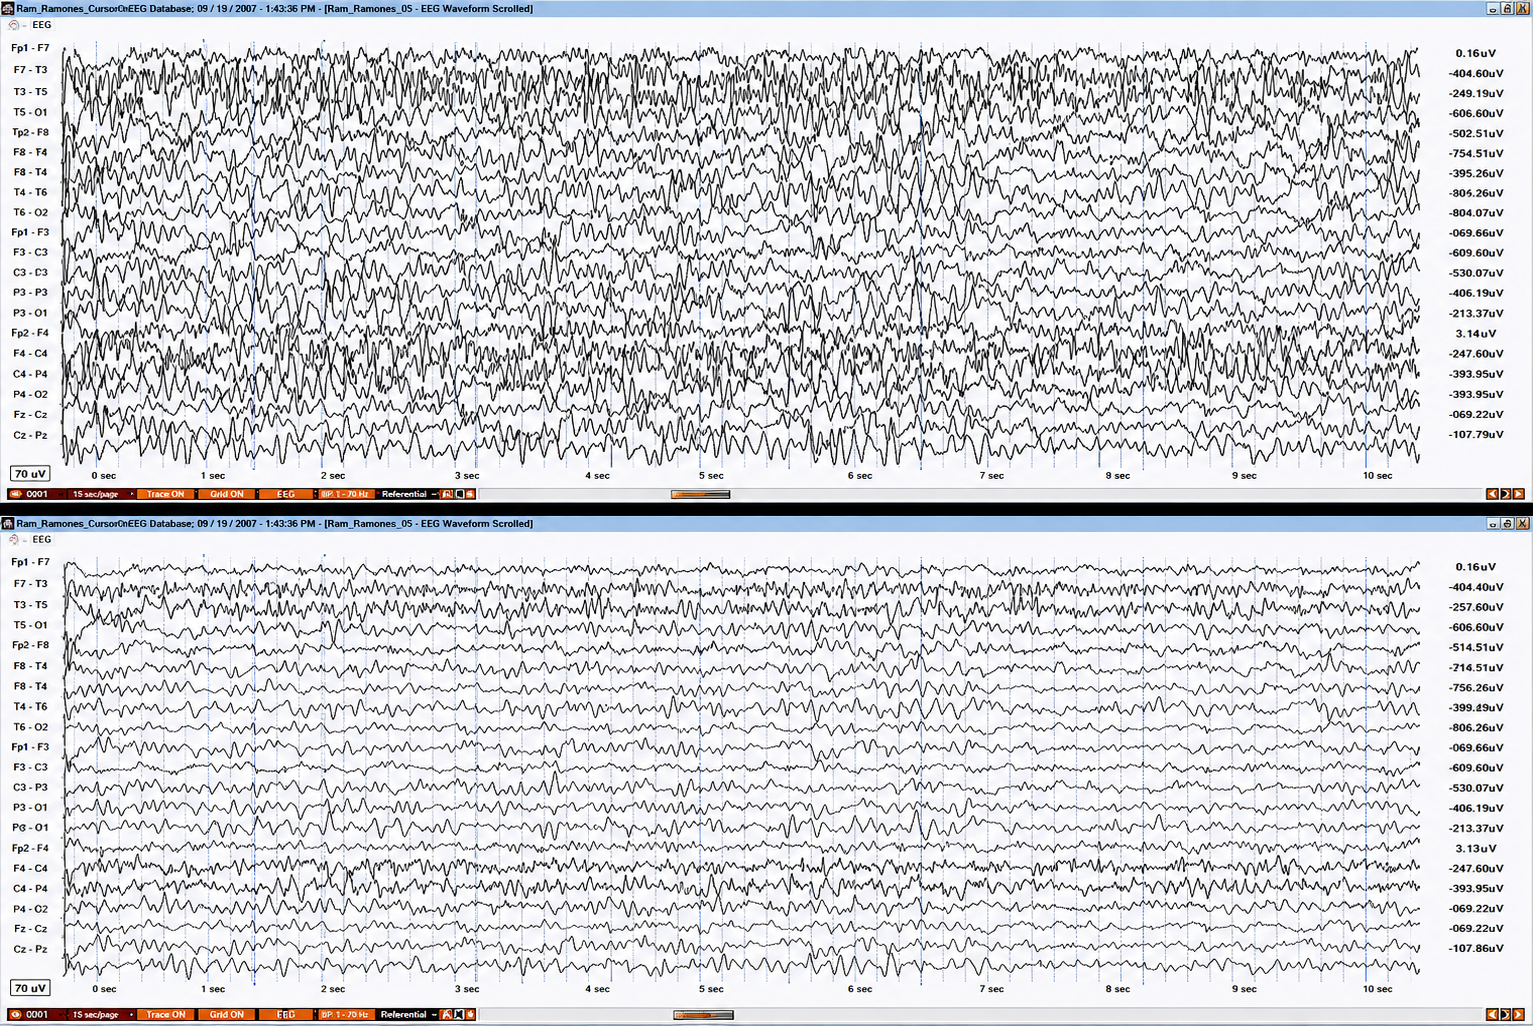
The display of the EEG waveform is affected by the amplifier's input sensitivity setting. Sensitivity is measured as microvolts of amplitude per millimeter of deflection (µV/mm). A lower sensitivity setting, such as 3 µV/mm, produces larger-appearing EEG waves than a higher setting, such as 10 µV/mm.
In the graphic below, the top frame shows the lower setting, in which fewer microvolts of amplitude are needed to move the tracing 1 mm. The bottom frame shows the higher setting, in which more microvolts of amplitude are required to move the tracing the same distance, so the waveform appears smaller. Do not confuse this display sensitivity, expressed in µV/mm, with an amplifier's input voltage range, which is the largest input the amplifier can accept without clipping; some manufacturers use the word sensitivity for that specification as well.
Gain is an amplifier's ability to increase the magnitude of an input signal, expressed as the ratio of output to input. An amplifier that produces a 1-mV output from a 1-μV input has a gain of 1,000.
Differential Amplifiers
Differential amplifiers help to separate genuine EEG signals from artifacts—one of the most critical functions in the entire recording chain. The concepts of common-mode rejection and differential input impedance directly affect the accuracy of every neurofeedback session.
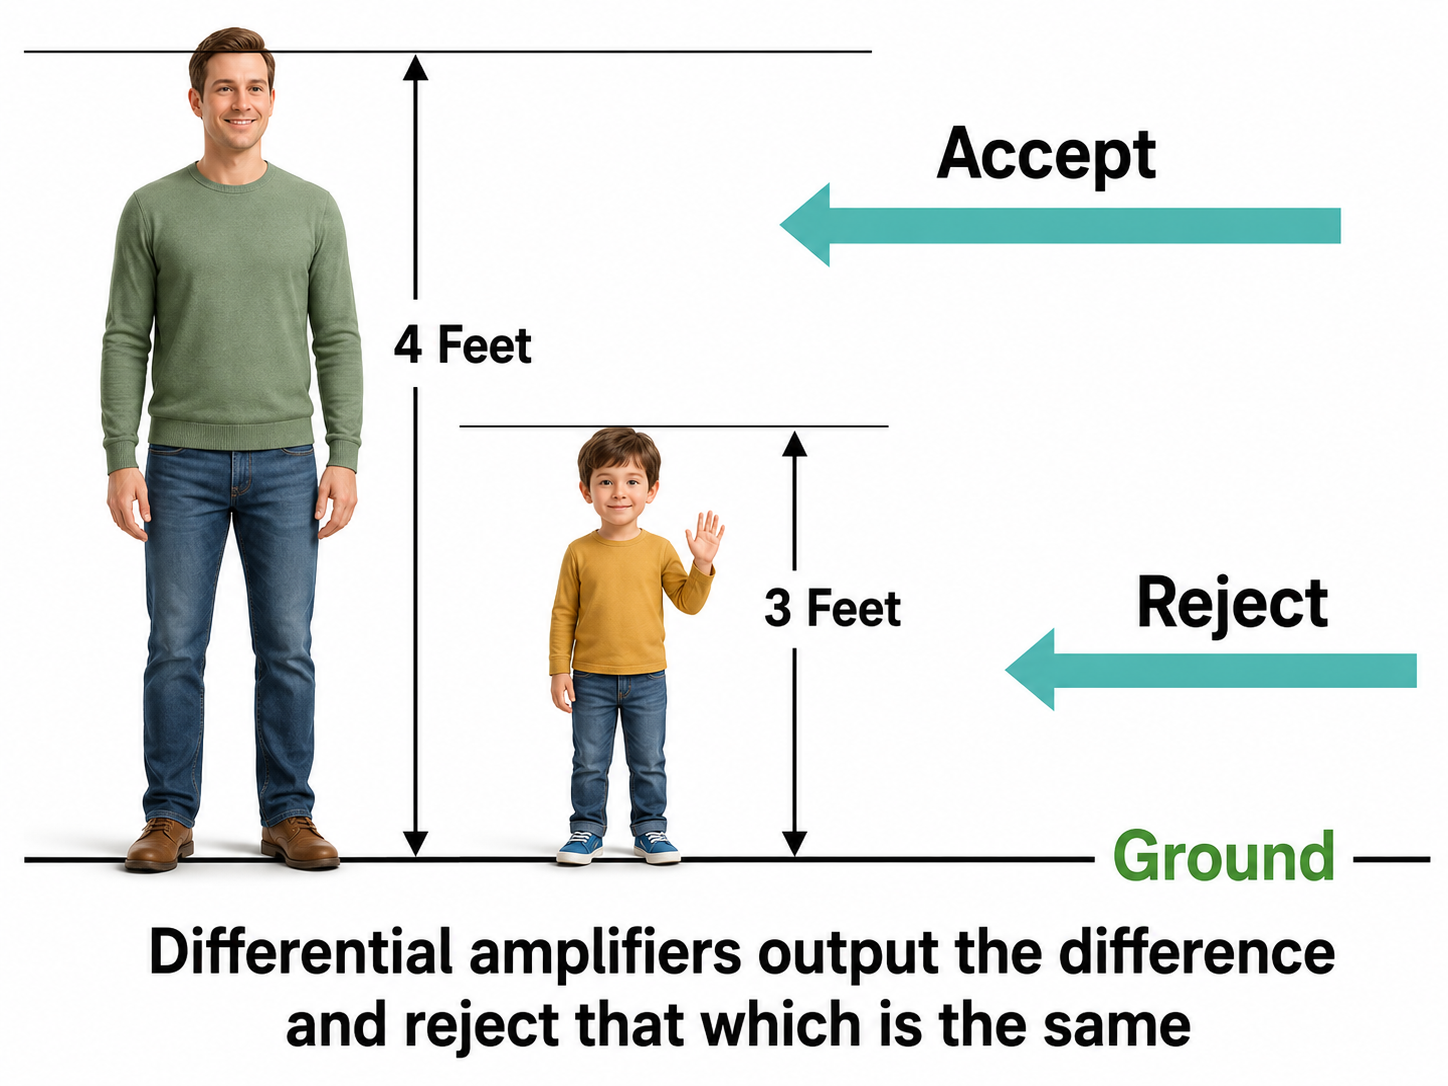
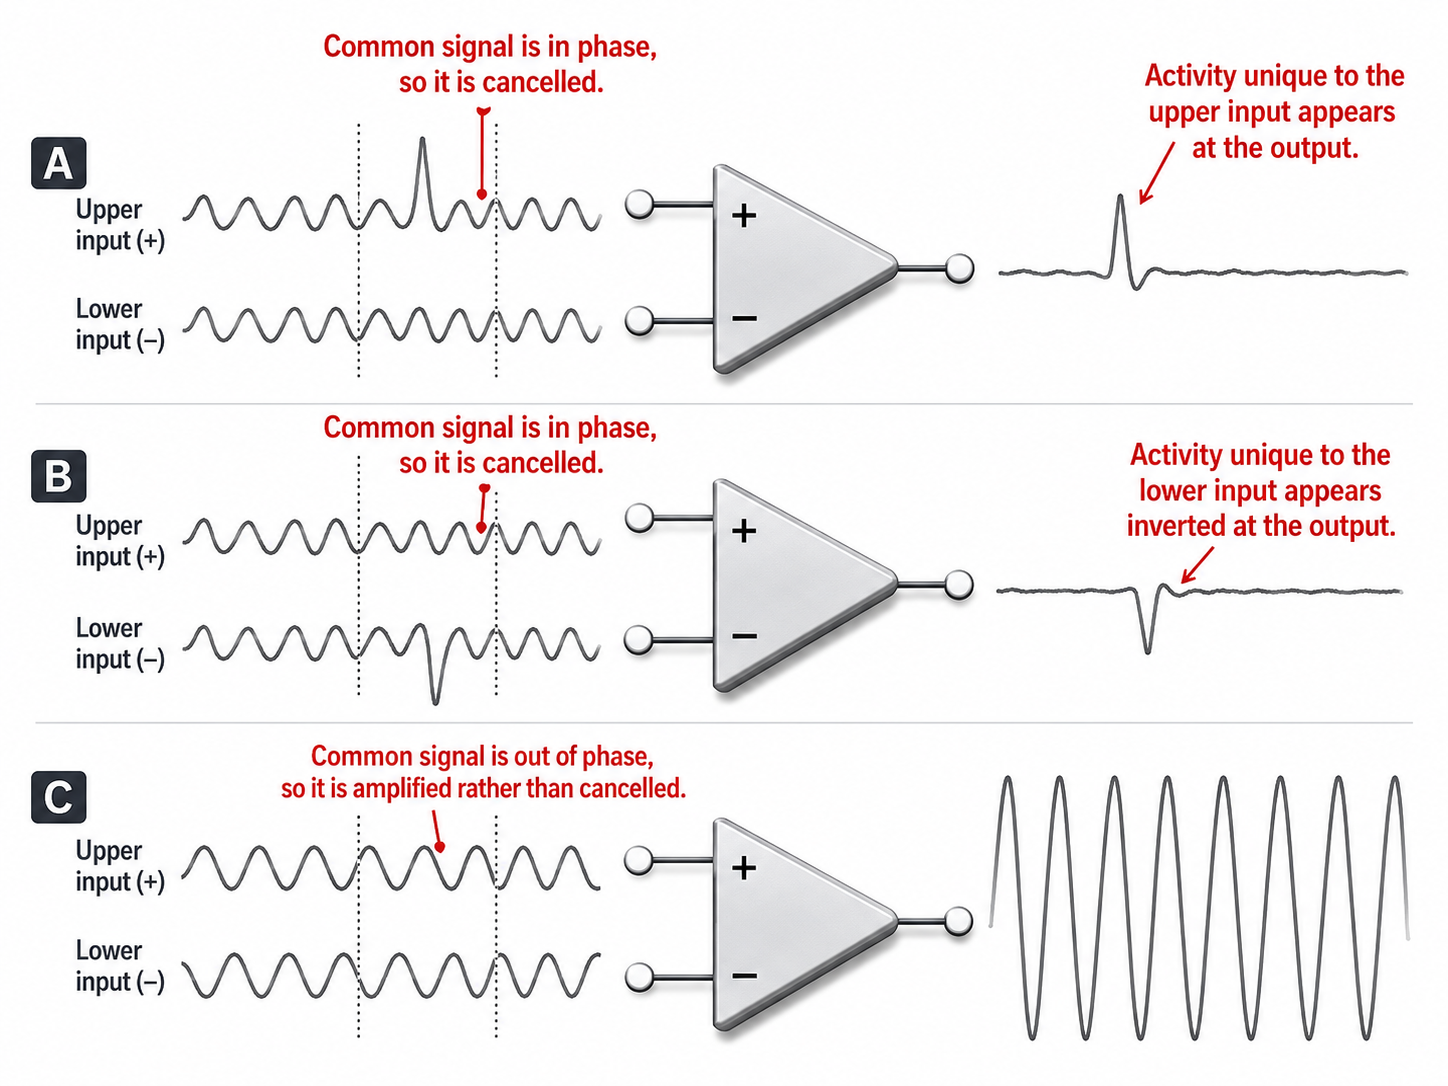
The EEG signal is first boosted by a differential amplifier (also called a balanced amplifier) and then by a gain amplifier. The differential amplifier amplifies the difference between its two inputs: the active (input 1) and reference (input 2).
One input is non-inverting and the other is inverting, so a voltage common to both inputs is subtracted away while a voltage that differs between them is preserved and amplified.
The portion of the signal that appears with the same amplitude and timing at both inputs is the common-mode signal, typically shared artifact such as power line noise, and the portion that differs between the inputs is the differential-mode signal, which carries the genuine EEG of interest.
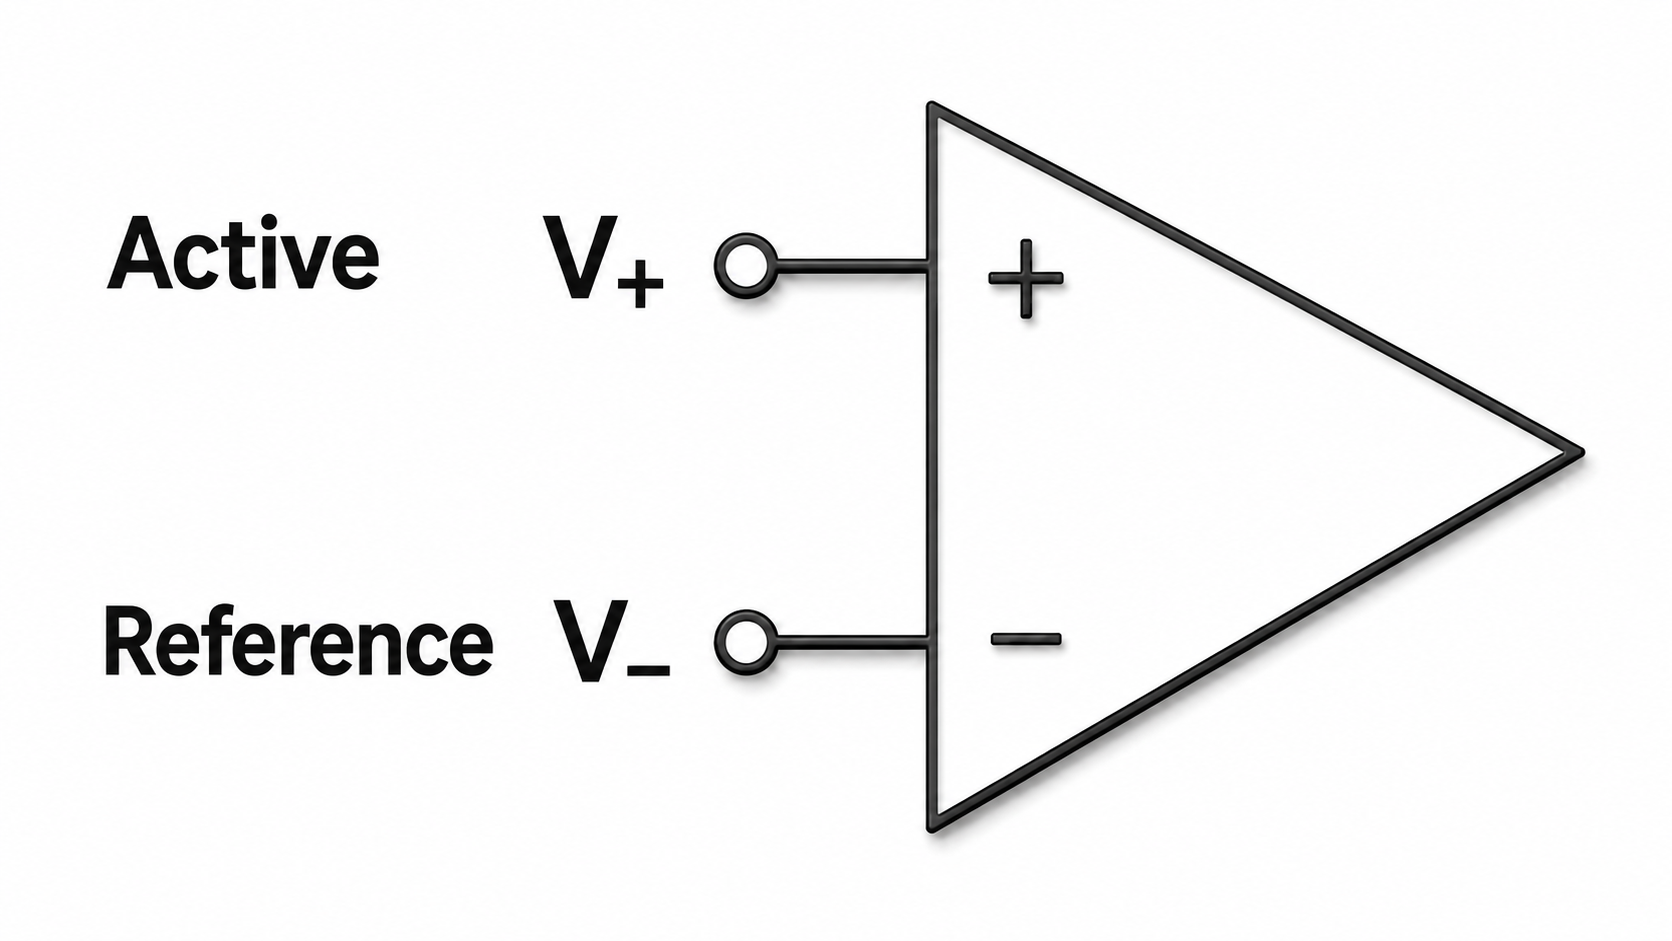
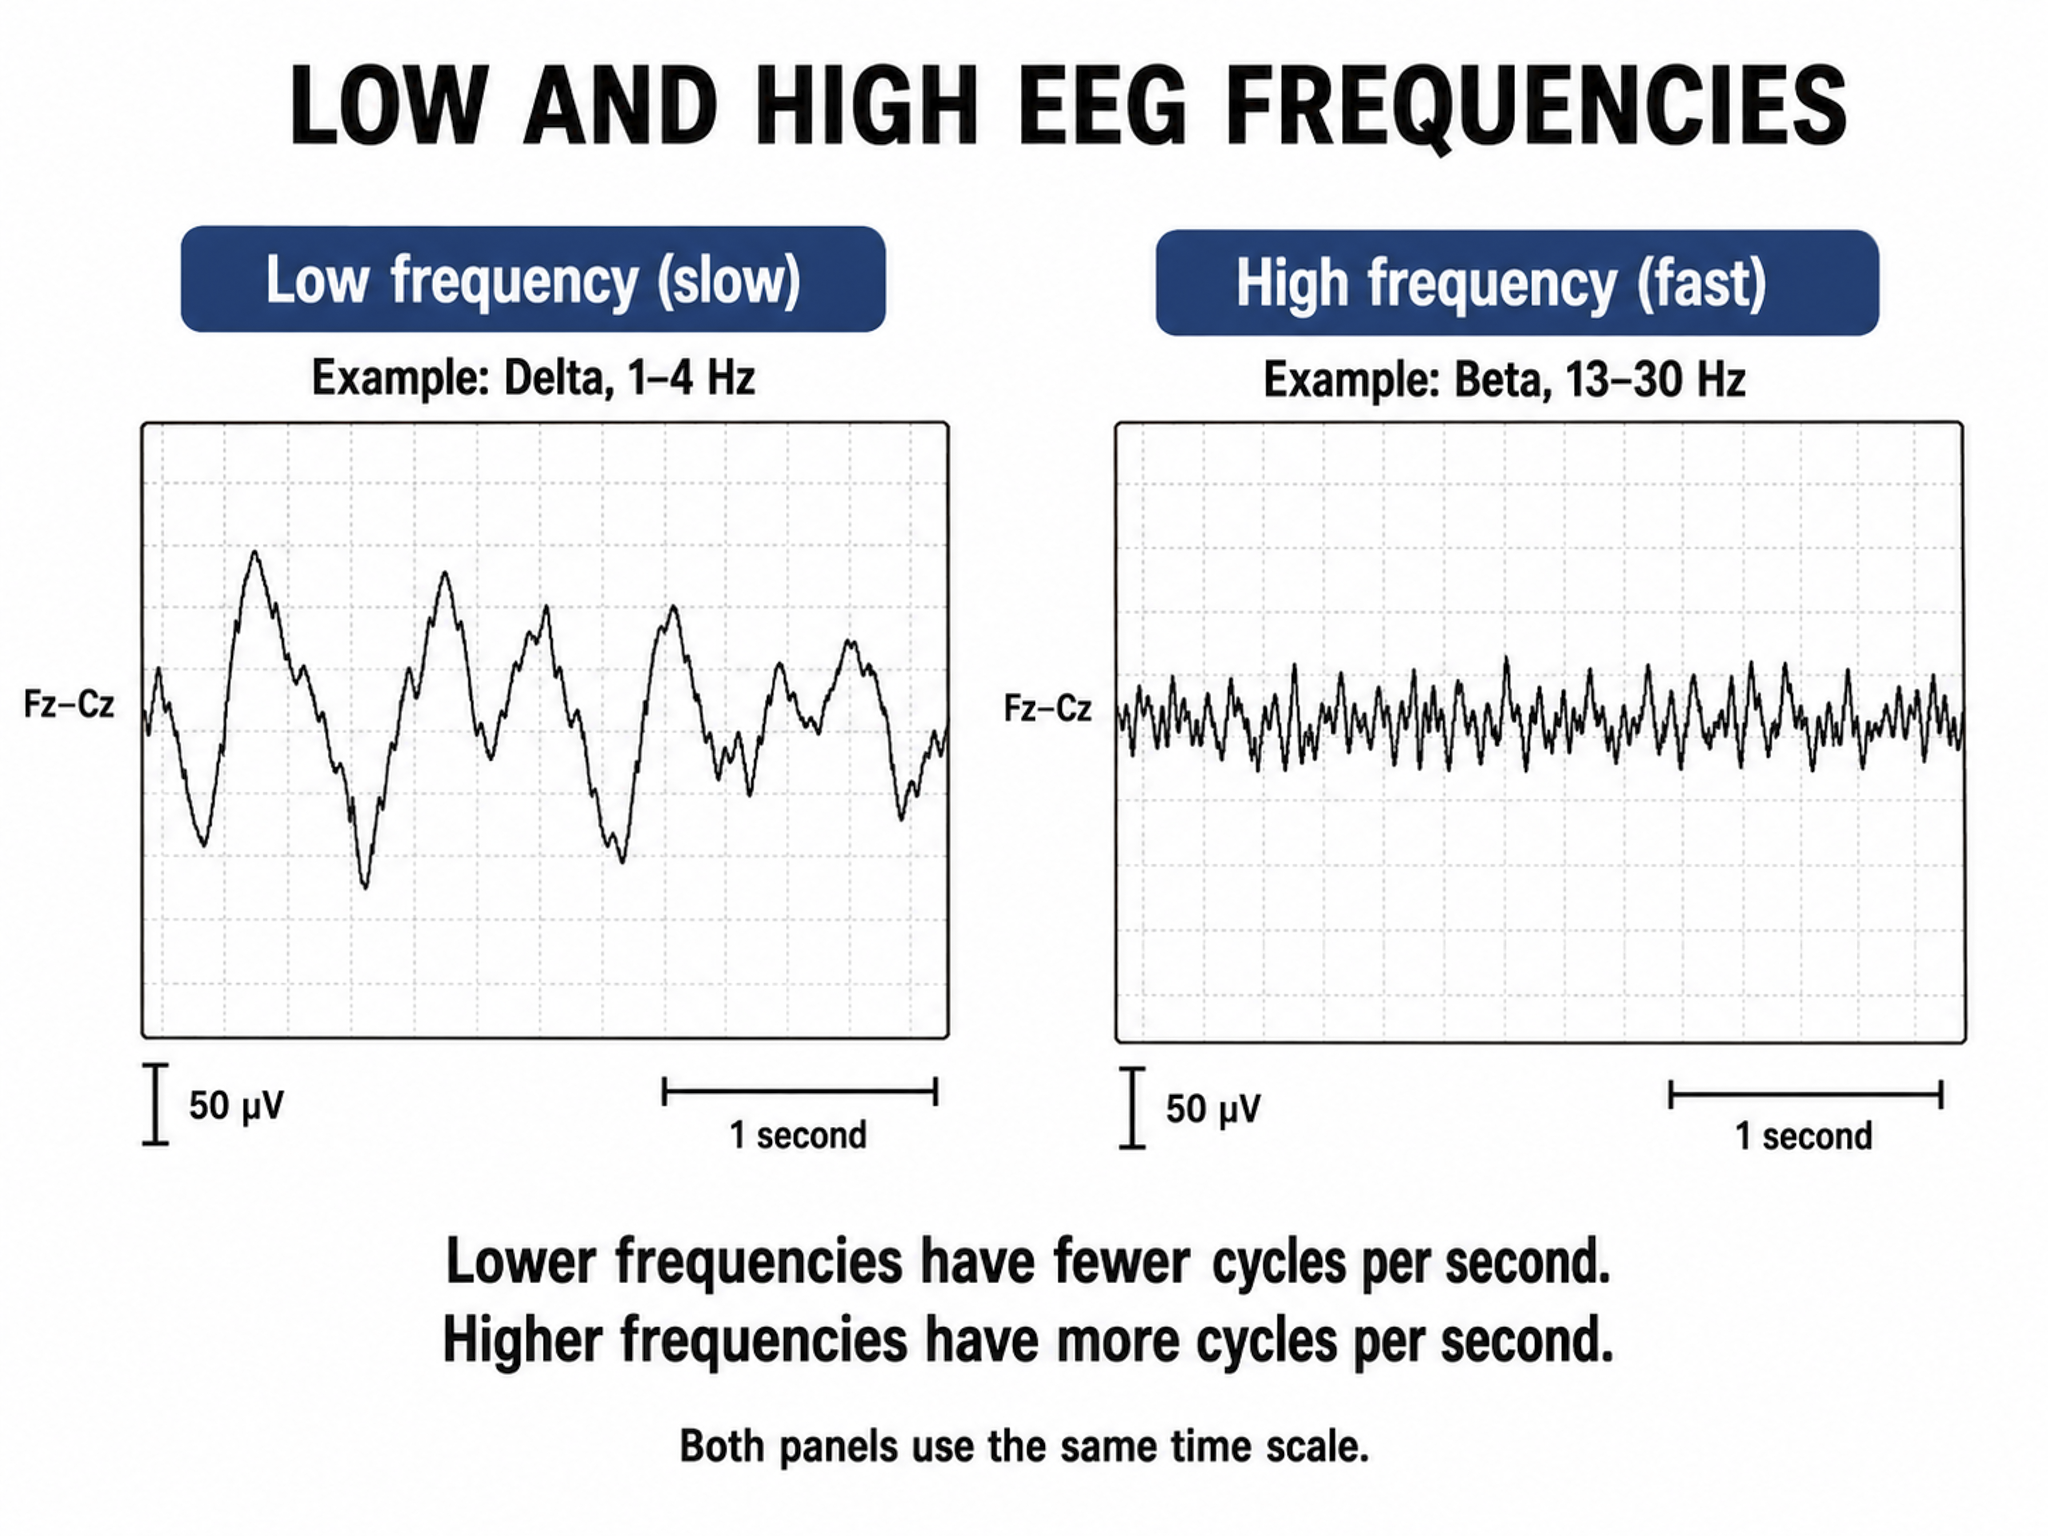
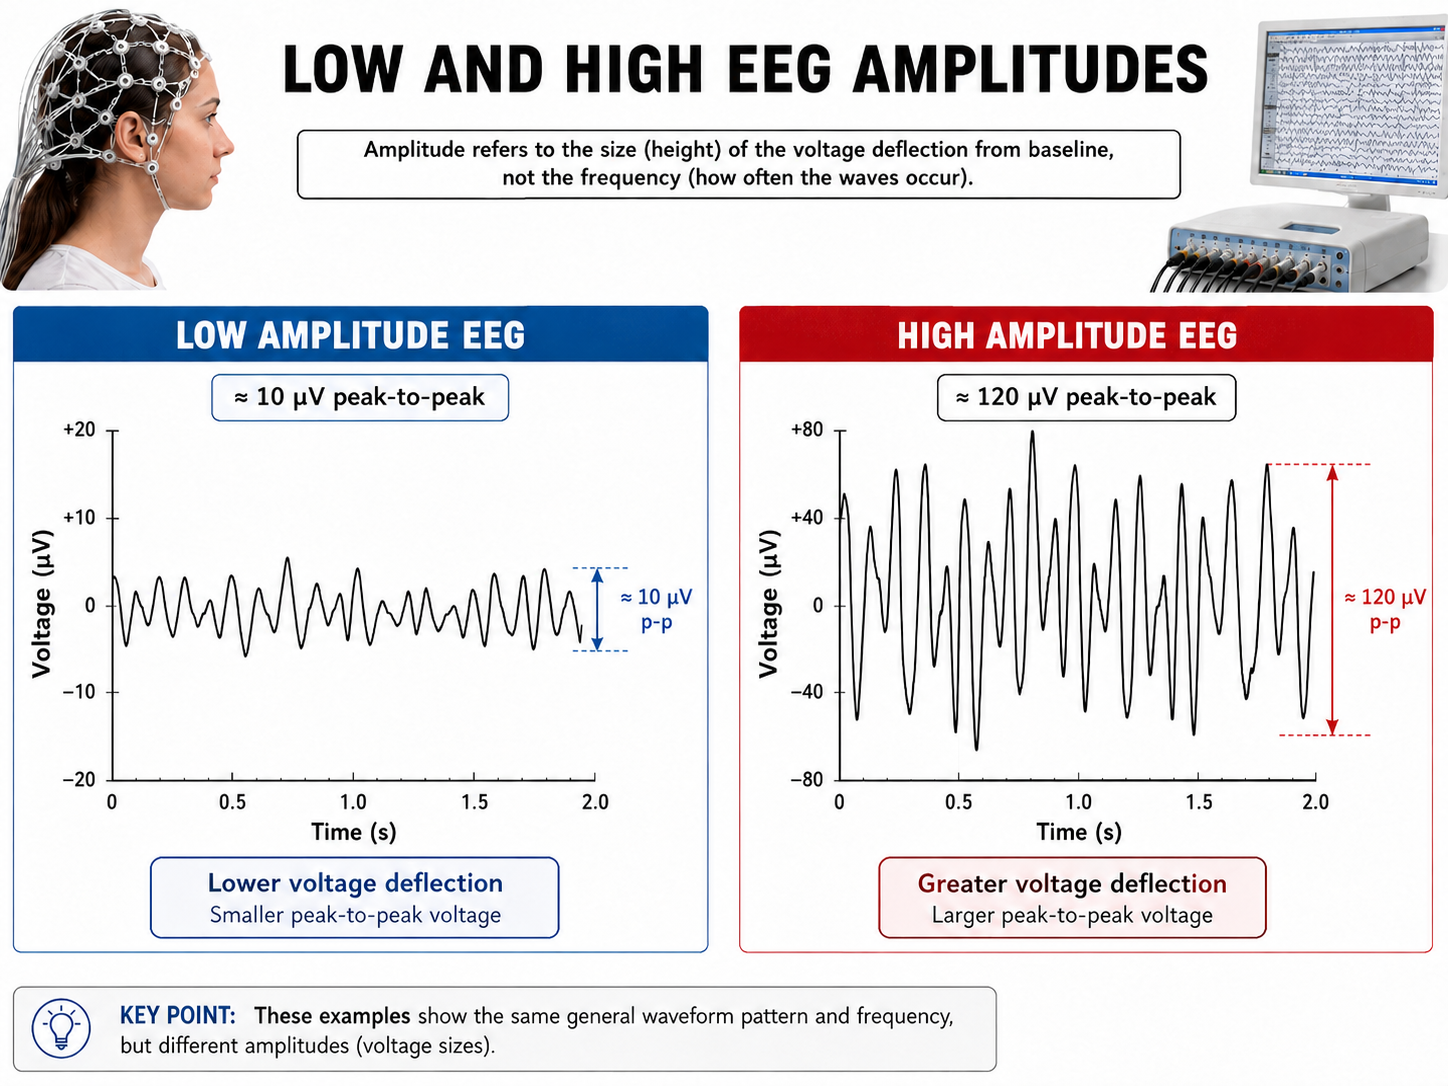
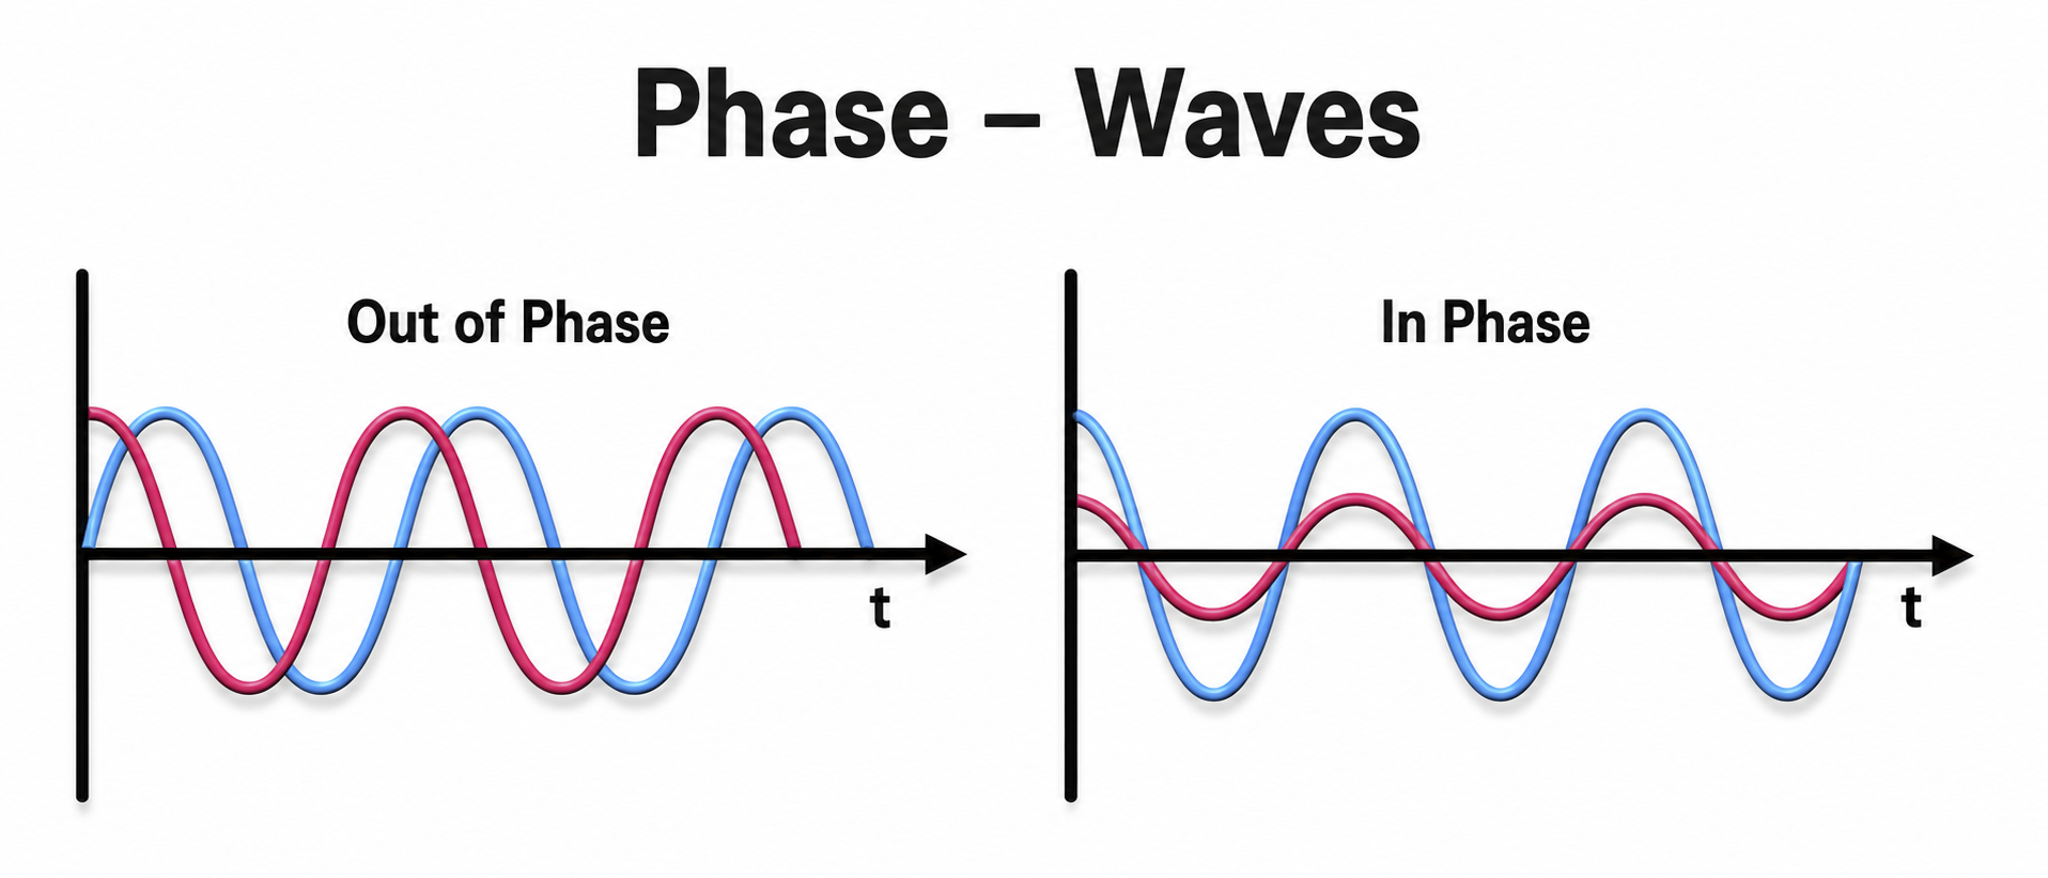
Three signal properties determine what a differential amplifier retains or rejects. Frequency is the number of cycles per second (Hz). Amplitude is the signal voltage or power, measured in microvolts or picowatts. Phase is the similarity in timing of the waves at two locations—signals that are 180° out of phase peak when the other reaches its trough.
How does a differential amplifier use these EEG features to reduce artifact? When no EEG activity is present, identical noise signals reach each amplifier input. The differential amplifier subtracts these signals, canceling out the artifact—the output of a perfect differential amplifier would be zero.
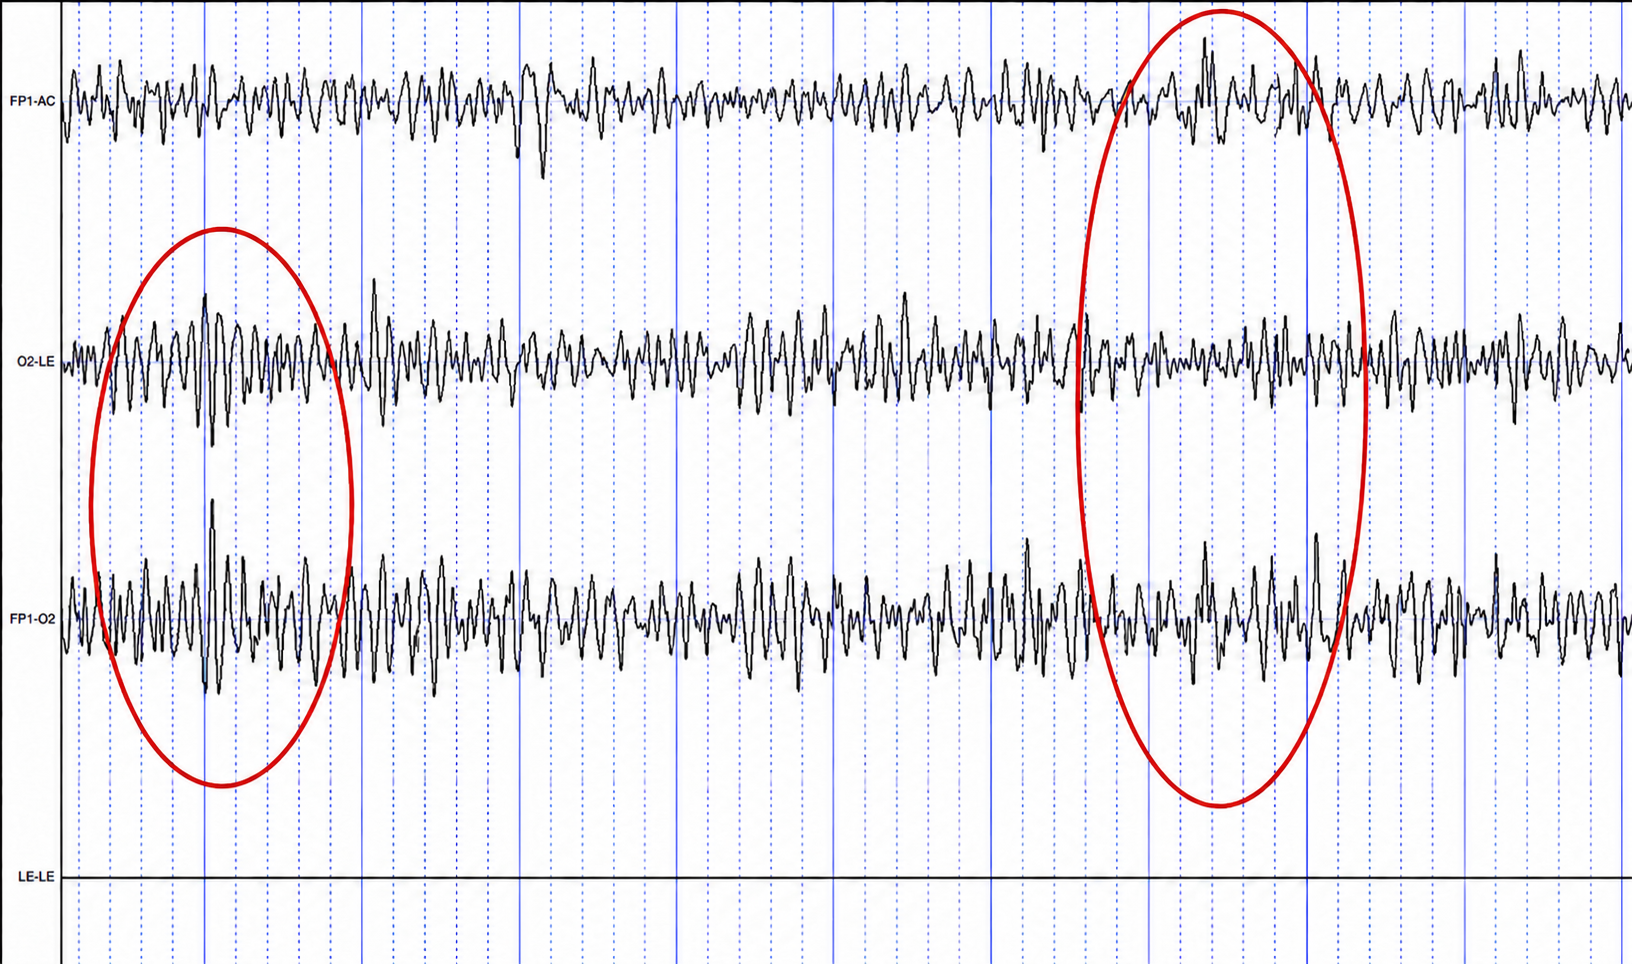
All four tracings below occur simultaneously. On the left portion of the top three traces, the first trace shows low amplitude activity at Fp1 (referenced to linked ears), the second shows high amplitude activity at O2 (also referenced to linked ears), and the third shows the difference between Fp1 and O2 when they are referenced to each other, so that shared activity is subtracted out. Toward the right side of the tracings, the third trace again shows the difference between Fp1 and O2.
The first tracing (Fp1-LE) shows the Fp1 electrode referenced to linked ears with an event circled in red. The second tracing (O2-LE) shows the O2 electrode, also referenced to linked ears, with a distinct EEG event. In the third tracing (Fp1-O2), in which these two electrodes are referenced to each other, the differences are retained—demonstrating common-mode rejection. Last, the fourth tracing (LE-LE) shows linked ears compared to each other, resulting in complete rejection of the identical signals.
The Effect of Electrode Location on Common Mode Rejection
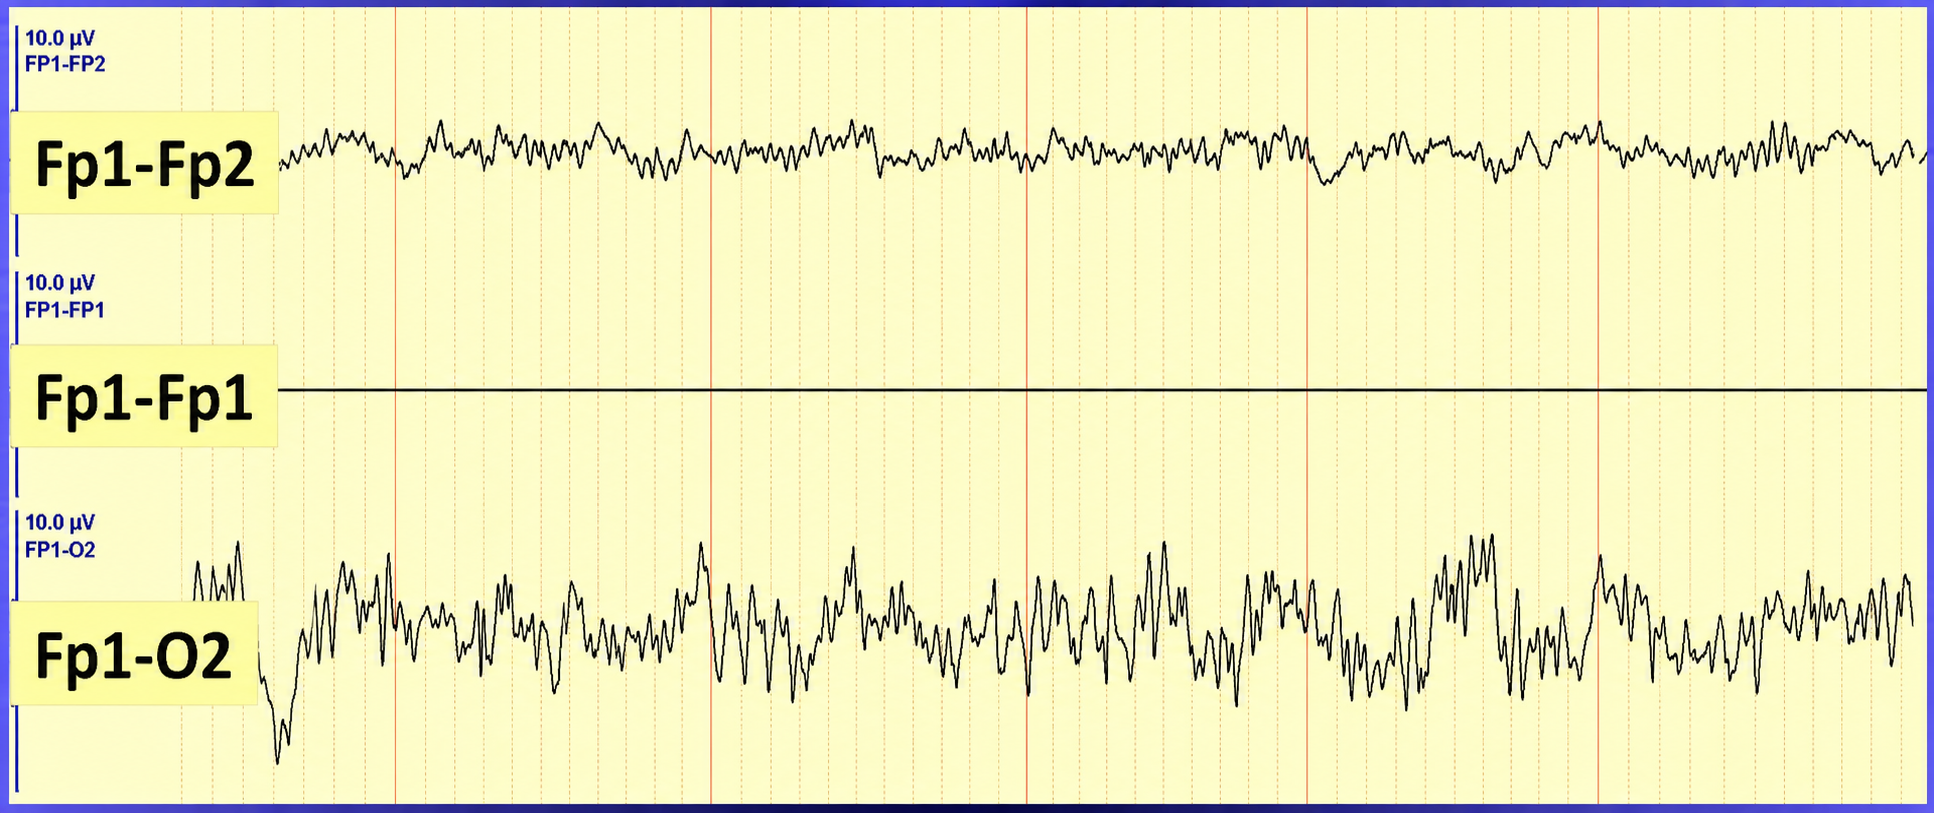
Brain activity is more similar when electrodes are placed close together and less similar when they are farther apart. This means that a differential amplifier may inadvertently reject actual EEG voltages detected by adjacent electrodes—a clinical pitfall worth remembering when choosing montages. In the recording below, sensors were placed at essentially the same anatomical location (labeled Fp1-Fp1) so that both inputs saw nearly identical activity, producing the near-flat line that demonstrates almost complete signal subtraction.
Differential Input Impedance
An amplifier's differential input impedance further reduces the effect of unequal impedances at the skin-electrode interface. As EEG signals enter the amplifier, they are dropped across a network of resistors presenting a differential input impedance in the Gohm (billion ohms) range, with state-of-the-art instruments now exceeding 10 Gohms. The differential input impedance must be at least 100 times the skin-electrode impedance so that 99% or more of the signal reaches the electroencephalograph.
Why is this important? Stronger signals help the amplifier differentiate genuine EEG activity from noise, producing more accurate feedback—which is the entire point of your recording system.
The Challenges of Recording Infra-Slow EEG Activity
Recording infra-slow (0-1 Hz) EEG activity pushes amplifier technology to its limits and introduces unique artifact challenges that clinicians must understand before attempting this type of recording.
AC amplifiers have severe limitations when recording infra-slow signals because client movement, eye movement, sweat, and transient field artifacts produce significant voltage changes that the amplifier cannot distinguish from genuine cortical activity. Long time constants over 80 seconds are recommended to integrate artifact-induced voltages over 2-4-minute periods, but persistent artifacts like eye movement will consistently degrade the signal-to-noise ratio.
Infra-slow recording requires DC-coupled amplifiers with a large dynamic range produced by 24-bit A/D converters to prevent saturation by slow drifts in baseline voltage. Standard EEG electrodes made of gold, steel, or tin are poor choices because they are comparatively polarizable: charge accumulates at the metal-electrolyte junction so the interface behaves like a capacitor, blocking the lowest frequencies and producing unstable baseline drift. Sintered silver/silver-chloride electrodes are preferred because they are only minimally polarizable, passing near-DC potentials with a comparatively stable half-cell potential. No electrode is entirely nonpolarizable.
The clinician must also distinguish slow artifacts from genuine infra-slow signals. Eccrine sweat glands produce standing millivolt-range potentials, and while partial skin puncturing can eliminate these, this practice risks infection transmission. Eye blink and eye movement artifacts can be identified by their characteristic location, while body tilt, cough and strain, hyperventilation, and tongue movements produce high-amplitude diffuse very slow potentials (Miller et al., 2007).
Common-Mode Rejection
A differential amplifier's effectiveness at separating signal from artifact is quantified by the common-mode rejection ratio (CMRR). Since differential amplifiers cancel noise imperfectly, both signal and some noise will be boosted. The CMRR compares how much a differential amplifier boosts the signal (differential gain) versus artifact (common-mode gain): CMRR = differential gain / common-mode gain.
CMRR should be measured at 50/60 Hz, where the strongest artifacts (like power line noise) are found. CMRR is usually expressed in decibels (dB), a logarithmic unit for comparing two amplitude values in which each 20-dB step represents a tenfold difference in voltage.
A widely cited floor for biosignal amplifiers is 80 dB, a 10,000:1 ratio, and neurofeedback sources commonly recommend at least 100 dB, which equals a 100,000:1 ratio and means the signal is boosted 100,000 times more than competing noise. Contemporary commercial EEG amplifiers typically specify roughly 100 to 120 dB at 50/60 Hz, and the best instrumentation-amplifier designs reach about 130 dB. Treat far larger published figures with caution, because the ratio actually achieved in a recording is limited by impedance mismatch between electrodes rather than by the amplifier alone, so a superb amplifier specification cannot rescue a poorly prepared montage.
You can take nine practical steps to maximize common-mode rejection: (1) ensure that skin-electrode impedances are balanced within 1-3 Kohm, since imbalance will make the signals look different and prevent complete subtraction of noise; (2) active electrodes should be equidistant from the artifact source; (3) active, reference, and ground sensors should be the same distance from each other; (4) when using two or more channels, the ground and each active should be the same distance apart; (5) ensure that there is a good ground connection, since a deficient ground lets the common-mode voltage appear unequally at the two inputs, so shared noise is no longer identical and can no longer be subtracted away; (6) identify artifact sources by using a portable electroencephalograph or electromyograph as you would a Geiger counter, moving the unit around the room with EEG sensors connected but held in your hand; (7) remove the artifact sources you find, for example, fluorescent lights can be replaced with fixtures that produce less 50/60 Hz noise; (8) remove unused sensor cables from the encoder so they do not function as an antenna for 50/60 Hz artifact; (9) position the electroencephalograph and electrode cable to reduce artifact reception, using the location and angle that yield the lowest readings when not attached to a patient (Thompson & Thompson, 2015).
Sampling the EEG Signal
This section covers the conversion of analog EEG signals into digital data. Sampling rate and resolution determine how faithfully your digital recording represents the actual brain activity, and choosing the wrong settings can introduce errors that are invisible but clinically significant.
An analog-to-digital (A/D) converter samples the EEG signal at a fixed interval, and the sampling rate—the number of measurements taken per second—must be high enough to represent the signal accurately. According to the Nyquist-Shannon sampling theorem, an A/D converter's sampling rate should be at least twice the highest frequency component you intend to sample.
The theorem sets a floor, not a practical target. An anti-aliasing filter, the low-pass filter that removes frequencies too high to be sampled correctly, does not cut off perfectly at its stated frequency but rolls off gradually, and sampling only slightly above the minimum can leave waveform peaks poorly defined. Guidelines therefore call for an extra margin.
The American Clinical Neurophysiology Society (ACNS) recommends a sampling rate of more than three times the high-frequency filter setting. Assuming a typical 70-Hz high-frequency filter, this yields a minimum of 256 samples per second (sps), with 512 sps preferable (Halford et al., 2016). In practice, 256 sps is the common clinical baseline, and rates of 500-1,000 sps or higher are preferred for detailed analysis of fast activity.
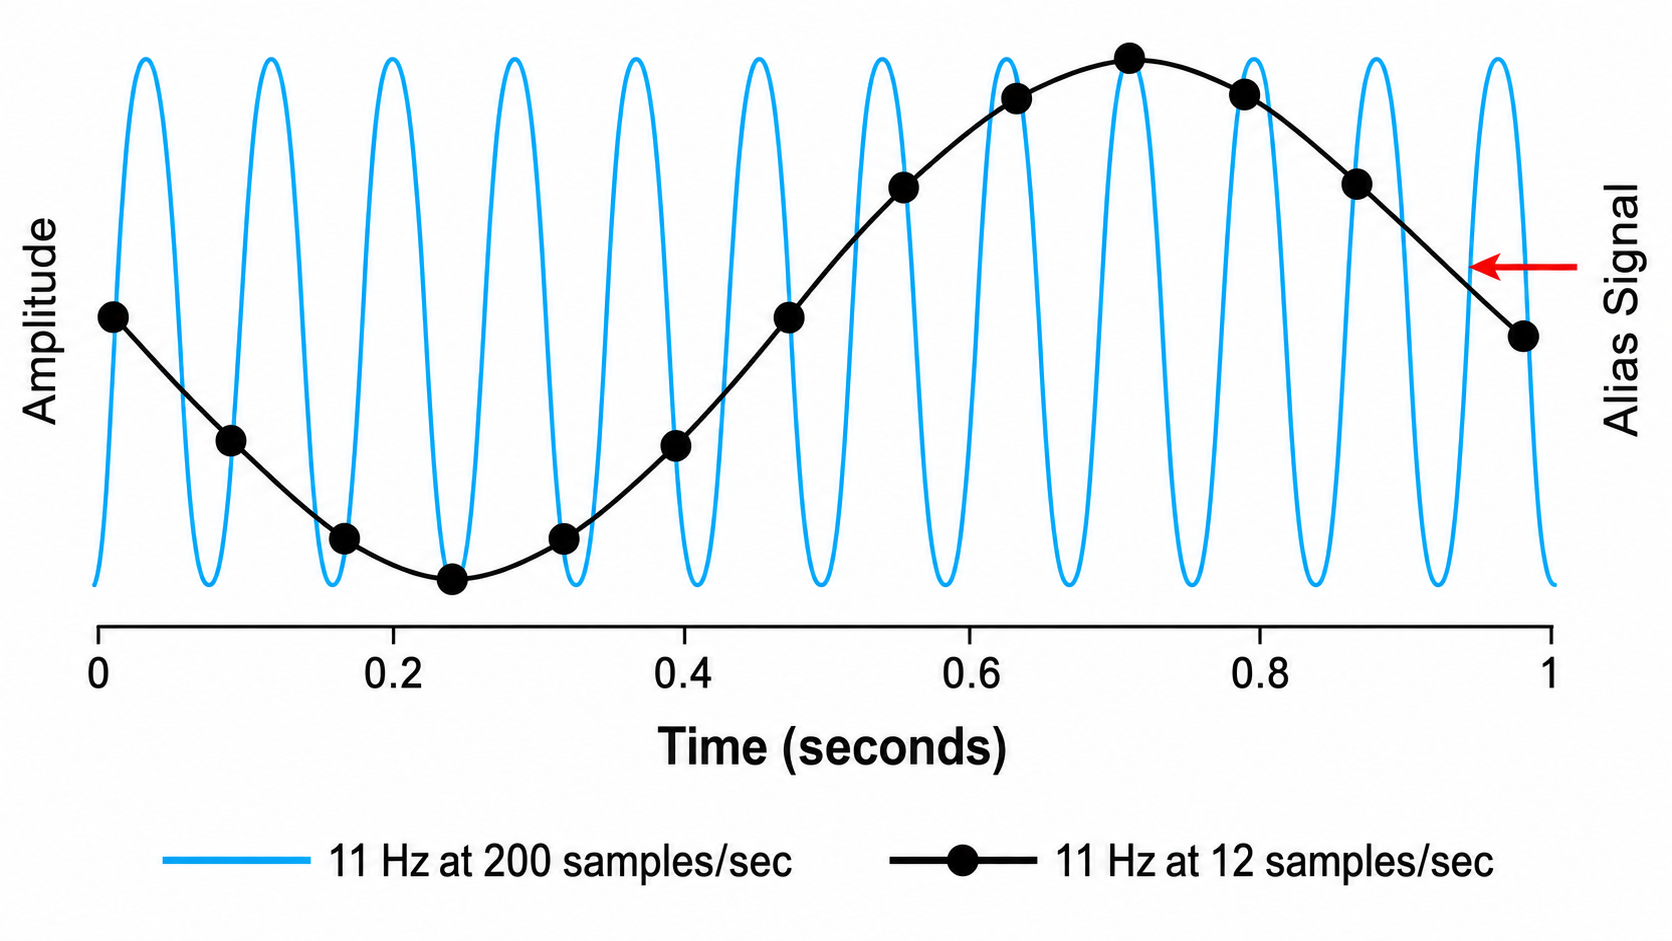
Sampling at rates that are too slow results in aliasing, where an analog signal appears to have a lower frequency than it actually does—producing "phantom" slow activity from too few samples per second. The graphic below illustrates this problem: an 11-Hz signal sampled at 12 sps produces the aliasing signal shown in black, while the same signal sampled at 200 sps is accurately reproduced.
Resolution Depends on Bit Depth
An A/D converter's resolution is limited by the smallest amplitude difference it can represent. The bit number refers to the number of voltage levels an A/D converter can discern. The ACNS (Halford et al., 2016) recommends a resolution of at least 16 bits per sample, which discriminates among 65,536 voltage levels; 24-bit converters are common in modern amplifiers. How fine a resolution this yields in microvolts depends on the amplifier's input range, since the available levels are divided across that range, and 16 bits permits fine amplitude resolution while still recording potentials of several millivolts without clipping. Lower resolutions coarsen the voltage steps, so small genuine changes may be lost or exaggerated by quantization, distorting the clinical picture.
Signal Properties
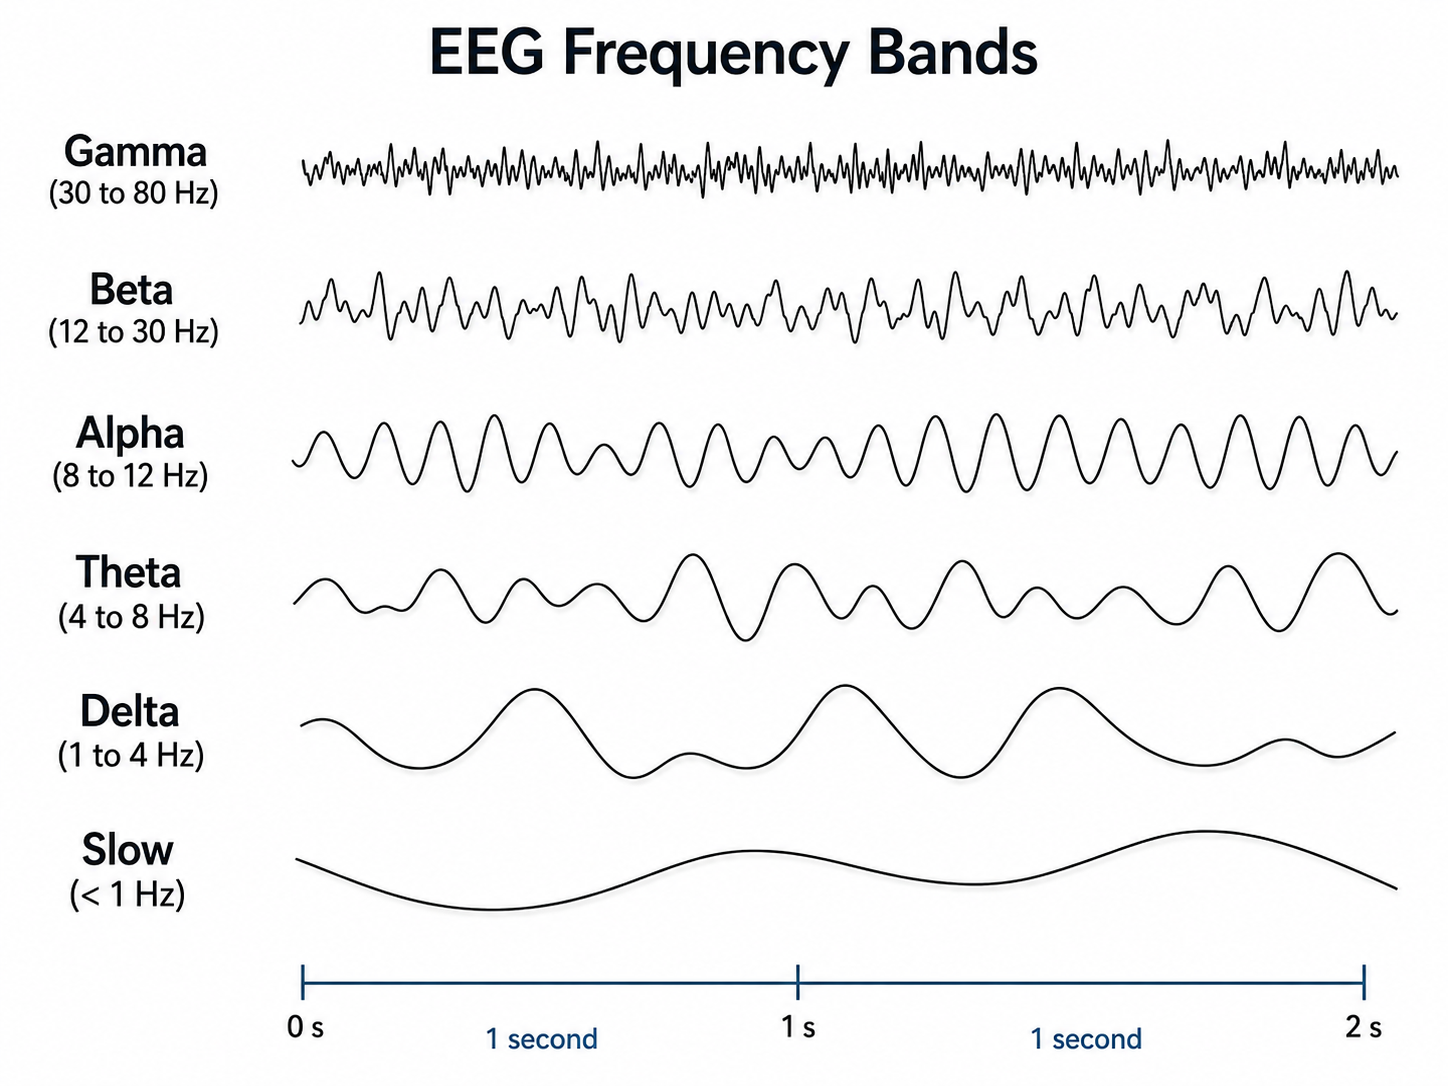
EEG signals are described by their frequency and amplitude. A/D conversion utilizes digital filters to decompose the complex EEG into its component frequencies—much like a prism separating white light into its constituent colors.
.jpg)
The movie below repeats the BioTrace+ /NeXus-32 display of EEG activity from 1-64 Hz broken into component delta, theta, alpha, and beta frequency bands by digital filters © John S. Anderson.
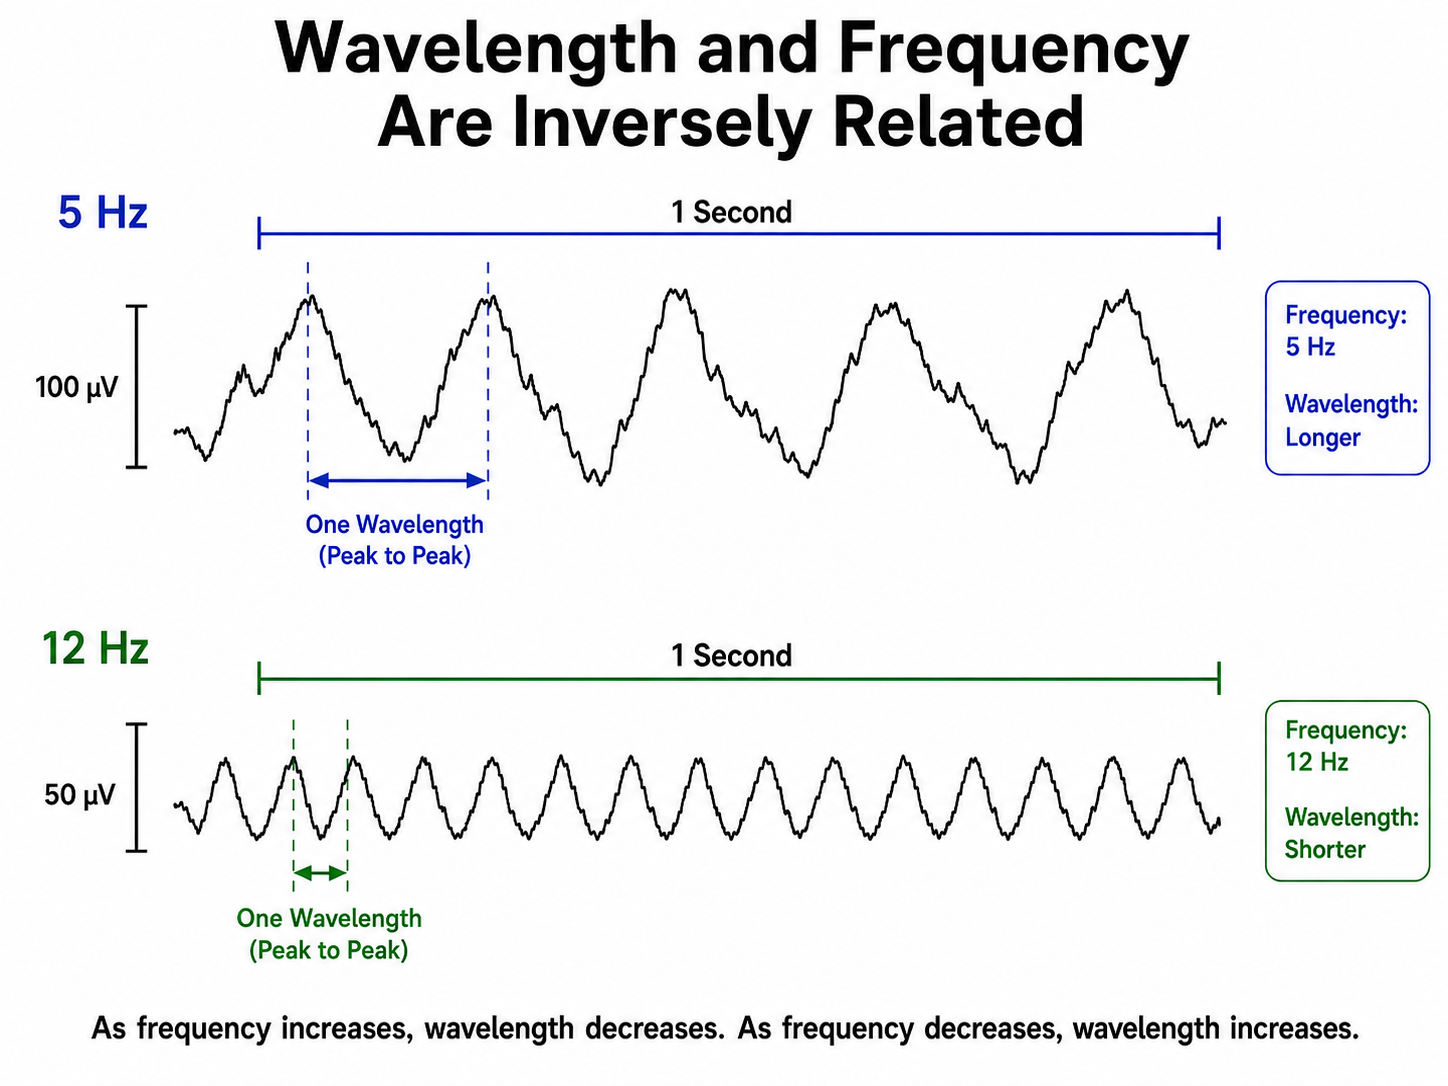
Recall that frequency is the number of cycles completed each second (Hz)—the longer the wavelength, the slower the frequency. The delta, theta, alpha, and beta bands can be defined by wave frequency, wave shape (morphology), and context. Amplitude, meanwhile, represents signal voltage or power and is measured in microvolts or picowatts.
The next graphic illustrates the inverse relationship between wavelength and frequency. The time scale on the horizontal axis is in milliseconds, and the amplitude scales differ for the two tracings.
EEG frequency is measured in cycles per second or Hz, and you can verify it by hand from any tracing on your screen. The zero-crossing method counts how many times the waveform crosses the zero-voltage line within a 1-second interval and divides that count by 2, since every complete cycle crosses zero twice—once ascending and once descending (Anderson, 2025). Counting the peaks that rise above the zero line during the same second yields the same value. Both procedures take only a few seconds and are worth performing whenever a display, a threshold, or an assessment value looks implausible, because they let you confirm the frequency of the activity you are rewarding independently of what the software reports.
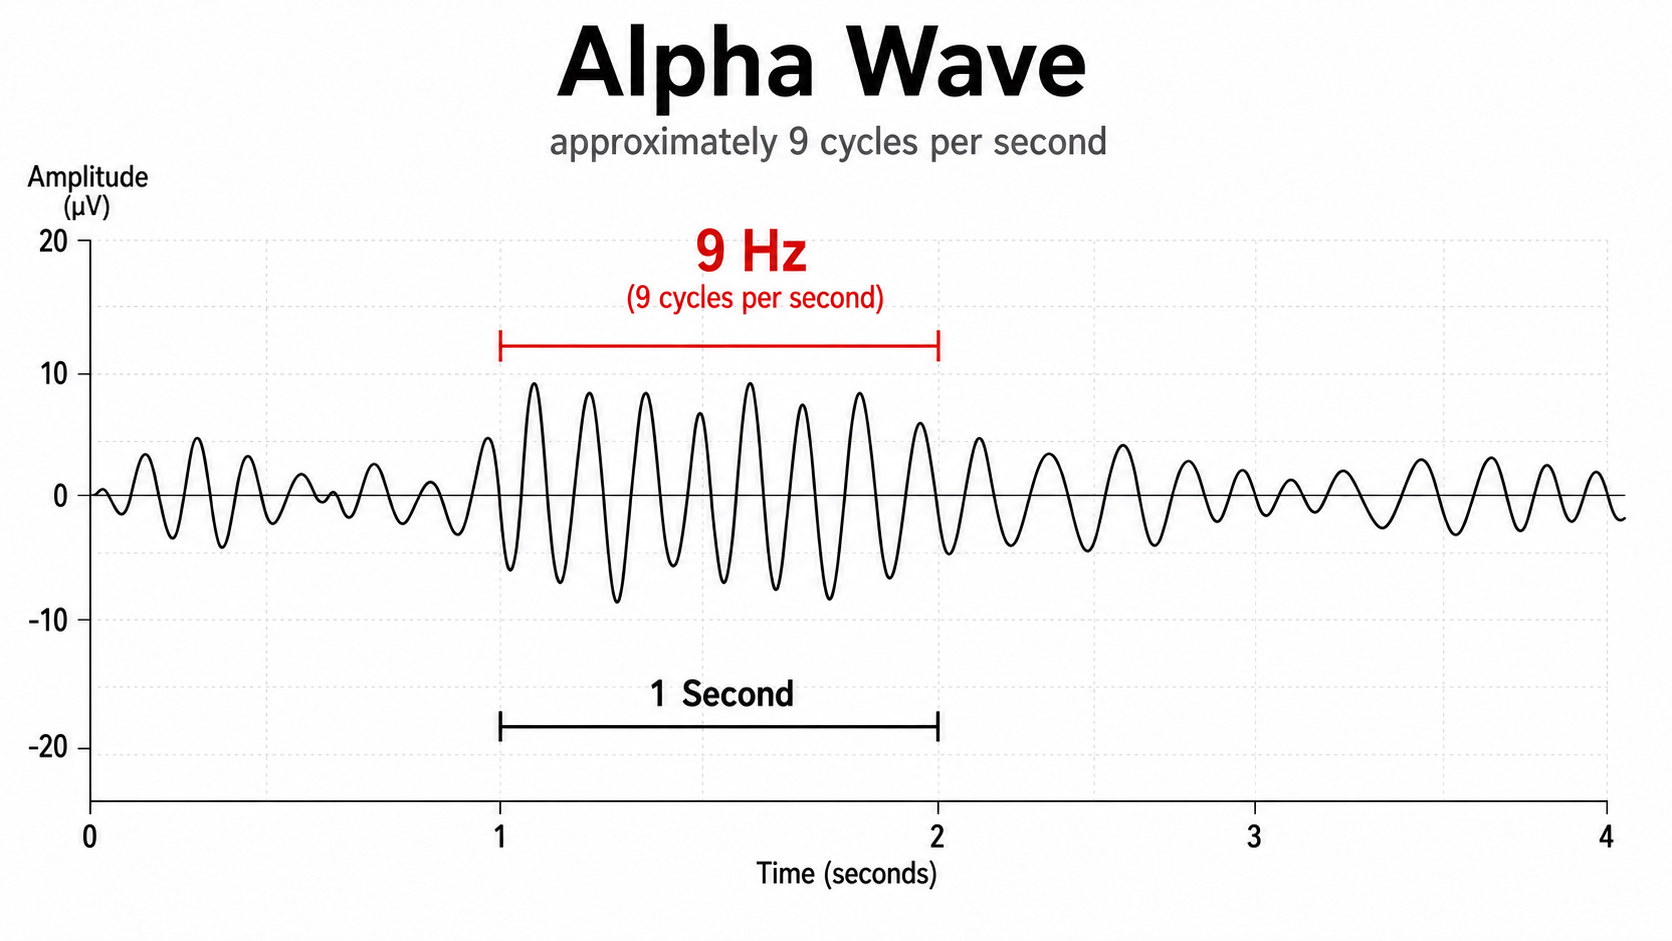
The slower the waves, the lower the EEG frequency.
The EEG signal is sent to an integrator to measure signal amplitude in microvolts (μV) or picowatts, and integrators use four methods to calculate the voltage. The peak-to-peak method provides the largest estimate—the voltage difference between the positive and negative maximum values of the original AC waveform, which is 2 times the peak value. Peak voltage is 0.5 of the peak-to-peak value, root mean square (RMS) voltage is 0.707 of the peak value, and average voltage is 0.637 of the peak value.
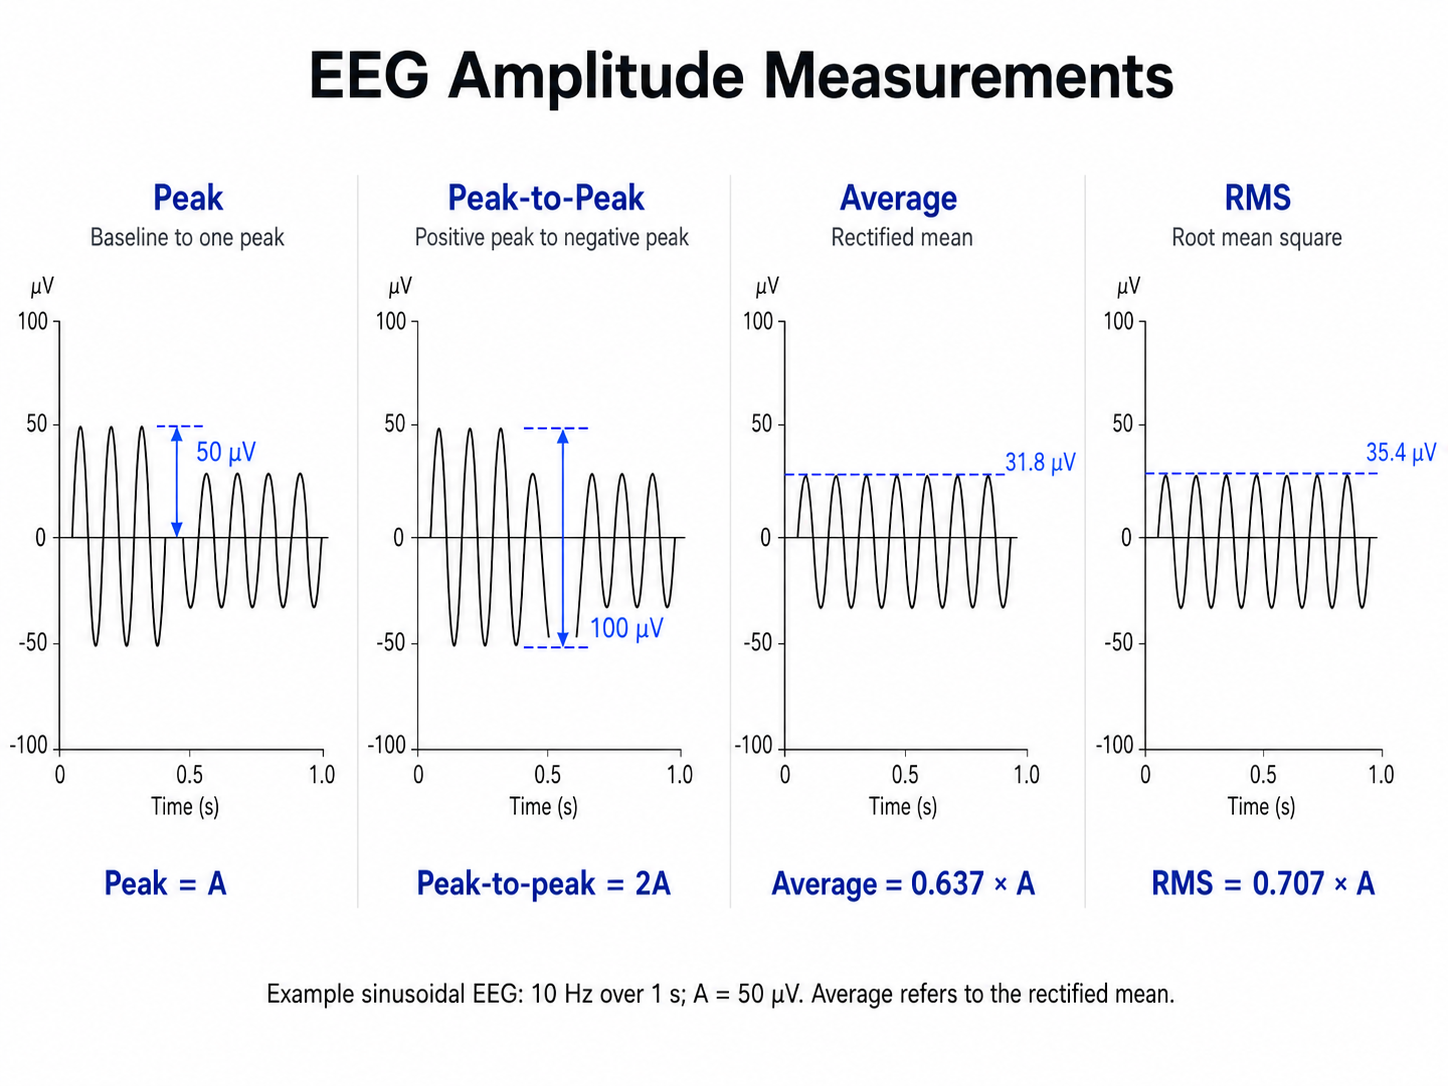
Conversion among these methods is straightforward. If the peak-to-peak voltage is 20 μV, peak voltage is 10 μV, root mean square voltage is 7.07 μV, and average voltage is 6.37 μV. Knowing which method your equipment uses is essential when comparing readings across different systems.
Two cautions apply to these conversions. First, the factors 0.707 (which equals 1 divided by the square root of 2) and 0.637 hold exactly only for a pure sine wave, so they are approximations for the complex, multi-frequency EEG rather than precise values. Second, the RMS value is the measure tied to power, because it represents the steady DC voltage that would deliver the same average power into the same resistance as the alternating signal, which is why RMS is preferred when amplitude is later converted to power.
Keeping Frequency and Amplitude Straight at the Keyboard
Practitioners who grasp frequency and amplitude in the abstract still stumble when they must apply them while a client waits, partly because our field describes one signal with a bewildering number of overlapping terms (Anderson, 2025). A working formulation keeps the two dimensions separate and independent of each other: frequency is how often the wave repeats within 1 second, and amplitude is the amount of electrical activity within that frequency band during that same period (Anderson, 2025). Every other value your software reports—magnitude, power, relative power, ratios, z-scores—is a transformation of one or both of these two measurements, so when a number confuses you, the first question to ask is which of the two it describes and what was done to it.
Frequency answers how fast. Amplitude answers how much. A client whose 8-12 Hz amplitude rises from 8 to 12 μV has not changed frequency at all, and a client whose peak alpha shifts from 9 to 10 Hz may show no amplitude change whatsoever. Protocols, thresholds, and progress notes that blur the two dimensions produce training decisions that cannot be evaluated.
Analog-to-digital conversion sets the ceiling on everything the software can do afterward. The Nyquist-Shannon sampling theorem requires sampling at more than twice the highest frequency of interest; sample too slowly and aliasing invents phantom slow activity that was never in the brain. Bit depth determines resolution, since it fixes how many voltage levels the converter can discern, and how fine that resolution is in microvolts depends on the amplifier's input range. Every EEG signal can be described by three properties: frequency, the number of cycles per second; amplitude, the signal strength in microvolts or picowatts; and phase, the timing relationship between waveforms at two locations. An integrator can express amplitude four ways, and peak-to-peak, peak, RMS, and average voltages are fixed multiples of one another for a pure sine wave and approximations for the complex EEG.
Check Your Understanding
- State the Nyquist-Shannon sampling theorem and explain what aliasing looks like in a tracing.
- How does bit number determine the resolution of an A/D converter?
- Define frequency, amplitude, and phase, and give the unit used for each.
- Rank the four integrator methods from largest to smallest estimate, and give the multiplier for each relative to the peak value.
- Why does a decision made at the acquisition stage limit what any later analysis can recover?
Assignment
Now that you have completed this unit, trace a single EEG signal from a cortical pyramidal neuron to a number on your screen. Name each stage it passes through, and at each stage identify one thing that could go wrong and how you would detect it. Which of those failures would still be visible in the finished topographic map, and which would be invisible?
Glossary
A (auricular): the International 10-20 system letter designating an earlobe reference placement, as in A1 and A2.
active electrode: an electrode positioned at a measurement site whose potential contributes to the recorded differential signal; it is distinct from the reference and ground electrodes.
active electrode (pre-amplified): an electrode carrying a small amplifier at the recording site, buffering the high-impedance contact before cable noise is added.
aliasing: distortion produced when a signal is sampled below the rate required to represent its highest frequencies, causing higher-frequency components to appear at lower frequencies.
amplitude: the magnitude of a signal's excursion from a specified reference level, reported using a stated convention such as peak, peak-to-peak, or RMS.
analog-to-digital converter (ADC): an electronic circuit that samples a continuous analog signal and represents each sample as a digital number.
anti-aliasing filter: a low-pass filter that removes frequencies too high to be sampled correctly, preventing aliasing.
artifact: an unwanted signal component introduced by movement, environmental interference, hardware, processing, or biological activity outside the signal of interest.
average rectified voltage: the mean absolute voltage of a waveform; for a full-wave-rectified sine wave, it equals approximately 0.637 times peak voltage.
bias potential: spurious voltage produced by the exchange of metal ions donated by the electrodes and electrolytes in the absence of a biological current.
bit number: the number of binary digits an analog-to-digital converter uses to represent each sample, setting its resolution; 16 bits discriminates among 65,536 voltage levels.
bridging artifact: electrical coupling between adjacent electrodes caused by conductive gel, sweat, or moisture, reducing their independence and distorting recorded voltage differences.
C fibers: small unmyelinated afferent fibers conducting slowly, commonly about 0.5 to 2 m/s, and carrying polymodal nociceptive, thermal, pruritic, and autonomic information.
channel: one differential amplifier input, formed by a pair of electrodes whose voltage difference is recorded. A single ground electrode is shared across all channels rather than belonging to any one of them.
common-mode rejection ratio (CMRR): the ratio of differential gain to common-mode gain, commonly expressed in decibels, indicating rejection of signals shared by both inputs.
common-mode signal: the portion of a signal that appears with the same amplitude and timing at both inputs of a differential amplifier, typically shared artifact such as power line noise, which the amplifier subtracts away.
conductive gel: a liquid or semi-liquid electrolyte that bridges scalp and electrode to lower and stabilize impedance; used to fill the wells of a wet cap.
conductive paste: a thicker electrolyte, such as Ten20™, that both conducts and helps hold a cup electrode in place on the scalp.
continuity test: an electrical test determining whether a low-resistance conducting path exists between two points.
decibel (dB): a logarithmic ratio unit equal to 10 log₁₀ of a power ratio, or 20 log₁₀ of an amplitude ratio when impedances are equivalent.
differential amplifier: an amplifier that outputs a gain-scaled difference between two input voltages while suppressing voltage common to both.
differential input impedance: the impedance presented between the two signal inputs of a differential amplifier.
differential-mode signal: the portion of a signal that differs between the two inputs of a differential amplifier, which carries the genuine EEG of interest and is preserved and amplified.
digital filter: an algorithm that transforms sampled data to attenuate or emphasize selected frequency components.
display resolution: the smallest distinguishable change or level shown by a display.
dry electrode: an electrode designed to record without conventional conductive gel or paste, often using direct contact, pins, or capacitive coupling.
electric power (W): the rate of energy transfer, equal in a DC circuit to voltage multiplied by current and measured in watts.
electrode: a conductive interface that transduces ionic current in tissue or electrolyte into electronic current in a recording circuit, or the reverse.
electrode cap: a head-worn array that positions EEG electrodes at standardized or predefined scalp locations.
electrode impedance meter: an instrument that applies a small test signal to estimate electrode-skin impedance.
F (frontal): the International 10-20 system letter designating sites that detect frontal lobe EEG activity.
Fp electrode sites: frontopolar scalp locations designated Fp1, Fpz, and Fp2 in the international 10–10 system; the 10–20 system uses Fp1 and Fp2.
frequency: the number of complete cycles of a periodic phenomenon per unit time, expressed in hertz for cycles per second.
gain: an amplifier's ability to increase the magnitude of an input signal to create a higher output voltage; the ratio of output/input voltages.
ground electrode: an electrode connected to the recording system's common or driven-ground circuit to reduce common-mode interference; it is distinct from the reference electrode.
half-cell potential: the small voltage produced at a single electrode-electrolyte contact as ions cross the junction; the main contributor to DC offset and the basis of the battery effect.
impedance (Z): frequency-dependent opposition to alternating current, comprising resistance and reactance and measured in ohms.
infra-slow activity: EEG activity below 0.1 Hz, recorded with DC-coupled amplifiers, high-resolution A/D conversion, and minimally polarizable electrodes such as sintered silver/silver-chloride.
inion: the most prominent point of the external occipital protuberance at the posterior skull.
input sensitivity (display sensitivity): the display scaling of an EEG tracing, expressed as microvolts of amplitude per millimeter of deflection (µV/mm), where a lower setting makes waveforms appear larger. Distinguish it from an amplifier's input voltage range, which some manufacturers also call sensitivity.
international 10–20 system: a standardized method for locating EEG electrodes at intervals of 10% or 20% of measured head distances; the original array includes 19 scalp and two auricular sites, with ground specified separately.
microvolt (µV): a unit of electric potential equal to 10⁻⁶ volt.
midline (EEG): the sagittal axis running from nasion to inion, along which the Fpz, Fz, Cz, Pz, and Oz sites lie.
midline EEG site (z): an electrode location on the sagittal midline designated by the suffix z in international EEG-placement systems.
Modified Combinatorial Nomenclature: the 10-10 naming system that relabels the temporal sites T3/T4 as T7/T8 and T5/T6 as P7/P8 for finer, more consistent electrode positions.
montage: the specified arrangement of electrode derivations or channel pairings used to display a physiological recording.
motion artifact: signal contamination produced by movement of the participant, sensor, electrode, cable, or tissue-sensor interface.
nasion: the midline depression at the junction of the frontal bone and nasal bones.
Nyquist-Shannon sampling theorem: a band-limited signal can be reconstructed from samples taken at a rate greater than twice its highest frequency under ideal conditions.
O (occipital): the International 10-20 system letter designating sites that detect occipital lobe EEG activity.
parietal EEG site (P): an electrode location over the parietal scalp designated P in international EEG-placement systems.
passive electrode: an electrode that transmits the raw scalp signal to the amplifier without on-site amplification.
peak voltage: the maximum voltage relative to a specified baseline; for a symmetric waveform centered on baseline, it equals one-half the peak-to-peak voltage.
peak-to-peak method: the integrator method that provides the largest amplitude estimate, equal to the voltage difference between the positive and negative maximum values of the AC waveform, which is 2 times the peak value.
peak-to-peak voltage: the voltage difference between a waveform's highest and lowest instantaneous values.
phase: the position of a periodic signal within its cycle, usually expressed in degrees or radians relative to a reference.
picowatt (pW): a unit of physical power equal to 10⁻¹² watt; it is not a standard unit of EEG voltage amplitude or conventional EEG spectral power.
polarization (electrophysiology): the separation or change of electrical charge across a cell membrane or electrode interface; hyperpolarization makes membrane potential more negative and depolarization makes it less negative.
preauricular point: a landmark immediately anterior to the tragus used in cranial and EEG measurements.
quantitative EEG (qEEG): the numerical analysis of digitized EEG features, such as spectral power, asymmetry, and connectivity, sometimes compared with normative databases; no universal minimum channel count defines it.
reference electrode: an electrode whose potential is used as the comparison for an active recording electrode; it is distinct from the ground electrode.
RMS voltage: the root mean square of a voltage waveform; for a zero-offset sinusoid it equals peak voltage divided by √2.
salt bridge: an unintended conductive path formed when excess gel or paste connects two neighboring electrodes, merging their signals into one and making both channels unusable; the mechanism behind the bridging artifact.
sampling rate: the number of discrete signal samples acquired per unit time, usually expressed in samples per second or hertz.
sintered silver/silver-chloride electrodes: electrodes made by fusing silver and silver-chloride powder under heat and pressure rather than plating it onto a base metal, giving the stable, low-noise surface slow cortical potential recording requires.
stage 1 sleep: a subtle drowsy state that clients often do not recognize, marked by decreasing alpha and increasing theta amplitude, slow rolling eye movements, and reduced EMG and beta activity; a common source of artifact in long recordings.
tracking test: a functional check that the recorded signal and feedback display change in the expected direction during a known physiological or physical manipulation.
tragus: the small cartilaginous flap projecting backward over the opening of the external acoustic meatus; the preauricular point lies immediately anterior to it.
transducer: a device that converts energy or a physical quantity from one form into another.
vertex and Cz: the vertex is the highest point of the skull; Cz is the midline EEG position at the intersection of nasion-inion and left-right preauricular measurements.
volt (V): the SI derived unit of electric potential difference, equal to one joule per coulomb.
voltage: electric potential difference between two points, expressed in volts.
volume conduction: passive spread of electrical fields through conductive biological tissues, allowing a source to influence electrodes located at a distance.
wet electrode: an electrode that uses conductive gel or paste as the electrolyte between skin and sensor.
zero-crossing method: a technique for estimating frequency by counting how many times a waveform crosses the zero-voltage line in one second and dividing by two.
Test Yourself on ClassMarker
Click the button below to take a 10-question exam over this entire unit. There is no password.
Review Flash Cards on Quizlet
Click the button below to review our chapter flash cards.
References
Acharya, J. N., Hani, A. J., Cheek, J., Thirumala, P., & Tsuchida, T. N. (2016). American Clinical Neurophysiology Society Guideline 2: Guidelines for standard electrode position nomenclature. Journal of Clinical Neurophysiology, 33(4), 308–311. https://doi.org/10.1097/WNP.0000000000000316
Anderson, J. S. (2025, April 10). John S. Anderson on frequency vs. amplitude [Blog post]. BioSource Software. https://www.biosourcesoftware.com/post/john-anderson-on-frequency-vs-amplitude
Bayat, M., Safaie, J., Mollazadeh Beidokhti, S., & Wallois, F. (2025). A comprehensive review of EEG electrode technologies: Advancements, applications, and future directions. Sensors and Actuators A: Physical, 399, 117396. https://doi.org/10.1016/j.sna.2025.117396
Biofeedback Certification International Alliance. (2020). Neurofeedback essential skills list. https://bcia.memberclicks.net/assets/NFCommonDocs/NF%20Mentoring%20Handbook.pdf
Collura, T. F. (2014). Technical foundations of neurofeedback. Routledge.
Demos, J. N. (2019). Getting started with EEG neurofeedback (2nd ed.). W. W. Norton & Company.
Di Flumeri, G., Aricò, P., Borghini, G., Sciaraffa, N., Di Florio, A., & Babiloni, F. (2019). The dry revolution: Evaluation of three different EEG dry electrode types in terms of signal spectral features, mental states classification and usability. Sensors, 19(6), 1365. https://doi.org/10.3390/s19061365
Ferree, T. C., Luu, P., Russell, G. S., & Tucker, D. M. (2001). Scalp electrode impedance, infection risk, and EEG data quality. Clinical Neurophysiology, 112(3), 536–544. https://doi.org/10.1016/S1388-2457(00)00533-2
Fisch, B. J. (1999). Fisch and Spehlmann's EEG primer: Basic principles of digital and analog EEG (3rd ed.). Elsevier.
Halford, J. J., Sabau, D., Drislane, F. W., Tsuchida, T. N., & Sinha, S. R. (2016). American Clinical Neurophysiology Society Guideline 4: Recording clinical EEG on digital media. Journal of Clinical Neurophysiology, 33(4), 317-319. https://doi.org/10.1097/WNP.0000000000000318
Hinrichs, H., Scholz, M., Baum, A. K., Kam, J. W. Y., Knight, R. T., & Heinze, H.-J. (2020). Comparison between a wireless dry electrode EEG system with a conventional wired wet electrode EEG system for clinical applications. Scientific Reports, 10, 5218. https://doi.org/10.1038/s41598-020-62154-0
International QEEG Certification Board. (n.d.). Guideline: Minimum technical requirements for performing quantitative EEG. EEG and Clinical Neuroscience Society. https://qeegcertificationboard.org
Kam, J. W. Y., Griffin, S., Shen, A., Patel, S., Hinrichs, H., Heinze, H.-J., Deouell, L. Y., & Knight, R. T. (2019). Systematic comparison between a wireless EEG system with dry electrodes and a wired EEG system with wet electrodes. NeuroImage, 184, 119–129. https://doi.org/10.1016/j.neuroimage.2018.09.012
Kappenman, E. S., & Luck, S. J. (2010). The effects of electrode impedance on data quality and statistical significance in ERP recordings. Psychophysiology, 47(5), 888–904. https://doi.org/10.1111/j.1469-8986.2010.01009.x
Miller, J. W., Kim, W. S., Holmes, M. D., & Vanhatalo, S. (2007). Ictal localization by source analysis of infraslow activity in DC-coupled scalp EEG recordings. NeuroImage, 35(2), 583-597. https://doi.org/10.1016/j.neuroimage.2006.12.018
Peper, E., Gibney, K. H., Tylova, H., Harvey, R., & Combatalade, D. (2008). Biofeedback mastery: An experiential teaching and self-training manual. Association for Applied Psychophysiology and Biofeedback.
Sinha, S. R., Sullivan, L. R., Sabau, D., San-Juan, D., Dombrowski, K. E., Halford, J. J., Hani, A. J., Drislane, F. W., & Stecker, M. M. (2016). American Clinical Neurophysiology Society Guideline 1: Minimum technical requirements for performing clinical electroencephalography. Journal of Clinical Neurophysiology, 33(4), 303–307. https://doi.org/10.1097/WNP.0000000000000308
Thompson, M., & Thompson, L. (2015). The neurofeedback book: An introduction to basic concepts in applied psychophysiology (2nd ed.). Association for Applied Psychophysiology and Biofeedback.
Return to Top