
Understanding the Uniqueness of qEEG Analysis
What You Will Learn in This Chapter
Imagine two clinicians looking at the same brain. One orders an MRI and sees exquisite anatomy: gyri, ventricles, and a small lesion measured to the millimeter. The other records a qEEG and sees something the MRI cannot show, which is what that brain is doing right now, sampled hundreds of times per second. Neither picture is more true than the other, and neither is complete on its own.
This unit teaches you to place the qEEG accurately among the neuroimaging methods it competes with and complements. You will work through the structural techniques, computerized axial tomography and magnetic resonance imaging, and then through the functional techniques, including the EEG and qEEG, magnetoencephalography, functional magnetic resonance imaging, positron emission tomography, and single-photon emission computerized tomography. For each method you will learn the biological signal it measures, its temporal and spatial resolution, its invasiveness, and its cost.
You will then compare the qEEG against those methods and against conventional clinical metrics such as behavioral rating scales and self-report questionnaires. By the end you should be able to say precisely what the qEEG adds to an assessment, and just as importantly, what it cannot tell you.
IQCB Blueprint Coverage: This unit addresses Understanding the Uniqueness of qEEG Analysis (V.A) within qEEG (V).
Learning Objectives
After completing this section, you will be able to:
Distinguish structural from functional neuroimaging methods and assign each technique to the correct category.
Identify the biological signal that each functional method uses as its index of brain activity.
Define temporal resolution and spatial resolution and rank the major neuroimaging methods on both dimensions.
Describe how computerized axial tomography and magnetic resonance imaging construct images and explain why MRI carries less risk.
Explain how the EEG and qEEG function as neuroimaging techniques at one channel, at 19 channels, and in three dimensions.
Compare magnetoencephalography, functional magnetic resonance imaging, positron emission tomography, and single-photon emission computerized tomography with respect to resolution, invasiveness, and accessibility.
Explain what the qEEG contributes beyond conventional clinical metrics such as behavioral assessments and self-report questionnaires.
Justify the selection of a neuroimaging method for a specific clinical or research question.
Listen to the Full-Length Lecture
Comparison of Neuroimaging Techniques
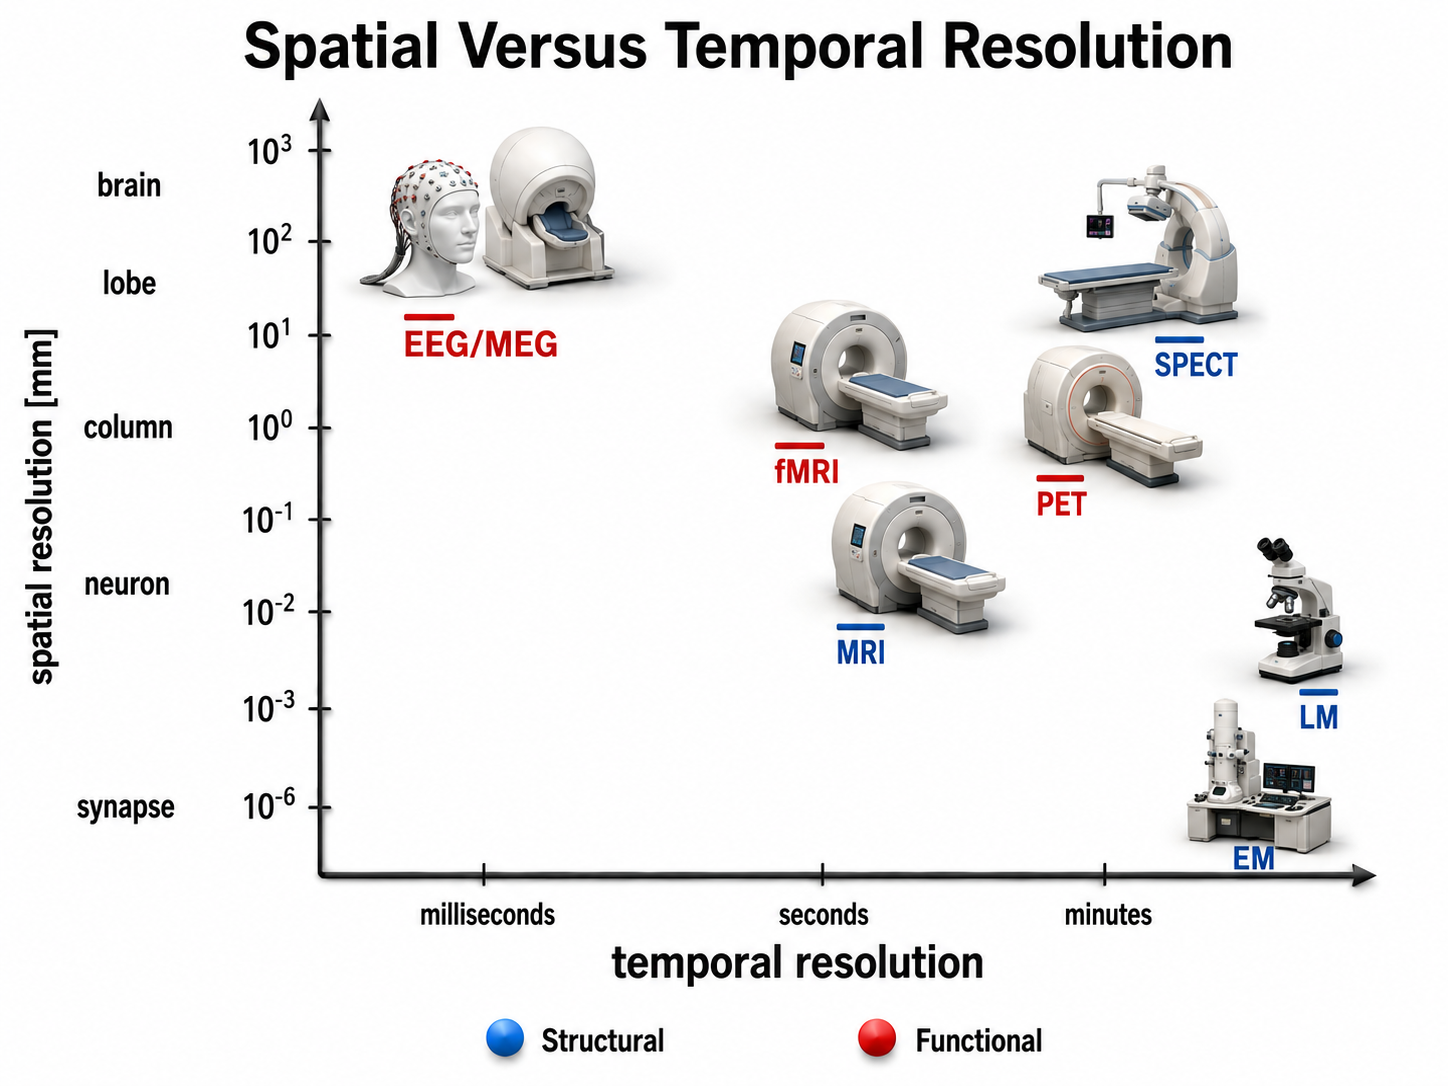
This section compares the major brain imaging methods, divided into structural techniques (which show anatomy) and functional techniques (which show activity). Understanding where EEG fits among these methods will help you appreciate both its strengths, particularly its excellent temporal resolution, and the complementary information that other modalities provide. Structural methods include CT and MRI, which present images of brain structures. Functional methods include EEG, MEG, fMRI, PET, and SPECT, each of which constructs images showing the location of differing levels of brain activity.
These functional techniques differ in the biological signals they measure. EEG detects brain electrical activity directly and MEG detects the magnetic fields that this activity generates; fMRI tracks blood oxygenation as an indirect marker of neural activity; PET uses positron-emitting radioisotopes attached to a tracer molecule, most commonly the glucose analog fluorodeoxyglucose (FDG), though many other tracers are used; and SPECT uses gamma-emitting radioisotopes. Because PET and SPECT usually require administering radioactive tracers and expose the patient to ionizing radiation, they are more invasive and carry greater risk for patients and research participants (Breedlove & Watson, 2023).
Each functional method can be evaluated on two dimensions: temporal resolution (how quickly it detects changes in function) and spatial resolution (how precisely it locates where those changes occur). EEG and MEG excel at temporal resolution, capturing neural events in milliseconds, but locating the sources of those events requires solving an inverse problem that has no unique solution, so their effective spatial resolution is generally coarser and less certain than fMRI's millimeter-level precision. This tradeoff is central to choosing the right imaging tool for a given clinical or research question.
Structural Techniques
The main structural imaging techniques are computerized axial tomography and magnetic resonance imaging.
Computerized Axial Tomography
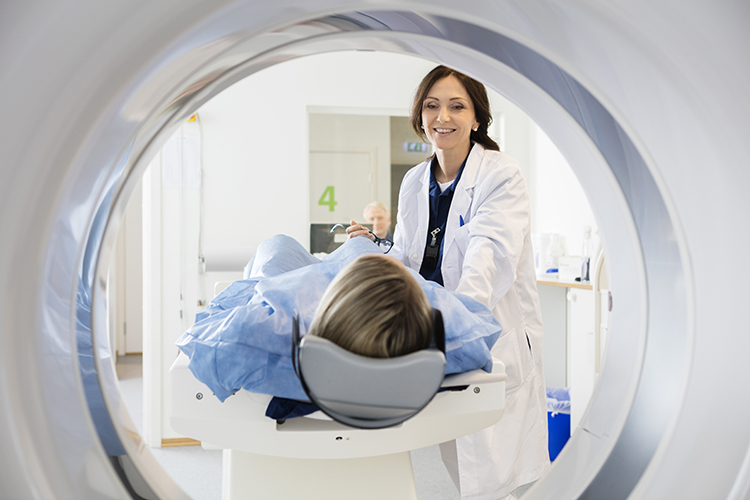
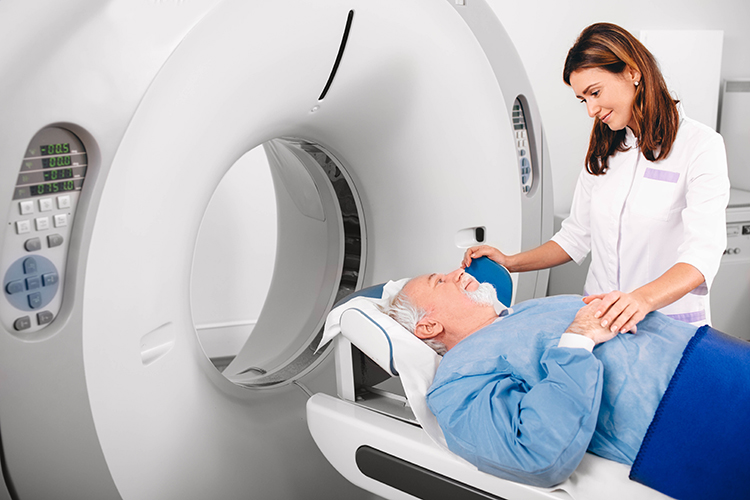
Computerized Axial Tomography (CAT or CT) provides medium-resolution images of brain structure by moving an x-ray source along an arc surrounding the head (Breedlove & Watson, 2023). CT scans allow physicians to visualize structural abnormalities such as stroke damage and tumors, making them a valuable first-line diagnostic tool in emergency settings.
Graphic © Tyler Olson/Shutterstock.com.
Graphic © Triff/Shutterstock.com.
Magnetic Resonance Imaging (MRI)
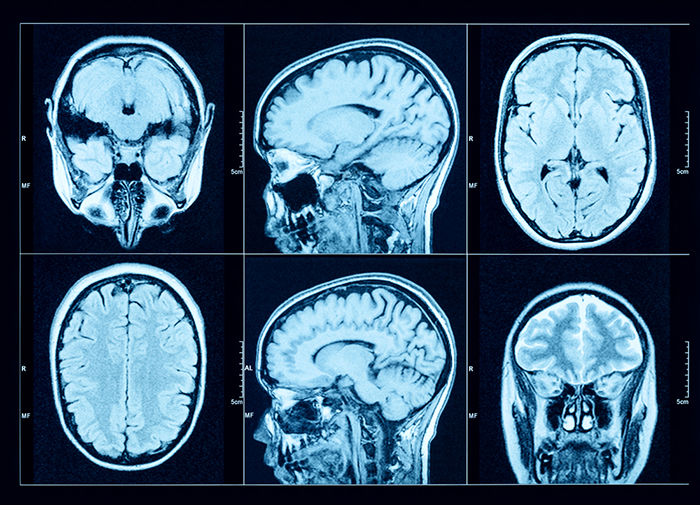
Magnetic resonance imaging (MRI) constructs higher-resolution images than CT scans by using powerful magnetic fields and radio wave pulses. Because MRI does not use ionizing radiation, it carries less cumulative risk with repeated use, although its strong magnetic field creates its own safety contraindications for patients with certain implants. MRI scans allow detailed examination of brain anatomy, including the location and volume of specific brain regions. Their superior spatial resolution can detect subtle abnormalities, such as the demyelination seen in multiple sclerosis, that CT scans would miss (Breedlove & Watson, 2023).
Graphic © Peastock/Shutterstock.com.
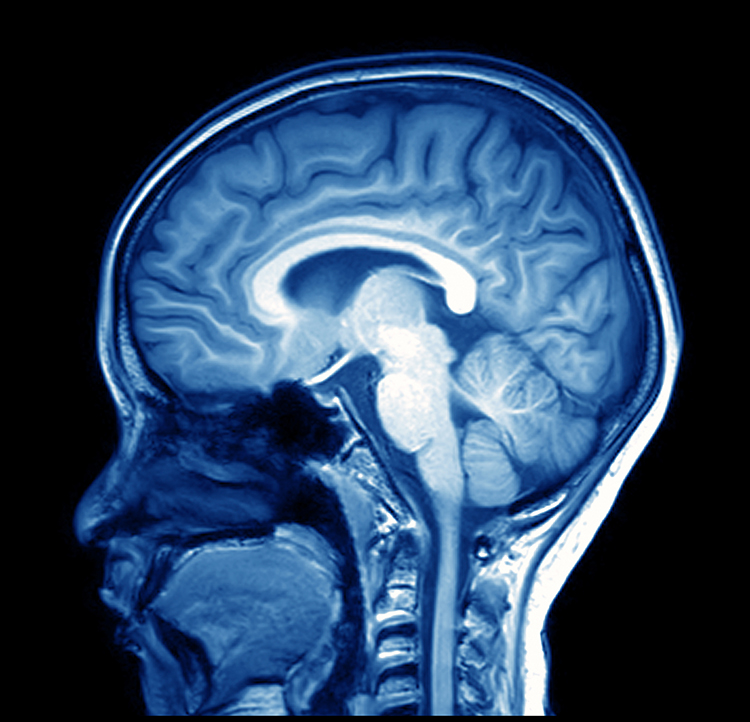
Graphic © MriMan/Shutterstock.com.
Functional Techniques
The functional techniques reviewed below include the EEG and qEEG, magnetoencephalography (MEG), functional magnetic resonance imaging (fMRI), positron emission tomography (PET), and single-photon computerized emission tomography (SPECT). See Lebby (2013) for an excellent overview of these techniques. Also, consult the McGill brain imaging tool module.
EEG
EEG and qEEG can be understood as functional imaging techniques in their own right, although a single-channel recording images the signal's frequency content rather than its anatomical source. Even a single-channel EEG displays microvolt amplitudes across adjacent 1-Hz bins or frequency bands, as in a 2D or 3D spectrogram. The 19-channel qEEG adds spatial information, mapping activity across the scalp using a 2D 10-20 layout, or estimating distributed sources in three dimensions with methods like LORETA (Low Resolution Brain Electromagnetic Tomography) and its variants sLORETA and eLORETA (Pascual-Marqui et al., 1994). As their name indicates, these are low-resolution source estimates constrained by modeling assumptions, not direct measurements of deep activity.
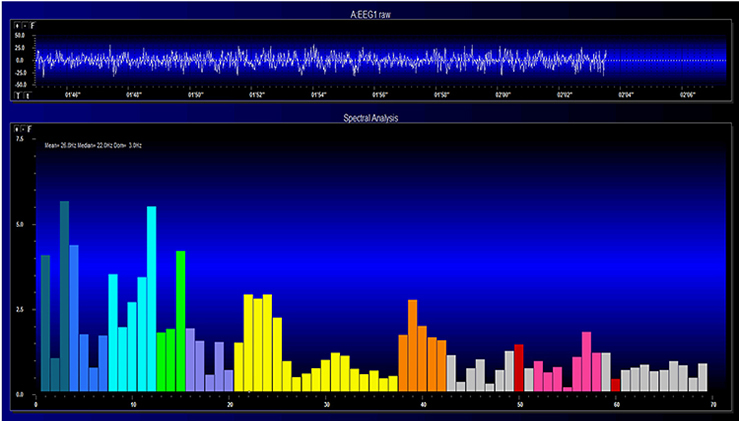
Graphic © John S. Anderson.
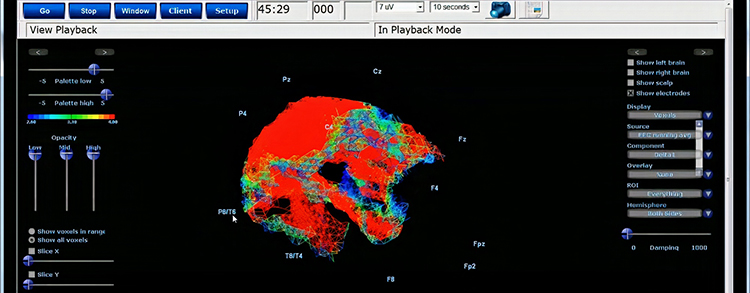
Graphic courtesy of BrainMaster Technologies.
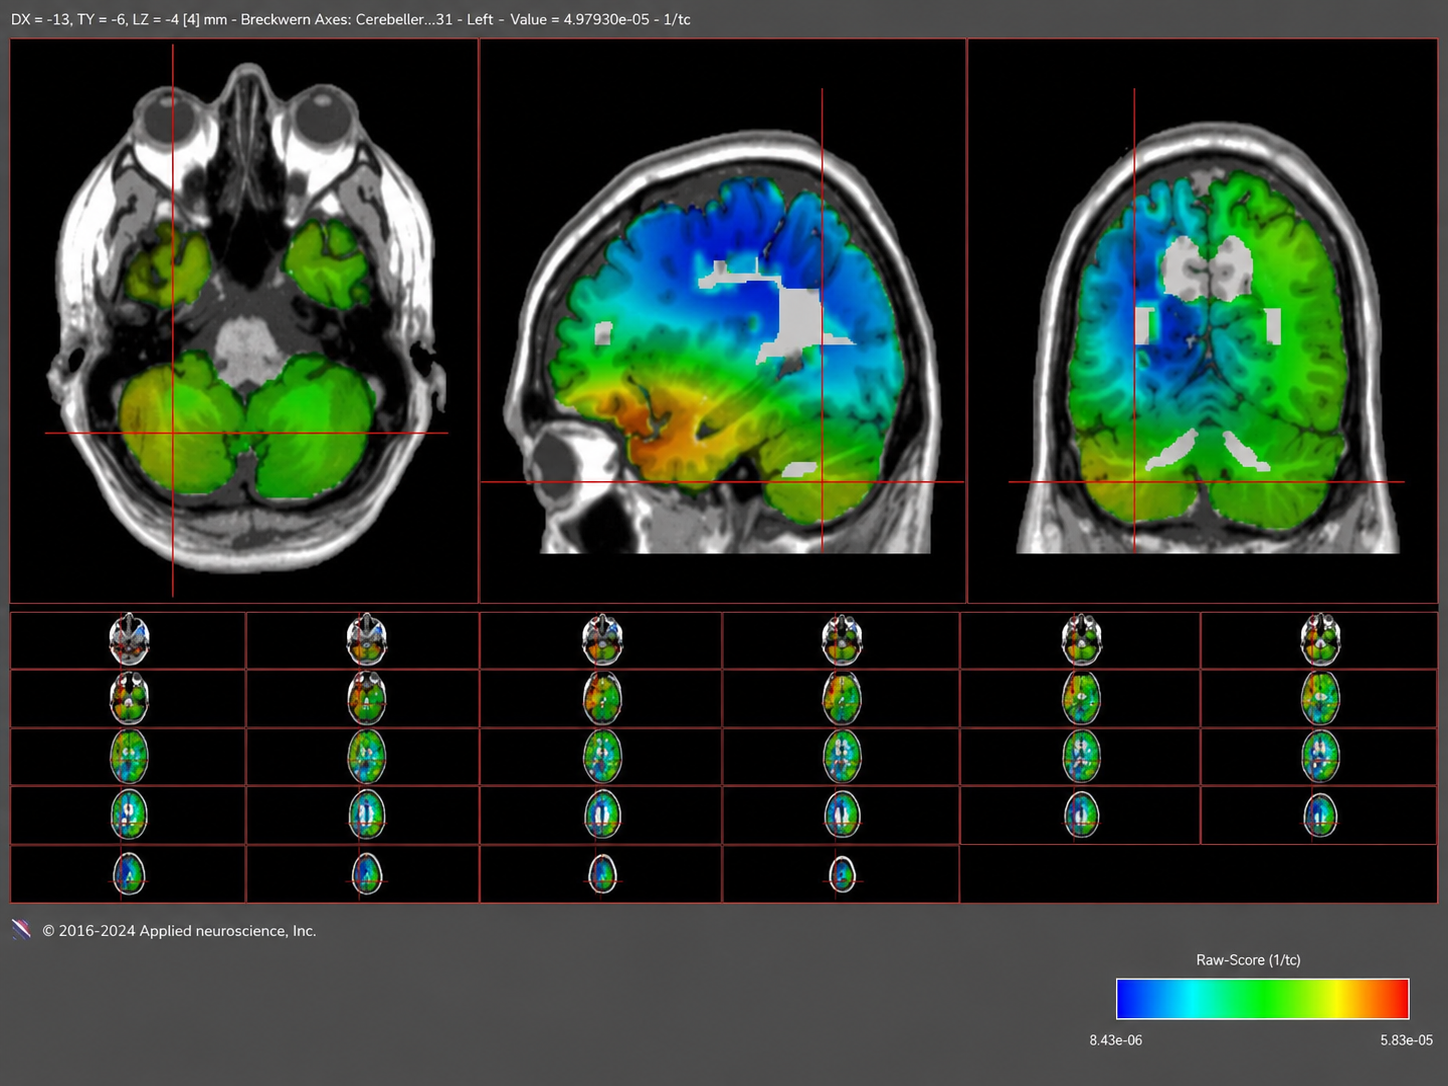
swLORETA graphic from Neuroguide - NeuroNavigator.
Magnetoencephalography
Magnetoencephalography (MEG) is a noninvasive functional imaging technique that has traditionally used SQUIDs (superconducting quantum interference devices), and increasingly uses optically pumped magnetometers (OPMs), to detect the weak magnetic fields generated by neuronal activity. Like EEG, MEG offers millisecond temporal resolution, allowing it to measure rapidly shifting patterns of cortical circuit activation (Breedlove & Watson, 2023). Because the skull distorts magnetic fields far less than electric fields, MEG generally localizes superficial cortical sources more accurately than scalp EEG—reported localization errors are often on the order of a few millimeters to about a centimeter—but its accuracy depends on source depth, orientation, and the head model used, and it remains less spatially certain than fMRI. Researchers sometimes combine MEG with MRI to better delineate the cortical structures generating the detected magnetic fields (Lin et al., 2004).
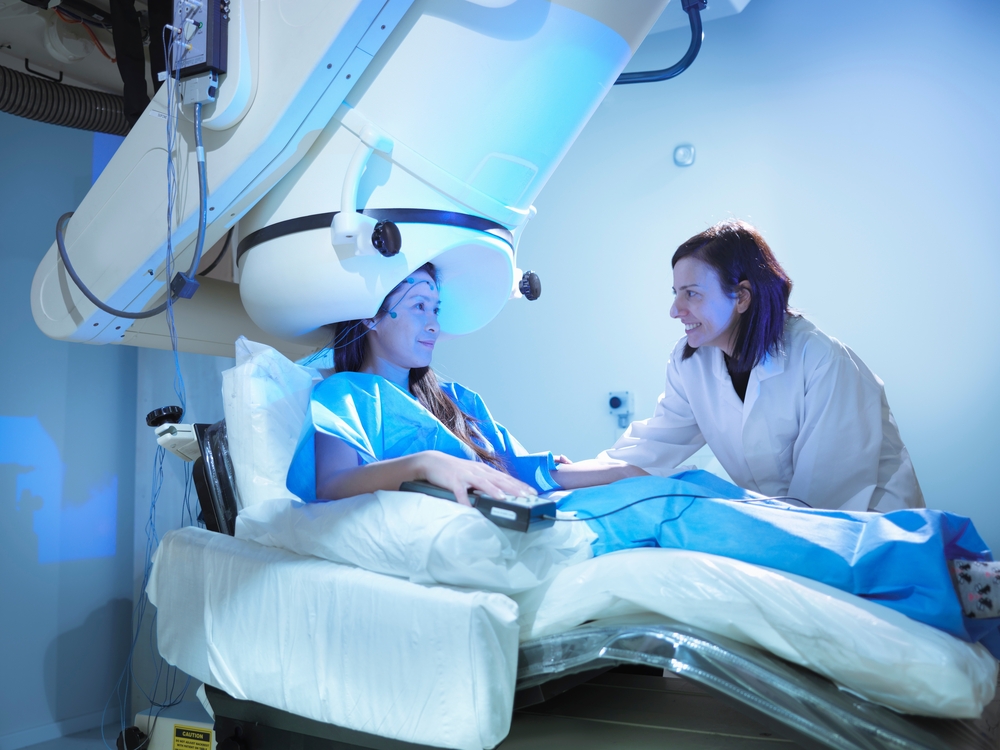
Magnetoencephalography Graphic © Image Source Trading ltd/Shutterstock.com.
Functional Magnetic Resonance Imaging (fMRI)
Functional Magnetic Resonance Imaging (fMRI) uses intense magnetic fields to detect the blood-oxygen-level-dependent (BOLD) signal, which reflects local changes in blood flow, blood volume, and the concentration of deoxygenated hemoglobin that accompany neural activity. Because blood flow increases more than oxygen consumption does, the BOLD signal is an indirect hemodynamic marker rather than a direct measure of oxygen use. Evidence from simultaneous recordings indicates that the signal corresponds more closely to local field potentials and synaptic input than to spiking output (Logothetis et al., 2001). A scanner's magnet strength, measured in teslas (T), strongly influences its spatial resolution, which is quantified in terms of voxel size, a three-dimensional pixel representing a specific volume of brain tissue. Higher magnet strength improves the signal-to-noise ratio, enabling finer voxel sizes and more detailed imaging. Most clinical and research scanning is done at 1.5 or 3.0 T; 7.0 T systems are now approved for clinical use, and ultra-high-field research scanners of 9.4 T and above exist at a small number of centers.
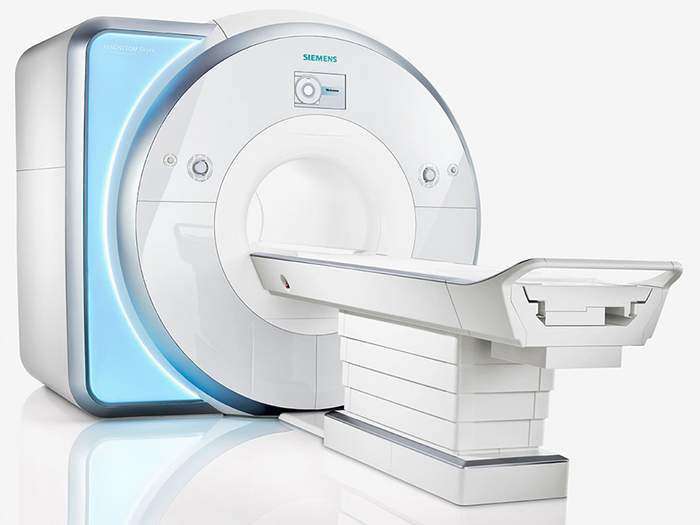
However, higher spatial resolution comes with a tradeoff: increased granularity can introduce more noise and potential artifacts, complicating the task of distinguishing true physiological signals from spurious data. Achieving the right balance between resolution and signal quality is crucial for accurate functional interpretations. Although fMRI is limited by the sluggishness of the hemodynamic response—which begins roughly 1 to 2 seconds after neural activity and peaks about 4 to 6 seconds later—it can reveal how networks contribute to cognitive performance. Compared to PET, fMRI offers both superior spatial resolution and superior temporal resolution, while PET retains the advantage of being able to image specific molecular targets (Breedlove & Watson, 2023).
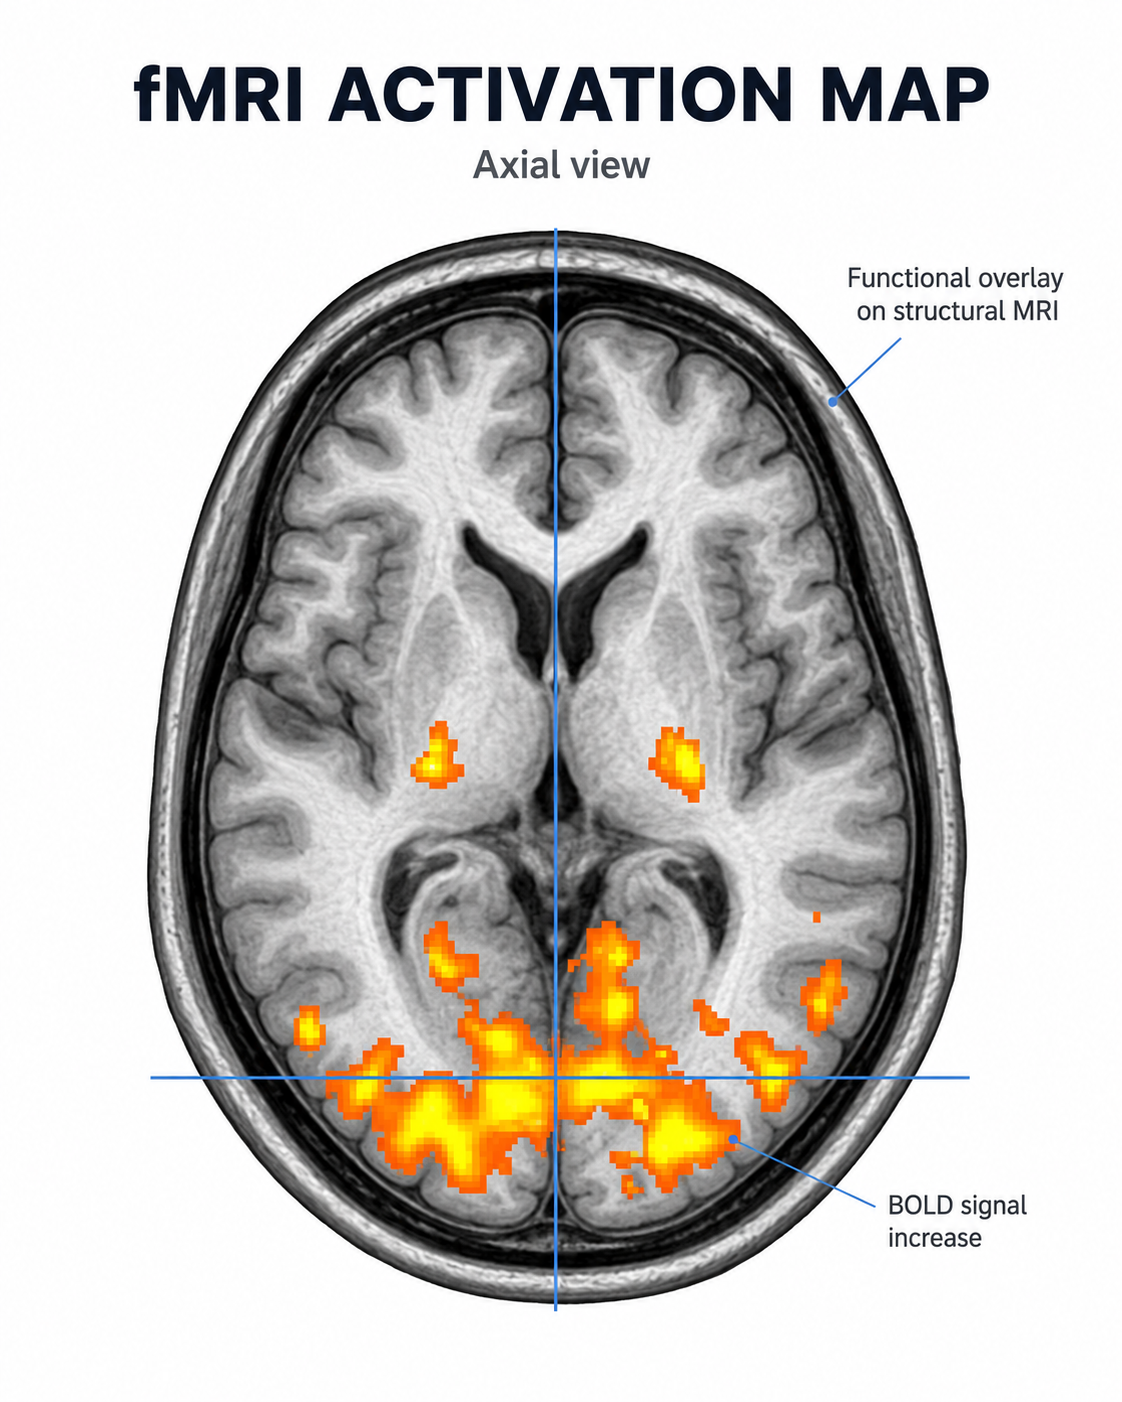
Axial fMRI activation map showing task-related BOLD signal increases overlaid on a structural MRI, with strongest activation in posterior cortical regions and smaller bilateral activation clusters in deeper cortical areas.
Positron Emission Tomography
Positron emission tomography (PET) is a functional imaging technique in which a radioactively labeled tracer is introduced into the bloodstream—usually by intravenous injection, sometimes by inhalation—and its distribution in the brain is imaged to measure metabolism, blood flow, or receptor binding (Breedlove & Watson, 2023). PET scans achieve low temporal resolution (tens of seconds to minutes) with moderate spatial resolution (roughly 4 to 6 mm on modern scanners), making them better suited for studying sustained metabolic and molecular processes than rapidly changing neural events.
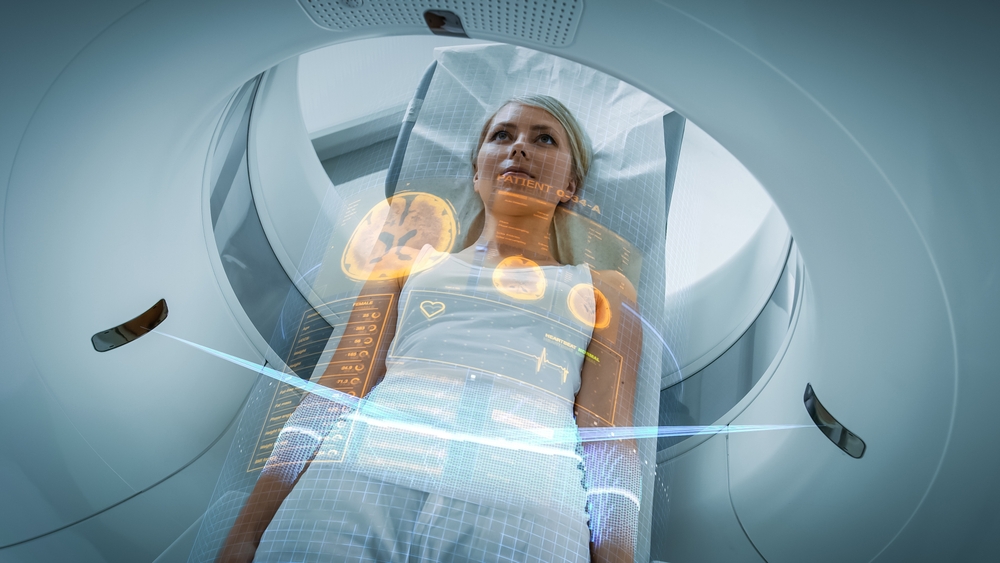
PET scan graphic © Gorodenkoff/Shutterstock.com.
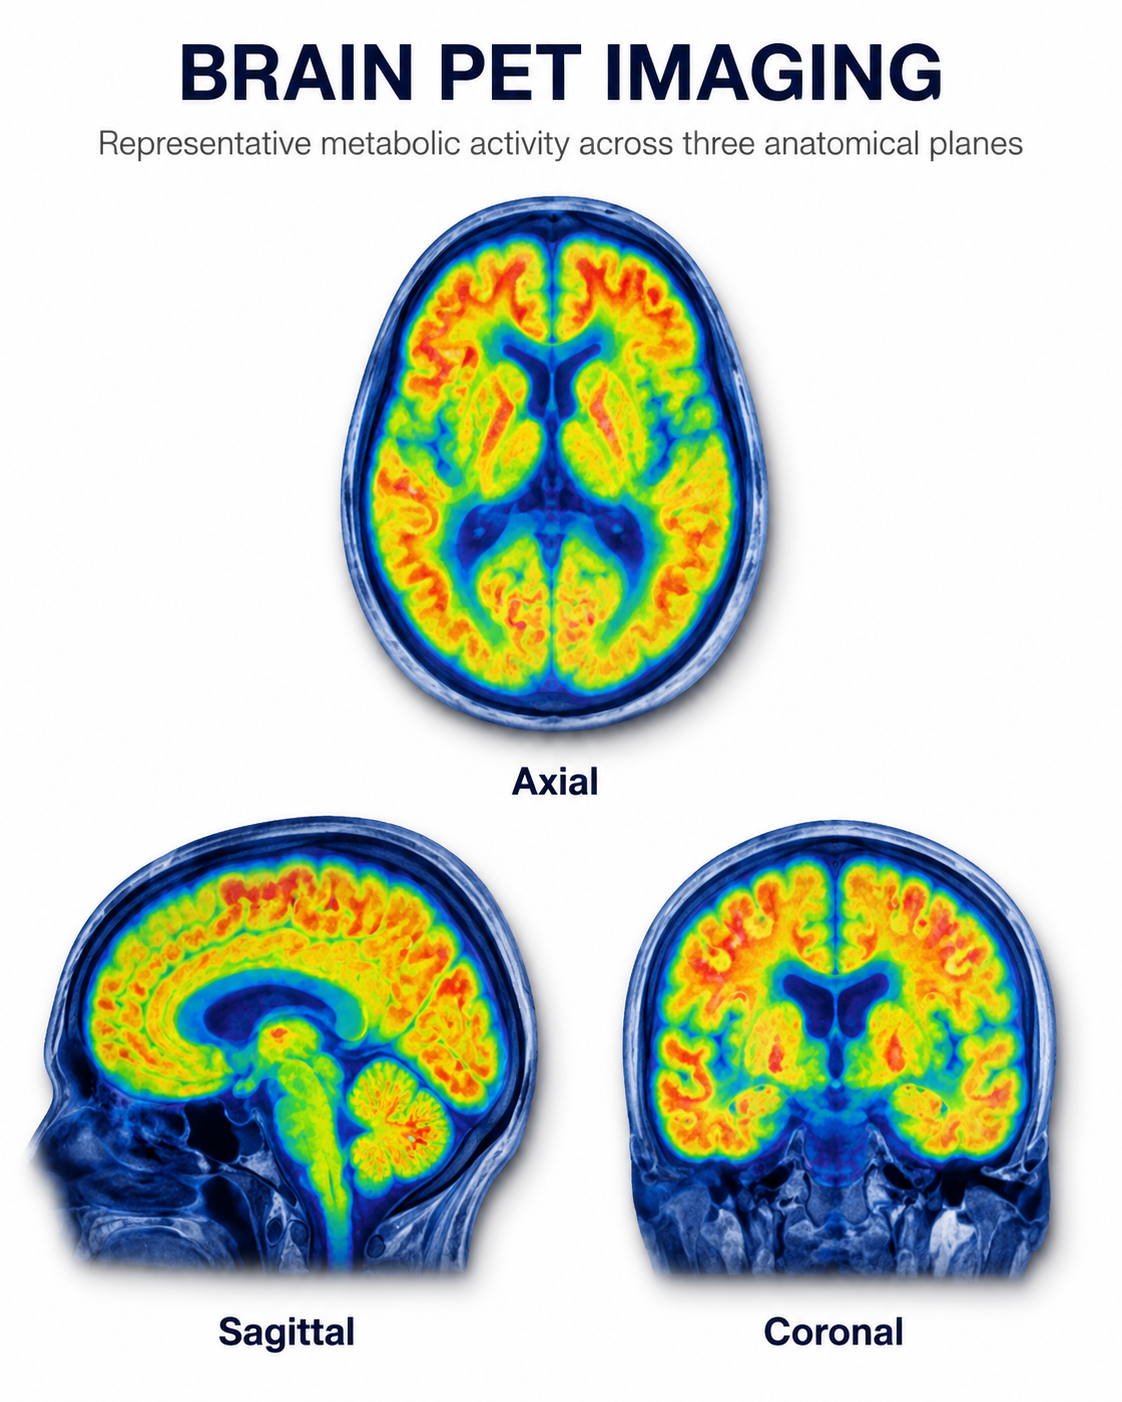
Brain PET imaging showing regional metabolic activity across axial, sagittal, and coronal planes, with warmer colors indicating higher tracer uptake and cooler colors indicating lower uptake.
Single-Photon Emission Computerized Tomography
Single-photon emission computerized tomography (SPECT) is a functional imaging technique that uses gamma rays to create three-dimensional and slice images of cerebral blood flow averaged over several minutes. SPECT achieves limited temporal resolution (minutes) and the coarsest spatial resolution of the functional methods discussed here—typically on the order of 1 cm—but it remains clinically useful for evaluating regional perfusion differences.
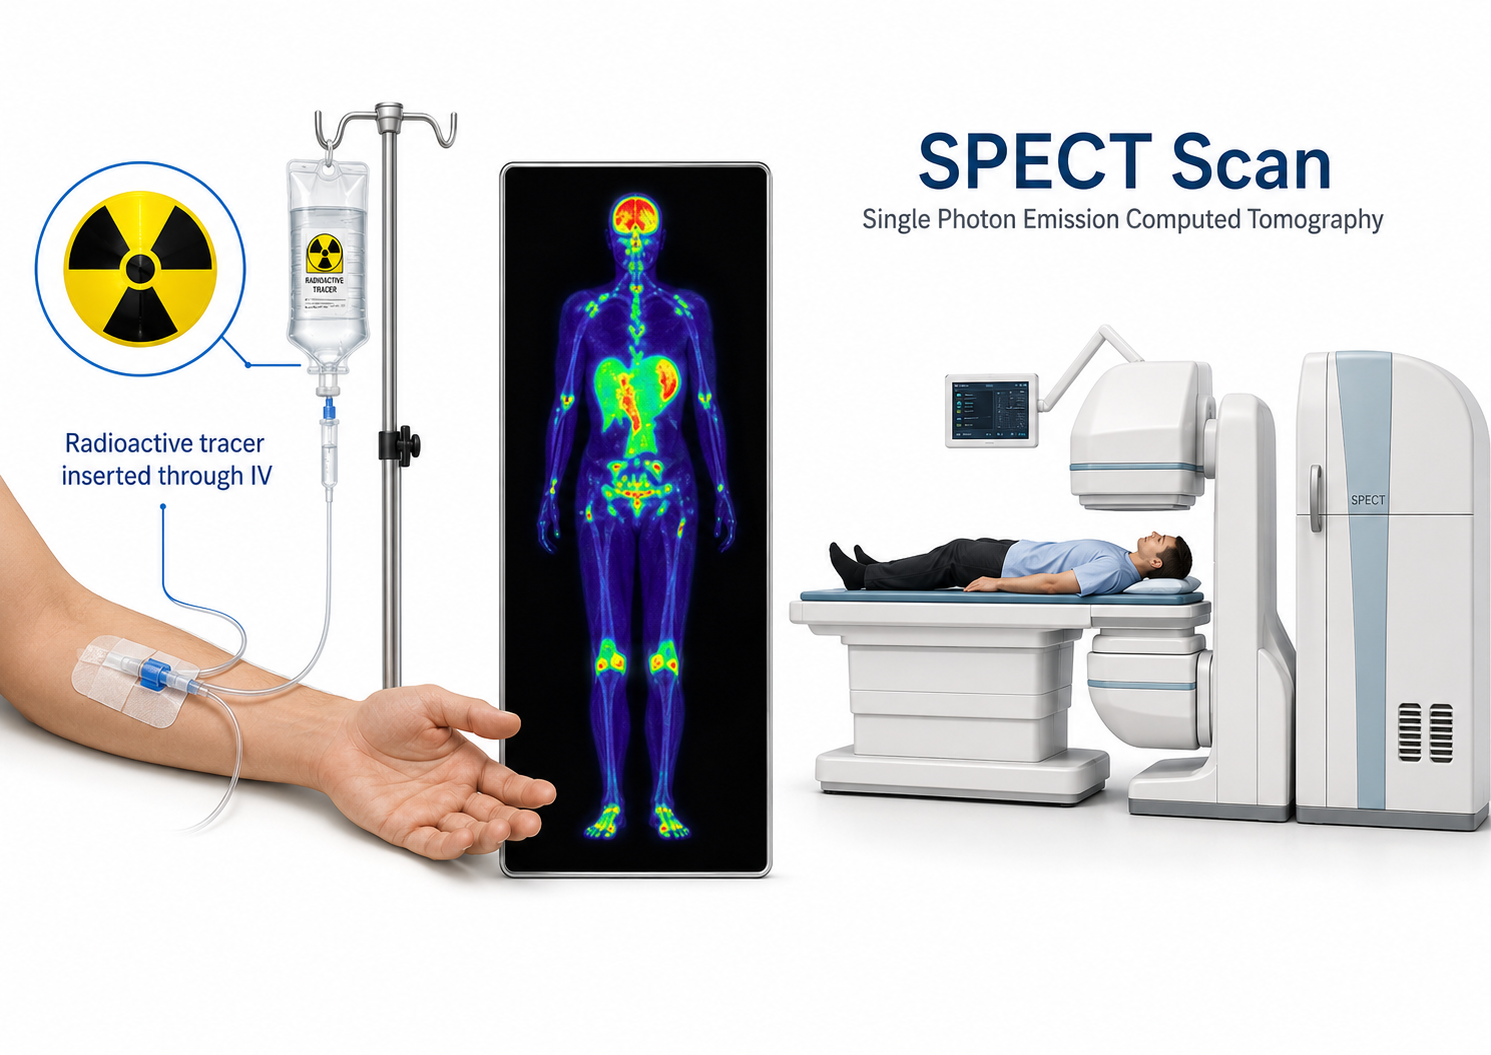
Graphic adapted from © rumruay/Shutterstock.com.
How the qEEG Compares with Other Neuroimaging Techniques
Temporal Resolution
The qEEG offers superior temporal resolution compared with other neuroimaging techniques. While the fMRI localizes to millimeters and PET to roughly 4 to 6 mm, both lack the millisecond-level temporal resolution of the qEEG (Michel & Murray, 2012). This high temporal resolution allows the qEEG to capture rapid neural dynamics, which makes it particularly useful for studying cognitive processes and brain connectivity (Michel et al., 2004).
Spatial Resolution
In contrast, techniques like fMRI and PET excel in spatial resolution, providing detailed images of brain structures and their functions. The fMRI measures blood oxygenation level-dependent signals, known as BOLD signals, which reflect neural activity indirectly, while PET uses radioactive tracers to visualize metabolic processes (Logothetis, 2008). The qEEG, however, has limited spatial resolution, which is a significant drawback when precise localization of brain activity is required (Sanei & Chambers, 2013).
Cost and Accessibility
The qEEG is relatively cost-effective and accessible compared with fMRI and PET. The latter require expensive equipment and facilities, which makes them less accessible for routine clinical use. The qEEG systems are portable, less expensive, and easier to use, which allows for broader application in diverse settings, including outpatient clinics and remote areas (Coburn et al., 2006).
Non-Invasiveness and Safety
The qEEG is non-invasive and poses no risk of radiation exposure, unlike PET, which involves the administration of radioactive substances. This makes the qEEG suitable for repeated measurements and for use in vulnerable populations such as children and pregnant women (Hughes & John, 1999). Repeatability is easy to underestimate. A method you can run weekly without accumulating risk supports treatment monitoring in a way that a single annual scan never will.
A 9-year-old is referred for inattention that has not responded to two stimulant trials, and the family asks why you are not ordering a brain scan. Consider what each method would buy you. A structural MRI would rule out gross pathology but say nothing about function, while PET would deliver metabolic detail at the cost of an injected radioisotope in a child. A qEEG costs a fraction of either, exposes the child to nothing, resolves activity in milliseconds, and can be repeated after each treatment change to check whether anything moved.
How the qEEG Compares with Conventional Clinical Metrics
Objective Measurement
Conventional clinical metrics, such as behavioral assessments and self-report questionnaires, rely heavily on subjective data, which can be influenced by various biases. The qEEG provides objective, quantifiable data on brain function, reducing the reliance on subjective reports and enhancing the accuracy of diagnoses and treatment evaluations (Boutros et al., 2011).
Early Detection and Prognosis
The qEEG can detect subtle abnormalities in brain function that may not be evident through conventional metrics. This capability allows for earlier detection of neurological and psychiatric conditions, potentially leading to more timely and effective interventions (John et al., 1988). Moreover, qEEG metrics have been shown to correlate with treatment outcomes, offering valuable prognostic information (Prichep et al., 1993).
Clinical and Research Applications
The qEEG has been used extensively in the diagnosis and monitoring of various neurological and psychiatric disorders, including epilepsy, ADHD, and depression (Clarke et al., 2001; Hughes & John, 1999). Its ability to provide real-time feedback on brain activity has also facilitated the development of neurofeedback therapies, which have shown promise in treating conditions such as anxiety and PTSD (Hammond, 2005).
Putting the Comparison Together
The qEEG stands out among neuroimaging techniques and conventional clinical metrics because of its high temporal resolution, cost-effectiveness, non-invasiveness, and objective measurement capabilities. It may lack the spatial resolution of techniques like fMRI and PET, but its unique attributes make it an invaluable tool in both clinical and research settings. Future advances in qEEG technology and analysis methods are likely to enhance its utility further, opening the way to new applications and insights into brain function.
The practical lesson is not that one method wins. It is that you should choose the method that matches your question. If your question concerns where a lesion sits, order structural imaging; if it concerns how a network behaves over the next 200 milliseconds, the qEEG is the instrument built for that job.
The qEEG earns its place through four advantages: millisecond temporal resolution that captures rapid neural dynamics, low cost and portability that put it within reach of outpatient and remote settings, non-invasiveness that permits repeated recordings in children and pregnant women, and objective quantification that reduces dependence on self-report. Its principal weakness is spatial resolution, which is why fMRI and PET remain preferable when precise localization drives the question. Against conventional clinical metrics, the qEEG adds objective data, earlier detection of subtle dysfunction, and prognostic information that correlates with treatment outcomes.
Check Your Understanding
- Define temporal resolution and spatial resolution, and state which techniques lead on each.
- Why can the qEEG be repeated far more often than a PET scan, and why does that matter clinically?
- What does the BOLD signal measure, and why is it an indirect index of neural activity?
- What does the qEEG add that a behavioral rating scale or self-report questionnaire cannot provide?
- A referral asks whether a client's frontal networks are engaging normally during a working memory task. Which method would you choose, and what would you give up by choosing it?
Cutting-Edge Topics in qEEG Research
Source Imaging Is Closing the Spatial Gap
The standard objection to the qEEG is spatial resolution, and that objection is now aging. EEG source imaging estimates the intracranial generators of scalp activity rather than settling for the scalp distribution itself (Michel et al., 2004). With enough electrodes and a realistic head model, inverse solutions such as LORETA and sLORETA place activity in three dimensions, which is why Michel and Murray (2012) argued for treating the EEG as a brain imaging tool rather than as a waveform display. The gap has not closed entirely, but the qEEG of today localizes far better than the 19-channel record of a generation ago.
Multimodal Recording and the Best of Both Trade-Offs
If the central trade-off is time against space, the obvious move is to record both. Lin and colleagues (2004) combined MEG with MRI so that the anatomy from one method could constrain the source estimates of the other. Simultaneous EEG and fMRI recording follows the same logic and is now routine in research settings. The result is a spatiotemporal picture that neither instrument produces alone, and it is steadily becoming the reference standard against which single-modality claims are judged.
Toward qEEG Biomarkers That Predict Treatment Response
Prichep and colleagues (1993) showed decades ago that qEEG measures track stimulant effects in attention deficit disorder, and Boutros and colleagues (2011) reviewed the diagnostic utility and specificity of the qEEG across psychiatric disorders. The current research question is sharper than diagnosis. Investigators now ask whether a pretreatment recording can predict which specific intervention a given client will respond to, which would turn the qEEG from a descriptive instrument into a decision tool. Coburn and colleagues (2006) framed the standards such claims must meet, and those standards remain the fair test for any proposed biomarker.
Portability, Dry Electrodes, and Assessment Outside the Clinic
Cost and portability were listed above as advantages, and hardware development keeps pushing that advantage further (Coburn et al., 2006). Dry-electrode and wireless systems are making it feasible to record outside a laboratory, in schools, in homes, and in remote regions where no scanner exists within hundreds of miles. Signal quality remains the open question, since convenience is worth nothing if artifact swamps the record. Still, no other functional imaging method is even a candidate for this kind of deployment.
Assignment
Now that you have completed this module, describe what fMRI scans can add to an assessment. Name the specific information an fMRI provides that a qEEG cannot, explain the cost you accept in temporal resolution when you order one, and describe a client presentation for which you would recommend both studies rather than either alone.
Glossary
blood oxygenation level-dependent (BOLD) signal: the fMRI measure that reflects local changes in blood flow, blood volume, and the concentration of deoxygenated hemoglobin accompanying neural activity, and that serves as an indirect hemodynamic index of that activity rather than a direct measure of oxygen use.
computerized axial tomography (CAT or CT): the creation of medium-resolution images of brain structure by moving an x-ray source along an arc surrounding the head.
functional magnetic resonance imaging (fMRI): MRI that maps task- or state-related changes in blood oxygenation, most commonly through the blood-oxygen-level-dependent signal.
magnetic resonance imaging (MRI): a noninvasive imaging technology that uses a strong magnetic field and radio waves to produce detailed, high-resolution, three-dimensional images of the body.
magnetoencephalography (MEG): a noninvasive functional imaging technique that uses SQUIDs (superconducting quantum interference devices), or increasingly optically pumped magnetometers, to detect the weak magnetic fields generated by neuronal activity.
positron emission tomography (PET): a functional imaging technique in which a positron-emitting tracer is introduced into the bloodstream and its distribution imaged to measure metabolism, blood flow, or receptor binding.
quantitative EEG (qEEG): the numerical analysis of digitized EEG features, such as spectral power, asymmetry, and connectivity, sometimes compared with normative databases; no universal minimum channel count defines it.
single-photon emission computed tomography (SPECT): a functional imaging technique that uses gamma rays to create three-dimensional and slice images of cerebral blood flow averaged over several minutes.
spatial resolution: the ability of a neuroimaging technique to distinguish between two separate points or structures in the brain, determining the level of detail in the images produced.
superconducting quantum interference device (SQUID): the extremely sensitive magnetometer that magnetoencephalography uses to detect the weak magnetic fields produced by neuronal activity.
temporal resolution: the ability of a neuroimaging technique to capture rapid changes in brain activity over time, reflecting the precision with which the timing of neural events can be measured.
voxel: a three-dimensional pixel representing a volumetric element in neuroimaging data such as qEEG or MRI, used to localize and quantify brain activity within a specific region.
Test Yourself on ClassMarker
Click the button below to take a 10-question exam over this entire unit. There is no password.
Review Flash Cards on Quizlet
Click the button below to review our chapter flash cards.
References
Boutros, N. N., Arfken, C., Galderisi, S., Warrick, J., Pratt, G., & Iacono, W. (2011). QEEG in psychiatric disorders: A review of diagnostic utility and specificity. Clinical EEG and Neuroscience, 42(1), 45-51. https://doi.org/10.1177/155005941104200110
Breedlove, S. M., & Watson, N. V. (2023). Behavioral neuroscience (10th ed.). Sinauer Associates.
Clarke, A. R., Barry, R. J., McCarthy, R., & Selikowitz, M. (2001). EEG analysis in attention-deficit/hyperactivity disorder: A comparative study of two subtypes. Psychiatry Research, 103(1), 63-73. https://doi.org/10.1016/S0165-1781(01)00261-3
Coburn, K. L., Lauterbach, E. C., Boutros, N. N., Black, K. J., Arciniegas, D. B., & Coffey, C. E. (2006). The value of quantitative EEG in clinical psychiatry: A report by the committee on research of the American Neuropsychiatric Association. Journal of Neuropsychiatry and Clinical Neurosciences, 18(4), 460-500. https://doi.org/10.1176/jnp.2006.18.4.460
Hammond, D. C. (2005). Neurofeedback treatment of depression and anxiety. Journal of Adult Development, 12(2-3), 131-137. https://doi.org/10.1007/s10804-005-7029-5
Hughes, J. R., & John, E. R. (1999). Conventional and quantitative electroencephalography in psychiatry. Journal of Neuropsychiatry and Clinical Neurosciences, 11(2), 190-208. https://doi.org/10.1176/jnp.11.2.190
John, E. R., Prichep, L. S., & Easton, P. (1988). Normative data banks and neurometrics: Basic concepts, methods and results of norm constructions. In Computer-aided electrophysiology (pp. 21-38). Springer. https://doi.org/10.1007/978-1-4684-5517-5_2
Lebby, P. C. (2013). Brain imaging: A guide for clinicians. Oxford University Press.
Lin, F., Witzel, T., Hamalainen, M. S., Dale, A. M., Belliveau, J. W., & Stufflebeam, S. M. (2004). Spectral spatiotemporal imaging of cortical oscillations and interactions in the human brain. NeuroImage, 23(2), 582-595. https://doi.org/10.1016/j.neuroimage.2004.04.027
Logothetis, N. K. (2008). What we can do and what we cannot do with fMRI. Nature, 453(7197), 869-878. https://doi.org/10.1038/nature06976
Logothetis, N. K., Pauls, J., Augath, M., Trinath, T., & Oeltermann, A. (2001). Neurophysiological investigation of the basis of the fMRI signal. Nature, 412(6843), 150-157. https://doi.org/10.1038/35084005
Michel, C. M., & Murray, M. M. (2012). Towards the utilization of EEG as a brain imaging tool. NeuroImage, 61(2), 371-385. https://doi.org/10.1016/j.neuroimage.2011.12.039
Michel, C. M., Murray, M. M., Lantz, G., Gonzalez, S., Spinelli, L., & de Peralta, R. G. (2004). EEG source imaging. Clinical Neurophysiology, 115(10), 2195-2222. https://doi.org/10.1016/j.clinph.2004.06.001
Pascual-Marqui, R. D., Michel, C. M., & Lehmann, D. (1994). Low resolution electromagnetic tomography: A new method for localizing electrical activity in the brain. International Journal of Psychophysiology, 18(1), 49-65. https://doi.org/10.1016/0167-8760(84)90014-X
Pfister, H., Kaynig, V., Botha, C. P., Bruckner, S., Dercksen, V., & Hege, H.-C. (2012). Visualization in connectomics. Mathematics and Visualization, 37. https://doi.org/10.1007/978-1-4471-6497-5_21
Prichep, L. S., Sutton, S., Hauer, J. F., & Kuperman, S. (1993). Quantitative EEG in the evaluation of stimulant effects in attention deficit disorder. Clinical Electroencephalography, 24(1), 8-18. https://doi.org/10.1177/155005949302400107
Sanei, S., & Chambers, J. A. (2013). EEG signal processing. John Wiley & Sons. https://doi.org/10.1002/9780470688031
Return to Top