
The Use of qEEG Norms and the Methods Used to Derive Them
What You Will Learn in This Chapter
A number by itself tells you nothing. An alpha amplitude of 43 microvolts at O1 is neither high nor low, neither reassuring nor alarming, until you know what 43 microvolts means for a person of that age, in that recording condition, at that site. Normative databases exist to supply exactly that context. They turn a raw measurement into a statement about how unusual your client is, and that single transformation is what makes quantitative EEG a clinical instrument rather than a pile of numbers.
This unit takes you through both halves of that story. First you will learn what qEEG norms are for, what a database actually contains, and the probability and statistics that make z-score comparison legitimate, including the Gaussian distribution, kurtosis and skewness, percentiles, alpha levels, correlation coefficients, and confidence intervals. Then you will learn how norms are built: ethics review, recruitment, stratification by age, representativeness, inclusion and exclusion criteria, sample size, recording conditions, amplifier matching, artifact removal, and the reliability and validity evidence that separates a defensible database from a marketing claim.
You will finish with a guided tour of the commercial and research databases you are most likely to meet in practice, including NeuroGuide, the Human Brain Institute database, Jewel, NewMind, TDBRAIN, iSyncBrain, and qEEG-Pro, along with the gold standards you can use to judge any database a vendor puts in front of you.
IQCB Blueprint Coverage: This unit addresses Use of qEEG Norms and Methods Used to Derive qEEG Norms (V.B) within qEEG (V).
Learning Objectives
After completing this section, you will be able to:
Define a qEEG norm and explain the six purposes normative databases serve, including description, comparison, diagnosis, biomarker exploration, protocol development, and scientific discovery.
Describe the variables, values, and montages a qEEG normative database contains, and explain what such databases deliberately leave out.
Calculate and interpret a z-score, and explain why a Gaussian distribution is required before z-scores can be used validly.
Distinguish kurtosis from skewness and explain how a non-Gaussian distribution is corrected.
Explain how database developers use stratification, representativeness, and inclusion and exclusion criteria to build a defensible normative sample.
Describe amplifier matching, artifact removal, and the recording conditions and durations used in database construction.
Compare reliability and validity evidence across databases, including split-half, test-retest, content, concurrent, predictive, and cross-validation results.
Contrast the features, samples, and regulatory status of NeuroGuide, the Human Brain Institute database, Jewel, NewMind, TDBRAIN, iSyncBrain, and qEEG-Pro.
Listen to the Full-Length Lecture
The Use of qEEG Norms
Quantitative electroencephalography has proven to be a valuable tool in clinical neuropsychology and psychiatry because it offers objective, quantifiable data on brain function. One of its significant advantages is the use of normative databases, which let you compare an individual's brain activity patterns to those of a healthy population. This section examines the use of qEEG norms and the methods employed to derive them.
Start with a definition. Normative data are "data that characterize what is usual in a defined population at a specific point or period of time" (O'Connor, 1990, p. 307). Everything that follows is an elaboration of that sentence.
The word norm shares the same etymology as normal (Online Etymology Dictionary, 2023), deriving from the Latin norma, which means a carpenter's square, standard, or pattern. Norms describe something that is "usual, typical, standard, or expected," or the usual amount (Cambridge Dictionary, 2023). They may be rules or standards of behavior in a group, such as shaking hands when greeting a stranger at a business meeting in North America. In that sense a norm can be qualitative or categorical.
Many norms, however, can be quantified, giving the expected amount of something in numerical form. An example is the value of 63.5 inches for the variable of height, which gives what is expected on average among adult women living in North America. A qEEG norm for the variable of alpha band amplitude, measured at a posterior 10-20 site in a healthy adult with eyes closed, falls in the range of 20 to 60 µV (Lewine & Orrison, 1995). Normative databases go further than a single expected value: they quantify the expected range a variable can take, with specific mean values and a measure of variability, the standard deviation, for the variable's range.
You can also think of qEEG norms as electronic tables of means and standard deviations for numerous EEG variables. Those statistics are calculated for each 10-20 site and for pairs of sites, from EEG collected on normally healthy individuals in adjacent age groups, across various states and tasks. The data are organized by qualitative variables such as site, site pair, age group, and recording condition, because the normal EEG is affected by all of those factors. Organizing the data this way lets deviations from normalcy emerge, which may suggest a hypothesis of pathology or impairment to be followed up by correlation with other sources of information, such as a neurological examination or neuropsychological testing, and possibly by treatment such as neurofeedback training.
qEEG norms serve as a reference for identifying deviations in brain function that may be associated with neurological or psychiatric conditions. By comparing a patient's EEG data to a normative database, you can identify abnormal patterns that may not be evident through standard EEG analysis. This comparison can aid in evaluating disorders including attention-deficit/hyperactivity disorder (ADHD), depression, anxiety, and epilepsy.
Normative databases are essential to the utility of qEEG in clinical practice. They enable the quantification of EEG data by converting raw EEG recordings into z-scores, which represent the number of standard deviations a particular data point lies from the mean of the normative group. These z-scores can highlight deviations in power spectral densities, coherence, phase lag, and other EEG metrics indicative of underlying neuropathology (John et al., 1988).
One of the key applications of qEEG norms is in the identification of neurodevelopmental disorders such as ADHD. Studies have shown that children with ADHD exhibit distinct qEEG patterns compared to their neurotypical peers, including increased theta activity and decreased beta activity. These patterns can be quantitatively assessed using normative databases, aiding diagnosis and treatment planning (Clarke et al., 2001).
Purposes of qEEG Normative Databases
Developers of databases begin by formulating a purpose. Those purposes include description, comparison, diagnosis, exploration of biomarkers, training protocol development, and scientific discovery.
Description
Generally, qEEG norms characterize or describe the range of what is expected for particular EEG variables in healthy participants. In this they resemble the norms used in health care for height and weight.
Anastasi (1976) put the underlying logic this way, writing about psychological test scores: "Norms represent the test performance of the standardization sample. The norms are thus empirically established by determining what a representative group of persons do on a test. Any individual's raw score is then referred to the distribution of scores obtained by the standardization sample, to discover where he falls in that distribution" (p. 67).
The norms of a qEEG database therefore have a descriptive purpose. They present what is normal for the sample of healthy individuals selected to represent the entire population of healthy people.
Comparison
The normative description of, say, the mean and variability of alpha power in a group of healthy participants resting with eyes closed can also serve as a benchmark. You use that benchmark to compare an individual, such as a new client, against what is normal, so you can determine whether the client's EEG is consistent with normal expectations or deviates from them. The database user asks a simple question: does this client's alpha power conform with the prediction I would make knowing the normal range of alpha power?
This comparative purpose resembles the practice in medicine of evaluating a patient's blood pressure against the normal expectation for healthy people of similar age. In a typical assessment before conducting neurofeedback, a qEEG normative database compares the participant's EEG to the values in the database and describes how and where the findings differ significantly from what is expected.
The comparative function of norms addresses what Anastasi (1976) wrote in the context of psychological test theory, which applies equally to the value of any EEG variable for any individual participant: "In the absence of additional interpretive data, a raw score on any psychological test is meaningless" (p. 67). To give meaning to a participant's EEG finding, you must place it in context. That means comparing it to the range of what is normal and identifying the degree to which the finding sits above or below normal expectation, based on the healthy participants assessed for the database, their average value, and how variable the values were among them.
The basic statistical methods described below are what quantify the degree of difference from expectation and its statistical significance.
Diagnosis
In clinical settings, a finding that a client's EEG differs from the norm may be integrated with other assessment findings to understand and diagnose the problems the client presents. Deviations from the norms in a qEEG database are not diagnostic in themselves, however. A statistically significant difference between client EEG findings and database norms does not necessarily carry clinically significant importance, and it does not predict how the client functions in daily activities. What statistical significance can do is suggest hypotheses to explore, which, together with information from other sources, may contribute to a valid diagnosis made by a qualified health provider.
Statistically significant qEEG findings must be considered in the context of clinical presentation, medical history, results of other relevant tests, and an understanding of the anatomy, physiology, and function of the brain. You also need knowledge of base rates in the setting where you work, meaning how often diagnoses of various types actually occur there. This discussion is instructive precisely because it names the limitations of qEEG findings.
Exploration of Biomarkers
Biomarkers are biological markers, defined as "objective indications of medical state observed from outside the patient, which can be measured accurately and reproducibly" (Strimbu & Tavel, 2010, p. 463). Related to biomarkers are endophenotypes, meaning "within phenotypes," which are quantifiable phenomena that link underlying biological processes to symptoms and are more stable than the symptoms themselves. McVoy and colleagues (2019) present a review of possible biomarkers in child psychiatric disorders.
Several databases have been used to explore EEG biomarkers and endophenotypes. Examples include work on ADHD (Arns et al., 2008; Ji et al., 2022), Alzheimer's disease (Jeong et al., 2022), Parkinson's disease (Caviness et al., 2016), and traumatic brain injury (Thatcher et al., 1989).
Training Protocol Development
Differences between the client's EEG and normative values, measured both before and after neurofeedback or another intervention, can be compared to determine whether the client's EEG has achieved a degree of normalization. This fulfills the purpose of outcome evaluation, and it is the basis on which many practitioners justify a course of training.
Scientific Discovery
In a research setting, a special group such as individuals with major depression or mild traumatic brain injury may be compared to the normative group in a qEEG database to identify what best differentiates the two groups. Studies that use discriminant function analyses to separate groups, for instance in traumatic brain injury, take exactly this approach (Thatcher et al., 1989). Discriminant function analyses may also be used clinically.
Databases are also used to investigate the association between EEG variables and measures of psychological function such as IQ (Thatcher et al., 2008). Thatcher and colleagues (2008) found that the qEEG variables of phase difference, phase reset per second, phase reset locking interval, and coherence were most strongly related to IQ. Comparisons have also been made between qEEG measures of brain function and other neuroimaging methods such as MRI (Thatcher et al., 1998), where these investigators found good correspondence between qEEG and MRI results.
In summary, qEEG normative databases are used in both clinical and research contexts. They support description, comparison, diagnosis, biomarker identification, treatment planning and evaluation, and scientific exploration.
A qEEG norm quantifies what is usual for a defined population at a defined time, expressed as a mean and standard deviation for each variable, at each site, in each age group and recording condition. Databases serve six purposes: describing what is normal, providing a benchmark for comparison, contributing to diagnosis, supporting biomarker and endophenotype research, guiding and evaluating neurofeedback protocols, and enabling scientific discovery. A statistically significant deviation is a hypothesis, not a diagnosis. Meaning comes only when the deviation is placed alongside clinical presentation, history, other test results, and local base rates.
What a qEEG Normative Database Contains
The contents of a qEEG normative database are the values of multiple EEG variables measured among normally healthy individuals across a range of ages. The database uses those values to calculate means and standard deviations, ensuring along the way that the values are normally distributed. It organizes its contents by age group, recording condition, and variable type. The variables included are those relevant to understanding the brain's structure and function and their integrity in clinical settings.
Variables
Database variables usually include power, relative power, and power ratios for the typical EEG frequency bands at each 10-20 site and pair of sites. Methods of qEEG analysis continue to progress, so calculations can now be made for variables from subcortical sites such as the cerebellum (Thatcher et al., 2020). Amplitude may also be calculated for single hertz bins.
Some databases with inverse solutions provide amplitude for Brodmann areas and anatomical structures. Some can produce reports showing results for the sites that comprise various brain networks, such as the salience network and the default mode network, and for sites involved in conditions such as depression and anxiety. Connectivity measures such as coherence, or comodulation (Kaiser, 2008), and various aspects of phase may also be database features. Asymmetry of amplitude between homologous sites and peak frequency may be calculated as well.
Variables can be calculated for various montages, including linked ears, average reference, and Laplacian. Both raw and z-score values for these variables are included in a database. The z-score calculations are what make it possible to compare an individual to the healthy normative population and to deliver z-score neurofeedback.
Some EEG features are deliberately absent from qEEG databases. Wave patterns such as epileptiform events are better appreciated with quantitative methods different from those used in the databases reviewed here. Waveforms of significance such as beta spindling, and changes in mental state, are also often identified more clearly by visual inspection.
Values
Each variable contains values, one for each participant in the database. Those values are aggregated or summarized with statistics such as the mean and standard deviation. Those two statistics are the basis for calculating z-scores and for judging the statistical significance of the difference from normal that a clinical participant might show.
Montages
Many variables in a database can be calculated in different versions depending on the montage you select. Linked ears, average reference, and Laplacian montages provide different views of the EEG and calculate EEG variables differently in order to do so. Choosing a montage is therefore not a cosmetic decision; it changes the numbers you are comparing to the norms.
The Probability and Statistics Behind Database Use
The mathematical analysis of data in a qEEG normative database serves the purposes described above. At a basic level, databases compute statistical quantities for variables, including means and standard deviations. Databases also ensure that their data are normally distributed in the bell-shaped manner referred to as Gaussian, so that values can be interpreted with reference to the statistical significance of their difference from the sample mean.
Descriptive statistics aim to describe and estimate the true value of a variable in the entire population of interest, so that results can be generalized to new participants who were not assessed for the database. Suppose the population of interest is adults aged 30 to 40. You want to use the information in the database with people anywhere on the planet. If it were possible to measure alpha power at P4 for every person in that age range and calculate the average, the result would be represented by μ, the Greek letter mu, and the variability would be represented by σ, the Greek letter sigma.
Because it is not possible to measure every 30- to 40-year-old, you instead collect a sample who can stand in for the entire population. Measuring alpha power at P4 in that sample estimates what the true values of μ and σ would be. The average of those sample measures, the mean, often written as M, estimates μ, and the variability of those measures, the standard deviation, often written as S, estimates σ. To the degree that the database sample resembles or adequately represents 30- to 40-year-olds across the globe, the database results may be said to generalize and to be validly used with that population worldwide.
Mean
By way of quick review, the mean or average of a variable is calculated by adding all values for that variable in the database's sample of normal individuals and dividing the sum by the number of individuals in the sample. It is often shown by M or by X.
Standard Deviation
Databases also show how much the values for a variable differ from each other, or vary. That is shown quantitatively by the standard deviation (S), sometimes represented by SD. The standard deviation is calculated by finding the difference between each value and the mean, squaring each difference, and dividing the sum of squared differences by the number of individuals in the sample. That result is called the variance. The square root of the variance is the standard deviation, which is used more commonly than the variance to show how individual values deviate from the average.
z-scores
Z-scores, also called standard scores, are extremely useful for describing and comparing qEEG findings and for delivering neurofeedback. You calculate a z-score using the mean and standard deviation for a variable: subtract the mean from the value and divide the difference by the standard deviation. When this is done for all values of a variable, the resulting z-scores have a mean of 0 and a standard deviation of 1. That quickly shows, for any value, how far it lies from the mean, and, if the values are Gaussian, how likely such a value is to occur if drawn at random from the database sample.
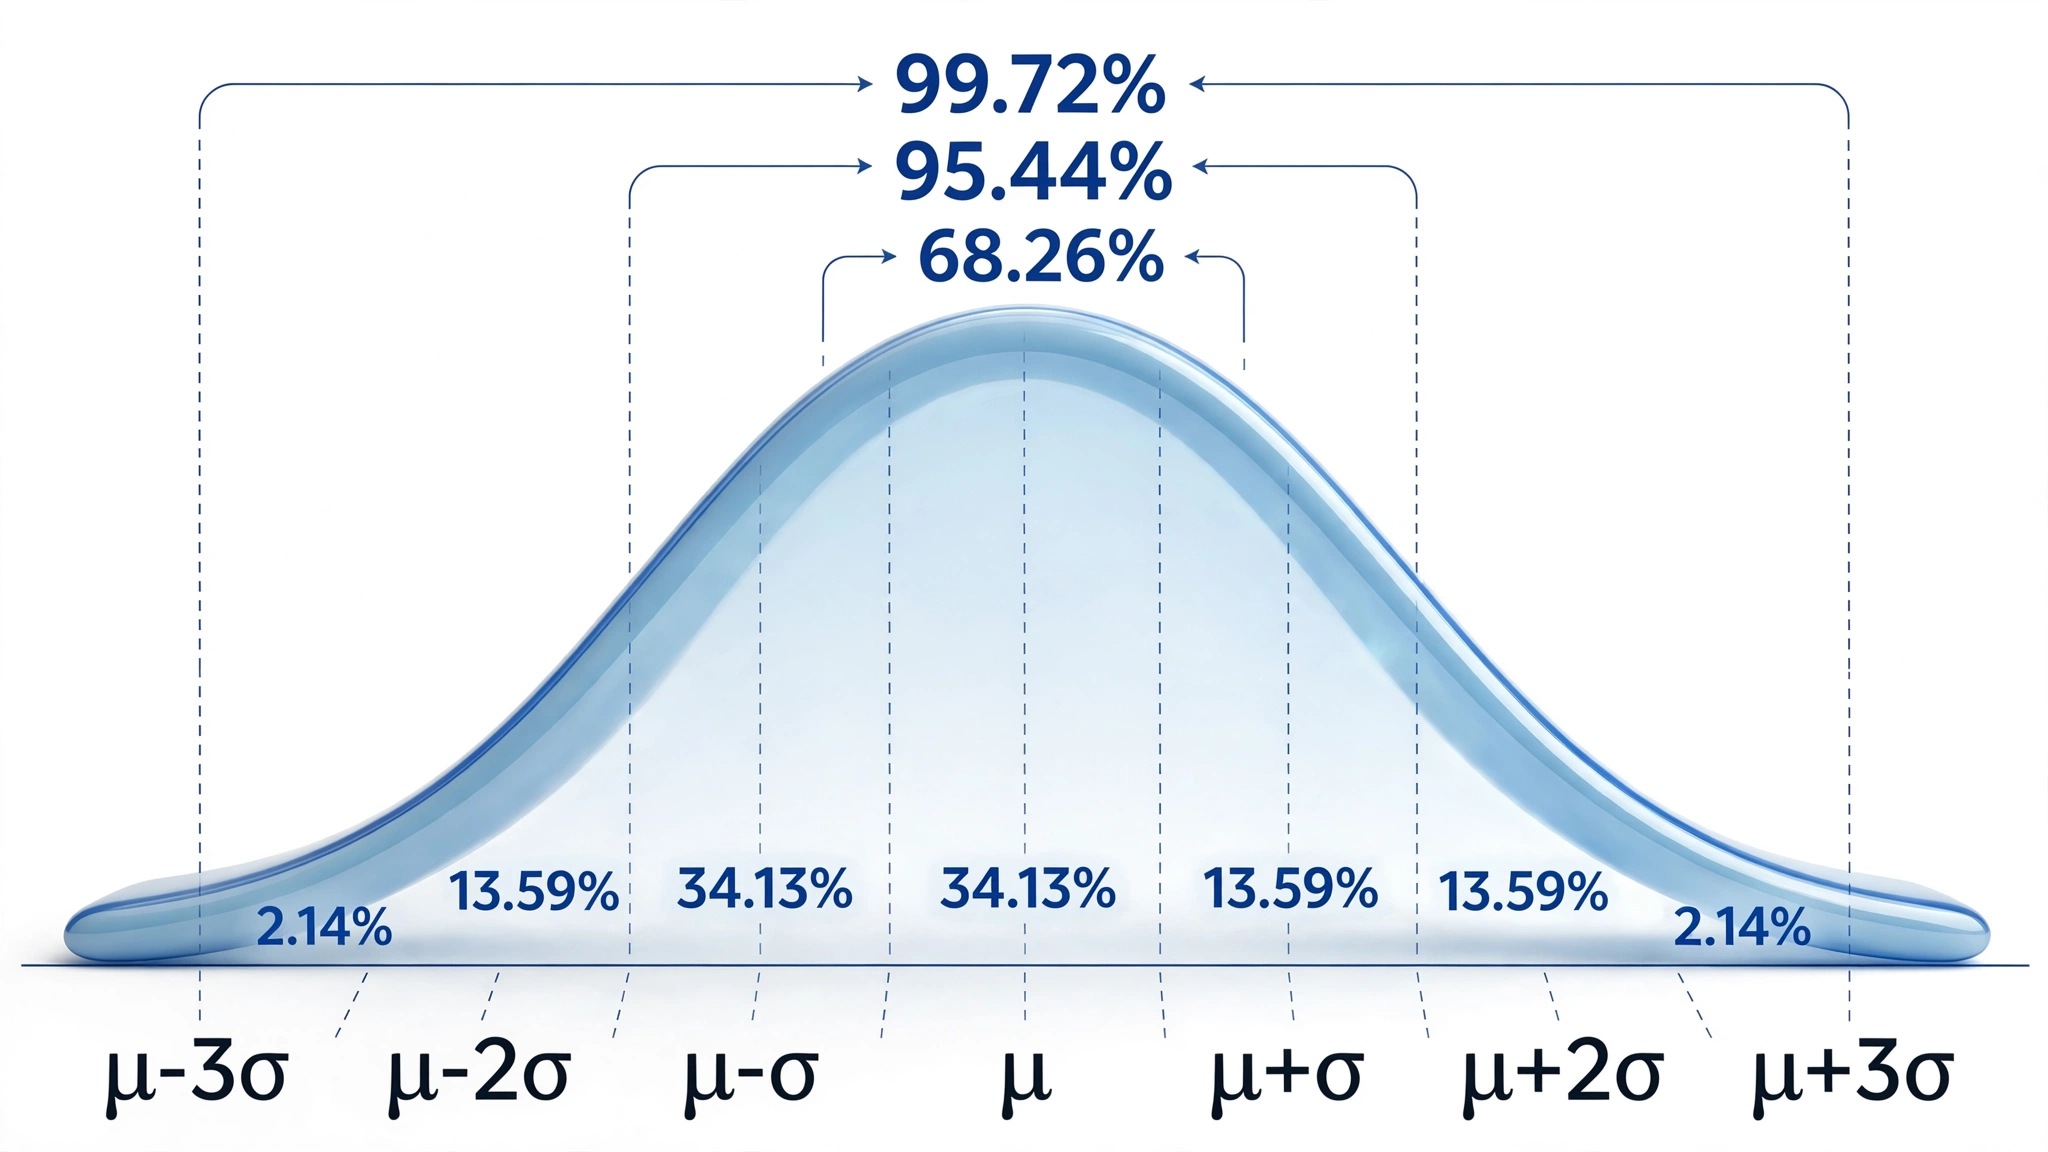
As the discussion of Gaussian distributions below explains, about 68 percent of database participants will have a value between -1 and +1 for any variable. Slightly more than 95 percent will have a value between -2 and +2. A value exceeding +2 occurs among normally healthy database participants with a probability of somewhat less than 5 percent.
The criterion or threshold for what counts as "normal" can therefore be defined quantitatively, albeit somewhat arbitrarily, in z-score terms. A database user could decide that "normal" means a z-score in the range seen among 95 percent of healthy people, which is -2.00 to +2.00. Z-scores outside that range would then be called statistically significantly different from the mean.
When a client's data are compared to the database, the client's data can also be converted to z-scores, and this has great practical utility. It provides a common unit of measure so that you can quickly see the statistically significant difference between the client's value and the mean value of normal participants.
Z-scores also provide a common unit of measure across different variables. Alpha power is measured in µV, but coherence is not. Both can nevertheless be transformed to z-scores so that their relative significance, in terms of difference from normal, can be compared directly. When assessing a client, converting findings to z-scores gives you a common metric for examining which of many variables carries the greatest statistical significance, because the z-score always has a mean of zero and a standard deviation of 1.
Neurofeedback practitioners use qEEG databases to develop z-score training protocols. Neurofeedback software that performs z-score training lets you identify variables with statistically significant or otherwise important values found during assessment. You then set neurofeedback thresholds in z-score terms to specify how normal the client's EEG for that variable must be before feedback is produced. The software calculates the value for the EEG variable and converts it to a z-score using the database statistics for that variable.
Based on the client's z-score and how far it deviates from the normative mean, the software delivers feedback or withholds it, according to how you have defined normal. Common thresholds are 2 or 3 standard deviations from the mean of the normal participants. With a threshold of 2, the client's EEG value must be consistent with 95 percent of the normal standardization group before feedback is provided. Client values beyond a z-score of 2 are statistically significant because they are unlikely to occur among healthy normal people, with a probability of occurring only 5 percent of the time.
The Normal Gaussian Distribution
qEEG normative databases contain means and standard deviations of EEG variables collected from healthy participants in adjacent age groups under defined assessment conditions such as resting eyes open, resting eyes closed, and various tasks. Using z-scores is advantageous when comparing an individual's assessment data with the healthy normal participants in the database. Using z-scores also requires that the distribution of values for a variable be Gaussian, or normally distributed.
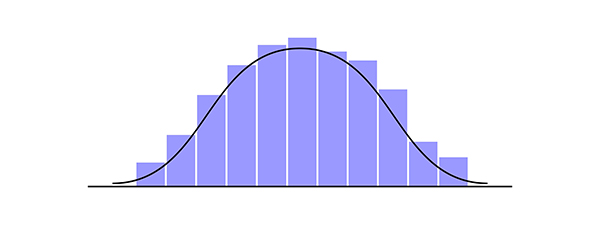
What is a Gaussian distribution? The type is named after the mathematician Carl Friedrich Gauss, who lived from 1777 to 1855. A Gaussian distribution, also called a normal distribution, has the familiar bell shape. It represents the relationship between a variable, such as alpha power, and the probability or frequency of a specific value for that variable in a sample of participants. A Gaussian distribution has a peak in the middle, neither too pointed nor too flat, called the mean, and it is symmetric, with the same shape on both sides.
When measured values are transformed into z-scores, the scores remain distributed in a Gaussian manner. The figure below shows the percentage of scores that fall between two symmetric z-score values, along with the cumulative percentage for any z-score, meaning the percentage of z-scores less than the selected value. On the horizontal axis, the figure shows z-scores, where μ represents the hypothetical mean of the entire population from which the database participants were sampled and σ represents the corresponding hypothetical standard deviation.
By comparison, the participants who comprise a database have their mean represented by M and their standard deviation represented by S. In the figure below, M equals 0 and S equals 1 for z-scores calculated for database participants. What these graphs show is that the largest number of scores occur around the middle, with very high and very low scores occurring less frequently.
To make valid statistical comparisons between an individual's EEG value and that of the comparison group, and to use z-scores at all, the distribution of values in the database must be Gaussian (Thatcher & Lubar, 2009). The Gaussianity of a distribution can be tested statistically.
Sometimes the data are not normally distributed. In those cases, mathematical transformations are applied so that the data become Gaussian. Although many variables such as height or weight have a normal distribution, some EEG variables must first be transformed, for example with a log10 transformation, before z-scores may be validly calculated (Thatcher et al., 2005a).
Gaussian Sensitivity
As described by Thatcher and colleagues (2003, p. 101), Gaussian sensitivity is important because it describes the degree of uncertainty, or conversely the accuracy and certainty, that a data set carries. In the forensic context, Gaussian sensitivity matters because of its relationship to an instrument's measurement error, which must be demonstrated as one of the Daubert standards (Daubert v. Merrell Dow, 1993).
Thatcher and colleagues (2005a) define sensitivity as the difference between two distributions: the ideal Gaussian distribution and the distribution of observed data values for the sample whose EEG has been measured. The difference between the two measures how closely the measured sample data approach the ideal Gaussian distribution. Compare this with the definition used to evaluate a diagnostic test, where sensitivity is the test's ability to identify individuals with a disease, and the related concept of specificity is the test's ability to identify individuals without it (McNamara & Martin, 2018).
Kurtosis, Skewness, and Normal Distributions
As described by Thatcher and colleagues (2003), having a normal distribution is important for minimizing the error with which the data estimate true scores. Data distributions can deviate from Gaussian normality in two ways, kurtosis and skewness.
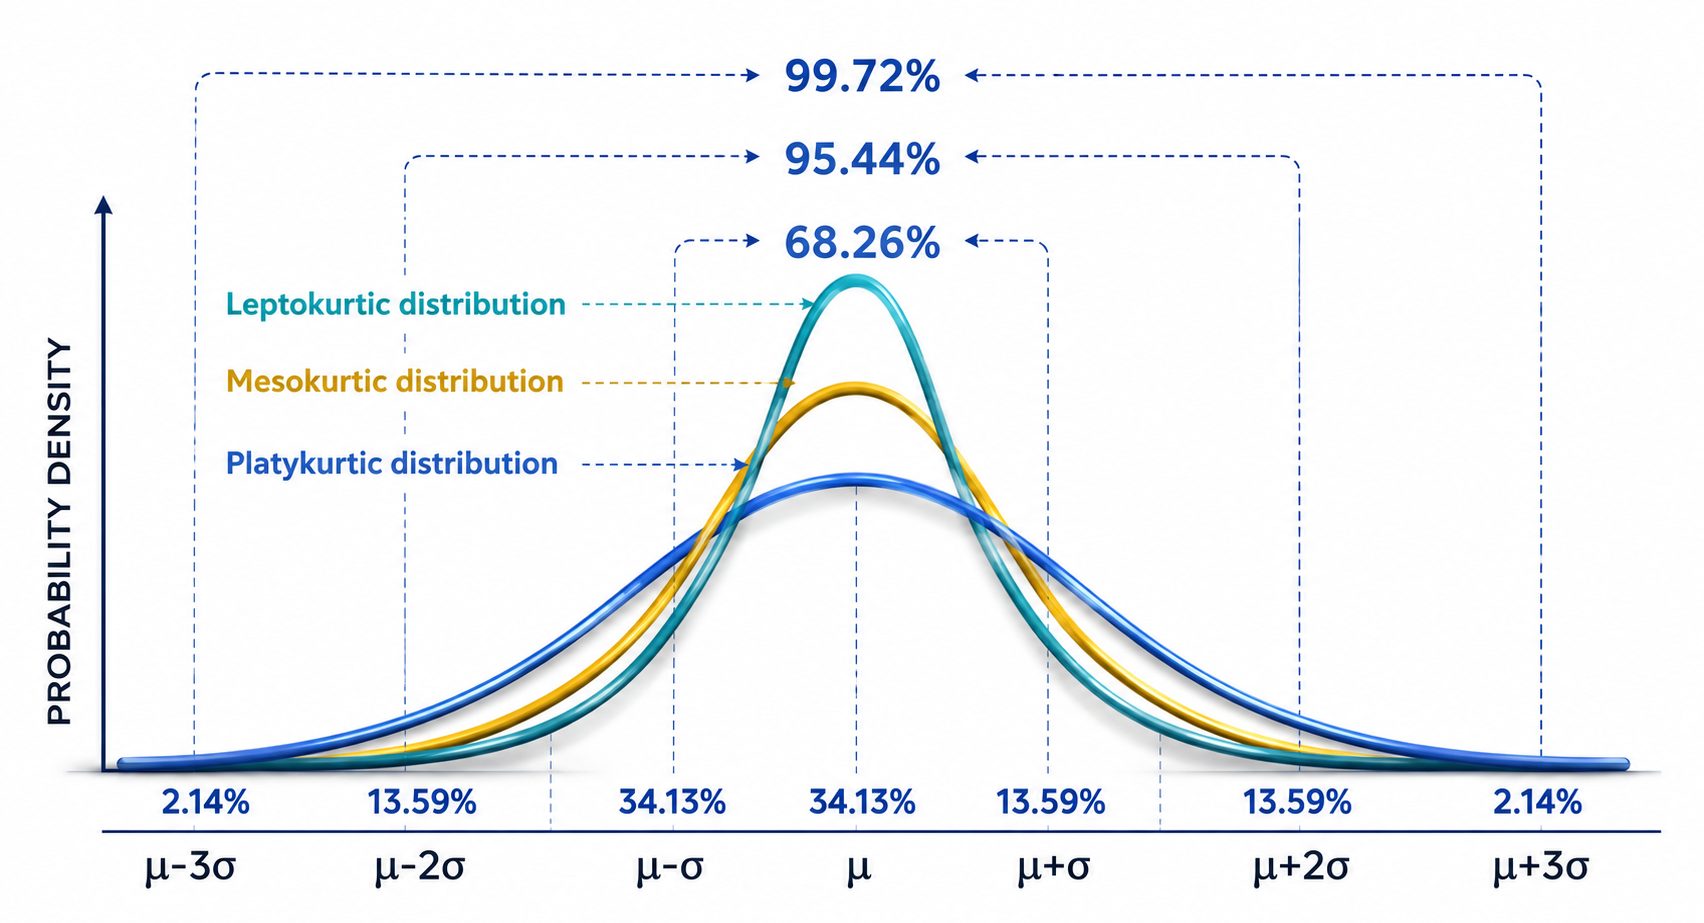
Kurtosis refers to the degree to which the tails of a distribution extend away from the mean, with the word derived from the Greek for bulging. Leptokurtic distributions have "lepto," or narrow, bulging, and platykurtic distributions have "platy," or flat, bulging. The Gaussian normal distribution is mesokurtic, with "meso," or medium, bulging.
A leptokurtic distribution has a peak that is more pointed than normal and tails that extend farther from the mean. That means a leptokurtic distribution has more outliers, meaning data points that lie far outside the expected range. A platykurtic distribution has a flatter peak, and its tails extend less far from the mean than a normal distribution does.
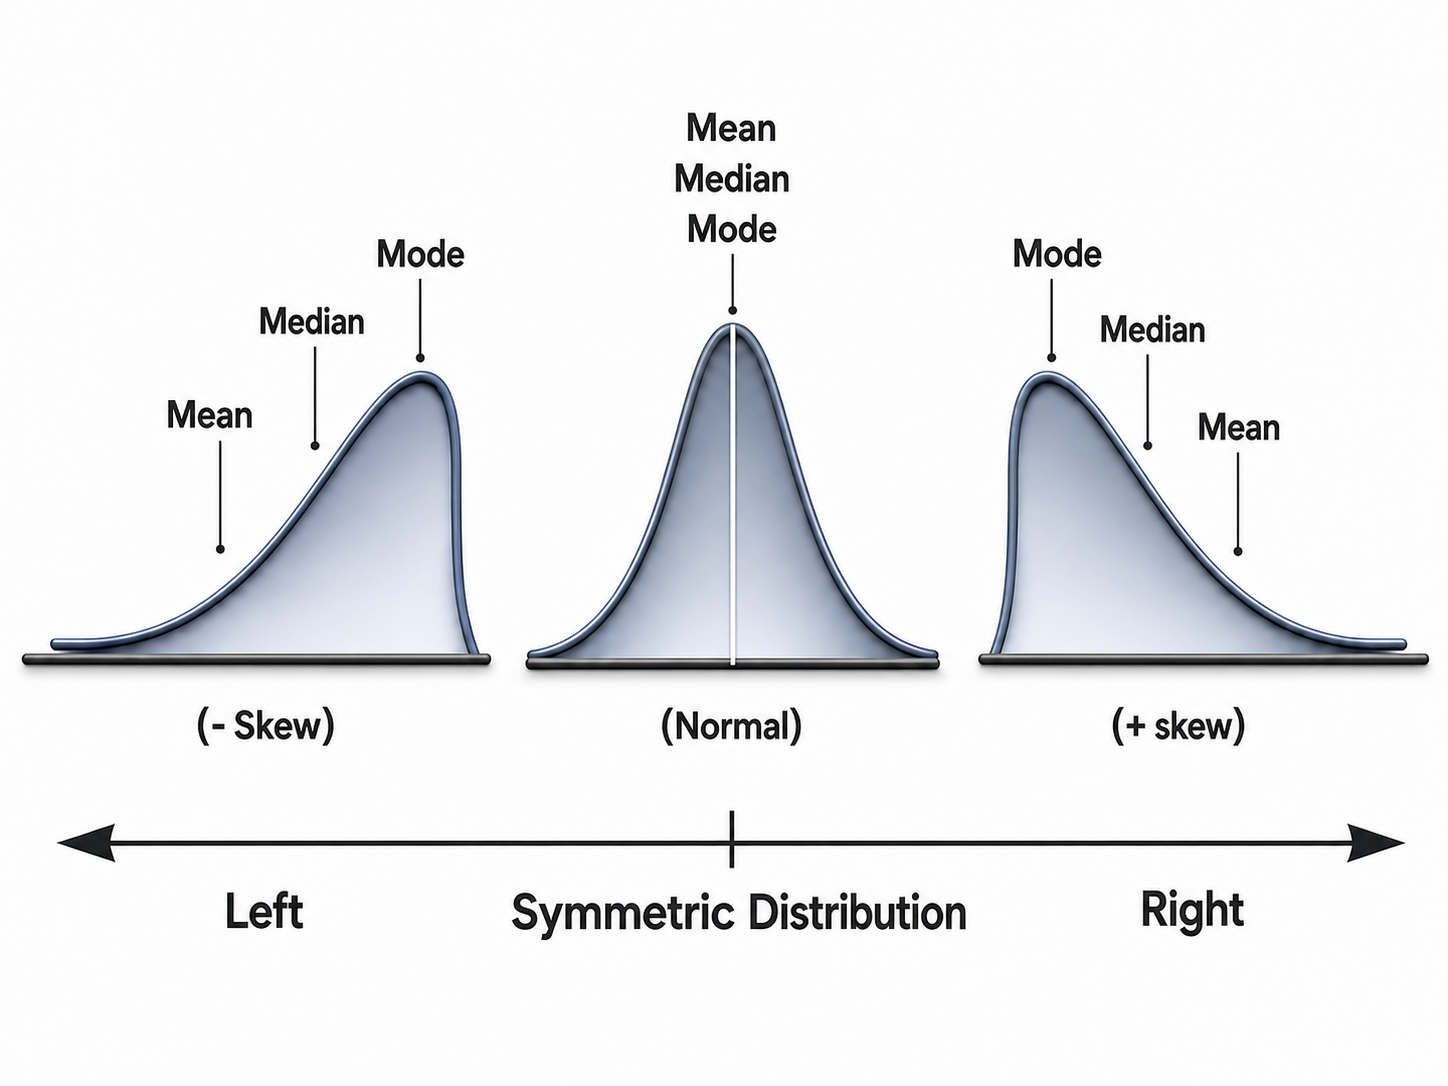
Skewness refers to the degree to which the symmetry of a distribution is reduced because the peak sits to one side or the other of the mean. Negatively skewed distributions have a mean less than their mode. Positively skewed distributions have a mean greater than their mode, the mode being the peak of the distribution, or the value taken on by the largest number of observations.
We adapted this graphic from © Iamnee/iStockphoto.com.
Both kurtosis and skewness can be calculated to see how far a distribution deviates from Gaussian normality. If a distribution deviates significantly, the values in it can be mathematically transformed, for example with a log10 transformation, to produce normally distributed data that can be examined more validly with statistics and that carry reduced errors of estimate.
Percentiles
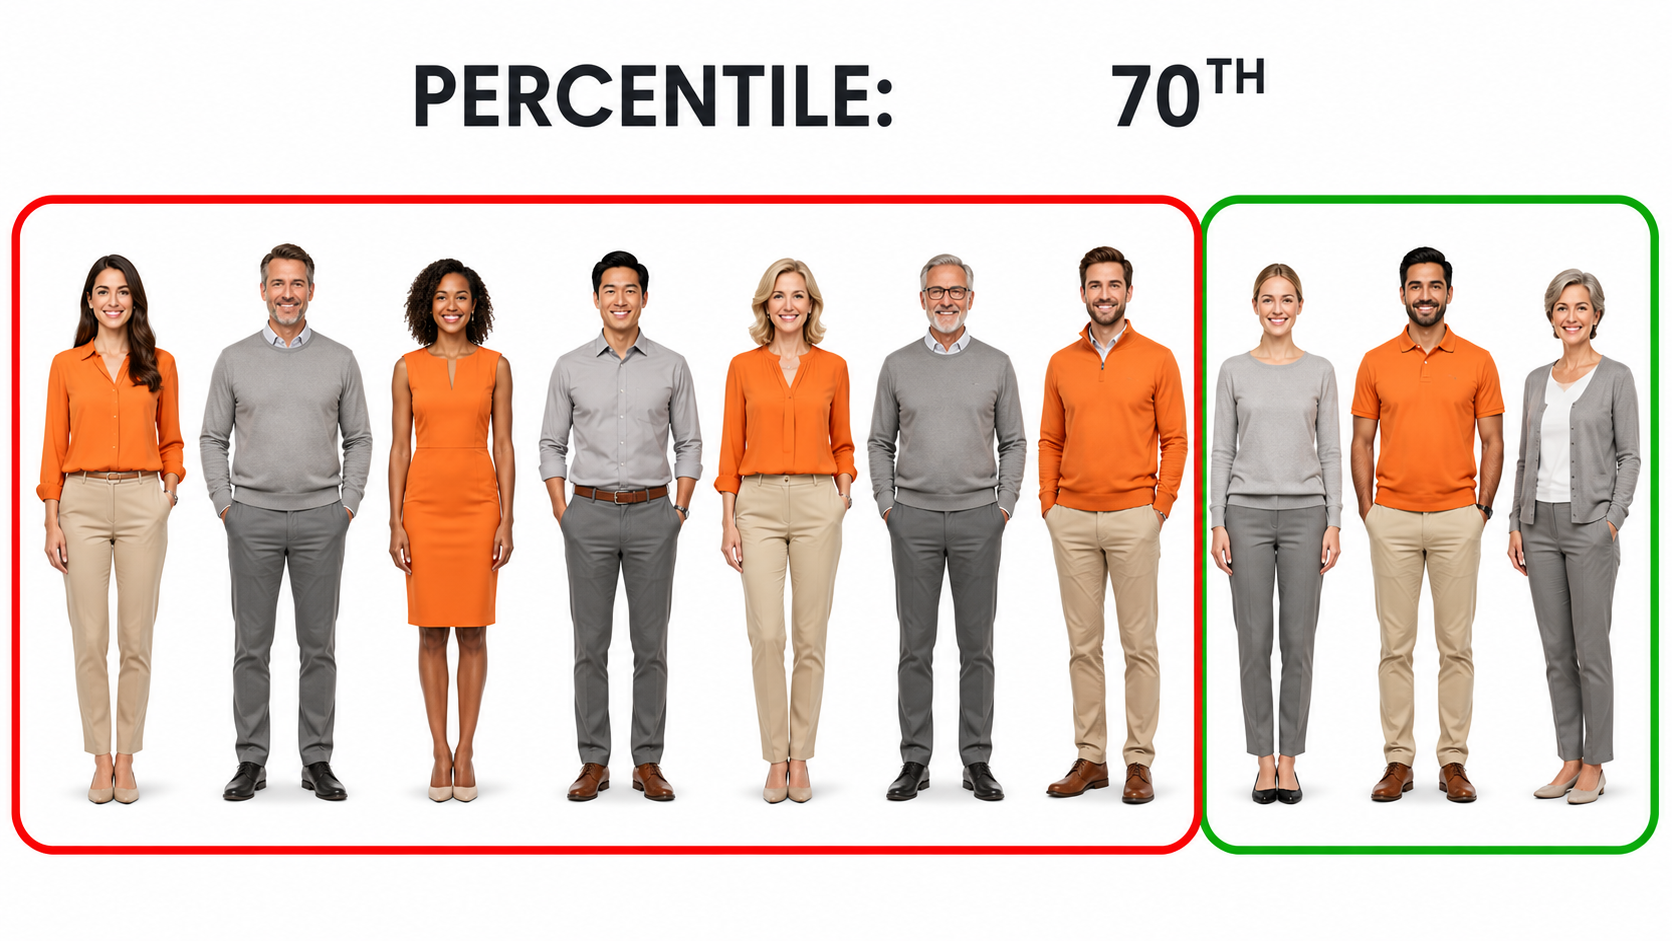
Percentiles range in value from 0 to 100. Any given percentile indicates the percent of scores or participants that fall below it. A test score equal to the 70th percentile means that 70% of scores for that test were lower.
Defining Normal
With reference to the figures above, it is possible to define "normal" statistically. A database user could set the normal range as any z-score between -2.0 and +2.0, on the knowledge that about 95 percent of z-scores for database participants fall in that range. Such a definition is somewhat arbitrary. Another user might define normal as any z-score between -1.5 and +1.5, narrowing the range of what counts as normal and expanding the range of what counts as abnormal. Z-scores outside the selected range are then defined as statistically significant, unlikely to have occurred by chance among normally healthy individuals, unexpected, or "abnormal."
Alpha Levels and P-Values
Experimenters set what is known as an alpha level, for example α = .05, to specify the degree of certainty they want statistical test results to achieve before drawing conclusions. Choosing α = .05 means that if the test result is less than .05, there is less than a 5% chance the result occurred merely by chance.
P-values are the probability that a result from a statistical test is due to chance. Suppose a statistical comparison of test scores in two groups yields a difference that would occur less than 5% of the time by chance alone. In that case the test's significance is p < .05. Alpha levels and p-values are used by qEEG and neurofeedback providers to define the level of significance an EEG variable must reach before it is considered significant or abnormal.
Correlation Coefficients
A correlation coefficient measures the linear association between two variables. It shows how confidently you can expect one variable to change when a second variable changes. Values range between -1.00 and +1.00, with positive values meaning the two variables tend to increase together and negative values meaning one tends to decrease as the other increases.
Strong correlation coefficients, meaning those close to either +1 or -1, can be tested for statistical significance. If significant, each variable is a good predictor of the other. A coefficient of 0.00 means no predictive relationship between the two variables. Correlation coefficients are measures of association and are used in the calculation of EEG measures such as coherence.
T-tests
A t-test is a statistical test used to compare the average scores for two groups measured at a single point in time, to see whether the difference is significant. Alternatively, a t-test may compare findings for a single group measured at two points in time, to see whether a change has occurred, for example as a result of neurofeedback training.
Standard Error of Measurement and Confidence Intervals
The standard error of measurement (SEM) is used to calculate confidence intervals around obtained scores. Its calculation is based on a test's standard deviation and its reliability. The higher the reliability and the lower the standard deviation, the smaller the SEM, and the more confidence you can place in the accuracy or consistency of the EEG value you are measuring. The SEM can be expressed in the same units as z-scores, that is, in standard deviation units.
A confidence interval is a range of values around a measured value that shows how confident you can be that the measured value is true or accurate. A 95 percent confidence interval, for example, shows the range within which the true value of a measurement lies with 95 percent probability when calculated over many samples. It does not mean that there is a 95% chance that the true mean lies within a specific confidence interval. Confidence intervals are calculated from a sample's mean and standard deviation, with the added requirement that the distribution of measures be normal.
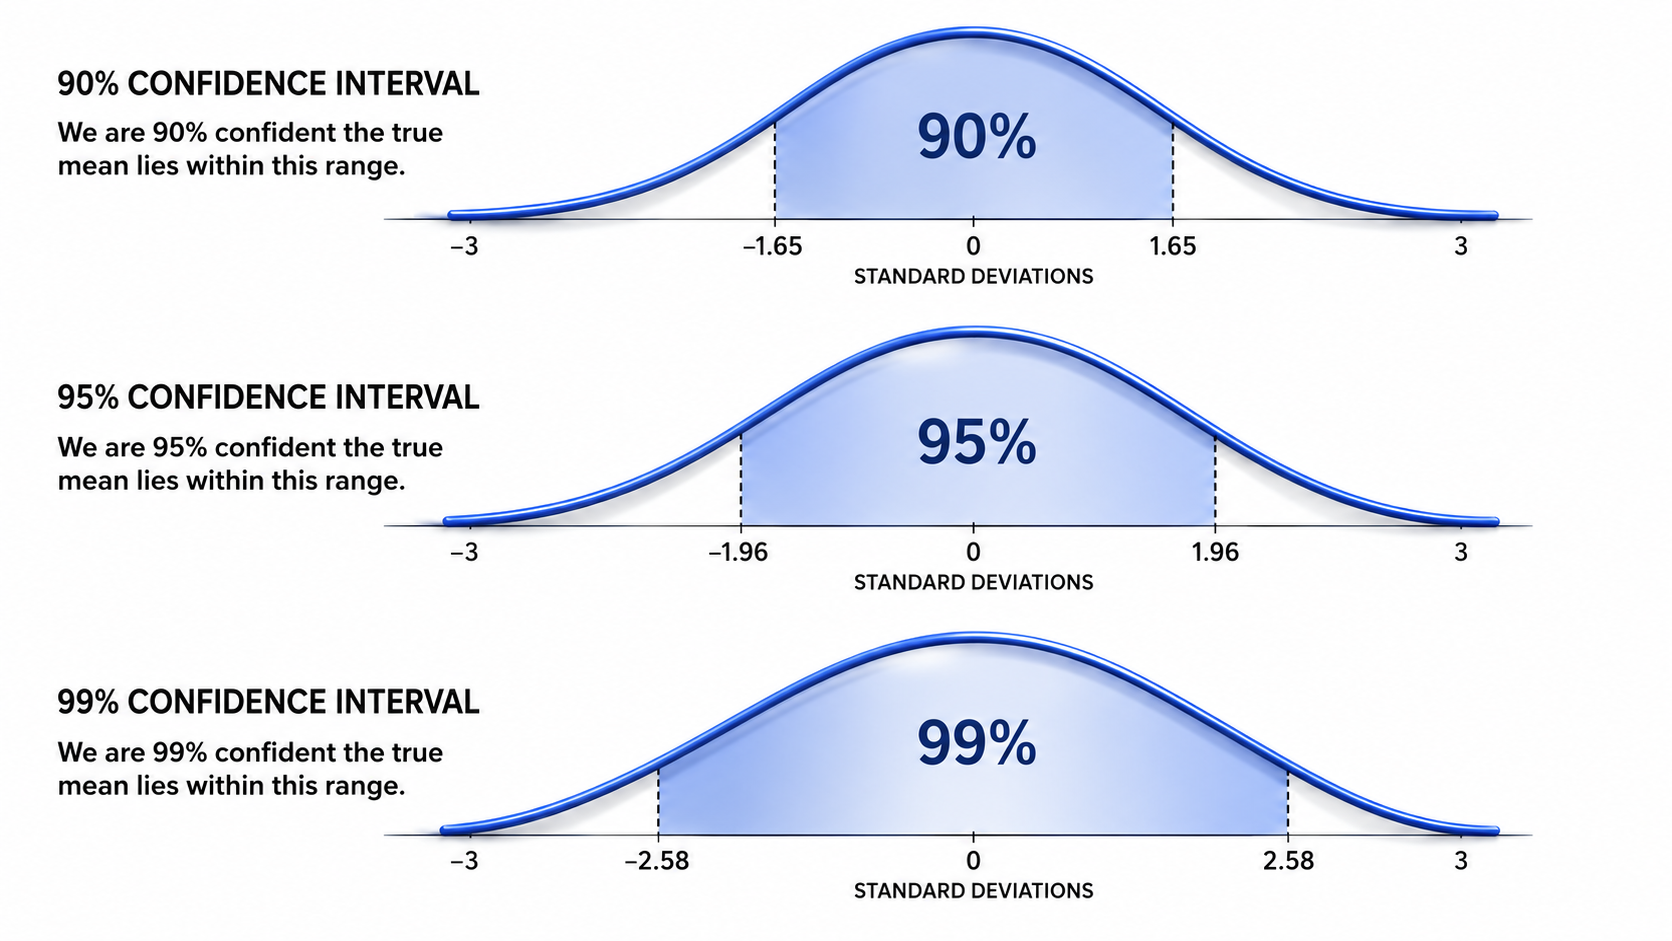
A variable takes on many values; measuring it in a sample produces a distribution with an average, with values on either side occurring less and less often. That distribution is summarized by the mean and the standard deviation, and its shape is judged against the Gaussian ideal using kurtosis and skewness. Once the distribution is Gaussian, whether naturally or after a log10 transformation, z-scores become valid, giving you one common metric for every EEG variable regardless of its original units. Setting a z-score criterion such as plus or minus 2 defines "normal," and alpha levels, p-values, correlation coefficients, t-tests, the standard error of measurement, and confidence intervals supply the rest of the inferential machinery.
Check Your Understanding
- Write out the steps for converting a raw alpha power value at P4 into a z-score, naming each statistic you need.
- Why must a distribution be Gaussian before z-scores can be used validly, and what is done when it is not?
- Distinguish kurtosis from skewness, and describe what a leptokurtic distribution looks like compared with a mesokurtic one.
- Two clinicians define normal as plus or minus 2.0 and plus or minus 1.5 standard deviations respectively. How does that choice change the number of findings each will call abnormal?
- How does Gaussian sensitivity differ from the sensitivity of a diagnostic test, and why does the distinction matter in forensic work?
Methods Used to Derive qEEG Norms
qEEG normative database developers must seek approval from an approved institutional ethics review board before recruiting participants and recording their EEG. Part of participant recruitment is then the use of an approved consent form. The participant provides consent for data collection after being informed about risks, benefits, later access to information about the database's progress, storage and use of the data, and any financial compensation.
Sample Selection and Data Collection
The first step in creating a normative database is selecting a representative sample from the general population. That sample should be large and diverse enough to account for variations in age, sex, and other demographic factors. EEG data are then collected from these individuals under standardized conditions to ensure consistency across recordings (John et al., 1988).
Data for qEEG normative databases come from individuals in a series of age ranges who are considered healthy within normal expectations. EEG is collected from them in different conditions so that different EEG variables can be calculated. The participants are selected to stand in for the entire population of healthy individuals, from whom it would be impossible to collect data exhaustively. Both the participants in the database and any future participants compared to it are assumed to come from the same or a similar population.
As noted above, a database developer first formulates a clear idea of the database's purpose. The developer considers what the database will be used for, what population needs to be represented and described, and who will eventually be compared to it. For qEEG normative databases, the relevant population is normally healthy individuals. Some databases limit their participants to children or to adults, and some span the entire developmental range, which lets users validly compare their clients to participants of the appropriate age.
Participant Recruitment
The database developer may use various recruitment strategies. Examples include posting flyers with contact information, making presentations at meetings that parents attend, drawing from a research participant pool at a university, placing announcements in print publications, asking family physicians and health clinics to forward contact information for interested patients, and making announcements on social media, television, and radio (Kubicek & Robles, 2016; UCLA Research Administration, 2021).
Recruitment bias, however, may affect the external validity of the resulting database if some factor systematically occurs in the sample but not in the population the sample is supposed to represent. If a sample for a database of blood pressure values includes only White participants, for instance, the resulting data may not validly represent Black, Hispanic, Asian, or Native American participants (Zakai et al., 2022).
Recruitment bias does not appear to affect qEEG databases strongly, at least with respect to culture. The findings of Matousek and Petersen (1973a, 1973b) in Scandinavia correspond well with results from a sample of children with different cultural and ethnic backgrounds (John, 1981).
Stratification
Age systematically affects the EEG (Gasser, Verleger, et al., 1988; Gasser, Jennen-Steinmetz, et al., 1988; John et al., 1977; Matousek & Petersen, 1973a, 1973b; Thatcher, 1991, 1992, 1994; Thatcher et al., 2003). For that reason database participants are stratified by age range, with the ranges defined more narrowly for children because normal development brings relatively rapid changes in the EEG. Matousek and Petersen used one-year age groupings to study children.
Thatcher, Walker, and Giudice (1987) used a sliding age range in which the ranges overlap, so that some participants were included who were chronologically somewhat younger or older than the nominal age of the range. This was done to improve the statistical properties of the sample and make it more amenable to analysis.
In the NeuroGuide database (Thatcher & Lubar, 2009), spans of 2 years form the levels of age stratification from birth to age 16, after which the ranges widen to a maximum of 35 to 82 years for the oldest level. The database user then compares their client to database participants of similar age, so that any differences found are not simply the result of age differences.
Because sex, race, socioeconomic status, and geographic location do not affect the EEG in the same systematic way, they are not needed for stratification. A study comparing urban participants in the United States with mixed urban and rural Scandinavian participants showed no major differences in results (John, 1981).
Representativeness
Database developers attempt to ensure that the sample they have recruited is representative of the population of interest, which for qEEG norms is the population of people who are healthy within normal expectations. Suppose the developer intends the database to be used with individuals of different races, cultures, geographic locations, socioeconomic levels, and intellectual abilities. In that case the developer will try to include participants who represent the typical range of values for those variables, even though those variables are not used for stratification.
Inclusion and Exclusion Criteria for Participant Selection
Developers of EEG normative databases use inclusion and exclusion criteria to ensure that the participants are healthy within normal expectations. Inclusion criteria are the characteristics a participant must have to be included. Screening instruments may be used to ensure that a candidate has met normal developmental milestones and is performing at grade level in school.
Exclusion criteria disqualify a prospective participant. These are often findings of neurological disease, psychiatric illness, developmental disorder, learning disability, or addictive behavior that could affect the EEG. The resulting pool of participants is therefore considered healthy and normal, in that their physical and mental condition falls within a range that lets them perform at least a minimum of reasonable age-appropriate day-to-day functions.
The variables used for inclusion and exclusion must be identified, and the method of measuring them must be specified. Methods for ascertaining a recruited participant's status vary. Participant or parent interviews, questionnaires, file reviews, and test results are all commonly used.
Sample Size
Using the defined age strata and the inclusion and exclusion criteria, the developer recruits enough participants to produce normally distributed data for the variables in the database. That normality is necessary for the valid calculation and use of z-scores. In addition to adding participants or transforming values until a distribution is normal, statistical regression methods have also been used to construct norms and to calculate the number of participants needed (John, 1977; Timmerman et al., 2021).
Thatcher and Lubar (2009) argue, however, that sample size matters less than several other factors. Those factors are eliminating artifacts, calibrating amplifiers, using good data collection methods, and the degree to which the measured values conform to a normal Gaussian distribution.
A colleague sends you a report from a database you have never heard of, showing your client three standard deviations above the mean for frontal beta. Before you build a protocol on that finding, ask what the database was built from. Were participants screened for neurological and psychiatric history, or were they clinical clients whose records were "cleaned" after the fact?
Then ask about the numbers and the hardware. How many participants sit in your client's age band, and how wide is that band? Was the amplifier that recorded your client matched to the amplifier that built the database? A z-score is only as trustworthy as the sample and the hardware behind it, and every one of those questions is answerable before you commit a client to twenty sessions of training.
Data for qEEG Databases
Collection Methods, Conditions, and Sample Duration
Data for qEEG databases are collected from standard EEG electrode sites, with impedance or offset appropriately minimized, using standardized recording methods in well-controlled conditions. Participants must be rested and alert, taking their normal medication, without having had poor sleep or excess coffee or intoxicant intake.
Data are collected in defined conditions, for instance with the participant resting and alert with eyes open or closed. Sometimes EEG data are collected while the participant performs a cognitive task, such as attending to or recalling verbal material, or event-related potential data are collected in response to various stimuli. Kropotov and colleagues developed the Human Brain Institute database with several task and ERP conditions in addition to resting conditions (Kropotov, 2009; Kropotov et al., 2005).
As Thatcher and Lubar (2009) note, many databases are based on recording the EEG while the participant is awake and resting with eyes closed and with eyes open, because those conditions can easily be replicated with new participants whose results are to be compared to the database. Thatcher and Lubar (2009) also point out that active conditions can help reveal the brain structures involved in specific tasks.
How much data do you need? Salinsky, Oken, and Morehead (1991) suggest that as little as 60 seconds of data produces results that are 92% reliable for some variables. Hughes and John (1999), among others, recommend that between 2 and 5 minutes of artifact-free data be used to calculate EEG variables reliably.
Amplifier Matching
A factor related to both data collection and database use is amplifier matching. Different qEEG amplifiers have different electrical frequency response curves that can affect EEG findings, especially at frequencies below 2 Hz. That can render some z-scores erroneous when the data are collected with an amplifier different from the one used to construct the database. The absolute power finding from one amplifier may differ from that of another amplifier used under the same conditions with the same participant.
Before 1990, the study of absolute power was sometimes avoided altogether if the researcher used an amplifier different from the one used to construct the database. Different amplitudes were sometimes found with different amplifiers, particularly at low frequencies. Power ratios were often used instead, according to Thatcher and Lubar (2009).
Amplifier matching first compares findings collected with the amplifier originally used to construct the database against those from a different amplifier, using the same participants. Differences between the two are then applied in calculations that compensate for those differences, so that measures taken with the new amplifier will be consistent with those of the original. This lets a practitioner confidently use a matched amplifier and know that z-scores calculated from its data will not be biased.
As Thatcher and Lubar (2009) described, the first use of amplifier matching came during construction of the University of Maryland database (Thatcher et al., 2003). Sine wave signals of different frequencies were fed into both the database amplifier and a second amplifier so that the frequency response curves of the two could be measured and any differences determined. The resulting response ratios at each frequency were then used to scale the power spectral analysis coefficients derived from the second amplifier.
Calculations based on data collected with the second amplifier were adjusted using those ratios. In this way, measures collected by the second amplifier match those that the first, or database, amplifier would have produced. A researcher or clinician using the second amplifier can therefore have confidence that the results can be validly compared to the findings in the database.
Artifact Removal
Raw EEG data are susceptible to various artifacts, including eye movements, muscle activity, and electrical interference. These artifacts distort the EEG signal and must be removed through preprocessing before the values of database variables are calculated. According to Thatcher and Lubar (2009), it is important to use visual inspection to remove artifacts, at least to provide an initial template that subsequent computer-based methods apply to exclude artifactual data from the final EEG sample for a participant. Using such methods produces the reliability of measurement necessary for accurate and valid quantification.
Common methods include visual inspection, automated algorithms, and independent component analysis (ICA) to separate and eliminate artifact components from the EEG data (Sanei & Chambers, 2013). Thatcher and Lubar (2009) caution, however, that artifact removal methods relying on independent or principal components analysis should be avoided, because they produce inaccurate EEG coherence and phase measures.
Calculation of EEG Variables
EEG bandwidths are defined, and the preprocessed data are subjected to frequency analysis, typically using Fast Fourier Transforms or wavelet transforms. This analysis decomposes the EEG signal into its constituent frequencies, allowing power spectral densities to be calculated across the delta, theta, alpha, beta, and gamma bands. Those power spectra are then used to derive normative values for each frequency band (Hughes & John, 1999). More recently, individual 1 Hz frequency bins have become standard for such analysis, further refining the specificity of the assessment.
The data for multiple participants in a given age group under specified conditions are then aggregated to produce a mean and standard deviation for each EEG variable of interest, at each 10-20 site or combination of sites. An example would be the mean and standard deviation for the 8 to 10 Hz alpha band at O2 for 30- to 40-year-olds resting with eyes open, or alpha-band coherence between F7 and T3 in the same group.
Building norms is a sequence of decisions, each of which can compromise the result. Ethics review and informed consent come first, then recruitment strategies chosen to avoid systematic bias, then stratification by age, which is the one demographic variable that reliably shapes the EEG. Inclusion and exclusion criteria define health, sample size is driven by the need for Gaussian distributions, and recording follows standardized conditions with 2 to 5 minutes of artifact-free data recommended. Amplifier matching corrects for hardware differences in frequency response, and artifact removal begins with visual inspection rather than ICA or PCA, which distort coherence and phase.
Reliability and Validity
Understanding qEEG normative databases benefits from knowing some basics not only of probability and statistics but also of psychological test theory and construction (Thatcher, 2010). The objective is to have tools that produce stable and true measures of the variable of interest. Any discussion of the truth or certainty of a particular measure rests on its reliability and its validity.
Reliability
Reliability, in the sense used for psychological tests, means consistency (Anastasi, 1976). Measures of reliability have a hypothetical range from 0.00, meaning two or more measurements are completely inconsistent, to +1.00, meaning complete consistency. A common standard for acceptable reliability is 0.90 or above.
Because quantification is done on data collected in one recording session using standardized mathematical calculations, the reliability of data in qEEG databases depends primarily on two things. The first is how well artifacts are removed from analog data recorded while the participant remains in a consistent state of consciousness. The second is the standardization of the methods used for data collection.
Two types of reliability measures are sometimes used (Nunnally, 1967). Split-half reliability calculates the similarity of values between alternating short epochs of artifact-free EEG data from a single recording session, correlating odd with even epochs in the sequence.
Test-retest reliability correlates artifact-free epochs from the first half of the qEEG recording with those from the second half. This type of reliability is sensitive to changes in data consistency that may occur from the beginning to the end of the recording session. Reliability figures greater than 0.9 are often found with these methods (Duffy et al., 1994; John, 1977; John et al., 1987; Thatcher, 1998; Thatcher et al., 2003).
Test-retest reliability has also been assessed over longer time frames than a single session. Gudmundsson and colleagues (2007) found that the highest reliability values over 2 months were for spectral variables, with reliability increasing up to an epoch length of 40 seconds, and with coherence being the least reliably measured. Cannon and colleagues (2012) used methods available with the NeuroGuide database along with low-resolution electromagnetic tomography (Pascual-Marqui et al., 1994) and found good test-retest stability of EEG measures.
Validity
In psychological test theory, "validity concerns what the test measures and how well it does so" (Anastasi, 1976, p. 134). The several types of validity include content validity, concurrent validity, predictive validity, construct validity, face validity, and ecological validity. The two most applicable to qEEG databases are content validity and concurrent validity.
Content validity refers to how well a test or database covers the domain of interest. For qEEG databases, content validity concerns whether the EEG variables and recording conditions in the database include those of most interest to clinicians and researchers. Given the range of variables and conditions reviewed above and detailed in the database profiles below, qEEG normative databases can be seen to have good content validity.
Concurrent validity is a form of criterion-related validity that refers to how well a measure is simultaneously associated with a gold standard or another measure of the same variable. It is relevant to how well the values of two databases agree with each other. The degree of association is described by a correlation coefficient ranging between -1.00 and +1.00, and concurrent validity coefficients above +0.75 are considered excellent.
Hughes and John (1999) reviewed evidence supporting the view that EEG normative databases have good concurrent validity, as shown by acceptable correlations between the values of their variables. Thatcher and Lubar (2009) reported that CNS Response compared z-scores calculated by the NYU and University of Maryland databases for 19-channel qEEG findings in psychiatric patients aged 6 to 84. Correlations between z-scores ranged from 0.857 to 0.979, where 1.00 would be perfect agreement. Those findings show good agreement between the z-score calculations of the NYU database, marketed as NxLink, and the University of Maryland database, marketed as NeuroGuide.
The measured and quantified values of EEG variables might also be compared to values based on visual inspection, as an exercise in concurrent validity. As reviewed by Thatcher (2010), however, visual inspection produces less reliable measures than qEEG methods, which necessarily limits its validity. Further, some EEG activity, including coherence and phase, is not well appreciated visually at all.
Another form of criterion-related validity, predictive validity, concerns how accurately one measure predicts a different measure. For qEEG databases, predictive validity concerns how well equations built on normative information can predict something or some state in the future. Studies have examined how well such data predict IQ (Thatcher et al., 1983, 2008) and membership in a mild traumatic brain injury group when used in a discriminant function analysis (Thatcher et al., 1989).
There is a broader validity question as well. How well do a participant's significant differences from normative values correlate with other measures and observations, such as CT or MR imaging findings, impairment seen on neuropsychological testing, and neurological examination? Results showing a significant relationship between qEEG and MRI variables among participants with traumatic brain injury (Thatcher et al., 1998) encourage the view that normative qEEG databases may have validity in the assessment of individuals with TBI.
Cross-Validation
Cross-validation is the statistical analysis of how closely the data of a new sample match the characteristics of the data of the original sample. If the findings of the second sample replicate those of the first to a satisfactory degree, you can conclude that the findings of the first sample represent the entire population from which it was drawn. Successful cross-validation gives confidence that a sample's results are valid.
Consider an example. The average alpha power at O1 during eyes-closed collection, together with its standard deviation and distribution shape for a sample of 10-year-old children, is compared to findings for the same variable in a different sample of 10-year-old children recorded the same way.
The usual method for conducting cross-validation is a leave-one-out procedure. Take a sample of 100 normally developing 10-year-olds, measure alpha amplitude at O1 with eyes closed, and calculate the mean and standard deviation. Results for even-numbered participants are then compared to those for odd-numbered participants. To the degree that the findings are identical, the cross-validation indicates that they are a valid estimate of the true values that would have been found had the entire population been measured. This type of analysis has been conducted successfully by the developers of several databases (Gasser, Verleger, et al., 1988; Gasser, Jennen-Steinmetz, et al., 1988; John et al., 1987; Thatcher et al., 1983).
Thatcher and colleagues (2003) have presented results for a related type of study referred to as Gaussian cross-validation. These investigators validated the NeuroGuide database by comparing participants separated into two groups using a leave-one-out method and found the validity results satisfactory. They also discuss the NeuroGuide database's sensitivity and specificity in terms of its Gaussian analysis, which showed the database to be statistically accurate and sensitive.
A question raised above deserves a direct answer: how validly do the measures in a database represent normal EEG activity? That validity rests on the combined effects of how participants were sampled, the exclusion and inclusion criteria, the data collection methods, the effectiveness of artifact removal, the variables selected for inclusion, and the mathematical methods used to quantify EEG variables.
Whether the use of qEEG normative databases and the comparison of test groups to database values have validity in predicting various conditions or cognitive characteristics remains a valuable field for study. So does the validity of comparing client and database findings for the purpose of planning and conducting EEG neurofeedback.
Check Your Understanding
- Distinguish split-half reliability from test-retest reliability as those terms are used with qEEG data.
- What reliability figure is generally regarded as acceptable, and which EEG variable did Gudmundsson and colleagues (2007) find least reliable?
- Explain content validity and concurrent validity as they apply to a qEEG normative database.
- Describe the leave-one-out cross-validation procedure using a concrete EEG variable.
- Why does Thatcher (2010) argue that visual inspection has limited validity as a criterion measure for qEEG?
qEEG Database Development History
Thatcher and Lubar (2009) report that the earliest qEEG database was assembled in the 1950s at UCLA and comprised several hundred candidates for the NASA space program, along with university faculty and students (Adey et al., 1961; Adey, 1964a, 1964b). Inclusion and exclusion criteria were not employed. These authors analyzed their data by calculating means, standard deviations, and measures of distribution shape for selected variables.
Matousek and Petersen (1973a, 1973b) published the first peer-reviewed normative database. Their work described inclusion and exclusion criteria and standards for statistical analysis. Over 400 participants were selected, of whom just over half were female, aged from two months to 22 years, all from an urban Scandinavian area. Individuals with a history of significant illness that may have affected brain function were excluded, and school-aged participants were required to perform at grade level. Eighteen to 49 participants were included in each one-year age group, and Matousek and Petersen were also the first to employ t-tests and z-scores.
Subsequent normative databases used similar subject selection criteria to ensure a representative sample. These were constructed by John and colleagues (John, 1977; John et al., 1977, 1987), by Thatcher and colleagues (Thatcher et al., 1983, 1987, 2003, 2005a, 2005b; Thatcher et al., 1986), and by Gordon and colleagues (2005).
The findings of Matousek and Petersen were subsequently replicated with a sample of children from a different culture by John and colleagues (John, 1977; John et al., 1977, 1987), who used age regression methods to produce appropriate means and standard deviations for different ages. These investigators, along with Duffy and colleagues (1994), emphasized the importance of variables having Gaussian distributions and of meeting standards of reliability, replication, and cross-validation.
Thatcher and Lubar (2009) also reviewed the history of current source normative databases, which can render images of the cortex in three dimensions. Variable Resolution Electromagnetic Tomographic Analysis (VARETA) is a z-score EEG database developed by Bosch-Bayard and colleagues (2001) that showed high sensitivity and specificity. VARETA differs from LORETA in that it uses a probabilistic mask, allowing the smoothness of the inverse solution to vary, and it estimates distributed and discrete sources with equal accuracy (Thatcher & Lubar, 2009). Machado and colleagues (2004) successfully used VARETA in cases of stroke.
Pascual-Marqui and colleagues (1994, 2001) developed an inverse solution for localizing EEG sources in three dimensions, termed Low-Resolution Electromagnetic Tomographic Analysis (LORETA). Thatcher and colleagues (2005a, 2005b) developed a normative database for LORETA, showing good cross-validation results and good sensitivity relative to surface EEG measures. Hoffman (2006) also found high accuracy in using this LORETA database to assess patients with various neurological diagnoses. Thatcher, Biver, and North (2007b) extended the development of a LORETA database with z-scores to measure EEG connectivity.
Thatcher and Lubar (2009) described how EEG z-score databases came to be used with real-time EEG biofeedback. That process uses complex demodulation as a joint-time frequency analysis (JTFA) to calculate a virtually instantaneous neurofeedback z-score. The JTFA calculation results in a smaller z-score than the usual Fast Fourier Transform calculation, producing a more conservative estimate of deviation from the database values.
Thatcher (1998) and colleagues developed a z-score normative EEG database, NeuroGuide, during the 1980s and 1990s, and its functionality has increased considerably since (Thatcher, 2021). At the time of that writing in the late 1990s, several other EEG databases existed, such as the NxLink z-score normative database developed by John and colleagues (John et al., 1987). The NxLink database has since been updated and is now called BrainDX (BrainDX, 2023).
Several qEEG normative databases besides NeuroGuide are currently commercially available. Others in common use have included the Human Brain Institute database (Kropotov, 2009), Sterman-Kaiser Imaging Lab (Kaiser, 2008), EureKa! (Congedo, 2005), NeuroRep (Coben & Hudspeth, 2008), iMediSync (Jeong et al., 2022), qEEG-Pro (Keizer, 2021), and TDBRAIN (van Dijk et al., 2022).
Features of Selected Current Databases
The profiles below cover NeuroGuide, the Human Brain Institute database, Jewel, NewMind, TDBRAIN, iSyncBrain, and qEEG-Pro. As you read them, notice how each answers the questions raised in the previous sections: who was sampled, how were they screened, what hardware was used, what variables are computed, and what validation evidence exists.
NeuroGuide
Thatcher and his collaborators have developed the NeuroGuide database over decades, beginning in the 1980s (Thatcher et al., 1983) and adding participants and features as they made innovations in analytic methods (Thatcher, 1998, 2021; Thatcher et al., 2020).
Developed initially at the University of Maryland, NeuroGuide completed an ethics review and required informed consent from participants. As Thatcher, Biver, and North (2007b) reported, the database has 727 participants aged 2 to 82. Most participants are younger than 14, to capture the changes in EEG that occur with normal development. Fifty-nine percent are male, 71 percent are white, 24 percent black, and 3 percent Asian. Participants are drawn from urban and rural environments and span a range of socioeconomic statuses (Thatcher, 1991, 1992, 1994, 1998; Thatcher et al., 1986, 1987).
NeuroGuide uses 20 age groups with sliding windows to increase its age resolution. The youngest 15 age groups span a 2-year range and overlap by 6 months for participants up to age 15 (N = 470). The remaining 5 age groups total 155 participants, each overlapping by five years (Thatcher et al., 2003). According to Thatcher and Lubar (2009), the purpose of sliding age ranges is to produce a more stable database solution with higher age resolution.
The oldest age group spans 35 to 82 years. The smallest sample size, N = 16, is for the 2 to 3 year age range, and the largest, N = 45, is for the 3 to 4 year range. Participant inclusion and exclusion were based on questionnaire responses and results from IQ, academic achievement, and neuropsychological tests. History regarding school grades and teacher reports, work, childhood development, environmental toxin exposure, loss of consciousness, neurological and psychiatric disorders, head injury with CNS symptoms, convulsions, skull size, and handedness was considered as well.
EEG eyes-open and eyes-closed data were collected with an Applied Neuroscience Laboratory amplifier at impedances below 10 kΩ (Thatcher et al., 2003). The frequency response was 0.5 to 30 Hz, and recording durations ranged from 59 to 142 seconds.
The resulting data were tested for Gaussianity and log transformed when necessary. NeuroGuide calculates numerous variables: amplitude, power, relative power, power ratios, asymmetry, coherence, phase metrics, peak frequencies, and burst metrics. These are transformed into z-scores for both surface and sLORETA analysis, and the data are also analyzed in terms of several brain networks. Newer developments include analysis of subcortical activity, such as the amygdala and cerebellum, and effective connectivity (Thatcher et al., 2020).
Analyses are used to generate reports, and a symptom checklist can be used to select neurofeedback protocols. The NeuroGuide database is the basis for z-score surface and sLORETA neurofeedback.
Thatcher and colleagues have used Joint Time-Frequency Analysis with the NeuroGuide database to calculate z-scores in real time for neurofeedback (Thatcher, 2018; Thatcher et al., 2007a, 2007b; Thatcher et al., 2019). Thatcher and Lubar (2009) outline the mathematical methods for this analysis and note that they yield a conservative estimate of the instantaneous value's deviation from normal. Graphs showing session-by-session change can also be produced, and care has been taken to match many available amplifiers to those used for data collection in NeuroGuide.
NeuroGuide has developed a standardized weighted LORETA method, swLORETA, for its NeuroNavigator imaging feature, with 12,400 voxels. NeuroNavigator also includes an index of phase slope for analyzing information flow. Unique to NeuroGuide is imaging of the cerebellum, red nucleus, nucleus accumbens, and habenula.
Among the other features of NeuroGuide (Thatcher, 2021) are automatic EEG artifact rejection that does not use ICA or PCA methods, display of conventional EEG with amplitude time and event markers, and multiple montages. Other features include conventional EEG display with time domain LORETA for viewing epilepsy and focal disorders, EEG JTFA and FFT analyses, auto- and cross-spectral analyses, bi-spectral analyses, a Gabor adaptive spectrogram, brain function and concussion indices, and an automatic qEEG clinical report writer. The package also offers color topographic maps of ANOVA and t-tests, and research tools for statistical analysis and digital signal processing such as NeuroStat, which can produce pre-post comparisons for EEG variables.
Gaussian cross-validation was established for NeuroGuide (Thatcher et al., 2003), and a discriminant function for mild traumatic brain injury has also been cross-validated (Thatcher et al., 1989). Multiple peer-reviewed publications have used NeuroGuide. It is registered with the FDA and can be obtained through Applied Neuroscience (2023), among other vendors.
Human Brain Institute
The qEEG normative database developed by the Human Brain Institute is described in Juri Kropotov's (2009) text on qEEG and event-related potentials and in Tereshchenko and colleagues (2010).

Not surprisingly, it contains normative data not only for EEG variables but also for ERPs. Participants include 1,000 healthy individuals ranging in age from 7 to 89 years. The sample for children and adolescents between 7 and 17 is 300 participants, with 500 adults aged 18 to 60 and 200 participants over 60. Inclusion criteria are an uneventful perinatal period and average or better academic achievement. Exclusion criteria are neurological and psychiatric disease, convulsions, or head injury with brain-related symptoms.
Data are also included for participants with clinical conditions such as ADHD, epilepsy, OCD, addiction, depression, and whiplash. Those data had not yet been included in the commercially available software as of a personal communication from Kropotov in 2023.
Data collection conditions used by the HBI normative database are eyes closed and eyes open, each with a minimum of 3 minutes of data. Recordings are also made for several task conditions: a go/no-go task, mathematical calculation, reading, auditory recognition, and an auditory oddball task.
The database uses WinEEG software for Mitsar amplifiers, which performs automated artifact marking and correction and spike detection, though manual artifact deletion is also available. Artifacts are defined as amplitudes above 100 µV, 0 to 1 Hz waves with amplitude above 50 µV, and 20 to 35 Hz frequencies above 35 µV. Eye movement artifacts are automatically corrected using a template and ICA.
Data include a frequency range of 0 to 45 Hz with 0.25 Hz resolution. EEG features available are absolute magnitude, absolute power, relative power, coherence, wavelet transformation, and ERPs. Montages available are linked ears, global average, and local average. Z-scores are calculated, the database has sLORETA capability, and qEEG data are normalized so that valid means and standard deviations can be calculated.
In addition to typical EEG variables such as power and coherence, wavelet transformations and dipole approximations are available. ICA extracts separate components of ERPs related to particular cognitive functions. Time dynamics and topography are provided for each component, so you can determine the amplitude and latency of ERP components, which matter for understanding stages of information processing.
A Mitsar amplifier is required for use. The software generates topograms showing deviations from normal and produces training recommendations. Data from new participants are compared to an age-matched subset of database participants numbering at least 30. The HBI database is registered with the FDA, and the North American vendor is bio-medical.com.
Jewel
Jewel is a qEEG z-score database created by John Demos (2023) and installed on the user's own computer.

Participants are ages 7 to adult, were recruited from John Demos's clinical practice, and provided informed consent. Data for the first 75 participants were collected with a Lexicor NeuroSearch 24 amplifier, and a BrainMaster Discovery amplifier was used for the remaining 1,000 participants.
Data without artifacts were manually selected for analysis. Amplitude, power, and coherence measures are calculated for several bands: delta (1.5-4 Hz), theta (4-8 Hz), alpha (8-12 Hz), beta (12-25 Hz), gamma (35-45 Hz), theta1 (4-6 Hz), theta2 (6-8 Hz), alpha1 (8-10 Hz), alpha2 (10-12 Hz), beta1 (12-14 Hz), beta2 (14-16 Hz), beta3 (16-20 Hz), beta4 (20-24 Hz), beta5 (24-28 Hz), and beta6 (28-32 Hz). Jewel offers unique eyes-open monopolar and bipolar z-scores, and z-scores based on amplitude rather than power.
Jewel has an automatic report generation feature based on qEEG findings and symptoms, the latter reported through a free online questionnaire that can also be sent to the client's therapist and used to generate a client report with homework. The report includes neurofeedback training suggestions for amplitude training, surface and sLORETA z-score protocols, low-frequency training, HEG training, and photic stimulation. Information from a knowledge base is also included. Protocol generation uses both qEEG findings and questionnaire results.
The Jewel brain map shows 10-20 sites corresponding to symptoms, and a table produced by Jewel correlates symptoms and bandwidths for training. Power and coherence findings are linked to corresponding symptoms, and protocols can be developed by several routes, for example based on symptoms or on cortical sites.
Jewel and qEEG-Pro data can both be processed through Jewel to prepare BrainAvatar z-score neurofeedback training protocols, and Jewel has a feature allowing side-by-side comparison of findings from its own database and those of qEEG-Pro. Z-score training options for 1-, 2-, 4-, and 6-channel protocols are supported. Jewel also generates non-z-score neurofeedback suggestions based on symptoms, along with weekly tracking sheets and pre-post qEEG comparisons.
Users must use BrainMaster's Discovery amplifier and BrainAvatar software with an analysis software upgrade. A Jewel subscription can be purchased from John Demos at www.eegshopping.com or from BrainMaster at www.brainmaster.com.
NewMind
The NewMind normative qEEG database is designed to simplify qEEG interpretation compared to other databases and to guide neurofeedback training. Its developer, Richard Soutar, began collecting data in 2006 and has periodically added participants, bringing the current sample to 797 healthy normal individuals aged 5 to 90.

The sample reportedly represents a wide variety of socioeconomic, racial, and ethnic backgrounds. Participants originate from over 600 primarily US clinics, where they sought neurofeedback training for peak performance or for amelioration of various disorders. The participants were carefully screened with cognitive, physiological, and emotional function measures so that only healthy individuals were included in the database.
Data were recorded with BrainMaster and NewMind amplifiers that had been frequency-matched (Soutar, 2020). A sampling rate of 256 Hz, bandwidth of DC to 40 Hz, input impedance of 500 MΩ, DC offset of plus or minus 300 LSB, and common mode rejection of 100 dB are reported.
Eyes-closed and eyes-open data were collected with a linked ears montage. One minute of clean data after automatic artifacting was used for both conditions. Time domain components analyzed by the database are delta (1-3 Hz), theta (4-7 Hz), alpha (8-12 Hz), low beta (13-15 Hz), beta (15-20 Hz), and high beta (20-30 Hz). Results are provided for magnitude, dominant frequency, interhemispheric coherence and phase, and asymmetry, shown in 1-standard-deviation increments for each 10-20 site.
Development of the NewMind database involved cross-validation and testing of statistical sensitivity and Gaussianity. Bootstrapping and log transformations were used when necessary to normalize the distribution of variables. The NewMind software integrates qEEG findings with comprehensive client self-report questionnaire results and tracks training progress.
The NewMind automated EEG analysis also identifies primary and secondary z-score locations. As the developer's demonstration page describes it, these z-score location suggestions assist the practitioner in identifying which locations to use when z-score protocol neurofeedback training is being used, because finding z-score locations and their order can otherwise be a long and painful process.
The database has a dashboard that facilitates generating provider and client reports, including head maps. Features include control sliders, an interpretive dashboard, midline analysis, a symptom tracker, a normed physiological checklist, a cross-validated cognitive checklist, a normed socio-emotional assessment, normed computerized cognitive performance tests, and a pre-post map comparison tool that reports percentage change in standard deviation units. The software automatically generates suggested neurofeedback training protocols, for which BrainMaster designs can be downloaded.
The NewMind database is not registered with the FDA and requires a NewMind, Discovery, or Mitsar amplifier. The NewMind cloud-based database can be found at www.newmindmaps.com and www.brainmaster.com.
TDBRAIN and the Brainclinics Brainmarker Platform
The TDBRAIN database, whose name stands for Two Decades: Brainclinics Research Archive for Insights in Neurophysiology, originates in Nijmegen, the Netherlands. Associates of the Research Institute Brainclinics of the Brainclinics Foundation have conducted considerable EEG and related research there (van Dijk et al., 2022). As the name suggests, data were collected between 2001 and 2021.
TDBRAIN is available as a free open-access database. Besides EEG data, it includes rich phenotype data such as baseline severity measures including the BDI and ADHD-RS, personality data from the NEO-FFI, sleep data, neuropsychological data, and, notably, treatment response data for rTMS and neurofeedback.
Participants number 1,274, of whom 620 are female, ranging in age from 5 to 88 years. Forty-seven are identified as healthy, another 255 have unknown diagnoses if any, and the remainder present a heterogeneous collection of diagnoses including major depressive disorder, ADHD, subjective memory complaints, and obsessive-compulsive disorder. An extended version of the database, TDBRAIN+, comprising about 4,500 EEG records, is used internally at Brainclinics for development of the Brainclinics Brainmarker platform, for which several validation studies have been published or are forthcoming (Voetterl et al., 2022, 2023).
Participants provided informed consent and satisfied several requirements regarding medications, caffeine, alcohol, and tobacco before data collection, which was done with a Neuroscan NuAmps amplifier. EEG, EOG, EMG, and ECG data were collected during two-minute samples for eyes open and eyes closed. In addition to the resting conditions, data were collected during an auditory oddball task and a visual 1-back test.
The available data are raw and unprocessed, but free Python code for artifact removal is available from the same source. That code automatically removes artifacts related to EMG, sharp channel jumps, kurtosis, extreme voltage swing, residual eyeblinks, electrode bridging, and extreme correlations (van Dijk et al., 2022).
Studies have demonstrated high reliability (Williams et al., 2005) and cross-cultural validation (Paul et al., 2007). Data were also validated using alpha power changes from eyes open to eyes closed and alpha peak frequency maturational changes (van Dijk et al., 2022).
A major clinical use of this database is to identify biomarkers, or so-called Brainmarkers, as prognostic stratification markers for selecting the treatment best matched to the individual. Candidate treatments include neurofeedback, psychostimulant medication, antidepressants, and rTMS (Arns et al., 2022). The TDBRAIN database and related code can be freely downloaded from the Brainclinics resources page, and further information about the Brainmarker platform is available from the Brainclinics assessment suite page.
iSyncBrain
The iMediSync corporation has developed a cloud-based normative database, iSyncBrain, that uses artificial intelligence-guided analytics (Jeong et al., 2022; Ji et al., 2022; Ko et al., 2021). The developers completed an ethics review, and participants provided informed consent.
Participants were recruited from the Korean EEG Center at Seoul National University, totaling 1,289 participants, 553 male and 736 female, whose ages ranged from 4 to 82. Participants were stratified by age and sex. Nonlinear regression methods were used to stratify by sex, and a de-noising process based on qEEG variability was used to stratify between female and male participants at various ages.
The sample size for age ranges was over 250 for the youngest group and fewer than 50 for the oldest. The database has 15 age groups for ages 4 to 19 and four age groups for ages above 19.
Inclusion and exclusion criteria included personal medical and academic history along with cognitive, emotional, and behavioral factors. Participants were excluded if their history was positive for any psychiatric or neurological disease, problematic academic or social activity, head trauma, epilepsy, behavioral or conduct disorders, or medical treatment that might have affected brain function. Participants were also excluded if they met quantified criteria on a measure of cognition such as the K-WPPSI, CNS Vital Signs, or MMSE, of emotional function such as the State-Trait Anxiety Inventory-Korean, Child Depression Inventory, or Beck Depression Inventory, or of behavior such as the Korean Child Behavior Checklist.
Four minutes of data were collected in eyes-closed and eyes-open conditions with a frequency range of 1 to 45 Hz. Artifacts were addressed with a notch filter, re-referencing to common average reference, Artifact Subspace Reconstruction, advanced mixture ICA, automated EEG denoising, and EMG and EOG artifact removal. A cloud-based, AI-driven auto-analyzing platform was used.
Amplitude was calculated for the delta, theta, alpha, beta, and gamma bands. Absolute and relative power spectra were calculated along with occipital peak alpha, power ratios, coherence, and sLORETA. Topographic maps and 3D viewing are also provided.
Log transformations were used when significant skewness was found, followed by curve fitting, a continuous method, to avoid disconnections or large jumps in z-scores between successive age bands. Non-linear regression using a spline method was used for the curve fitting, and z-scores were then calculated. Average reference and common reference montages can be used.
The iSyncBrain database has been validated concurrently with the qEEG-Pro normative database, and the results show good agreement (Ko et al., 2021). ADHD and Alzheimer's disease participants have also been evaluated using the database (Jeong et al., 2022; Ji et al., 2022). The database can generate reports, including a biomarker for mild cognitive impairment. It does not indicate FDA registration.
qEEG-Pro
qEEG-Pro was developed by Keizer, with participants recruited from the Neurofeedback Institute Netherlands (Keizer, 2021, 2023; Kerson, 2023). Participants ranged in age from 6 to 83 years. There were 1,482 participants in the eyes-open condition, 527 female and 955 male, and 1,232 in the eyes-closed condition, 432 female and 799 male.
The database provides different norms based on sex and recording condition, with age regression methods using a sliding window to compare a new participant's assessment to similar-aged database participants. Most participants were younger than 20 years, with the largest age groups totaling between 70 and 80 participants. qEEG-Pro uses a moving average of 150 age subgroups ranging from 1 to 75.5 years, with a 6-month age resolution (Keizer, 2018; Kerson, 2023). The manual indicates that these subgroups were created by "selecting 200 participants who had a minimum age difference with age bin of interest" (Keizer, 2018, p. 31).
Participants were screened with the CNC-1020 questionnaire (Brownback, 2023). Regression analysis was conducted on all metrics, including those that had been log-transformed, using the CNC-1020's 47 categories of psychopathology, which were also log-transformed. The resulting residuals were then used to calculate the means and standard deviations for all metrics in the database (Keizer, 2018, p. 31). Participants were excluded if their EEG data showed epileptiform activity or if recordings were less than 1 minute long.
Data were collected in eyes-open and eyes-closed conditions using a Deymed TruScan32 amplifier. Fully automated artifact rejection was used, but it did not employ ICA or PCA methods. The artifact rejection eliminated data below the high-pass filter and within the notch filter range. Noisy channels were eliminated as well, and data showing eye blink, horizontal eye movement, and low- and high-frequency artifacts were also removed.
The resulting data were analyzed into bands ranging from 1 to 45 Hz, specifically delta (1-3 Hz), theta (4-7 Hz), alpha (8-12 Hz), beta (15-20 Hz), and gamma (35-45 Hz), with a 1 Hz resolution. Z-scores are calculated for power, relative power, power ratios, asymmetry, phase coherence, phase lag, burst metrics including average peak power and bursts per second, and comodulation, meaning cross-frequency power correlation. The database also has sLORETA functionality, and linked ears and Laplacian montages can be used.
qEEG-Pro generates a report that includes maps for absolute power, relative power, and z-scores for single hertz bins from 1 to 40 Hz. Additional maps are generated for extreme z-score development, relevant for identifying possible maturational lag, for fluctuation time, used to examine power variability, and for percentage deviant activity, showing the percentage of time power values exceed 2.3 standard deviations for a site by frequency map.
The report also includes tables for absolute and relative power, both raw and z-score, amplitude asymmetry, phase coherence, FFT power distribution, peak alpha frequency at each 10-20 site, and z-score alpha peak distribution maps.
Concurrent validity studies have been conducted with qEEG-Pro against iSyncBrain (Ko et al., 2021) and NeuroGuide (Thatcher et al., 2020), showing good correlation. The database's development and use are presented in peer-reviewed publications (Keizer, 2021; Ko et al., 2021). A BrainMaster Discovery amplifier must be used for neurofeedback, and the qEEG-Pro database is FDA-approved.
The databases differ in ways that matter clinically. NeuroGuide draws on 727 carefully screened participants aged 2 to 82 with sliding age windows, Gaussian cross-validation, a cross-validated mTBI discriminant function, subcortical imaging, and FDA registration. The Human Brain Institute database adds ERP norms and task conditions across 1,000 participants but requires a Mitsar amplifier. Jewel and NewMind draw their samples from clinical practices and clinics, screened after the fact, and NewMind is not FDA registered. TDBRAIN is open-access and research-oriented, built around treatment-response stratification rather than normalcy comparison, while iSyncBrain and qEEG-Pro are large, sex-stratified, cross-validated against each other, with qEEG-Pro FDA-approved and iSyncBrain not indicating registration.
Check Your Understanding
- Why does NeuroGuide use sliding, overlapping age windows rather than fixed age bands, and what does that buy the user?
- Which two databases in this unit were built primarily from people seen in clinical practice, and what concern does that raise?
- What makes TDBRAIN's purpose different from that of the other databases profiled here?
- Name the databases in this unit that are FDA registered or approved, and the ones that are not.
- What concurrent validity evidence links iSyncBrain, qEEG-Pro, and NeuroGuide?
Multiple Tests and Comparisons Risk
Thatcher and Lubar (2009) commented on the frequent practice of subjecting the same EEG data to analysis with multiple normative databases. They suggested that doing so may produce invalid results from those databases that have not met the minimal standards outlined above. The consequence can be spurious, inconsistent findings that mislead a clinician.
Thatcher and Lubar (2009) stated that database users must know how well the databases they use follow scientific standards, and must disclose to their clients the corresponding certainty and validity of the results they share. There is a purely statistical problem here as well. The risk of spuriously significant findings by chance increases with the number of tests you run, so using a database, or more than one database, requires selectivity (Schretlen & Sullivan, 2013).
Gold Standards for Evaluating a Normative Database
This section has reviewed the basic concepts you need in order to understand and use qEEG normative databases. Thatcher and Lubar (2009) described a set of gold standards for evaluating them (p. 54).
The clinician must evaluate the claims made by product developers to determine whether the claimed methods and product features are valid. That is genuinely difficult for clinicians who are not experts in database development, statistical analysis, and EEG theory and practice. Some of the databases discussed above were developed using client EEGs rather than carefully screened participants. The claim that such recordings can be "cleaned" of abnormal patterns so their data can be included in a normative database is questionable at best.
The clinical database approach, using recordings from clinical participants, also depends heavily on the developer's knowledge of neurophysiology, neuropsychology, and electroencephalography. Some of these products may therefore be effective, valid, and useful in clinical settings, while others may not. Ultimately you are responsible for using a reliable, validated instrument with known and well-documented parameters that have withstood the scrutiny of multiple peer-reviewed publications. One or two publications authored by the developers do not meet that criterion.
The list of criteria below, adapted from Thatcher and Lubar (2009), summarizes the steps reviewed in this unit that meet good scientific standards for developing qEEG normative databases.
Complete an ethics review; recruit participants; apply inclusion and exclusion criteria; stratify participants based on age; collect data; use different data acquisition conditions such as resting, task, and ERP; reject artifacts; ensure the data are Gaussian; ensure adequate sample size; evaluate test-retest reliability; cross-validate; evaluate with clinical conditions; validate concurrently with another database; publish in peer-reviewed journals; and register with the FDA.
Judgments about qEEG normative databases that follow that plan can also be made based on the results of these steps as published in peer-reviewed journals. When a vendor cannot point you to that literature, you have learned something important.
Not every product marketed as a normative database was built like one. Some were assembled from clinical clients whose records were retroactively cleaned, an approach whose validity is questionable. Running one data set through several databases multiplies both the chance of contradictory results and, through repeated testing, the chance of a spuriously significant finding. Your defense is the gold standard checklist: ethics review, screened recruitment, age stratification, artifact rejection, Gaussian data, adequate sample size, test-retest reliability, cross-validation, clinical evaluation, concurrent validation against another database, peer-reviewed publication, and FDA registration.
Check Your Understanding
- What two risks did Thatcher and Lubar (2009) identify in running one client's data through multiple normative databases?
- Why is a database built from "cleaned" clinical recordings problematic as a normative reference?
- List five of the gold standard steps for developing a qEEG normative database and explain why each matters.
- Why are one or two publications authored by the database developer insufficient evidence of validity?
- What does a clinician owe a client regarding the certainty and validity of database-derived findings?
Cutting-Edge Topics in qEEG Research
From Normalcy Comparison to Treatment Stratification
Every database in this unit except one is built to answer the question "is this person normal?" TDBRAIN was built to answer a different one: "which treatment will this person respond to?" Its 1,274 participants are mostly not healthy controls, and its value lies in the treatment response data attached to each record for rTMS and neurofeedback (van Dijk et al., 2022). Voetterl and colleagues (2022, 2023) have used the extended TDBRAIN+ archive to develop stratification markers separating patients likely to respond to methylphenidate from those likely to respond to neurofeedback, and to separate antidepressant from brain stimulation candidates. If that line of work holds up, the clinical role of a database shifts from describing deviance to predicting response (Arns et al., 2022).
Artificial Intelligence in Database Analytics
iSyncBrain represents a different frontier: a cloud-based, AI-driven auto-analyzing platform applied to a 1,289-participant Korean sample stratified by both age and sex (Ko et al., 2021). Its pipeline chains Artifact Subspace Reconstruction, advanced mixture ICA, and automated denoising before any norm is computed, and it uses spline-based non-linear regression for curve fitting so that z-scores do not jump discontinuously between adjacent age bands. Jeong and colleagues (2022) went further, converting qEEG features into image formats suitable for deep learning and using them to classify Alzheimer's disease dementia. The methodological question this raises is unresolved: when an automated pipeline removes artifact, who verifies that the removal did not also take real signal with it, given that Thatcher and Lubar (2009) warn ICA-based methods distort coherence and phase?
Subcortical and Effective Connectivity Imaging
NeuroGuide's swLORETA implementation now reaches structures that surface EEG was long assumed to be blind to, including the cerebellum, red nucleus, nucleus accumbens, and habenula, across 12,400 voxels (Thatcher et al., 2020). The NeuroNavigator phase slope index adds a directional claim, estimating which region leads and which follows, which is a step beyond the symmetric coherence measures that dominated earlier databases. These developments extend the content validity of normative databases into territory that previously required fMRI or PET. They also raise the stakes on inverse solution assumptions, because a z-score for habenular activity inherits every uncertainty in the source model that produced it.
Regression-Based Norming and the Death of the Age Bin
Age stratification has always involved a compromise. Bins wide enough to hold adequate sample sizes are too wide to capture rapid developmental change, while narrow bins leave you comparing a client to a handful of people. Sliding overlapping windows, used by Thatcher, Walker, and Giudice (1987) and refined in NeuroGuide's 20 groups, were the first answer. qEEG-Pro's moving average across 150 subgroups with 6-month resolution and iSyncBrain's spline curve fitting push further toward continuous norming. Timmerman and colleagues (2021) describe the general statistical machinery for regression-based norming that makes this possible, which suggests the age bin may eventually disappear entirely in favor of a continuous function of age.
Assignment
Now that you have completed this unit, explain how researchers construct normative databases. Walk through the sequence from ethics review and recruitment to publication, naming at each step the decision the developer must make and the consequence of getting it wrong.
Then apply what you have written. Choose one of the databases profiled in this unit, evaluate it against the gold standard criteria, and state whether you would be comfortable defending its findings if a colleague, or an attorney, challenged them.
Glossary
alpha level: the probability of a Type I error, that is, of rejecting the null hypothesis when it is true.
amplifier matching: a procedure that compares the frequency response of a new amplifier with that of the amplifier used to build a normative database and applies scaling corrections so that measures taken with the new amplifier are comparable to the database values.
biomarker: a measurable characteristic evaluated as an indicator of a biological or clinical process. Correlation with a disorder does not by itself make a marker diagnostically or therapeutically actionable.
concurrent validity: the degree to which a measure agrees with an appropriate criterion measured at approximately the same time.
confidence interval: an interval estimate generated by a procedure that, under repeated sampling and model assumptions, captures the true parameter at the stated long-run rate.
content validity: the degree to which a test or measurement reflects the entire range of material it is supposed to assess.
correlation coefficient: a statistical measure of linear association that indicates the extent to which two variables fluctuate together, ranging from -1.00 to +1.00.
criterion-related validity: the extent to which a measure is related to an outcome, assessed by comparing it with a criterion known to be associated with the construct.
cross-validation: a method for assessing how a predictive model or set of norms performs with an independent dataset different from the one used for its development.
descriptive statistics: numerical summaries that characterize a sample of scores, comprising measures of central tendency and measures of variability.
exclusion criteria: specific conditions or attributes that disqualify individuals from participating in normative database construction.
fast Fourier transform (FFT): an efficient algorithm for computing the discrete Fourier transform and decomposing a sampled signal into frequency components.
Gaussian curve: a symmetric bell-shaped probability distribution in which most values cluster near the mean and progressively fewer fall toward the tails, also called the normal distribution.
Gaussian sensitivity: the degree to which the distribution of observed data values in a sample approaches the ideal Gaussian distribution, which describes the uncertainty or accuracy a data set carries.
inclusion criteria: specific conditions or attributes required for individuals to be eligible to participate in normative database construction.
independent component analysis (ICA): a computational technique that separates mixed signals in EEG data into statistically independent components, facilitating artifact removal.
joint time-frequency analysis (JTFA): a family of techniques that analyze signals with time-varying frequency content, providing information in both the time and frequency domains and enabling real-time z-score training.
kurtosis: a statistical measure that describes the shape of a distribution's tails in relation to its overall shape.
leptokurtic: describing distributions with positive kurtosis, having heavy tails and a sharp peak, and therefore more outliers than a normal distribution.
low-resolution electromagnetic tomography (LORETA): the inverse solution of Pascual-Marqui and colleagues (1994) that estimates three-dimensional cortical sources of scalp-recorded EEG at low spatial resolution.
mean: the sum of observed values divided by the number of values.
mesokurtic: having kurtosis approximating that of the normal distribution, with tails neither heavier (leptokurtic) nor lighter (platykurtic) than normal.
normal curve: a bell-shaped probability distribution symmetrical about its mean, with about 68% of scores within one standard deviation and 95% within two.
normative databases: collections of EEG measures gathered from large samples of healthy individuals, against which an individual client's values are compared as z-scores.
p value: the probability of obtaining a result at least as extreme as the one observed if the null hypothesis were true, compared against the alpha level the experimenter has chosen.
percentiles: values below which a given percentage of observations in a group fall, ranging from 0 to 100.
platykurtic: having negative excess kurtosis, with a flatter peak and tails extending less far from the mean than in a normal distribution.
predictive validity: the extent to which a score on a scale or test predicts future performance on a related criterion.
reliability: the consistency or reproducibility of measurements across repeated observations, raters, items, or conditions.
skew: a measure of asymmetry in a distribution, produced when the peak sits to one side or the other of the mean.
split-half reliability: a measure of consistency in which alternating epochs of artifact-free data from a single recording are correlated, comparing odd with even epochs.
standard deviation: the square root of variance, describing the typical distance of observations from their mean.
standard error of measurement (SEM): the standard deviation of an individual's observed scores from their true score, used to calculate confidence intervals around obtained scores.
stratification: the process of dividing population data into distinct subgroups or strata based on specific characteristics, most often age in qEEG databases, so that the norms accurately reflect the diversity within the population and allow more precise comparisons.
t test: an inferential statistic that compares the means of two groups, or the mean of a single group measured at two points in time.
test-retest reliability: the consistency of scores obtained when the same measure is administered to the same individuals on separate occasions under comparable conditions.
validity: the degree to which evidence and theory support the interpretations and uses of measurements or test scores for a specified purpose.
wavelet transforms: a method used to analyze EEG signals at different scales or resolutions. Wavelet transforms allow examination of both frequency and time information simultaneously, providing a more detailed analysis of brain wave patterns.
z score: a standardized value expressing how far a measurement falls from a reference mean in standard-deviation units; it is not the probability of a diagnosis or evidence that a feature requires treatment.
Test Yourself on ClassMarker
Click the button below to take a 10-question exam over this entire unit. There is no password.
Review Flash Cards on Quizlet
Click the button below to review our chapter flash cards.
References
Adey, W. R. (1964a). Data acquisition and analysis techniques in a brain research institute. Annals of the New York Academy of Sciences, 31, 884-886. PMID: 14214053
Adey, W. R. (1964b). Biological instrumentation, electrophysiological recording and analytic techniques. Physiologist, 72, 65-68. PMID: 14154035
Adey, W. R., Walter, D. O., & Hendrix, C. E. (1961). Computer techniques in correlation and spectral analyses of cerebral slow waves during discriminative behavior. Experimental Neurology, 3, 501-524. https://doi.org/10.1016/s0014-4886(61)80002-2
Anastasi, A. (1976). Psychological testing (4th ed.). Macmillan.
Applied Neuroscience. (2023). Applied Neuroscience, Inc. https://appliedneuroscience.com/
Arns, M., Gunkelman, J., Breteler, M., & Spronk, D. (2008). EEG phenotypes predict treatment outcome to stimulants in children with ADHD. Journal of Integrative Neuroscience, 7(3), 421-438. https://doi.org/10.1142/s0219635208001897
Bosch-Bayard, J., Valdés-Sosa, P., Virues-Alba, T., Aubert-Vázquez, E., John, E. R., Harmony, T., Riera-Díaz, J., & Trujillo-Barreto, N. (2001). 3D statistical parametric mapping of EEG source spectra by means of variable resolution electromagnetic tomography (VARETA). Clinical Electroencephalography, 32(2), 47-61. https://doi.org/10.1177/155005940103200203
BrainDX. (2023). BrainDX research. https://braindx.net/research.php
Cambridge Dictionary. (2023). Norm. https://dictionary.cambridge.org/dictionary/english/norm
Cannon, R. L., Baldwin, D. R., Shaw, T. L., Diloreto, D. J., Phillips, S. M., Scruggs, A. M., & Riehl, T. C. (2012). Reliability of quantitative EEG (qEEG) measures and LORETA current source density at 30 days. Neuroscience Letters, 518(1), 27-31. https://doi.org/10.1016/j.neulet.2012.04.035
Caviness, J. N., Utianski, R. L., Hentz, J. G., Beach, T. G., Dugger, B. N., Shill, H. A., Driver-Dunckley, E. D., Sabbagh, M. N., Mehta, S., & Adler, C. H. (2016). Differential spectral quantitative electroencephalography patterns between control and Parkinson's disease cohorts. European Journal of Neurology, 23(2), 387-392. https://doi.org/10.1111/ene.12878
Clarke, A. R., Barry, R. J., McCarthy, R., & Selikowitz, M. (2001). EEG analysis in attention-deficit/hyperactivity disorder: A comparative study of two subtypes. Psychiatry Research, 103(1), 63-73. https://doi.org/10.1016/S0165-1781(01)00261-3
Coben, R., & Hudspeth, W. J. (2008). Introduction to advances in EEG connectivity. Journal of Neurotherapy, 12, 93-98. https://doi.org/10.1080/10874200802429843
Congedo, M. (2005). EureKa! (Version 3.0) [Computer software]. Nova Tech EEG.
Daubert v. Merrell Dow Pharmaceuticals, 61 U.S.L.W. 4805 (U.S. June 29, 1993).
Duffy, F. H., Hughes, J. R., Miranda, F., Bernad, P., & Cook, P. (1994). Status of quantitative EEG (QEEG) in clinical practice, 1994. Clinical Electroencephalography, 25(4), VI-XXII. https://doi.org/10.1177/155005949402500403
Gasser, T., Jennen-Steinmetz, C., Sroka, L., Verleger, R., & Möcks, J. (1988). Development of the EEG of school-age children and adolescents. II. Topography. Electroencephalography and Clinical Neurophysiology, 69(2), 100-109. https://doi.org/10.1016/0013-4694(88)90205-2
Gasser, T., Verleger, R., Bächer, P., & Sroka, L. (1988). Development of the EEG of school-age children and adolescents. I. Analysis of band power. Electroencephalography and Clinical Neurophysiology, 69(2), 91-99. https://doi.org/10.1016/0013-4694(88)90204-0
Gordon, E., Cooper, N., Rennie, C., Hermens, D., & Williams, L. M. (2005). Integrative neuroscience: The role of a standardized database. Clinical EEG and Neuroscience, 36(2), 64-75. https://doi.org/10.1177/155005940503600205
Gudmundsson, S., Runarsson, T. P., Sigurdsson, S., Eiriksdottir, G., & Johnsen, K. (2007). Reliability of quantitative EEG features. Clinical Neurophysiology, 118(10), 2162-2171. https://doi.org/10.1016/j.clinph.2007.06.018
Hoffman, D. (2006). LORETA: An attempt at a simple answer to a complex controversy. Journal of Neurotherapy, 10, 57-72. https://doi.org/10.1300/J184v10n01_05
Hughes, J. R., & John, E. R. (1999). Conventional and quantitative electroencephalography in psychiatry. Journal of Neuropsychiatry and Clinical Neurosciences, 11(2), 190-208. https://doi.org/10.1176/jnp.11.2.190
Jeong, T., Park, U., & Kang, S. W. (2022). Novel quantitative electroencephalogram feature image adapted for deep learning: Verification through classification of Alzheimer's disease dementia. Frontiers in Neuroscience, 16, 1033379. https://doi.org/10.3389/fnins.2022.1033379
Ji, Y., Choi, T. Y., Lee, J., Yoon, S., Won, G. H., Jeong, H., Kang, S. W., & Kim, J. W. (2022). Characteristics of attention-deficit/hyperactivity disorder subtypes in children classified using quantitative electroencephalography. Neuropsychiatric Disease and Treatment, 18, 2725-2736. https://doi.org/10.2147/NDT.S386774
John, E. R. (1977). Functional neuroscience. In E. R. John & R. W. Thatcher (Eds.), Neurometrics Vol. II: Quantitative electrophysiological analyses. Lawrence Erlbaum Associates.
John, E. R. (1981). Neurometric evaluation of brain dysfunction related to learning disorders. Acta Neurologica Scandinavica, 64(Suppl. 89), 87-100. https://doi.org/10.1111/j.1600-0404.1981.tb02367.x
John, E. R., Karmel, B. Z., Corning, W. C., Easton, P., Brown, D., Ahn, H., John, M., Harmony, T., Prichep, L., Toro, A., Gerson, I., Bartlett, F., Thatcher, R., Kaye, H., Valdes, P., & Schwartz, E. (1977). Neurometrics: Numerical taxonomy identifies different profiles of brain functions within groups of behaviorally similar people. Science, 196, 1393-1410. https://doi.org/10.1126/science.867036
John, E. R., Prichep, L. S., & Easton, P. (1987). Normative data banks and neurometrics: Basic concepts, methods and results from norm construction. In A. Redmond (Ed.), Handbook of electroencephalography and clinical neurophysiology III: Computer analysis of the EEG and other neurophysiological signals (pp. 449-495). Elsevier.
John, E. R., Prichep, L. S., & Easton, P. (1988). Normative data banks and neurometrics: Basic concepts, methods and results of norm constructions. In Computer-aided electrophysiology (pp. 21-38). Springer. https://doi.org/10.1007/978-1-4684-5517-5_2
Kaiser, D. A. (2008). Ultradian and circadian effects in electroencephalography activity. Biofeedback, 36, 148-151.
Keizer, A. W. (2018). qEEG-Pro manual (v1.5). Neurofeedback Institute Netherlands.
Keizer, A. W. (2021). Standardization and personalized medicine using quantitative EEG in clinical settings. Clinical EEG and Neuroscience, 52(2), 82-89. https://doi.org/10.1177/1550059419874945
Keizer, A. W. (2023, February 2). Personal communication on normative databases.
Kerson, C. (2023, February 20). Personal communication.
Ko, J., Park, U., Kim, D., & Kang, S. W. (2021). Quantitative electroencephalogram standardization: A sex- and age-differentiated normative database. Frontiers in Neuroscience, 15, 766781. https://doi.org/10.3389/fnins.2021.766781
Kropotov, J. (2009). Quantitative EEG, event-related potentials and neurotherapy. Academic Press.
Kropotov, J. D., Grin-Yatsenko, V. A., Ponomarev, V. A., Chutko, L. S., Yakovenko, E. A., & Nikishena, I. S. (2005). ERP correlates of EEG relative beta training in ADHD children. International Journal of Psychophysiology, 55(1), 23-34. https://doi.org/10.1016/j.ijpsycho.2004.05.011
Kubicek, K., & Robles, M. (2016, November 11). Resource for integrating community voices into a research study: Community advisory board toolkit. Southern California Clinical and Translational Science Institute grant UL1TR001855.
Lewine, J. D., & Orrison, W. W. (1995). Clinical electroencephalography and event-related potentials. In W. W. Orrison, J. D. Lewine, J. A. Sanders, & M. F. Hartshorne (Eds.), Functional brain imaging (pp. 327-368). Mosby.
Machado, C., Cuspineda, E., Valdés, P., Virues, T., Llopis, F., Bosch, J., Aubert, E., Hernández, E., Pando, A., Alvarez, M. A., Barroso, E., Galán, L., & Avila, Y. (2004). Assessing acute middle cerebral artery ischemic stroke by quantitative electric tomography. Clinical EEG and Neuroscience, 35(3), 116-124. https://doi.org/10.1177/155005940403500303
Matousek, M., & Petersén, I. (1973a). Automatic evaluation of EEG background activity by means of age-dependent EEG quotients. Electroencephalography and Clinical Neurophysiology, 35(6), 603-612. https://doi.org/10.1016/0013-4694(73)90213-7
Matousek, M., & Petersén, I. (1973b). Frequency analysis of EEG background activity by means of age-dependent EEG quotients. In P. Kellaway, I. Petersén, R. K. Otnes, & L. Enochson (Eds.), Automation of clinical electroencephalography (pp. 75-102). Raven Press.
McNamara, L. A., & Martin, S. W. (2018). Sensitivity, specificity, and predictive value. In S. S. Long, C. G. Prober, & M. Fischer (Eds.), Principles and practice of pediatric infectious diseases (5th ed.). Elsevier.
McVoy, M., Lytle, S., Fulchiero, E., Aebi, M. E., Adeleye, O., & Sajatovic, M. (2019). A systematic review of quantitative EEG as a possible biomarker in child psychiatric disorders. Psychiatry Research, 279, 331-344. https://doi.org/10.1016/j.psychres.2019.07.004
Nunnally, J. C. (1967). Psychometric theory. McGraw-Hill.
O'Connor, P. J. (1990). Normative data: Their definition, interpretation, and importance for primary care physicians. Family Medicine, 22(4), 307-311. PMID: 2200734
Online Etymology Dictionary. (2023). Norm. https://www.etymonline.com/word/norm
Pascual-Marqui, R. D., Koukkou, M., Lehmann, D., & Kochi, K. (2001). Functional localization and functional connectivity with LORETA comparison to normal controls and first episode drug naive schizophrenics. Journal of Neurotherapy, 4, 35-37. https://doi.org/10.1300/J184v04n04_06
Pascual-Marqui, R. D., Michel, C. M., & Lehmann, D. (1994). Low resolution electromagnetic tomography: A new method for localizing electrical activity in the brain. International Journal of Psychophysiology, 18(1), 49-65. https://doi.org/10.1016/0167-8760(84)90014-x
Salinsky, M. C., Oken, B. S., & Morehead, L. (1991). Test-retest reliability in EEG frequency analysis. Electroencephalography and Clinical Neurophysiology, 79(5), 382-392. https://doi.org/10.1016/0013-4694(91)90203-g
Sanei, S., & Chambers, J. A. (2013). EEG signal processing. John Wiley & Sons. https://doi.org/10.1002/9780470688031
Schretlen, D. J., & Sullivan, C. (2013). Intraindividual variability in cognitive test performance. In S. Koffler, J. Morgan, I. S. Baron, & M. F. Greiffenstein (Eds.), Neuropsychology: Science and practice: Vol. I (pp. 39-60). Oxford University Press.
Strimbu, K., & Tavel, J. A. (2010). What are biomarkers? Current Opinion in HIV and AIDS, 5(6), 463-466. https://doi.org/10.1097/COH.0b013e32833ed177
Tereshchenko, E. P., Ponomarev, V. A., Muller, A., & Kropotov, J. D. (2010). Comparative efficiencies of different methods for removing blink artifacts in analyzing quantitative electroencephalogram and event-related potentials. Fiziologiia Cheloveka, 36(1), 5-17. PMID: 20196443
Thatcher, R. W. (1991). Maturation of the human frontal lobes: Physiological evidence for staging. Developmental Neuropsychology, 7(3), 397-419. https://doi.org/10.1080/87565649109540500
Thatcher, R. W. (1992). Cyclic cortical reorganization during early childhood. Brain and Cognition, 20(1), 24-50. https://doi.org/10.1016/0278-2626(92)90060-y
Thatcher, R. W. (1994). Psychopathology of early frontal lobe damage: Dependence on cycles of development. Development and Psychopathology, 6(4), 565-596. https://doi.org/10.1017/S0954579400004697
Thatcher, R. W. (1998). EEG normative databases and EEG biofeedback. Journal of Neurotherapy, 2, 8-39. https://doi.org/10.1300/J184v02n04_02
Thatcher, R. W. (2010). Validity and reliability of quantitative electroencephalography. Journal of Neurotherapy, 14, 122-152. https://doi.org/10.1080/10874201003773500
Thatcher, R. W. (2018). NeuroGuide help manual. Applied Neuroscience.
Thatcher, R. W. (2021). Handbook of quantitative EEG and EEG biofeedback (3rd ed.). ANI Publishing.
Thatcher, R. W., Biver, C. J., & North, D. N. (2007a). Z-score biofeedback: Technical foundations. Applied Neuroscience. https://www.appliedneuroscience.com/PDFs/Z_Score_Biofeedback.pdf
Thatcher, R. W., Biver, C. J., & North, D. N. (2007b). Spatial-temporal current source correlations and cortical connectivity. Clinical EEG and Neuroscience, 38(1), 35-48. https://doi.org/10.1177/155005940703800109
Thatcher, R. W., Biver, C. J., Soler, E. P., Lubar, J., & Koberda, J. L. (2020). New advances in electrical neuroimaging, brain networks and neurofeedback protocols. Journal of Neurology and Neurobiology, 6, 1-14. https://doi.org/10.16966/2379-7150.168
Thatcher, R. W., Biver, C., McAlaster, R., Camacho, M., & Salazar, A. (1998). Biophysical linkage between MRI and EEG amplitude in closed head injury. NeuroImage, 7(4, Pt. 1), 352-367. https://doi.org/10.1006/nimg.1998.0330
Thatcher, R. W., Krause, P. J., & Hrybyk, M. (1986). Cortico-cortical associations and EEG coherence: A two-compartmental model. Electroencephalography and Clinical Neurophysiology, 64(2), 123-143. https://doi.org/10.1016/0013-4694(86)90107-0
Thatcher, R. W., & Lubar, J. F. (2009). History of the scientific standards of QEEG normative databases. In T. H. Budzynski, H. K. Budzynski, J. R. Evans, & A. Abarbanel (Eds.), Introduction to quantitative EEG and neurofeedback: Advanced theory and applications (2nd ed., pp. 29-59). Academic Press.
Thatcher, R. W., Lubar, J. R., & Koberda, J. L. (2019). Z-score EEG biofeedback: Past, present, and future. Biofeedback, 47(4), 89-103. https://doi.org/10.5298/1081-5937-47.4.04
Thatcher, R. W., McAlaster, R., Lester, M. L., Horst, R. L., & Cantor, D. S. (1983). Hemispheric EEG asymmetries related to cognitive functioning in children. In A. Perecman (Ed.), Cognitive processing in the right hemisphere (pp. 125-145). Academic Press.
Thatcher, R. W., North, D. N., & Biver, C. J. (2005a). EEG inverse solutions and parametric vs. non-parametric statistics of low resolution electromagnetic tomography (LORETA). Clinical EEG and Neuroscience, 36, 1-9.
Thatcher, R. W., North, D. N., & Biver, C. J. (2005b). Evaluation and validity of a LORETA normative EEG database. Clinical EEG and Neuroscience, 36(2), 116-122. https://doi.org/10.1177/155005940503600211
Thatcher, R. W., North, D. N., & Biver, C. J. (2008). Intelligence and EEG phase reset: A two compartmental model of phase shift and lock. NeuroImage, 42(4), 1639-1653. https://doi.org/10.1016/j.neuroimage.2008.06.009
Thatcher, R. W., Walker, R. A., Biver, C. J., North, D. N., & Curtin, R. (2003). Quantitative EEG normative databases: Validation and clinical correlation. Journal of Neurotherapy, 7, 87-121. https://doi.org/10.1300/J184v07n03_05
Thatcher, R. W., Walker, R. A., Gerson, I., & Geisler, F. H. (1989). EEG discriminant analyses of mild head trauma. Electroencephalography and Clinical Neurophysiology, 73(2), 94-106. https://doi.org/10.1016/0013-4694(89)90188-0
Thatcher, R. W., Walker, R. A., & Giudice, S. (1987). Human cerebral hemispheres develop at different rates and ages. Science, 236(4805), 1110-1113. https://doi.org/10.1126/science.3576224
Timmerman, M. E., Voncken, L., & Albers, C. J. (2021). A tutorial on regression-based norming of psychological tests with GAMLSS. Psychological Methods, 26(3), 357-373. https://doi.org/10.1037/met0000348
UCLA Research Administration, Human Research Protection Program. (2021). Guidance and procedure: Recruitment and screening methods and materials. Author.
van Dijk, H., van Wingen, G., Denys, D., Olbrich, S., van Ruth, R., & Arns, M. (2022). The two decades Brainclinics research archive for insights in neurophysiology (TDBRAIN) database. Scientific Data, 9(1), 333. https://doi.org/10.1038/s41597-022-01409-z
Zakai, N. A., Minnier, J., Safford, M. M., Koh, I., Irvin, M. R., Fazio, S., Cushman, M., Howard, V. J., & Pamir, N. (2022). Race-dependent association of high-density lipoprotein cholesterol levels with incident coronary artery disease. Journal of the American College of Cardiology, 80(22), 2104-2115. https://doi.org/10.1016/j.jacc.2022.09.027
Return to Top