
Networks and Connectivity
What You Will Learn in This Chapter
For most of the twentieth century, brain science asked where a function lived. Which gyrus produces speech, which strip of cortex moves the hand, which lobe stores a memory. That question turned out to be only half of the story. Almost nothing the brain does well is done by one region working alone, and the interesting variable is often not how active a region is but how well it is talking to the regions it depends on.
This unit teaches you to think in terms of conversations rather than locations. You will learn the three ways connectivity is defined, which are functional, structural, and effective, and you will see why they answer different questions. You will then work through the qEEG metrics that quantify those conversations, including coherence, comodulation, phase lag index, imaginary coherence, amplitude envelope correlation, and Granger causality. Finally, you will meet the three large-scale networks that dominate the clinical literature: the default mode network, the salience network, and the executive network.
Along the way you will learn why volume conduction is the villain of connectivity analysis, why two electrodes can look perfectly synchronized without any real communication between them, and how metrics like the phase lag index were invented specifically to solve that problem. By the end you should be able to read a connectivity report without mistaking a measurement artifact for a clinical finding.
IQCB Blueprint Coverage: This unit addresses Knowledge of Networks and Connectivity and Definition of Terms (V.F) within qEEG (V).
Learning Objectives
After completing this section, you will be able to:
Define functional, structural, and effective connectivity and explain what question each one answers.
Describe the small-world architecture of the brain and explain the role hubs play within it.
Compare coherence, comodulation, phase lag index, imaginary coherence, amplitude envelope correlation, and Granger causality.
Explain how volume conduction inflates connectivity estimates and identify the metrics designed to resist it.
Distinguish phase-based measures from amplitude-based measures and state what each one adds.
Identify the regions and functions of the default mode network, the salience network, and the executive network.
Apply qEEG connectivity metrics to neurological, psychiatric, cognitive, and developmental presentations.
Listen to the Full-Length Lecture
Why Connectivity Became the Central Question
The study of brain networks and connectivity has become a central focus in neuroscience, because it offers insight into how different regions of the brain communicate and function collectively. Connectivity refers to the complex interactions between brain regions that enable cognitive, sensory, and motor functions.
These interactions can be studied at many levels, from local circuits of a few millimeters to large-scale networks spanning both hemispheres. Researchers use a range of neuroimaging and electrophysiological techniques to capture them. Understanding these networks is crucial for deciphering the neural basis of behavior and the pathophysiology of neurological and psychiatric disorders.
Here is the practical payoff for you as a clinician. Two clients can show nearly identical absolute power values and still differ enormously in how their networks are organized, and that organizational difference is often what predicts symptoms and treatment response.
Defining the Three Kinds of Connectivity
Functional Connectivity
Functional connectivity refers to the temporal correlation between spatially remote neurophysiological events, indicating that different regions of the brain are functionally linked. This concept is typically assessed using methods such as functional magnetic resonance imaging (fMRI), which measures the blood oxygen level dependent (BOLD) signal, and electroencephalography (EEG), which captures electrical activity directly.
Notice what functional connectivity does not claim. It does not imply a direct anatomical connection between the two regions. It reflects the coherence of activity patterns over time, which two regions can share because they are wired together, because a third region drives both of them, or because they happen to be responding to the same input (Friston, 2011).
Structural Connectivity
Structural connectivity describes the physical connections between different brain regions, primarily formed by white matter tracts. This type of connectivity is often investigated using diffusion tensor imaging (DTI), a form of MRI that maps the diffusion of water molecules along white matter fibers.
Structural connectivity provides the anatomical basis for functional interactions. It reveals the pathways through which information can flow in the brain, which is the hardware layer beneath the software of moment-to-moment communication (Behrens & Sporns, 2012).
Effective Connectivity
Effective connectivity refers to the causal influence that one brain region exerts over another. Unlike functional connectivity, which is symmetrical and undirected, effective connectivity involves directionality and causality. It answers the question of who is driving whom.
Techniques such as dynamic causal modeling (DCM) and Granger causality analysis are used to infer effective connectivity. These methods provide insight into the directional flow of information and the hierarchical organization of brain networks (Friston et al., 2013).
How Brain Networks Are Organized
Small-World Networks
A small-world network is a type of network characterized by high clustering of connections and short path lengths between nodes. In the context of brain networks, this means that neurons and regions form tightly connected local clusters, while a smaller number of long-range connections allow efficient communication across the whole brain.
Think of an airline route map. Most flights connect nearby cities, but a handful of long-haul routes let you reach the far side of the world in two or three hops. Small-world properties are believed to optimize both local specialization and global integration of information (Bassett & Bullmore, 2006).
Hubs
Hubs are highly connected and central nodes within a network, playing a critical role in facilitating communication and integration across different regions. In the brain, hubs are typically found in regions that are crucial for many cognitive functions, such as the precuneus, the posterior cingulate cortex, and the anterior cingulate cortex.
Hubs are integral to the brain's small-world architecture, and that centrality comes at a cost. Because so much traffic passes through them, hubs are thought to be selectively vulnerable in many neurodegenerative diseases, and damage to a hub disrupts far more of the network than damage to a peripheral node (Crossley et al., 2014).
Functional connectivity measures temporal correlation and is symmetric and undirected. Structural connectivity measures the physical white matter pathways, usually with diffusion tensor imaging. Effective connectivity measures causal influence and has a direction, and it is estimated with dynamic causal modeling or Granger causality. The brain is organized as a small-world network with dense local clustering and short global path lengths, and hubs such as the precuneus and the posterior and anterior cingulate cortices carry a disproportionate share of the traffic. That centrality makes hubs both efficient and vulnerable.
Check Your Understanding
- Two regions show high functional connectivity. Name three different situations that could produce that result.
- Why is effective connectivity described as directional when functional connectivity is not?
- What two properties define a small-world network, and what does each one buy the brain?
- Why are hubs disproportionately affected in neurodegenerative disease?
- Which imaging method would you use to ask whether a white matter tract is intact, and why would EEG be the wrong tool for that question?
qEEG Connectivity Metrics
qEEG connectivity metrics quantify the relationships between different brain regions, helping you understand the functional and structural networks underlying cognitive and behavioral functions. These metrics divide into the same two families you just met. Functional metrics measure statistical dependencies between neural signals, while effective metrics assess the causal influence one neural system exerts over another.
Six metrics do most of the work in clinical qEEG: coherence, comodulation, phase lag index, imaginary coherence, amplitude envelope correlation, and Granger causality. They are not interchangeable. Each one makes a different assumption about what counts as communication, and each one fails in a different way.
Coherence
Coherence measures the degree of synchronization between two EEG signals across different frequency bands. It is calculated as the normalized cross-spectral density between two signals, producing a value between 0, meaning no synchronization, and 1, meaning perfect synchronization. Coherence is used to assess functional connectivity, reflecting how different brain regions work together during tasks or at rest (Thatcher et al., 1986).
Clinically, increased coherence in specific frequency bands may indicate enhanced communication between brain regions, while decreased coherence may suggest disconnection or dysfunction. Reduced coherence in the alpha band, for example, has been associated with cognitive decline in Alzheimer's disease (Babiloni et al., 2006).
Coherence carries an important caveat that you should keep in front of you whenever you read a coherence map. Because a single generator can project to several electrodes at once through the conductive tissues of the head, coherence can be high between two sites that are not communicating at all. This is the volume conduction problem, and the three metrics that follow were designed in response to it.
Comodulation
Comodulation refers to the synchronization or co-occurrence of amplitude fluctuations in different frequency bands across different brain regions. In qEEG connectivity analysis, comodulation examines the coupling between the amplitudes of brain wave oscillations rather than the alignment of their phases.
Comodulation is crucial for understanding the complex dynamics of brain activity. Unlike coherence, which measures phase synchronization, comodulation focuses on the amplitude correlation between different frequencies, offering a complementary perspective on how brain regions interact. This is particularly useful for identifying patterns of neural coordination that are not evident from phase-based measures alone.
Comodulation helps identify and characterize the neural networks involved in cognitive and behavioral functions. The coupling between theta and gamma oscillations, for instance, has been linked to working memory and cognitive control processes (Canolty et al., 2006).
The computation proceeds in two steps. First comes amplitude envelope extraction, in which the amplitude envelopes of the decomposed signals are computed, often using the Hilbert transform. Second comes the comodulation calculation itself, in which the correlation or coherence between the amplitude envelopes of different frequency bands is calculated to assess the degree of comodulation.
Abnormal comodulation patterns can be indicative of neurological and psychiatric disorders. Disrupted comodulation between frequency bands has been observed in conditions such as epilepsy and schizophrenia, which makes it a candidate biomarker for diagnosis and treatment monitoring (Lopes da Silva, 2013).
Phase Lag Index
The phase lag index (PLI) measures the consistency of phase differences between EEG signals, providing information about the directionality of communication between brain regions. Unlike coherence, PLI is less sensitive to volume conduction effects, which makes it a more reliable measure of true brain connectivity (Stam et al., 2007).
The logic behind PLI is elegant. Volume conduction spreads a single source to multiple electrodes essentially instantaneously, producing a phase difference of zero. By discarding zero-lag relationships and counting only consistent nonzero phase lags, PLI throws out the artifact and keeps the signal.
Abnormal PLI values can indicate disrupted neural synchronization. Altered PLI patterns have been observed in patients with epilepsy, reflecting the abnormal connectivity associated with seizure activity (van Diessen et al., 2013).
Imaginary Coherence
Imaginary coherence assesses the synchronization between EEG signals by focusing on the imaginary part of the cross-spectrum. Because volume-conducted activity contributes almost entirely to the real part of the cross-spectrum, discarding the real part removes most of the artifact and provides a clearer picture of genuine brain connectivity (Nolte et al., 2004).
Imaginary coherence has been used to study connectivity in a range of psychiatric and neurological disorders. Decreased imaginary coherence in the beta band, for example, has been linked to schizophrenia, suggesting disrupted long-range connectivity (Hinkley et al., 2011).
Amplitude Envelope Correlation
The amplitude envelope correlation (AEC) measures the correlation between the amplitude envelopes of EEG signals. This metric reflects the strength of functional connectivity by quantifying how the amplitude of oscillatory activity in one brain region correlates with that in another region over time (Engel et al., 2013).
AEC can reveal changes in connectivity associated with different brain states. Reduced AEC in the alpha band has been associated with impaired consciousness in disorders such as coma and the vegetative state (Boly et al., 2008).
Granger Causality
Granger causality is a measure of effective connectivity that assesses the directional influence one time series exerts over another. It uses predictive modeling to determine whether past values of one signal improve the prediction of future values of another signal, which is taken as evidence of a causal relationship (Granger, 1969).
Granger causality has been applied to study directional interactions in a variety of brain disorders. Abnormal Granger causality patterns have been found in patients with autism, reflecting atypical information flow in neural networks (Billeci et al., 2013).
Coherence and phase lag index are phase-based measures, while comodulation and amplitude envelope correlation are amplitude-based measures. Coherence is the most familiar metric but the most vulnerable to volume conduction, because a single generator projecting to two electrodes produces spurious zero-lag synchrony. Phase lag index solves this by ignoring zero-lag relationships, and imaginary coherence solves it by discarding the real part of the cross-spectrum. Granger causality stands apart as a measure of effective connectivity, asking whether one signal predicts another rather than whether the two merely covary. Choose the metric that matches your question, and never report a coherence finding without considering whether volume conduction could explain it.
A 62-year-old client named Marguerite is referred for memory complaints that her family attributes to normal aging. Her absolute power values fall inside normal limits for her age, and a report based on power alone would be unremarkable. Her connectivity analysis tells a different story: alpha-band coherence between posterior and frontal sites is markedly reduced, a pattern associated with cognitive decline in Alzheimer's disease (Babiloni et al., 2006). Before you act on that, you check the imaginary coherence and phase lag index results to confirm that the reduction is not an artifact of reference choice or head geometry, and both metrics agree. You now have a physiological finding that justifies a referral for neuropsychological testing, months before the standard screening instruments would have flagged her.
Check Your Understanding
- What range of values can coherence take, and what does each end of the range mean?
- Explain in your own words why volume conduction inflates coherence but has much less effect on the phase lag index.
- How does imaginary coherence remove the contribution of volume conduction?
- What does comodulation measure that coherence cannot, and what role does the Hilbert transform play in computing it?
- Why is Granger causality classified as a measure of effective rather than functional connectivity?
Applications of qEEG Connectivity Metrics
Neurological Disorders
qEEG connectivity metrics are widely used to investigate the neural basis of neurological disorders. In epilepsy, these metrics can identify abnormal connectivity patterns that contribute to seizure generation and spread. That information guides treatment strategies such as resective surgery or neurostimulation, where knowing which network is involved matters as much as knowing which lobe (Gotman, 2013).
Psychiatric Disorders
In psychiatric disorders, qEEG connectivity metrics help uncover underlying neural mechanisms that symptom checklists cannot reach. Altered connectivity patterns in the default mode network have been associated with depression and anxiety disorders. These findings provide insight into pathophysiology and offer potential biomarkers for predicting treatment response (Greicius et al., 2007).
Cognitive and Developmental Disorders
qEEG connectivity metrics are also valuable in studying cognitive and developmental disorders. In ADHD, disrupted connectivity patterns have been linked to attentional deficits and hyperactivity. Those patterns inform the development of targeted interventions such as neurofeedback, where the training target can be a network relationship rather than a single-site amplitude (Arns et al., 2013).
Major Brain Networks
Default Mode Network
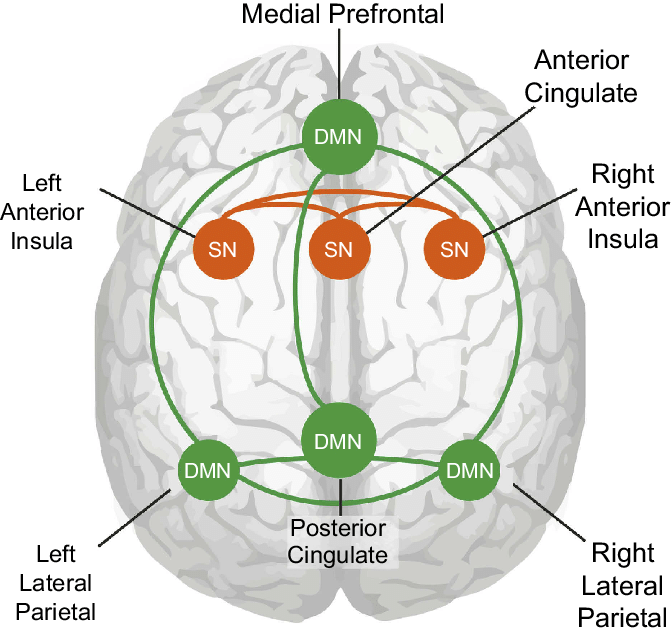
The default mode network (DMN) is a prominent brain network that is active during rest and involved in self-referential and introspective activities. The DMN includes regions such as the medial prefrontal cortex, the posterior cingulate cortex, and the inferior parietal lobule.
The DMN is the network that comes online when you stop attending to the outside world and start thinking about yourself, your past, or your future. Abnormalities in DMN connectivity have been associated with a range of psychiatric conditions, including depression and schizophrenia (Raichle, 2015).
.jpg)

Salience Network
The salience network is responsible for detecting and filtering salient stimuli, integrating sensory, emotional, and cognitive information. It includes regions such as the anterior insula and the anterior cingulate cortex.
Think of the salience network as the brain's assignment editor. It decides what deserves attention right now and hands control to the appropriate system. Dysfunction in the salience network has been implicated in disorders such as autism and frontotemporal dementia (Menon, 2015).
Executive Network
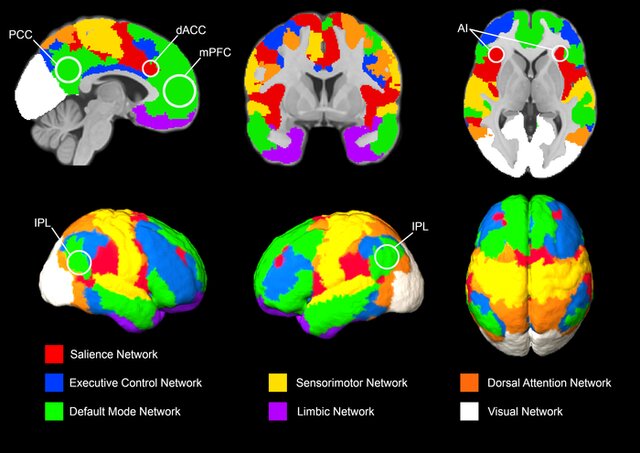
The executive network, also known as the executive control network, is involved in high-level cognitive functions such as working memory, problem solving, and attention. Key regions include the dorsolateral prefrontal cortex and the posterior parietal cortex.
Impaired connectivity within the executive network is often observed in conditions like ADHD and Alzheimer's disease (Seeley et al., 2007). Notice how the three networks relate to one another: the salience network detects what matters and switches control between the inward-facing default mode network and the outward-facing executive network. When that switching mechanism misfires, a client can be stuck ruminating when a task demands focus.
Integration with Clinical Examinations
Understanding brain networks and connectivity enhances both the diagnostic and the therapeutic approach to neurological and psychiatric disorders. Functional and structural connectivity analyses can identify network dysfunctions that correlate with clinical symptoms, and those correlations guide more targeted interventions.
Network-based approaches can improve the accuracy of early diagnosis in Alzheimer's disease by identifying disrupted connectivity patterns before significant cognitive decline appears (Greicius et al., 2004). That is the whole promise of connectivity analysis in a sentence: it can see a network coming apart while the person is still compensating.
Bringing It Together
The study of brain networks and connectivity provides a comprehensive framework for understanding the complex interactions that underlie brain function. By defining functional, structural, and effective connectivity, and by examining the characteristics of the major brain networks, you can appreciate the architecture of the brain rather than only its parts.
This knowledge advances basic neuroscience, and it has direct implications for practice. Quantifying the interactions between regions gives you information about the neural basis of cognitive, behavioral, and clinical phenomena that no single-site measure provides. Integrating qEEG connectivity metrics with other neuroimaging and clinical data can sharpen your understanding of brain disorders and guide more effective diagnostic and therapeutic strategies.
Connectivity metrics have found application across neurological, psychiatric, cognitive, and developmental disorders, from localizing epileptic networks to predicting antidepressant response. Three large-scale networks dominate the clinical literature. The default mode network, comprising the medial prefrontal cortex, the posterior cingulate cortex, and the inferior parietal lobule, is active at rest and during self-referential thought. The salience network, comprising the anterior insula and the anterior cingulate cortex, detects what matters and switches control between the other two. The executive network, comprising the dorsolateral prefrontal cortex and the posterior parietal cortex, handles working memory, problem solving, and attention.
Check Your Understanding
- Name the core regions of the default mode network, the salience network, and the executive network.
- What role does the salience network play in coordinating the other two networks?
- How can connectivity analysis detect Alzheimer's disease earlier than cognitive screening does?
- Why might a network-level target be more useful than a single-site amplitude target in ADHD neurofeedback?
- Your client shows normal absolute power across all bands but abnormal connectivity. What does that combination tell you, and what does it rule out?
Cutting-Edge Topics in qEEG Research
Neurofeedback That Targets Networks Rather Than Sites
The most interesting recent work asks whether training can restore a disrupted network rather than merely change an amplitude. Nicholson, Ros, Densmore, and colleagues (2020) ran a randomized controlled trial of alpha-rhythm EEG neurofeedback in posttraumatic stress disorder and measured the outcome with fMRI as well as symptom scales. They reported decreased PTSD symptoms alongside restored default mode and salience network connectivity. That pairing matters, because it links a scalp-level intervention to a change in the large-scale architecture this unit describes.
Nicholson, Ros, Jetly, and Lanius (2020) extended the argument, framing neurofeedback in PTSD as a method for regaining control of network dynamics rather than of a single frequency band. The clinical implication is that your training target should be chosen from a network model of the presenting problem.
Machine Learning Applied to Multimodal Connectivity Data
Connectivity data are high-dimensional, which is exactly the situation where pattern classification outperforms rules of thumb. Nicholson and colleagues (2019) used multivariate pattern analysis on multimodal neuroimaging data to classify posttraumatic stress disorder and, more impressively, its dissociative subtype. The classifier drew on distributed network features rather than on any single region.
Expect this approach to reach qEEG. When the input features are coherence, phase lag index, and amplitude envelope correlation matrices rather than fMRI voxels, the same methods become available at a fraction of the cost. The open questions are replication across sites and whether classifiers trained on one normative database generalize to another.
The Default Mode Network as the Brain's Center of Gravity
Davey and Harrison (2018) argue that the default mode network is best understood not as a resting-state curiosity but as the substrate of self-representation. On their account the DMN integrates information across time to maintain a coherent sense of who you are. That reframing changes how you interpret DMN abnormalities in depression, where rumination looks less like a symptom of low mood and more like a network stuck in its default configuration.
The Ongoing War Against Volume Conduction
Every metric in this unit that postdates coherence exists because of one problem. Nolte and colleagues (2004) attacked it by keeping only the imaginary part of the cross-spectrum, and Stam and colleagues (2007) attacked it by discarding zero-lag phase relationships altogether. Both solutions work, and both throw away real information along with the artifact, because genuine zero-lag synchrony does occur in the brain.
The current frontier is source-space connectivity, in which signals are first projected back to cortical sources and connectivity is computed between those sources rather than between scalp electrodes. This does not eliminate the problem, since source leakage replaces volume conduction, but it changes its geometry in ways that are easier to model. Watch for connectivity reports that specify whether the analysis was performed in sensor space or source space, because the two are not comparable.
Assignment
Now that you have completed this unit, explain how activating the default mode network could impair athletic performance. Ground your answer in the network relationships described in this chapter rather than in general statements about concentration.
In your response, identify which network should dominate during skilled movement, describe what the salience network contributes to switching between the two, and name one connectivity metric you would use to test your explanation in a laboratory study. Say why you chose that metric over the alternatives.
Glossary
amplitude envelope correlation (AEC): the correlation between the amplitude envelopes of EEG signals, indicating the strength of functional connectivity by quantifying how the amplitude of oscillatory activity in one brain region correlates with that in another over time.
blood oxygenation level-dependent (BOLD) signal: the fMRI measure that reflects local changes in blood flow, blood volume, and the concentration of deoxygenated hemoglobin accompanying neural activity, and that serves as an indirect hemodynamic index of that activity rather than a direct measure of oxygen use.
coherence (EEG): a frequency-specific measure equal to the squared magnitude of the cross-spectrum divided by the product of the two autospectra, ranging from 0 to 1.
comodulation: covariation over time in the amplitude or power of a specified frequency band between recording sites, calculated with a stated method.
default mode network (DMN): a cortical network of sites located in frontal, temporal, and parietal regions that is most active during introspection and daydreaming and relatively inactive when pursuing external goals.
diffusion tensor imaging (DTI): an MRI technique that maps white matter tracts by measuring the direction in which water diffuses through tissue.
dynamic causal modeling (DCM): an analytic method that estimates the directional influence one brain region exerts over another from neuroimaging data.
effective connectivity: the directional influence that one brain region exerts over another, distinguished from functional connectivity, which describes correlation without direction.
executive network: a brain network involved in high-level cognitive functions such as working memory, problem solving, and attention, primarily including the dorsolateral prefrontal cortex and the posterior parietal cortex.
functional connectivity: the statistical dependencies between spatially remote neurophysiological events, indicating that different brain regions are functionally linked without implying a direct anatomical connection.
Granger causality: a statistical test of directed influence in which one signal counts as driving another when its past values improve prediction of the other's future values. It establishes predictive precedence, not physiological causation.
Hilbert transform: a mathematical operation used to extract the instantaneous amplitude envelope and phase of a filtered signal, forming the first step in comodulation and amplitude envelope correlation analyses.
imaginary coherence: a measure of the synchronization between EEG signals that uses only the imaginary part of the cross-spectrum, reducing the influence of volume conduction and highlighting true brain connectivity.
network hub: a node with disproportionately high connectivity or centrality that supports communication or integration within a network.
phase lag index (PLI): a measure of the consistency of nonzero phase differences between EEG signals, providing information about the directionality and strength of functional connectivity while minimizing volume conduction effects.
qEEG connectivity metrics: quantitative measures of the statistical or causal relationships between EEG signals recorded at different scalp sites, used to characterize the functional and effective networks underlying cognition and behavior.
salience network: a large-scale network centered on anterior insula and dorsal anterior cingulate cortex that detects behaviorally relevant events and coordinates network switching.
small-world network: a type of network characterized by high clustering of connections and short path lengths between nodes, optimizing both local specialization and global integration of information.
structural connectivity: the physical connections between different brain regions, primarily formed by white matter tracts, providing the anatomical basis for functional and effective connectivity.
volume conduction: passive spread of electrical fields through conductive biological tissues, allowing a source to influence electrodes located at a distance.
Test Yourself on ClassMarker
Click the button below to take a 10-question exam over this entire unit. There is no password.
Review Flash Cards on Quizlet
Click the button below to review our chapter flash cards.
References
Bassett, D. S., & Bullmore, E. (2006). Small-world brain networks. The Neuroscientist, 12(6), 512-523. https://doi.org/10.1177/1073858406293182
Behrens, T. E., & Sporns, O. (2012). Human connectomics. Current Opinion in Neurobiology, 22(1), 144-153. https://doi.org/10.1016/j.conb.2011.08.014
Crossley, N. A., Mechelli, A., Vértes, P. E., Winton-Brown, T. T., Patel, A. X., Ginestet, C. E., McGuire, P., & Bullmore, E. T. (2014). Cognitive relevance of the community structure of the human brain functional coactivation network. Proceedings of the National Academy of Sciences, 110(28), 11583-11588. https://doi.org/10.1073/pnas.1220826110
Davey, C. G., & Harrison, B. J. (2018). The brain's center of gravity: How the default mode network helps us to understand the self. World Psychiatry, 17(3), 278-279. https://doi.org/10.1002/wps.20553
Friston, K. J. (2011). Functional and effective connectivity: A review. Brain Connectivity, 1(1), 13-36. https://doi.org/10.1089/brain.2011.0008
Friston, K. J., Harrison, L., & Penny, W. (2013). Dynamic causal modelling. NeuroImage, 19(4), 1273-1302. https://doi.org/10.1016/S1053-8119(03)00202-7
Greicius, M. D., Srivastava, G., Reiss, A. L., & Menon, V. (2004). Default-mode network activity distinguishes Alzheimer's disease from healthy aging: Evidence from functional MRI. Proceedings of the National Academy of Sciences, 101(13), 4637-4642. https://doi.org/10.1073/pnas.0308627101
Menon, V. (2015). Salience network. In A. W. Toga (Ed.), Brain mapping: An encyclopedic reference (Vol. 2, pp. 597-611). Academic Press. https://doi.org/10.1016/B978-0-12-397025-1.00112-4
Nicholson, A. A., Densmore, M., McKinnon, M. C., Neufeld, R. W. J., Frewen, P. A., Théberge, J., Jetly, R., Richardson, J. D., & Lanius, R. A. (2019). Machine learning multivariate pattern analysis predicts classification of posttraumatic stress disorder and its dissociative subtype: A multimodal neuroimaging approach. Psychological Medicine, 49(12), 2049-2059. https://doi.org/10.1017/S0033291718002866
Nicholson, A. A., Ros, T., Densmore, M., Frewen, P. A., Neufeld, R. W. J., Théberge, J., Jetly, R., & Lanius, R. A. (2020). A randomized, controlled trial of alpha-rhythm EEG neurofeedback in posttraumatic stress disorder: A preliminary investigation showing evidence of decreased PTSD symptoms and restored default mode and salience network connectivity using fMRI. NeuroImage: Clinical, 28, 102490. https://doi.org/10.1016/j.nicl.2020.102490
Nicholson, A. A., Ros, T., Jetly, R., & Lanius, R. A. (2020). Regulating posttraumatic stress disorder symptoms with neurofeedback: Regaining control of the mind. Journal of Military, Veteran and Family Health, 6(S1), 3-15. https://doi.org/10.3138/jmvfh.2019-0032
Raichle, M. E. (2015). The brain's default mode network. Annual Review of Neuroscience, 38, 433-447. https://doi.org/10.1146/annurev-neuro-071013-014030
Seeley, W. W., Menon, V., Schatzberg, A. F., Keller, J., Glover, G. H., Kenna, H., Reiss, A. L., & Greicius, M. D. (2007). Dissociable intrinsic connectivity networks for salience processing and executive control. Journal of Neuroscience, 27(9), 2349-2356. https://doi.org/10.1523/JNEUROSCI.5587-06.2007
Return to Top