Cardiovascular Anatomy
What You Will Learn in This Chapter
Have you ever wondered why your hands turn cold when you are anxious, or why some people seem to have hearts that age faster than others? This unit takes you on a journey through your cardiovascular system, the remarkable network of blood vessels and the muscular pump at its center that biofeedback clinicians target to treat conditions ranging from essential hypertension to migraine headaches.
You will discover how arteries, veins, and capillaries work together to deliver nutrients and remove waste, and why the tiny arterioles in your fingertips hold the key to temperature biofeedback training. You will learn what blood volume pulse reveals about arterial health and why a missing dicrotic notch might signal trouble. Most importantly, you will explore heart rate variability, the healthy fluctuation between heartbeats that indexes your capacity to adapt to life's challenges.
Along the way, you will encounter the baroreceptor reflex (your body's built-in blood pressure regulator), understand why resonance frequency breathing is like pushing a child on a swing at just the right tempo, and discover why a healthy heart is decidedly not a metronome. By the end of this unit, you will understand how clinicians use HRV biofeedback to help clients restore the dynamic balance between their sympathetic and parasympathetic nervous systems.
This unit covers Arteries, Three Measures of Peripheral Blood Flow, Veins, Capillaries, Arteriovenous Anastomoses (AVAs), Blood Pressure, the Heart, and Heart Rate Variability. You will also explore cutting-edge topics including wearable HRV technology, cardiac vagal tone and longevity, and the heart-brain connection.
BCIA Blueprint Coverage: This unit addresses Descriptions of most commonly employed biofeedback modalities: Skin temperature, ECG and heart rate (III-A 1-2).
"HRV is the organized fluctuation of time intervals between successive heartbeats defined as interbeat intervals" (Shaffer, Meehan, & Zerr, 2020). The oscillations of a healthy heart are complex. Heart rate variability (HRV) indexes how efficiently we mobilize and utilize limited self-regulatory resources to maintain homeostasis. HRV plays a vital role in regulatory capacity, executive functions, health, and performance. A healthy heart can rapidly adjust to sudden challenges due to the cooperation of interlocking and better-calibrated control systems. HRV is crucial to health, performance, and resilience. Behavioral interventions like aerobic exercise, healthy breathing, compassion, and mindfulness meditation are powerful strategies for increasing HRV.

Biofeedback interventions like heart rate variability biofeedback (HRVB) target the cardiovascular system to treat disorders as diverse as anxiety, depression, essential hypertension, migraine, post-traumatic stress disorder, Raynaud's disorder, and stress.
Biofeedback monitors blood pressure (BP), heart rate (HR), heart rate variability (HRV), pulse wave velocity, temperature, and blood volume pulse modalities. There has been a paradigm shift in treating disorders like depression and heart failure. Clinicians increasingly teach clients to enhance HRV through exercises that strengthen parasympathetic nervous system (PNS) tone. PNS activity is also called vagal tone because the vagus is the primary component of this autonomic branch (Breit et al., 2018).
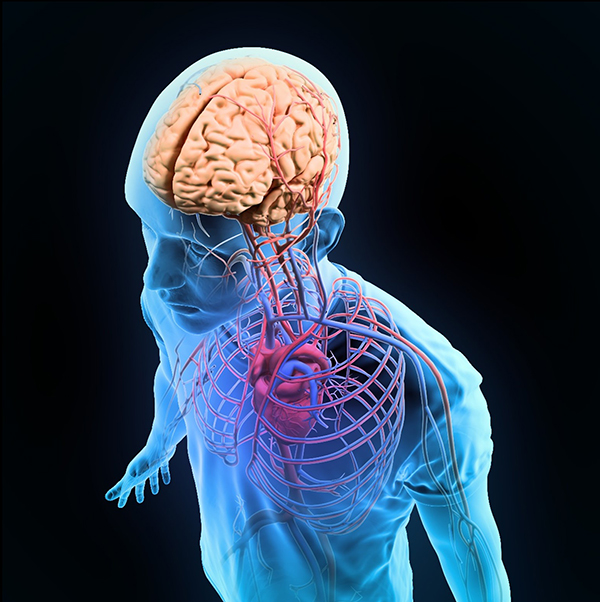
The brain receives more afferent projections from the heart than any other organ. Emerging evidence suggests that the heart's intrinsic nervous system has extensive bidirectional connections with the brain (MacKinnon et al., 2013; Shaffer, McCraty, & Zerr, 2014).
Researchers increasingly recognize the importance of HRV as an index of vulnerability to stressors and disease.
Here is a critical point to remember: the PNS and baroreceptor system produce brief (≤ 5 minutes) resting HRV without a sympathetic contribution. Patients can learn to increase the healthy variability of their hearts to treat disorders like anxiety, asthma, depression, hypertension, and irritable bowel syndrome. HRV biofeedback training can help patients restore a healthy dynamic balance between the sympathetic and parasympathetic nervous systems.
Temperature is one of the most widely trained modalities. Our understanding of the mechanisms underlying hand-warming and hand-cooling, while still incomplete, has radically changed due to landmark studies by researchers like Robert Freedman. These findings underscore the complexity of the cardiovascular system.
Two patterns, coupling and fractionation, describe changes observed when monitoring subjects. In response coupling, responses change together (HR up, BP up). In response fractionation, responses change independently (HR down, BP up).
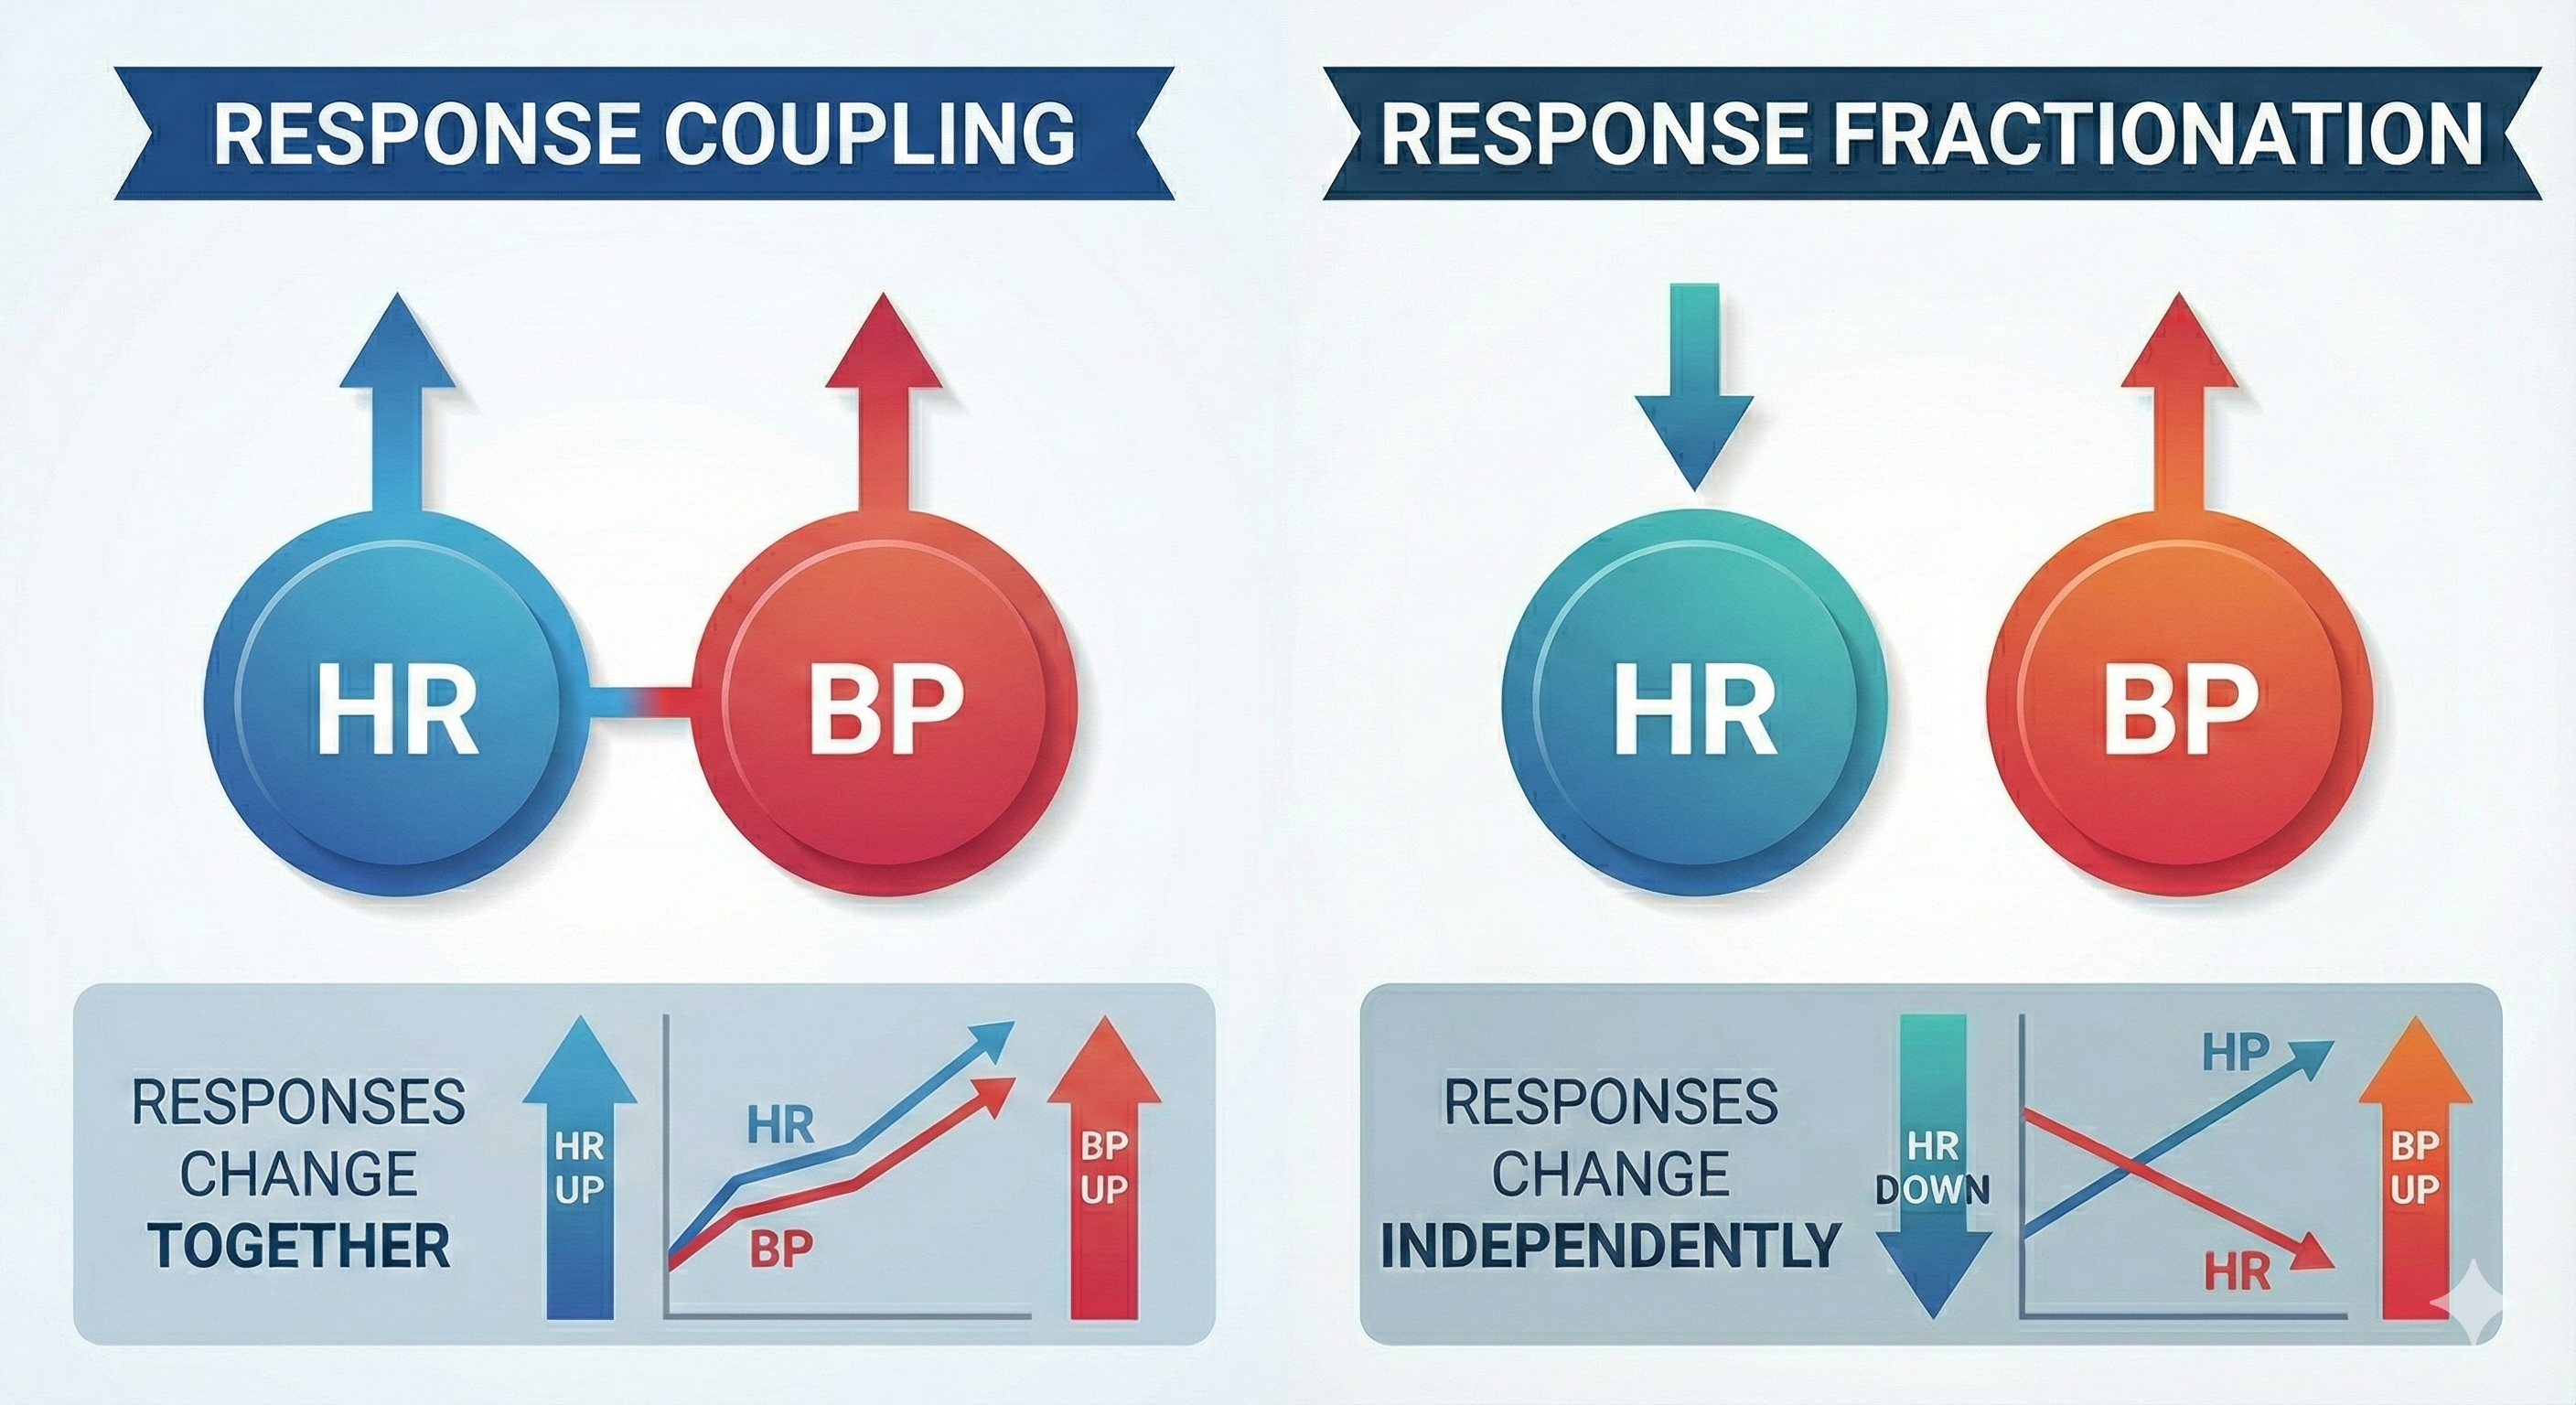
Coupling and fractionation reflect the multiple, independent processes that jointly produce these physiological measures. Healthy systems operate nonlinearly (unpredictably) to adapt to rapidly changing demands. Whether responses couple or fractionate during a specific observation period depends on the complicated interplay of participant, task, and environmental variables.
🎧 Listen to the Full Chapter LectureArteries: Your Body's High-Pressure Delivery System
Arteries carry blood away from the heart. Think of them as the express highways of your circulatory system, designed to handle high-pressure, high-speed blood flow.
🎧 Listen to a mini-lecture on Arteries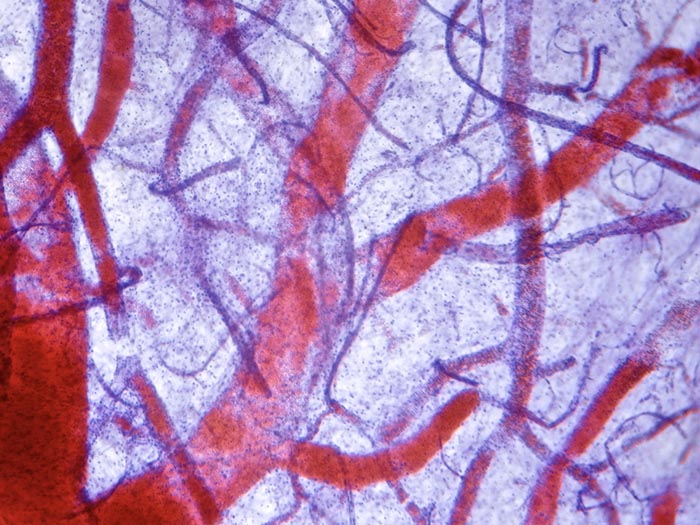
Check out the Khan Academy YouTube video Arteries vs. Veins - What's the Difference?
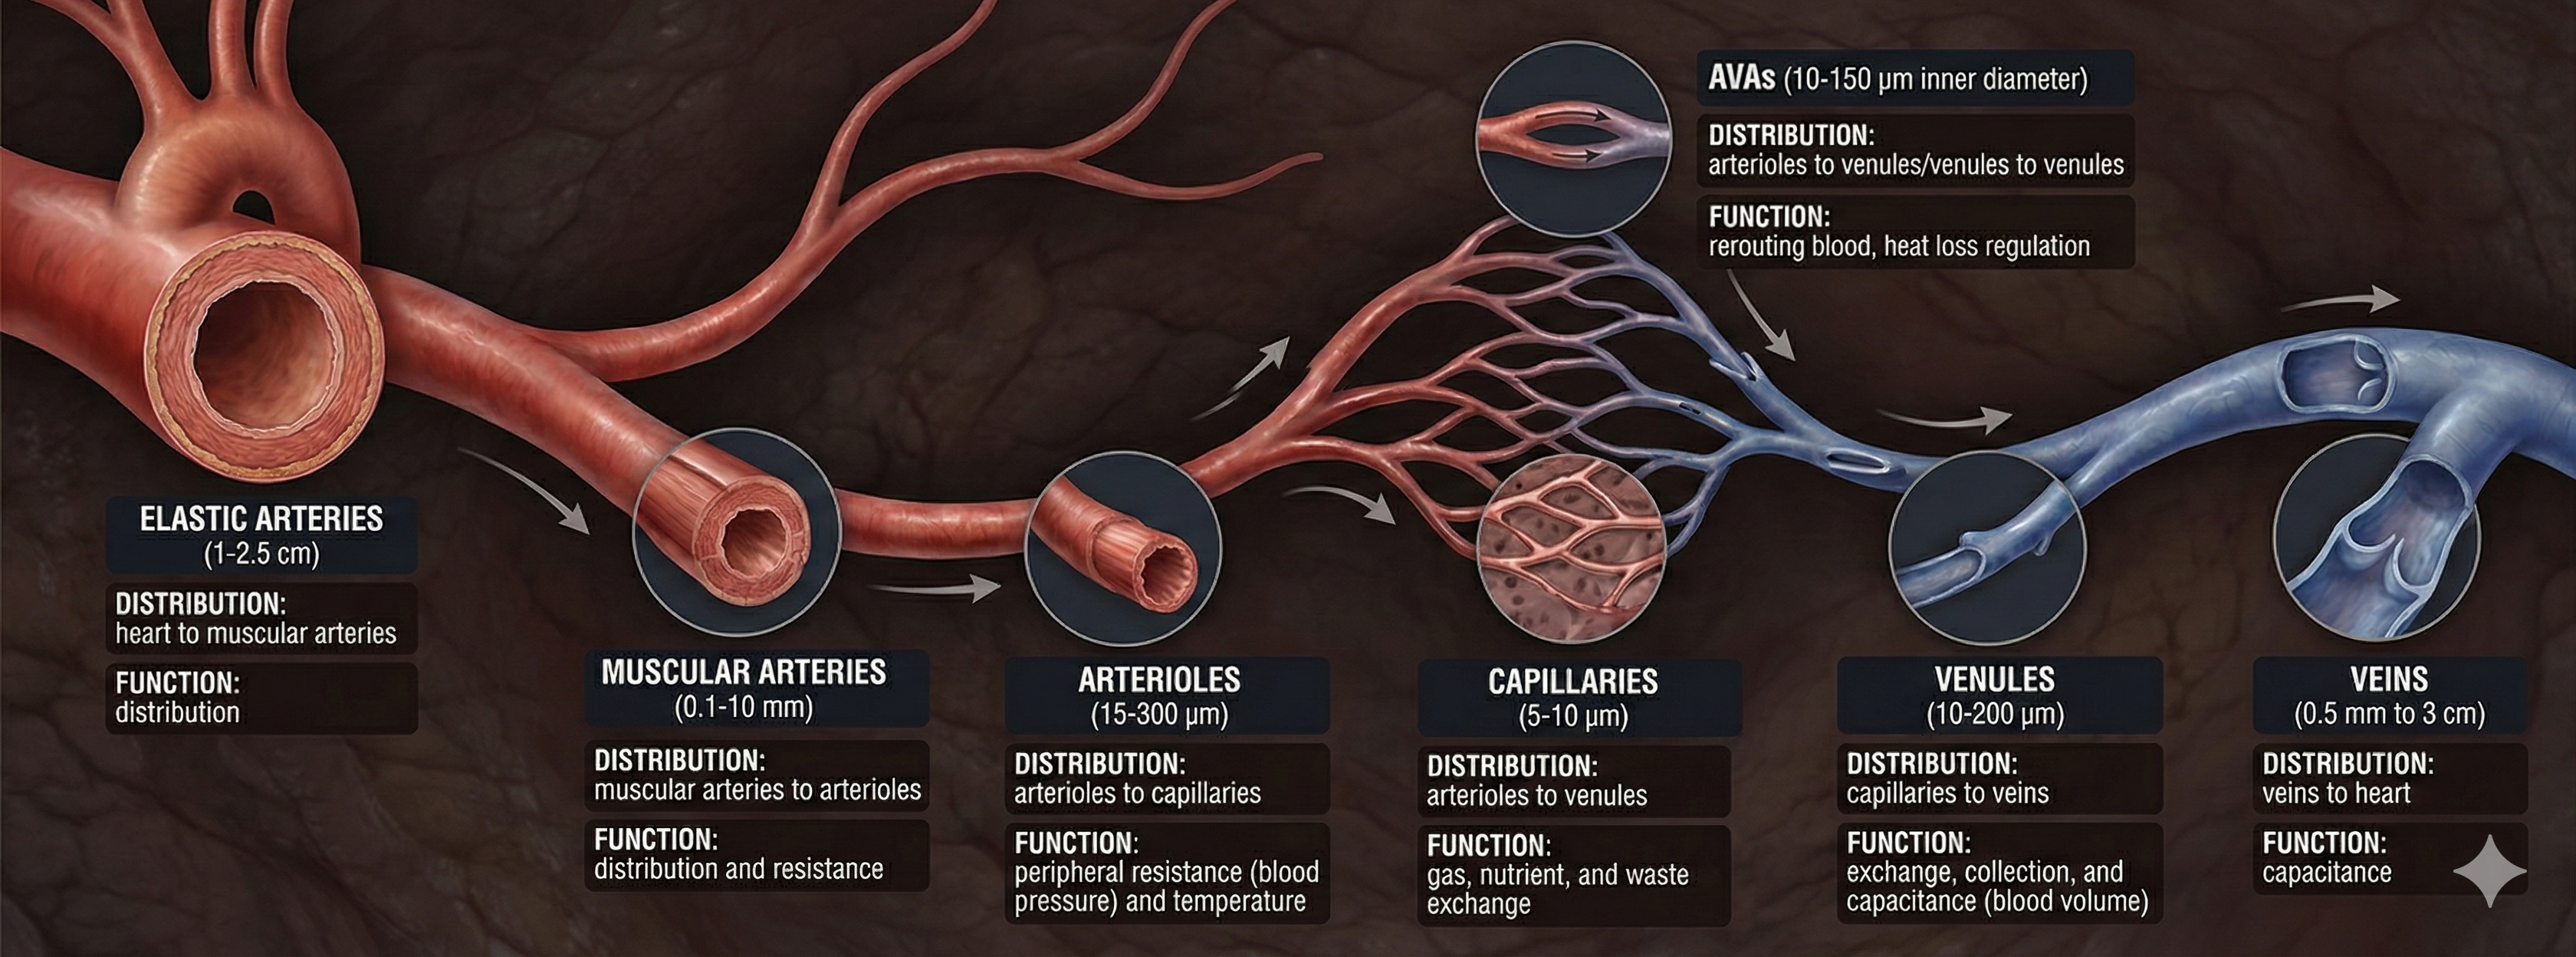
Arteries come in different sizes, each with a specialized job. Elastic arteries are large arteries like the aorta that distribute blood from the heart to muscular arteries. Medium-sized muscular arteries (like the brachial artery you feel when taking a pulse at your inner elbow) circulate blood throughout the body. They branch into small resistance arteries, which divide into arterioles.
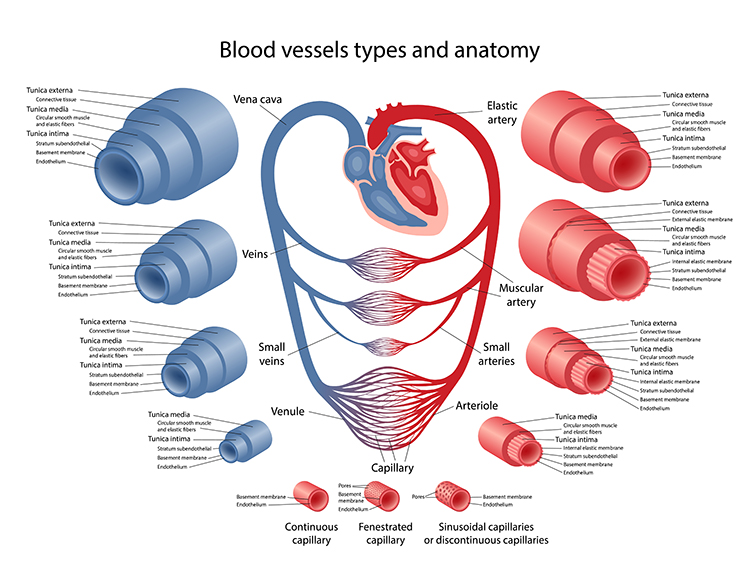
Here is where things get interesting for biofeedback: about 400 million arterioles regulate capillary blood flow by controlling resistance. The main source of resistance is the friction between blood and blood vessel walls. These microscopic vessels (15-300 μm in diameter) deliver blood to capillaries and anastomoses. Arterioles divide into microscopic capillaries as they penetrate tissue. There are 3-5 levels of branching between arterioles and capillary beds, varying with the supplied organ or tissue (Jackson, 2021).
Resistance arteries and arterioles help create peripheral vascular resistance, which is a major component of blood pressure (Segal, 2000). For example, arterioles contribute 50% of skeletal muscle vascular resistance (Fronek & Zweifach, 1975). Arterioles are responsible for most pulmonary vascular resistance due to their greater rigidity compared to larger arteries (Chaudhry et al., 2020).
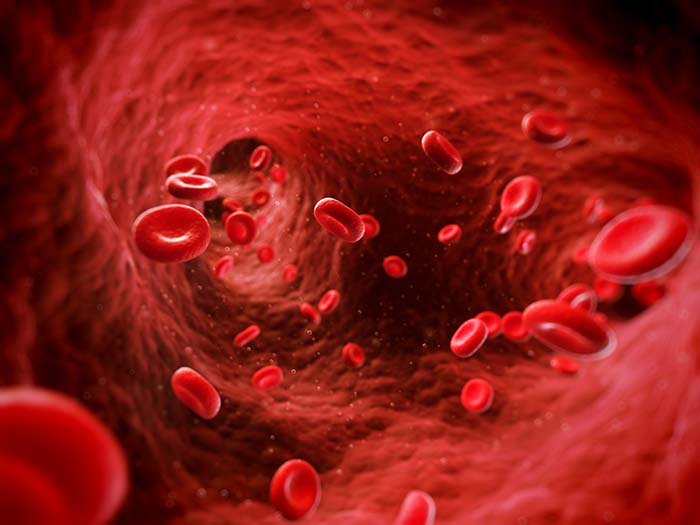
The video below shows red blood cells traveling through a pulsating arteriole.
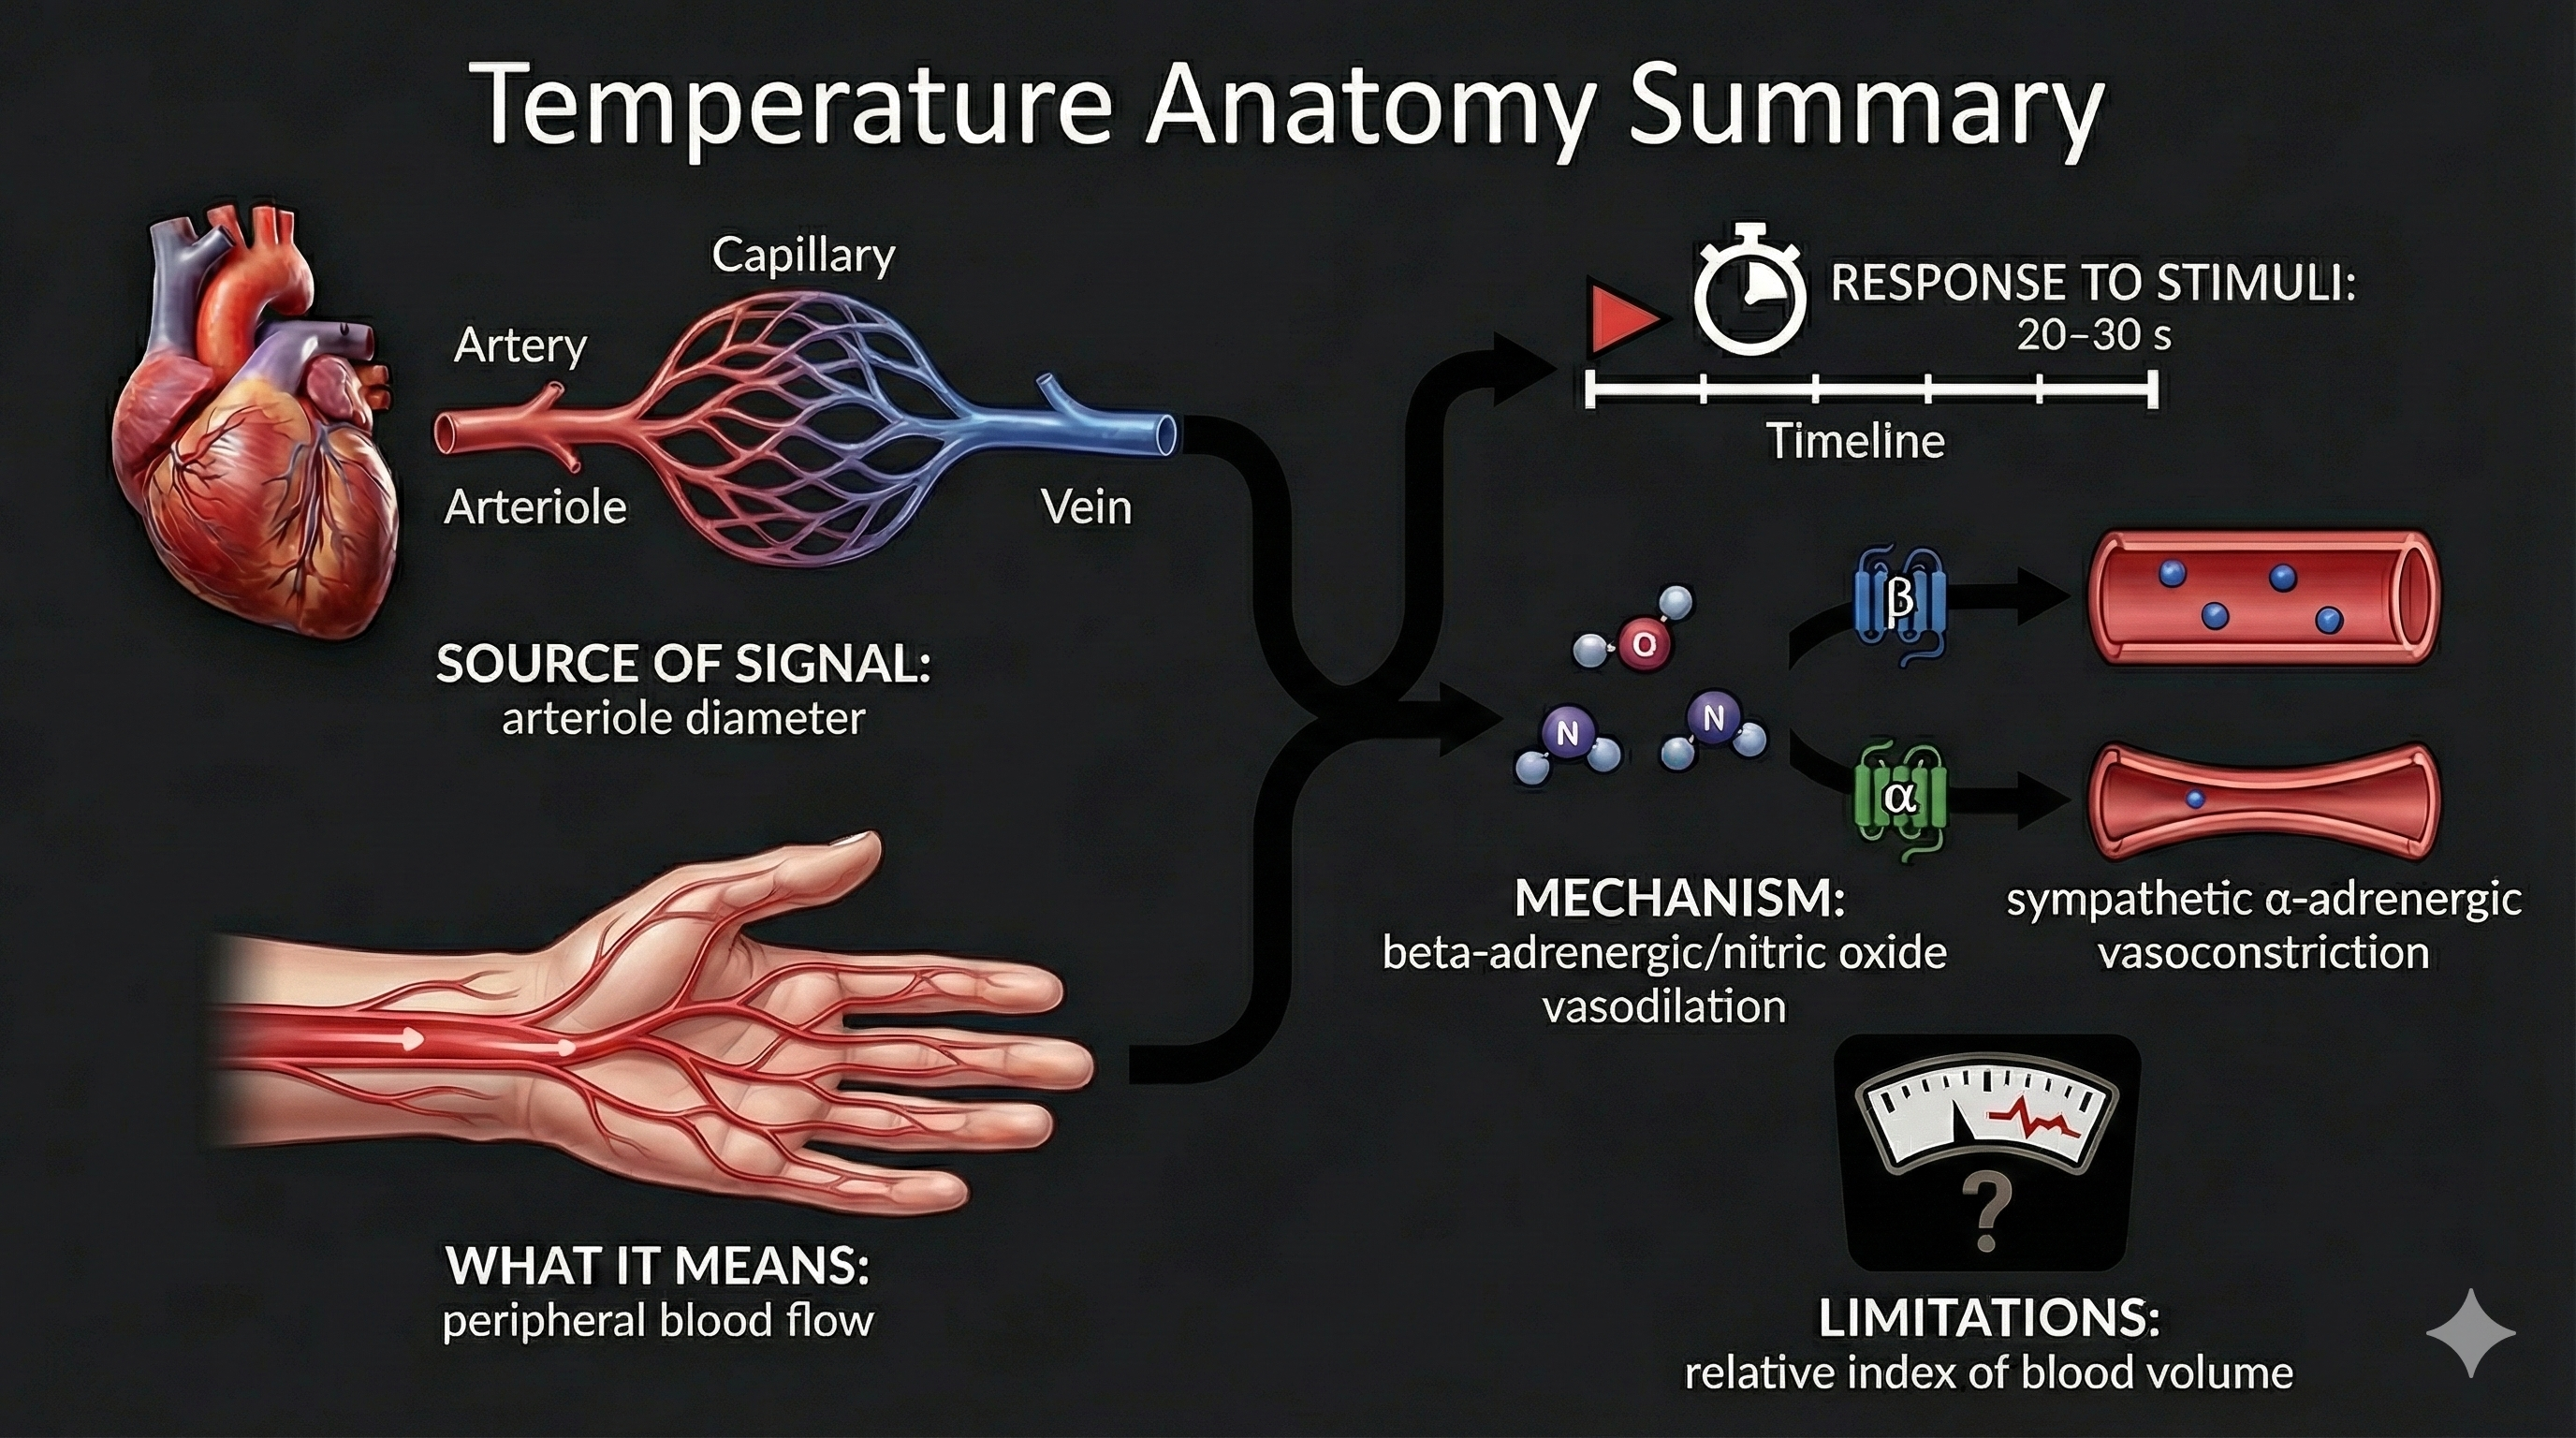
The control of arteriole diameter, which is crucial to regulating BP and hand temperature, is highly complex. Neural, hormonal, and local controls regulate blood flow through arterioles. These control mechanisms play varying roles across our body's organs. Modest degrees of vasoconstriction or vasodilation can greatly affect systemic vascular resistance (Tortora & Derrickson, 2021).
🎧 Listen to a mini-lecture on Factors That Control Arteriole Diameter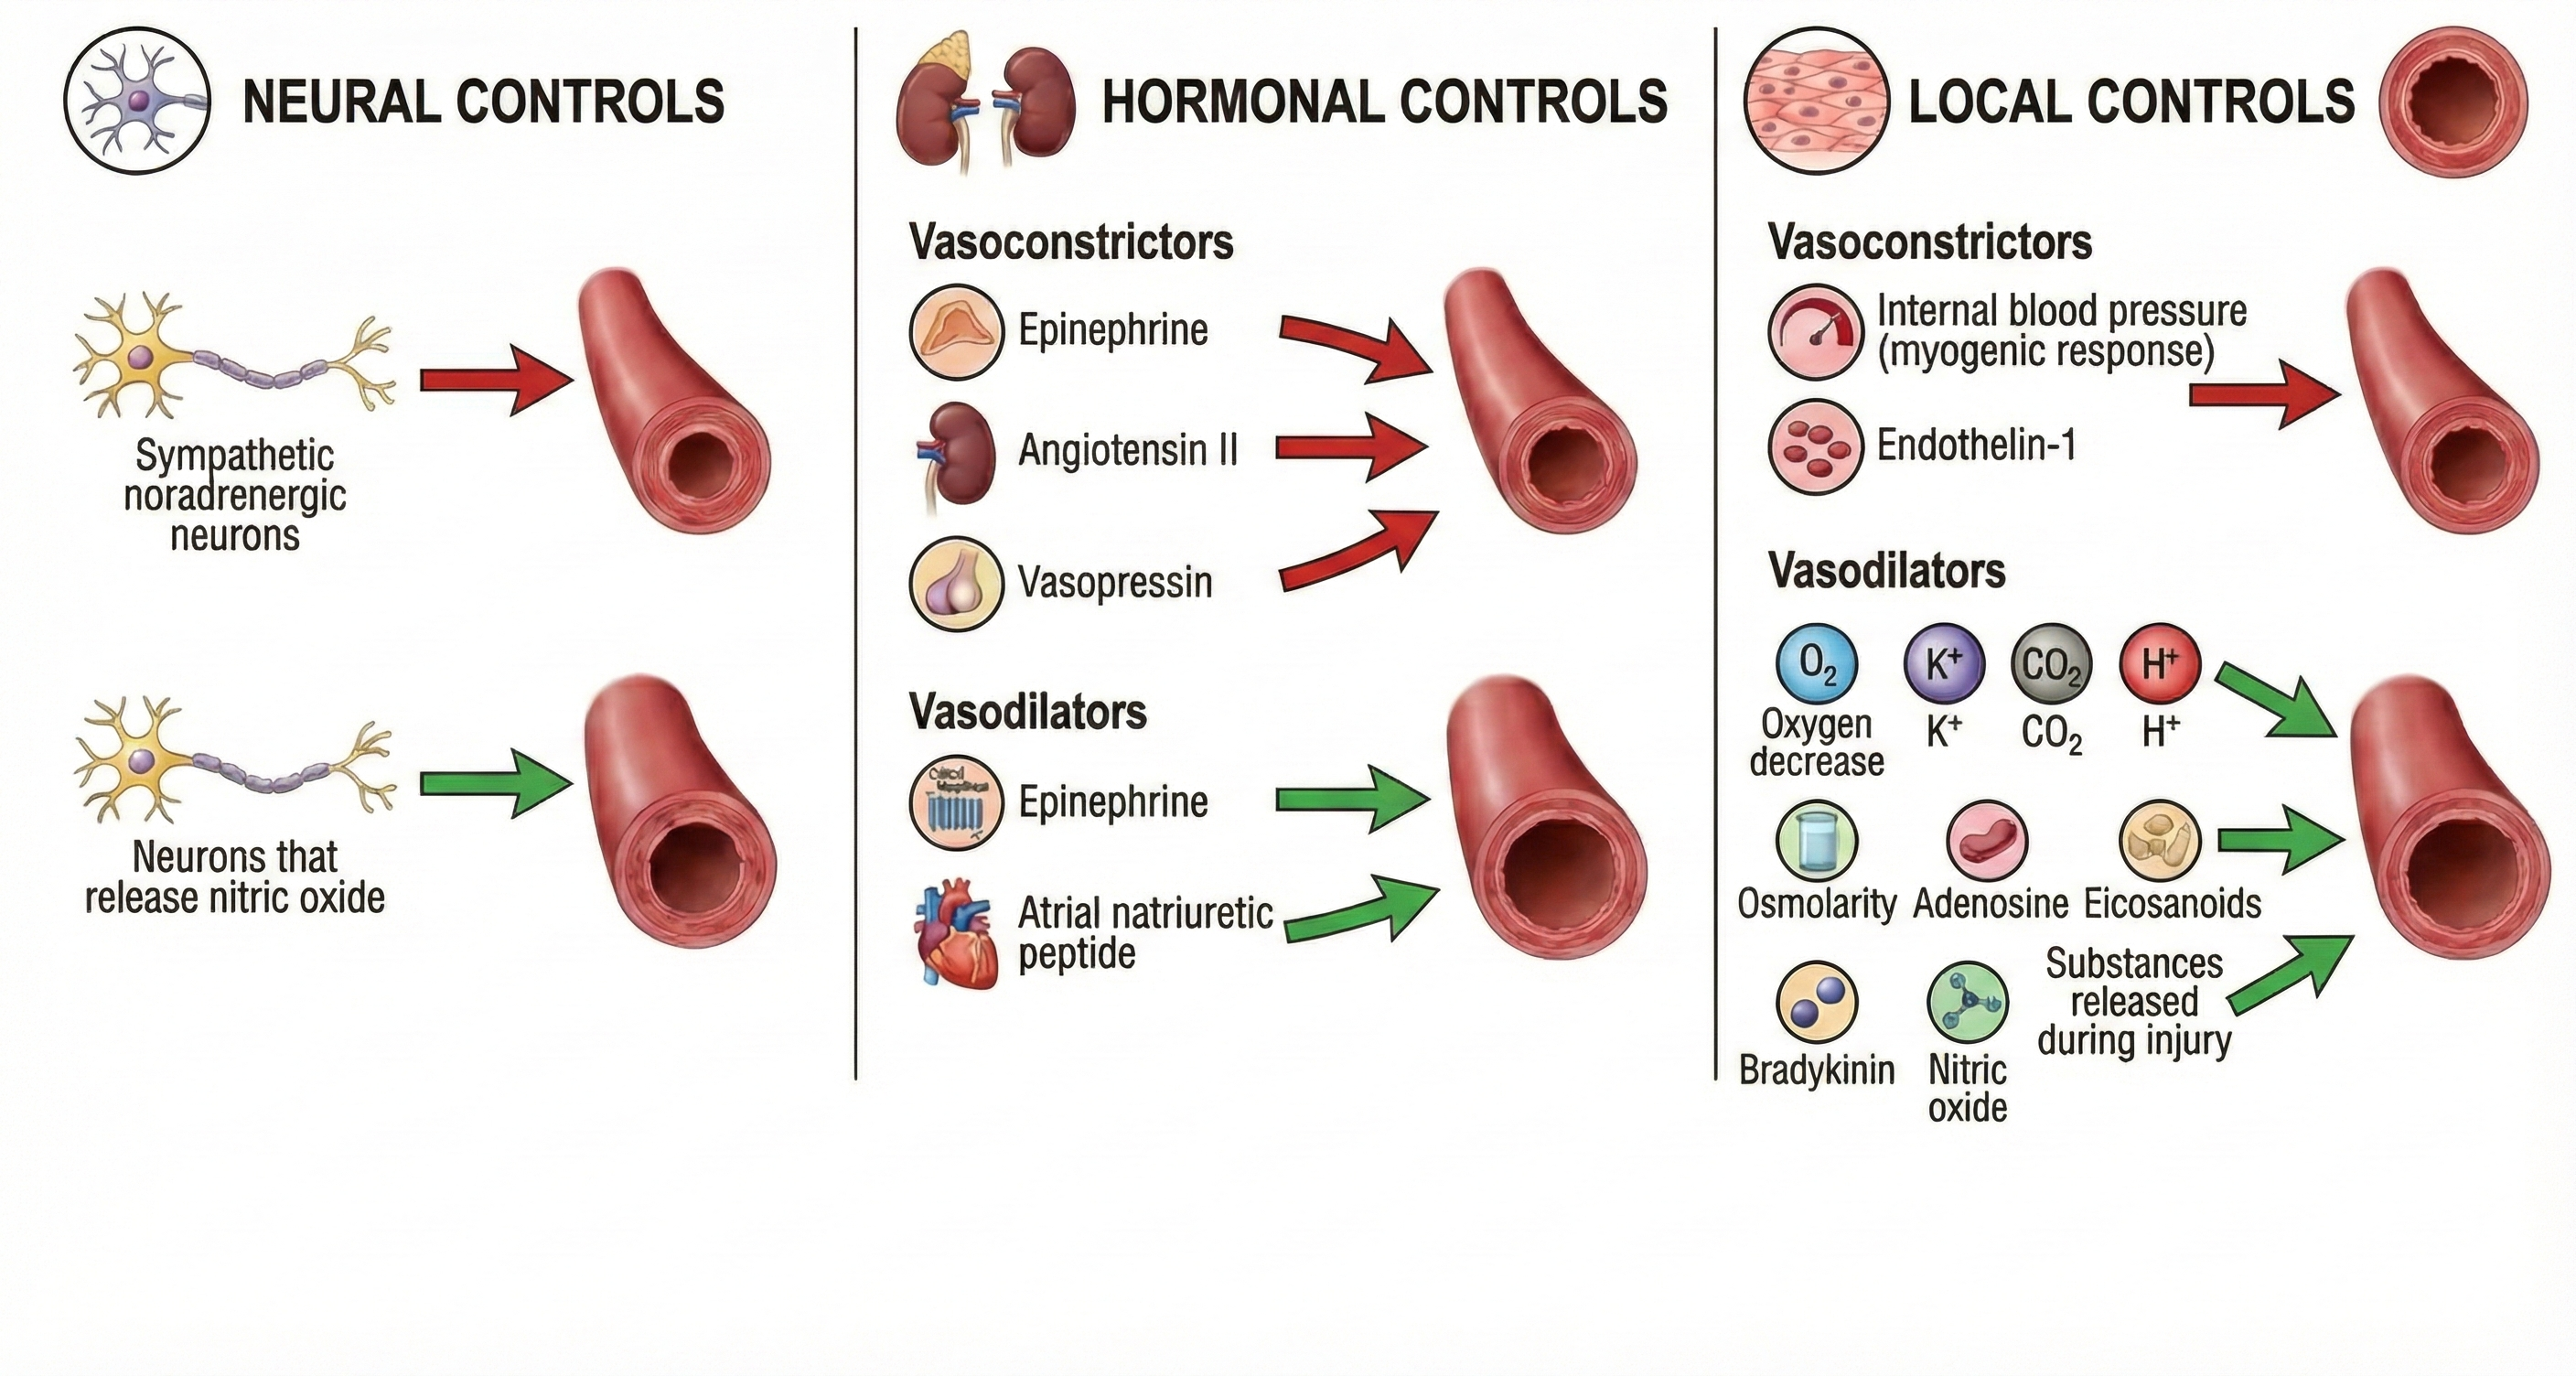
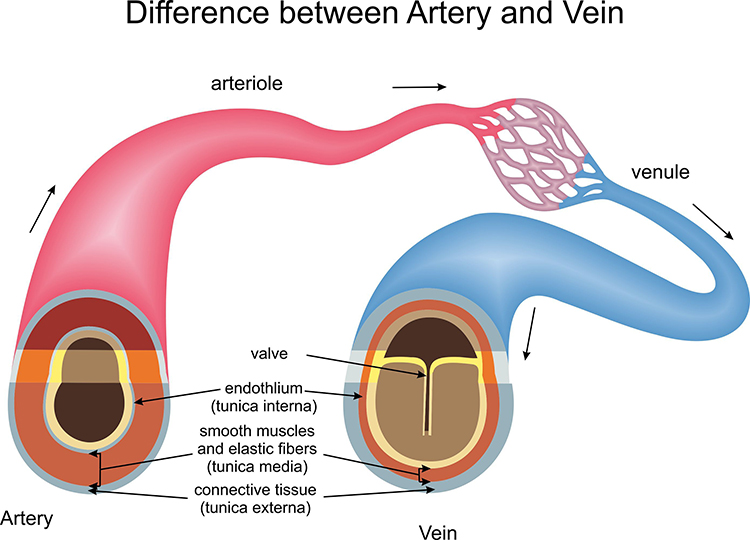
The Three Layers of Blood Vessels
Generalized blood vessels have three layers or tunics surrounding a hollow lumen or center. Understanding these layers is essential for grasping how hand-warming and hand-cooling work.
The tunica interna (innermost layer) directly contacts circulating blood and responds to epinephrine (E) and norepinephrine (NE) with vasodilation (increase in lumen diameter and blood flow) in digits like the fingers.
The tunica media (middle layer) is composed of smooth muscle and elastic fibers controlled by sympathetic constrictor fibers (C-fibers). This is a site of neurally-controlled vasoconstriction (decrease in lumen diameter and blood flow) in the digits. However, reduced sympathetic firing, exposure to nitric oxide, H+, lactic acid, or blood pressure changes relax the smooth muscle layer (Tortora & Derrickson, 2021).
Finally, the tunica externa or external layer is composed of a connective tissue sheath. It supplies vessel walls with nerves and self-vessels and connects vessels to tissues.
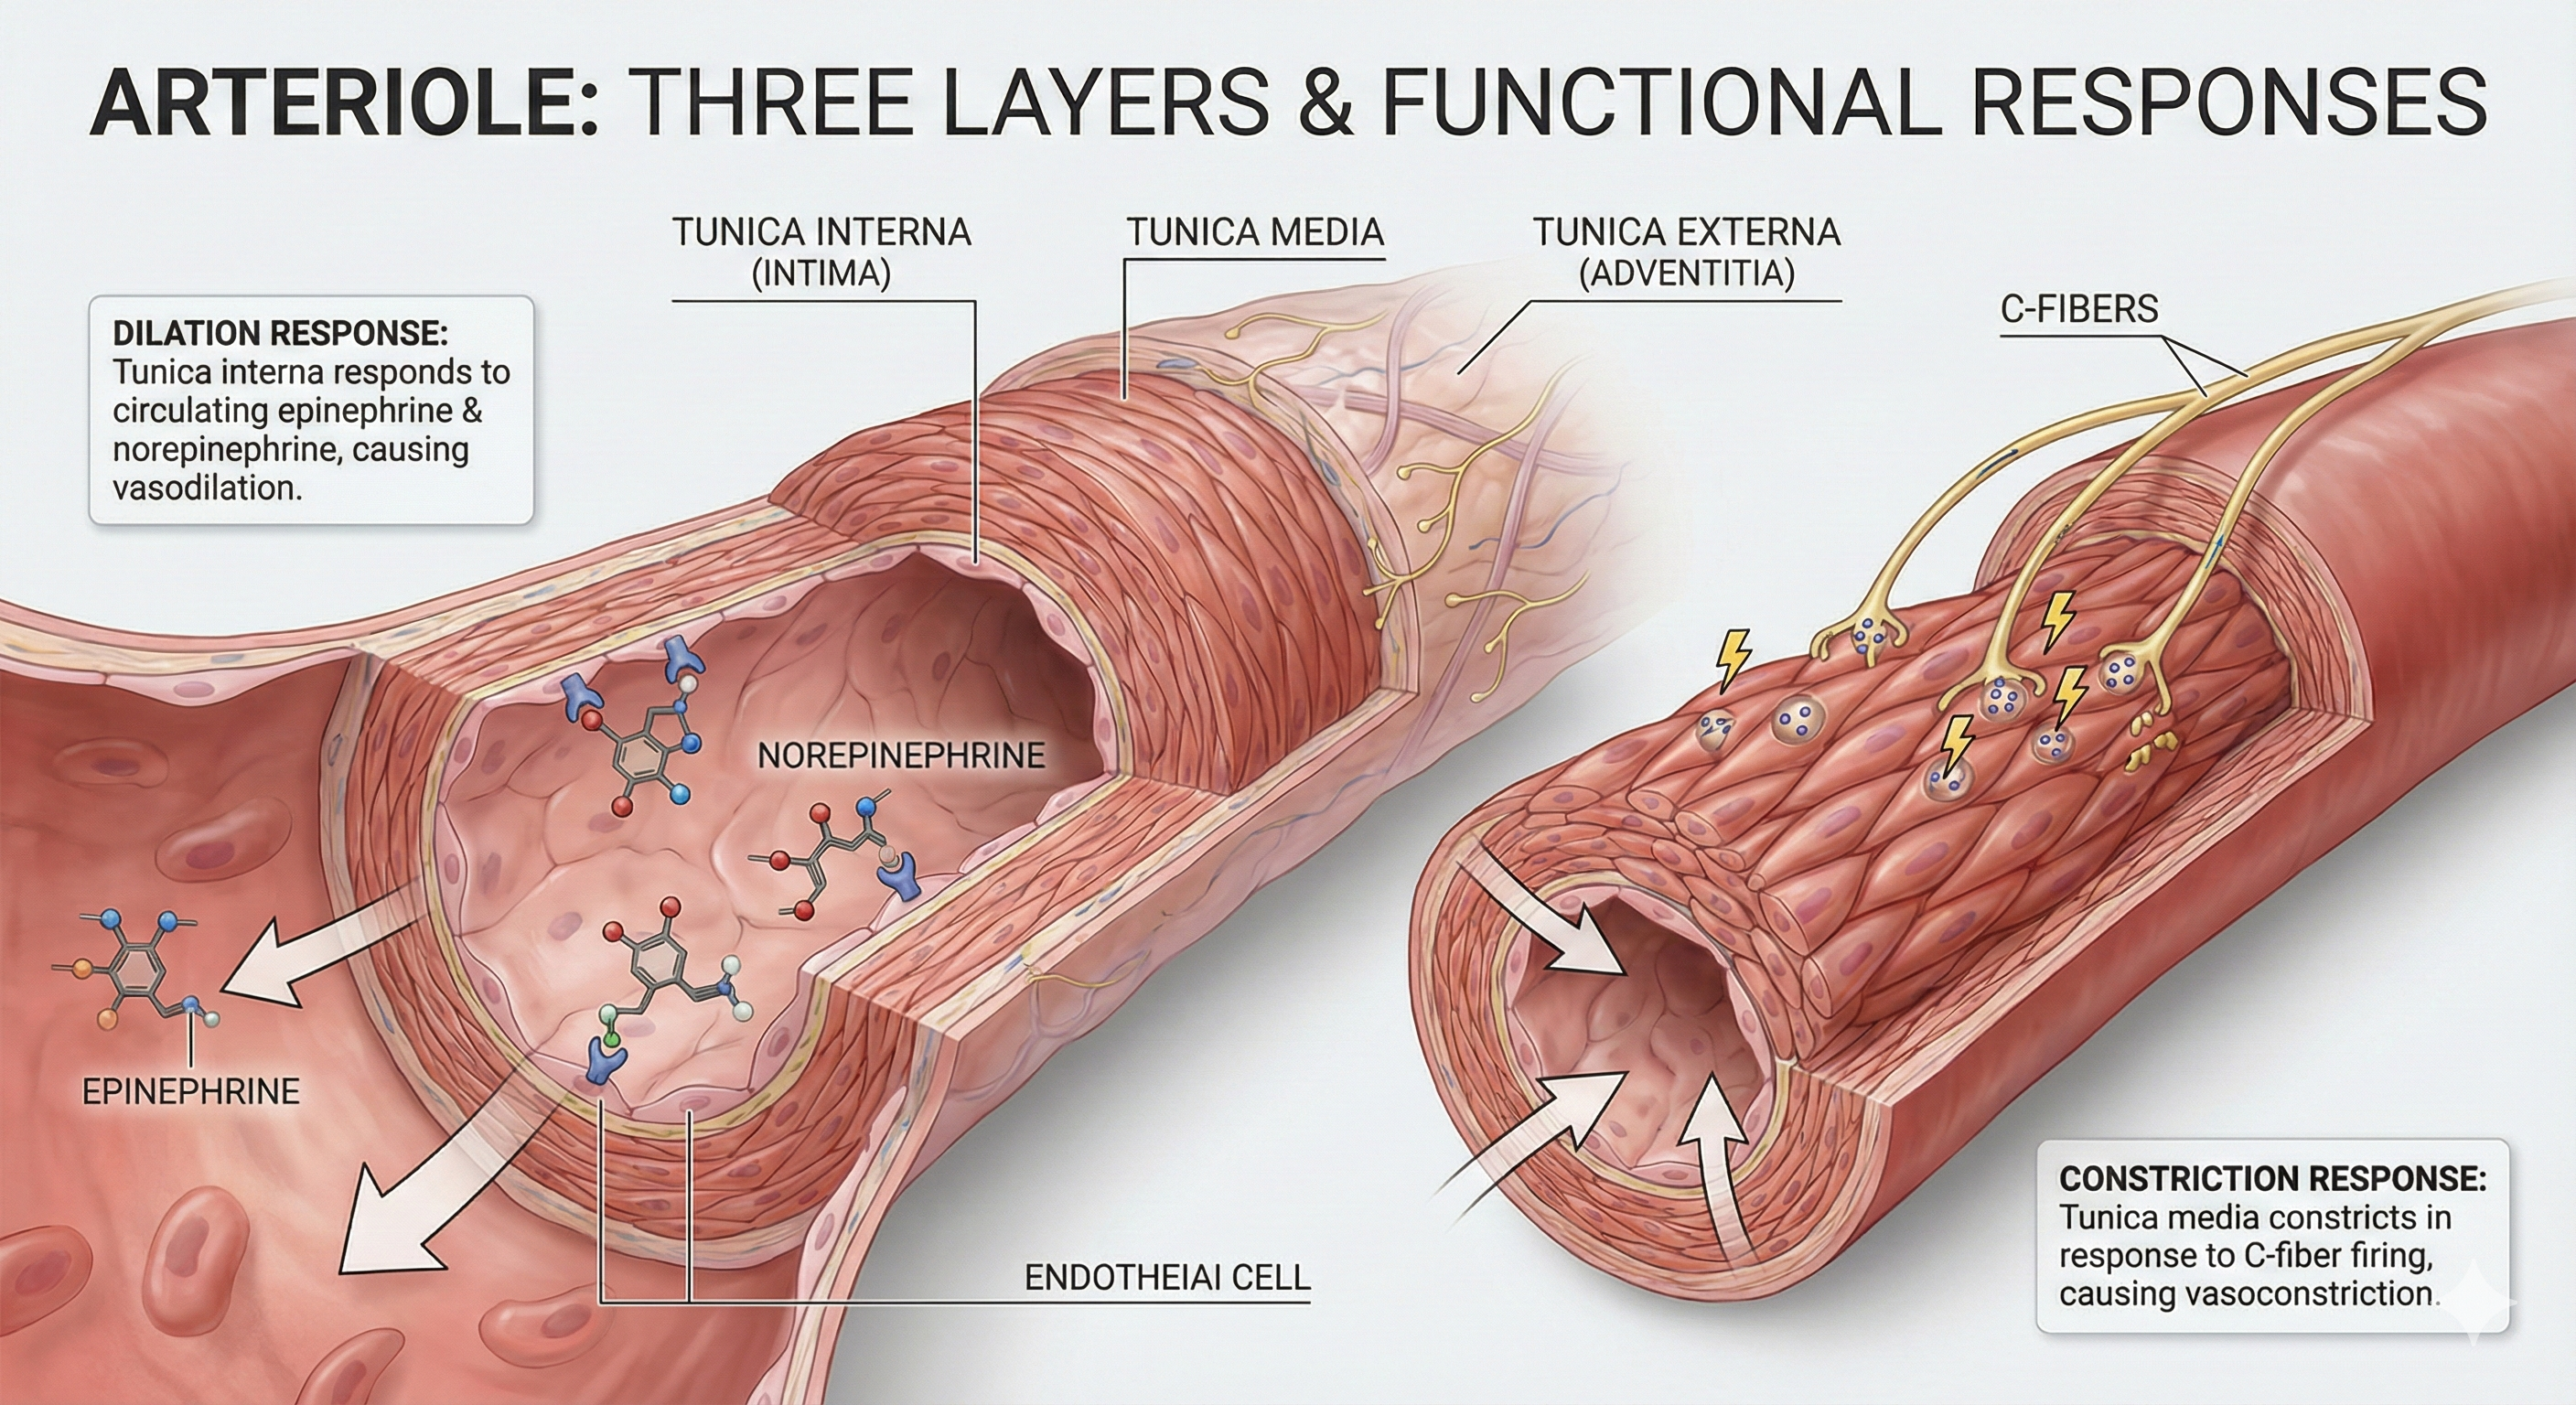
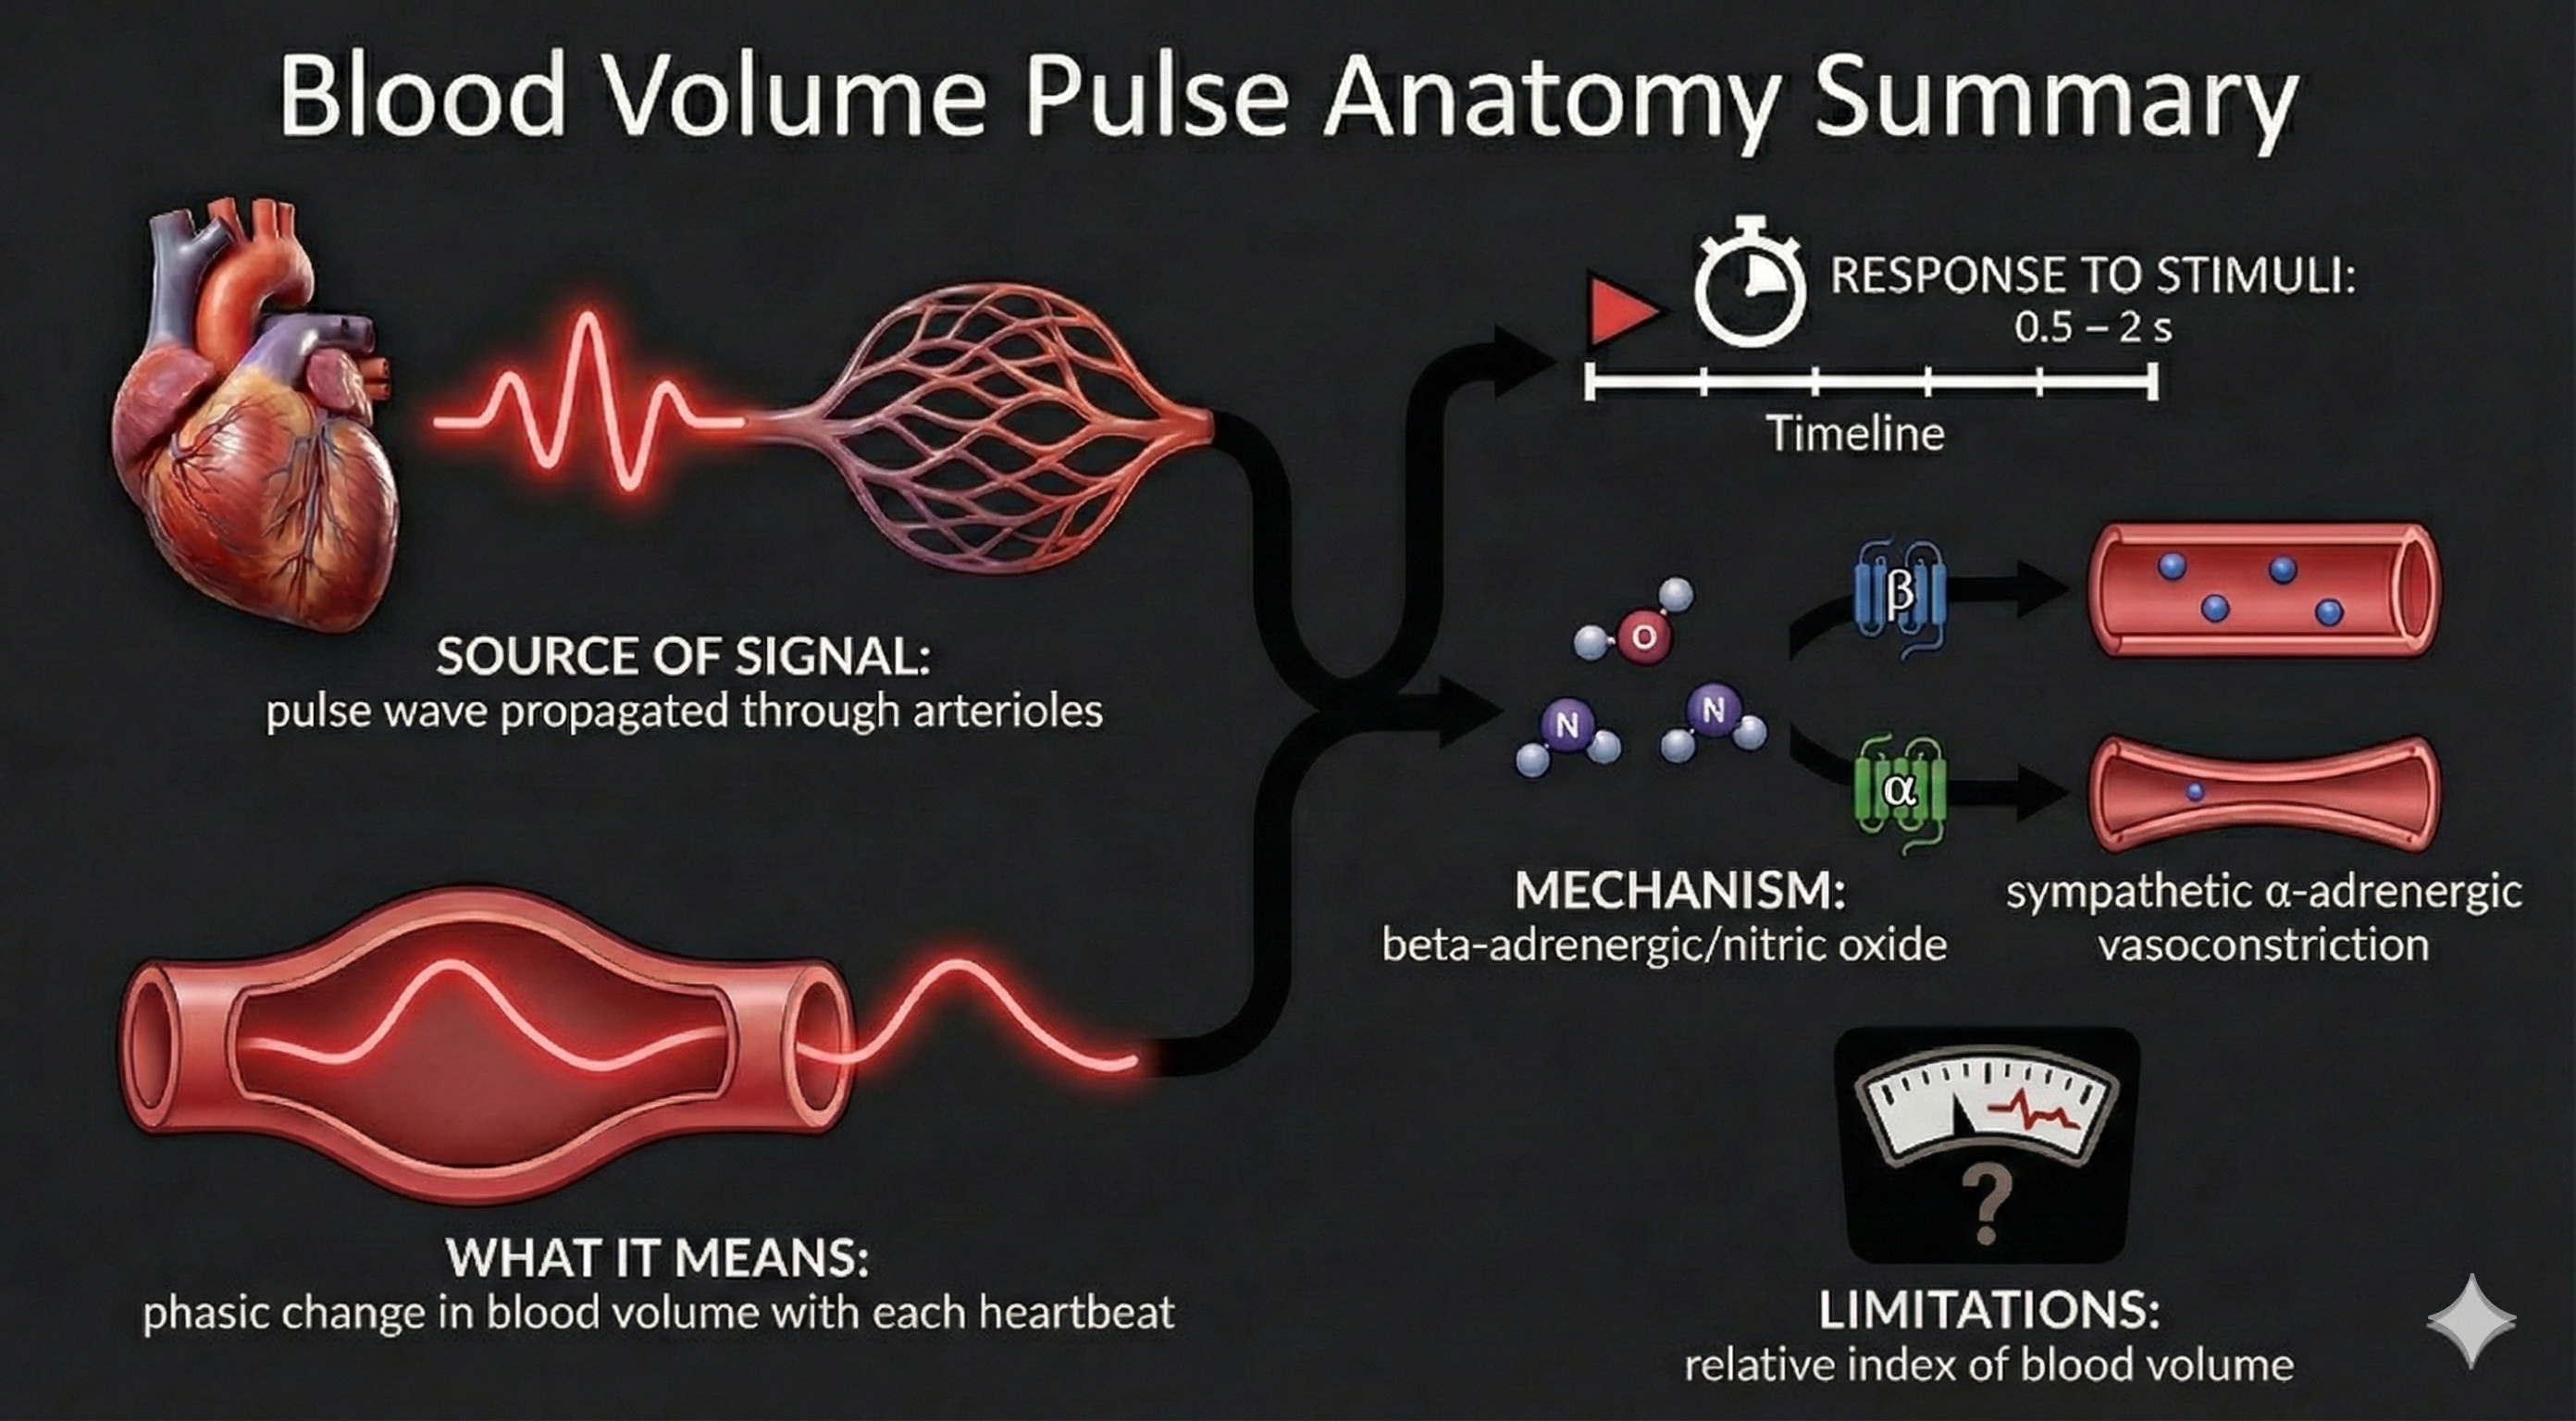
Here is a key insight for biofeedback clinicians: separate mechanisms produce hand-warming and hand-cooling. Hand-warming involves releasing a beta-adrenergic hormone and nitric oxide at the tunica interna. Hand-cooling is mediated by vasoconstrictor hormones and the firing of sympathetic C-fibers at the tunica media.
Human studies have demonstrated that hand warming involves the release of beta-adrenergic hormones and nitric oxide (NO). Beta-adrenergic receptors, particularly the β3 subtype, are present in the cardiovascular system and are activated by catecholamines at high concentrations.
Activation of β3-adrenergic receptors leads to the production of NO via endothelial NO synthase (eNOS), resulting in vasodilation and increased blood flow (Moens et al., 2010). Epinephrine is likely the more significant catecholamine for β3 receptor activation, as it induces vasodilation through direct receptor activation and NO-mediated pathways (Arch, 2002; Gauthier, Langin, & Balligand, 1996).
Three Measures of Peripheral Blood Flow
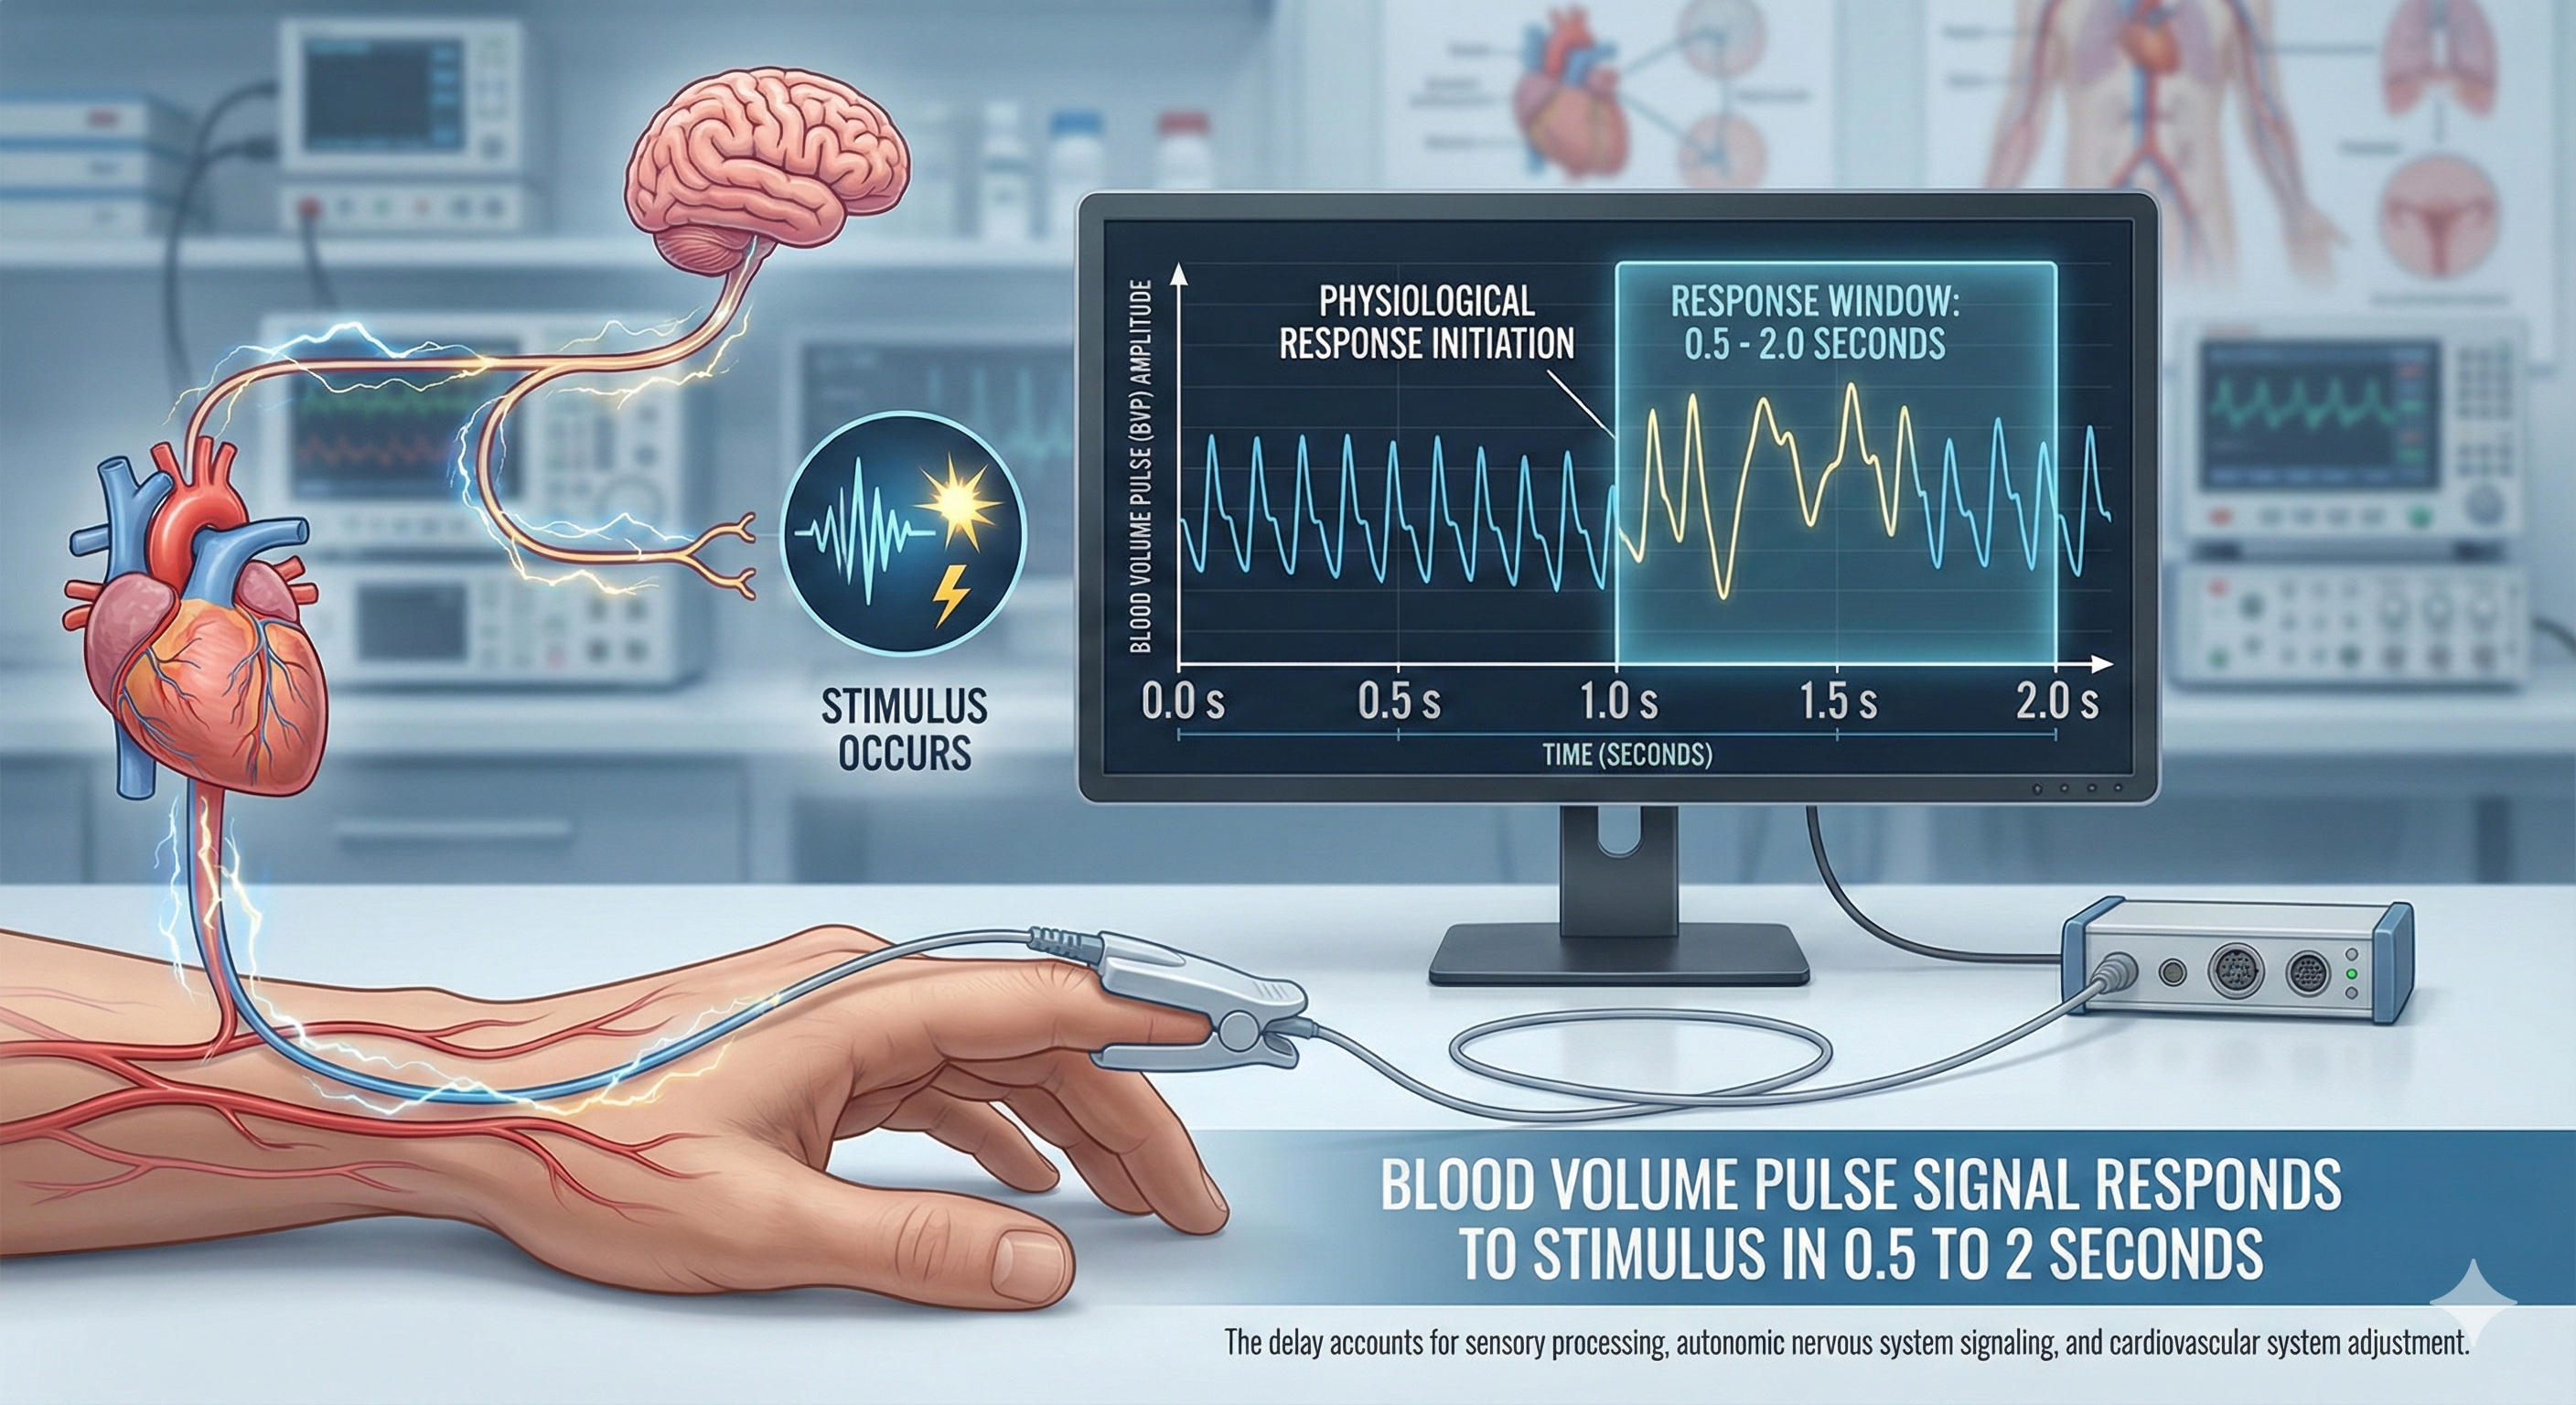
Temperature, blood volume pulse, and pulse wave velocity all depend on blood movement through arteries. Temperature and blood volume pulse provide relative measures of peripheral blood flow. Here is an important distinction to remember: temperature responds to stimuli in 20-30 seconds, while blood volume pulse reacts in a blazingly fast 0.5-2 seconds.
Temperature: The Slow but Steady Indicator
Skin temperature indirectly indexes peripheral blood flow, which is primarily regulated by cutaneous arterioles (Peek, 2016).
🎧 Listen to a mini-lecture on Hand Temperature 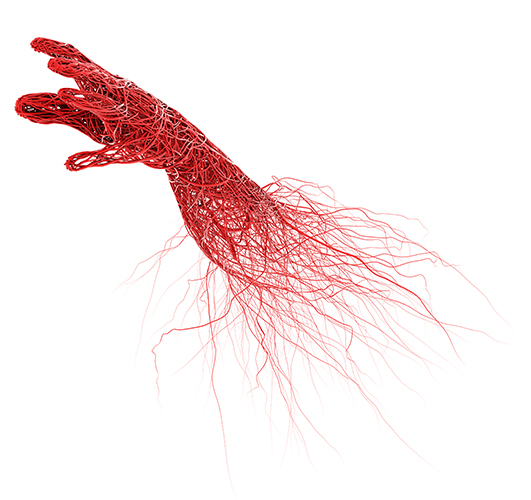
Temperature is a gradual tonic index of blood flow. Following a stressor, it may take temperature 20-30 seconds to fall since arterioles must constrict, tissue perfusion with blood must drop, and a sensor called a thermistor must register this change.
🎧 Listen to a mini-lecture on Hand-Cooling"Temperature is the modality most vulnerable to effort" (Khazan, 2019, p. 90). Since blood volume pulse and temperature monitor the same underlying physiology, "trying" can also produce large-scale disruptions in this modality.
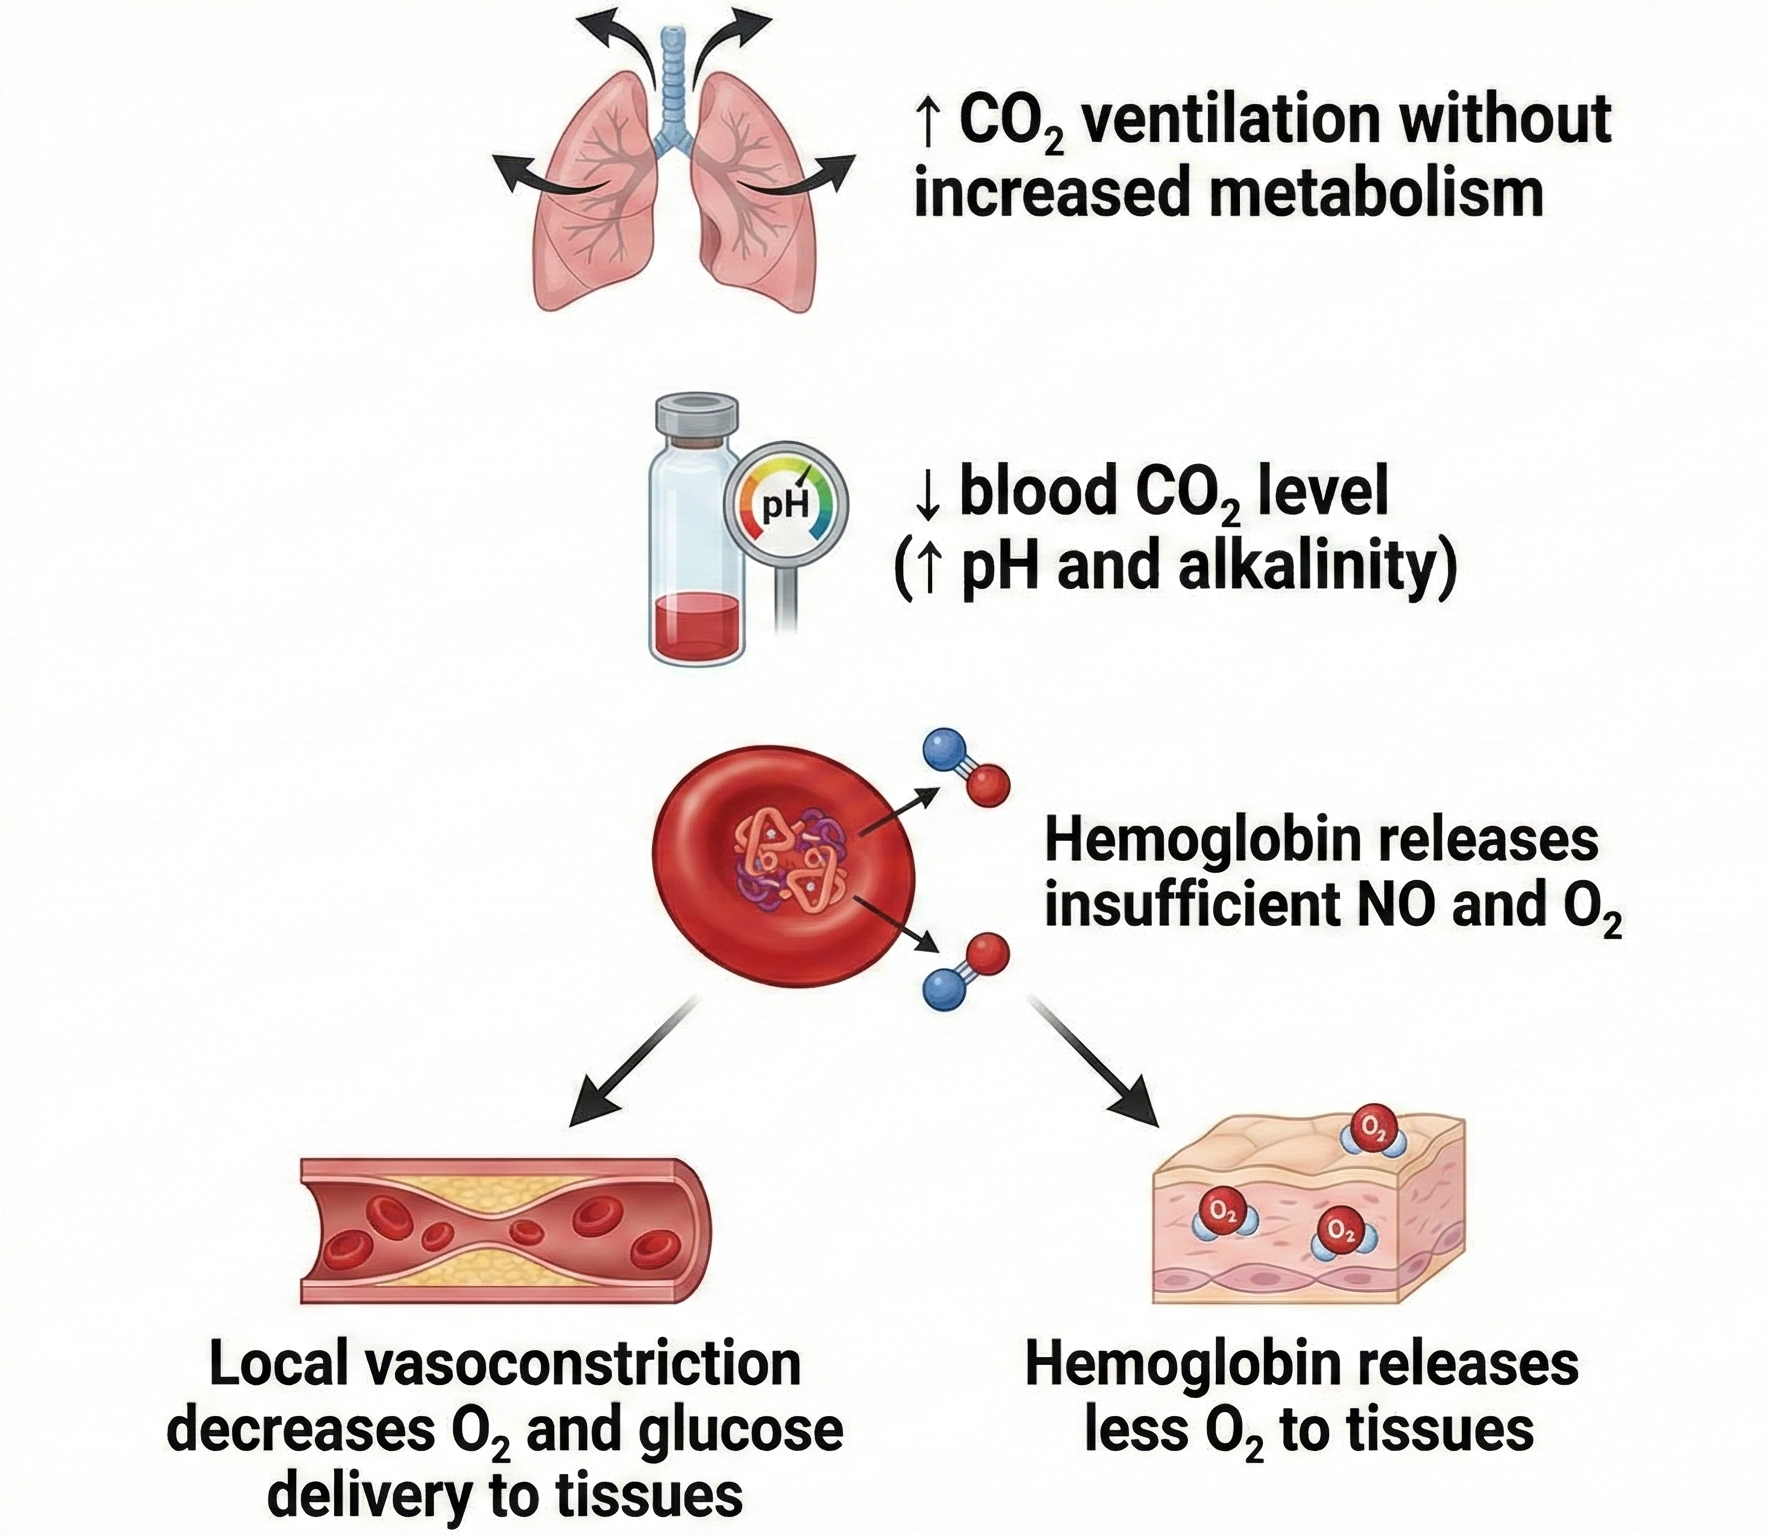
What can trigger hand-cooling? Exposure to cold temperatures, overbreathing, trying too hard, stressors, and worrying can all do it. CO2 loss reduces nitric oxide release, which is needed to relax arteriole walls.
Blood Volume Pulse: The Fast Responder
Blood volume pulse (BVP) is the phasic (momentary) change in blood volume with each heartbeat. It is the vertical distance between the maximum value (peak) and the minimum value (trough) of a pulse wave and is measured by the photoplethysmograph (PPG).
🎧 Listen to a mini-lecture on Blood Volume PulseBVP responds to a stressor in 0.5-2 seconds. Why is BVP so much faster than temperature? Because it shines an infrared light on the skin surface instead of relying on a sluggish temperature sensor.
The large-scale BVP changes in hands that are not cold can help clients when hand-warming stalls since BVP provides higher-resolution feedback.
The shape of the BVP waveform can indicate loss of arterial elasticity, and decreased pulse transit time is associated with aging, arteriosclerosis, and hypertension (Izzo & Shykoff, 2001). Peper, Harvey, Lin, Tylova, and Moss (2007) compared BVP waveforms and BP values for two parents and their teenage daughter in the recordings below.
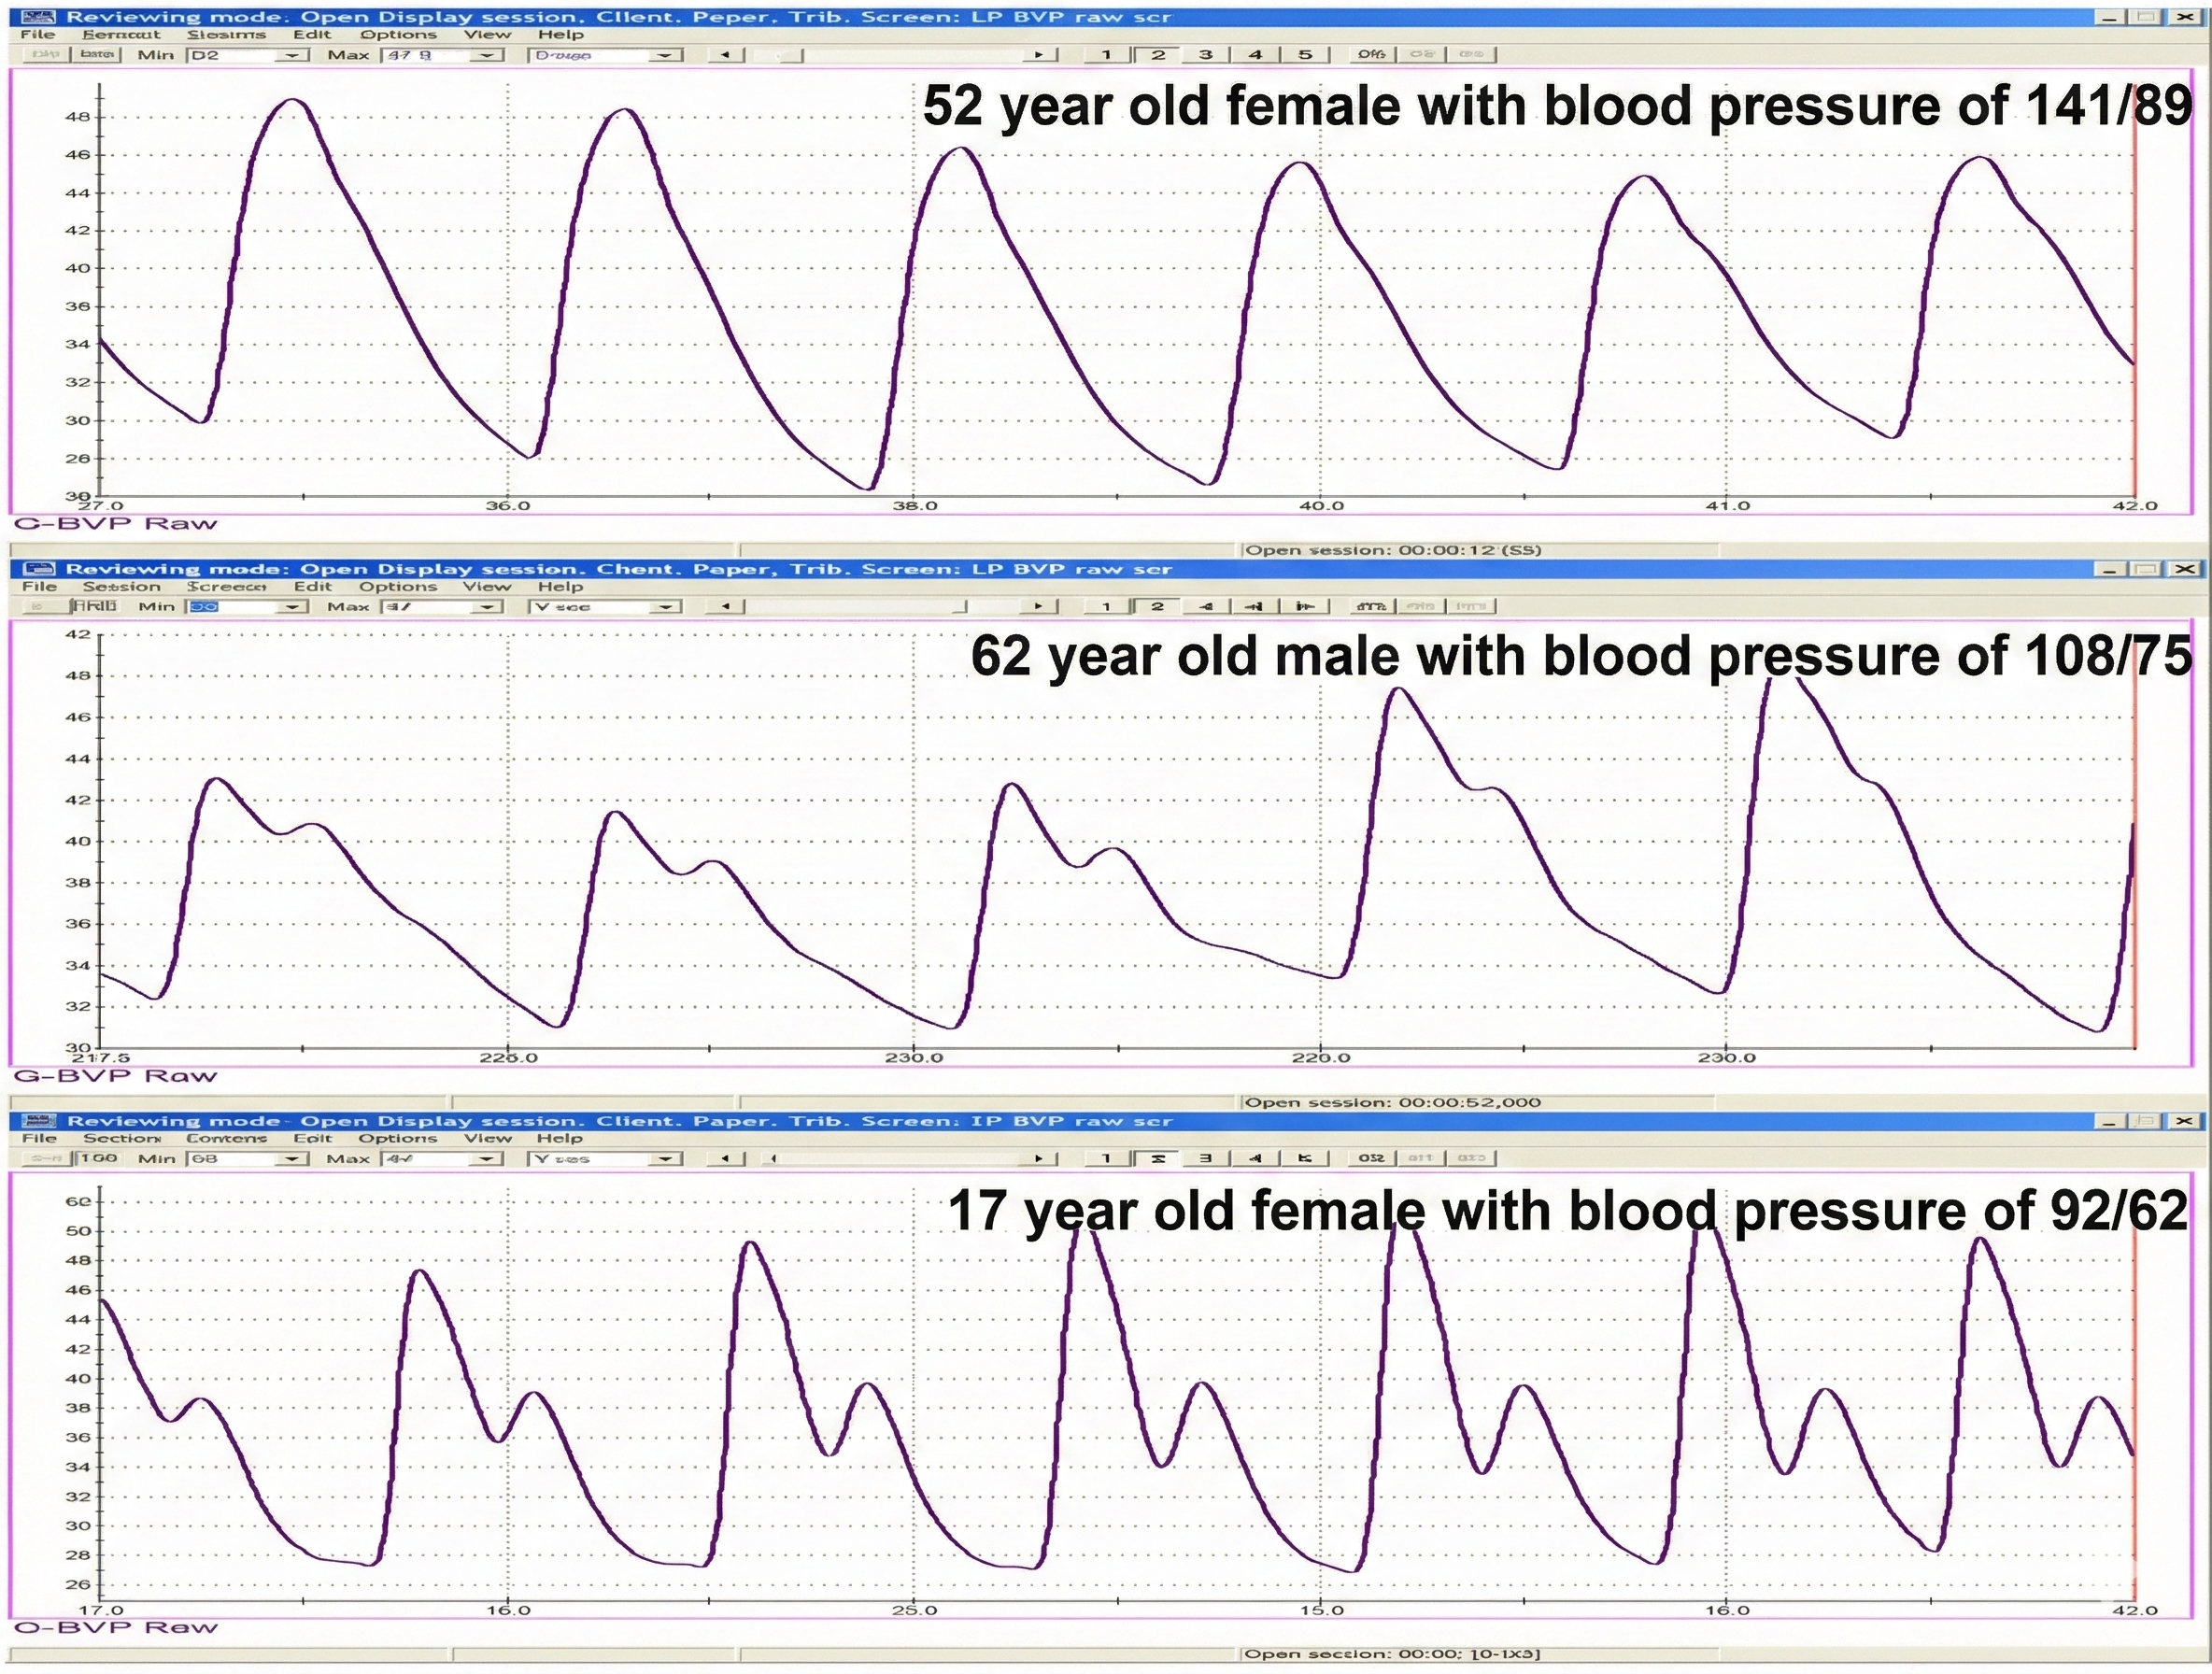
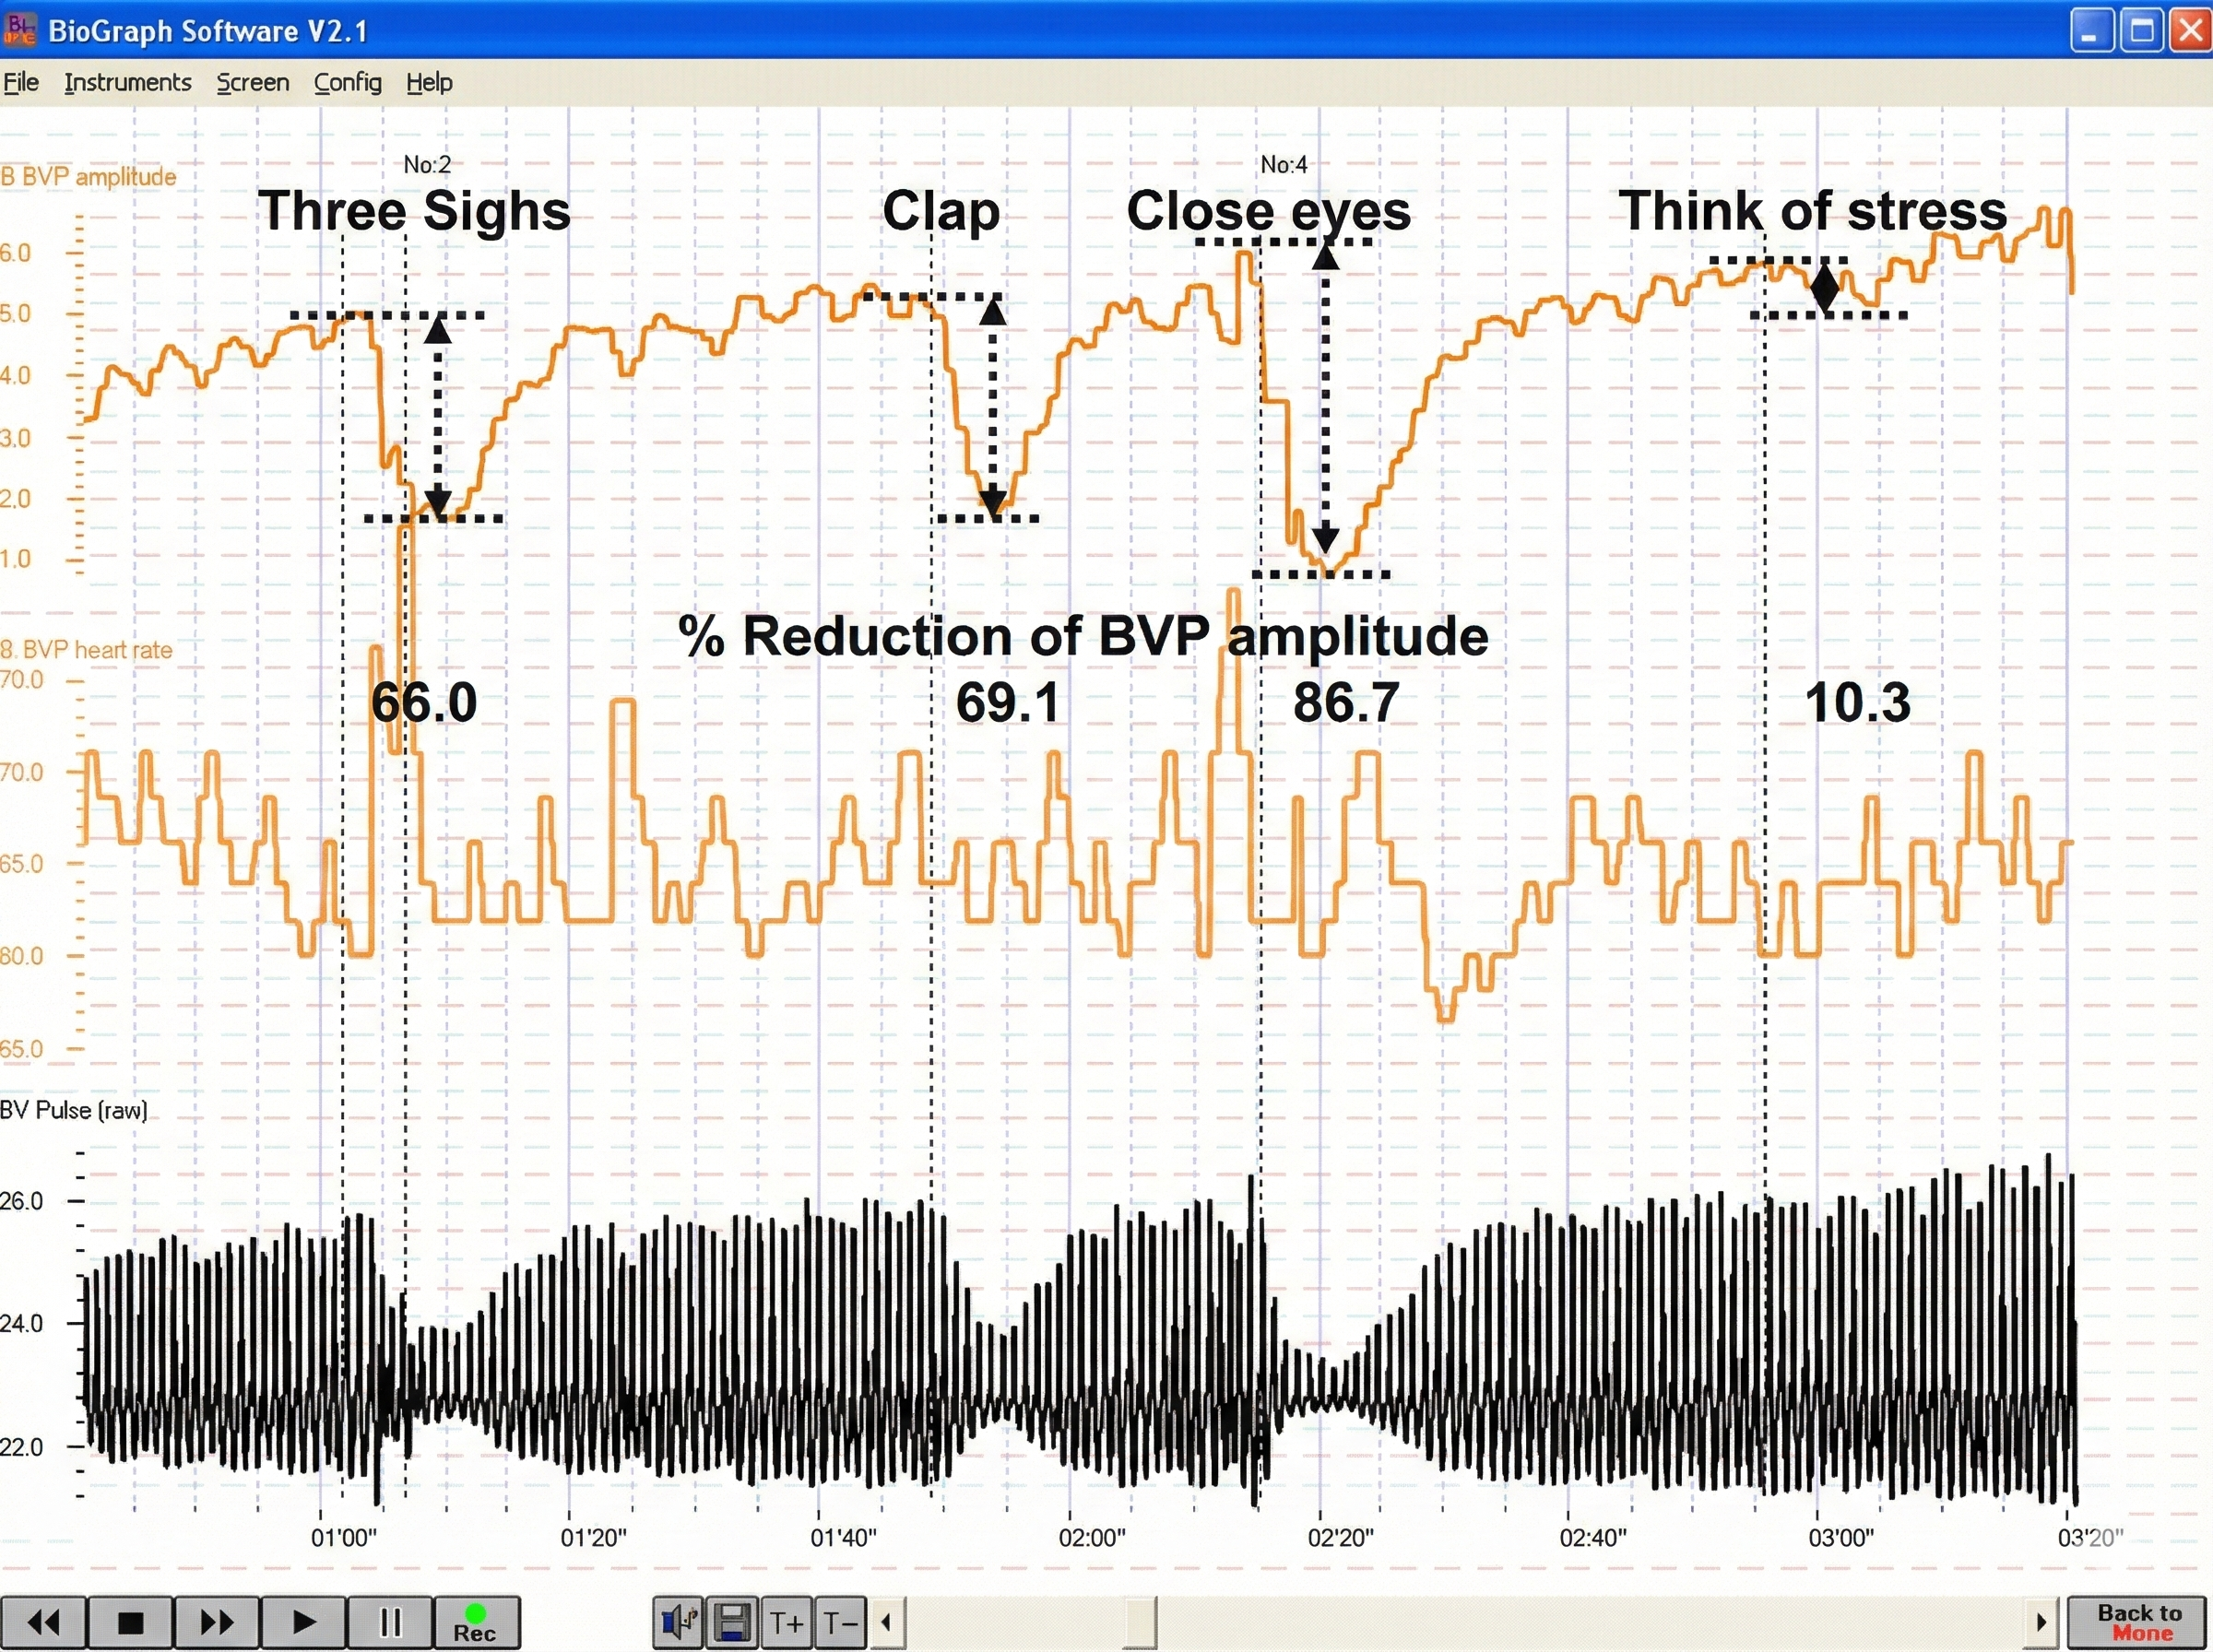
BVP amplitude can provide valuable information about a client's cognitive and emotional responses, as shown in the recording below from Peper, Harvey, Lin, Tylova, and Moss (2007).
Below is a BioGraph® Infiniti blood volume pulse (BVP) display. Note the small dicrotic notch following the peak of each waveform. The reduction or disappearance of a dicrotic notch may indicate the loss of arterial flexibility seen in arteriosclerosis.
When a client is successful in hand-warming, temperature has two advantages over BVP: it is measured in absolute units and gradually changes.
BioGraph® Infiniti blood volume pulse and temperature display © BioSource Software LLC.
Pulse Wave Velocity: The Indirect Blood Pressure Measure
The ejection of blood from the left ventricle during systole produces a pulse wave. Pulse wave velocity (PWV) is the rate of pulse wave movement through the arteries. Practitioners measure PWV by placing pressure transducers (motion sensors) at two points of the arterial system (like the brachial and radial arteries of the same arm). The interval required for the pulse wave to move between these points is called transit time (TT). Pulse wave velocity is used as an indirect measure of BP change. During stress tests, researchers have reported correlations with average and systolic (but not diastolic) BP changes.
Arteries carry blood away from the heart through a hierarchical system from large elastic arteries to tiny arterioles. The 400 million arterioles act as gatekeepers, controlling resistance and regulating blood flow to capillaries. Blood vessel walls have three layers: the tunica interna responds to hormones with vasodilation, the tunica media contains smooth muscle controlled by sympathetic nerves, and the tunica externa provides structural support. Hand-warming and hand-cooling operate through different mechanisms at different vessel layers. Temperature responds slowly (20-30 seconds) while BVP reacts quickly (0.5-2 seconds), making them complementary measures for biofeedback training.
Comprehension Questions: Arteries and Peripheral Blood Flow
- Why is hand-warming slower than hand-cooling, and what does this tell you about the mechanisms involved?
- A client's BVP waveform lacks a clear dicrotic notch. What might this indicate about their arterial health?
- Explain why overbreathing can trigger hand-cooling, even when the room temperature is comfortable.
- When would you choose BVP feedback over temperature feedback during a training session?
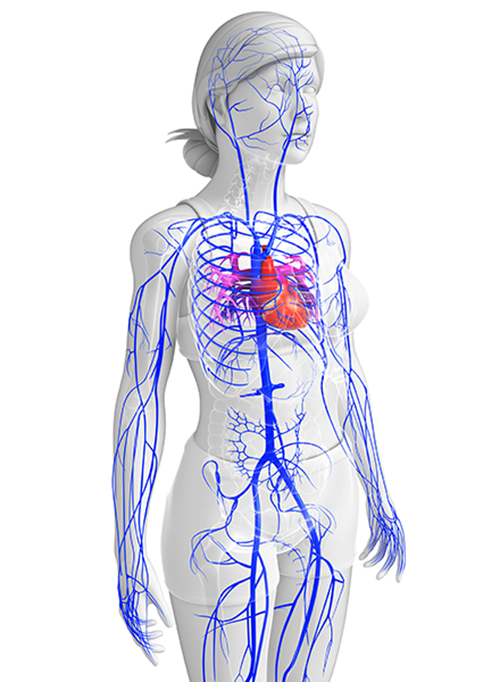
Veins: The Return Journey to Your Heart
Veins are blood vessels that route blood from tissues back to the heart. Veins contain the same three layers found in arteries.
🎧 Listen to a mini-lecture on VeinsThese layers are thinner in veins due to lower pressure.
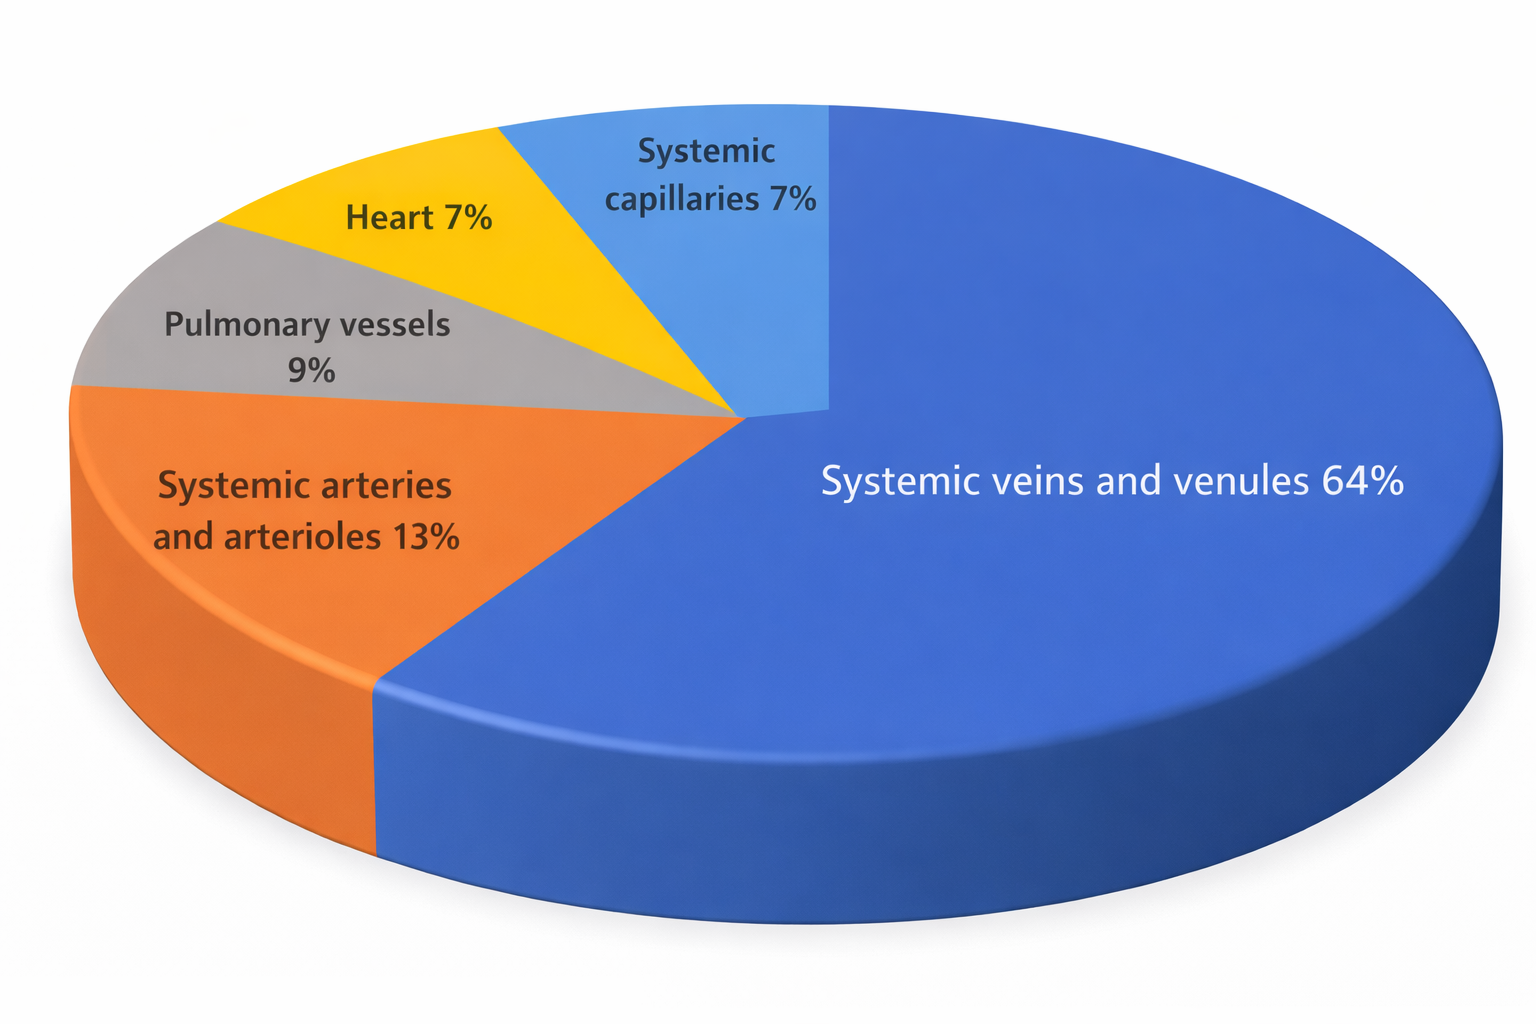
Smooth muscle allows veins to adjust diameter actively. Systemic veins and venules serve as blood reservoirs that store 64% of blood volume at rest.
When we exercise, sympathetic signals to veins constrict them and increase blood flow to skeletal muscles. Venoconstriction helps to compensate for falling blood pressure (Tortora & Derrickson, 2021).
A venule is a small vein (10-200 μm in diameter) that collects blood from capillaries and delivers it to a vein. The low return pressure in these vessels requires valves that prevent backward blood flow. Venules play an essential role in controlling return blood flow to the heart due to narrow diameter, contractility, and extensive surface area. The smallest postcapillary venules (10-50 μm in diameter) exchange nutrients and wastes and allow the departure of white blood cells (Tortora & Derrickson, 2021).
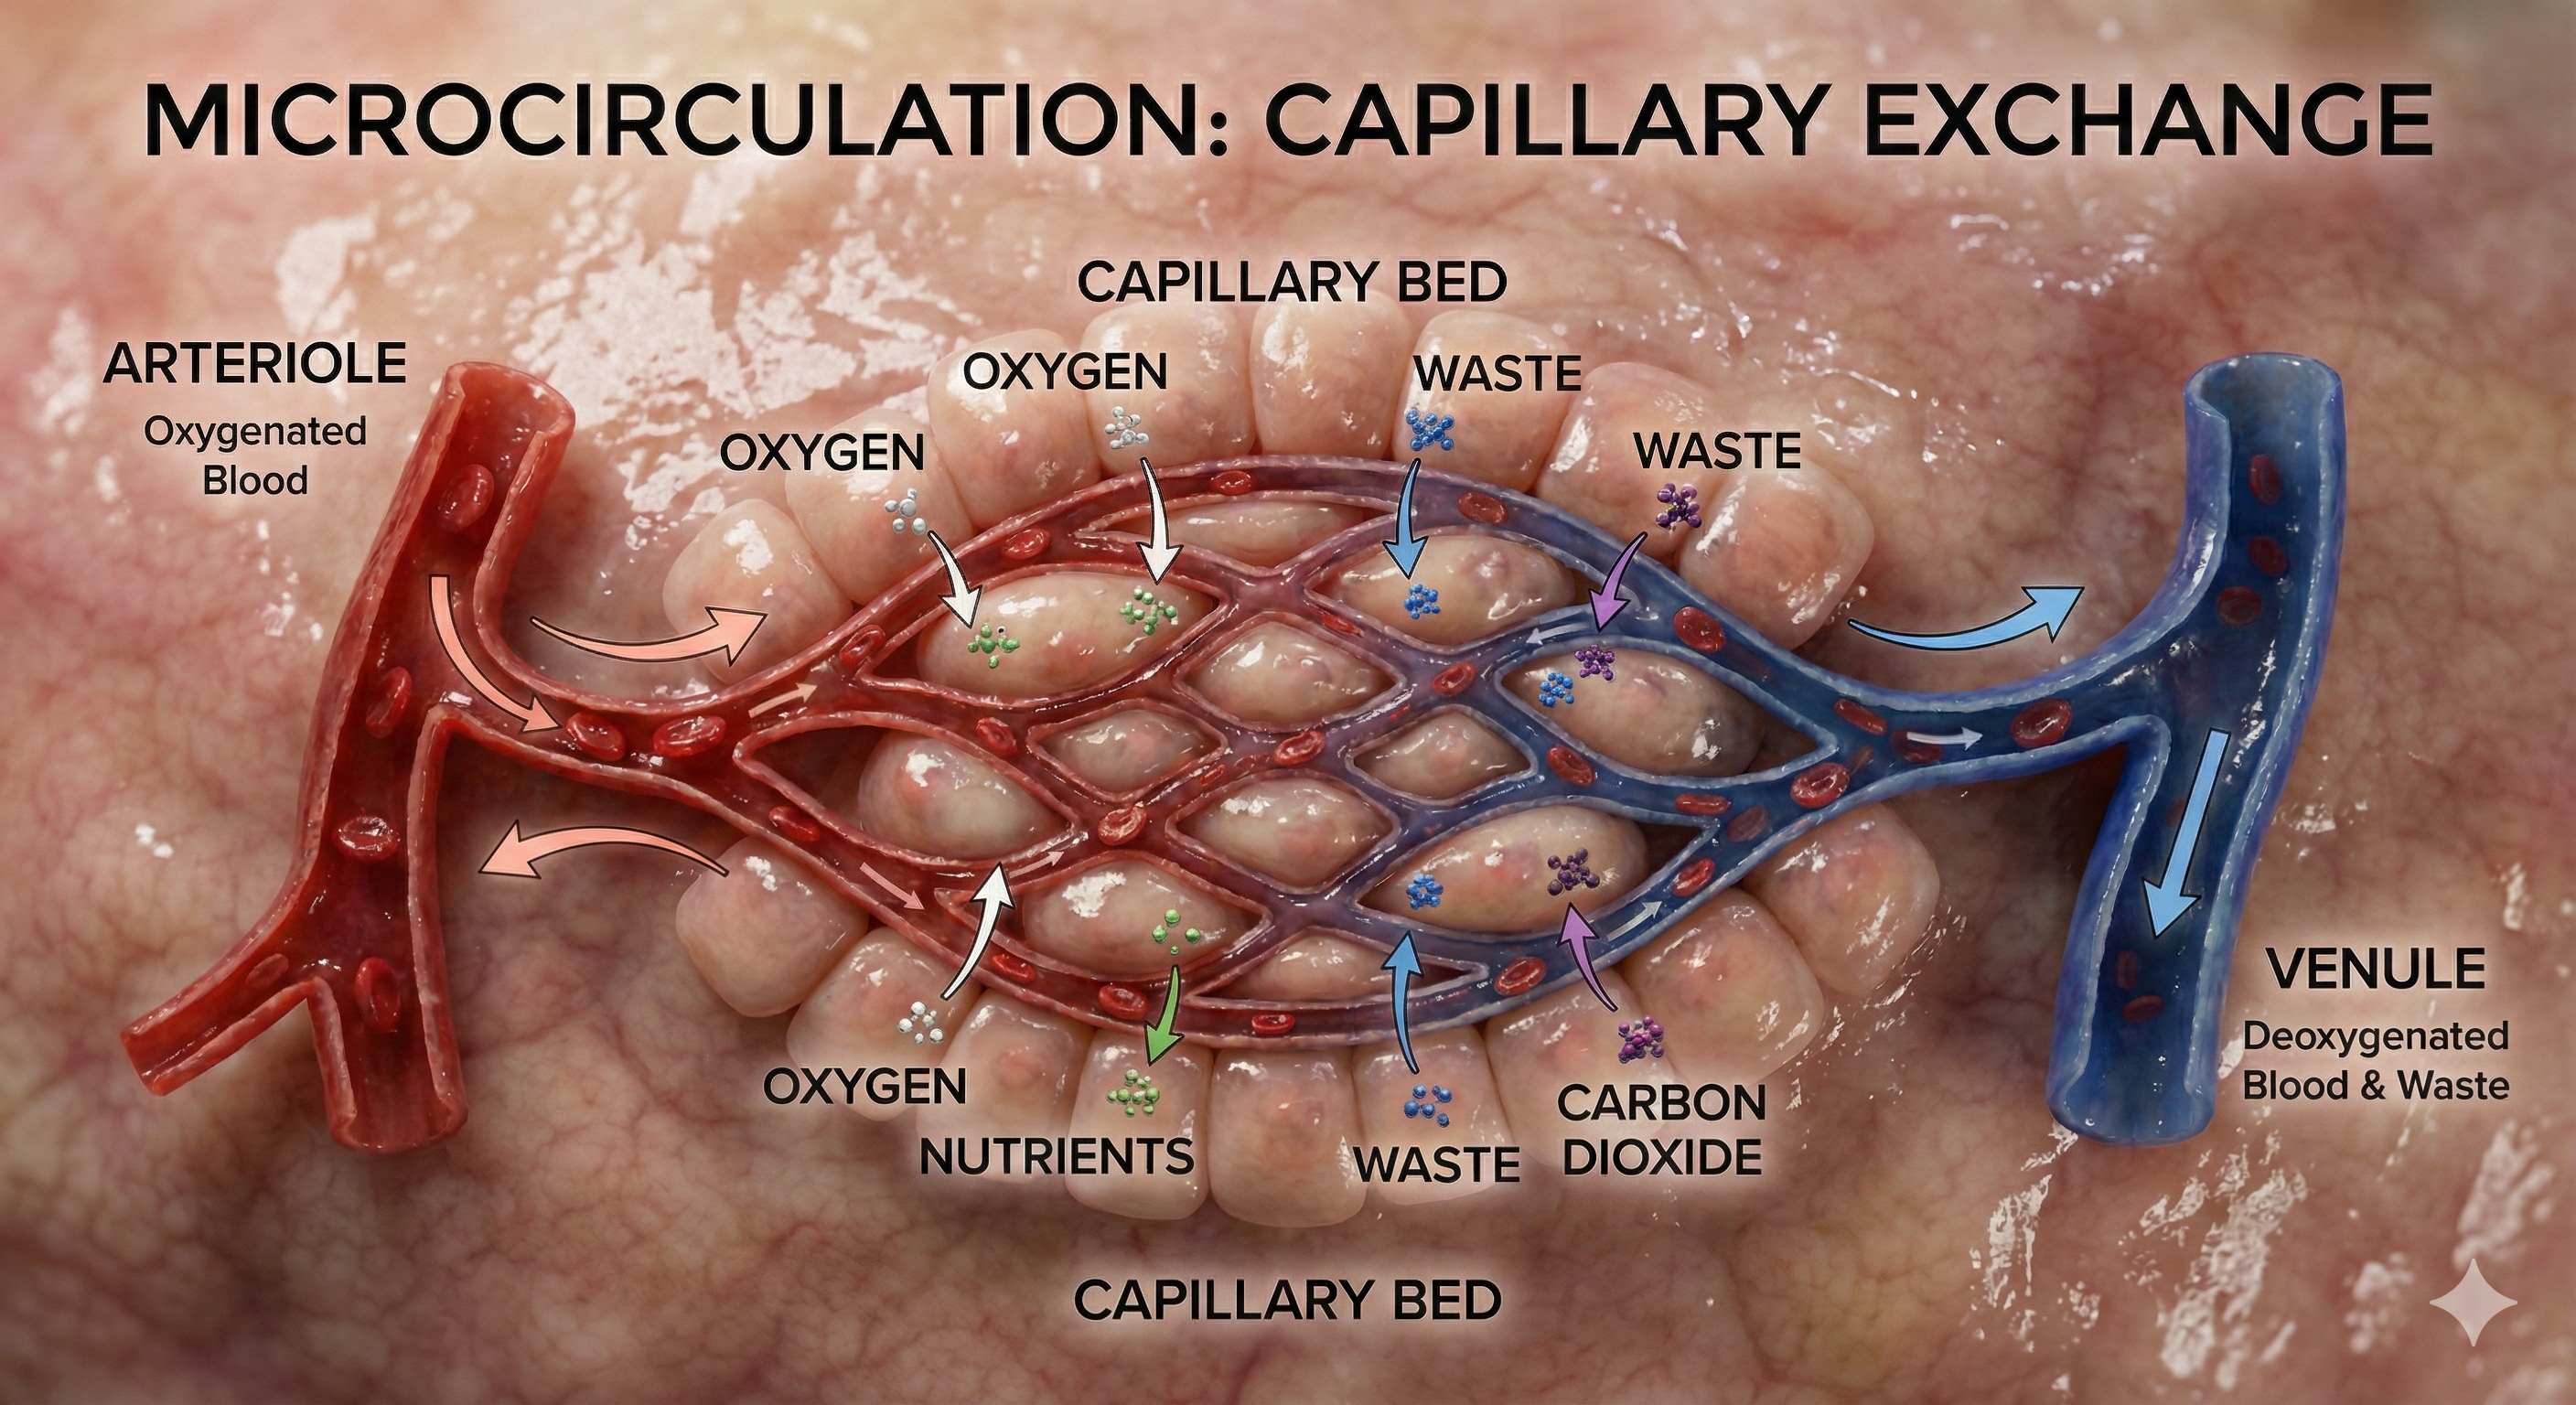
Capillaries: Where the Real Exchange Happens
Capillaries may directly connect arterioles with venules or form extensive networks to rapidly exchange many substances (nutrients and waste products). "The mission of the entire cardiovascular system is to keep blood flowing through capillaries to allow capillary exchange, the movement of substances between blood and interstitial fluid" (Tortora & Derrickson, 2021, p. 781).
🎧 Listen to a mini-lecture on CapillariesCapillaries are the smallest blood vessels (5-10 μm in diameter) and generally consist of a single layer of endothelium and basement membrane. Change in capillary diameter is passive due to the absence of a smooth muscle layer. True capillaries extend from arterioles or metarterioles. A precapillary sphincter functions as a valve that controls blood flow to the tissues at the arterial end of a capillary.
Capillaries exchange nutrients and metabolic end-products between blood vessels and cells. This exchange is aided by 1-micron-thick walls, extensive branching, and massive surface area. Capillary distribution is densest where tissue activity is highest.
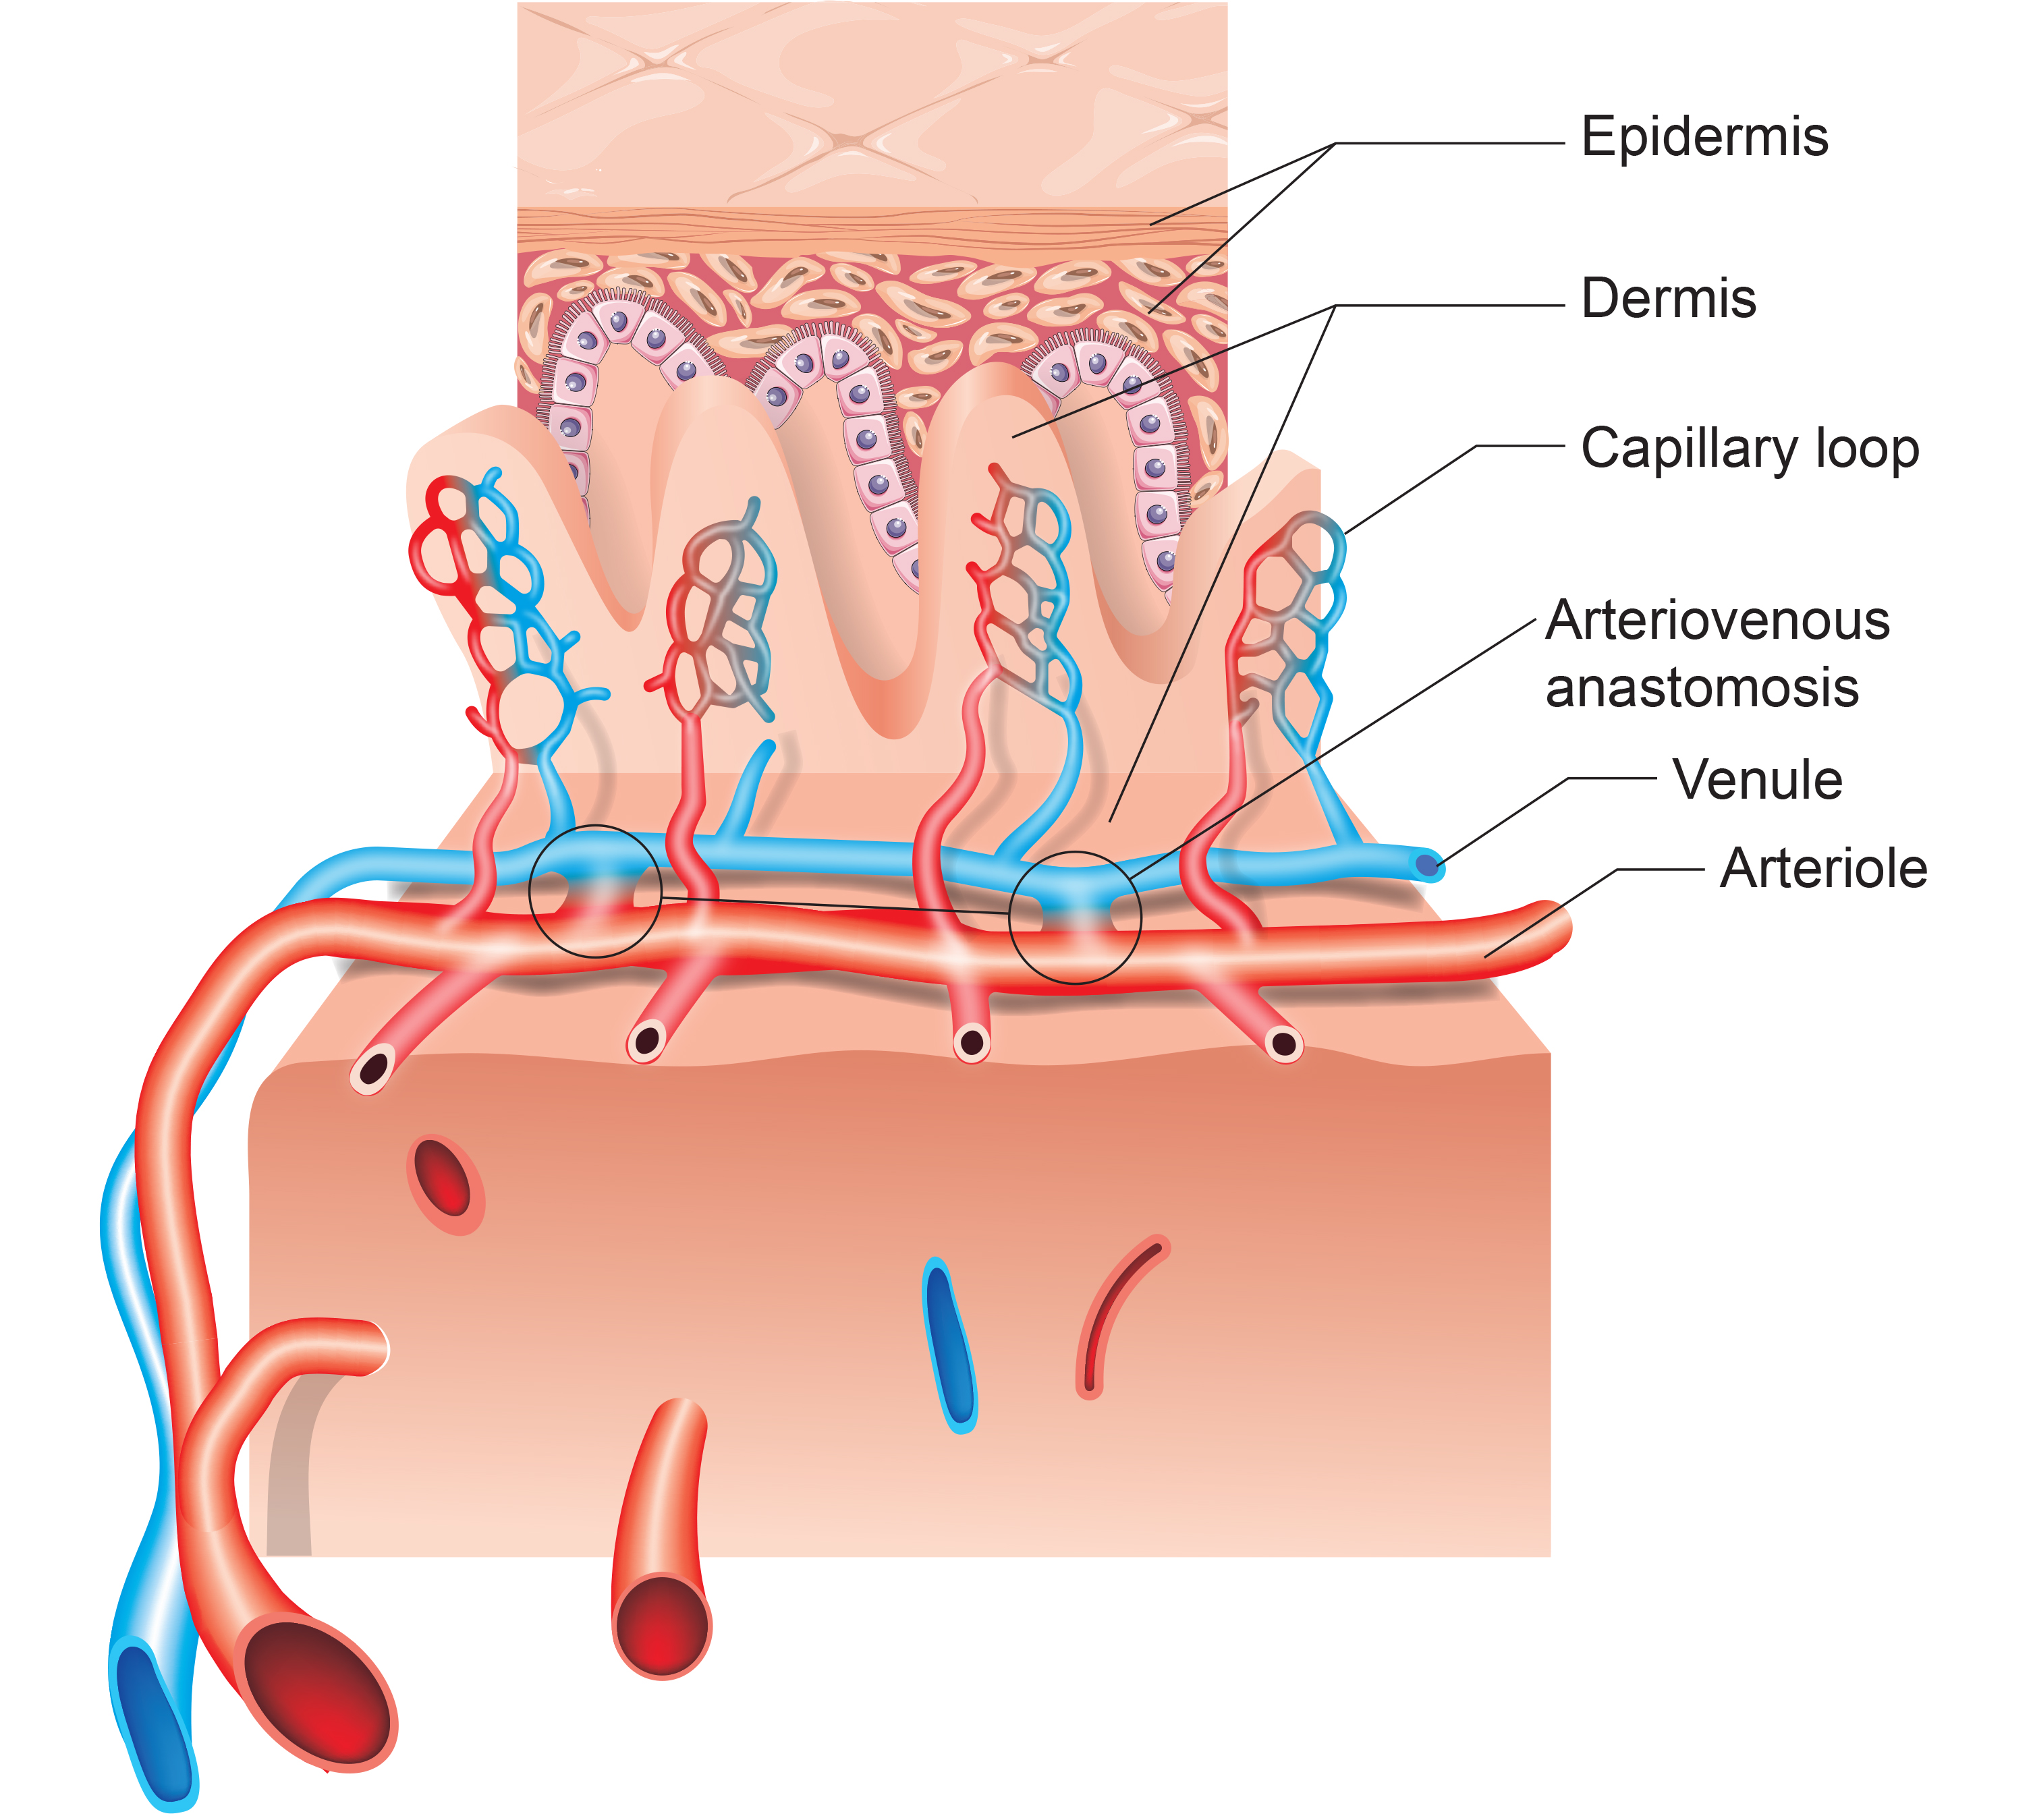
Arteriovenous Anastomoses (AVAs): The Body's Temperature Shortcuts
Arteriovenous anastomoses (AVAs) are junctions of two or more vessels that supply the same region.
🎧 Listen to a mini-lecture on Arteriovenous Anastomoses (AVAs)These vessels contain the three layers seen in both arterioles and venules. Smooth muscle allows anastomoses to adjust diameter actively. AVAs between arteries reroute blood to tissues or organs when ordinary movements compress a vessel or circulation is obstructed by disease, injury, or a surgical procedure. AVAs also form between veins, arterioles, and venules (Tortora & Derrickson, 2021).
AVAs bypass capillaries, directly shunt blood from arterioles to venules, and help regulate temperature (Walløe, 2016).
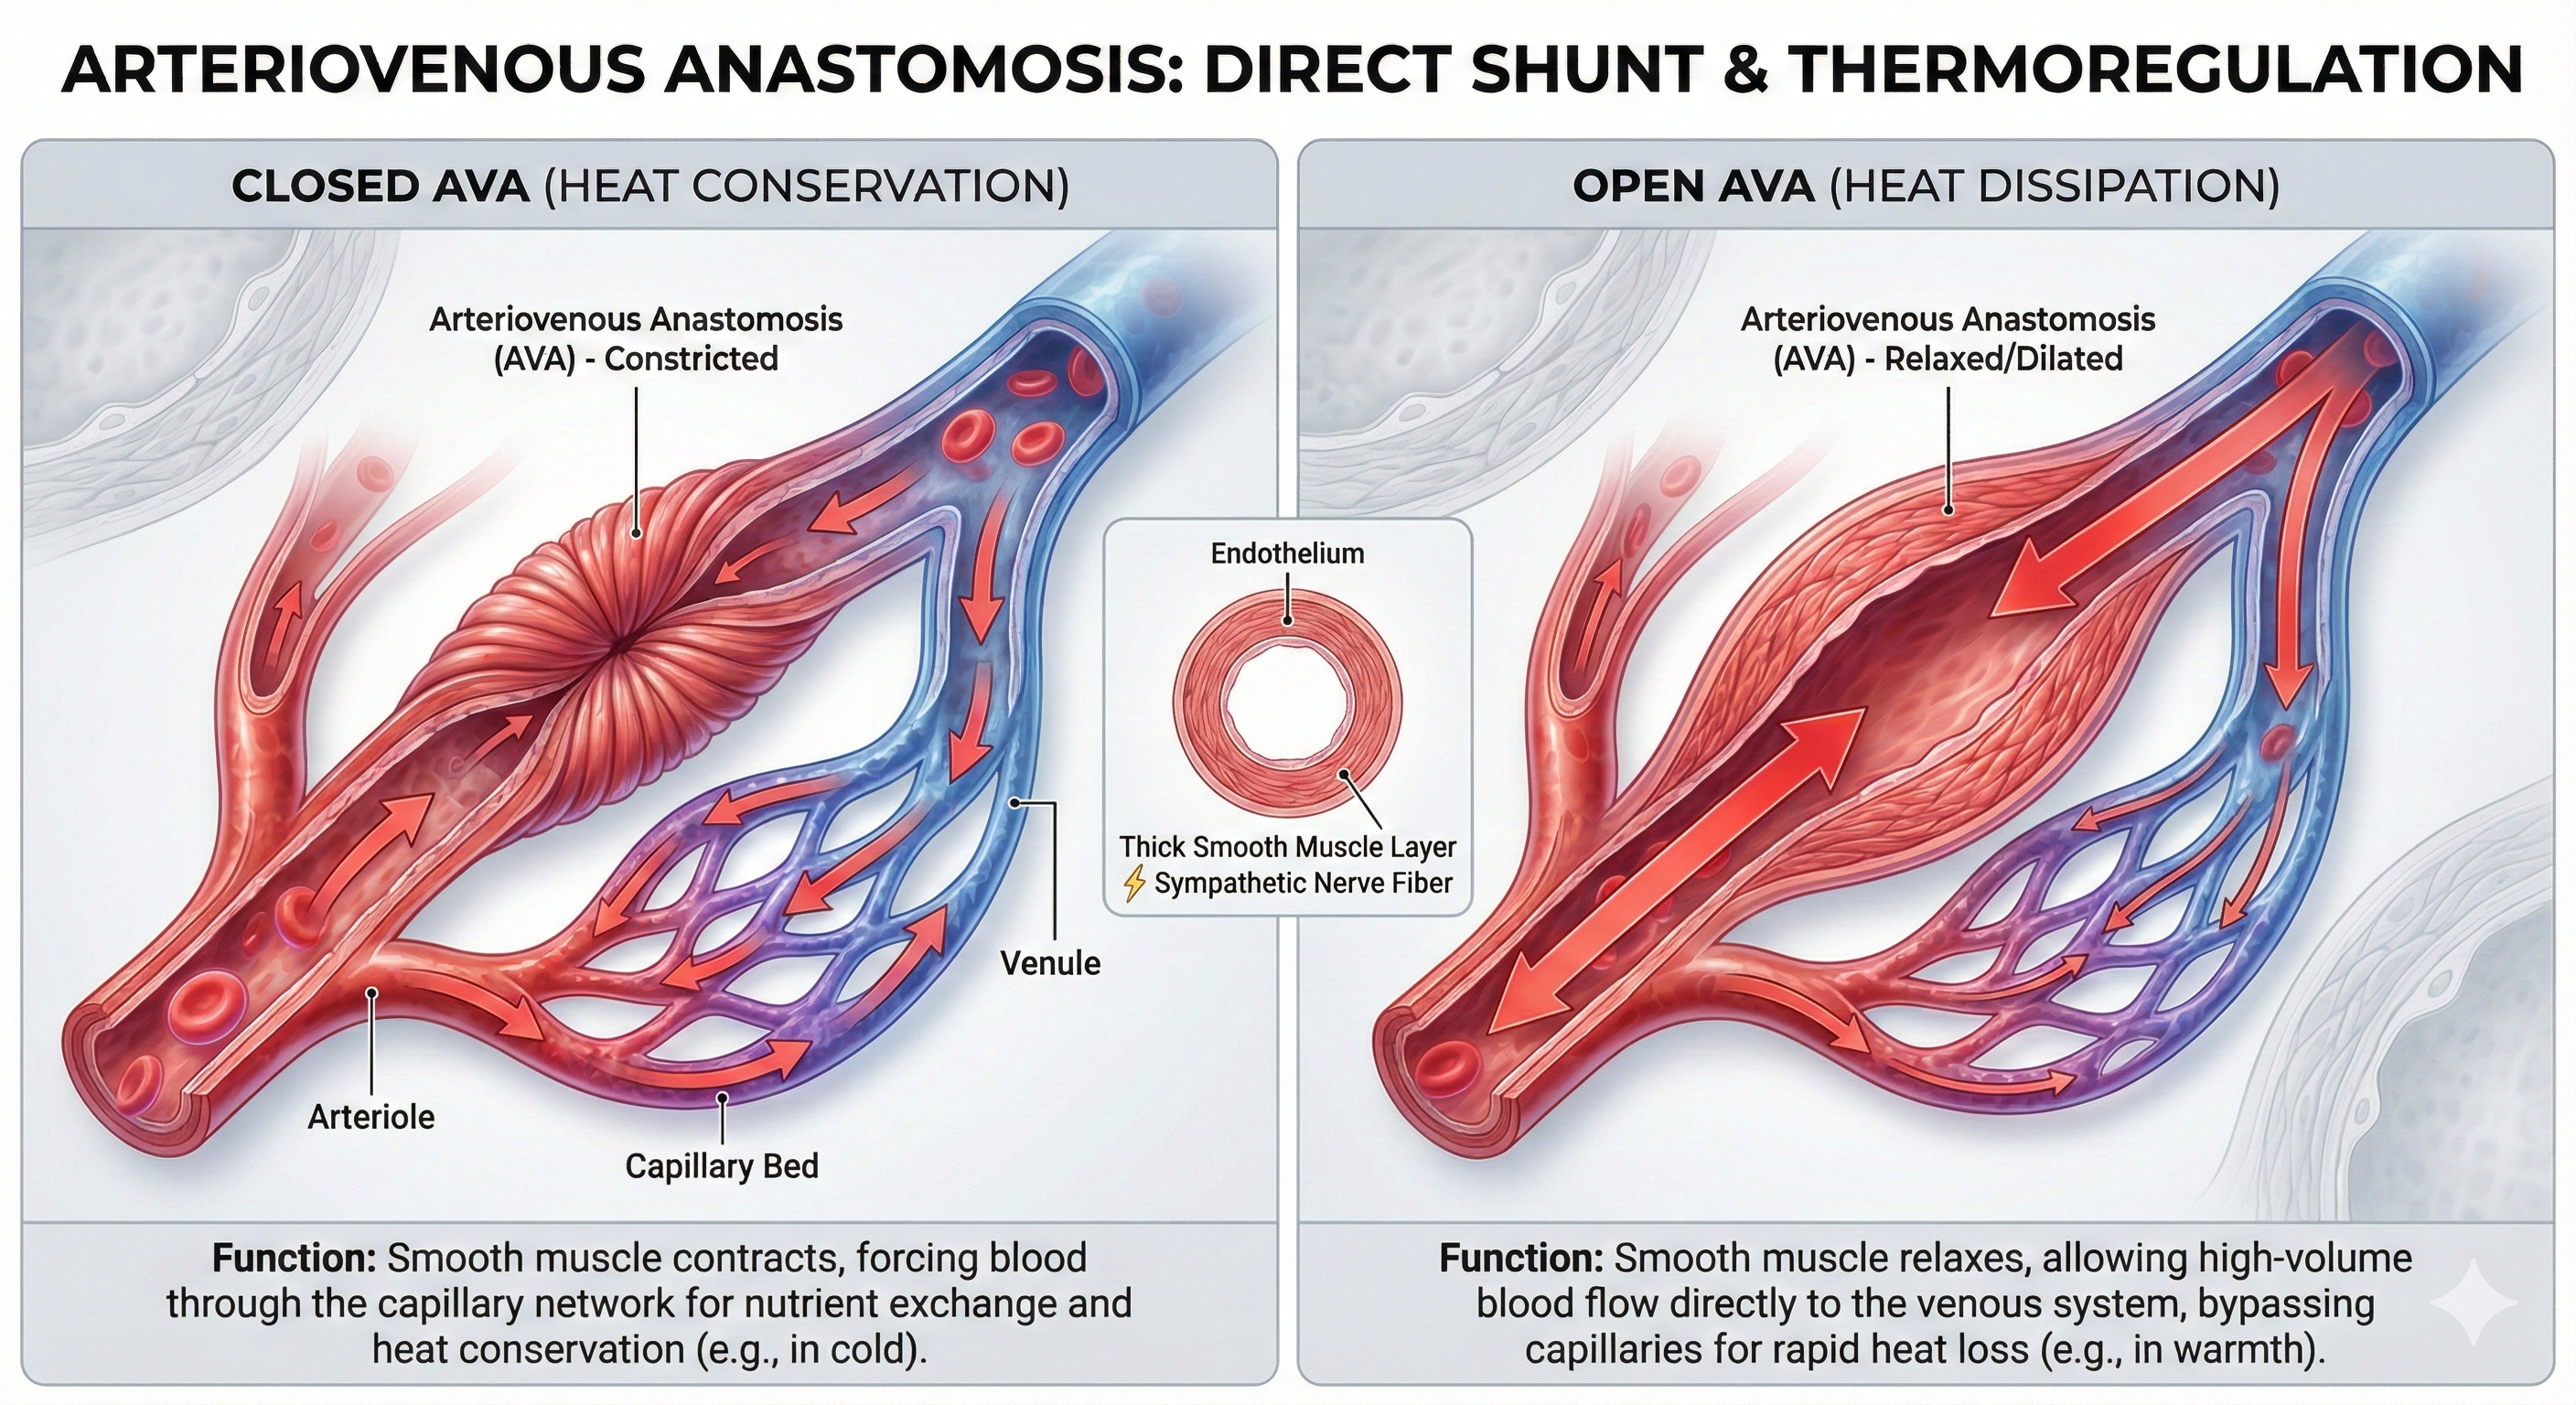
AVAs are all closed when a naked human body is exposed to temperatures around 79 degrees F. They all open as the temperature approaches 97 degrees F. AVA dilation transfers blood from the epidermis to the interior, cooling the skin. This mechanism is implicated in Raynaud's disease and phenomenon.
Blood Pressure: The Force That Keeps You Going
Blood pressure is the force exerted by blood as it presses against blood vessels. In clinical practice, BP refers to the pressure in arteries. Cardiac output is the amount of blood pumped by the heart in a minute calculated by multiplying stroke volume by heart rate. A typical value for a resting adult is 5.25 liters/minute (70 milliliters x 75 beats/minute). Stroke volume is the amount of blood ejected by the left ventricle during one contraction. Heart rate is the number of contractions per minute.
🎧 Listen to a mini-lecture on Cardiac Measurements
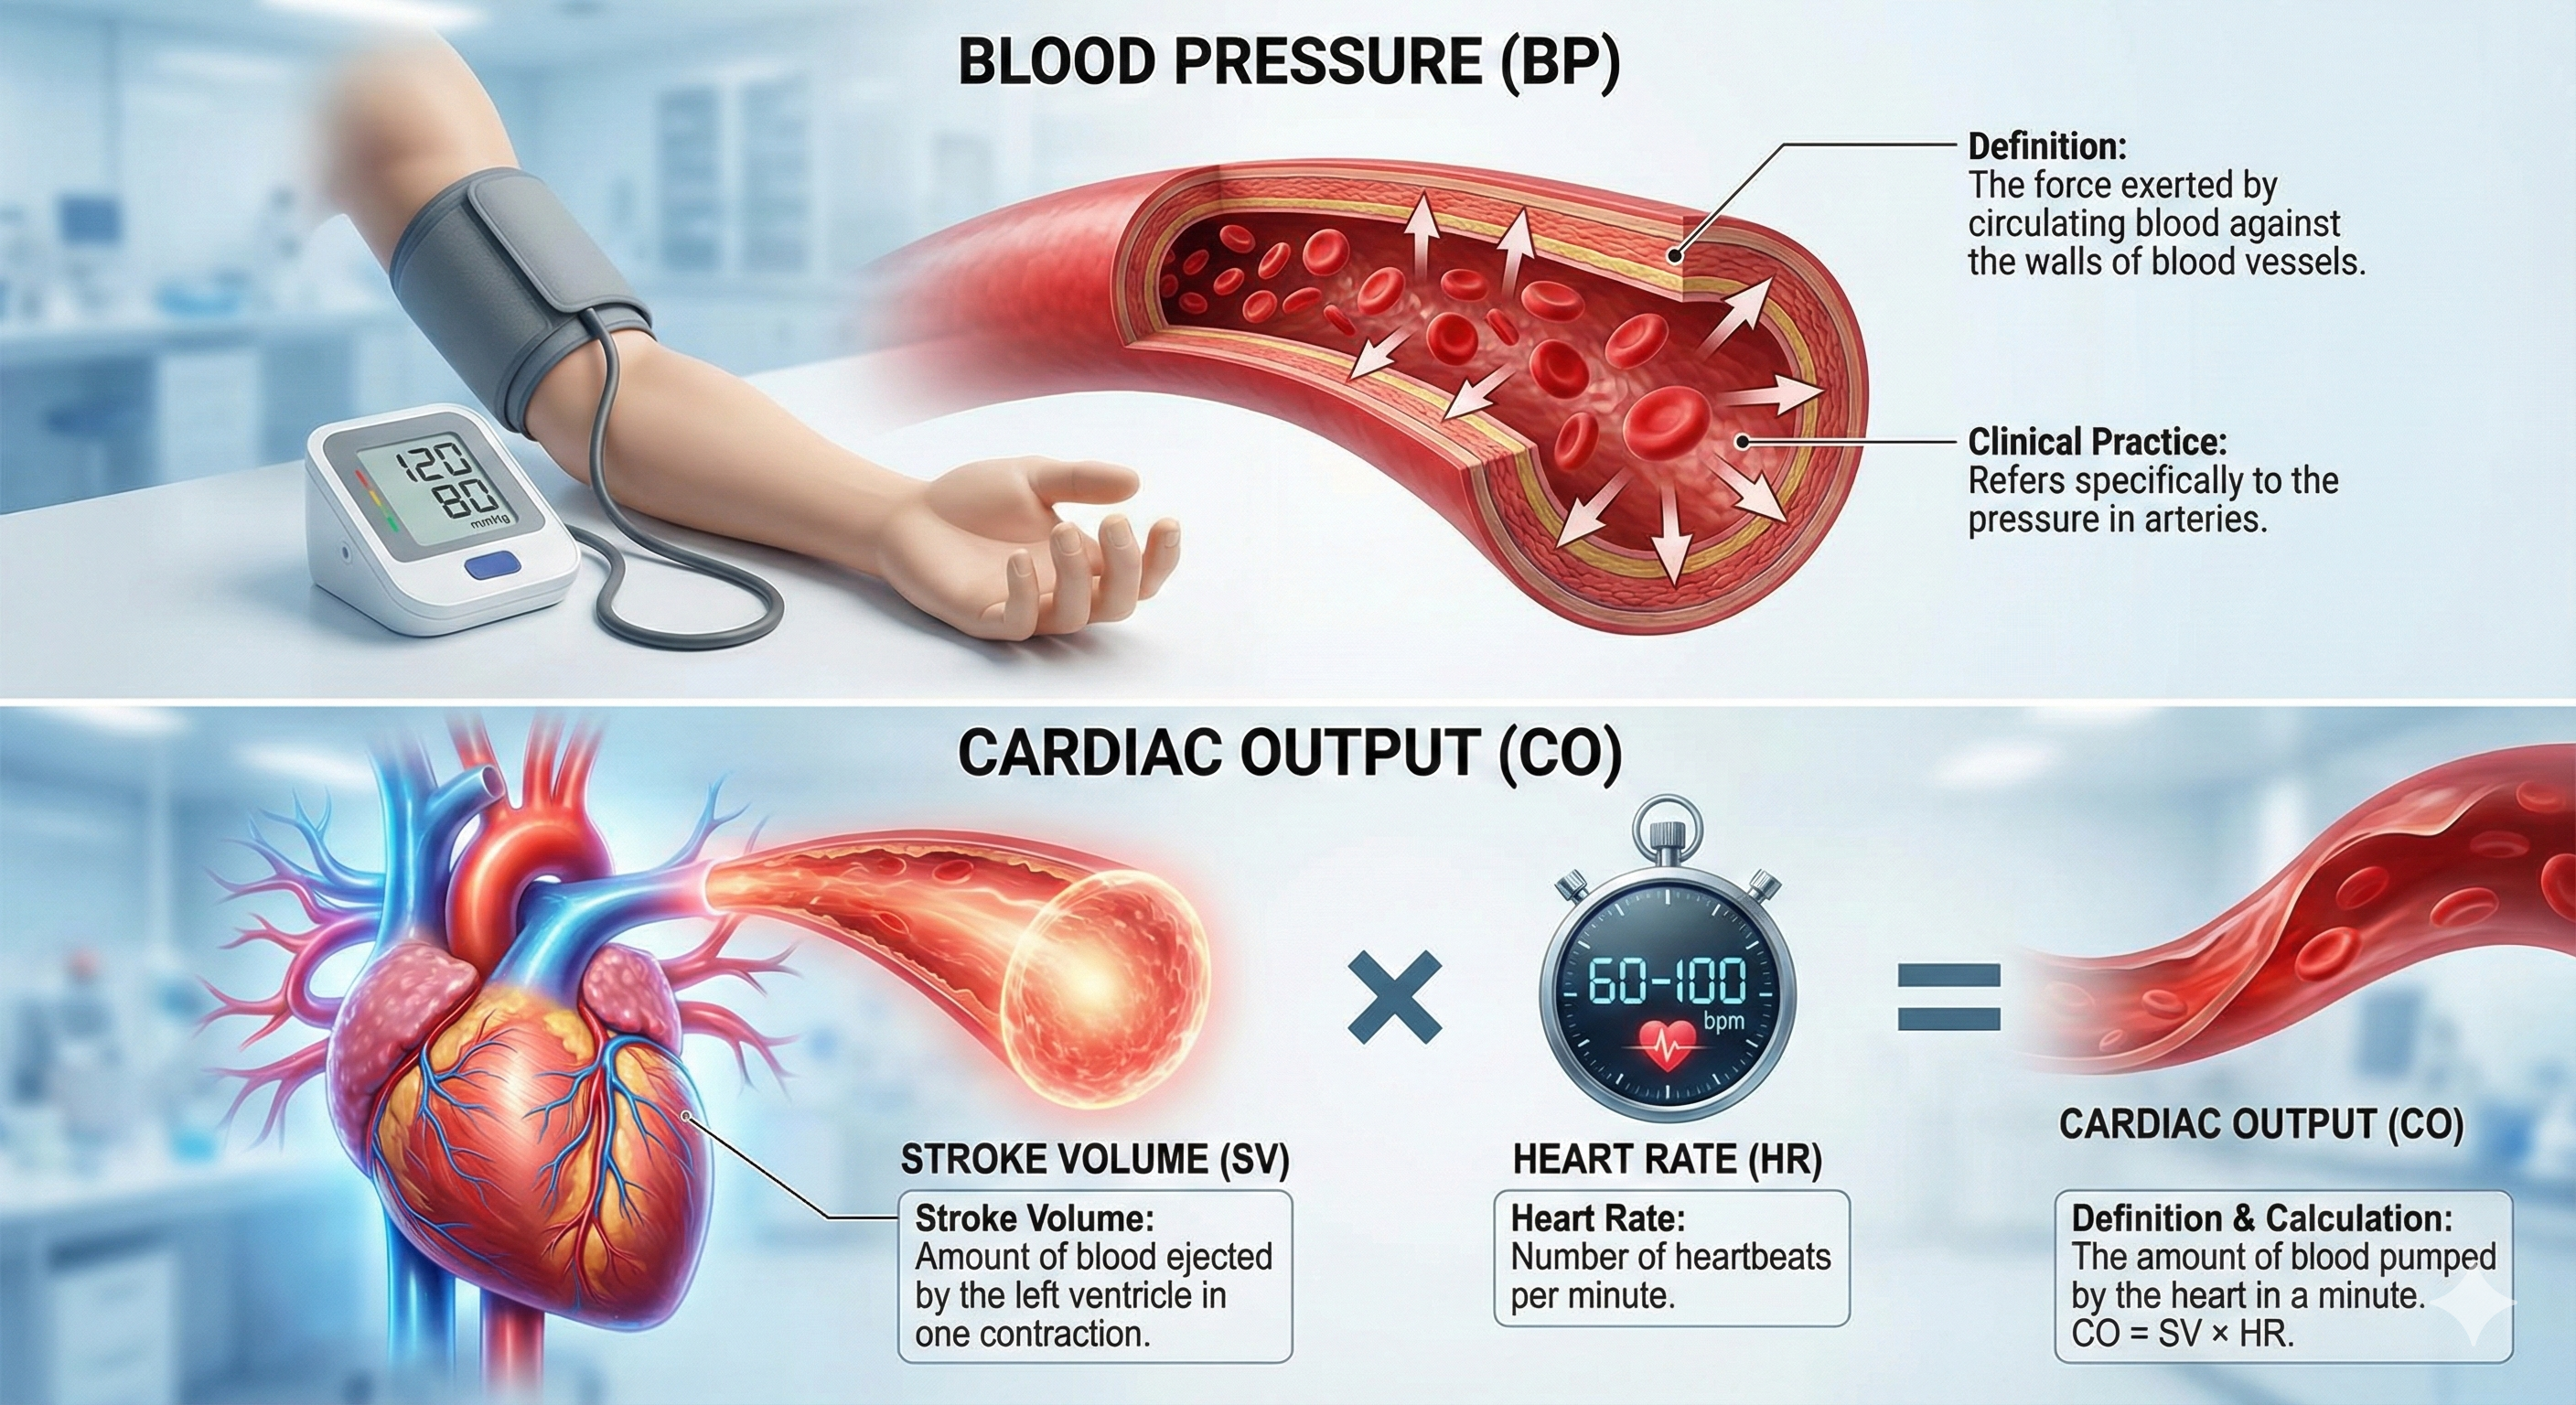
Blood leaving the left ventricle meets resistance or friction due to blood viscosity (thickness), length of blood vessels, and radius. Blood pressure equals cardiac output times resistance. Self-regulation skills that lower BP reduce cardiac output, resistance, or both.
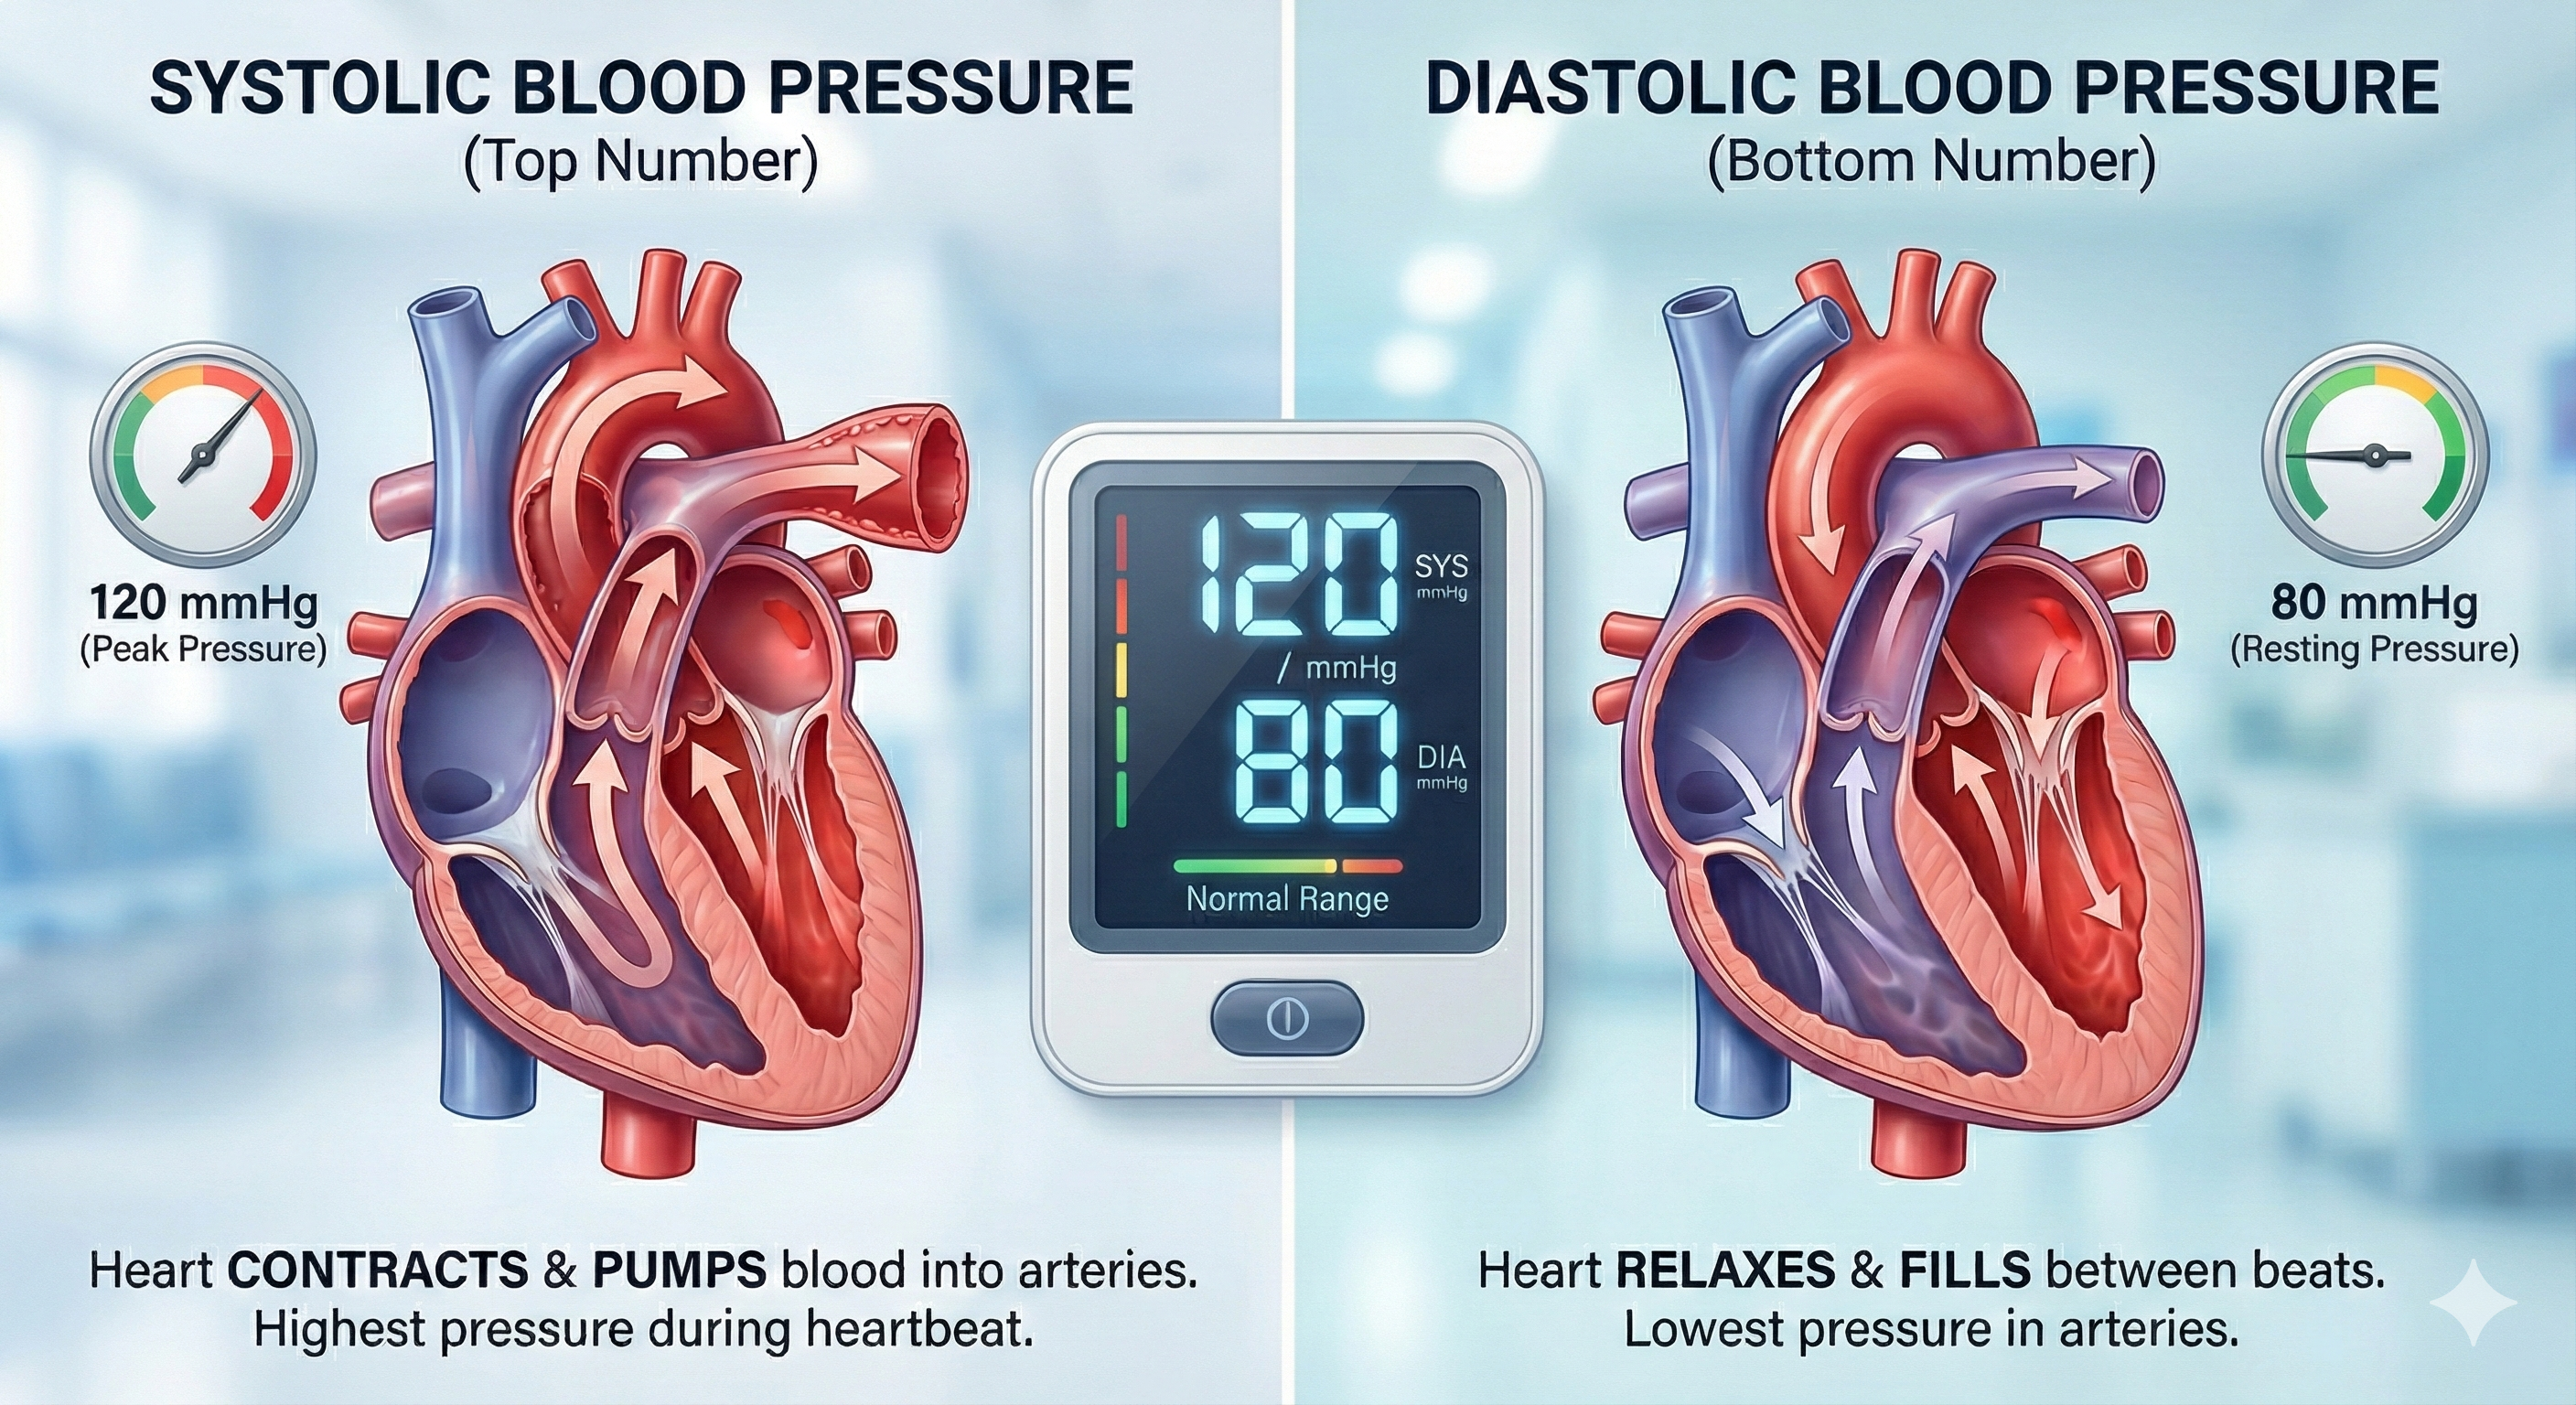
Clinicians measure both systolic and diastolic BPs. Systolic blood pressure (SBP) is the force exerted by blood on arterial walls during contraction of the left ventricle (called systole). SBP is the upper value when BP is reported and is about 120 mmHg in young adult males at rest. Diastolic blood pressure (DBP) is the force applied against arteries during ventricular relaxation (called diastole). DBP is the lower value and is about 80 mmHg at rest.
Veins return blood to the heart through a low-pressure system that relies on valves to prevent backflow, and they serve as blood reservoirs storing 64% of blood volume at rest. Capillaries are where the actual exchange of nutrients and wastes occurs, with their thin walls and massive surface area optimized for this mission. AVAs provide shortcuts between arterioles and venules that help regulate body temperature. Blood pressure results from cardiac output multiplied by resistance, with systolic pressure reflecting ventricular contraction and diastolic pressure reflecting relaxation.
The Heart: Your Tireless Four-Chambered Pump
The heart is a hollow muscular organ about the size of a closed fist that pumps 1,500 to 2,000 gallons of blood each day in the adult cardiovascular system.
🎧 Listen to a mini-lecture on an Overview of the Heart
Review the External Structure of the Heart
Click on the Quizlet logo to review an interactive diagram created by raymondmitchelafrica.

The Heart's Four Chambers
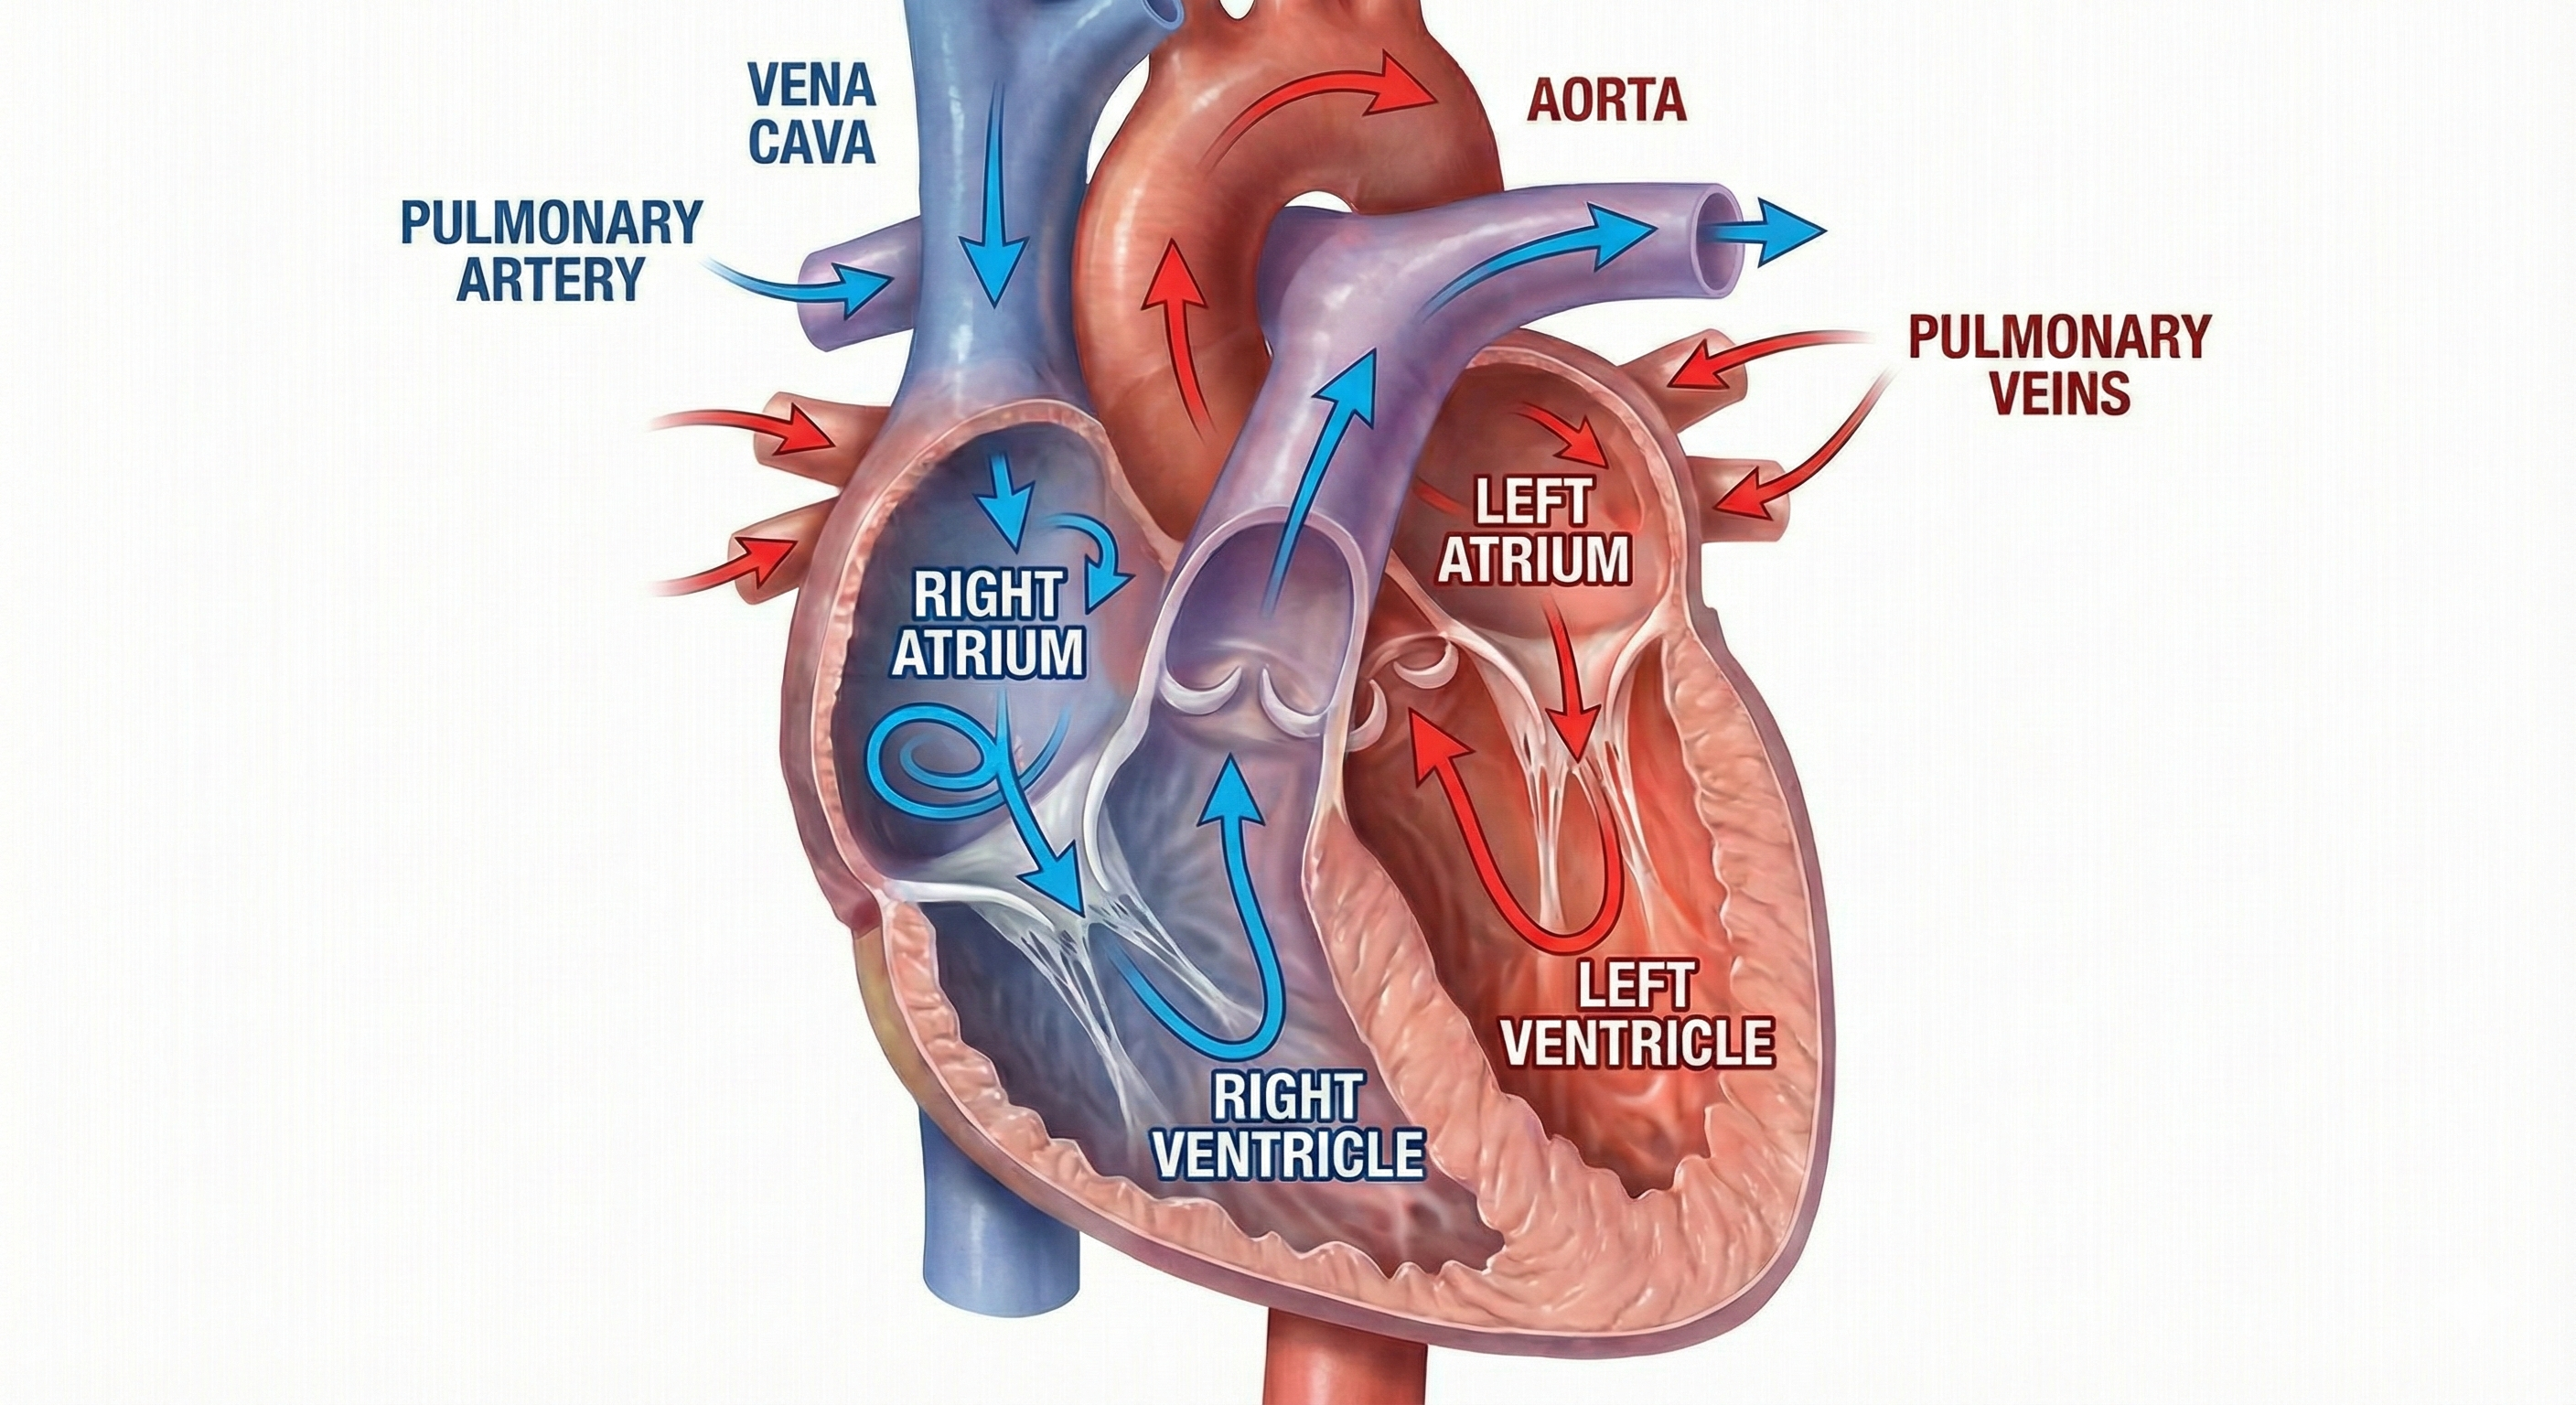
The heart contains four chambers: two atria and two ventricles. The right atrium is the upper chamber that receives deoxygenated blood and pumps it into the right ventricle. The right ventricle is the lower chamber that receives deoxygenated blood from the right atrium and pumps it into the pulmonary artery. The left atrium is the upper chamber that receives oxygenated blood from the pulmonary veins and pumps it to the left ventricle. The left ventricle is the lower chamber that receives oxygenated blood from the left atrium and pumps it through the aorta.
The Heart's Electrical Conduction System
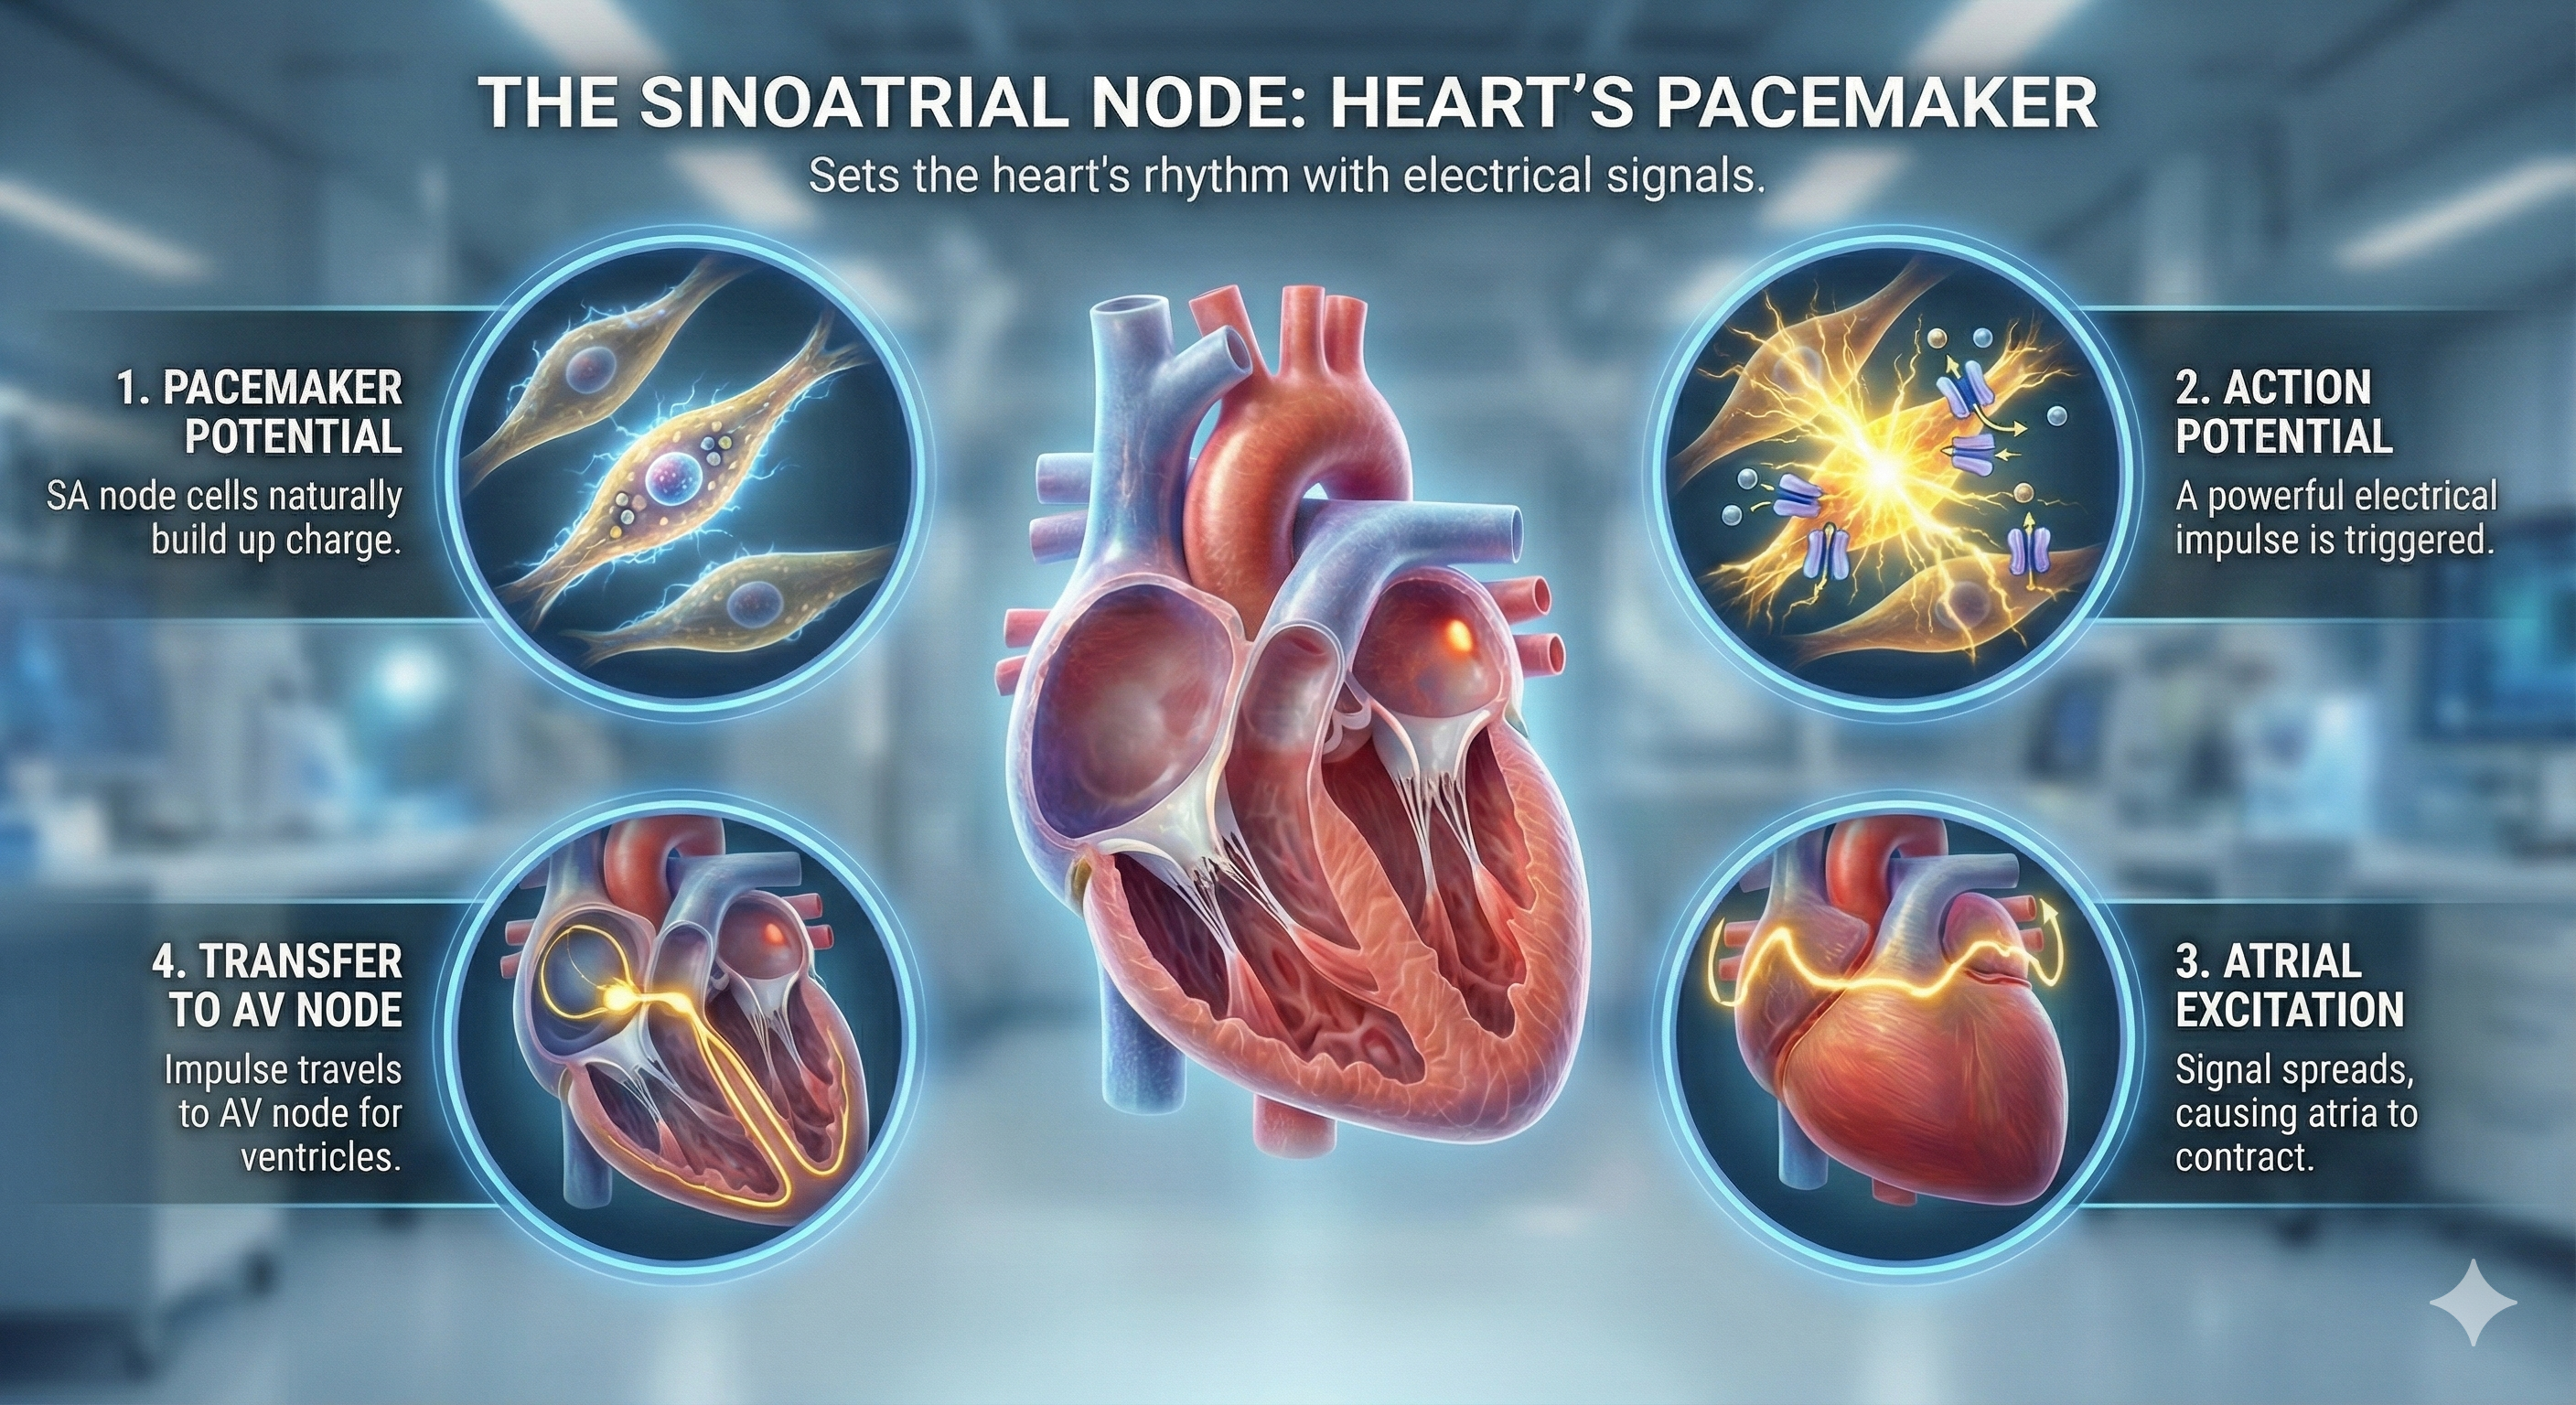
The heart beats because of electrical impulses generated by its conduction system. The sinoatrial (SA) node initiates each cardiac cycle through spontaneous depolarization of its autorhythmic fibers. The atrioventricular (AV) node is located between the atria and ventricles. The atrioventricular (AV) bundle conducts electrical impulses from the AV node to the top of the septum. Bundle branches descend along both sides of the septum and conduct the action potential over the ventricles about 0.2 seconds after the appearance of the P wave. Conduction myofibers extend from the bundle branches into the myocardium, depolarizing contractile fibers in the ventricles.
The Electrocardiogram (ECG): Reading Your Heart's Electrical Activity
The electrocardiogram (ECG) is a recording of the heart's electrical activity using an electrocardiograph. A cardiac cycle consists of systole (ventricular contraction) and diastole (ventricular relaxation).
The P wave is produced as contractile fibers in the atria depolarize and culminates in the atria's contraction (atrial systole). The QRS complex corresponds to the depolarization of the ventricles. The R-spike is the initial upward deflection in the QRS complex of the ECG. The S-T segment connects the QRS complex and the T wave; ventricular contraction continues through the S-T segment. The T wave represents ventricular repolarization.

Check out the YouTube video 15 Second EKG.
Considerations for HRV Biofeedback Training
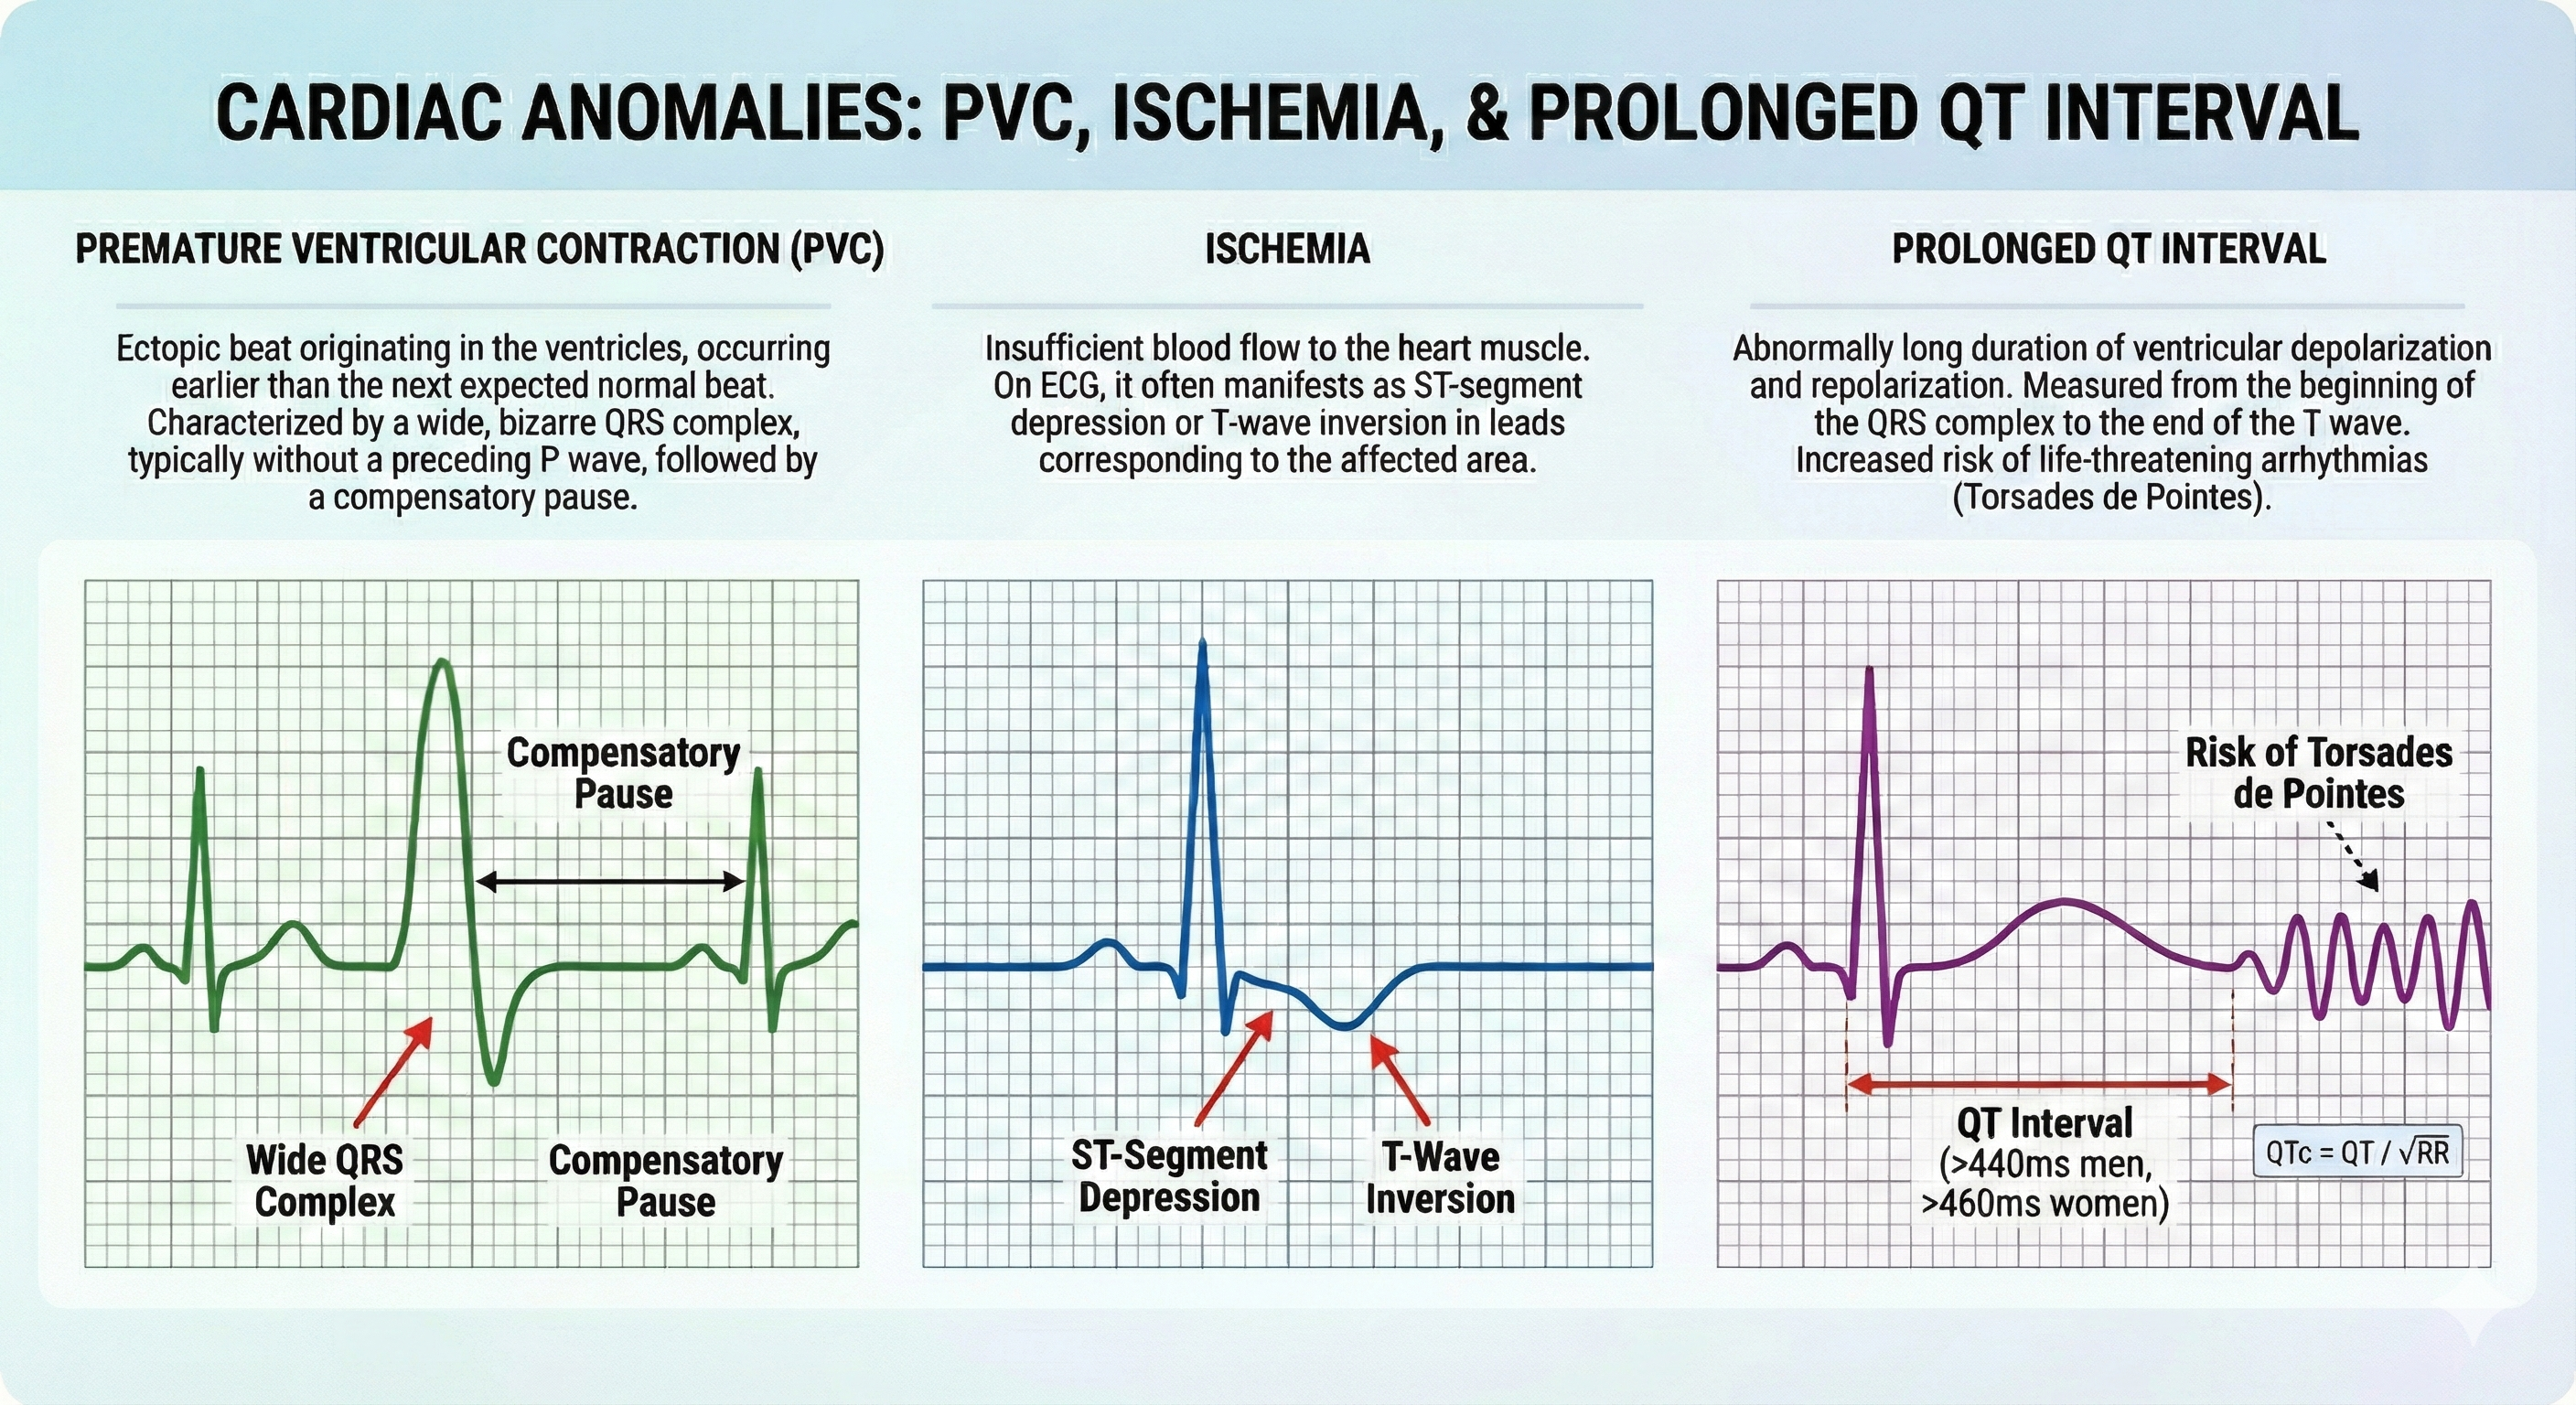
Clinicians should examine ECG morphology for evidence of arrhythmias, ischemia, and prolonged Q-T intervals that could endanger client safety as part of client assessment for HRV biofeedback training (Drew et al., 2004).
Regulation by the Cardiovascular Center
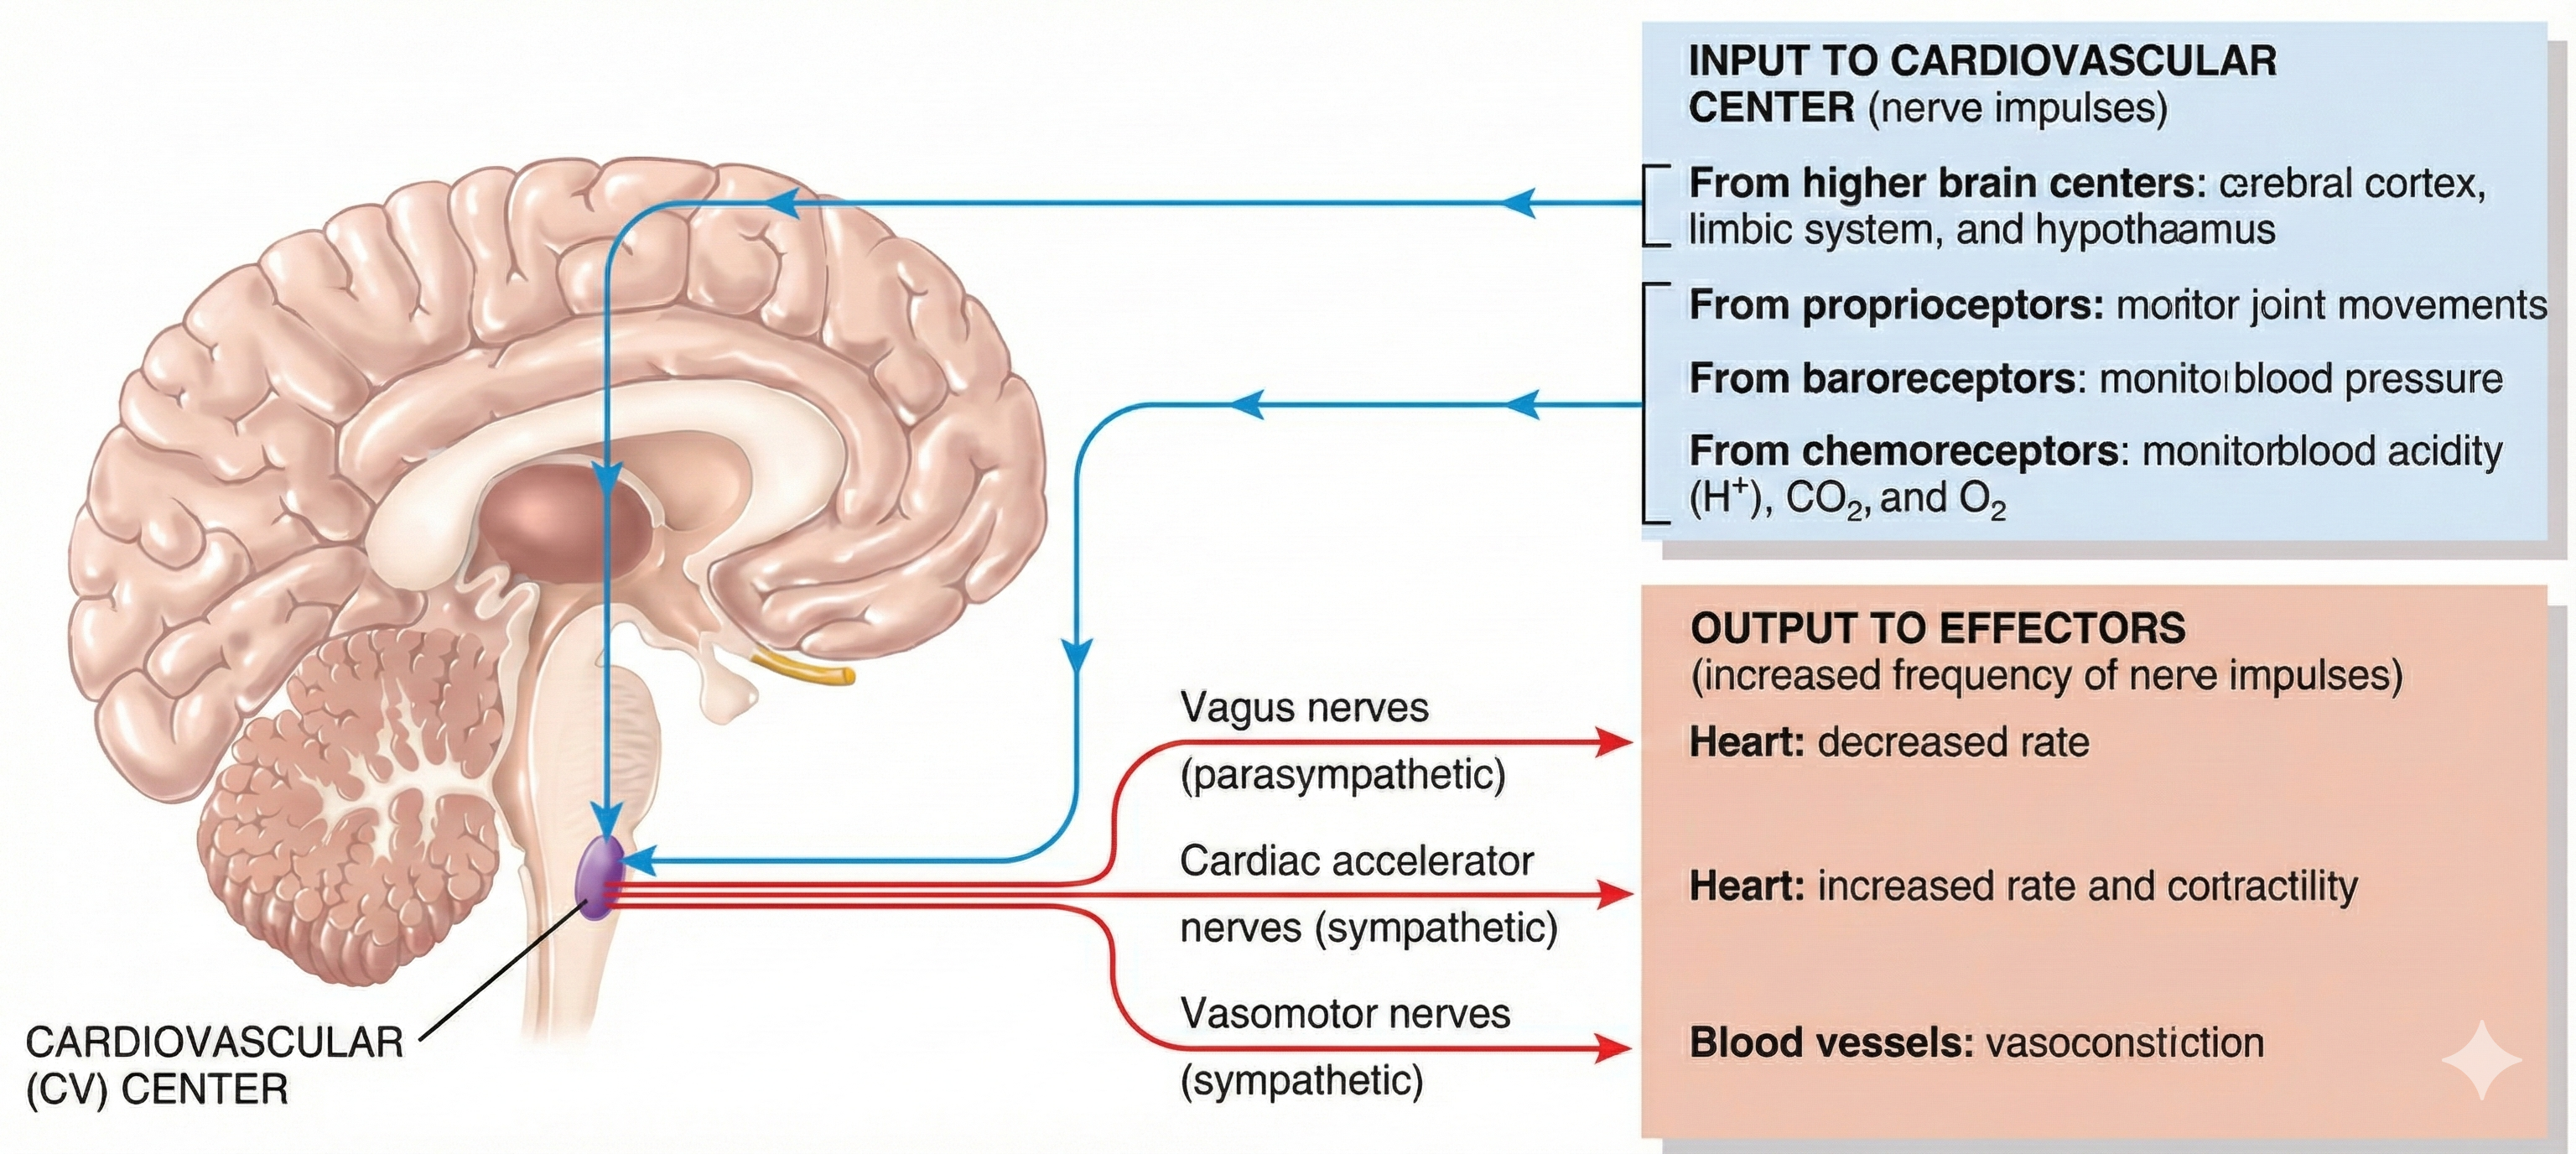
The cardiovascular (CV) center located in the medulla regulates blood pressure and tissue perfusion by changing HR, stroke volume, systemic vascular resistance, and blood volume. Interconnected neuronal, hormonal, and local negative feedback systems are responsible for immediate and long-term BP regulation and redistribution of blood flow.
Autonomic Control of the Heart
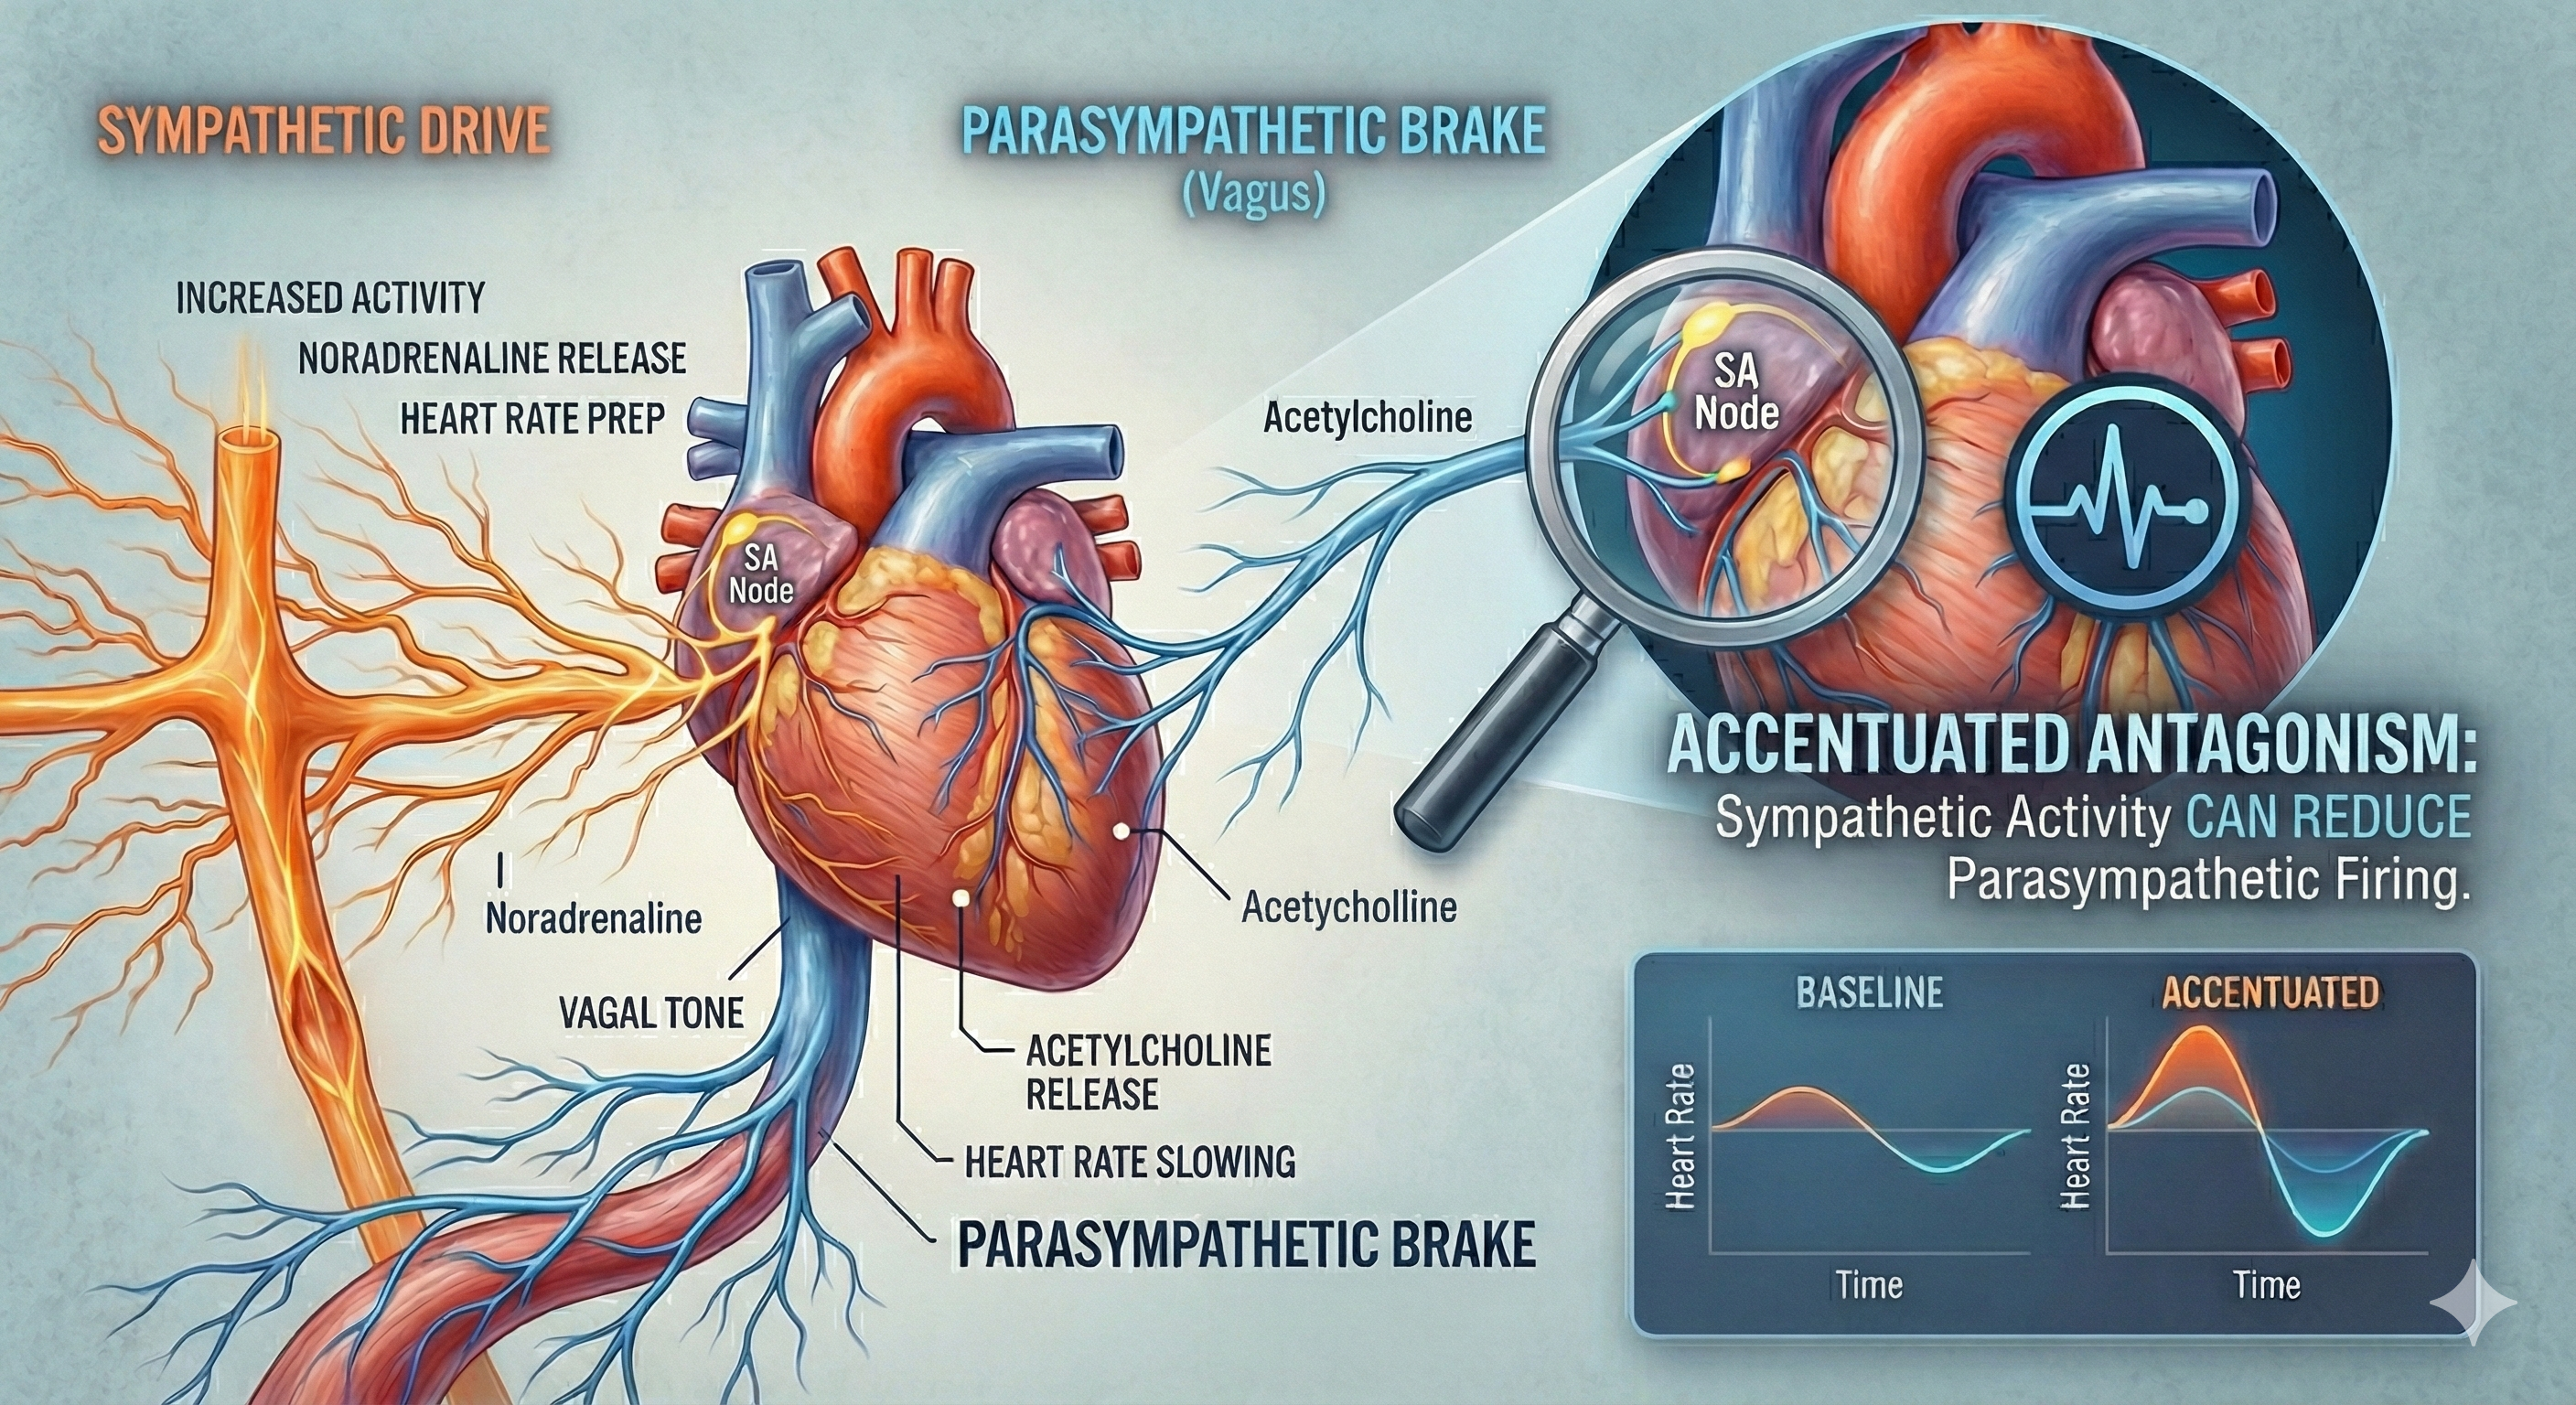
The CV center regulates the heart and vasomotor tone. Sympathetic cardiac accelerator nerves target the SA node, AV node, and the bulk of the myocardium (heart muscle). Action potentials conducted by these motor neurons release NE and E. These neurotransmitters bind to beta-adrenergic (β1) receptors located on cardiac muscle fibers. This speeds spontaneous SA and AV node depolarization, increasing HR and strengthening atria and ventricle contractility.
Parasympathetic vagus (X) nerves also innervate the SA node, AV node, and atrial cardiac muscle.
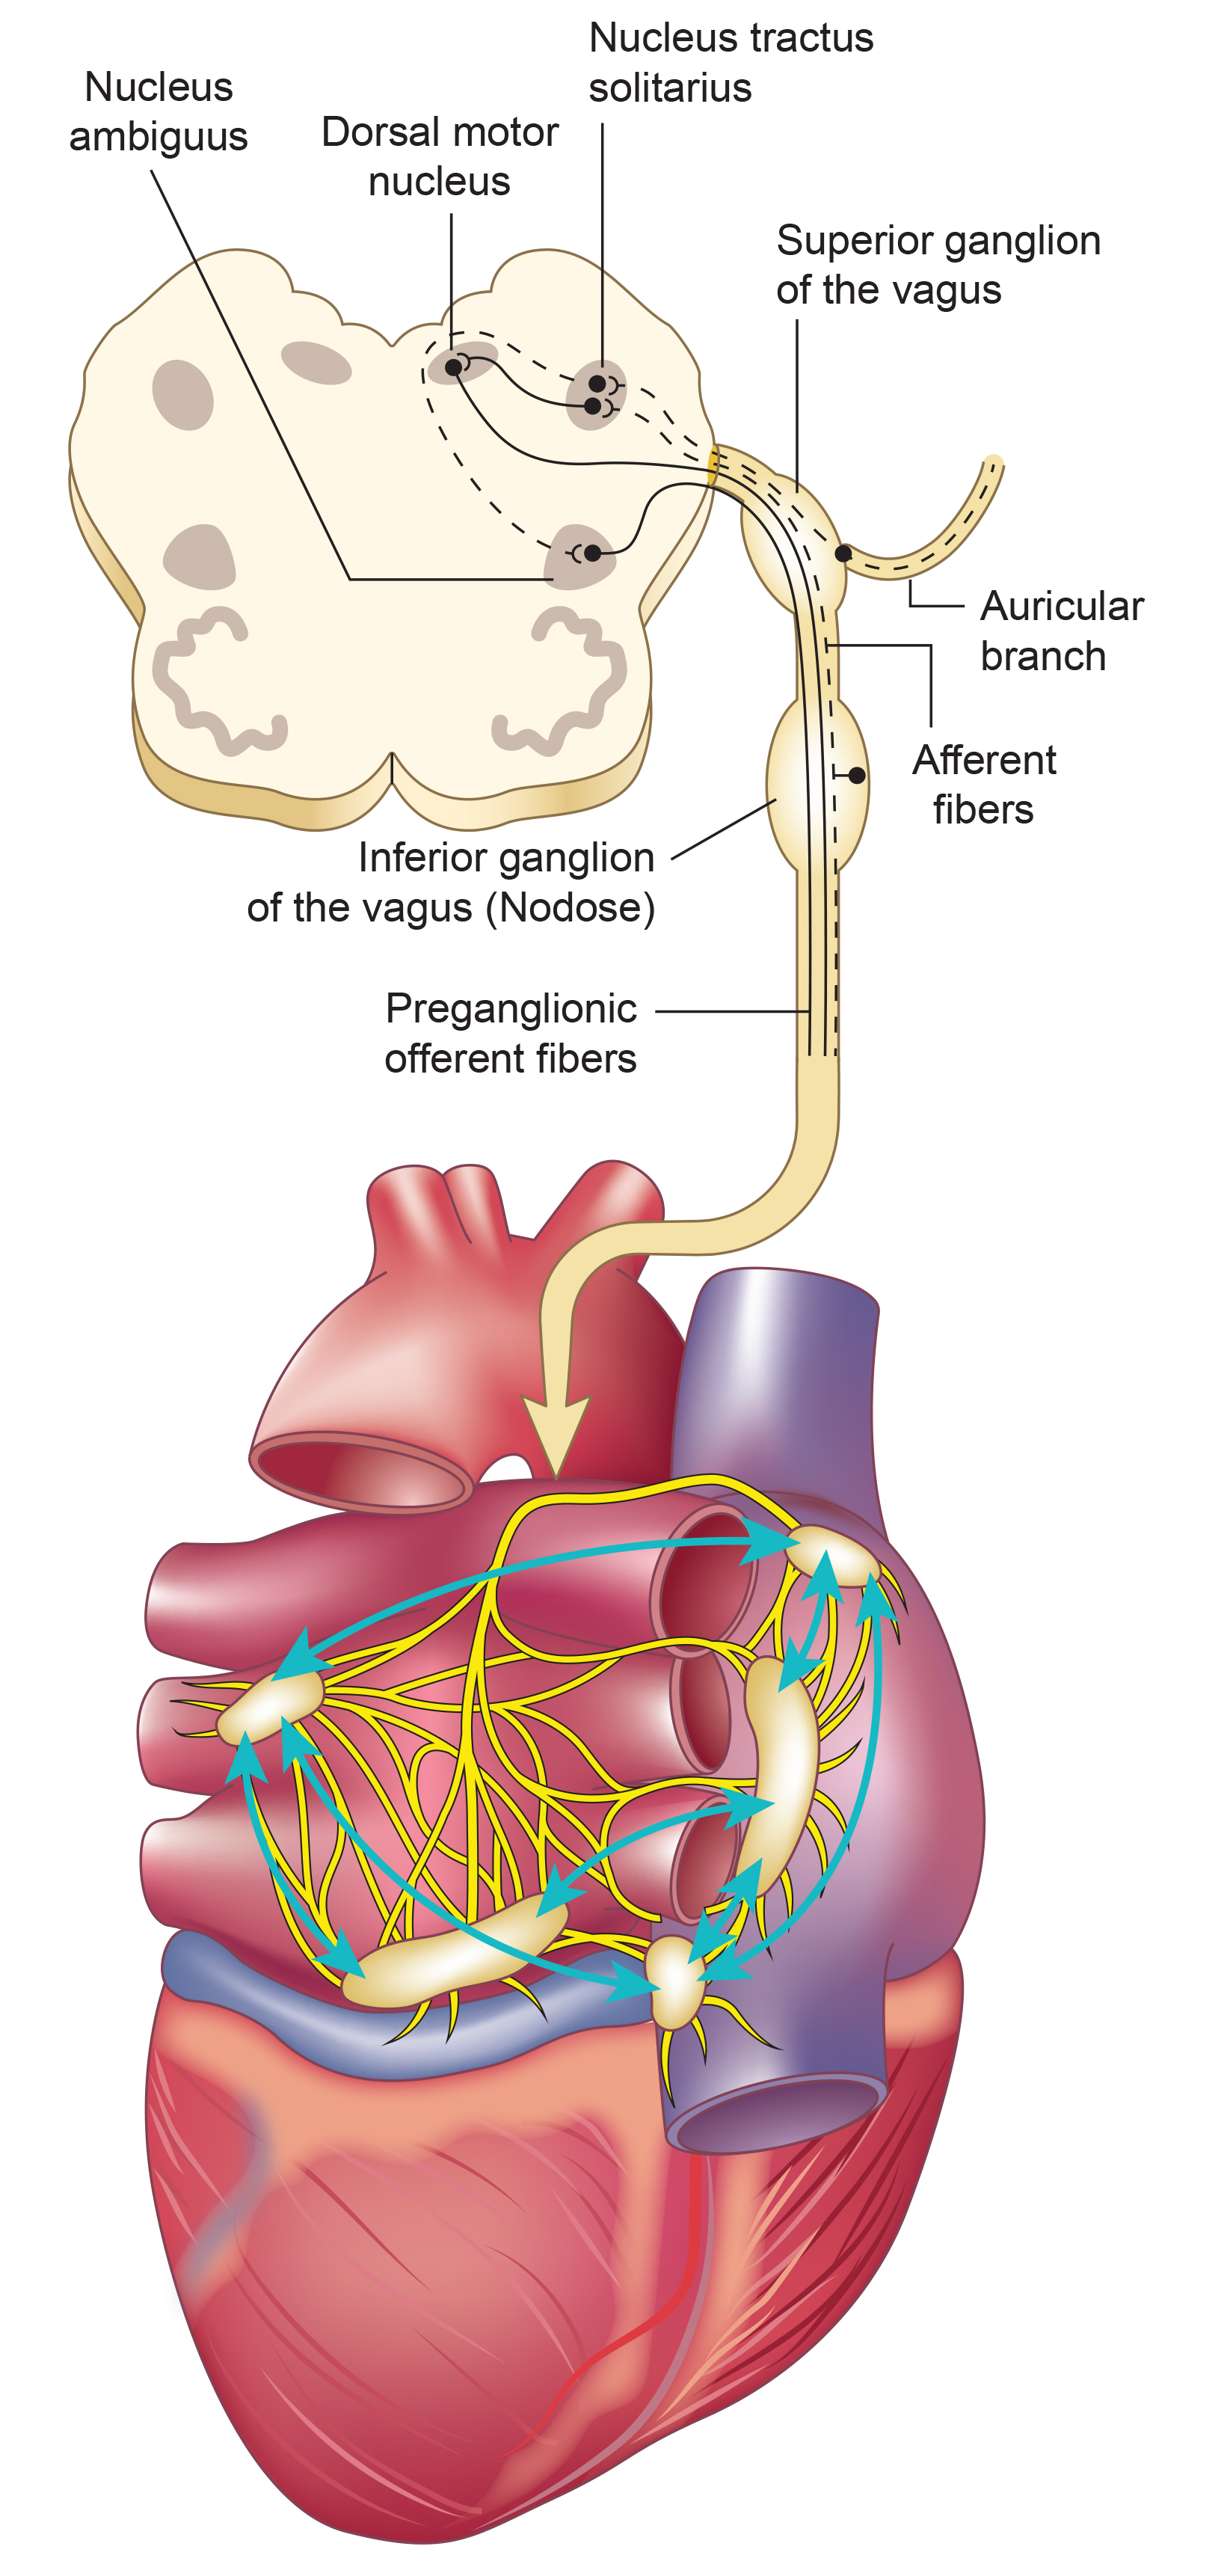
Firing by these motor neurons triggers acetylcholine release and binding to muscarinic (mainly M2) receptors. Cholinergic binding decreases the rate of spontaneous depolarization in the SA and AV nodes (slowing heart rate). Since there is sparse vagal innervation of the ventricles, vagal tone minimally affects the ventricular contractility (Tortora & Derrickson, 2021).
Autonomic Balance: The Dance Between Branches
There is a dynamic balance between sympathetic nervous system (SNS) and parasympathetic nervous system (PNS) influences in a healthy heart. The synergistic relationship between these autonomic branches is complex: sometimes reciprocal, additive, or subtractive (Gevirtz, Schwartz, & Lehrer, 2016).
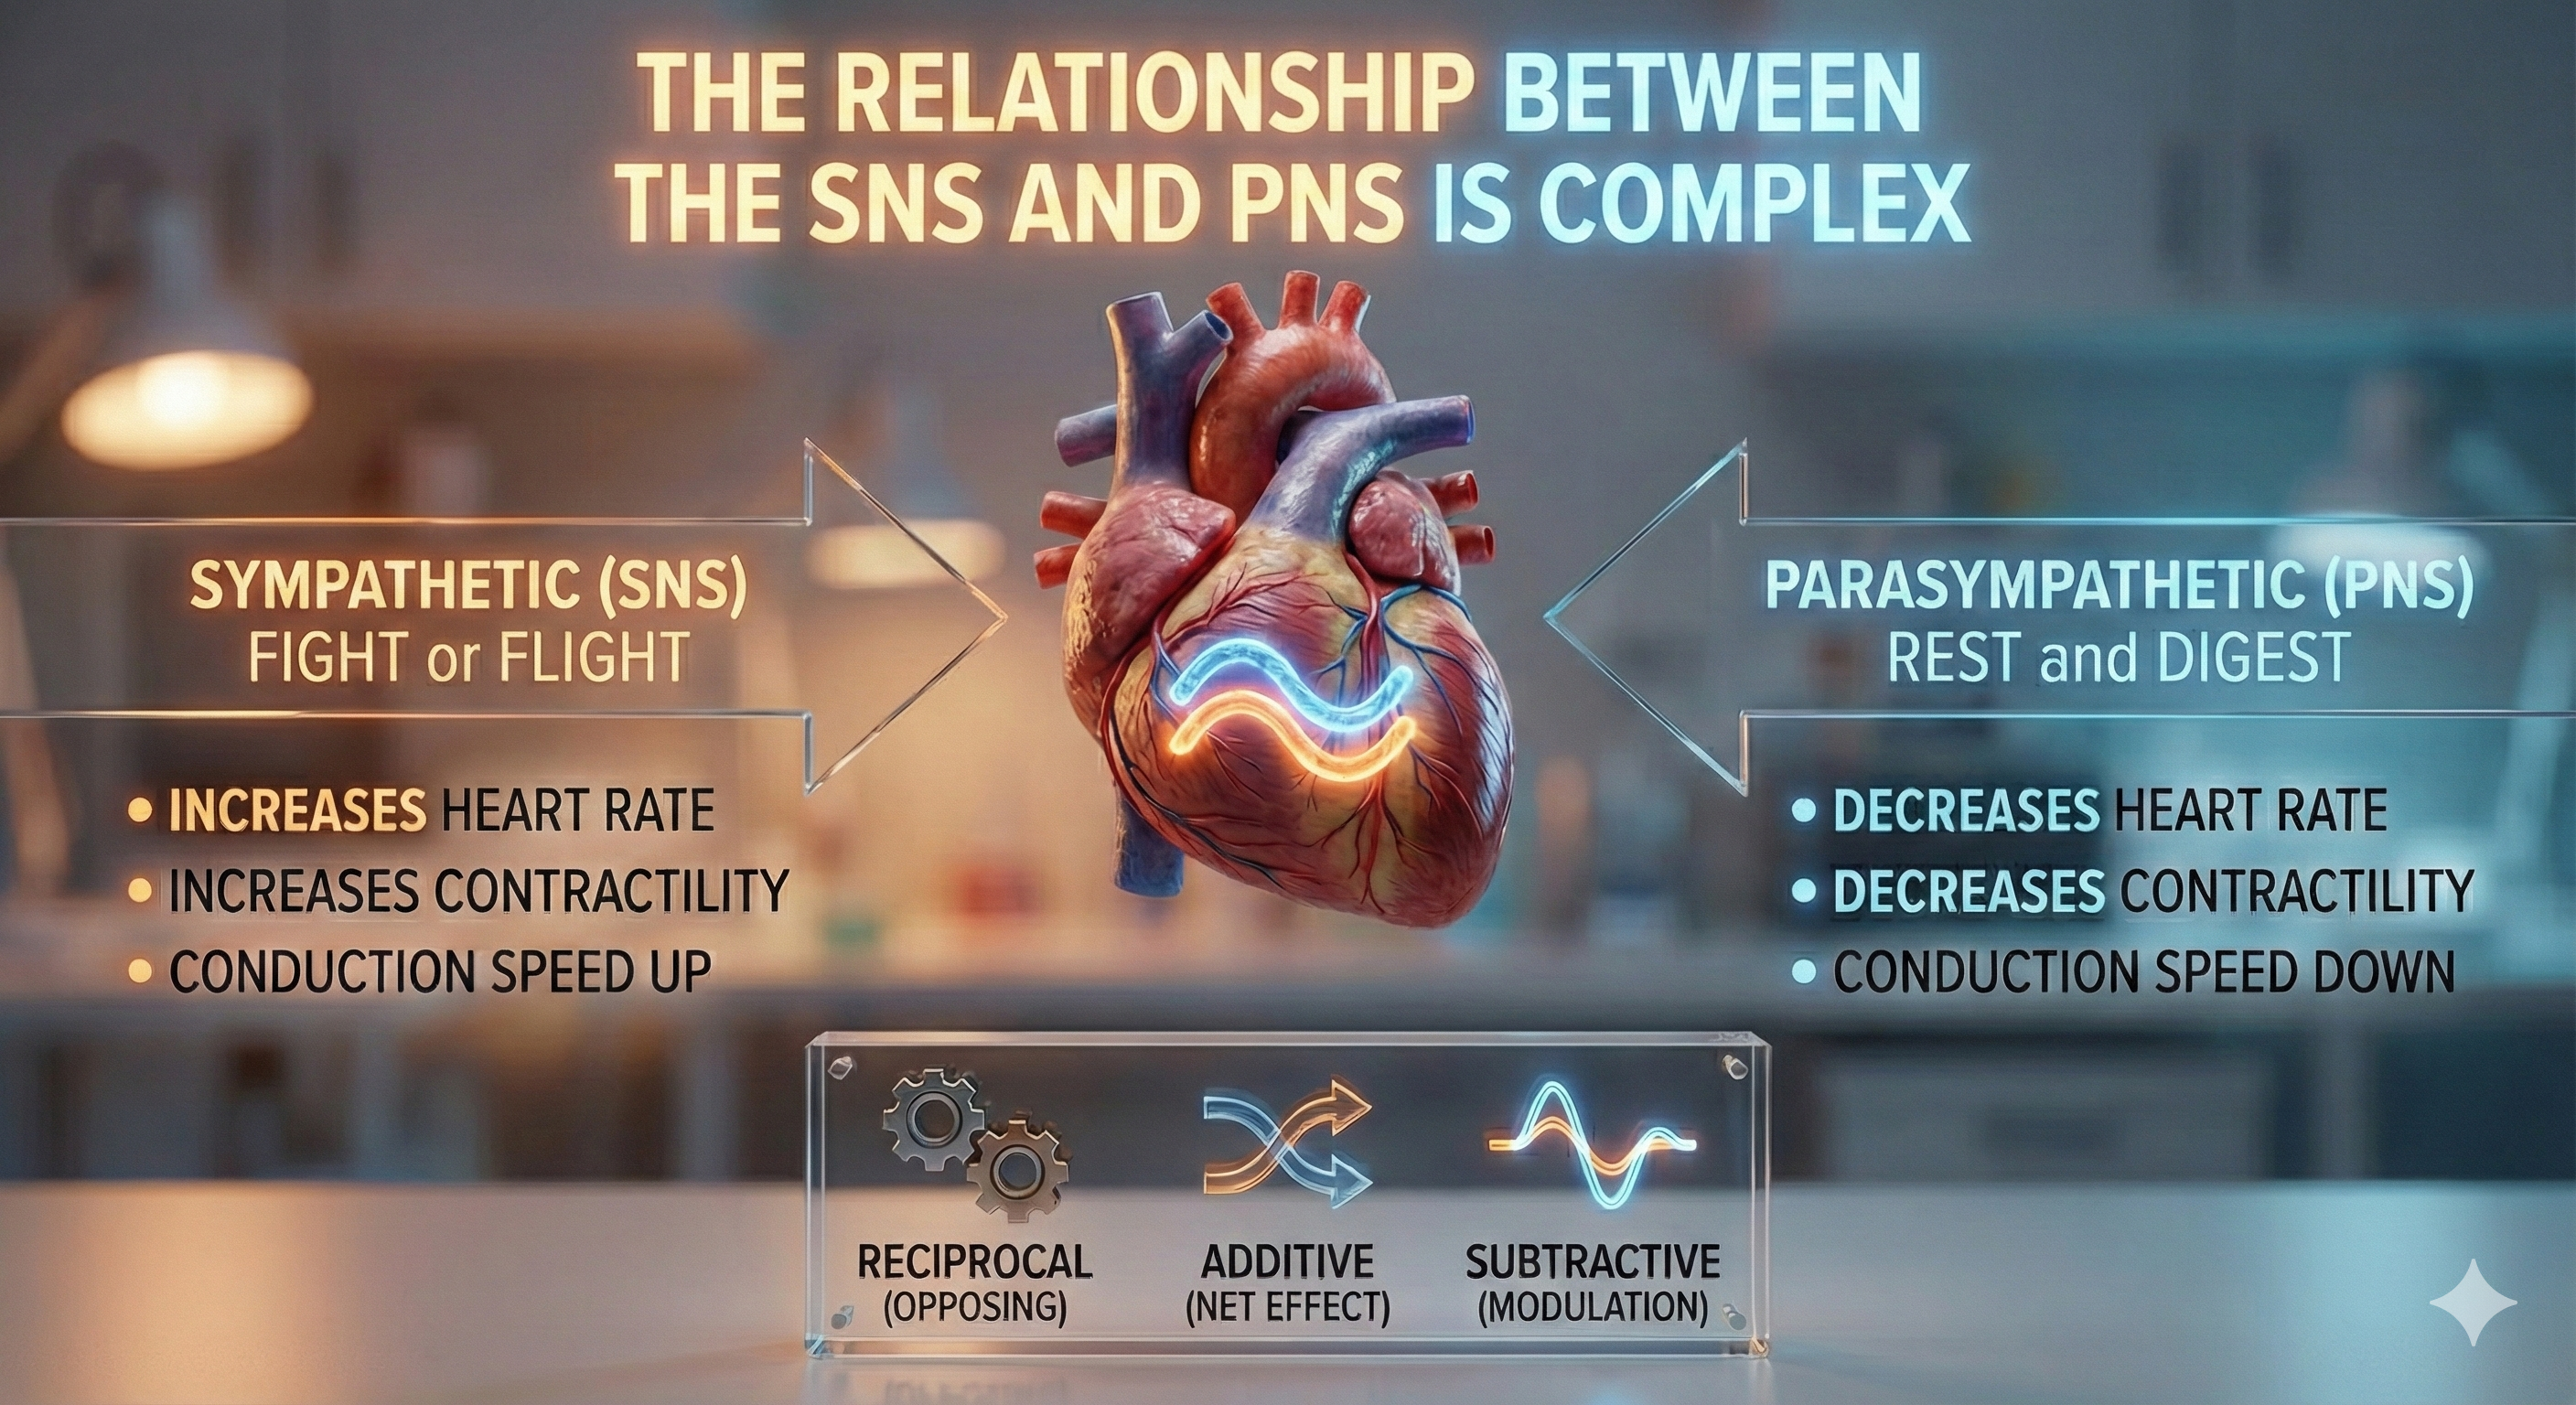
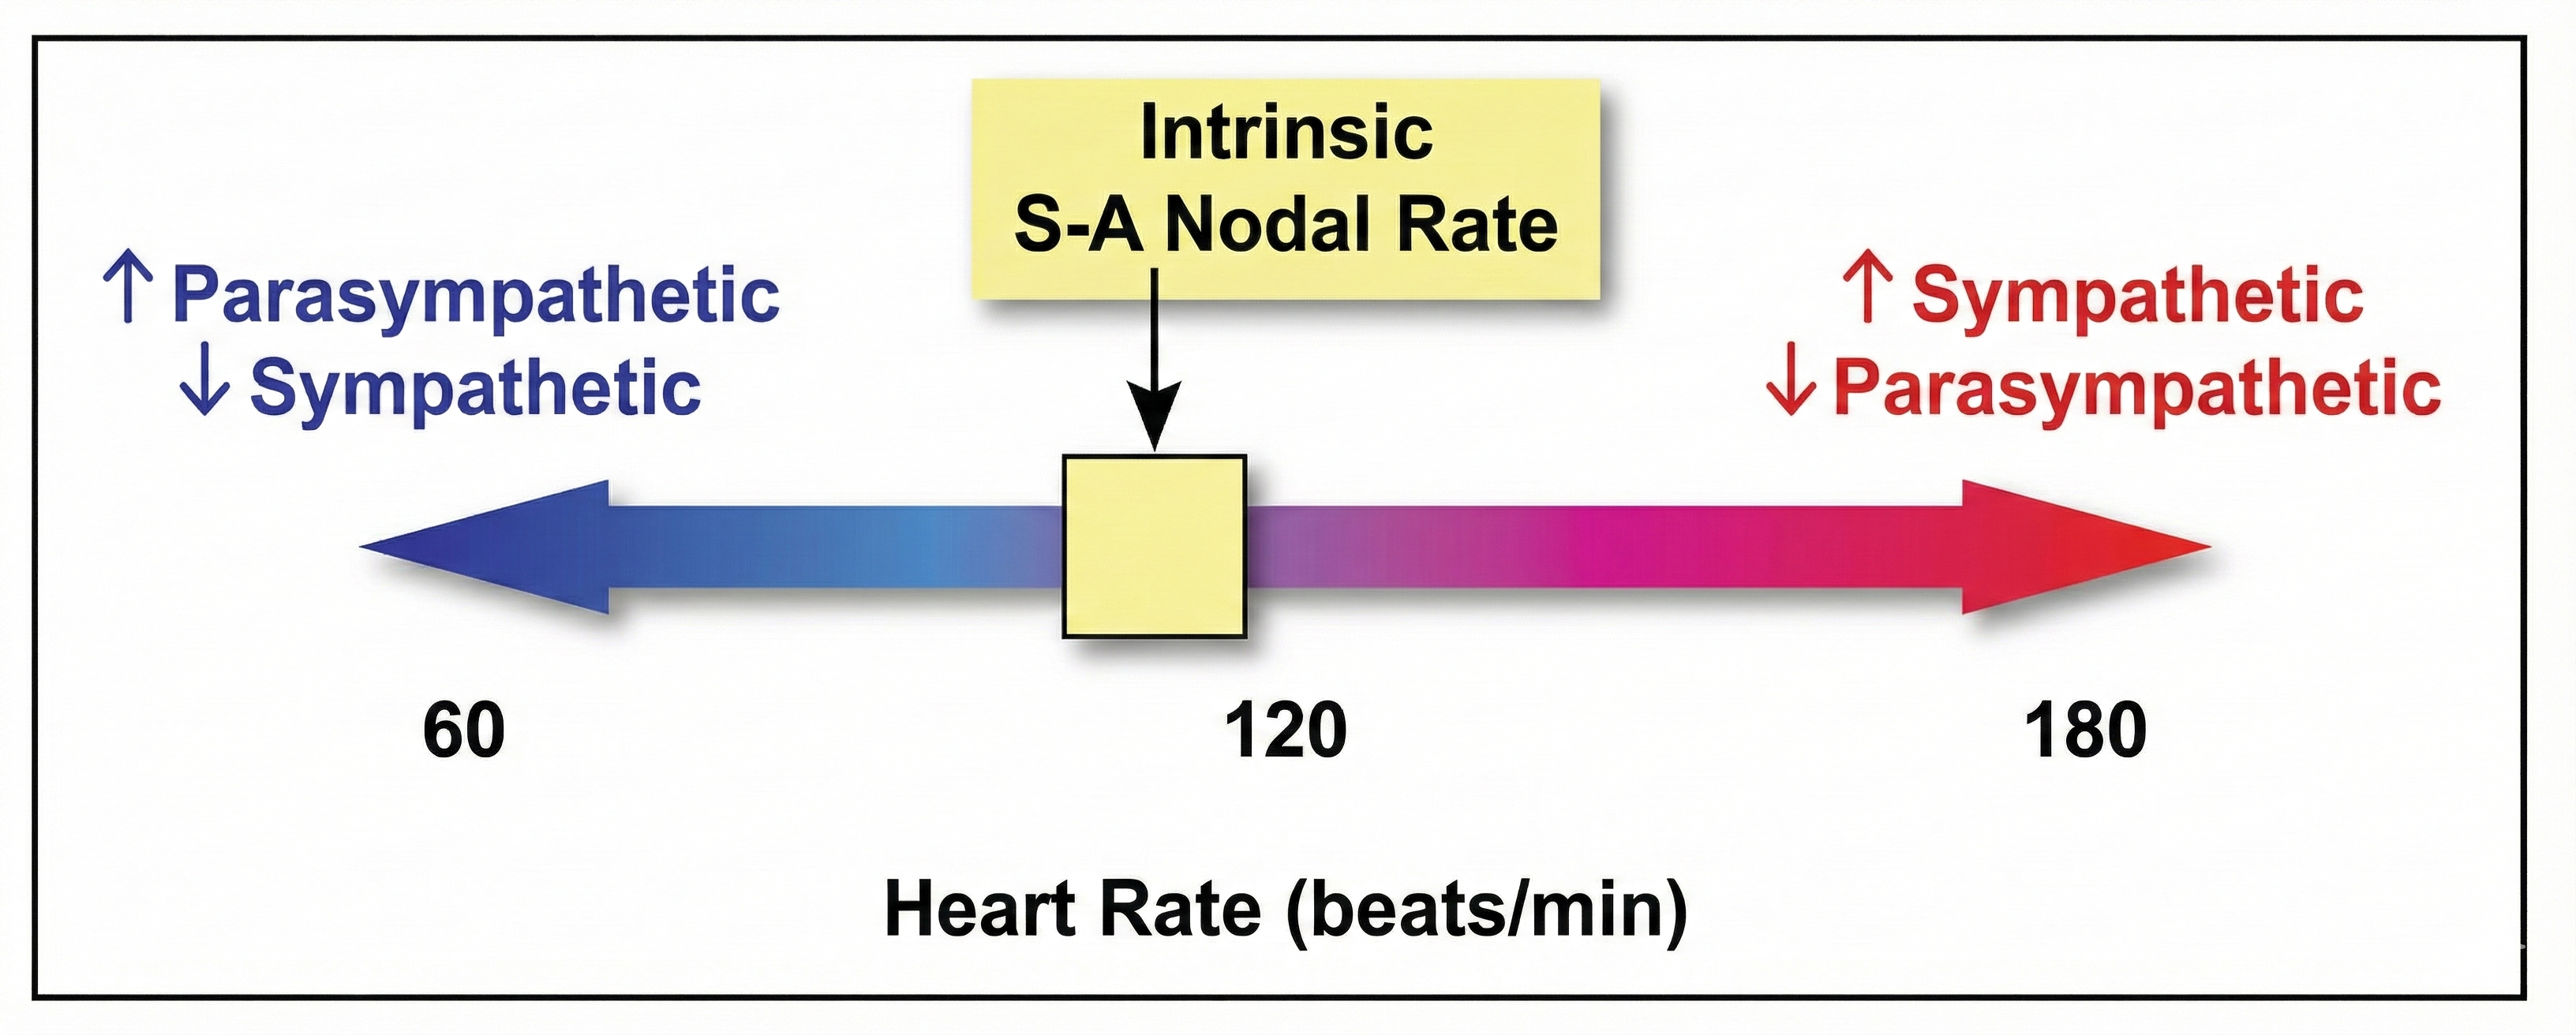
PNS control predominates at rest, resulting in an average HR of 75 beats per minute (bpm) that is significantly slower than the SA node's intrinsic rate, which decreases with age, from an average 107 bpm at 20 years to 90 bpm at 50 years (Opthof, 2000).
The PNS can slow the heart by 20 or 30 beats per minute or briefly stop it (Tortora & Derrickson, 2021). This control illustrates the response called accentuated antagonism (Olshansky et al., 2011). Parasympathetic nerves exert their effects more rapidly (< 1 second) than sympathetic nerves (> 5 seconds) (Nunan et al., 2010; Shaffer, McCraty, & Zerr, 2014; Tortora & Derrickson, 2021).
Heart Rate: More Than Just a Number
Heart rate (HR; also called stroke rate) is the number of heartbeats per minute. This value is 75 beats/minute for a resting young adult male. Resting rates slower than 60 beats/minute (bradycardia) and faster than 100 beats/minute (tachycardia) may indicate a cardiovascular disorder. Typical non-athlete HRs are 60-80 bpm. Athletes may have HRs between 40-60 bpm (Khazan, 2019).

Abnormal or irregular rhythms are called arrhythmias or dysrhythmias (Tortora & Derrickson, 2021).
Here is a sobering finding: Imahori et al. (2021) conducted a cohort study of 2147 adults ≥ 60 who were free of dementia when they entered the study. Resting heart rates (RHR) ≥80 (compared with 60-69 bpm) were associated with a greater risk of dementia and more rapid cognitive decline, independent of cardiovascular disease.
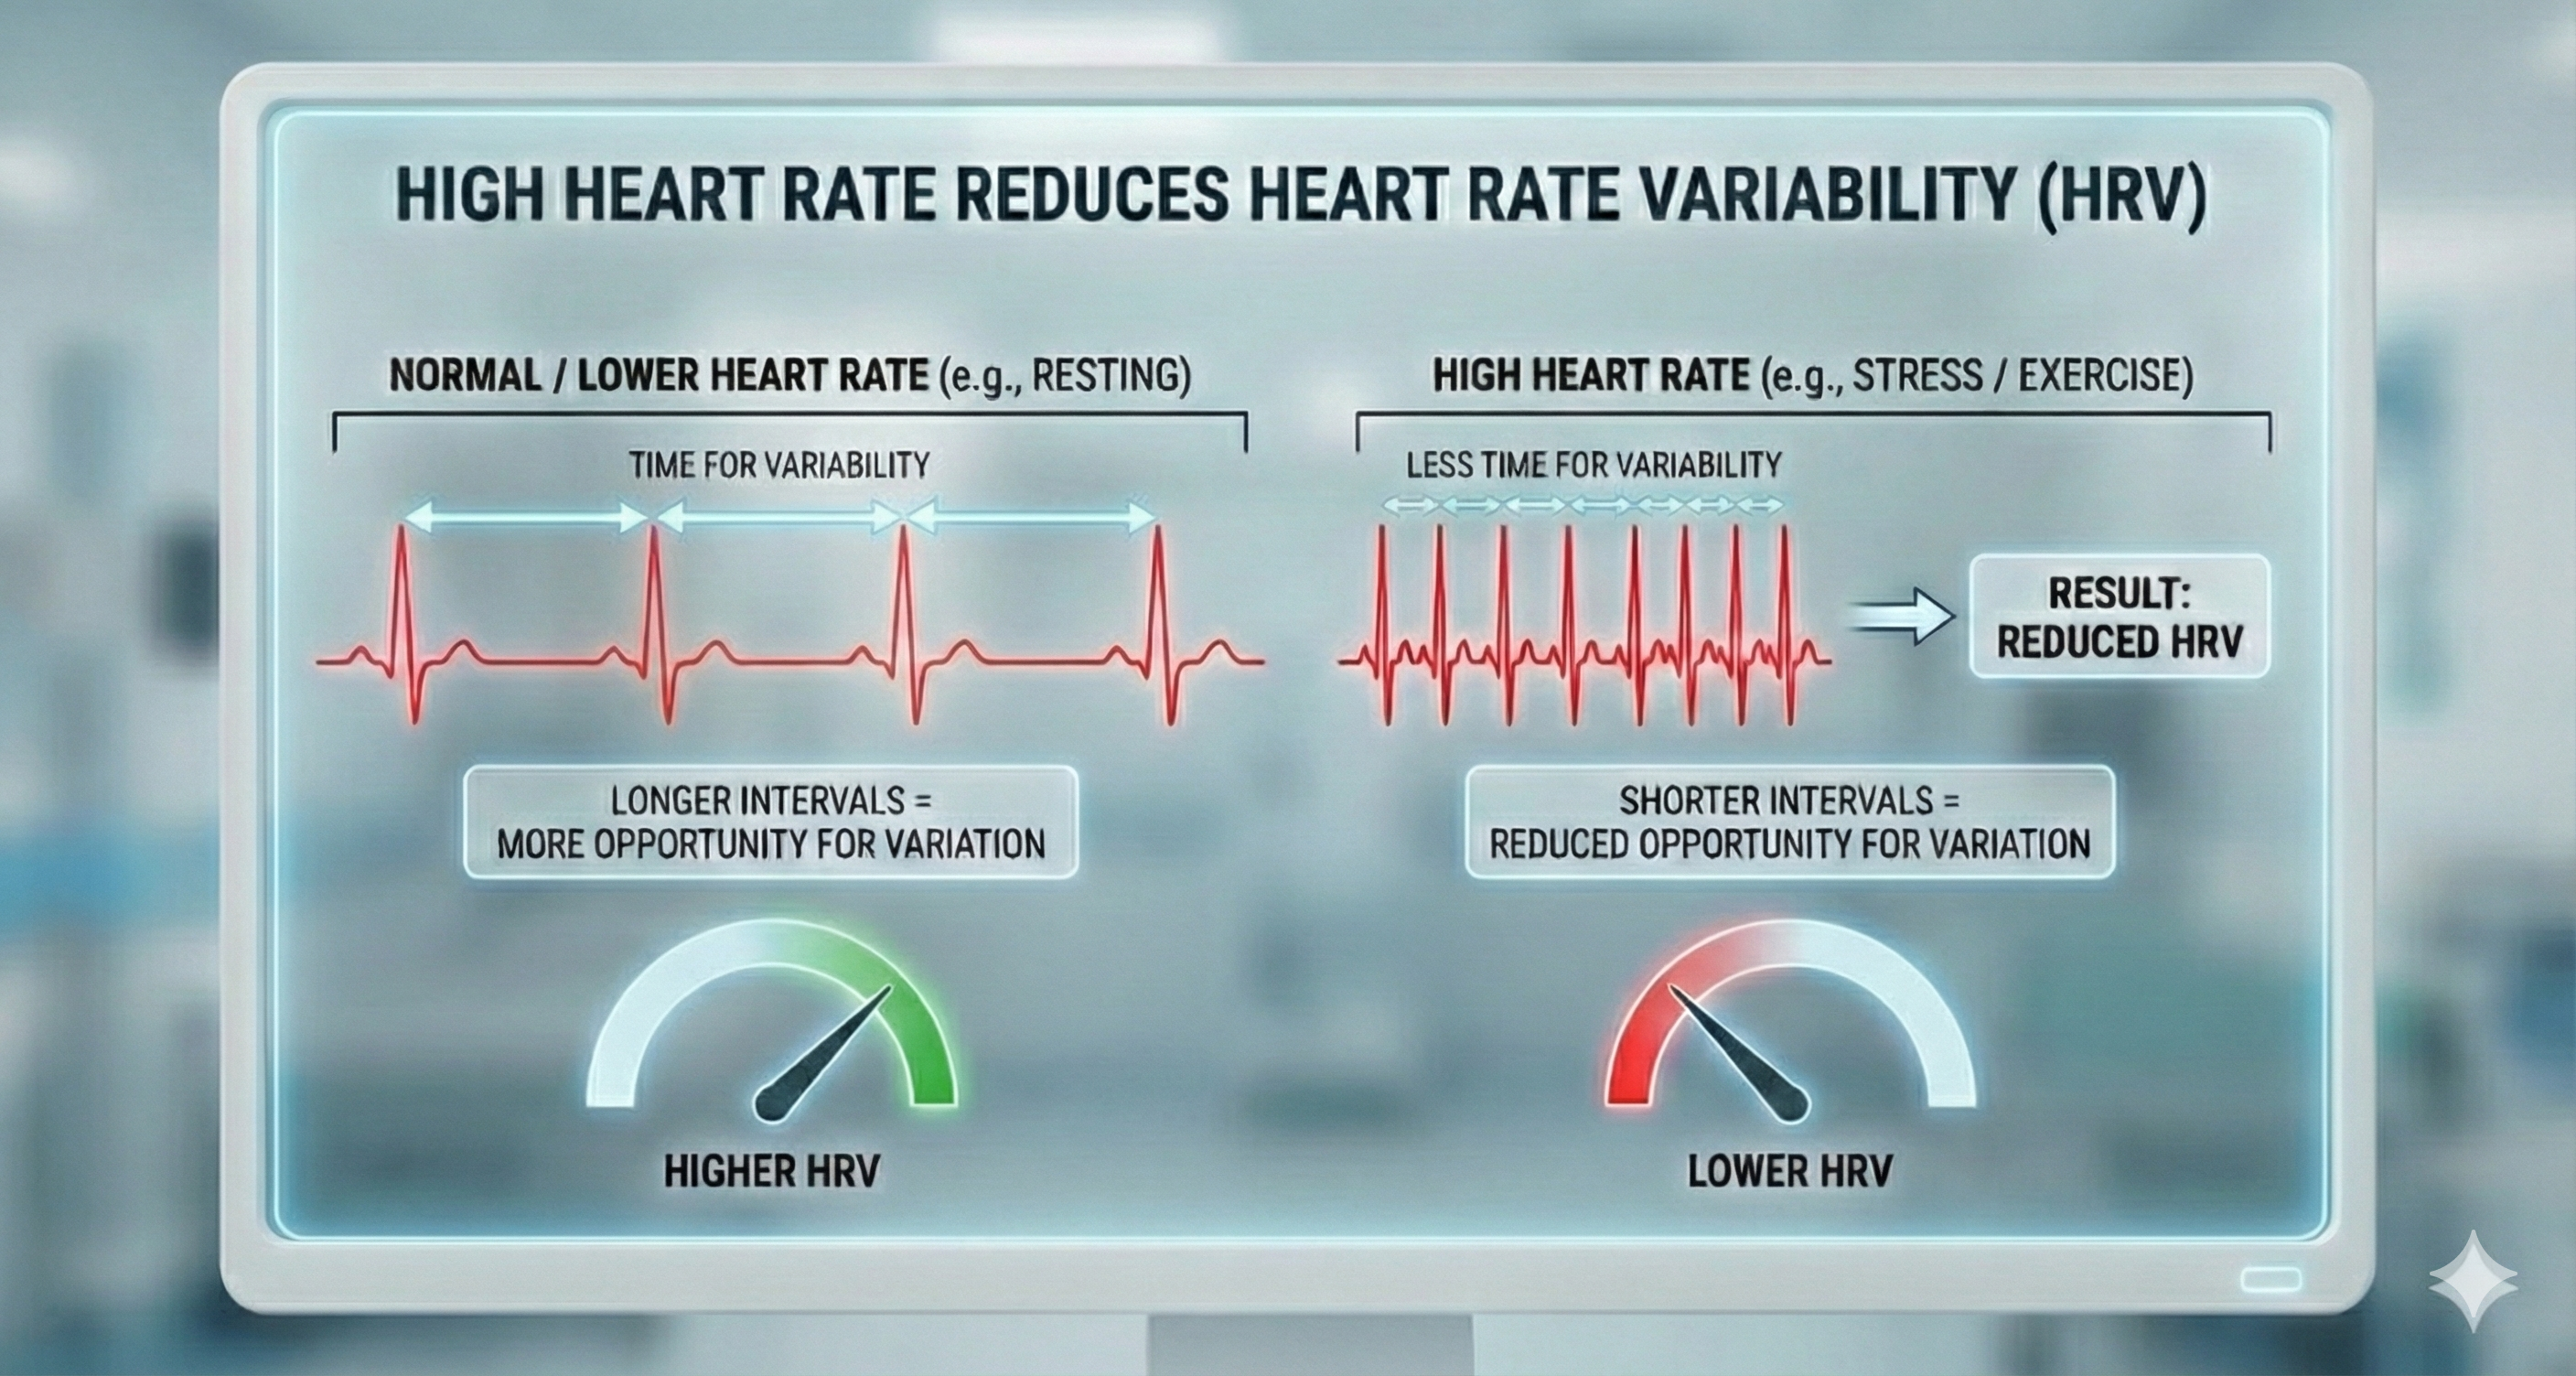
Heart rate is significant because a high rate can reduce heart rate variability. Faster HRs allow less time between successive heartbeats for HR to vary. This lowers HRV.
The heart is a four-chambered pump controlled by its electrical conduction system starting at the SA node. The cardiovascular center in the medulla integrates information from multiple sources to regulate heart rate, stroke volume, and blood vessel diameter. Autonomic control involves both sympathetic cardiac accelerator nerves (which speed the heart) and parasympathetic vagus nerves (which slow it), with the PNS predominating at rest. The parasympathetic branch acts faster than the sympathetic branch. Elevated resting heart rate is associated with increased dementia risk and limits heart rate variability.
Comprehension Questions: The Heart and Its Control
- Why does parasympathetic control predominate at rest, and what would happen if it did not?
- Explain the concept of accentuated antagonism and provide an example.
- A client has a resting heart rate of 95 bpm. What concerns might this raise, and what questions would you want to explore?
- How does the speed difference between sympathetic and parasympathetic effects relate to the body's survival needs?
Heart Rate Variability (HRV): The Rhythm of Resilience
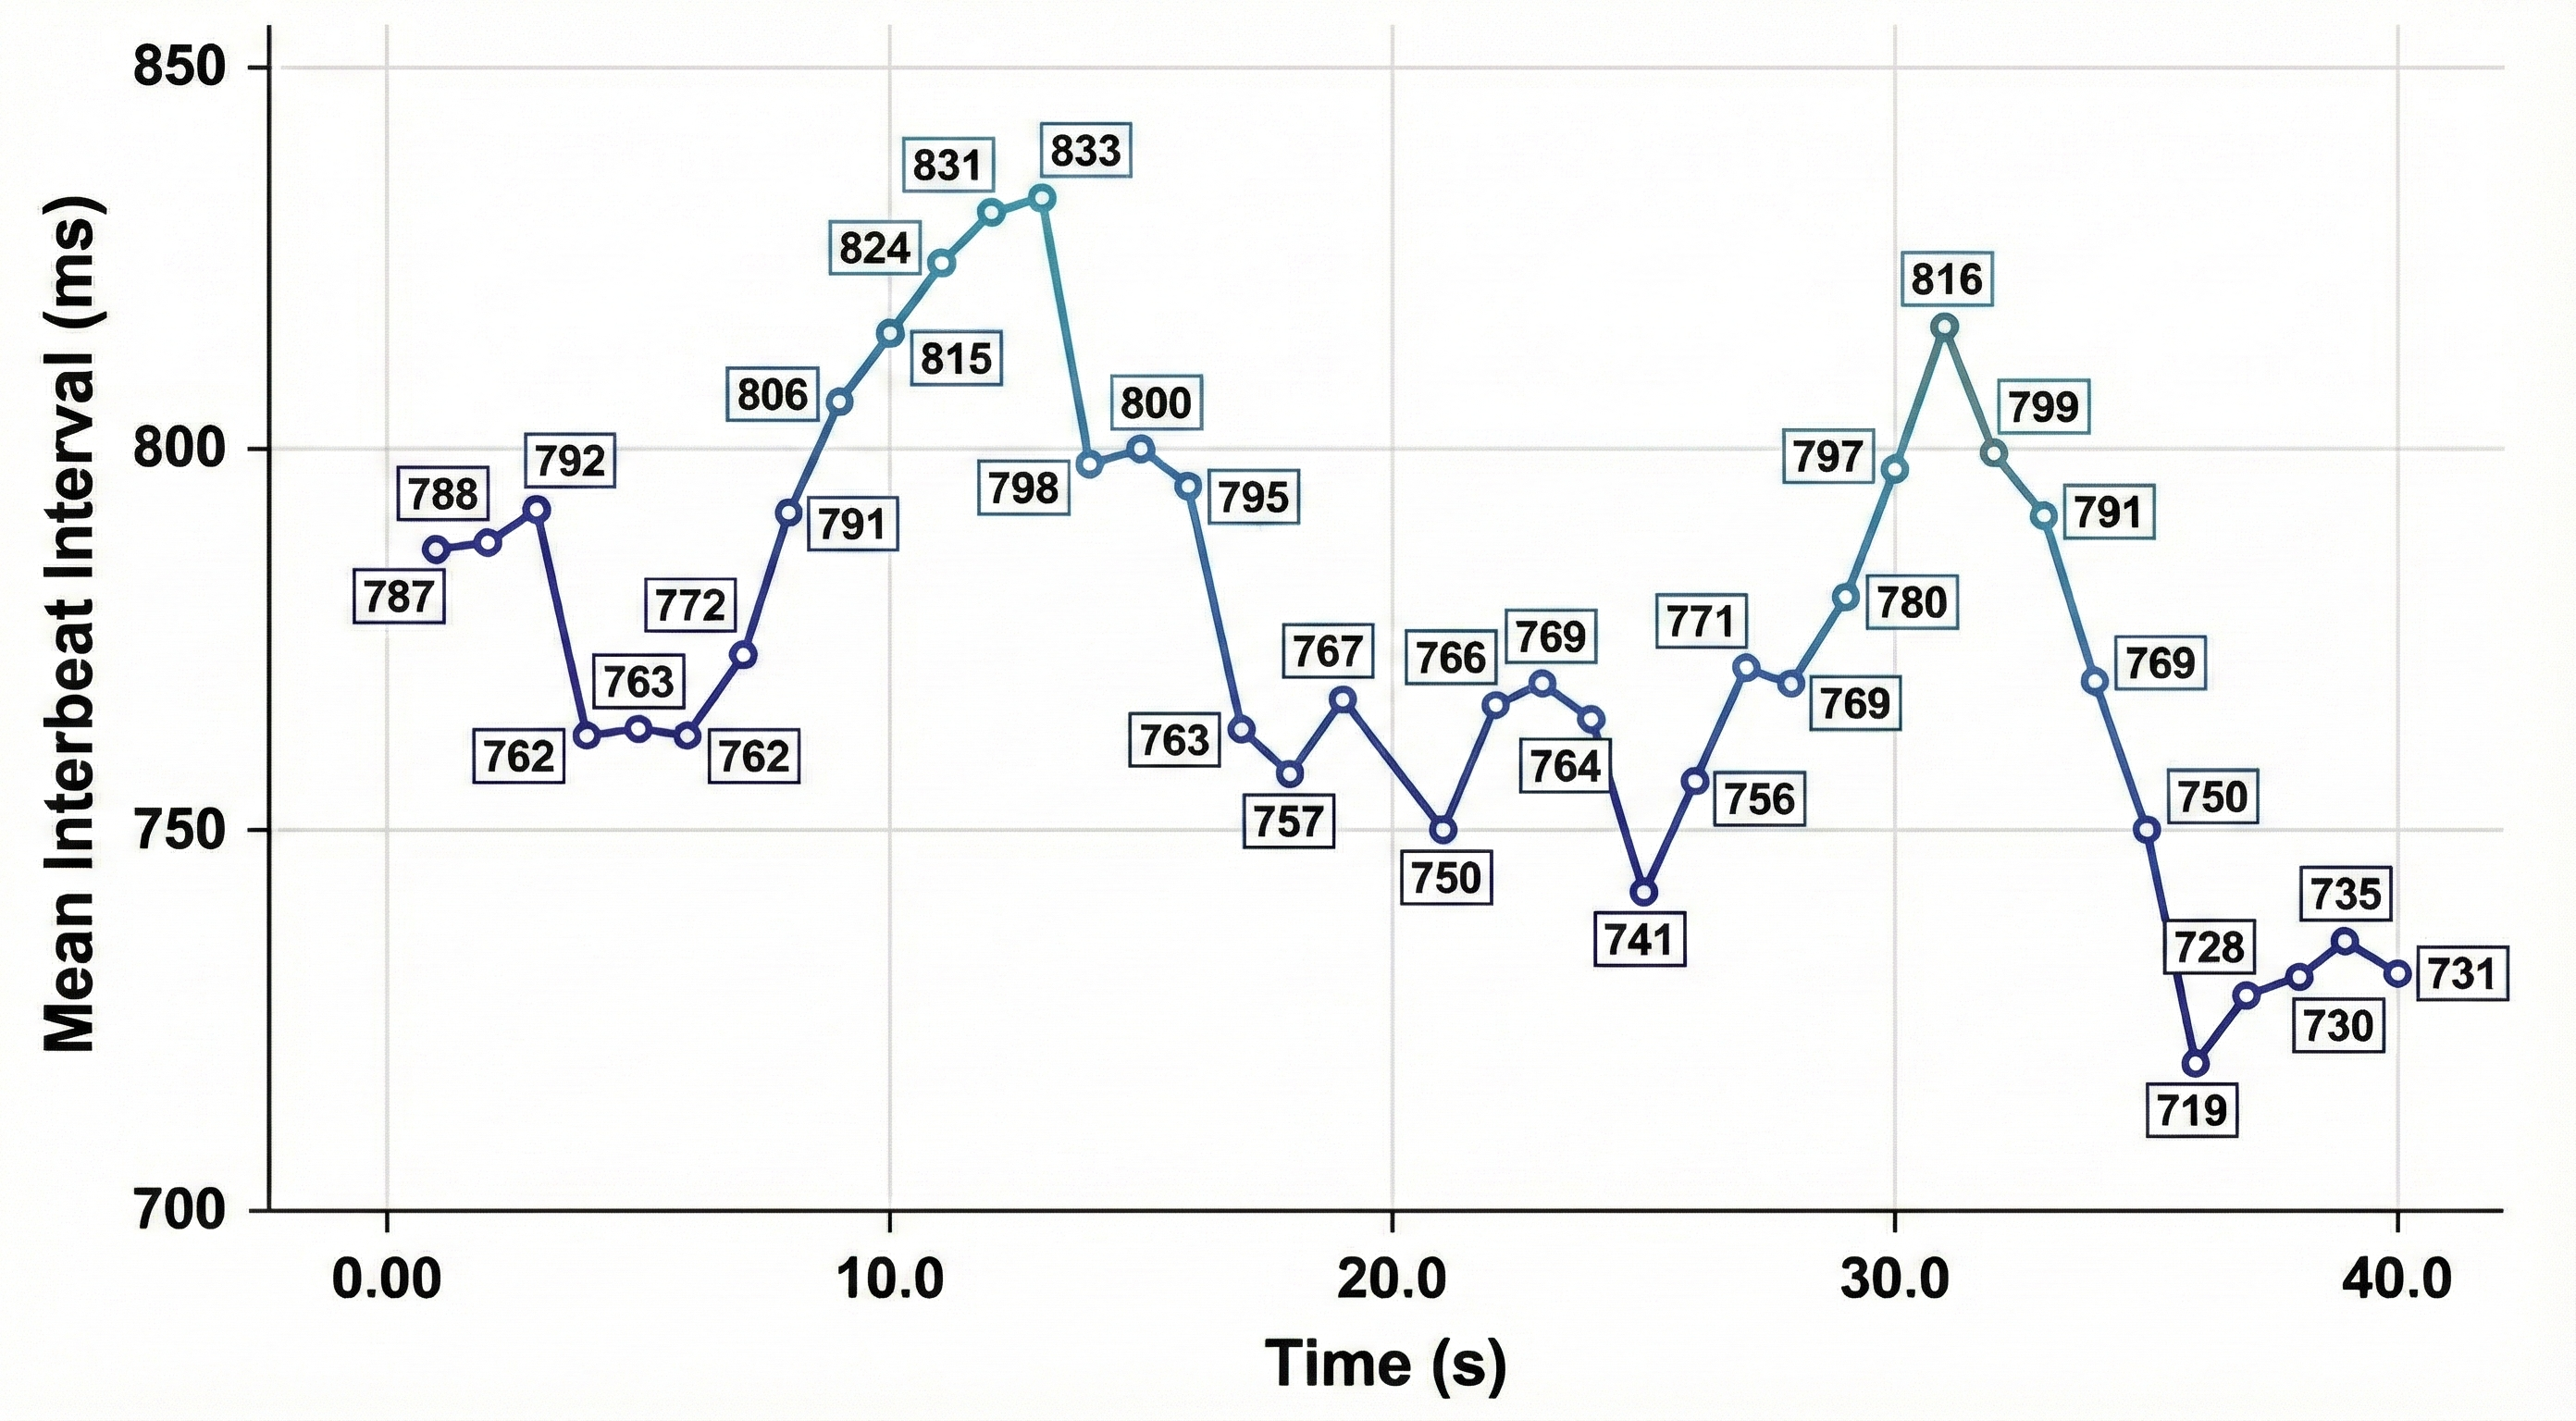
Heart rate variability (HRV) consists of changes in the time intervals between consecutive heartbeats (Task Force of the European Society of Cardiology and the North American Society of Pacing and Electrophysiology, 1996). BCIA's Biofeedback Blueprint covers HRV briefly since it offers a separate HRV Biofeedback Certification and Certificate of Completion.
🎧 Listen to a mini-lecture on a Heart Rate Variability OverviewWe measure the time intervals between successive heartbeats in milliseconds.
HRV is produced by interacting regulatory mechanisms that operate on different time scales (Moss, 2004). Circadian rhythms, core body temperature, and metabolism contribute to 24-hour HRV recordings, representing the "gold standard" for clinical HRV assessment. The parasympathetic, cardiovascular, and respiratory systems produce short-term (e.g., 5-minute) HRV measurements.
Sources of Heart Rate Variability
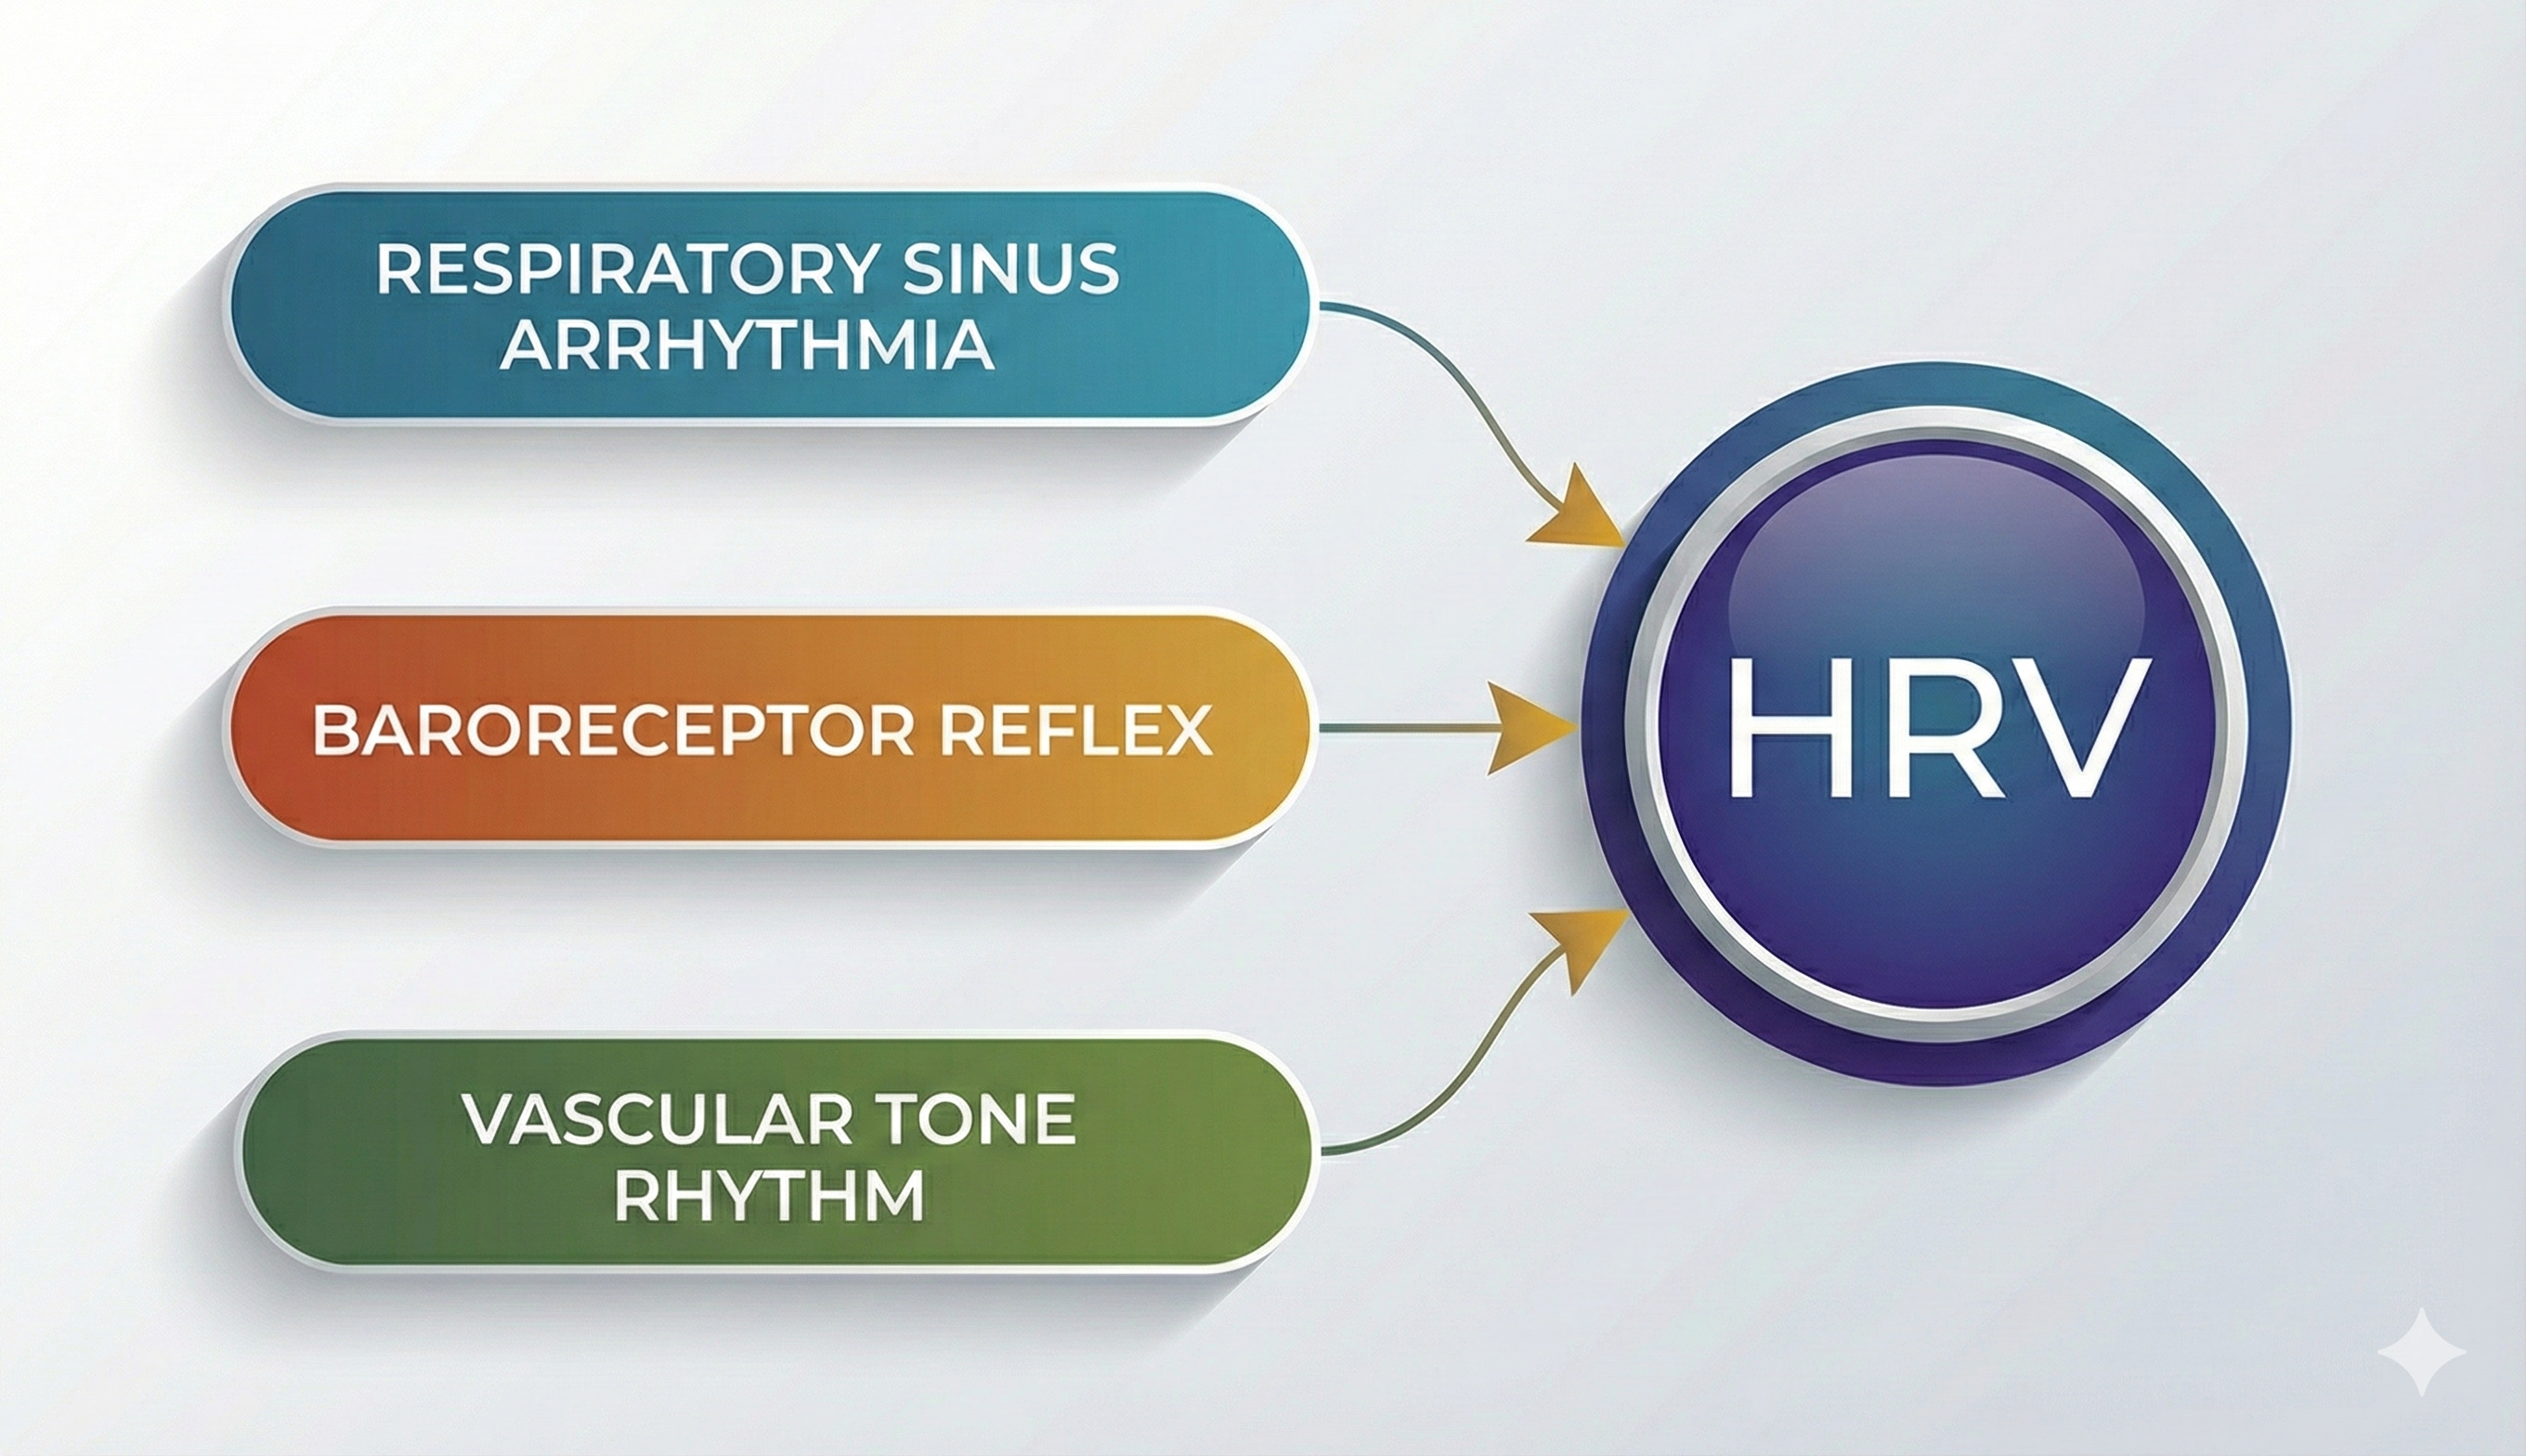
Respiratory sinus arrhythmia, the heart rate baroreflex, and the vascular tone rhythm are the primary sources of HRV, in descending order of importance (Hayano & Yuda, 2019).
 🎧 Listen to a mini-lecture on Sources of Heart Rate Variability
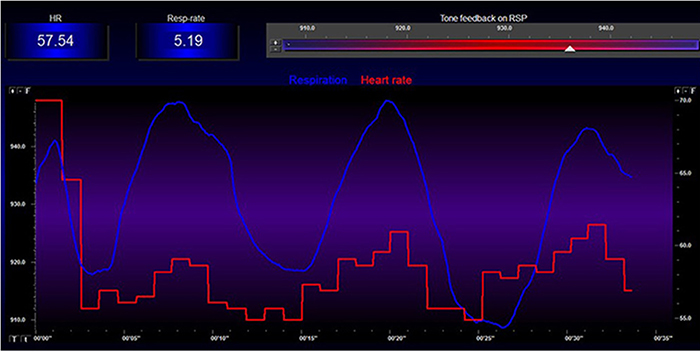
Respiratory sinus arrhythmia (RSA), heart rate speeding and slowing across each breathing cycle, is the primary and entirely parasympathetic source of HRV (Gevirtz, 2020).
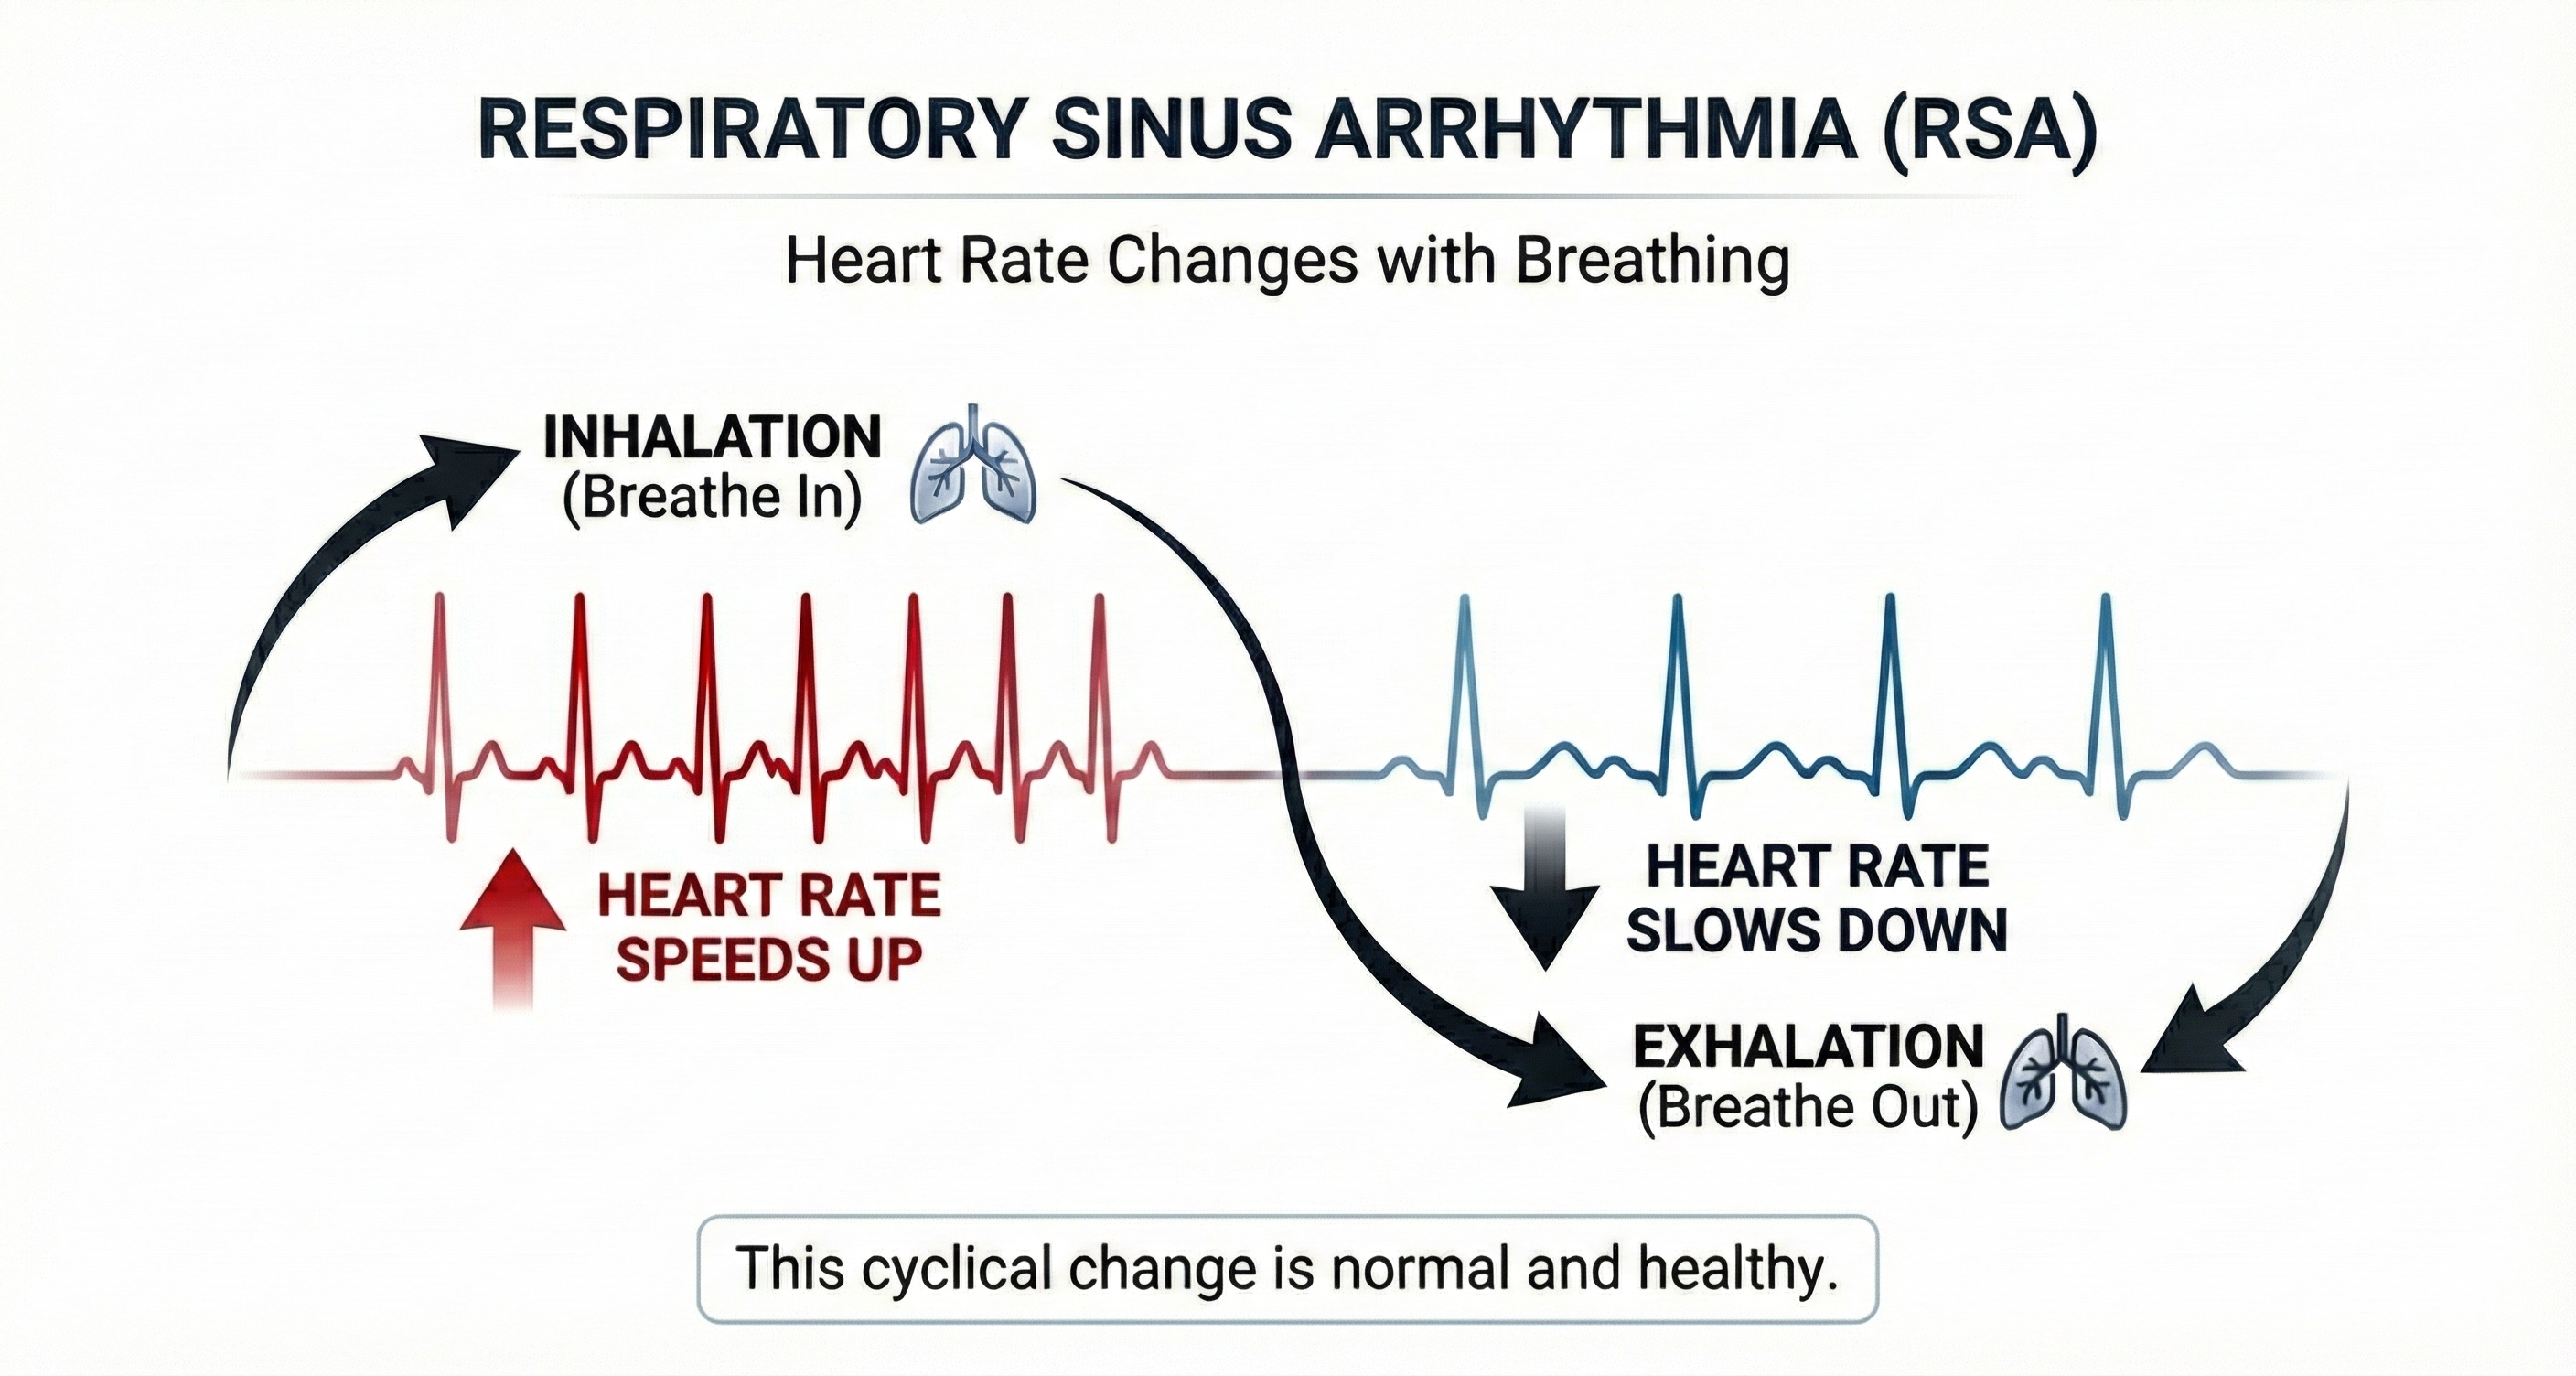
Inhalation partially disengages the vagal brake, speeding heart rate. This is purely parasympathetic.
Exhalation reapplies the vagal brake, slowing heart rate.
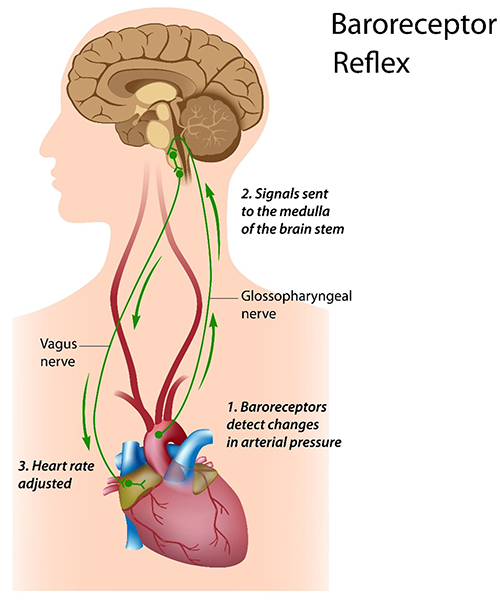
The baroreceptor reflex, which exerts homeostatic control over acute BP changes, is the second-most-important and entirely parasympathetic source of HRV (Gevirtz, 2020).
🎧 Listen to a mini-lecture on the Baroreceptor Reflex
Slow-paced breathing increases RSA by stimulating the baroreceptor system at its unique resonance frequency (~ 0.1 Hz). The resonance frequency is caused by the delay in the baroreflex (Lehrer et al., 2004). Before HRVB, respiration and the baroreflex are usually out of phase resulting in weak resonance effects.
Visualize pushing a child on a swing. A single frequency pushes the child the highest and elicits the most squeals of excitement. The best pushing rate is analogous to the resonance frequency (Khazan, 2020).

Resonance is simple physics (Lehrer, 2020). The baroreflex system exhibits resonance since it is a feedback system with a fixed delay. Inertia due to blood volume in the vascular tree accounts for most of this delay.
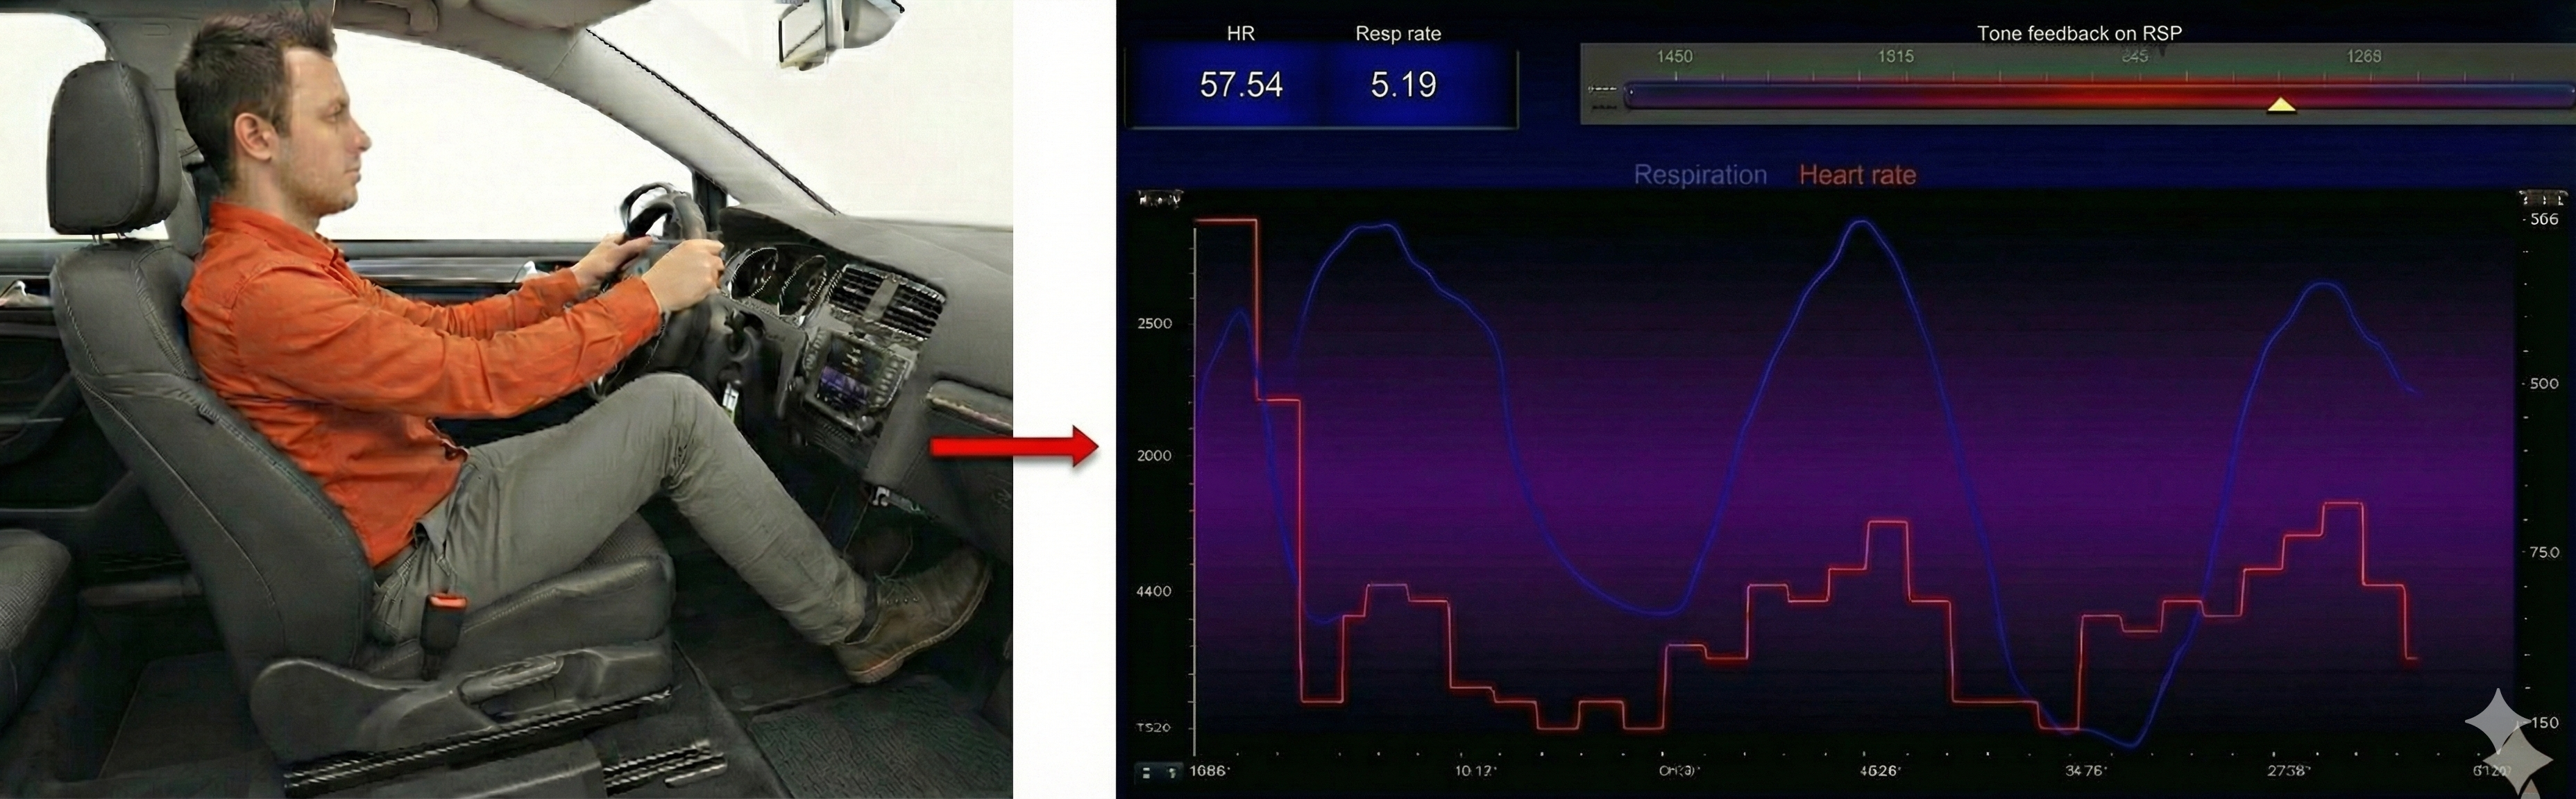
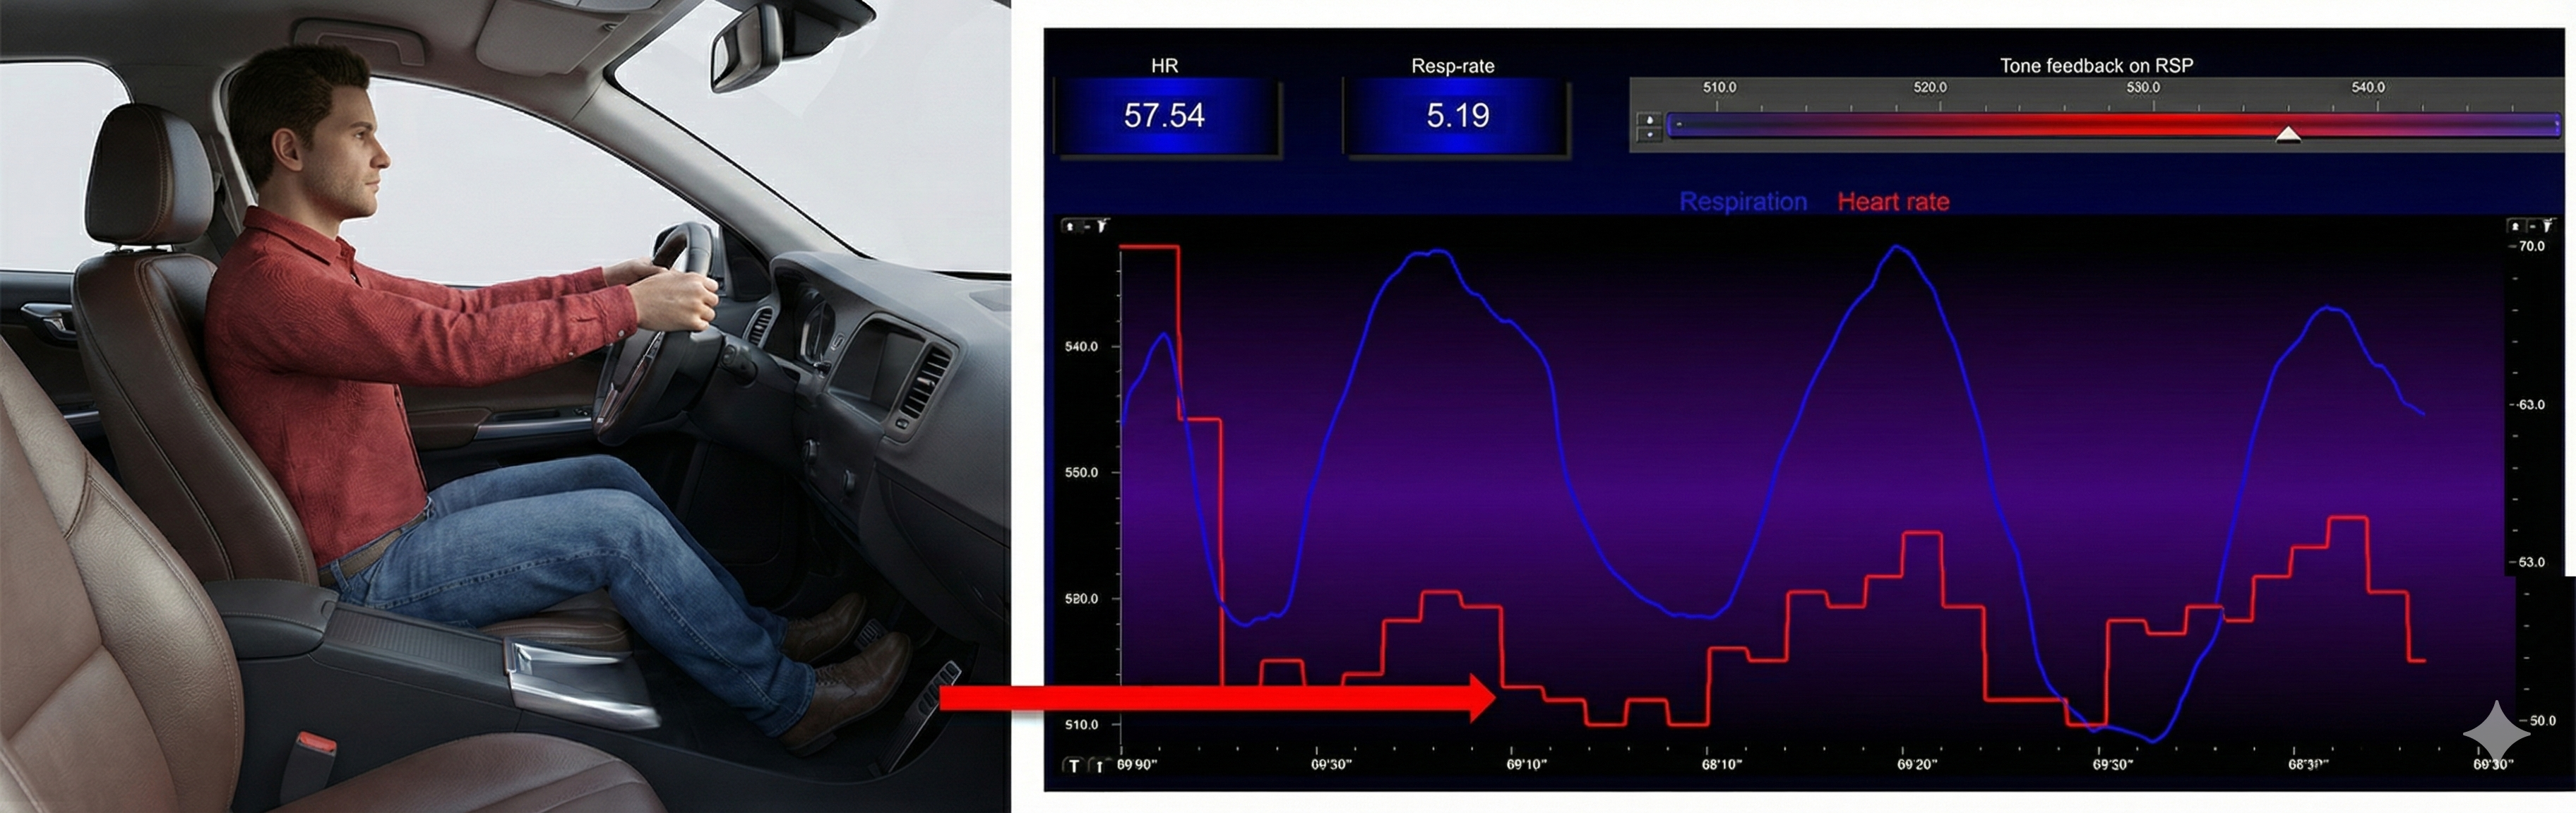
🎧 Listen to a mini-lecture on ResonanceWhen clients breathe at their resonance frequency, heart rate and respiration are in perfect phase (0°); their peaks and valleys coincide.
🎧 Listen to a mini-lecture on the Resonance Frequency
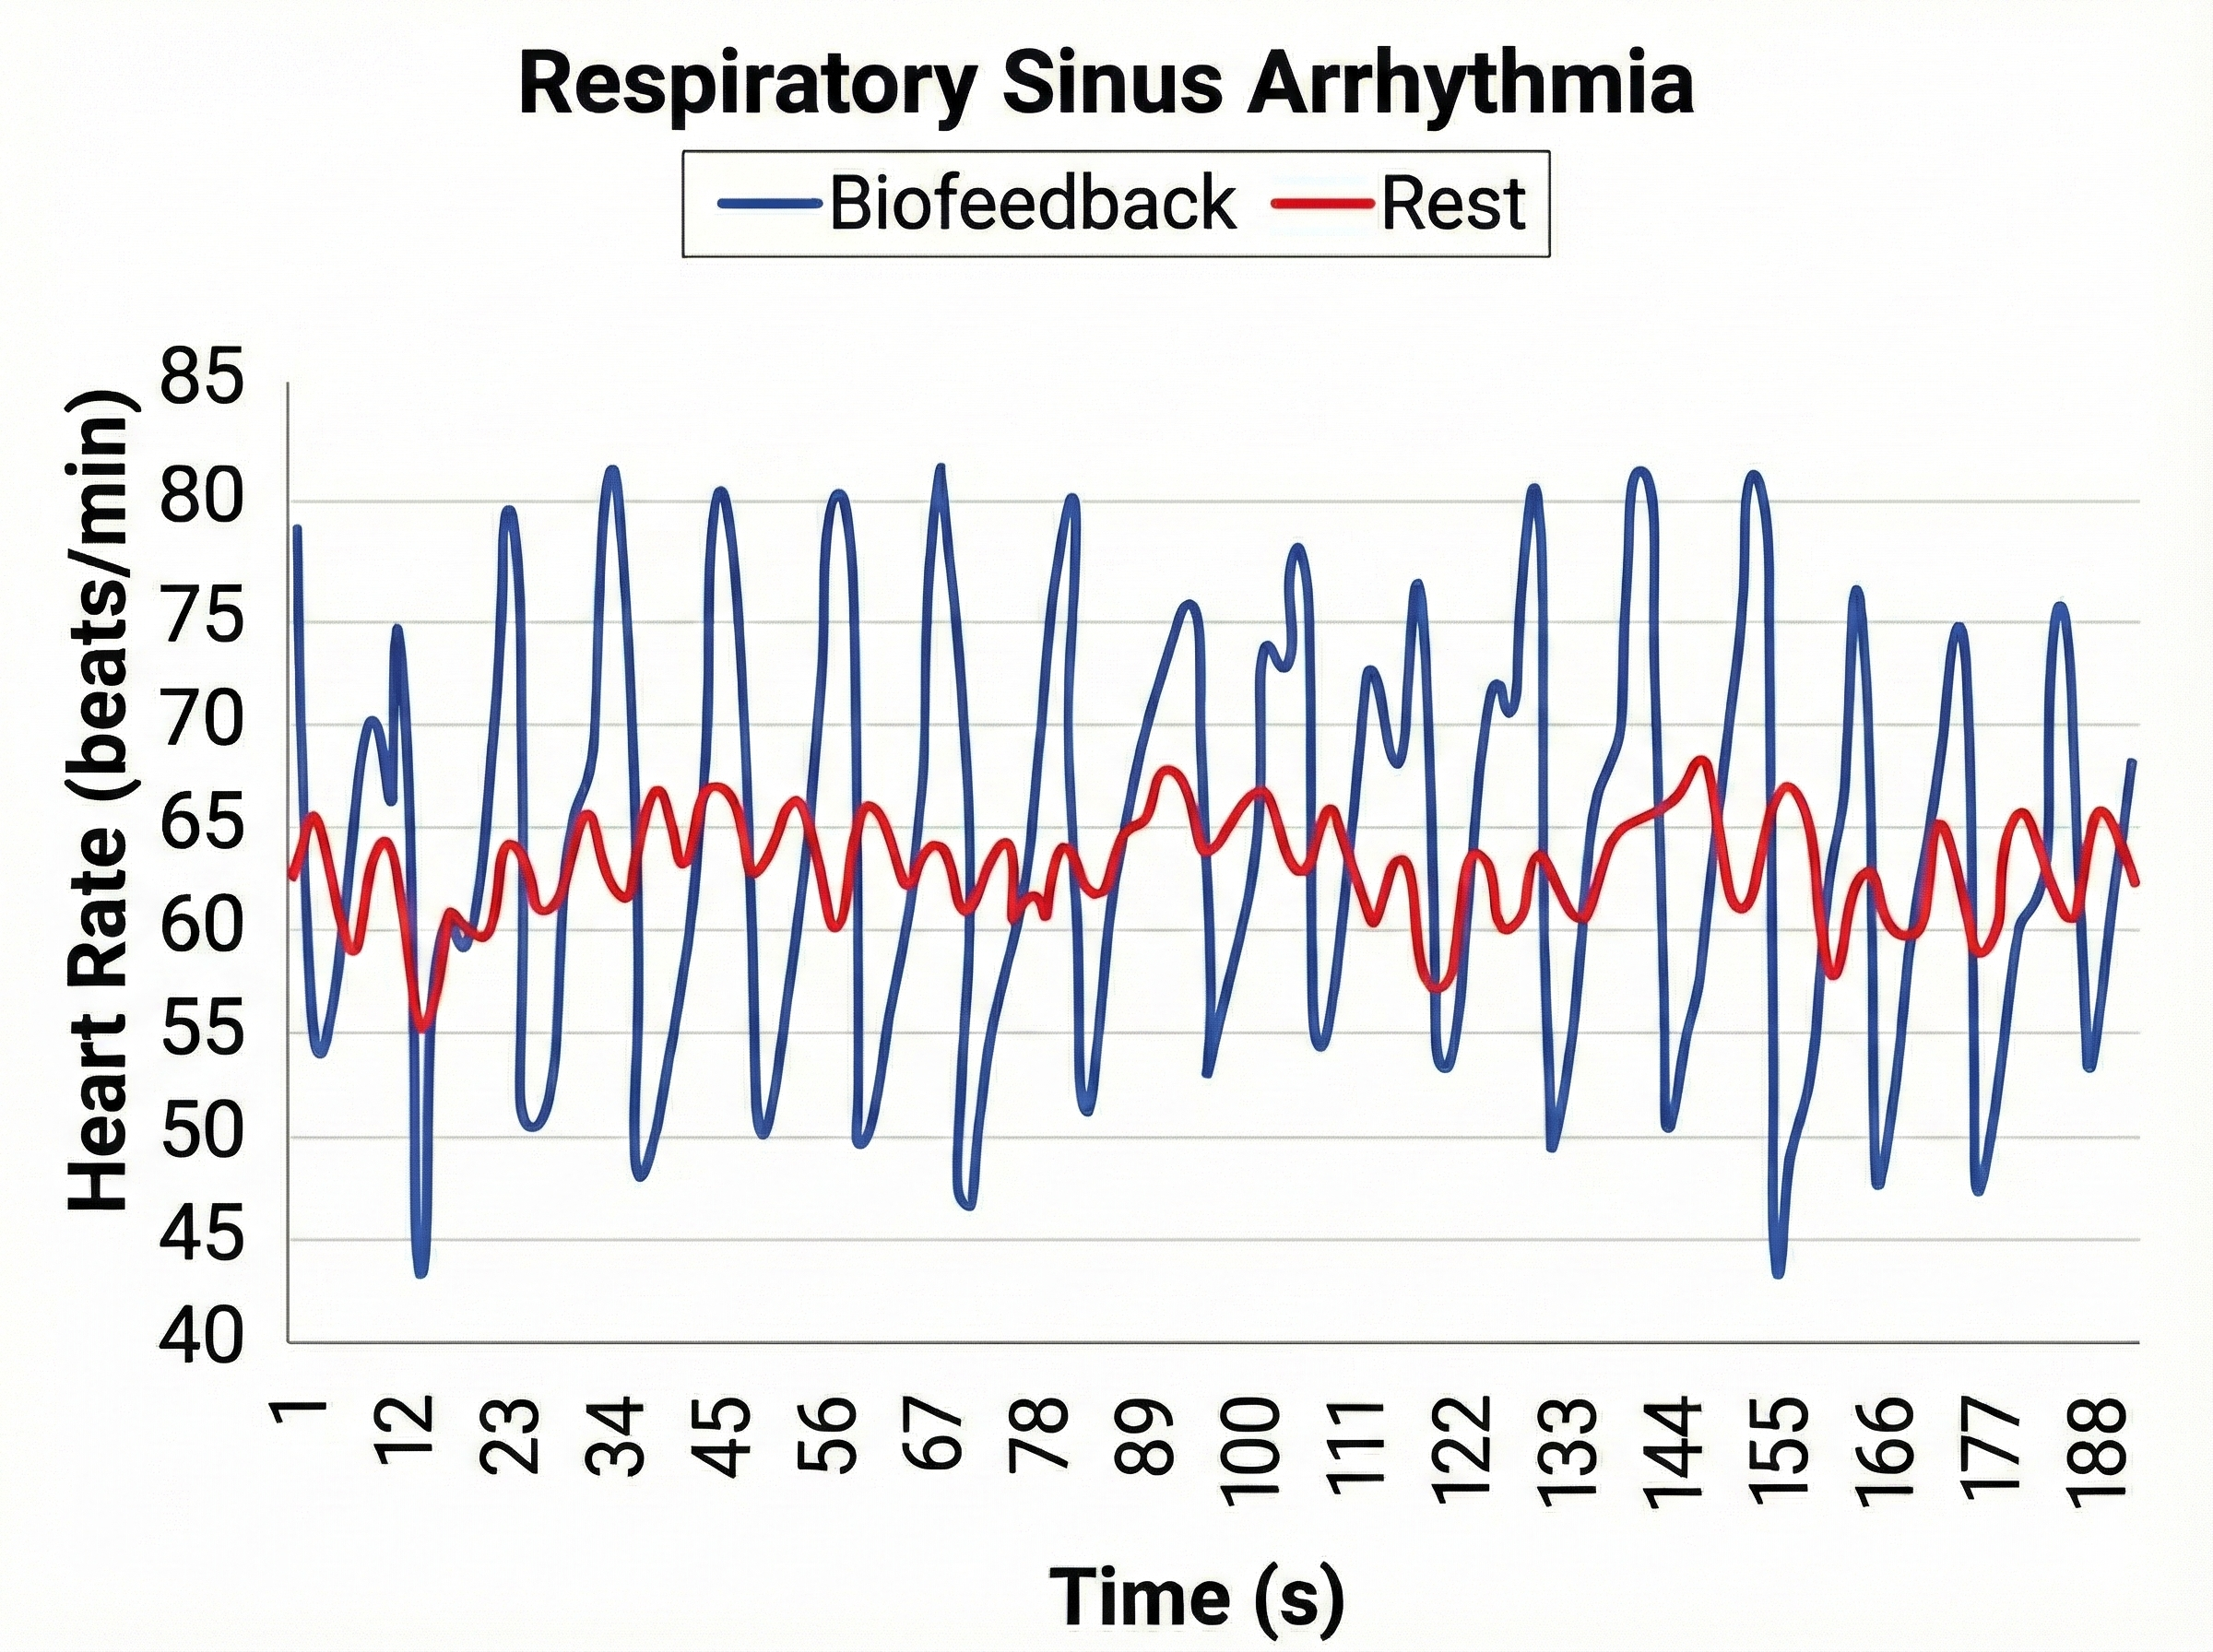
Slowing breathing to rates between 4.5-6.5 bpm for adults and 6.5-9.5 bpm for children increases RSA (Lehrer & Gevirtz, 2014). Increased RSA immediately "exercises" the baroreflex without changing vagal tone or tightening BP regulation. Those changes require weeks of practice. HRV biofeedback can increase RSA 4-10 times compared to rest (Lehrer et al., 2020b; Vaschillo et al., 2002).
🎧 Listen to a mini-lecture on Increased Respiratory Sinus Arrhythmia
Why Is Heart Rate Variability Important?
A healthy heart is not a metronome. When the time intervals between heartbeats significantly change across successive breathing cycles, this shows that the cardiovascular center can effectively modulate vagal tone.
🎧 Listen to a mini-lecture on Why Is Heart Rate Variability Important?
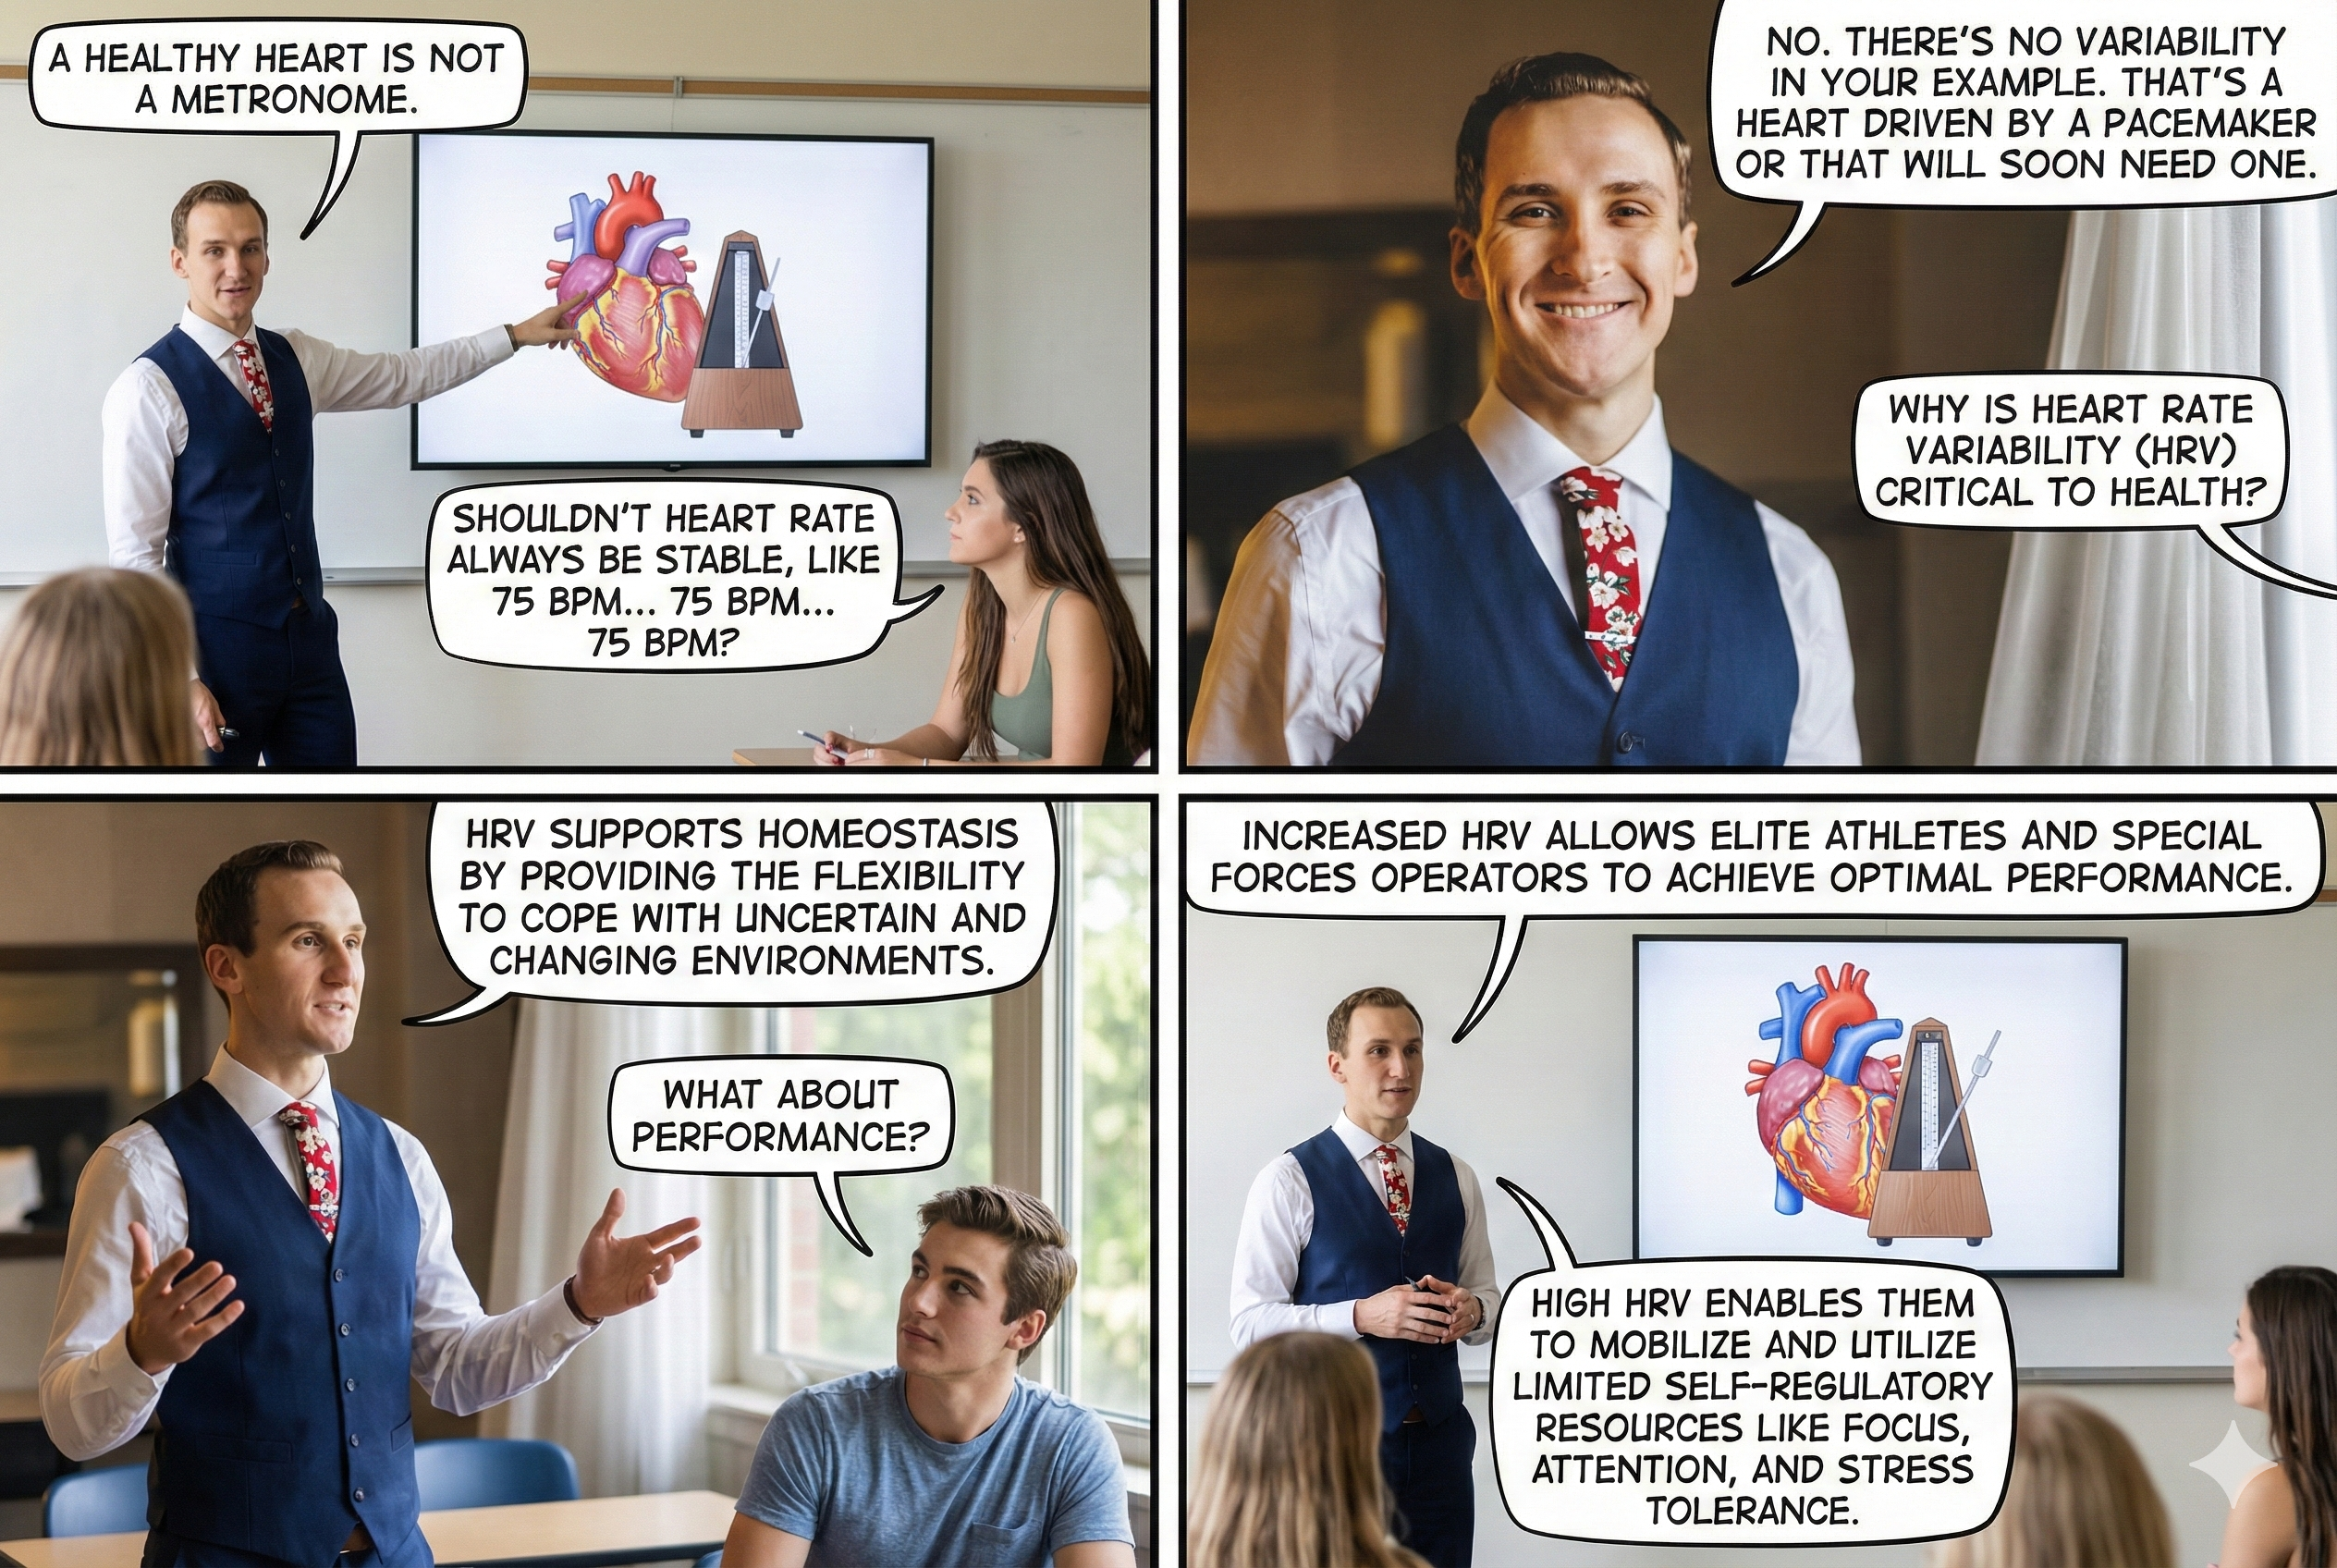
"The complexity of a healthy heart rhythm is critical to the maintenance of homeostasis because it provides the flexibility to cope with an uncertain and changing environment...HRV metrics are important because they are associated with regulatory capacity, health, and performance and can predict morbidity and mortality" (Shaffer, Meehan, & Zerr, 2020).
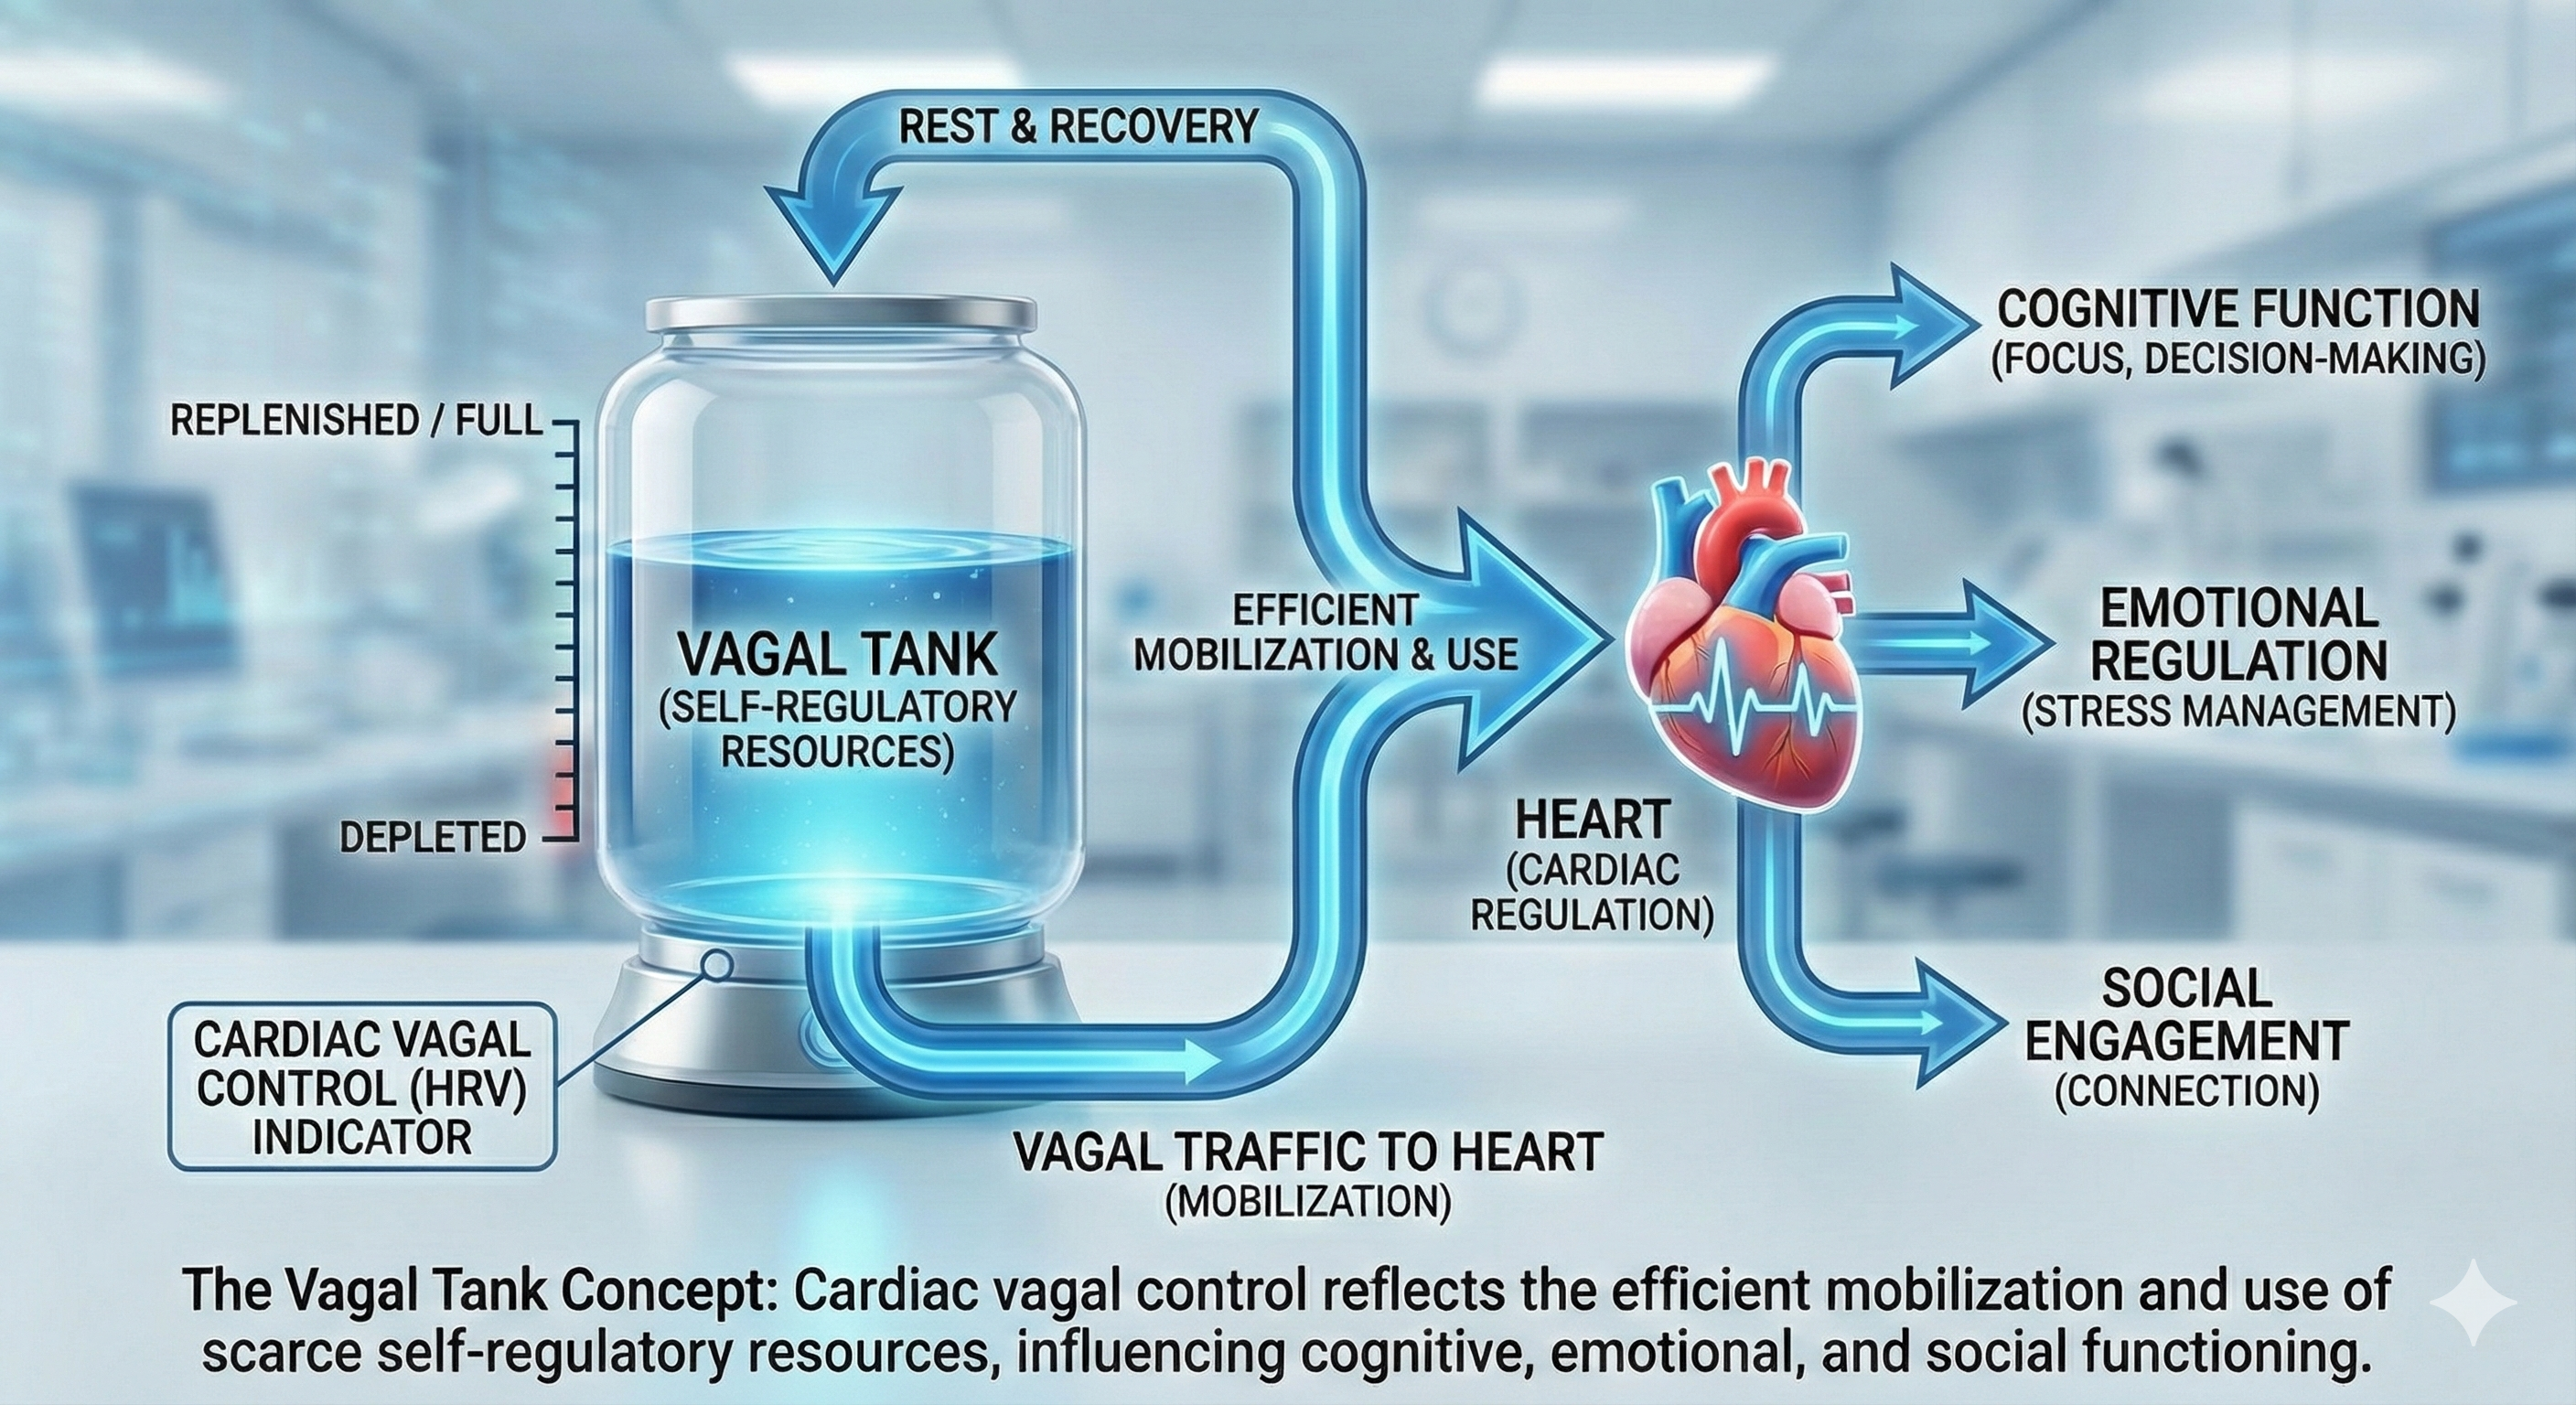
Vagal tank theory (Laborde et al., 2018) argues that vagal traffic to the heart indicates how efficiently we mobilize and use scarce self-regulatory resources.
Heart rate variability biofeedback is extensively used to treat various disorders (e.g., asthma and depression) and enhance performance in various contexts (e.g., sports; Gevirtz, 2013; Lehrer et al., 2020a; Tan et al., 2016).
Lehrer et al. (2020) observed that "HRVB has the largest effect sizes on anxiety, depression, anger, and athletic/artistic performance and the smallest effect sizes on PTSD, sleep, and quality of life" (p. 109).
Reduced HRV Is Associated with Disease and Loss of Adaptability
In the early 1960s, researchers found that changes in HRV preceded fetal distress (Hon & Lee, 1963).
🎧 Listen to a mini-lecture on Reduced HRV Is Associated with Disease and Loss of AdaptabilityReduced HRV is associated with vulnerability to physical and psychological stressors and disease (Lehrer, 2007). Prospective studies have shown that decreased HRV is the strongest independent predictor for the progression of coronary atherosclerosis (McCraty & Shaffer, 2015).
Low HRV is a marker for cardiovascular disorders, including hypertension, especially with left ventricular hypertrophy; ventricular arrhythmia; chronic heart failure; and ischemic heart disease (Bigger et al., 1995; Casolo et al., 1989; Maver, Strucl, & Accetto, 2004; Nolan et al., 1992; Roach et al., 2004). Low HRV predicts sudden cardiac death, especially due to arrhythmia following myocardial infarction and post-heart attack survival (Bigger et al., 1993; Bigger et al., 1992; Kleiger et al., 1987).
Reduced HRV may predict disease and mortality because it indexes reduced regulatory capacity, which is the ability to surmount challenges like exercise and stressors. Patient age may be an essential link between reduced HRV and regulatory capacity since both HRV and nervous system function decline with age (Shaffer, McCraty, & Zerr, 2014).
Heart-Brain Interactions: The Two-Way Street
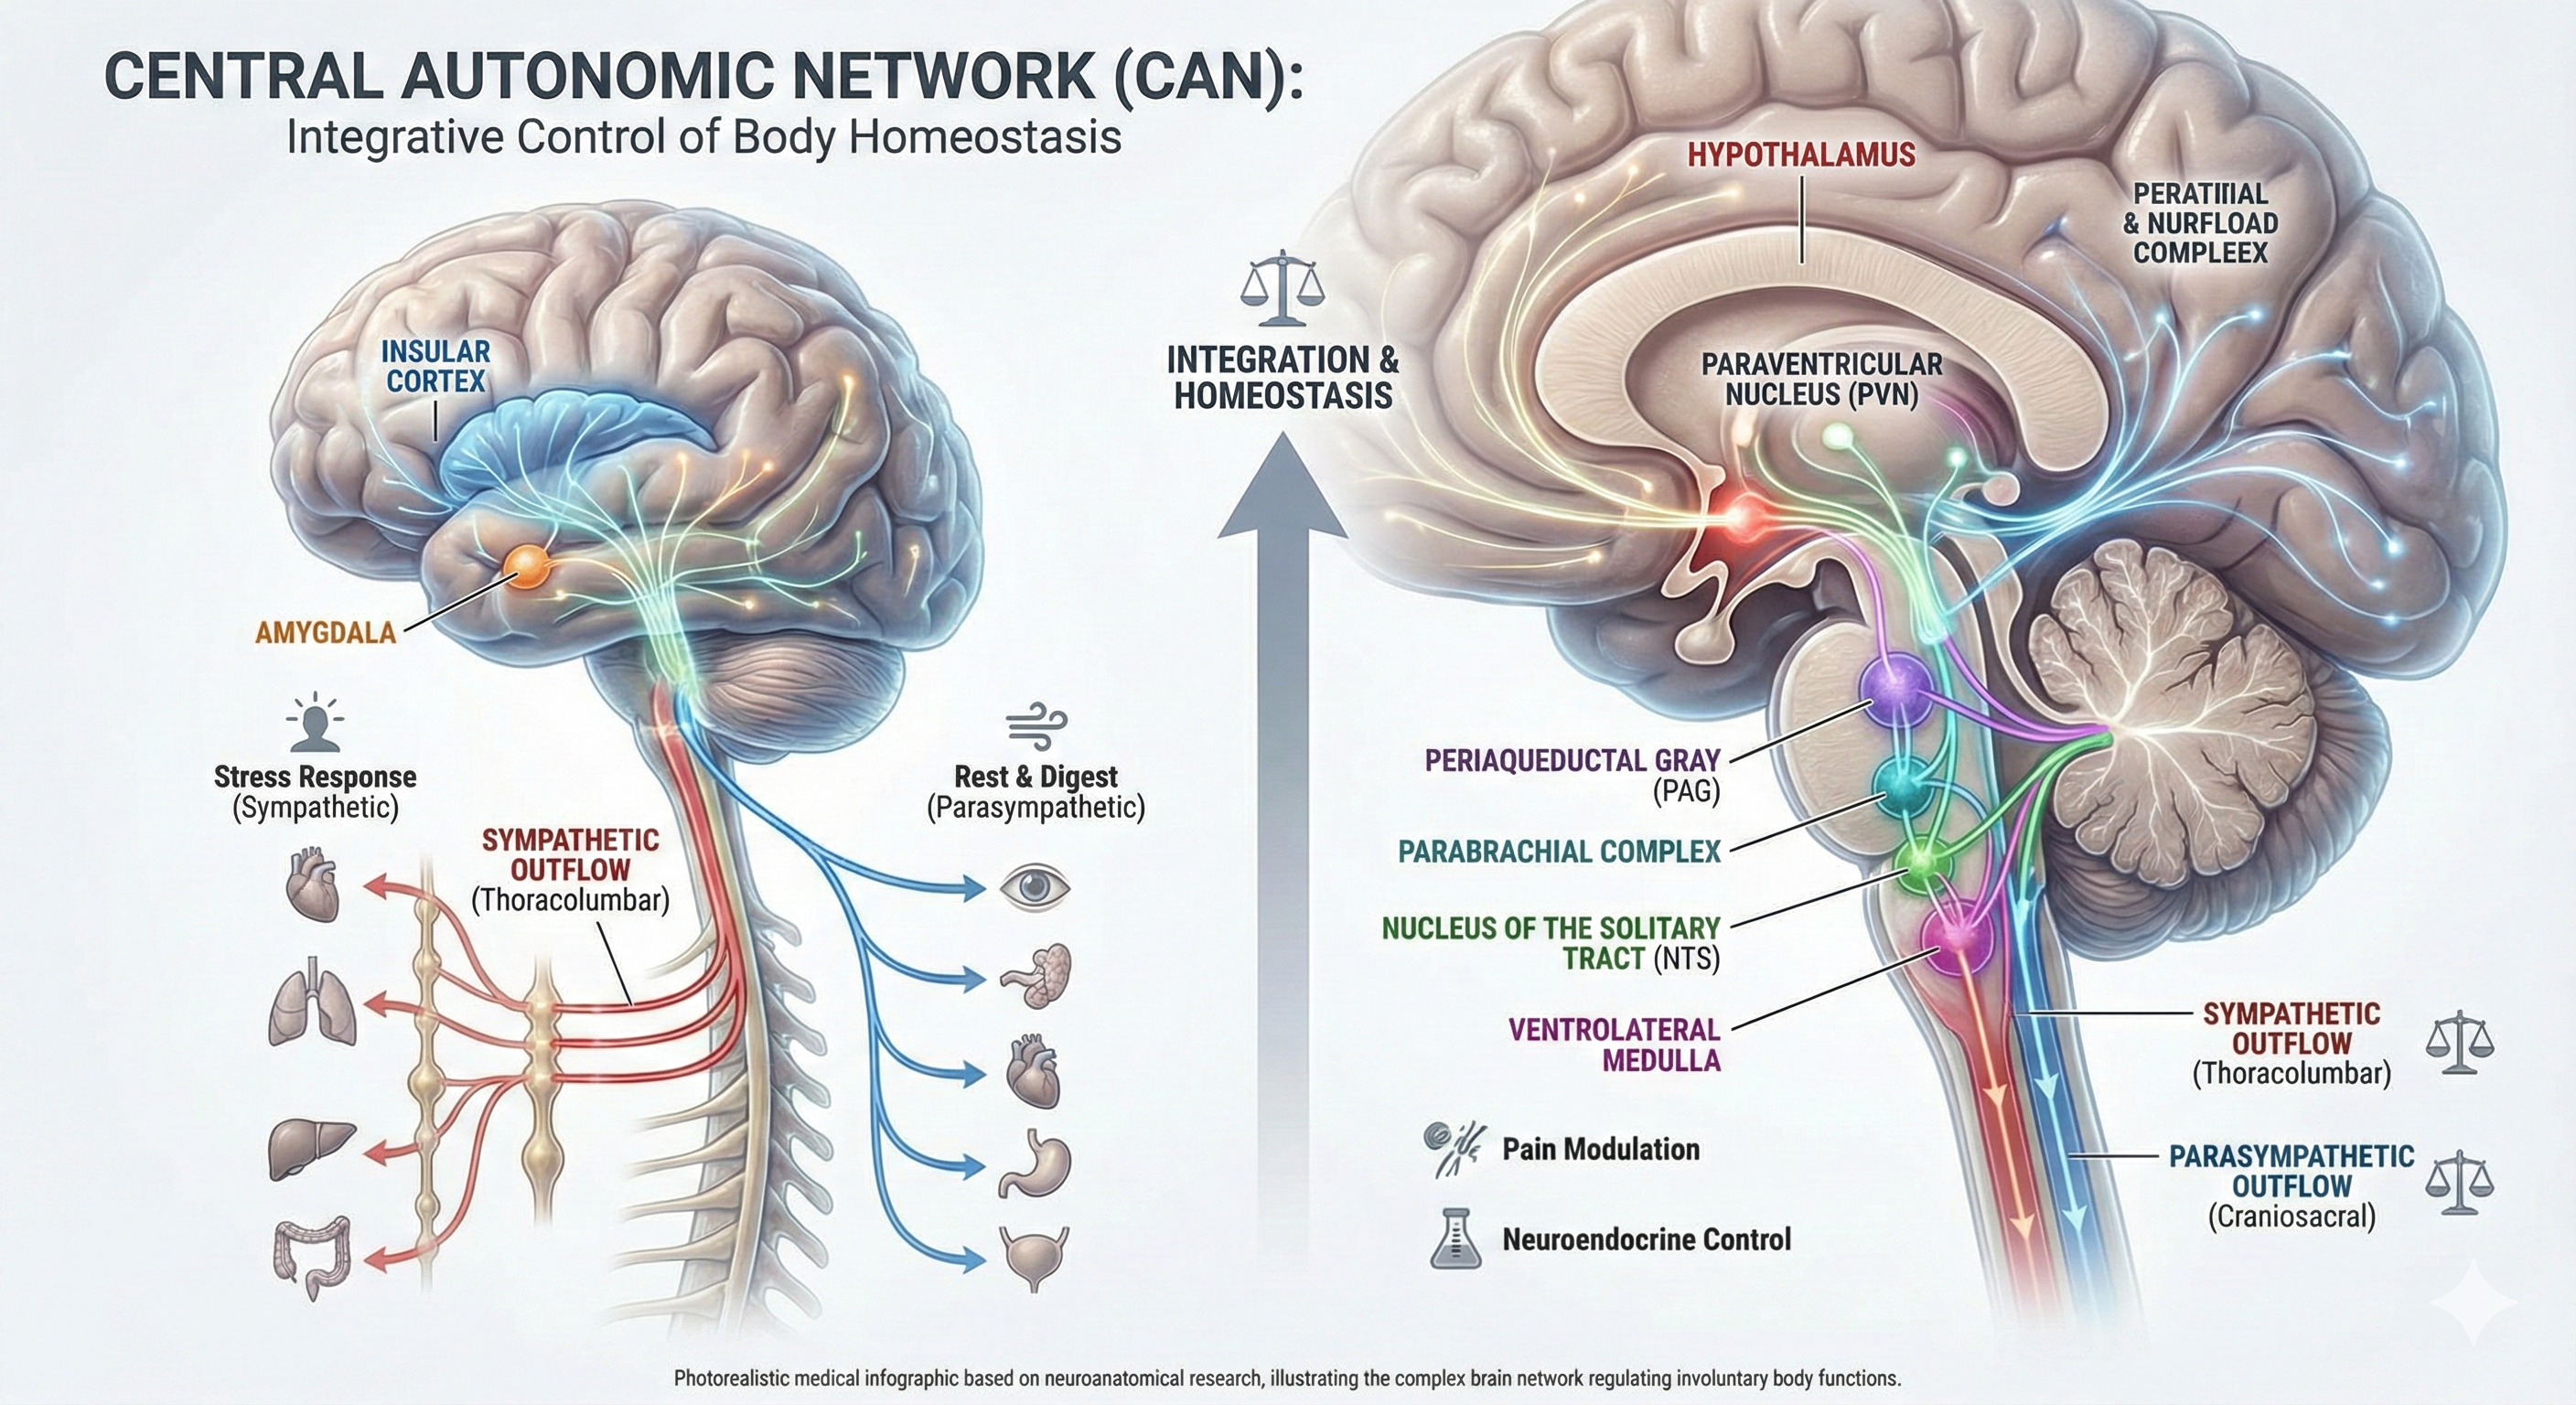
Thayer and Lane (2000) outline a neurovisceral integration model that describes how a central autonomic network (CAN) that links the brainstem NST with forebrain structures (including the anterior cingulate, insula, and ventromedial prefrontal cortex, and the amygdala and hypothalamus) through feedback and feed-forward loops.
Shaffer, McCraty, and Zerr (2014) propose that interconnected cardiac ganglia create an intrinsic nervous system within the heart that influences the S-A and A-V node pacemakers and forms reciprocal connections with the extrinsic cardiac ganglia found in the chest cavity and the medulla. The sensory, interconnecting, afferent, and motor neurons within the heart can function independently and constitute a "little brain" on the mammalian heart.
🎧 Listen to a mini-lecture on Heart-Brain Interactions
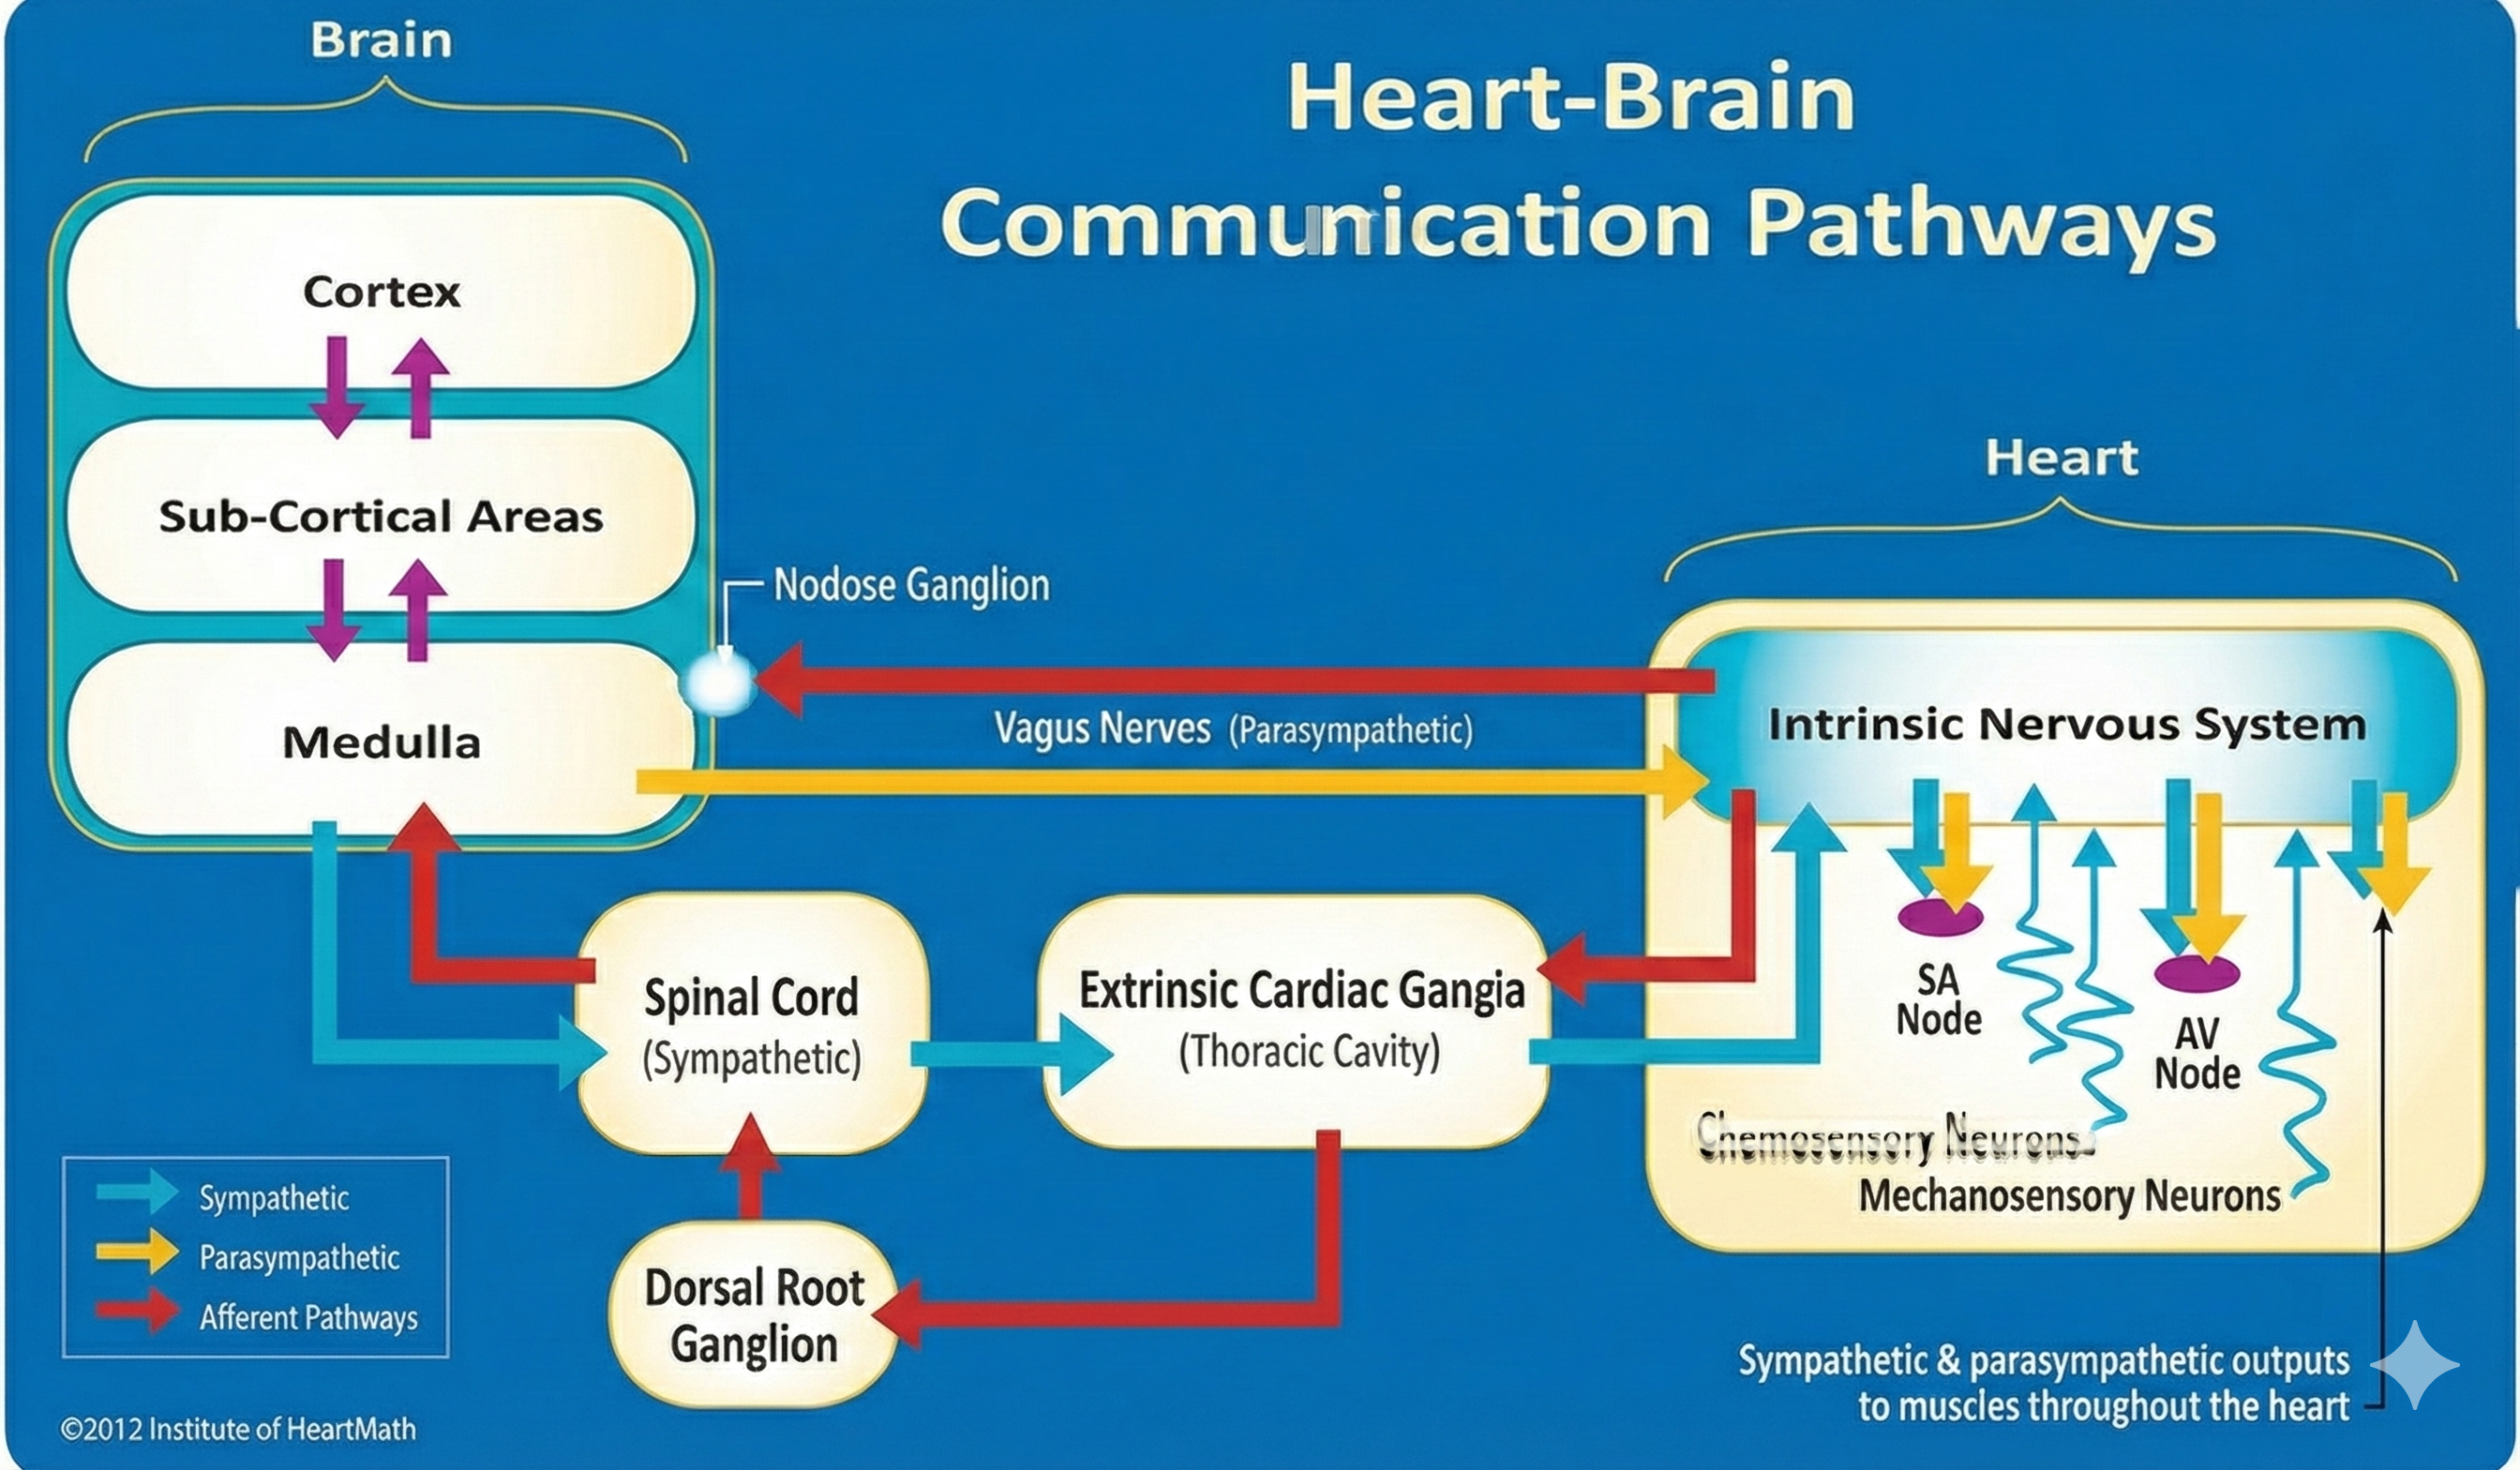
The ascending afferent nerves help to regulate the heart and its rhythms physiologically and influence efferent SNS and PNS activity. From 85-90% of vagus nerve fibers are afferents and more afferents from the heart target the brain than any other major organ.
Heart rate variability reflects the healthy fluctuation between heartbeats produced mainly by respiratory sinus arrhythmia and the baroreceptor reflex. HRV biofeedback trains clients to breathe at their resonance frequency (around 6 breaths per minute for most adults), which aligns respiration with baroreflex timing and can increase RSA 4-10 times above baseline. A healthy heart is not a metronome; complexity in cardiac oscillations indicates regulatory capacity and adaptability. Reduced HRV is associated with cardiovascular disease, depression, anxiety, and increased mortality. The heart-brain connection is bidirectional, with 85-90% of vagus nerve fibers carrying information from the heart to the brain.
Comprehension Questions: Heart Rate Variability
- Explain the "child on a swing" analogy and what it teaches about resonance frequency breathing.
- Why is HRV considered a marker for both disease and adaptability? What is the connection between these two concepts?
- A client asks why their heart should be variable rather than steady like a clock. How would you explain this?
- According to vagal tank theory, what does cardiac vagal control indicate about self-regulation?
- How might resonance frequency breathing affect heart-brain communication, based on the MacKinnon et al. (2013) findings?
Cutting-Edge Topics in Cardiovascular Biofeedback
Wearable HRV Technology: From the Clinic to Daily Life
The world of HRV monitoring has undergone a remarkable transformation. What once required expensive laboratory equipment and trained technicians can now be tracked by a device on your wrist or a sensor clipped to your ear. Consumer-grade wearable devices like smartwatches, chest straps, and ring sensors are increasingly being used not just by athletes optimizing performance, but by everyday people interested in understanding their stress levels and recovery patterns.
This democratization of HRV measurement raises both exciting possibilities and important cautions for clinicians. On the positive side, clients can now collect weeks or months of real-world data that would be impossible to gather in clinical settings. They can see how their HRV responds to specific stressors, track the impact of their breathing practice over time, and identify patterns that might never emerge during a single office visit.
However, the accuracy of consumer devices varies considerably. Photoplethysmography (PPG) sensors in wrist-worn devices can produce artifacts from movement, skin tone variations, and poor sensor contact (Shaffer, Meehan, & Zerr, 2020). Clinicians working with client-generated HRV data should understand these limitations and help clients interpret trends rather than fixating on single values. The most reliable consumer-grade measurements typically come from chest strap monitors or devices that sample during consistent conditions like sleep.
Cardiac Vagal Tone and Longevity: The HRV-Aging Connection
One of the most intriguing frontiers in cardiovascular research is the relationship between HRV and healthy aging. Scientists have long known that HRV declines with age, but emerging research suggests this relationship may be bidirectional: not only does aging reduce HRV, but maintaining higher HRV may actually slow aspects of the aging process itself.
The concept of "inflammaging" describes the chronic, low-grade inflammation that accumulates as people get older, even in the absence of obvious infection or disease. This background inflammation is linked to many age-related conditions, from cardiovascular disease to cognitive decline. Here is where the story becomes relevant to biofeedback practice: the vagus nerve's anti-inflammatory pathway may help regulate this process. Higher cardiac vagal tone, as indexed by HRV, appears to be associated with lower levels of inflammatory markers like C-reactive protein and interleukin-6 (Thayer & Fischer, 2009).
Recent longitudinal studies have begun tracking whether HRV biofeedback training might influence biological aging markers. Yoo et al. (2022) found that five weeks of daily HRV biofeedback produced changes in both HRV metrics and cortical brain volume in younger and older adults, suggesting that the training can produce real biological changes rather than just temporary state shifts.
The Intrinsic Cardiac Nervous System: Your Heart's "Little Brain"
Perhaps the most paradigm-shifting development in cardiovascular neuroscience is the growing recognition that the heart contains its own sophisticated nervous system. This intrinsic cardiac nervous system, sometimes called the "heart brain" or "little brain on the heart," consists of approximately 40,000 neurons organized into ganglia that can process information and make decisions independently of the central nervous system.
These cardiac neurons are not mere relay stations. They contain sensory neurons that detect mechanical and chemical changes, interconnecting neurons that process this information, and motor neurons that can modulate heart rhythm and contractility. In laboratory preparations, this network can maintain coordinated cardiac function even when completely disconnected from the brain (Armour, 2008).
What does this mean for biofeedback practice? It suggests that the heart is not simply a pump following orders from the brain but an active participant in a complex, bidirectional communication system. When clients practice resonance frequency breathing and experience shifts in emotional state, they may be influencing this intrinsic cardiac network, which in turn sends different patterns of afferent signals to the brain.
HRV Biofeedback for Long COVID Dysautonomia
The COVID-19 pandemic has unfortunately created a large population of individuals experiencing persistent symptoms long after their initial infection. Among the most debilitating of these Long COVID symptoms are those related to autonomic dysfunction: racing heart upon standing, exercise intolerance, temperature dysregulation, and the frustrating combination of feeling "wired but tired."
Many Long COVID patients meet criteria for postural orthostatic tachycardia syndrome (POTS), a condition in which heart rate rises abnormally when moving from lying to standing. HRV biofeedback has emerged as a promising approach for this population. A feasibility study by Corrado et al. (2024) found improvements in symptom and disability measures following a brief HRV biofeedback program in Long COVID patients.
The rationale is straightforward: if Long COVID has destabilized autonomic regulation, then training that strengthens vagal control and improves autonomic flexibility might help restore function. Biofeedback approaches can be delivered remotely, which matters enormously for patients whose symptoms make traveling to appointments difficult. The training is non-pharmacological, avoiding medication side effects that can be particularly problematic in this sensitive population.
The Beating Network: Why HRV and Temperature Matter
A modern view of the cardiovascular system treats the heart not as a simple pump, but as a dynamically regulated network constantly tuned by the brain, nerves, and blood vessels. Heart rate variability (HRV), the natural beat-to-beat changes in heart rate, emerges from this interplay between the heart's pacemaker and the autonomic nervous system (ANS), which includes the "speed-up" sympathetic branch and the "slow-down" parasympathetic or vagal branch (Tiwari et al., 2020; Shaffer & Meehan, 2020). High, flexible HRV is now seen as a marker of a resilient cardiovascular system able to respond to stress and then recover, while chronically low HRV signals rigid control and higher risk of disease (Johnston et al., 2019; Liu et al., 2025). HRV biofeedback uses real-time displays of these rhythms so people can learn, through breathing and attention, to shift their ANS toward more adaptive patterns (Shaffer & Meehan, 2020; Fournié et al., 2021). These same neural circuits also coordinate blood vessel tone and skin blood flow, which directly affect body and skin temperature, linking cardiovascular anatomy and physiology to temperature-based biofeedback (Manuel et al., 2020; Lokesh & Khurana, 2025).
Brain-Heart Pathways and the Baroreflex
Recent work has sharpened understanding of the brain structures that shape cardiovascular rhythms central to HRV and temperature control. The central autonomic network, including prefrontal, cingulate, and insular cortices plus brainstem nuclei, integrates information about internal bodily state and emotional demands, then adjusts heart rate and vessel tone accordingly (Manuel et al., 2020; Mulcahy et al., 2019). At the core of moment-to-moment control is the baroreflex, a feedback loop in which stretch-sensitive baroreceptors in the arteries detect each surge of blood pressure and send signals to the brainstem, which then tweaks sympathetic and parasympathetic outflow to keep pressure stable (Lokesh & Khurana, 2025; Shaffer & Meehan, 2020). HRV biofeedback at each person's resonance frequency, typically around six breaths per minute, deliberately drives large blood pressure and heart-rate oscillations that can strengthen this baroreflex over time (Shaffer & Meehan, 2020; Fournié et al., 2021). Functional MRI studies show hypothalamic subsystems oscillate in time with classic HRV frequency bands, suggesting these deep brain regions are key hubs that link cardiovascular rhythms to thermal regulation and behavioral state (Manuel et al., 2020; Mulcahy et al., 2019). This emerging "brain-heart axis" view helps explain why training HRV can change not just heart rhythms, but also blood pressure, mood, and perceived stress (Fournié et al., 2021; Liu et al., 2025).
Vessels, Skin, and Cold: Anatomy Behind Temperature Biofeedback
The cardiovascular system's branching tree of arteries, arterioles, and capillaries does more than move oxygen; it also serves as a dynamic thermostat. Pulse rate variability (PRV) measured from photoplethysmography (PPG) at the ear or finger reflects how cardiac output interacts with vascular tone and local blood flow, and it can diverge from HRV when vessels strongly constrict or dilate (Ishaque et al., 2021; Mejía-Mejía et al., 2020). In whole-body cold exposure, PRV from peripheral sites like the finger and toe changes more than central sites, mirroring strong sympathetic-driven vasoconstriction that shunts blood toward core organs to conserve heat (Mejía-Mejía et al., 2020). This localized vascular response underlies temperature biofeedback: by learning to relax and adjust breathing, a person can reduce sympathetic tone, allowing skin vessels to reopen and peripheral temperature to rise. Studies now highlight that multi-site PRV can reveal different patterns of autonomic control at core versus peripheral regions, making it a promising tool for fine-tuning biofeedback protocols that target both HRV and skin temperature (Johnston et al., 2019; Mejía-Mejía et al., 2020). In practical terms, this means that what you see on a fingertip temperature sensor is not just "how warm you are," but the end product of brain-heart-vessel interactions.
Nonlinear Heart Dynamics and Circadian Rhythms
Another recent insight is that the heart's rhythm behaves less like a clock and more like a complex, nonlinear system coupled to metabolism, breathing, and daily rhythms. Mathematical modeling of HRV suggests that heart rate dynamics are governed by stable control points whose "slope," or responsiveness, depends on both metabolic demands and the balance of sympathetic and parasympathetic activity (He, 2020). This helps explain why HRV falls with aging or heart failure, reflecting reduced metabolic flexibility and impaired myocardial function, and can spike in certain ischemic states when sympathetic drive surges (He, 2020; Johnston et al., 2019). At the same time, molecular clock genes such as Bmal1 and thyroid hormone signaling in hypothalamic neurons tune autonomic output across the day, producing circadian patterns in heart rate and parasympathetic tone (Kolms et al., 2025; Rhoads et al., 2025). HRV measurements therefore change with time of day, sex, and hormonal state, all of which are increasingly recognized as important context for interpreting biofeedback data and designing training schedules (Quigley et al., 2024; Sundas et al., 2025). For temperature biofeedback, these rhythms matter too, since the same hypothalamic networks coordinate both thermoregulation and cardiovascular responses (Lokesh & Khurana, 2025; Manuel et al., 2020).
From Theory to Practice: HRV and Temperature Biofeedback in Health
Translating this anatomy and physiology into practice, HRV biofeedback is now being tested and used as a non-drug tool for chronic disease management and rehabilitation. Systematic reviews show that HRV biofeedback, typically using slow paced breathing near resonance frequency with visual or tactile feedback, can improve blood pressure, inflammatory markers, asthma symptoms, anxiety, sleep, pain, and overall cardiovascular prognosis, with few adverse effects (Fournié et al., 2021; Shaffer & Meehan, 2020). In cardiac rehabilitation, wearable-based systems now guide patients through resonance-frequency breathing at home, automatically adjusting breathing rates and monitoring HRV, and early data suggest meaningful HRV improvements over one month of training (Hu et al., 2025). Neural imaging studies of multi-week HRV biofeedback show changes in brain-body coupling, supporting the idea that training reshapes the central autonomic network and not just the heart's rhythm (Mulcahy et al., 2019; Yoo et al., 2022). Combining HRV with temperature feedback may further enhance learning, because rising fingertip temperature gives a simple, intuitive signal that sympathetic tone is dropping and parasympathetic activity is rising, consistent with increased HRV (Lokesh & Khurana, 2025; Mejía-Mejía et al., 2020). Together, these findings position biofeedback as a way to deliberately engage cardiovascular control circuits that evolution built for survival, now repurposed to build resilience and recovery.
Comprehension Questions: Cutting-Edge Topics
- What are the advantages and limitations of consumer wearable devices for HRV monitoring compared to clinical-grade equipment?
- Explain the connection between cardiac vagal tone, inflammation, and aging. Why might HRV biofeedback be relevant to healthy aging?
- What is the intrinsic cardiac nervous system, and why does its existence change how we think about heart-brain communication?
- Why might HRV biofeedback be particularly well-suited as an intervention for Long COVID dysautonomia?
- How does the central autonomic network integrate emotional and bodily information to control cardiovascular function?
- Explain how pulse rate variability (PRV) differs from HRV and why this distinction matters for temperature biofeedback.
- Why do circadian rhythms and hormonal factors matter when interpreting HRV data or designing biofeedback training schedules?
- How might combining HRV and temperature biofeedback enhance learning compared to using either modality alone?
Glossary
0.1 Hz biofeedback: training to concentrate ECG power around 0.1 Hz in the low frequency (LF) band by teaching patients to breathe diaphragmatically at their resonance frequency around 6 breaths per minute and experience positive emotional tone to maximize HR variability.
accentuated antagonism: the ability of PNS neurons to slow or stop the heart.
allostasis: the maintenance of stability through change by mechanisms that anticipate challenge and adapt through behavior and physiological change.
alpha-adrenergic receptors: G protein-coupled receptors for the catecholamines epinephrine and norepinephrine. The binding of these catecholamines to arteriole alpha-adrenergic receptors can produce hand-cooling.
arrhythmias: abnormal or irregular rhythms, also called dysrhythmias.
artery: blood vessels that carry blood away from the heart and are divided into elastic and muscular arteries and arterioles.
arteriole: an almost-microscopic blood vessel that delivers blood to capillaries and anastomoses.
arteriovenous anastomoses (AVAs): an end-to-end joining of blood vessels.
autonomic nervous system (ANS): the automatic control system that regulates heart rate, blood pressure, digestion, and other involuntary functions, made up of sympathetic ("fight-or-flight") and parasympathetic ("rest-and-digest") branches (Tiwari et al., 2020; Lokesh & Khurana, 2025).
baroreflex: the baroreceptor reflex that provides negative feedback control of BP. Elevated BP activates the baroreflex to lower BP, and low BP suppresses the baroreflex to raise BP.
β-adrenergic receptors: G protein-coupled receptors for the catecholamines epinephrine and norepinephrine. Catecholamine binding to the lumen of an arteriole is responsible for hand-warming.
blood pressure: the force exerted by blood as it presses against arteries.
blood volume pulse (BVP): the phasic change in blood volume with each heartbeat measured using a photoplethysmograph (PPG).
capillary: blood vessels found near almost all cells that may directly connect arterioles with venules or form extensive networks for rapid exchange.
cardiac output: the amount of blood pumped by the heart in a minute calculated by multiplying stroke volume times HR.
central autonomic network (CAN): interconnected brain regions in the cortex, hypothalamus, and brainstem that integrate bodily signals and control autonomic output to the heart and blood vessels (Mulcahy et al., 2019; Manuel et al., 2020).
electrocardiogram (ECG): a recording of the heart's electrical activity using an electrocardiograph.
heart rate: the number of heartbeats per minute, also called stroke rate.
heart rate variability (HRV): beat-to-beat changes in HR, including changes in the RR intervals between consecutive heartbeats.
heart rate variability biofeedback (HRVB): a training method where people view their heart-rate patterns in real time and use techniques like slow breathing to increase HRV and shift autonomic balance, with demonstrated benefits in several chronic conditions (Shaffer & Meehan, 2020; Fournié et al., 2021).
interbeat interval (IBI): the time interval between the peaks of successive R-spikes.
neurovisceral integration model: a hypothesis that a central autonomic network (CAN) links the brainstem NST with forebrain structures through feedback and feed-forward loops.
nitric oxide: an endothelium-derived signaling molecule that induces peripheral vasodilation.
photoplethysmograph (PPG): a device that measures the relative amount of blood flow through tissue using a photoelectric transducer.
pulse rate variability (PRV): beat-to-beat variability derived from pulse wave signals (e.g., fingertip PPG), influenced by both cardiac rhythms and vascular changes, and sometimes differing from HRV, especially at peripheral sites (Mejía-Mejía et al., 2020; Ishaque et al., 2021).
regulatory capacity: the ability to adaptively respond to challenges like exercise and stressors.
resonance frequency: the frequency at which a system, like the cardiovascular system, can be activated or stimulated.
respiratory sinus arrhythmia (RSA): respiration-driven heart rhythm that contributes to the high frequency (HF) component of HRV.
sinoatrial (SA) node: the heart node that initiates each cardiac cycle through spontaneous depolarization.
stroke volume: the amount of blood ejected by the left ventricle during one contraction.
thermoregulation: the processes that maintain body temperature within a narrow range, largely via hypothalamic control of blood flow to skin and brown fat and adjustments in heart rate and vessel tone (Manuel et al., 2020; Lokesh & Khurana, 2025).
vagal tank theory: the hypothesis that vagal traffic to the heart indicates how efficiently we mobilize and use scarce self-regulatory resources.
vagal tone: he activity level of the vagus nerve, the primary parasympathetic pathway to the heart. Higher vagal tone indicates greater parasympathetic influence, which slows heart rate and increases heart rate variability. It serves as an index of the body's capacity for calm, recovery, and flexible stress responses.
vein: blood vessels that return blood from tissues back to the heart.
venule: a microscopic vessel formed by capillaries that delivers blood to a vein.
Test Yourself
Click on the ClassMarker logo to take 10-question tests over this unit without an exam password.

Review Flashcards on Quizlet
Click on the Quizlet logo to review our chapter flashcards.
Visit the BioSource Software Website
BioSource Software offers Human Physiology, which satisfies BCIA's Human Anatomy and Physiology requirement, and Biofeedback100, which provides extensive multiple-choice testing over BCIA's Biofeedback Blueprint.

Assignment
Now that you have completed this module, describe how this module has changed your understanding of hand-warming. Also, explain when blood volume pulse feedback could be more useful than temperature biofeedback.
References
Armour, J. A. (2008). Potential clinical relevance of the 'little brain' on the mammalian heart. Experimental Physiology, 93(2), 165-176.
Bigger, J. T., Jr., et al. (1992-1995). [Multiple studies on HRV and cardiac outcomes]. Circulation and Journal of the American College of Cardiology.
Breit, S., et al. (2018). Vagus nerve as modulator of the brain-gut axis. Frontiers in Psychiatry, 9, 44.
Corrado, J., et al. (2024). HEART Rate Variability Biofeedback for LOng COVID Dysautonomia. Advances in Rehabilitation Science and Practice, 13.
Fournié, C., Chouchou, F., Dalleau, G., Caderby, T., Cabrera, Q., & Verkindt, C. (2021). Heart rate variability biofeedback in chronic disease management: A systematic review. Complementary Therapies in Medicine, 56, 102589. https://doi.org/10.1016/j.ctim.2020.102589
Gevirtz, R., Schwartz, M. S., & Lehrer, P. M. (2016). Cardiorespiratory biofeedback. In M. S. Schwartz & F. Andrasik (Eds.), Biofeedback: A practitioner's guide (4th ed.). The Guilford Press.
Hayano, J., & Yuda, E. (2019). Pitfalls of assessment of autonomic function by heart rate variability. Journal of Physiological Anthropology, 38(1), 3.
He, Z. (2020). The control mechanisms of heart rate dynamics in a new heart rate nonlinear time series model. Scientific Reports, 10(1), 4796. https://doi.org/10.1038/s41598-020-61454-4
Hu, T., Zhang, X., Millham, R., Xu, L., & Wu, W. (2025). Implementation of wearable technology for remote heart rate variability biofeedback in cardiac rehabilitation. Sensors, 25(3), 834. https://doi.org/10.3390/s25030834
Ishaque, S., Khan, N., & Krishnan, S. (2021). Trends in heart-rate variability signal analysis. Frontiers in Digital Health, 3, 639444. https://doi.org/10.3389/fdgth.2021.639444
Johnston, B. W., Barrett-Jolley, R., Krige, A., & Welters, I. (2019). Heart rate variability: Measurement and emerging use in critical care medicine. Journal of the Intensive Care Society, 20(3), 221-227. https://doi.org/10.1177/1751143718816797
Khazan, I. (2019-2020). [Multiple works on biofeedback]. W. W. Norton & Company.
Kolms, B., Dore, R., Sentis, S., de Assis, L. D., Oster, H., & Mittag, J. (2025). Impaired thyroid hormone receptor signaling in anterior hypothalamic parvalbumin neurons causes bradycardia in male mice. European Thyroid Journal, 14(2), e220112. https://doi.org/10.1159/000542936
Lehrer, P. M., & Gevirtz, R. (2014). Heart rate variability biofeedback: How and why does it work? Frontiers in Psychology, 5, 756.
Lehrer, P., et al. (2020). Heart rate variability biofeedback improves emotional and physical health and performance: A systematic review and meta-analysis. Applied Psychophysiology and Biofeedback.
Liu, S., Cui, Y., & Chen, M. (2025). Heart rate variability: A multidimensional perspective from physiological marker to brain-heart axis disorders prediction. Frontiers in Cardiovascular Medicine, 12, 1501234. https://doi.org/10.3389/fcvm.2025.1501234
Lokesh, & Khurana, D. (2025). Heart rate variability and blood pressure: Insights into autonomic regulation and cardiovascular health. Journal of Ayurveda and Integrated Medical Sciences, 10(3), 45-54. https://doi.org/10.21760/jaims.10.3.7
MacKinnon, S., et al. (2013). Utilizing heartbeat evoked potentials to identify cardiac regulation. Applied Psychophysiology and Biofeedback, 38, 241-255.
Manuel, J., Färber, N., Gerlach, D., Heusser, K., Jordan, J., Tank, J., & Beissner, F. (2020). Deciphering the neural signature of human cardiovascular regulation. eLife, 9, e55316. https://doi.org/10.7554/eLife.55316
McCraty, R., & Shaffer, F. (2015). Heart rate variability: New perspectives. Global Advances in Health and Medicine, 4(1), 46-61.
Mejía-Mejía, E., Budidha, K., Abay, T. Y., May, J., & Kyriacou, P. A. (2020). Heart rate variability and pulse rate variability for the assessment of autonomic responses. Frontiers in Physiology, 11, 479. https://doi.org/10.3389/fphys.2020.00479
Mulcahy, J. S., Larsson, D. E. O., Garfinkel, S. N., & Critchley, H. D. (2019). Heart rate variability as a biomarker in health and affective disorders: A perspective on neuroimaging studies. NeuroImage, 202, 116072. https://doi.org/10.1016/j.neuroimage.2019.116072
Peper, E., et al. (2007). Is there more to blood volume pulse than HRV? Biofeedback, 35(2), 54-61.
Quigley, K. S., Gianaros, P. J., Norman, G. J., Jennings, J. R., Berntson, G. G., & de Geus, E. J. C. (2024). Publication guidelines for human heart rate and heart rate variability studies in psychophysiology—Part 1: Physiological underpinnings and foundations of measurement. Psychophysiology, 61(5), e14567. https://doi.org/10.1111/psyp.14567
Rhoads, M., Monroe, B., & Pollock, D. M. (2025). Bmal1 mediates sex differences in parasympathetic control of heart rate. Physiology, 40(S1), Abstract.
Shaffer, F., McCraty, R., & Zerr, C. L. (2014). A healthy heart is not a metronome. Frontiers in Psychology.
Shaffer, F., & Meehan, Z. M. (2020). A practical guide to resonance frequency assessment for heart rate variability biofeedback. Frontiers in Neuroscience, 14, 570400. https://doi.org/10.3389/fnins.2020.570400
Shaffer, F., Meehan, Z. M., & Zerr, C. L. (2020). A critical review of ultra-short-term HRV norms research. Frontiers in Neuroscience, 14, 594880.
Sundas, A., Contreras, I., Navarro-Otano, J., Soler, J., Beneyto, A., & Vehi, J. (2025). Heart rate variability over the decades: A scoping review. PeerJ, 13, e17543. https://doi.org/10.7717/peerj.17543
Task Force of the European Society of Cardiology (1996). Heart rate variability: Standards of measurement. Circulation, 93, 1043-1065.
Thayer, J. F., & Lane, R. D. (2000). A model of neurovisceral integration. Journal of Affective Disorders, 61, 201-216.
Tiwari, R., Kumar, R., Malik, S., Raj, T., & Kumar, P. (2020). Analysis of heart rate variability and implication of different factors on heart rate variability. Current Cardiology Reviews, 16(3), 173-186. https://doi.org/10.2174/1573403X16666191111105029
Tortora, G. J., & Derrickson, B. H. (2021). Principles of anatomy and physiology (16th ed.). John Wiley & Sons.
Vaschillo, E., et al. (2002). Heart rate variability biofeedback as a method for assessing baroreflex function. Applied Psychophysiology and Biofeedback, 27, 1-27.
Yoo, H., Nashiro, K., Min, J., Cho, C., Mercer, N., Bachman, S., Nasseri, P., Dutt, S., Porat, S., Choi, P., Zhong, Y., Grigoryan, V., Feng, T., Thayer, J. F., Lehrer, P., Chang, C., Stanley, J., Marmarelis, V., Narayanan, S. S., Nation, D., Wisnowski, J., & Mather, M. (2022). Multimodal neuroimaging data from a 5-week heart rate variability biofeedback randomized clinical trial. Scientific Data, 9(1), 771. https://doi.org/10.1038/s41597-022-01866-9