Electrodermal Hardware
What You Will Learn
This chapter will transform electrodermal monitoring from a technical mystery into a practical clinical skill you can confidently use with your clients. You will discover why skin conductance has become the measure of choice over skin resistance, and how a simple principle about electrical flow makes sympathetic nervous system activity visible on your screen. You will learn the art of electrode placement, understanding why the fingers you choose and how snugly you secure the sensors can mean the difference between meaningful data and misleading artifacts.
The chapter guides you through the fascinating world of skin potential, a less common but powerful modality that can distinguish between orienting responses and alarm reactions in ways that skin conductance cannot. You will master the electrodermograph itself, learning how constant voltage systems protect your clients while providing accurate readings, and why modern AC methods have advantages over older DC approaches. Along the way, you will encounter the artifacts that can contaminate your electrodermal recordings, from loose electrodes and movement to temperature effects and respiration patterns, and learn practical strategies to identify and control each one. By the end of this chapter, you will be prepared to conduct electrodermal biofeedback training with confidence, recognizing the difference between variable-reactors, over-reactors, and under-reactors, and understanding how to help each type achieve greater self-regulation.
Valid electrodermal measurements ensure the integrity of client assessment and biofeedback training. Accurate measurements require understanding the signal and potential artifacts (sources of contamination) and developing bulletproof procedures (Shaffer & Combatalade, 2013).
Peper, Shaffer, and Lin (2010) recommended the following guidelines for ensuring accurate psychophysiological monitoring. First, understand the physiological mechanisms that generate the signal. Second, always record and inspect the raw signal because this will allow you to identify artifacts. Third, question whether displayed values make sense. For example, skin conductance levels that rapidly fluctuate, exceed 40 μS/cm2, or fall below 1 μS/cm2 should be suspect in a client who is sitting quietly. Fourth, recognize the appearance of common artifacts and how they alter derived measurements. Fifth, intentionally create artifacts to recognize them better. For example, rhythmically move the fingers attached to the sensor, loosen or tighten the sensors if secured with the Velcro® finger straps, and review the raw signal and calculated skin conductance values.
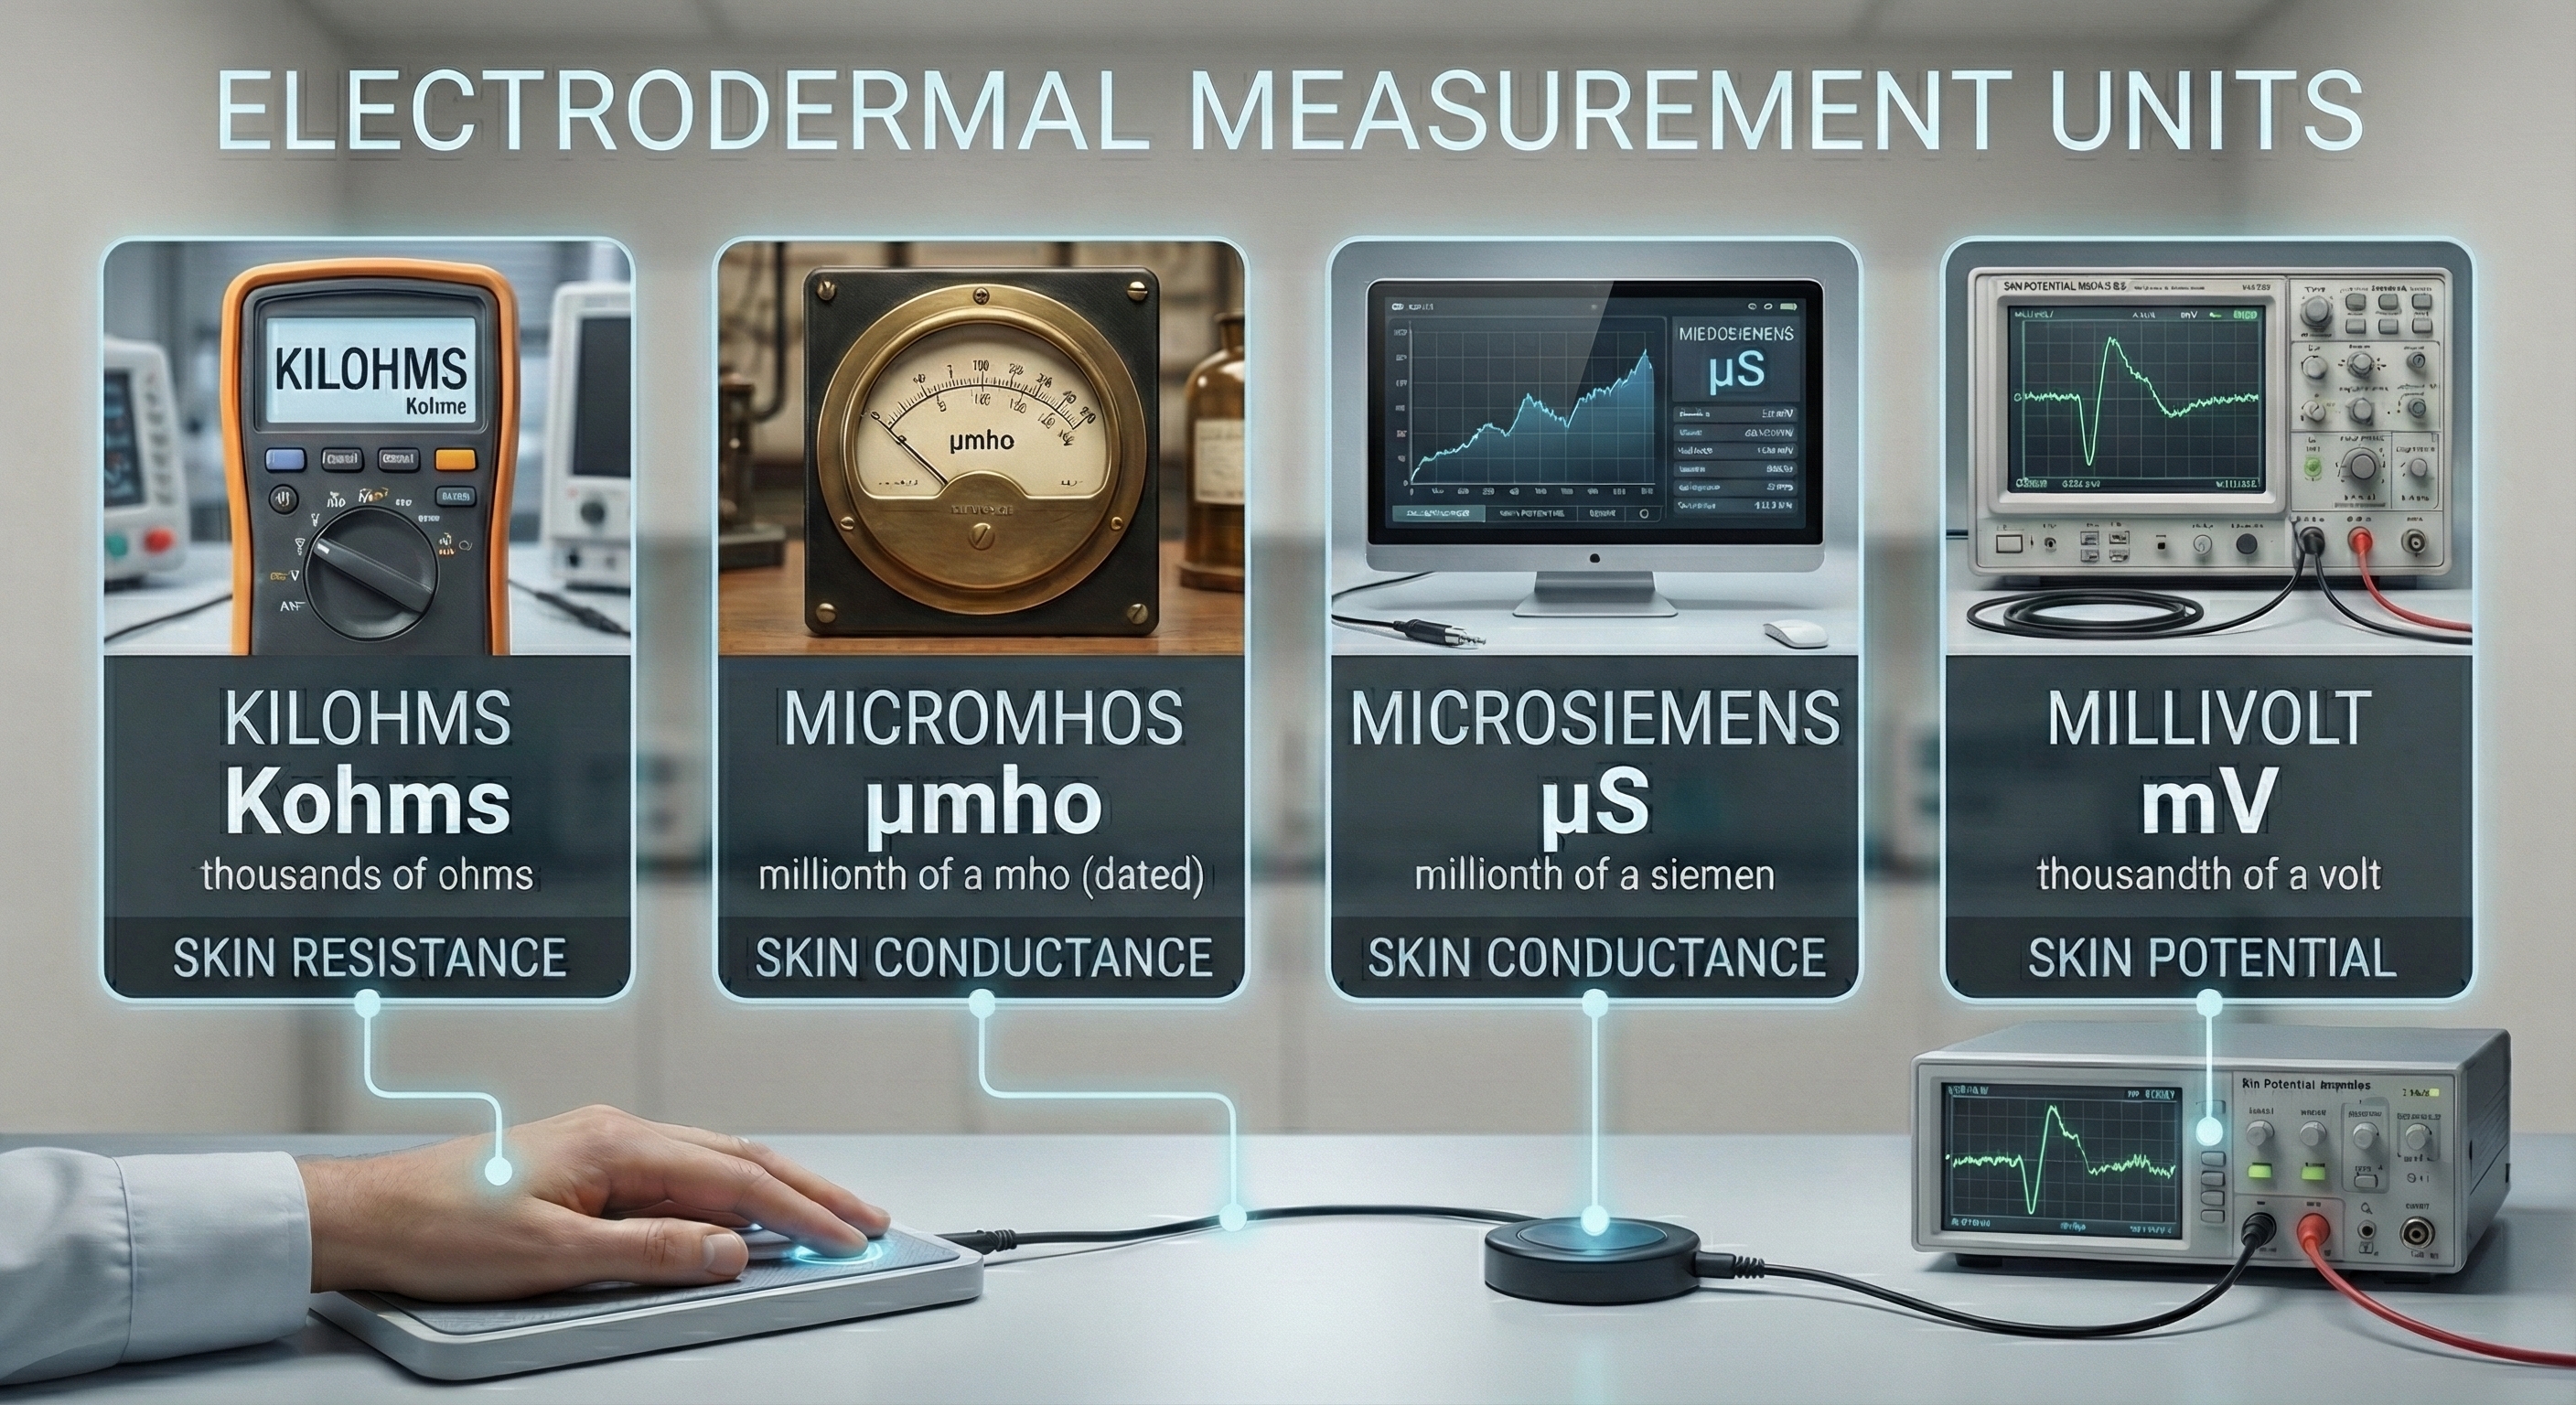
Below are widely-used electrodermal activity units.
BCIA Blueprint Coverage
This unit addresses Descriptions of the most commonly employed biofeedback modalities: Electrodermal activity (III-A), Sources of artifact (III-B), and Structure and function of the autonomic nervous system (V-A).
This unit covers Exosomatic EDA Measures, Skin Potential, The Electrodermograph, Skin Conductance Patterns, Drug Effects, and Assessing Electrodermograph Accuracy.
🎧 Listen to the Full Chapter Lecture
Exosomatic EDA Measures
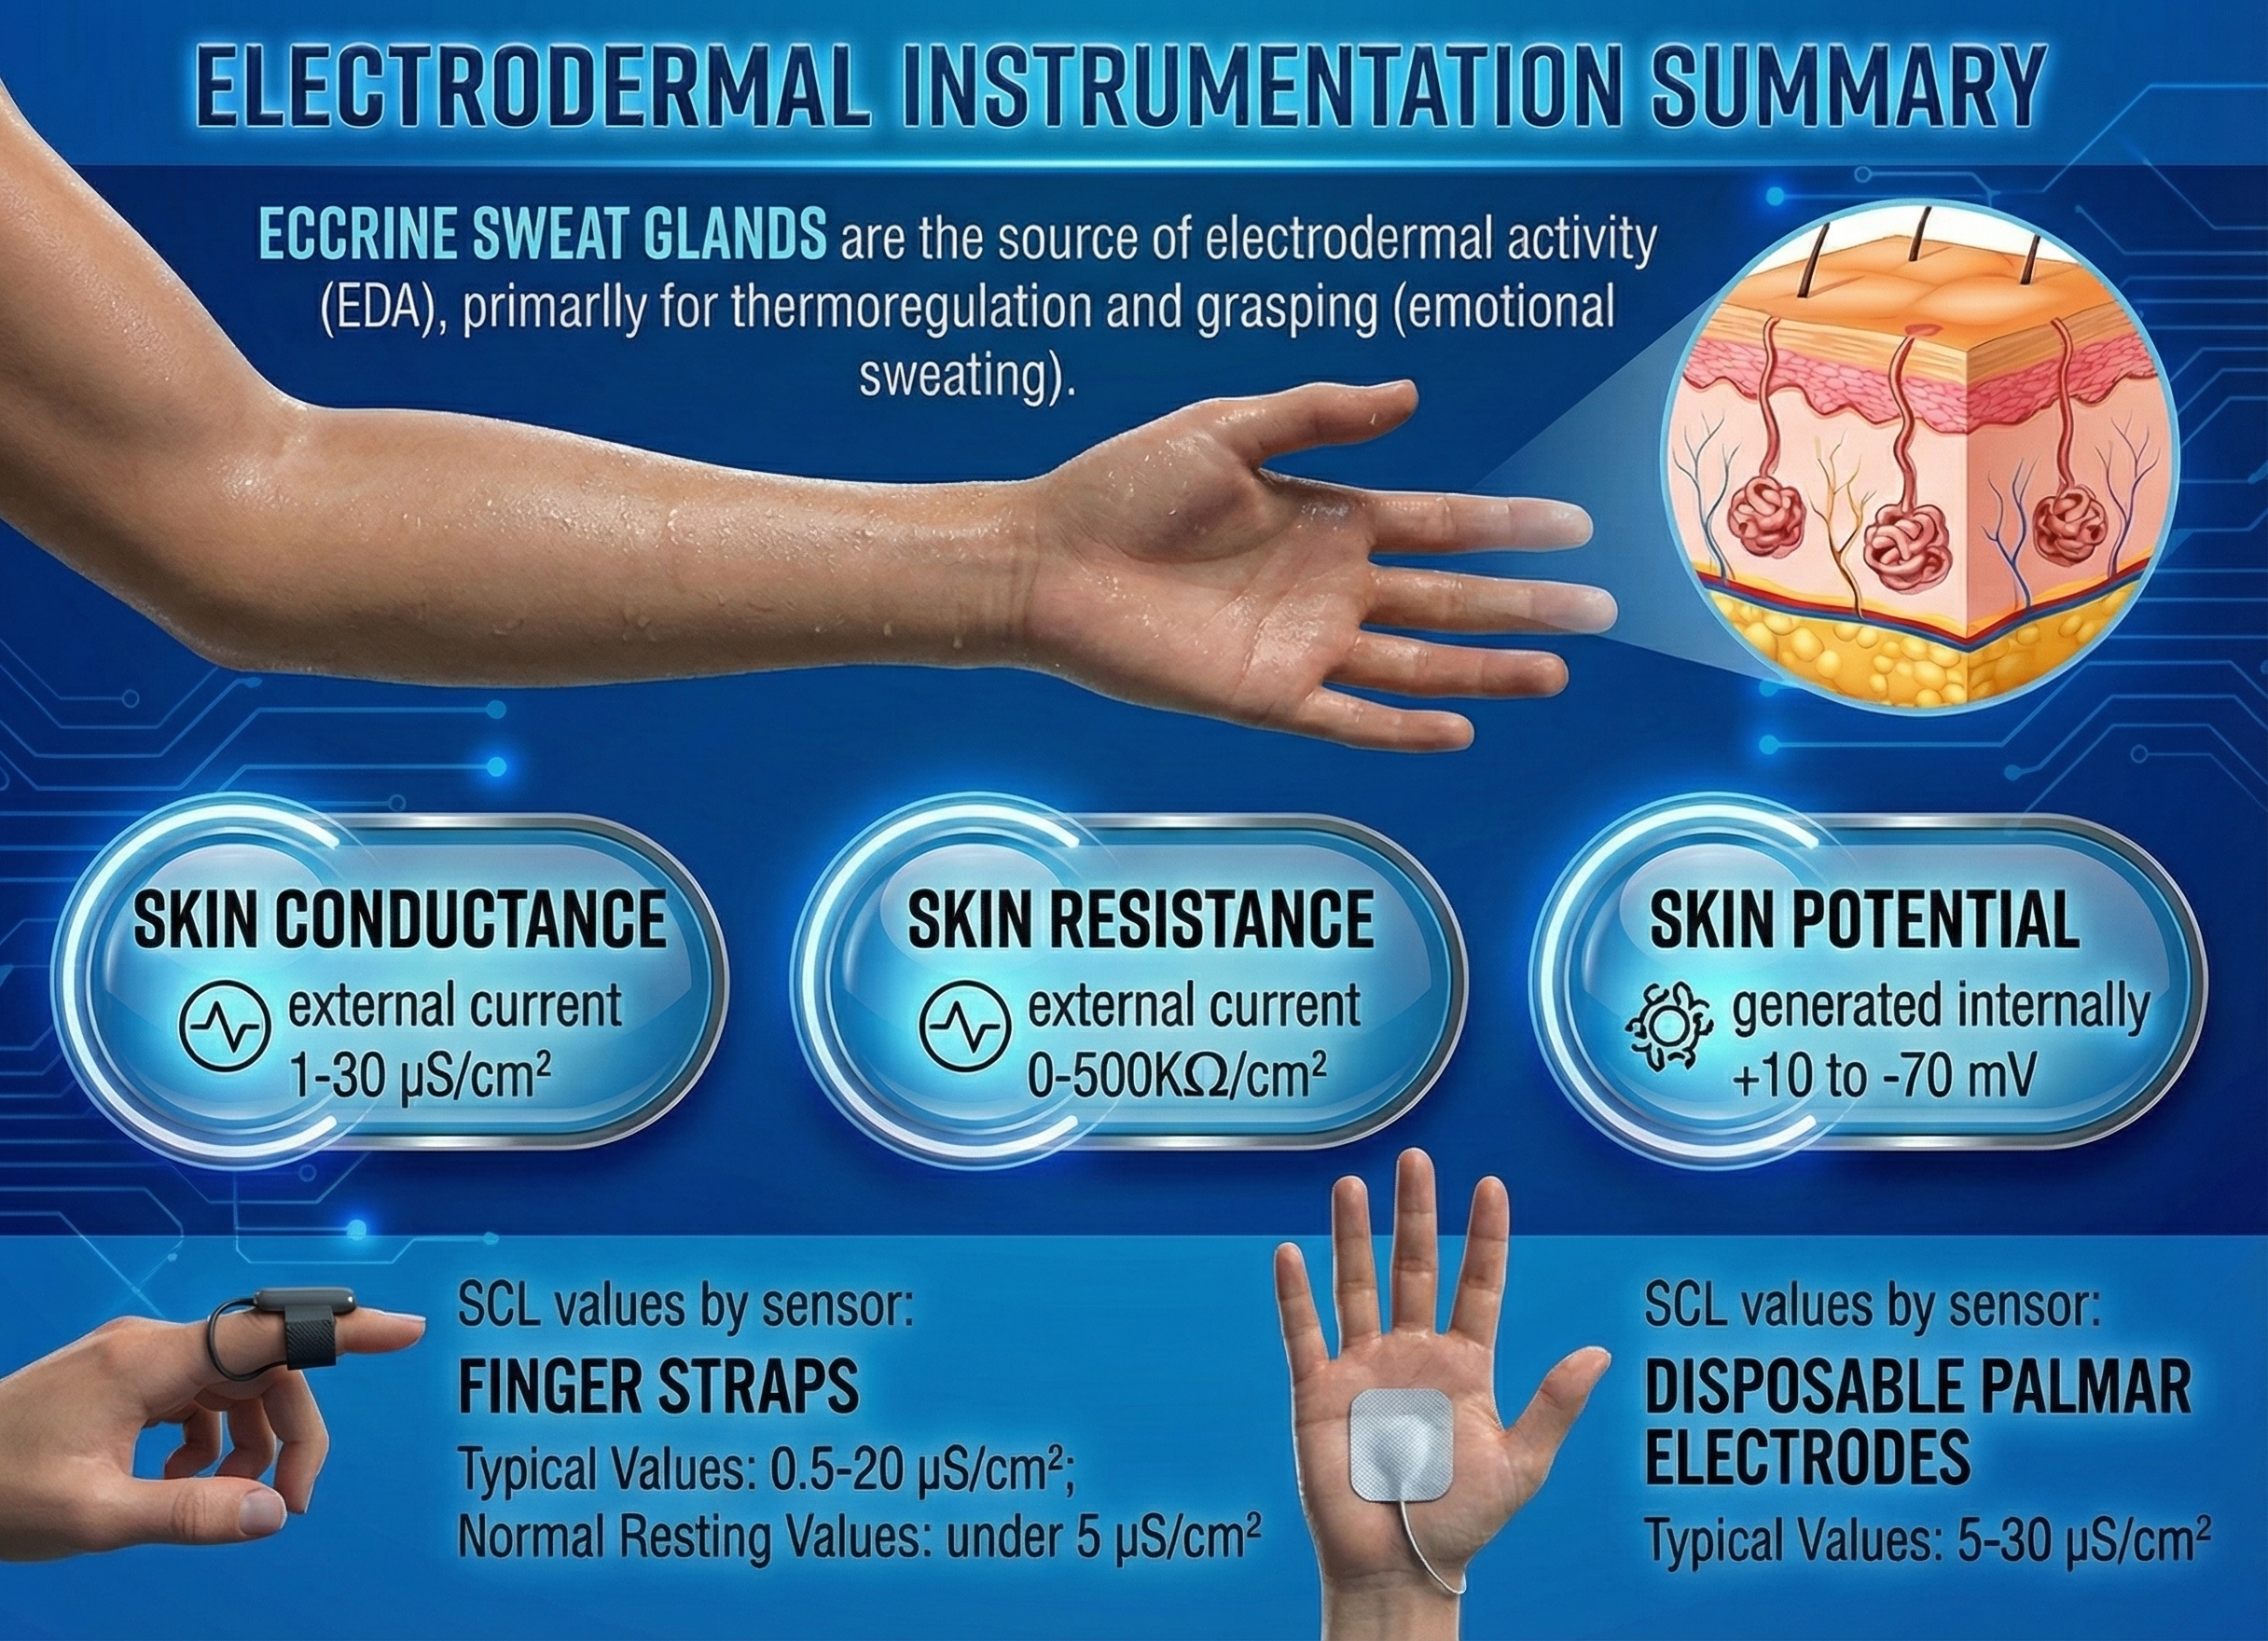
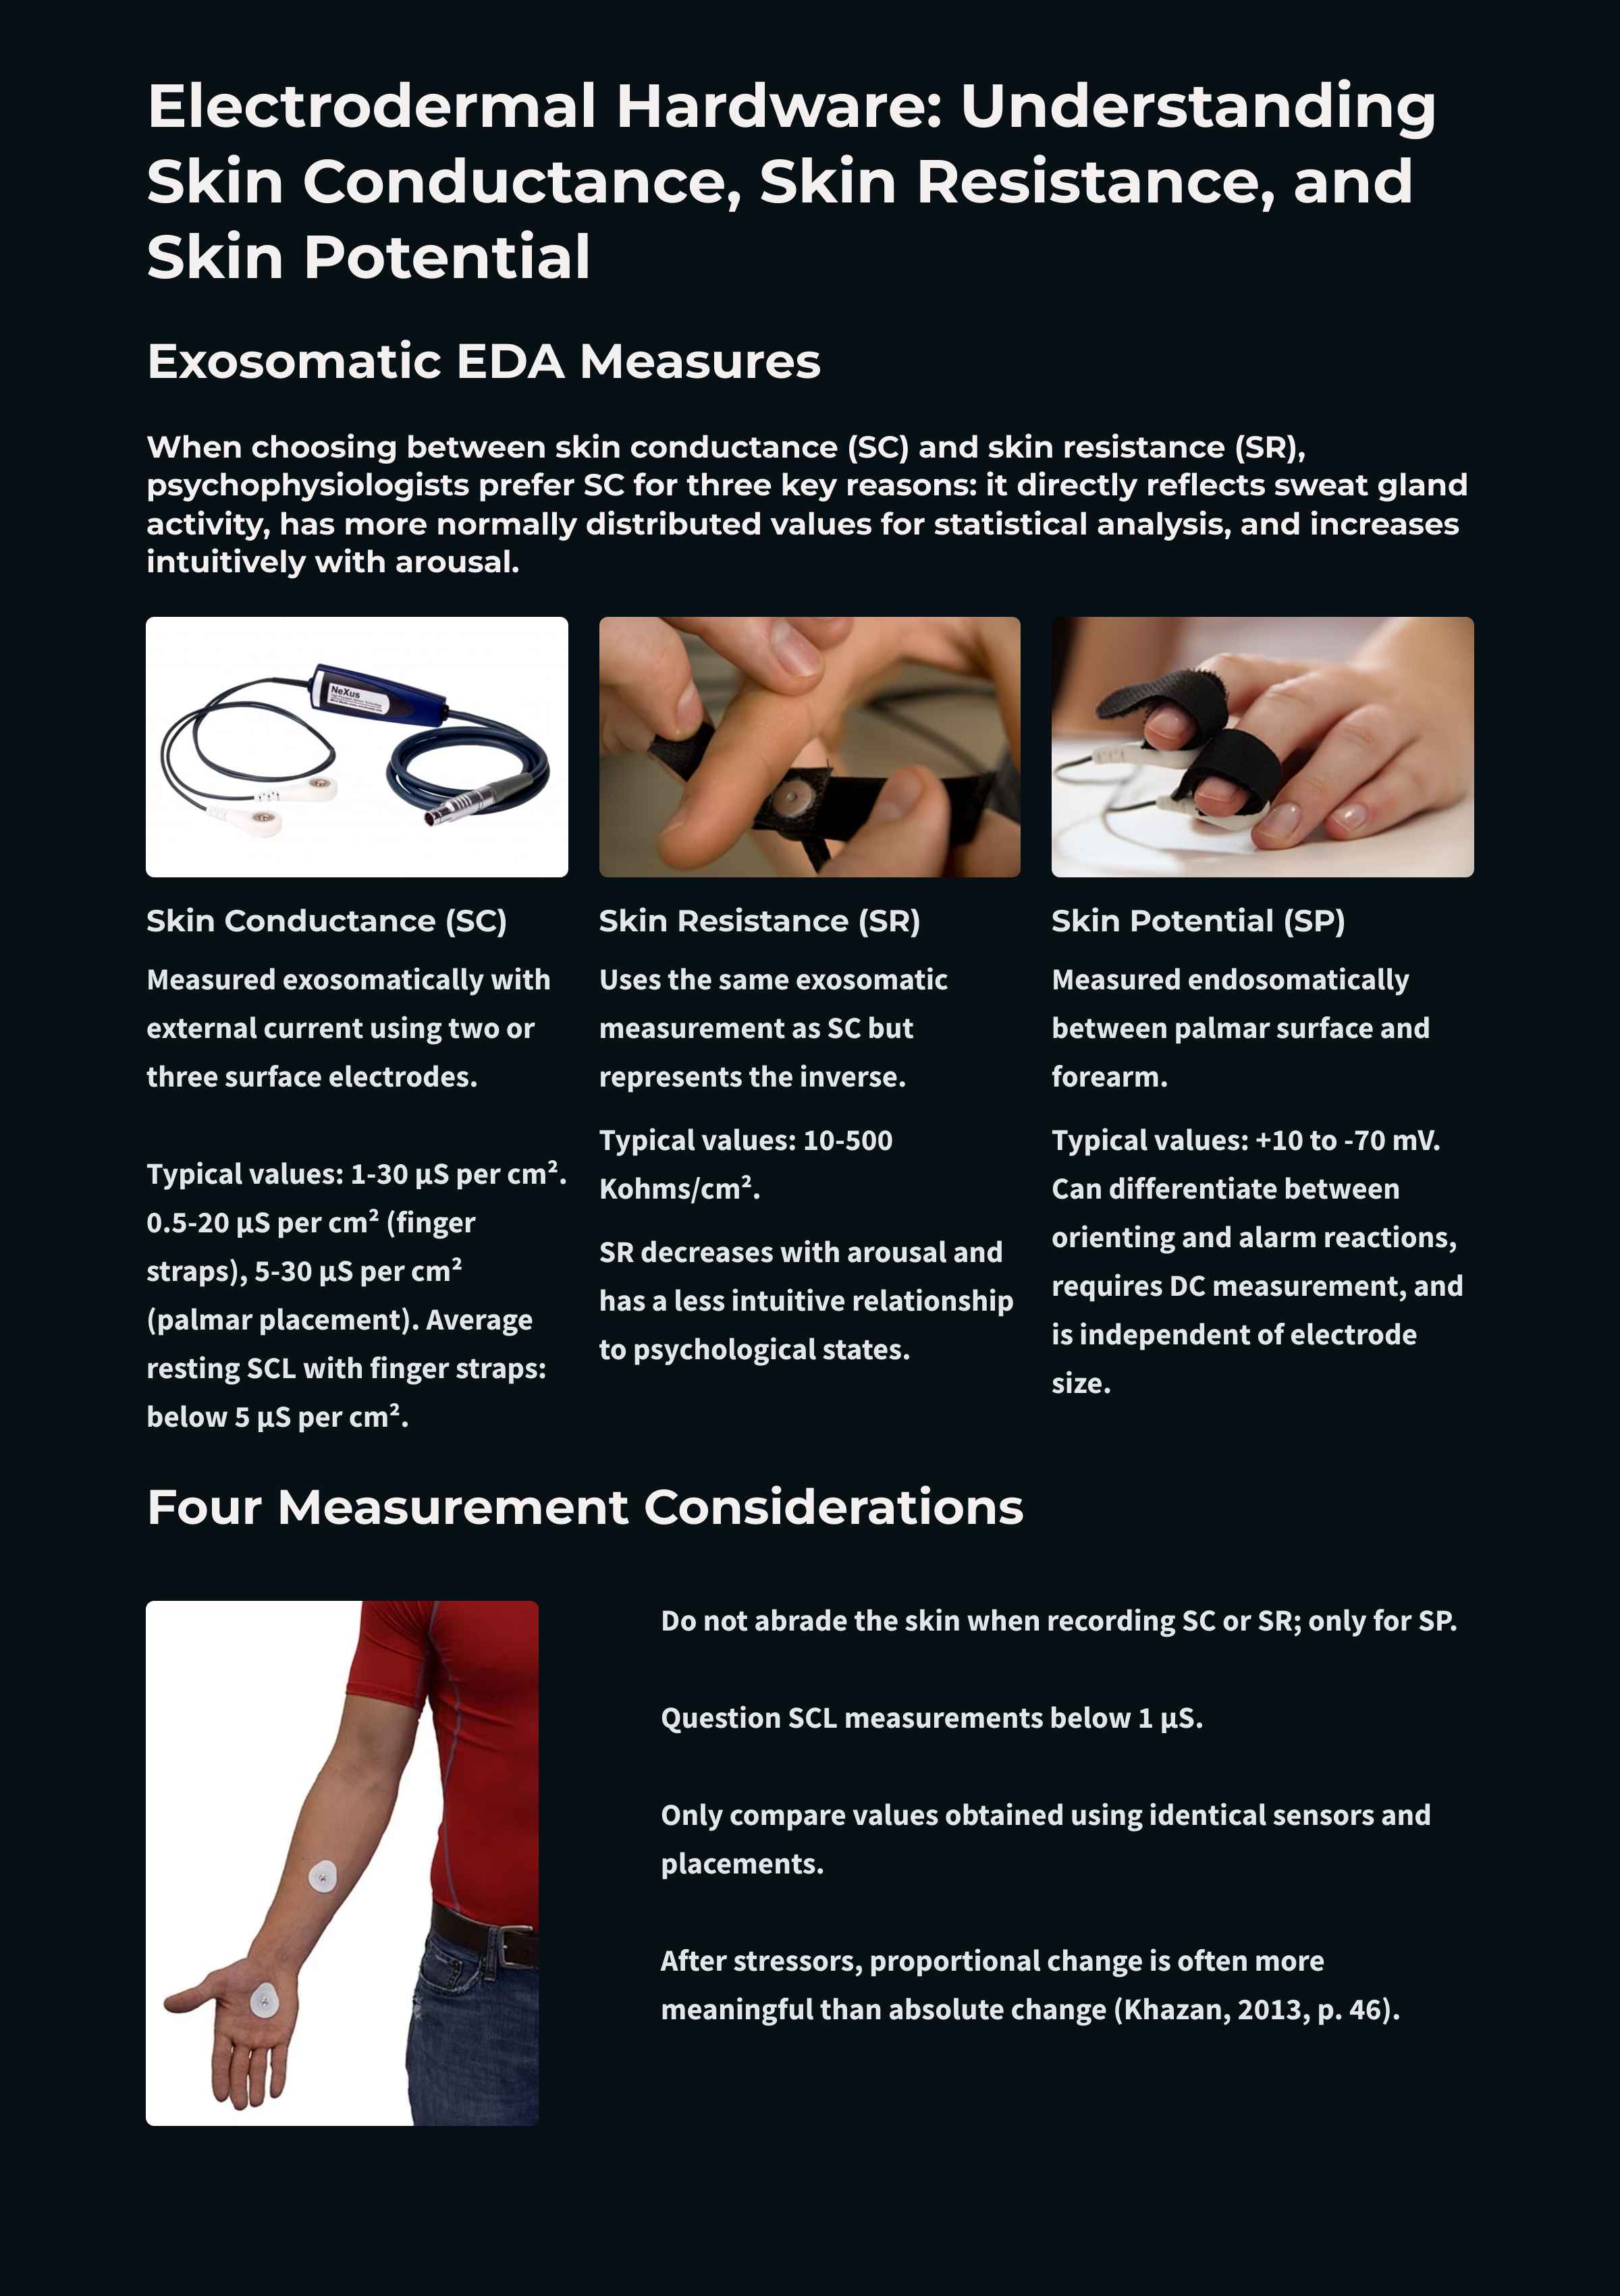
When choosing between skin conductance (SC) and skin resistance (SR), which should you use? Psychophysiologists prefer SC for three reasons. First, SC more directly reflects the number of active sweat glands and their activity. Second, SC values are more normally distributed, which aids statistical analysis. Third, SC increases as arousal and activity increase. This relationship makes more intuitive sense than resistance dropping with increased arousal (Andreassi, 2007).
SC, like SR, is monitored exosomatically where the current comes from outside the body. This method uses two or three surface electrodes to impose a current across the skin. SC does not measure the number of active sweat glands. Instead, SC is an indirect index of sweat gland activity that depends on passing an electric current across the skin. No current, no conductance. This indirect measure is closely related to eccrine sweat gland activity. High levels of sweat gland activity are strongly correlated with high SC levels (Peek, 1987).
Measurement circuits use a constant voltage or constant current. A constant voltage system holds the voltage through the skin constant so that the current changes with resistance. In contrast, a constant current system holds the current constant so that voltage changes with resistance.
Researchers prefer the newer constant voltage system since it adjusts the current in response to the number of active sweat glands and directly measures skin conductance. The electrodermograph reduces the current it imposes when there are fewer active sweat glands. This correction prevents excessive current density from irritating sweat glands and producing a driver artifact that distorts measurement (Stern, Ray, & Quigley, 2001). When using constant current systems, current density should be limited to 10 μA/cm2 to avoid potential sweat gland damage (Edelberg, 1967; Boucsein et al., 2012).
Researchers also prefer measurement using an AC over a DC since this reduces the risk of electrode polarization. Polarization means that electrodes develop persistent charges that impede current flow. Recent research (2024-2025) provides stronger support for AC excitation: compared to DC, full-wave AC excitation demonstrates reduced signal drift, greater temporal stability, and enhanced measurement of the skin's capacitive response (Massot et al., 2024). These advantages make AC particularly valuable for ambulatory and wearable applications where signal reliability is essential. In usual practice, SC measurements using AC and DC methods appear comparable for laboratory settings. Montagu (1964) found that AC and DC conductance values were strongly correlated (r = +0.99 for skin conductance levels and r = +0.97 for skin conductance responses).
Electrodes
SC and SR values vary with electrode recording surface; skin potential (SP) values do not. SC values are expressed in μS (microsiemens) per cm2. In 1971, during the 14th General Conference on Weights and Measures, the mho (inverse of ohm) was replaced by the siemen as the official unit of conductance (Wikipedia, 2016).
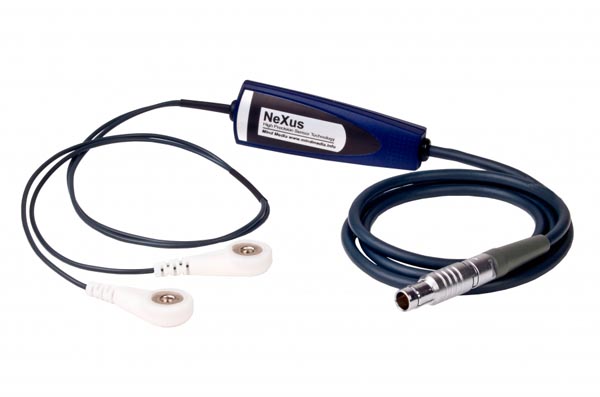
EDA electrodes should be nonpolarizing (not segregate charge) since this reduces conductance values. Biomedical engineers reduce polarization by coating a metal with its salt. Silver/silver-chloride or zinc/zinc-sulphate electrodes are both used. A Mind Media skin conductance sensor is shown below.
The electrode recording area should be as large as possible. A larger recording area reduces resistance and spreads current across more sweat glands, reducing sweat gland irritation (Stern, Ray, & Quigley, 2001). Standard electrodes applied to palmar or plantar (sole of the foot) sites range from 1.5 to 2 centimeters in diameter. Finger electrodes are typically 1 centimeter or less in diameter (Andreassi, 2007). For valid comparisons, you should only analyze measurements obtained using the same electrode size, composition, and placement (Shaffer, Combatalade, Peper, & Meehan, 2016).
In general, a level is a tonic measure of EDA that quantifies the average amplitude over a specified period and indexes baseline values. A response is a phasic measure of electrodermal activity representing a spontaneous or stimulus-elicited change in sweat gland activity and refers to change from the baseline values (Shaffer, Combatalade, Peper, & Meehan, 2016).
Electrode Placement
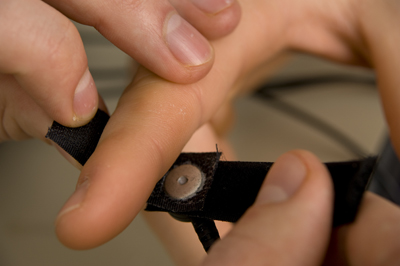
Clinicians secure skin conductance electrodes with double-backed adhesive collars (also used in EMG), surgical tape, or elastic bands. Velcro® is frequently used to attach finger electrodes.
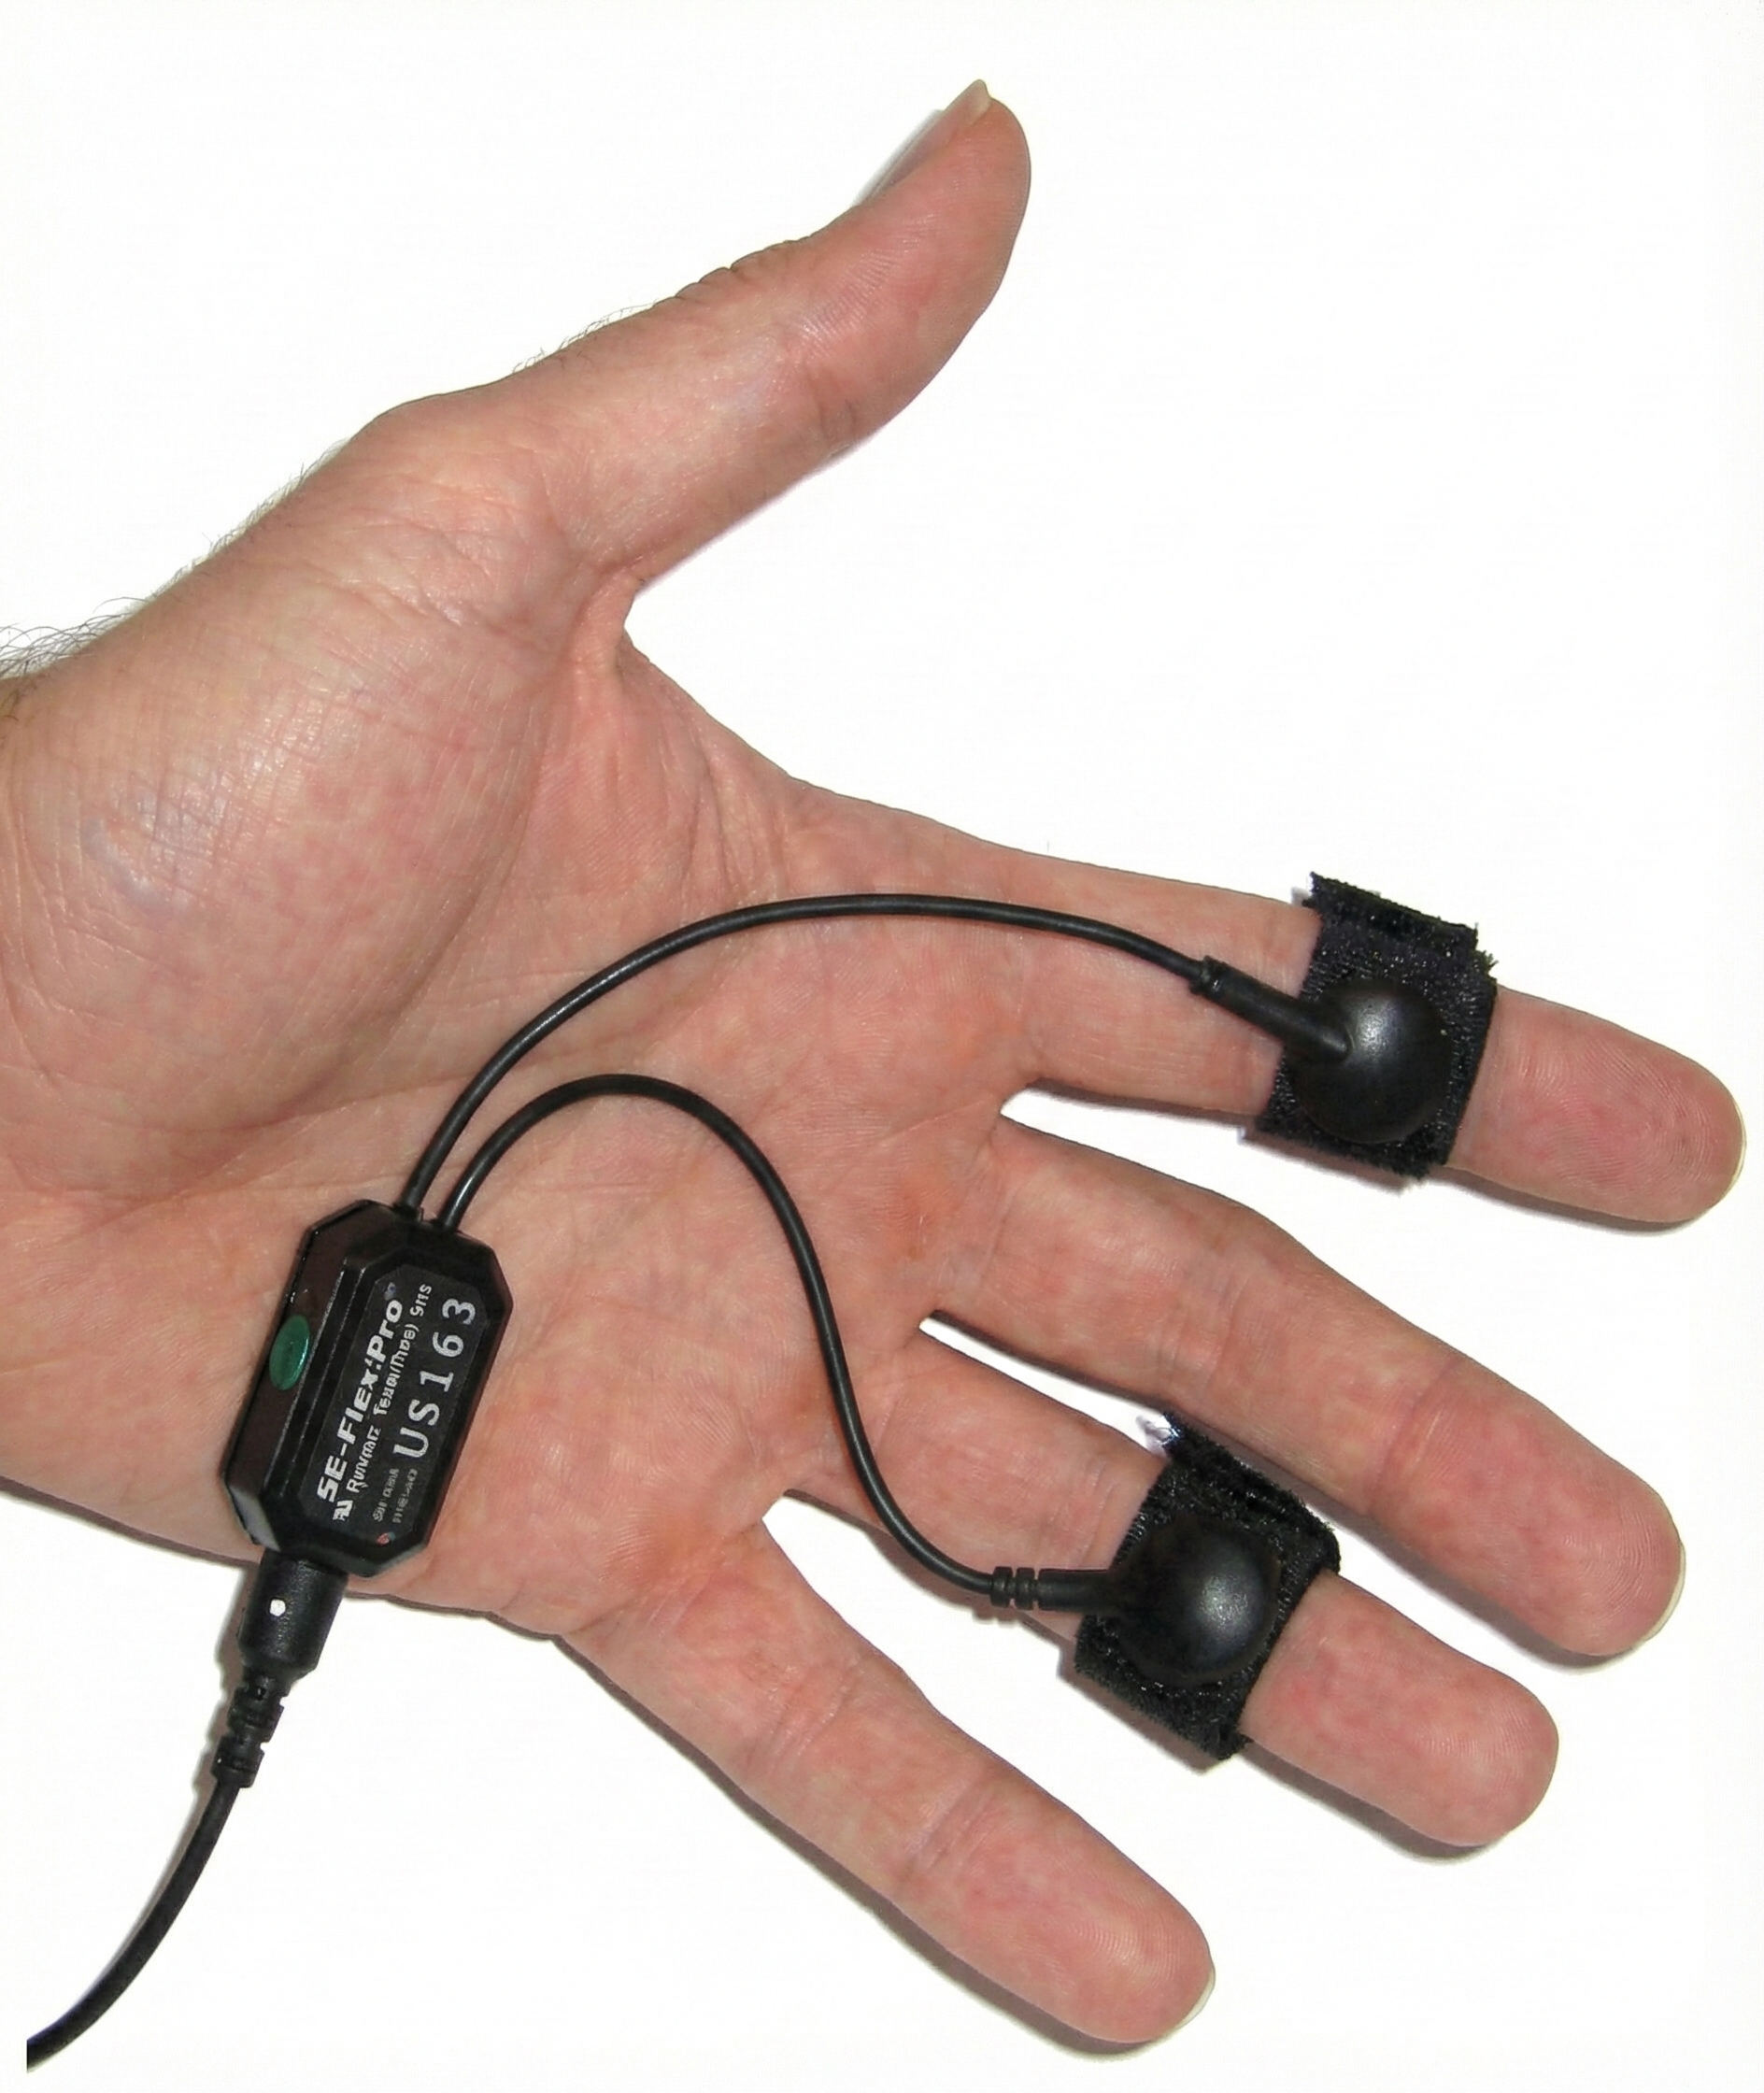
There are two finger straps attached to the skin conductance sensor shown below. The conductive electrode in each finger strap should be placed against the inside part of the finger. Graphic courtesy of Mind Media.
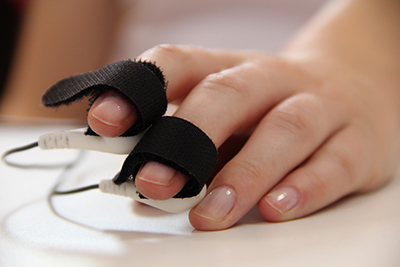
One choice for placement is to use the index and ring finger. Skip a finger to avoid physical contact between the sensors. A second placement uses the index and middle finger because they are both within the median nerve dermatome (Hugdahl, 1995). Close the Velcro straps around the fingers to make contact snug yet comfortable. Loosen the straps if the fingers throb or change color. Use the intermediate phalange of each finger to prevent the sensors from slipping off and permit the performance of some motor tasks. Although the distal phalange is slightly more reactive due to a higher density of eccrine sweat glands, the finger straps sometimes fall off. Thus, the intermediate phalanges are commonly used.
Place the cables directed inwards is a practical method of keeping the cables out of the way. Tape the wires to your client's blouse or shirt to restrict sensor movement (Peper, Gibney, Tylova, Harvey, & Combatalade, 2008). Graphic courtesy of Thought Technology, Ltd.
Electrode Gel
Electrode gel may be used to conduct current when dry electrode values are low. They should contain a physiologic concentration of saline, which should not exceed 0.05 molar concentration (Hugdahl, 1995). Commercial EEG and EKG gels may distort readings if their saline content approaches saturation (Venables & Christie, 1973). Fowles et al. (1981) recommended mixing Unibase paste with a 3% saline solution for a paste with a 0.05 molar NaCl concentration.
Why does electrolyte concentration matter? Research has shown that high-salt-concentration gels can produce paradoxically negative (decreased conductance) responses. This occurs because the weak electrolyte in sweat pushes out the stronger electrode gel electrolyte from the sweat duct. To avoid this artifact, use gels with physiologic salt concentrations (Boucsein et al., 2012).
Allow 5-10 minutes for electrode stabilization before recording.
After applying electrodes with gel, wait at least 5-10 minutes before beginning data collection. This stabilization period allows the gel to equilibrate with the skin and sweat duct contents, reducing initial drift and ensuring more reliable measurements (Boucsein et al., 2012).
SC Recording
Clinicians attach electrodes to the palmar surface of the hands or fingers or the plantar surface of the foot (sole), where there is the highest density of eccrine sweat glands (about 1,000 glands per square cm). Placement may be bipolar or monopolar (Hugdahl, 1995).
The graphic below, which was generously provided by Peper, Gibney, Tylova, Harvey, and Combatalade (2008), shows palmar and finger placements for SC sensors. As stated earlier, use the intermediate phalange of each finger.
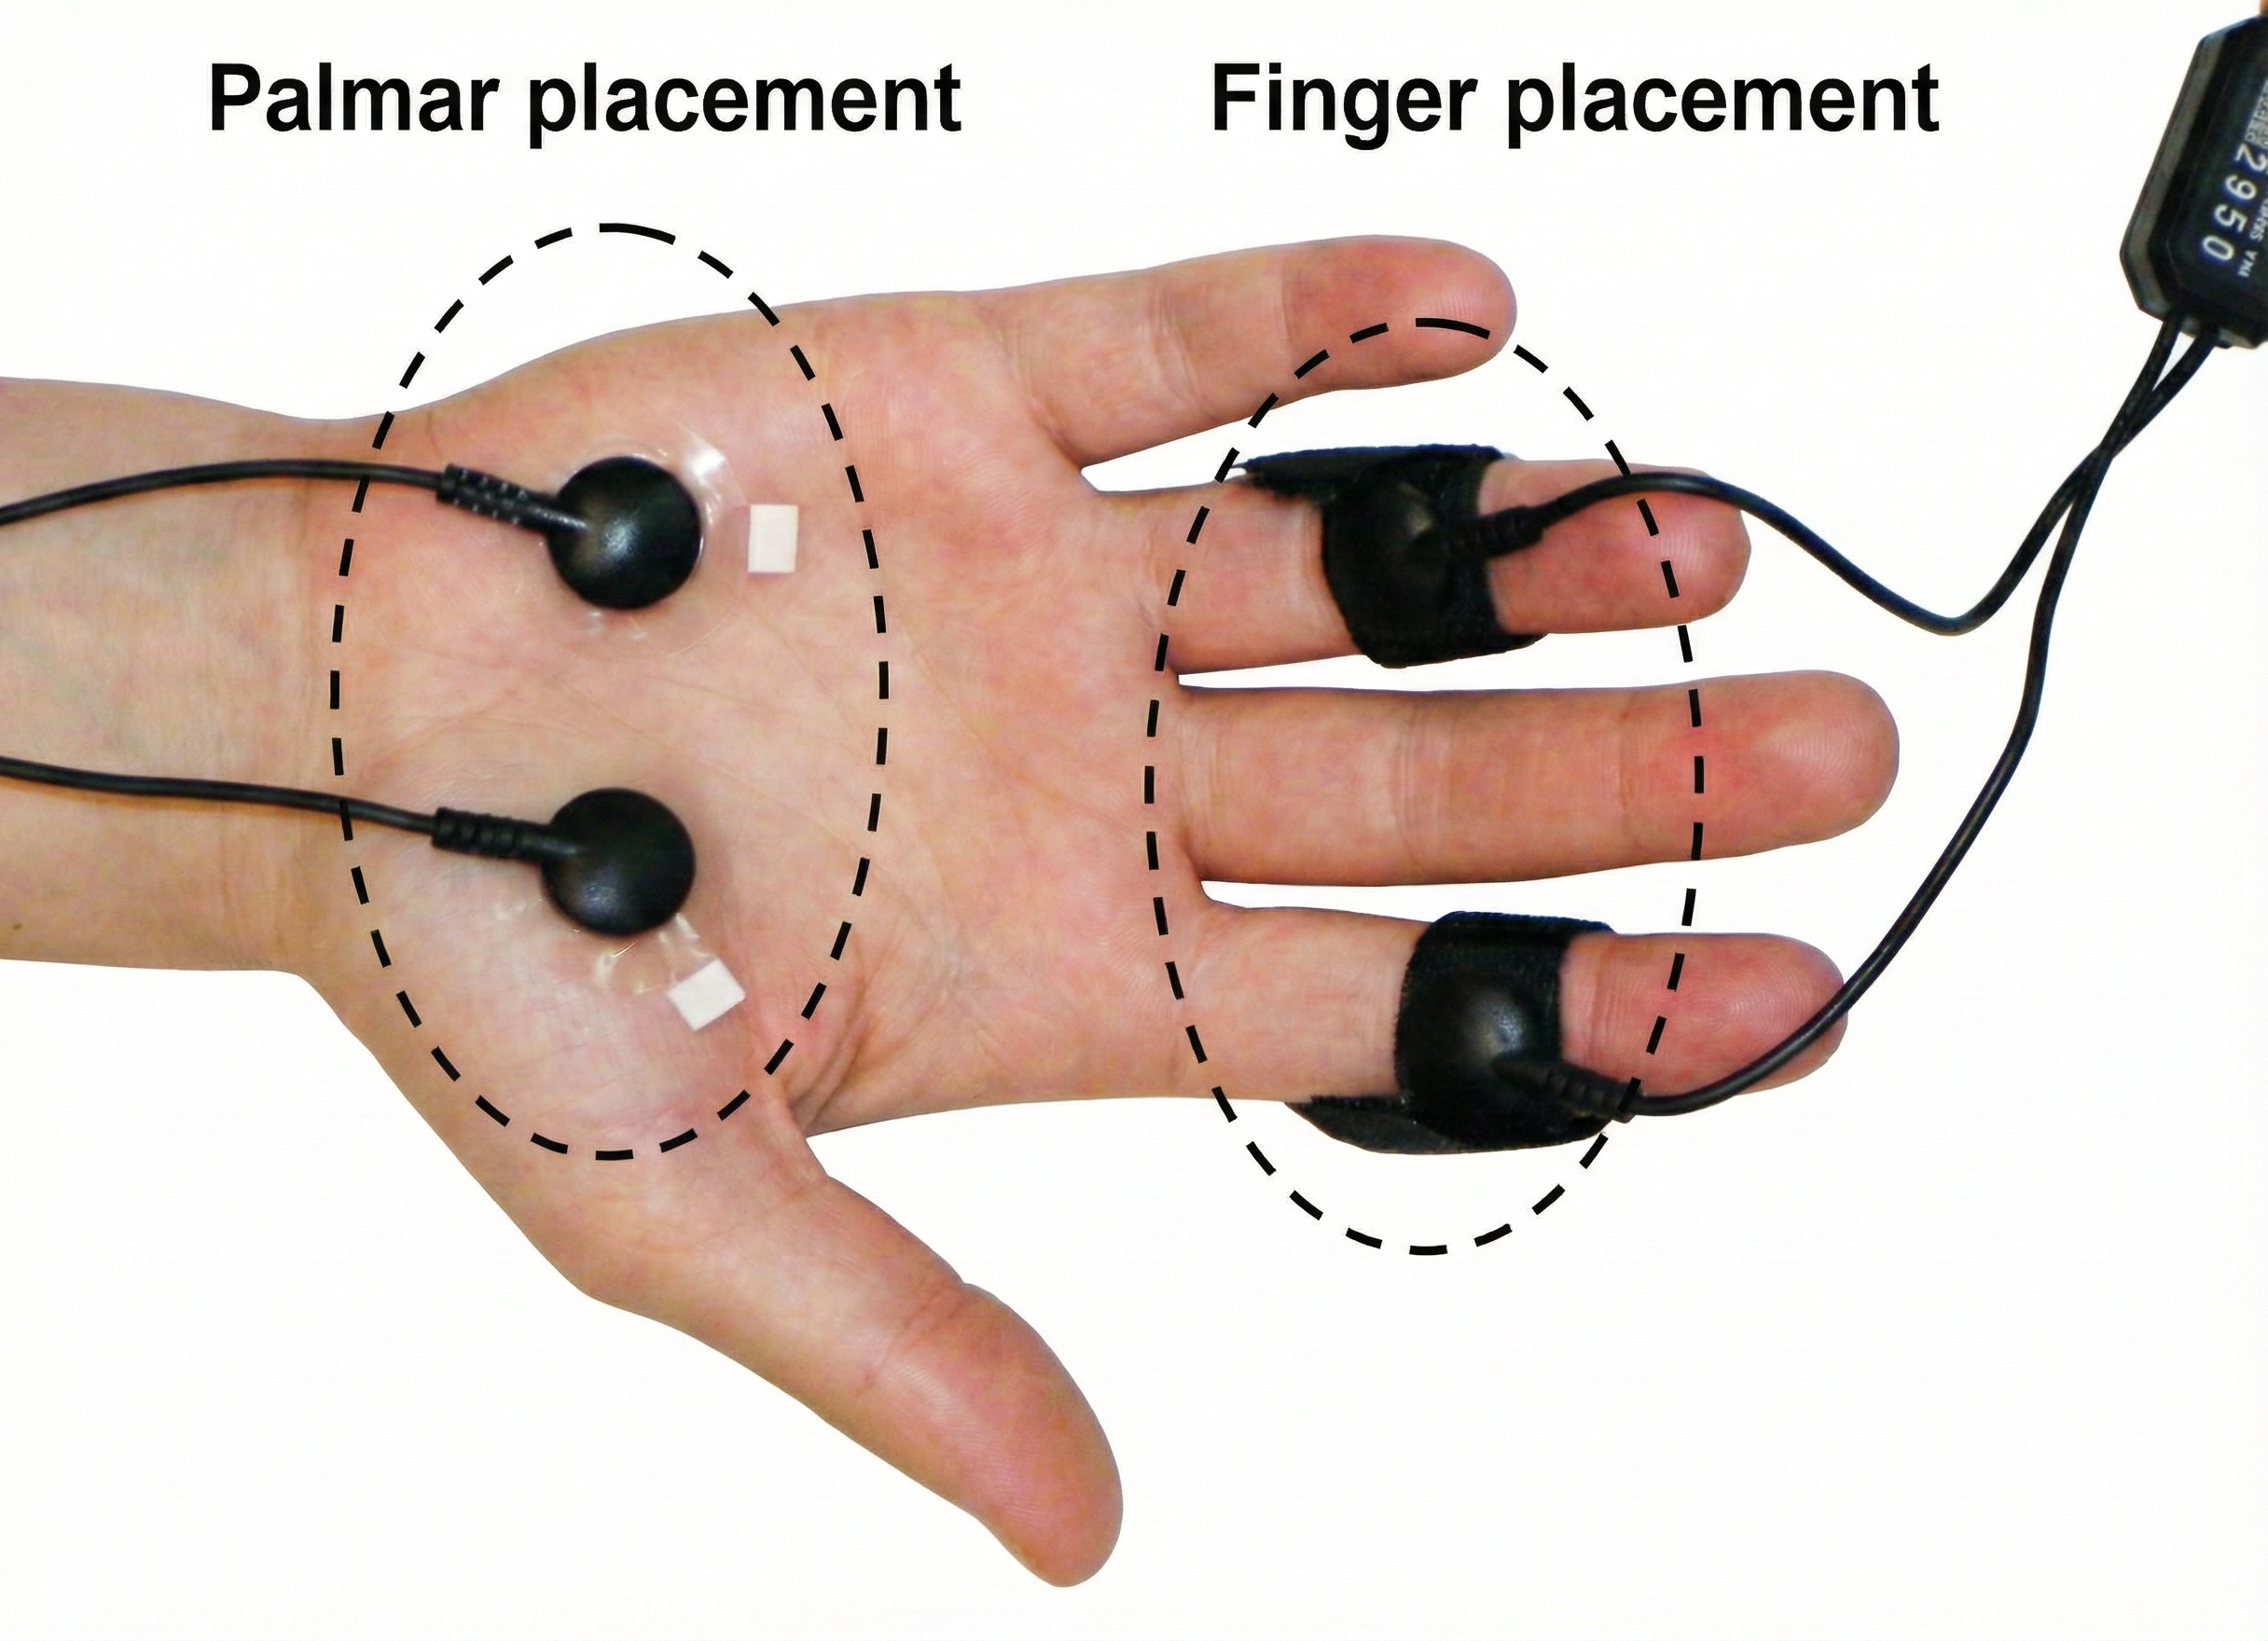
Individuals should wash their hands before each session to standardize skin condition. SCL may significantly drop after washing with soap and water removes surface salt (Peek, 1987).
Do not abrade the skin when recording SC or SR. Only abrade the skin when recording SP.
You can shift to a palmar placement if a finger placement yields SCL values less than 1.5 μS per cm2 because low values make the recording more susceptible to artifacts. If you apply conductive gel to increase a client's low SCL values, you must consistently use this procedure to ensure comparable values across sessions (Shaffer, Combatalade, Peper, & Meehan, 2016).
Tonic and Phasic Measurements
Skin conductance recordings show tonic (SCL) and phasic (SCR) components. SCRs resemble small waves that ride tidal drifts in SCL (Lykken & Venables, 1971).
SCRs are classified as nonspecific (NS-SCRs) and event-related (ER-SCRs).
Below is a BioGraph® Infiniti skin conductance display.
NS-SCRs occur when identifiable stimuli are absent. The typical rate during rest is 1 to 3 per minute. NS-SCRs must be differentiated from responses due to breathing and movement (Dawson, Schell, & Filion, 1990). These spontaneous fluctuations in skin conductance increase with anxiety and arousal (Hugdahl, 1995).
ER-SCRs are elicited by specific stimuli which may be "novel, unexpected, significant, or aversive" (Dawson, Schell, & Filion, 1990). How do we count ER-SCRs? A criterion of 0.01 μS is typically used to identify an ER-SCR. An ER-SCR is shown below. The diagram below was adapted from Stern, Ray, and Davis (1980).
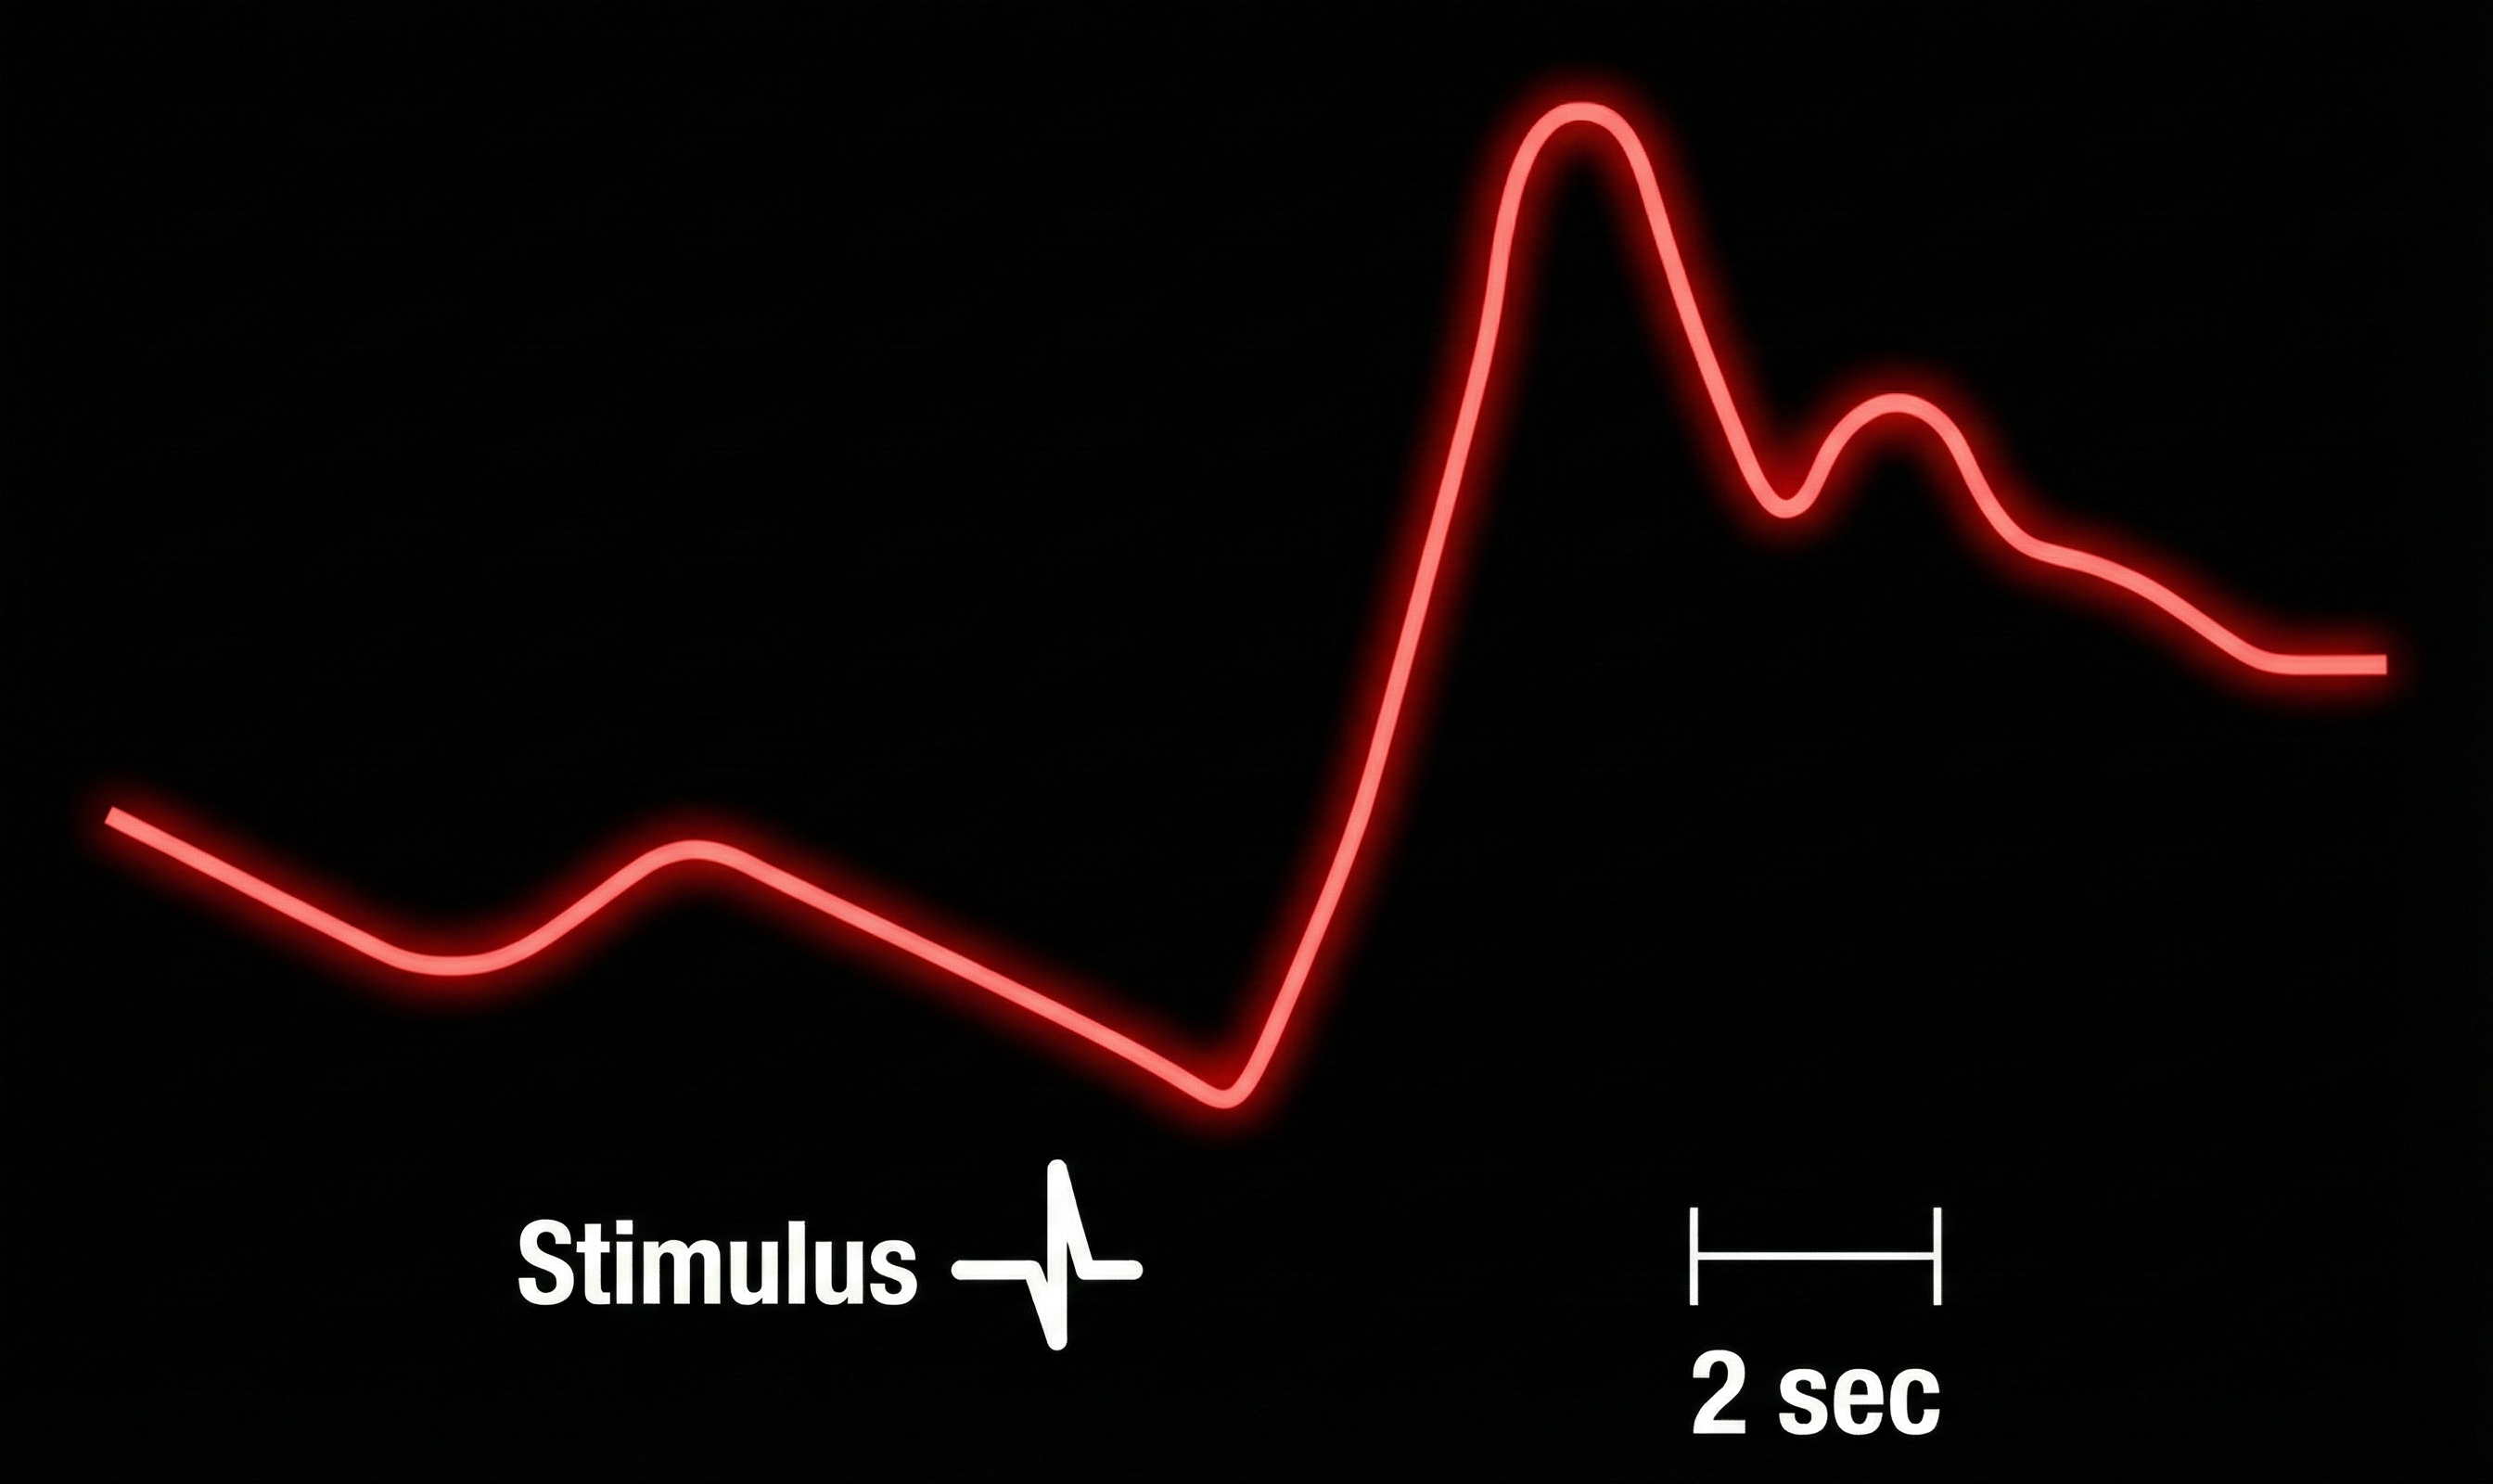
An ER-SCR displays several essential properties: latency, magnitude, amplitude, rise time, and half-recovery time. Latency measures the interval between a stimulus and SCR onset, 1 to 3 seconds.
The magnitude is the average SCR value across all stimulus trials, including those with no response.
The amplitude is the average SCR value from only those trials with a measurable response. The frequently used magnitude metric conflates frequency and amplitude so that increased mean SCR may only reflect changes in frequency. Both amplitude and magnitude depend on electrode recording surface (0.05 to 5 μS; Andreassi, 2000; Schwartz & Andrasik, 2003).
The rise time is the interval between SCR onset and peak, 1 to 3 seconds.
Finally, half-recovery time (rec t/2) is the interval between the SCR peak and 50% recovery of amplitude, 2 to 10 seconds (Dawson et al., 2016). The diagram below was adapted from Schwartz (1995).
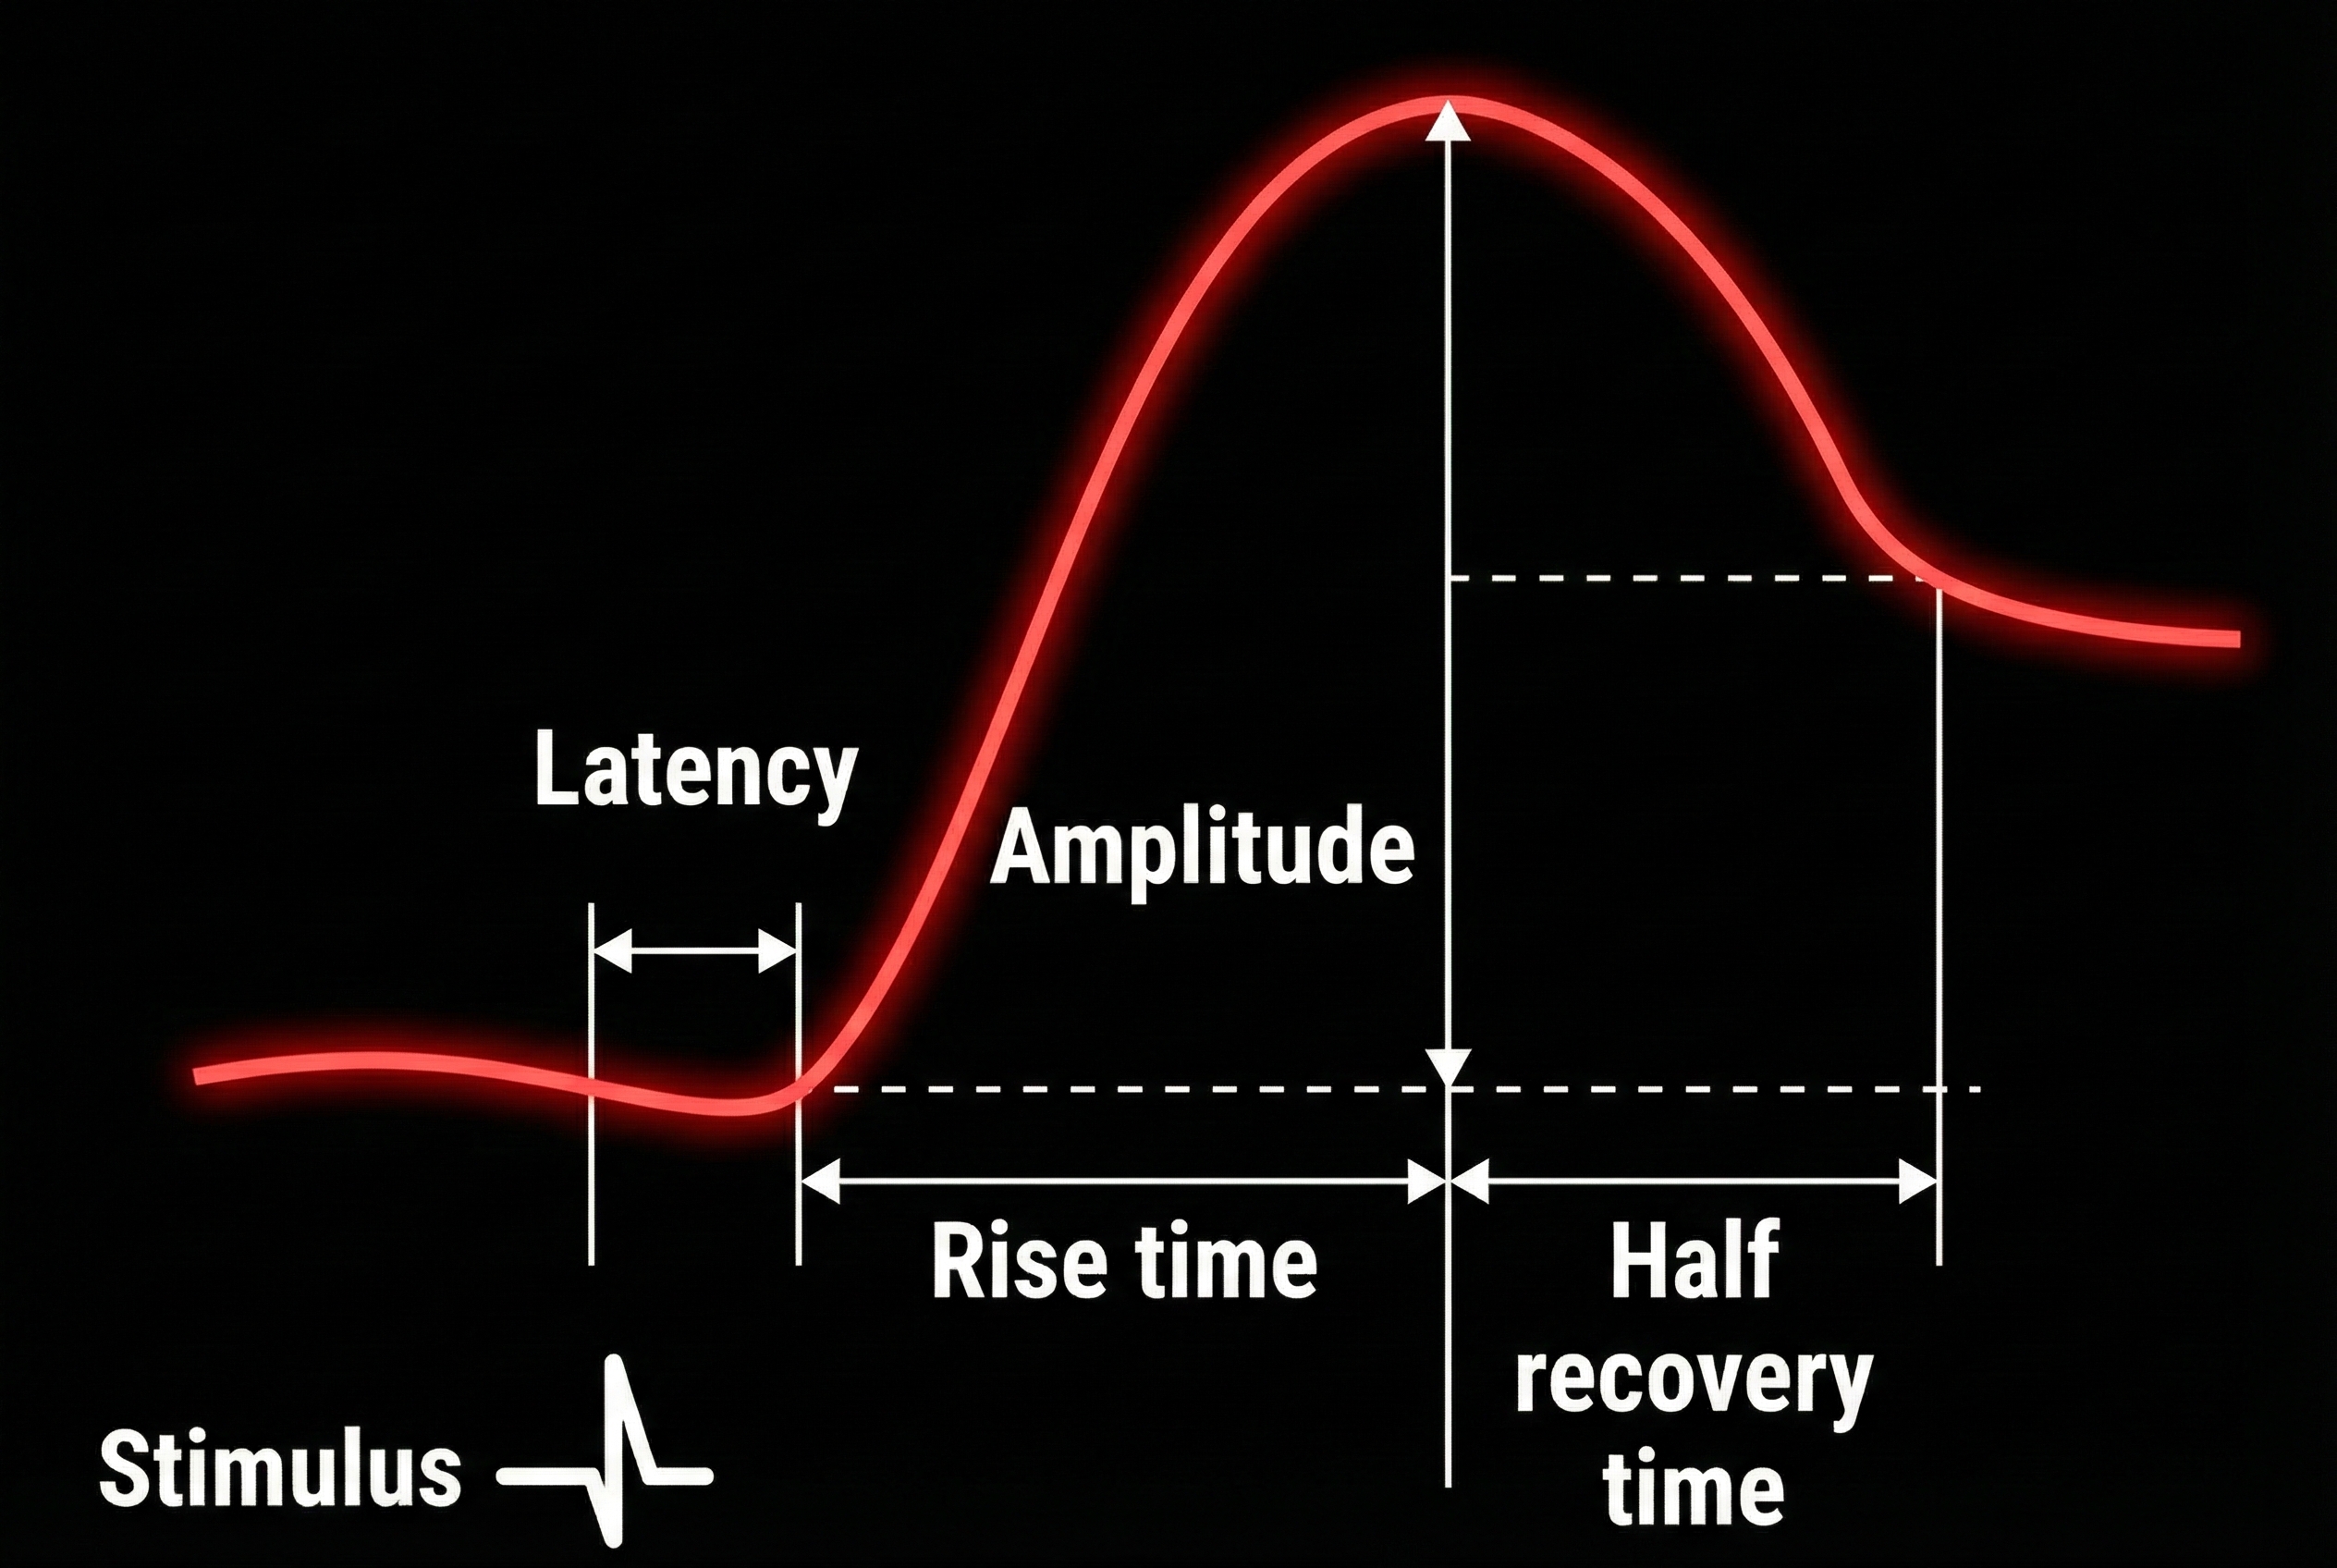
Table of electrodermal measures, definitions, and typical values from Dawson et al. (2016).
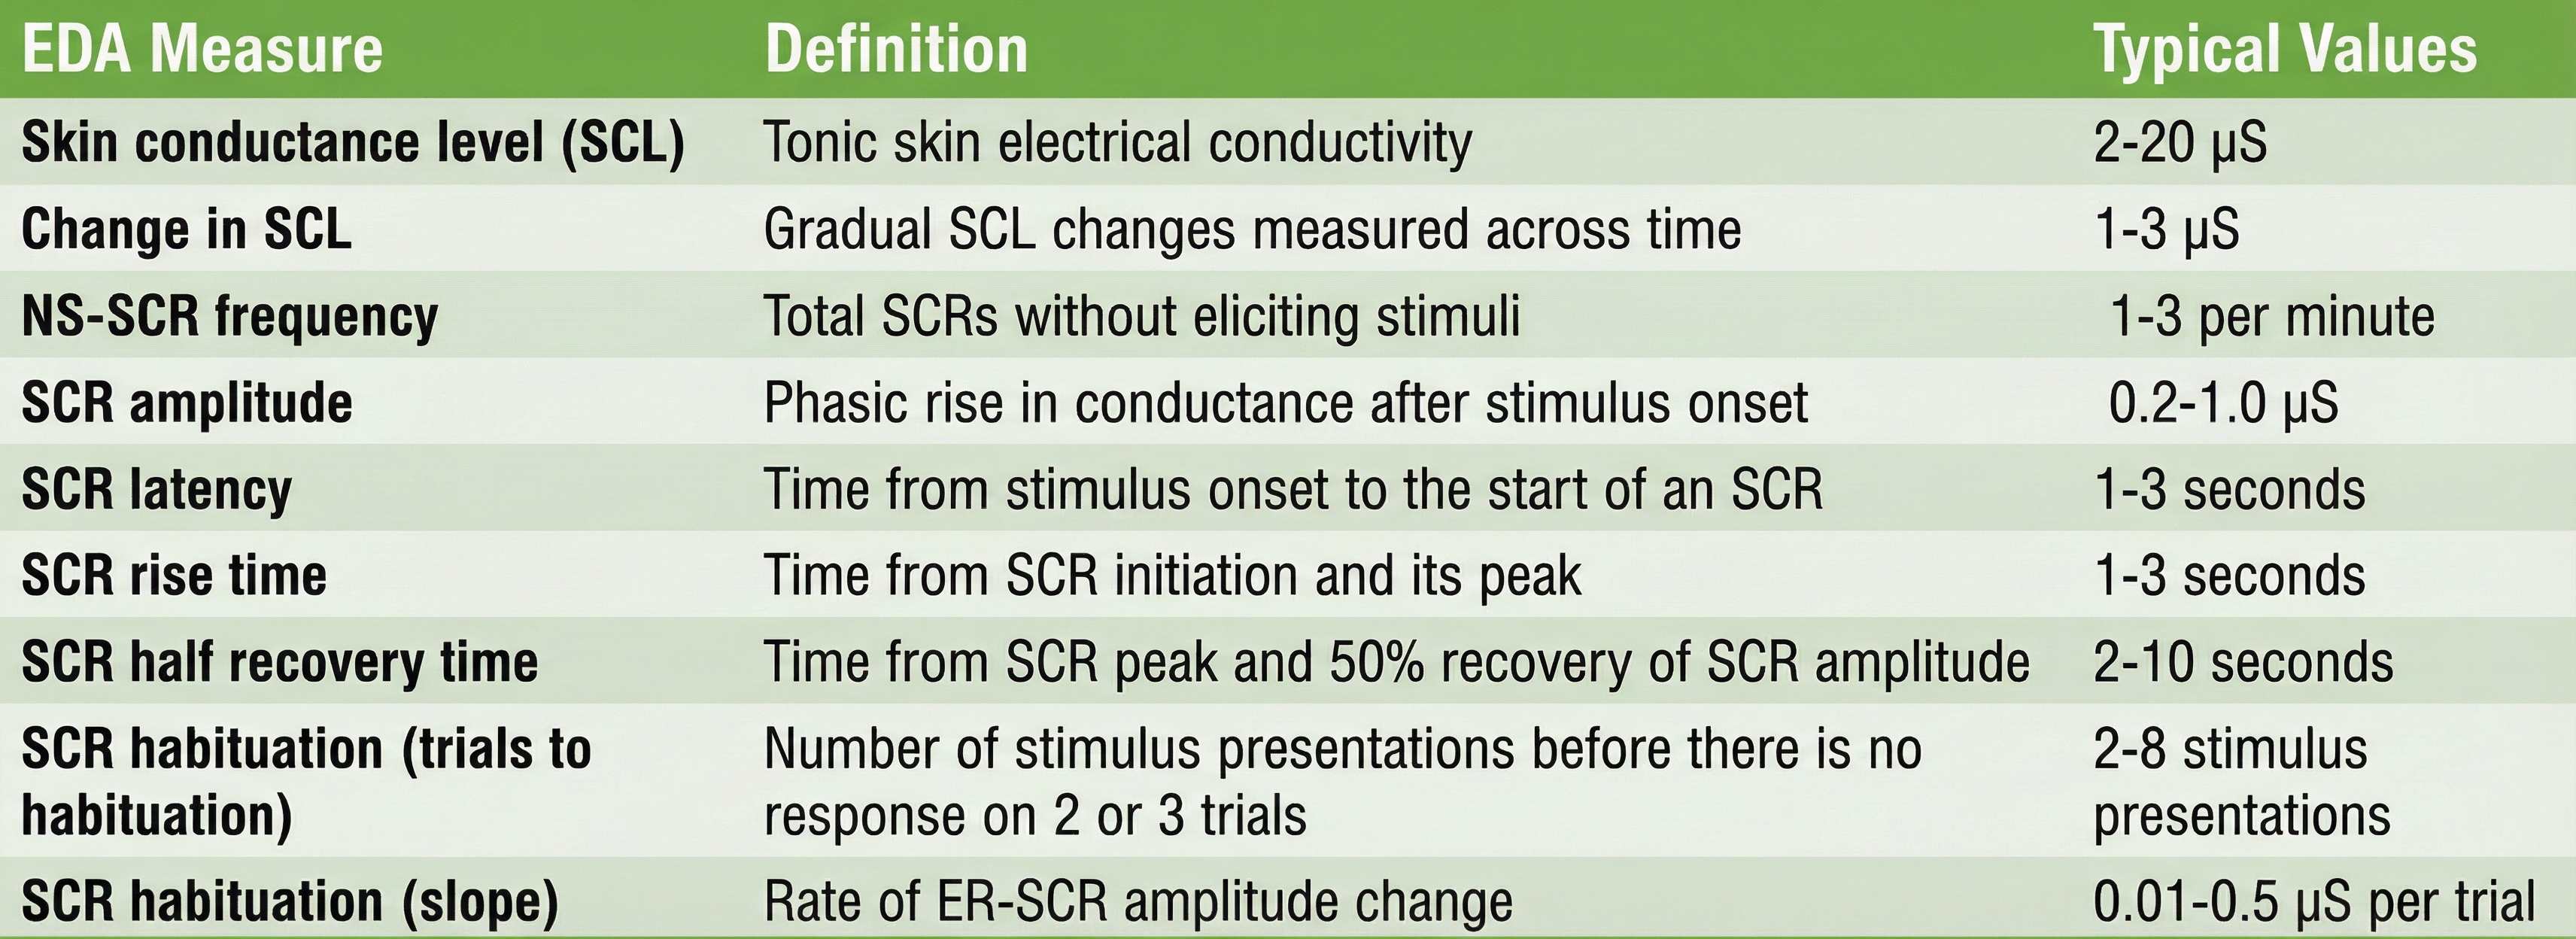
Typically, higher SCL and SCR amplitudes and NS-SCR frequency cluster with short latency, rise time, and recovery time. The correlations among these parameters are under 0.60 (Dawson et al., 2016; Schell et al., 1988; Venables & Christie, 1980).
Skin Resistance
Skin resistance is measured exosomatically using the procedure outlined for skin conductance. Like SCL and SCR, measurements depend on the electrode recording surface. The tonic index is skin resistance level (SRL). Typical values are 10 to 500 Kohms/cm2 (Hassett, 1978). The phasic component is skin resistance response (SRR). Edelberg (1972) suggested that the criterion for an SRR should be 0.1% of baseline resistance. SRR latency is the same as SCR latency, 1 to 3 seconds (Schwartz & Andrasik, 2003).
An SRR is shown in the diagram below, which was adapted from Stern, Ray, and Davis (1980).
Skin conductance is preferred over skin resistance because it directly reflects sweat gland activity, produces normally distributed values, and increases intuitively with arousal. Constant voltage systems prevent driver artifacts by automatically adjusting current; when using constant current systems, limit current density to 10 μA/cm2. AC measurement provides advantages over DC, including reduced signal drift and greater temporal stability—particularly valuable for wearable and ambulatory applications. When using electrode gel, allow 5-10 minutes for stabilization before recording, and use gels with physiologic (0.05 M) salt concentration to avoid artifacts. Proper electrode selection, placement on the intermediate phalanges, and consistent procedures are essential for valid measurements. Understanding the difference between tonic (SCL) and phasic (SCR) components allows clinicians to assess both baseline arousal and moment-to-moment responses to stimuli.
Comprehension Questions: Exosomatic EDA Measures
- Why do psychophysiologists prefer skin conductance over skin resistance for measuring electrodermal activity?
- What is a driver artifact, and how does a constant voltage system prevent it?
- Explain the difference between tonic and phasic electrodermal measurements and give an example of each.
- Why should you use the intermediate phalange rather than the distal phalange for finger electrode placement?
- What is the typical latency range for an event-related skin conductance response?
- Why is electrode stabilization time important, and how long should you wait before recording?
Skin Potential
Skin potential is very useful because it can differentiate between orienting and alarm reactions (Sokolov, 1963). However, it is more difficult to record because the signal contains a direct current (DC) component. Most commercial biofeedback systems measure SC instead of SP.
Sensor Placement
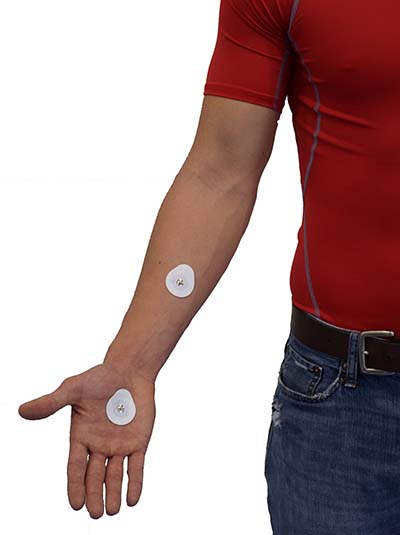
When recording SP, the selection of electrode locations is crucial. SP is measured using a monopolar placement, where one electrode is over an active site (like the palmar surface of the hand), and the reference electrode is over a relatively inactive site (forearm), as shown below. You may place an additional reference lead on an inactive site (forearm) on the same side of the body when 50/60Hz artifact is a problem (Andreassi, 2007). A monopolar SP electrode placement is shown below.
Skin potential is measured endosomatically by placing an active electrode over a site (like the hand's palmar surface) and a reference electrode over a relatively inactive site (forearm). SP is the voltage difference between sweat glands and internal tissues (Hassett, 1978). Unlike SC and SR, SP measurements do not depend on the electrode recording surface. The tonic component is skin potential level (SPL). Typical values are +10 to -70 mV (referenced to the inactive electrode). The phasic component is skin potential response (SPR), which typically includes a negative limb up to 2 mV and a positive limb up to 4 mV (Stern, Ray, & Quigley, 2001).
Recording Procedure
Always use conductive gel when recording SP.
Whereas SC and SR are often measured using dry electrodes (no conductive gel), SP measurements, like ECG or EMG measurements, are cleaner and less prone to artifacts when using conductive gel. Why the difference? SC and SR are exosomatic measures where an external current is applied—the imposed current creates conductance pathways even with dry electrodes. In contrast, SP is an endosomatic measure of the skin's own voltage—no external current is applied, so the electrode-skin interface quality directly affects signal quality. Without gel, the high impedance at the electrode-skin junction degrades the weak endogenous potential signal.
Skin preparation may involve abrasion of the inactive site using an abrasive paste. The bias or potential difference between the two electrodes should be kept below 1 mV to prevent confusing gradual electrode drift with a gradual change in SPL. A researcher can measure bias before and after data collection by placing the electrode pair in a saline solution and measuring the resulting SPL (Stern, Ray, & Quigley, 2001).
Signal Properties
SPR has the same 1 to 3 second latency as SCR and SRR.
The amplitudes of palmar SCRs and SPRs are highly correlated during a single recording session (Wilcott, 1967). The SPR can exhibit a monophasic waveform (negative or positive), biphasic waveform (negative, then positive), or triphasic waveform (negative, positive, then negative). The classic pattern is biphasic, as shown in the diagram below adapted from Stern, Ray, and Davis (1980). A negative voltage is recorded upward by convention (Stern, Ray, & Quigley, 2001).
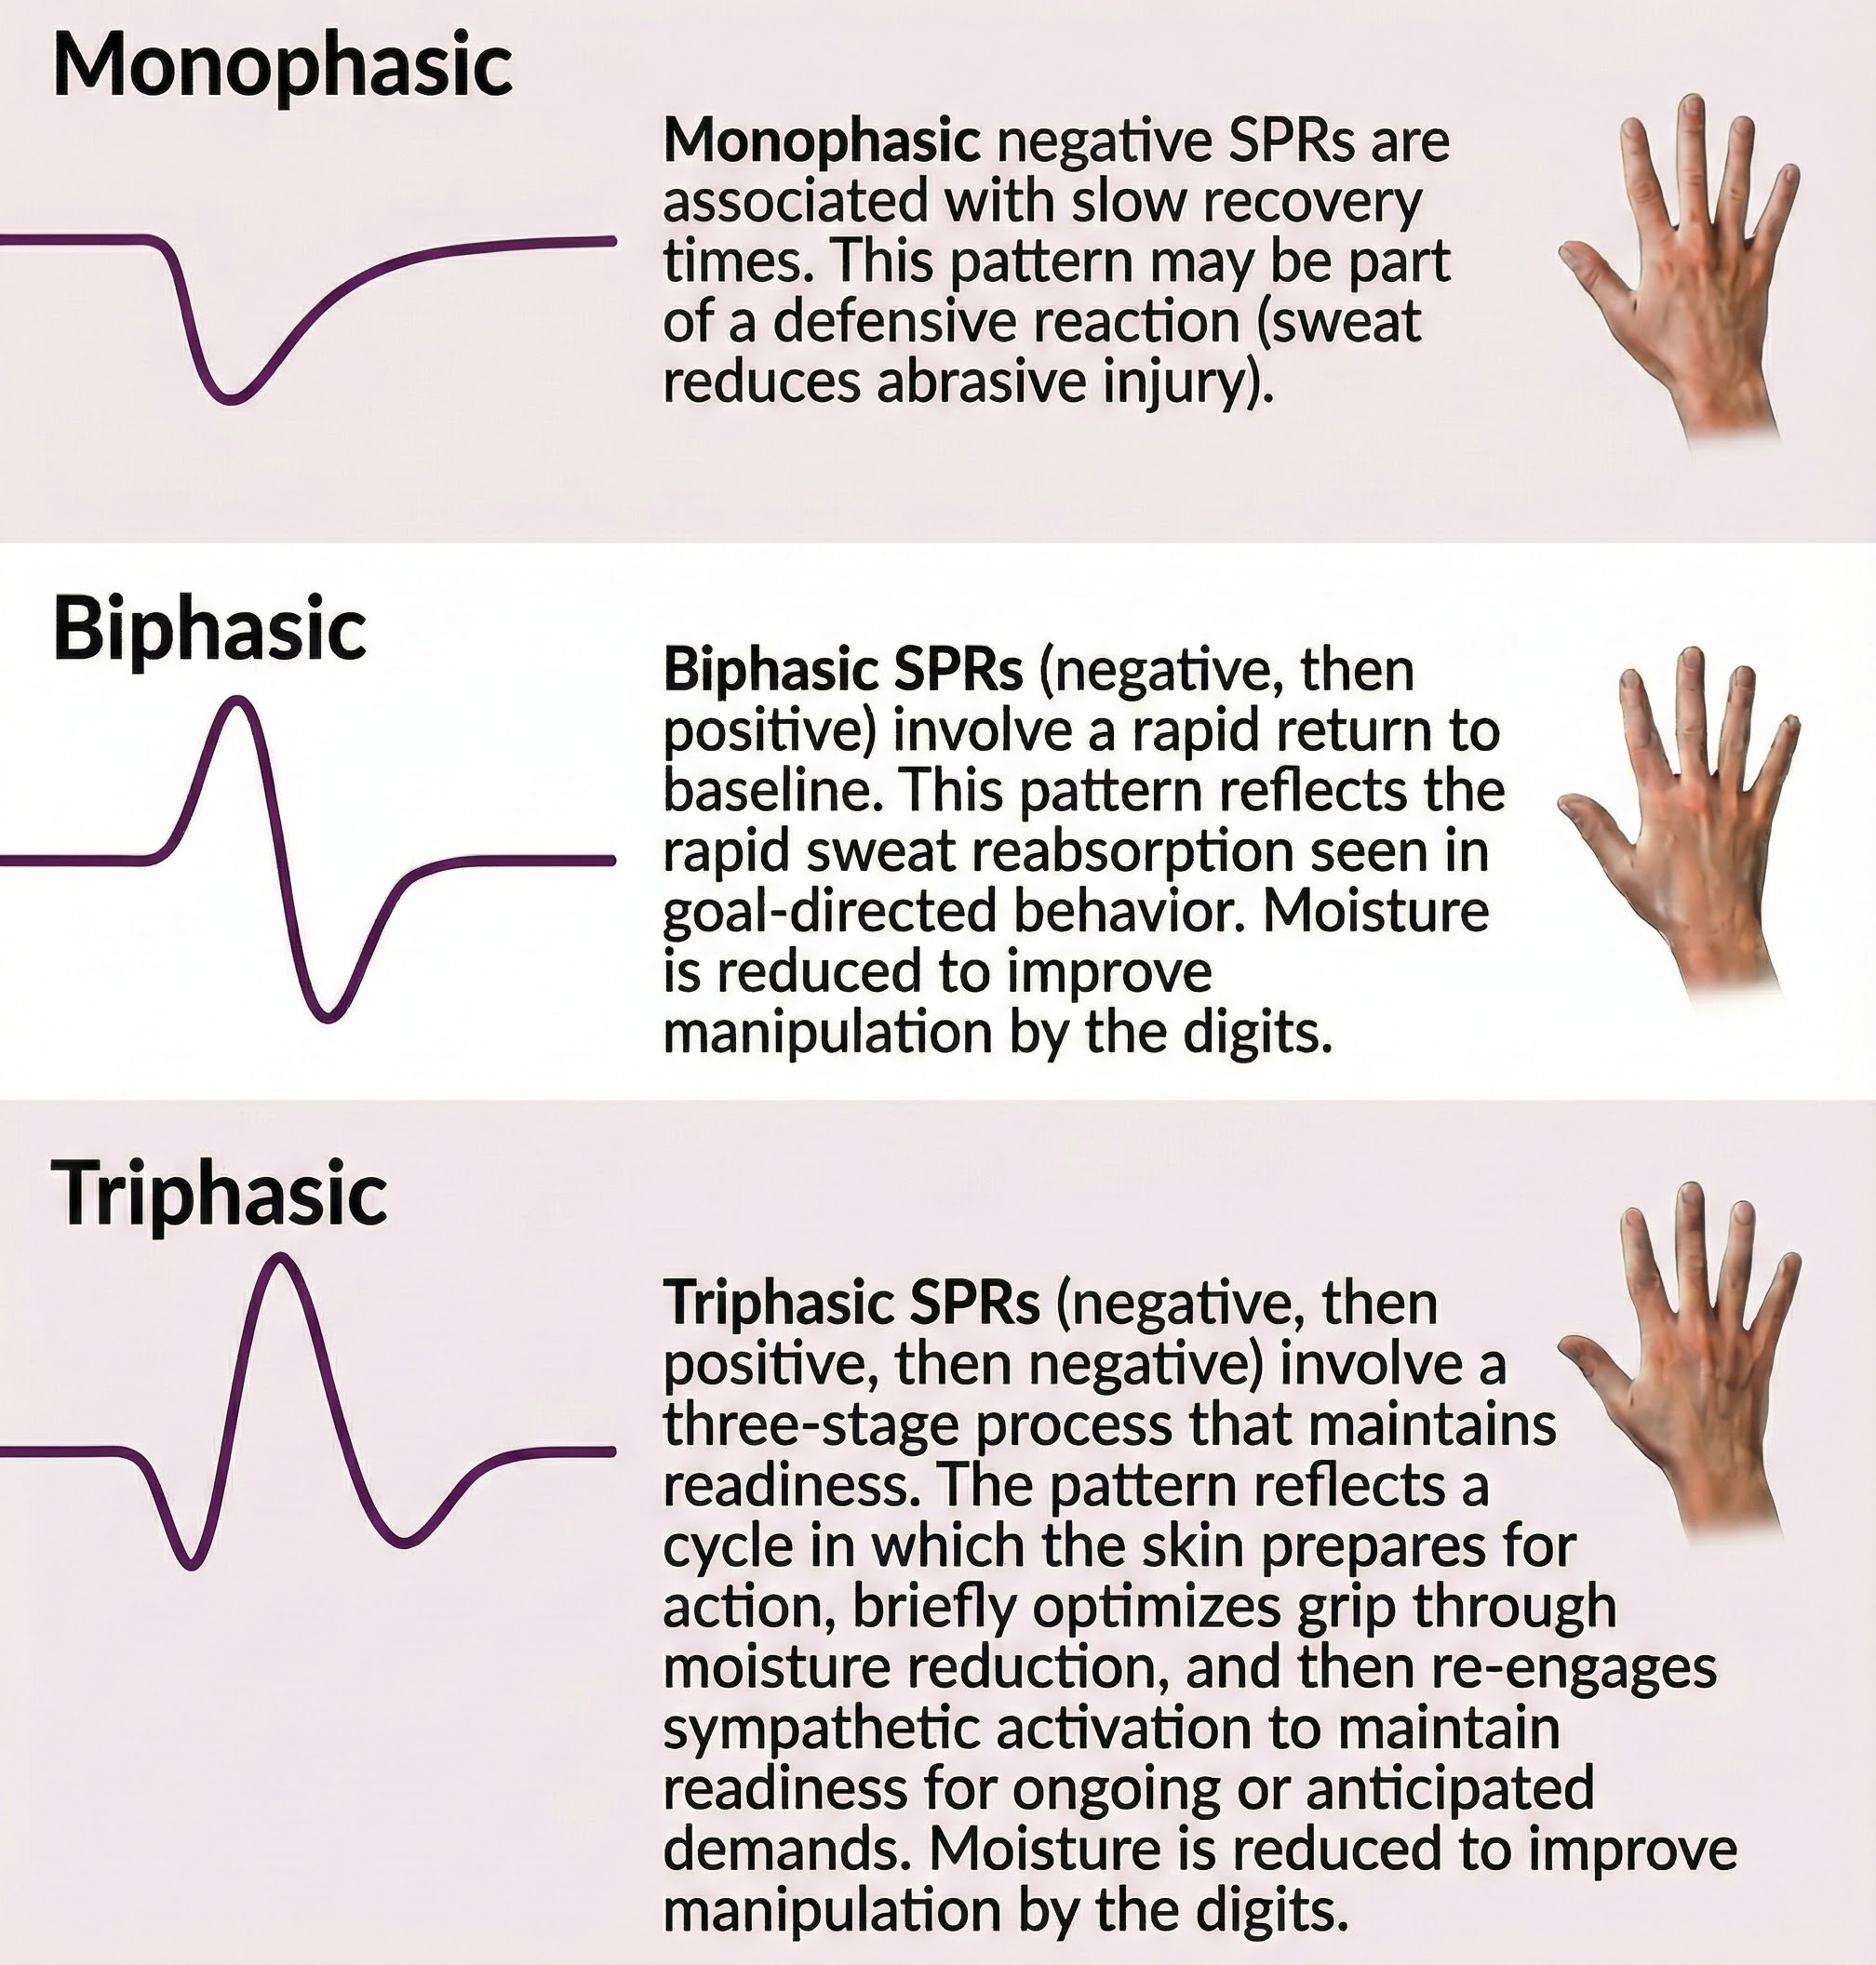
Human skin acts like a negatively charged membrane that is particularly permeable to cations (positive ions) (Edelberg, 1971). At rest, SPL mainly reflects the epidermal potential. When SPRs occur, they increase skin potential negativity. This relationship implies that sweat gland potentials contribute more to the SPR than epidermal potentials. Microelectrode studies confirm that the sweat gland pore is more negative than the corneum surface (Edelberg, 1968).
Comprehension Questions: Skin Potential
- What clinical advantage does skin potential offer over skin conductance?
- Why is monopolar placement necessary for recording skin potential?
- Describe the three types of SPR waveforms and what the classic pattern looks like.
- Why must you always use conductive gel when recording skin potential but not necessarily for skin conductance?
The Electrodermograph
Signal Processing
A specialized amplifier processes the EDA signal. An operational amplifier converts current to a proportional DC voltage for skin conductance and resistance. Analogous circuitry is used to process the temperature signal.
A DC signal amplifier boosts the voltage to usable levels for skin potential, which is already a voltage. Following amplification by an operational amplifier or DC signal amplifier, a low pass filter (2.5 Hz) may reject higher frequency artifacts like 50/60Hz.
Sampling Rate Considerations. Digital recording systems sample the EDA signal at various rates depending on the application. Laboratory equipment typically samples at 64 Hz or higher, providing excellent temporal resolution for detecting rapid phasic changes. Most wearable devices sample at 4 Hz (e.g., Empatica devices), which is adequate for capturing tonic changes and larger phasic responses but may miss subtle, rapid SCR dynamics. Higher sampling rates are preferred for research requiring precise latency and rise time measurements.
Standard Filter Settings. A bandpass filter of 0.05 Hz to 2 Hz is commonly applied to EDA signals. The high-pass component (0.05 Hz) removes slow baseline drift, while the low-pass component (2 Hz) eliminates high-frequency noise and muscle artifact. Some analysis approaches use continuous decomposition methods to mathematically separate tonic (SCL) and phasic (SCR) components rather than relying solely on filtering.
SCR Detection Thresholds. The traditional threshold for identifying an SCR is 0.05 μS, representing a visible deflection in early paper chart recorders. Modern digital systems often use a more sensitive criterion of 0.01 μS for event-related SCRs. The choice of threshold affects both the number of detected responses and the minimum amplitude considered meaningful. Clinicians should document which threshold they use to ensure consistency across sessions and comparability with published research.
Smartphones and tablets can now function as electrodermographs with specialized hardware and apps like Mindfield's eSense Skin Response and Thought Technology Ltd.'s eVu TPS.
🎧 Watch an eVu TPS Demonstration
Measurement Precautions
Four concerns for optimal measurement when monitoring EDA are individual differences, movement artifact, skin condition, and room temperature.
Individual Differences
Individual differences can significantly affect EDA measurement. Researchers have shown that age, race, lability-stability (Lacey & Lacey, 1958), and stage of the menstrual cycle influence EDA (Stern, Ray, & Quigley, 2001). Usually, older people with drier hands or calloused hands have significantly lower SCLs and SCRs, while children have higher SCLs and SCRs (Shaffer, Combatalade, Peper, & Meehan, 2016).
Loose Electrodes
Loose electrodes will cause variations in the electrode surface area touching the skin and generate sudden rises and falls in the signal, which are too fast to be normal SCRs. To check for loose electrodes, gently tug on each electrode lead while watching the signal on the screen. Tightening the electrode band or using a clean adhesive electrode will fix the problem.
Drift
On some systems, you may occasionally observe slow upward drifting of the baseline value. This type of drift is not related to physiological responses and may be caused by electrode polarization or sweat buildup. Using fresh silver/silver-chloride electrodes, using finger band electrodes instead of adhesive ones, and making sure that the person's hands are not closed (preventing air circulation) may reduce the occurrence of drift. Many EDA systems use a bandpass filter (0.05 Hz to 2 Hz) to remove drift and high-frequency artifacts.
Sensor Interference
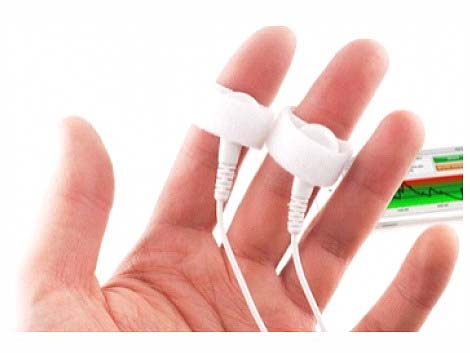
Occasionally, clinicians will place two SC sensors on a person to measure skin conductance bilaterally and assess left/right brain dominance. Placing the sensors on each hand should be acceptable, but if the two sensors are placed too close together, they may interfere with each other. Interference appears as a stair-step pattern in one of the signals.
Movement
Movement artifact results when movement increases or decreases electrode contact with the skin. This problem is less severe with recessed precious metal electrodes prepared with conductive gel. Movement artifacts can be reduced by instruction to minimize movement and confirming compliance. Tape the sensor cable to the client's blouse or shirt for strain relief. Ensure that the client is in a stable, comfortable position. Sensors may also be placed on the non-dominant hand during tasks that require one hand. When this artifact occurs, it is easily discriminated from valid EDA waveforms by visual inspection of the raw waveform (Peek, 1987).
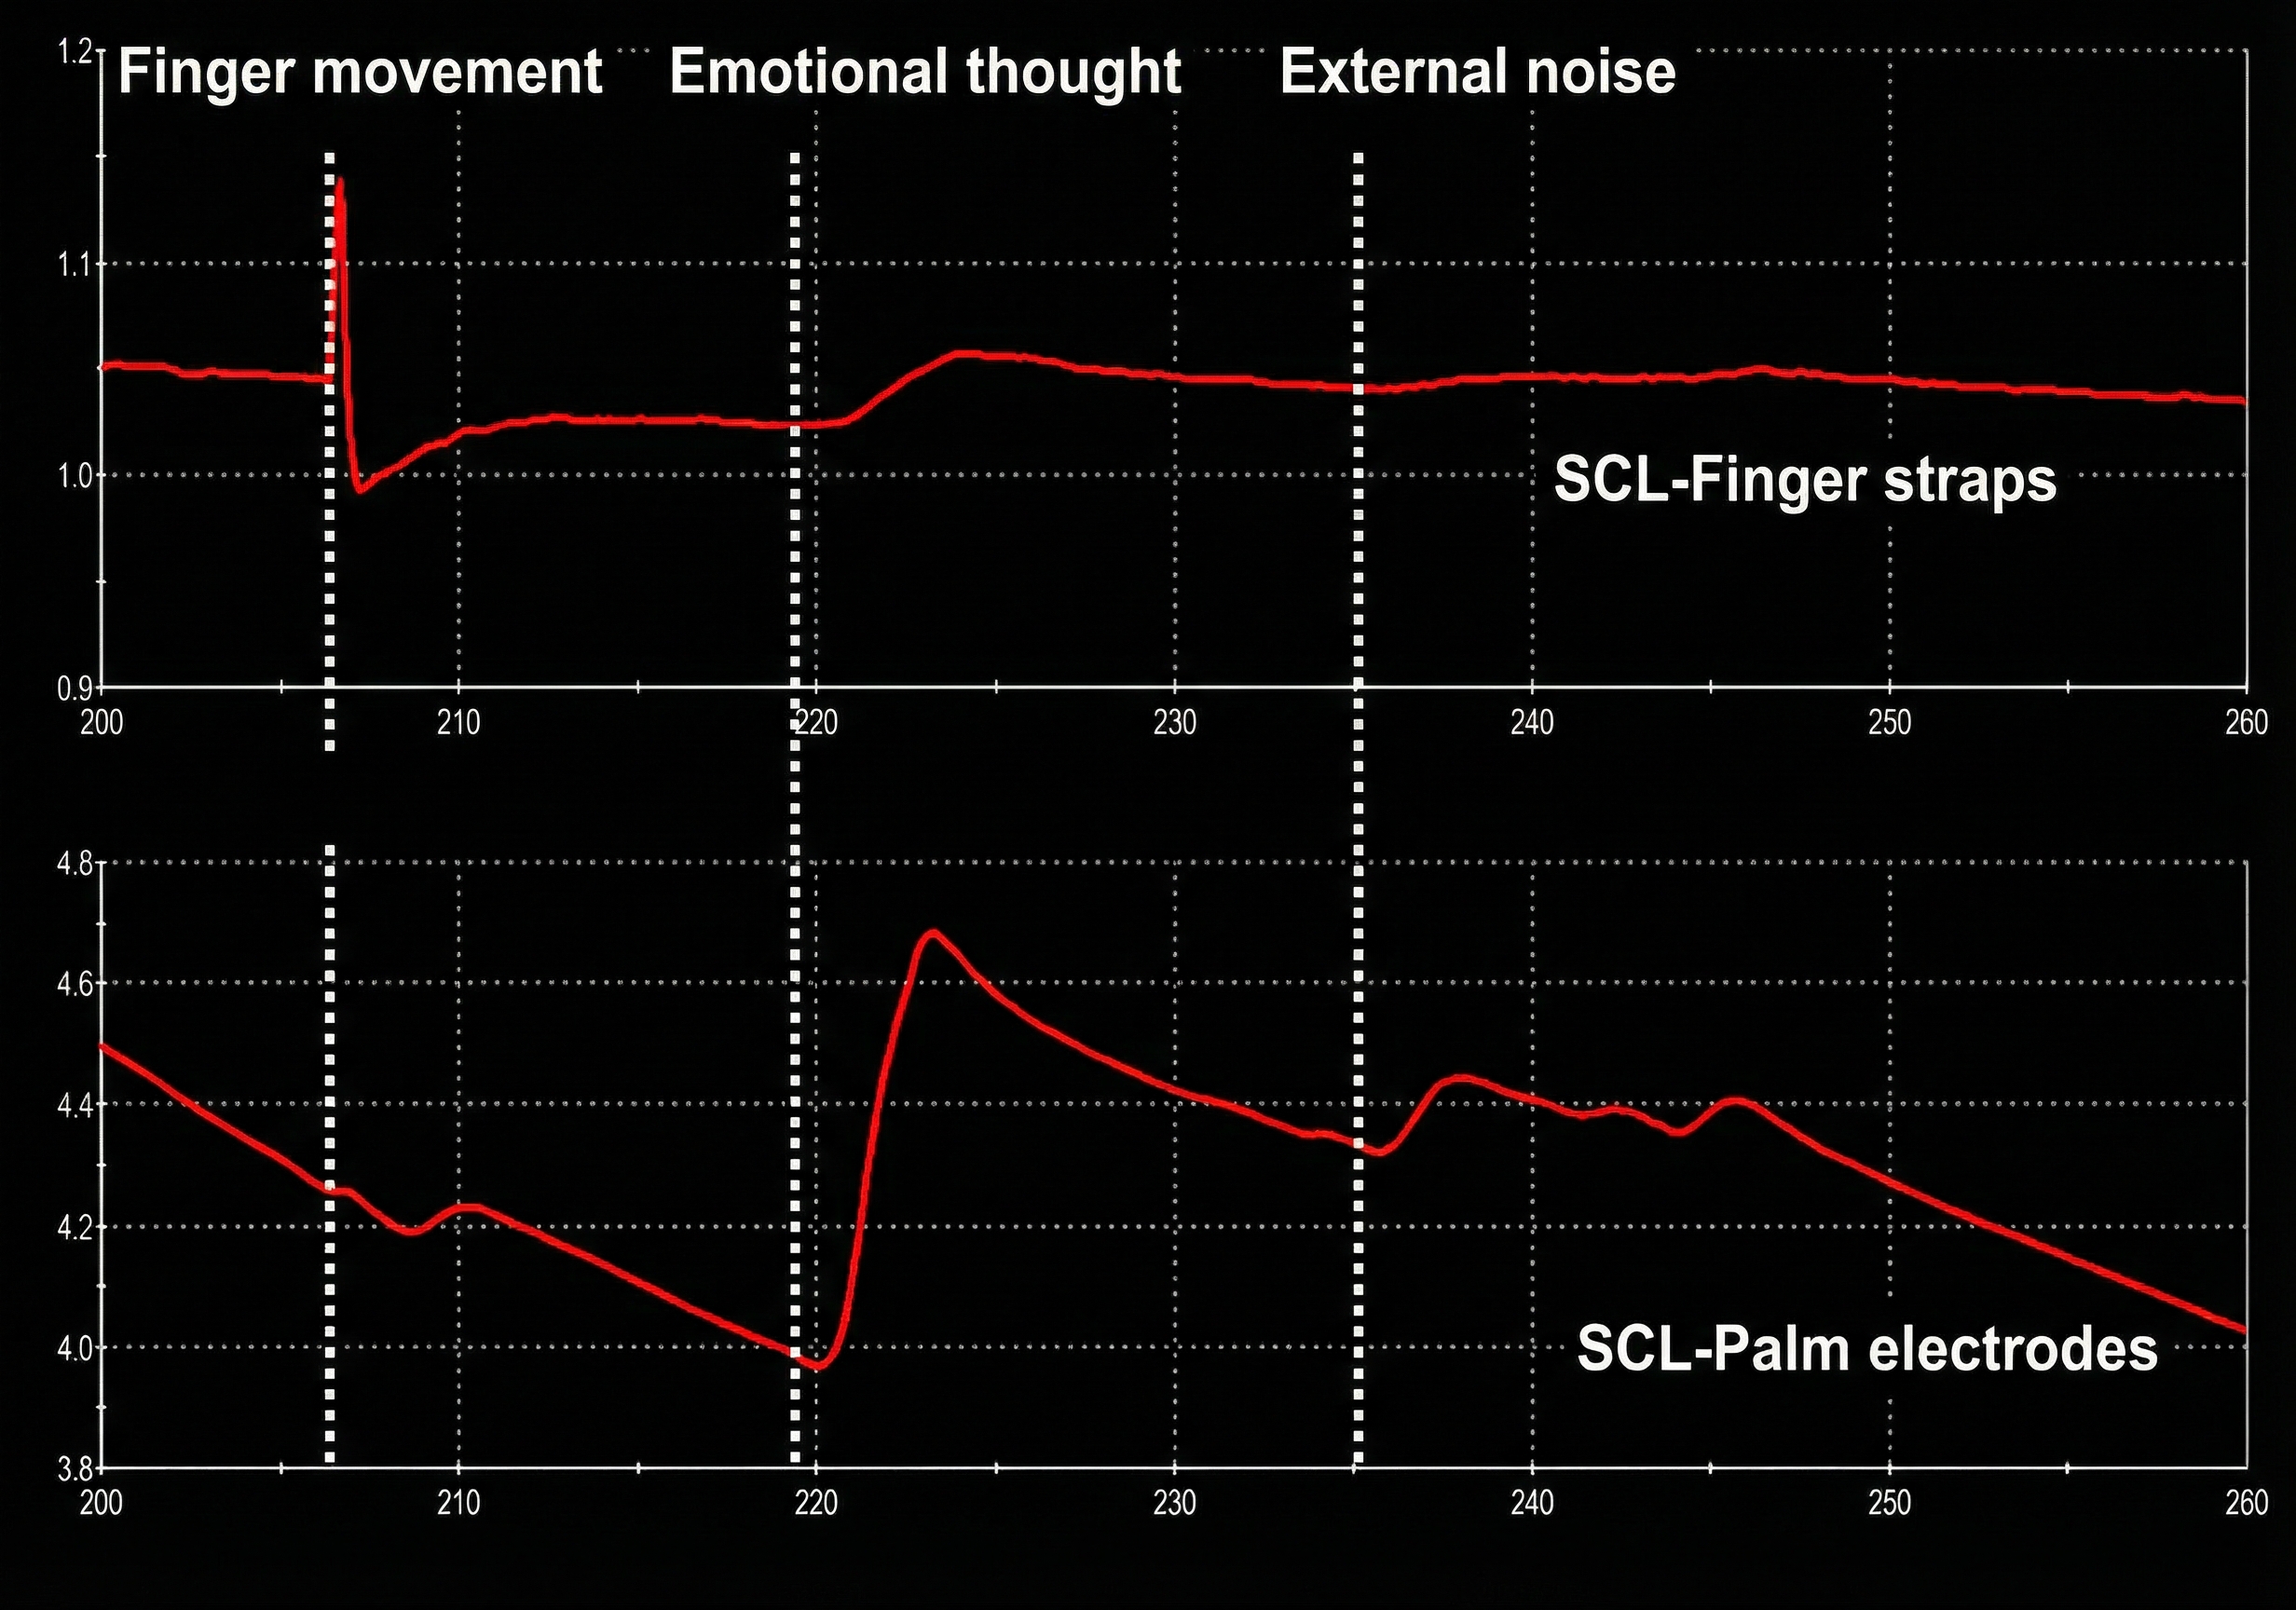
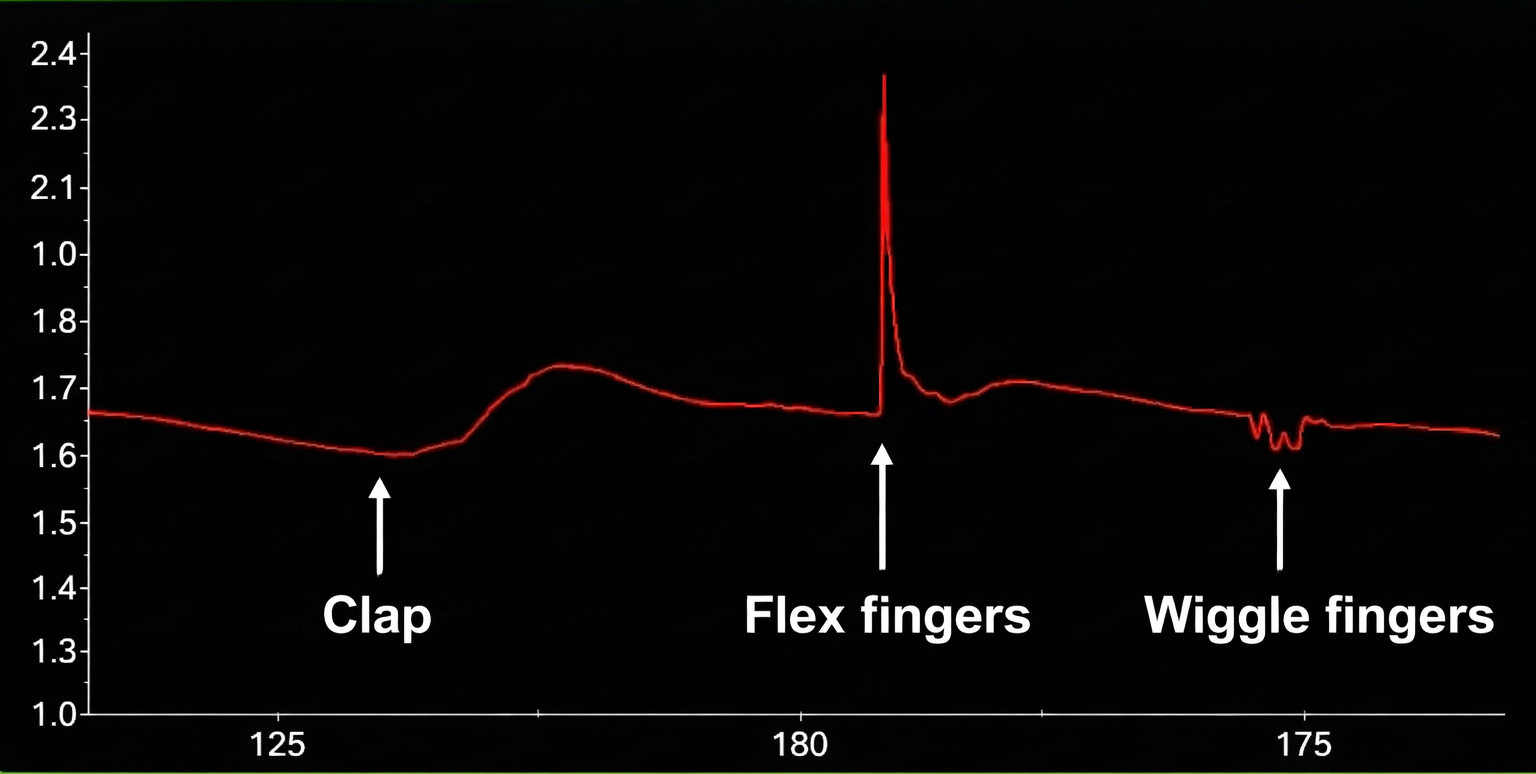
The graphic below shows a finger movement artifact compared to an SCR to the sound of a clap. It is reproduced with permission from Peper, Gibney, Tylova, Harvey, and Combatalade (2008).
Below is a BioGraph® Infiniti skin conductance display of movement artifact.
Skin Condition
Skin condition affects EDA in several ways. Calluses may increase epidermal resistance and lower SC values (Peek, 1987), while abrasions through the highly-resistant epidermis can raise SC readings. Epidermal abrasions are very rare. These problems can be prevented by not placing electrodes over sites that have been callused or abraded.
Depending on individual differences, SCL values can fall sharply after washing hands with soap and water, removing surface salt. Measurement reliability may be increased by asking a client not to wash (or wash) immediately before each session (Peek, 1987). To ensure valid comparisons, always use the same skin preparation procedure.
Hand Temperature
Hand temperature may lower or raise EDA values. When clients are cold, SC may decrease. Warmer-than-normal rooms may increase SC (Venables & Christie, 1980). Excessively high temperatures and humidity may produce thermoregulatory sweating and increased SC unrelated to psychophysiological activity (Peek, 1987). Room temperature and humidity should be regulated across sessions to prevent artifactual values. Time of day, day of the week, and season should also be controlled as potentially confounding environmental variables (Stern, Ray, & Quigley, 2001).
Respiration Pattern
Respiration patterns can subtly affect SCL values. For example, rapid, shallow, thoracic breathing and (particularly) sighing may increase SCRs (Shaffer, Combatalade, Peper, & Meehan, 2016). Usually, when people sigh or habitually breathe shallowly and thoracically, SCL measurements are higher. See Unit 3 in Peper, Gibney, Tylova, Harvey, and Combatalade's (2008) Biofeedback Mastery: An Experiential Teaching and Self-Training Manual for a detailed methodology to investigate SCL artifacts.
Consistency
You can best compare changes in client EDA activity if you use a consistent measurement protocol. Standardize handwashing (optional), application of conductive gel (optional), sensor placement, room temperature, and task (e.g., eyes-closed resting baseline) so that within- and across-session comparisons will be valid. Resting baselines should never provide real-time feedback because this would introduce an unpredictable source of variability.
Consistent with Green and Green's (1977) psychophysiological principle, when an SCR occurs in a person sitting quietly with no external stimuli, it may be a response to a covert change in breathing, cognition, or emotion. Remember that many individuals, especially those who are vigilant or feel unsafe, respond with an SCR to stimuli such as sounds, lights, being touched, and people moving closer (Shaffer, Combatalade, Peper, & Meehan, 2016).
The electrodermograph uses operational amplifiers and low-pass filters to process EDA signals accurately. Laboratory equipment typically samples at 64 Hz or higher, while wearable devices often sample at 4 Hz. Standard bandpass filtering (0.05-2 Hz) removes both slow drift and high-frequency noise. SCR detection thresholds of 0.01-0.05 μS are commonly used. Modern smartphones can function as portable electrodermographs with appropriate sensors. Multiple factors can compromise measurement accuracy, including individual differences (age, skin condition), loose electrodes, signal drift, movement, hand temperature, and respiration patterns. Consistent measurement protocols are essential for valid within- and across-session comparisons. Always inspect the raw signal to identify artifacts before interpreting calculated values.
Comprehension Questions: The Electrodermograph
- How does a low-pass filter improve electrodermal recordings?
- What artifact pattern would you expect to see if a client's electrodes were loose?
- Why might an older client with calloused hands show lower SCL values than a younger client?
- How can respiration patterns affect skin conductance measurements?
- Why should resting baselines never provide real-time feedback?
- What is the difference in sampling rates between laboratory equipment and wearable devices, and why does this matter?
Skin Conductance Patterns
SCRs are produced by sympathetic activation triggered by internal emotions, imagery, memories, and thoughts, and external stimuli like ringtones. Toomim and Toomim (1975) proposed three response patterns: variable-reactors, over-reactors, and under-reactors.
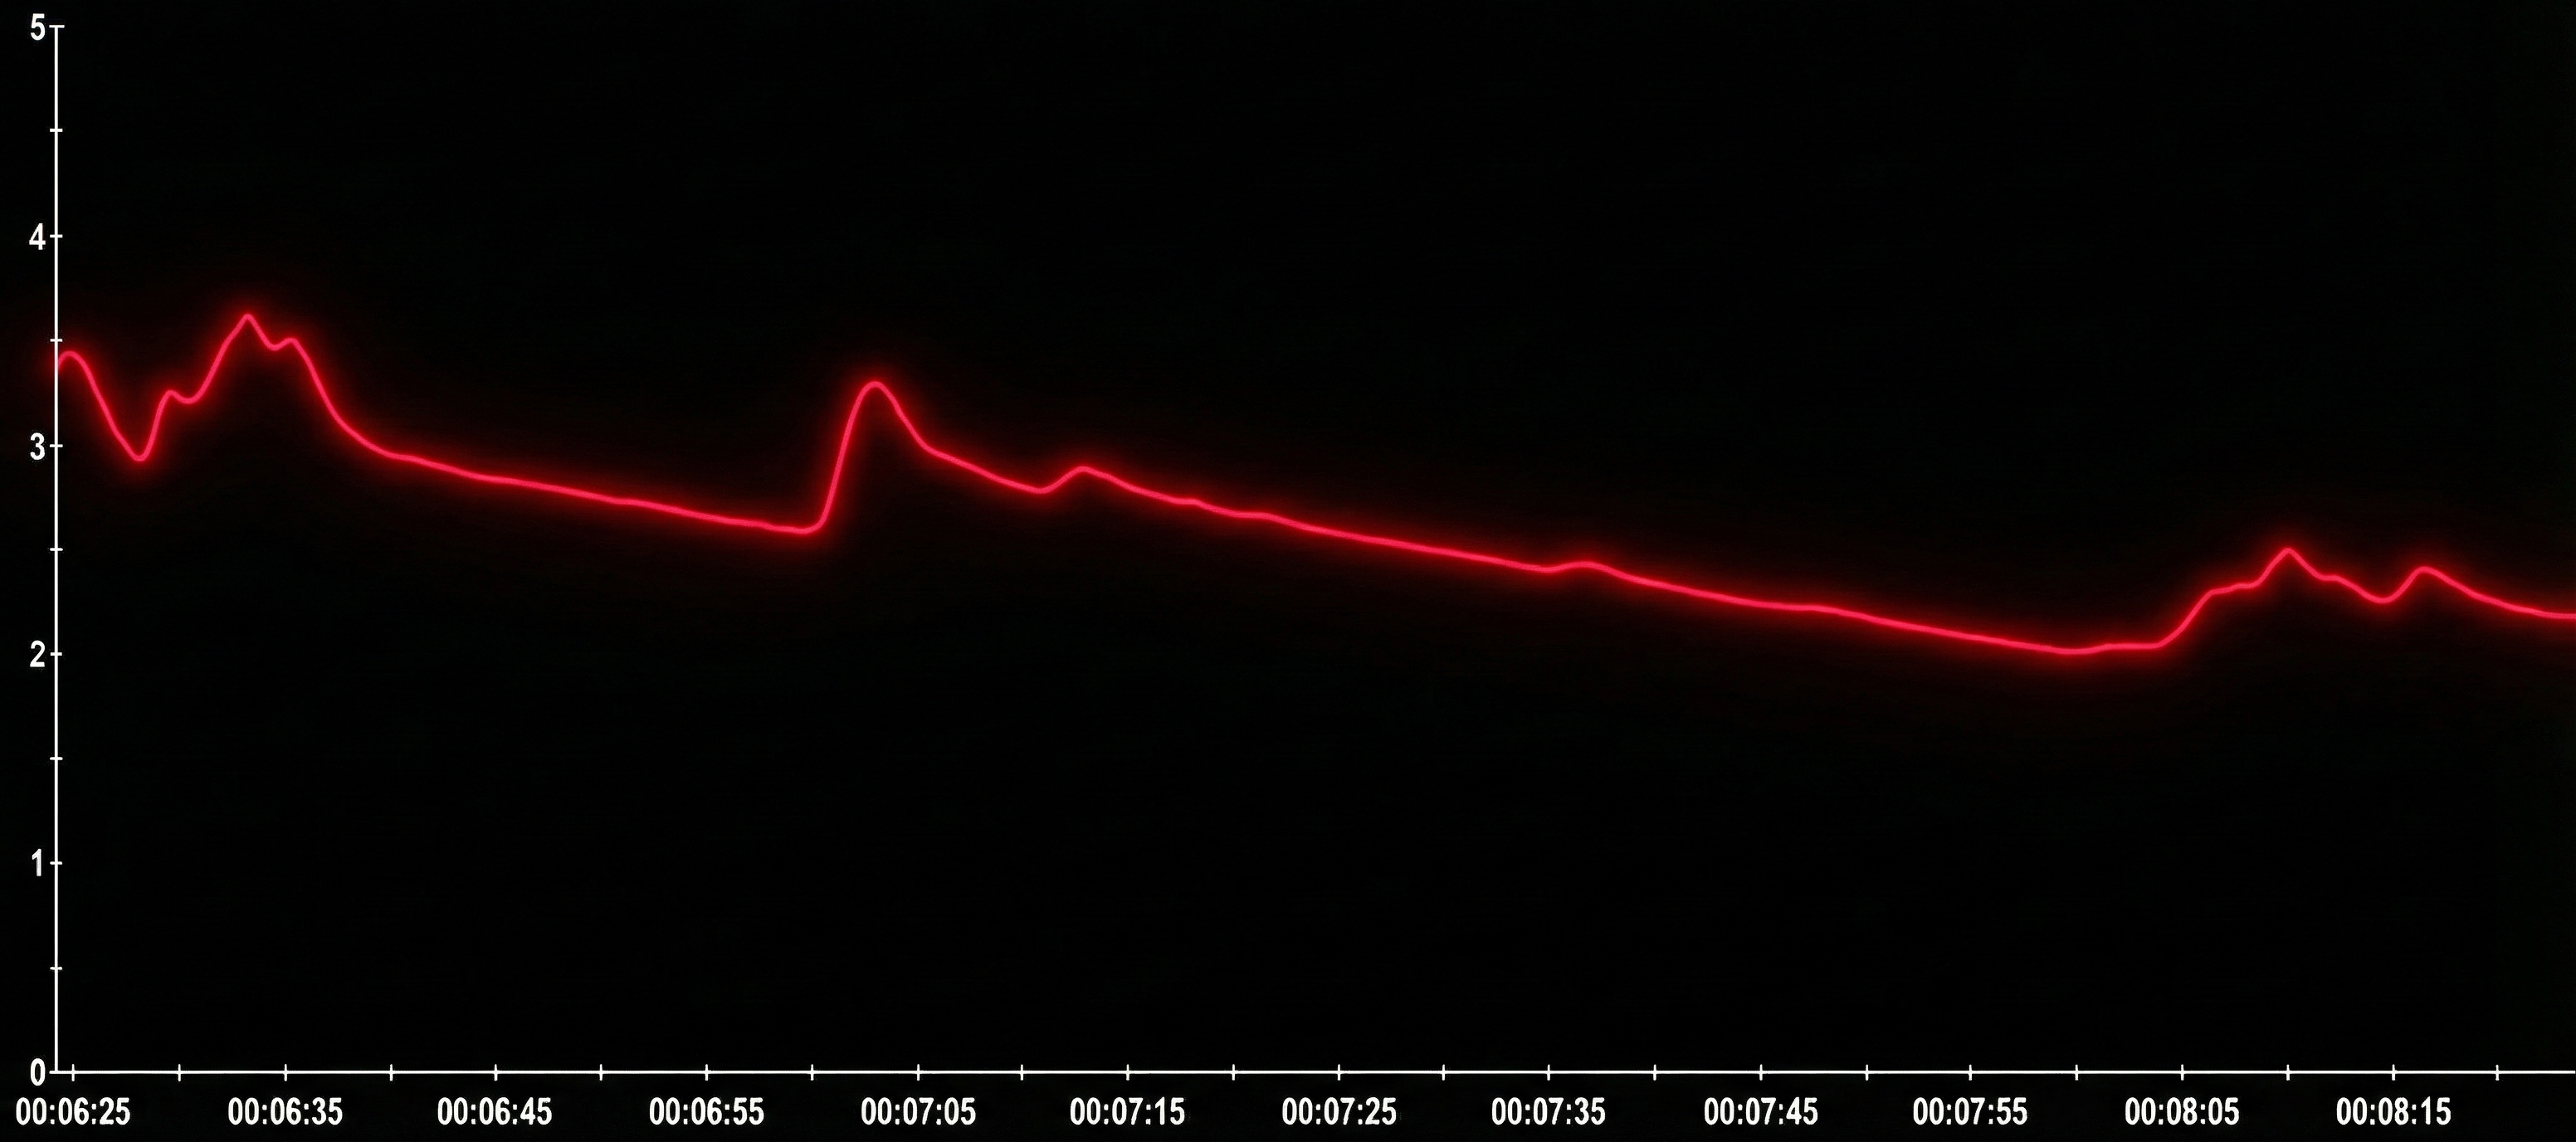
Variable-reactors produce SCRs in response to a stimulus like a loud clap and quickly return to baseline. A variable-reactor's skin conductance signal shows occasional SCRs and a progressively decreasing SCL. Note the amplitude scale between 0 and 5 microsiemens. Graphic reproduced with permission from Didier Combatalade, Thought Technology, Ltd.
Over-reactors continuously produce SCRs as if they need excessive sympathetic arousal. They overreact to stimuli with high-amplitude responses and slowly return to baseline. An over-reactor's skin conductance signal shows multiple SCRs and a high SCL. Note the amplitude scale between 0 and 16 microsiemens. Graphic reproduced with permission from Didier Combatalade, Thought Technology, Ltd.
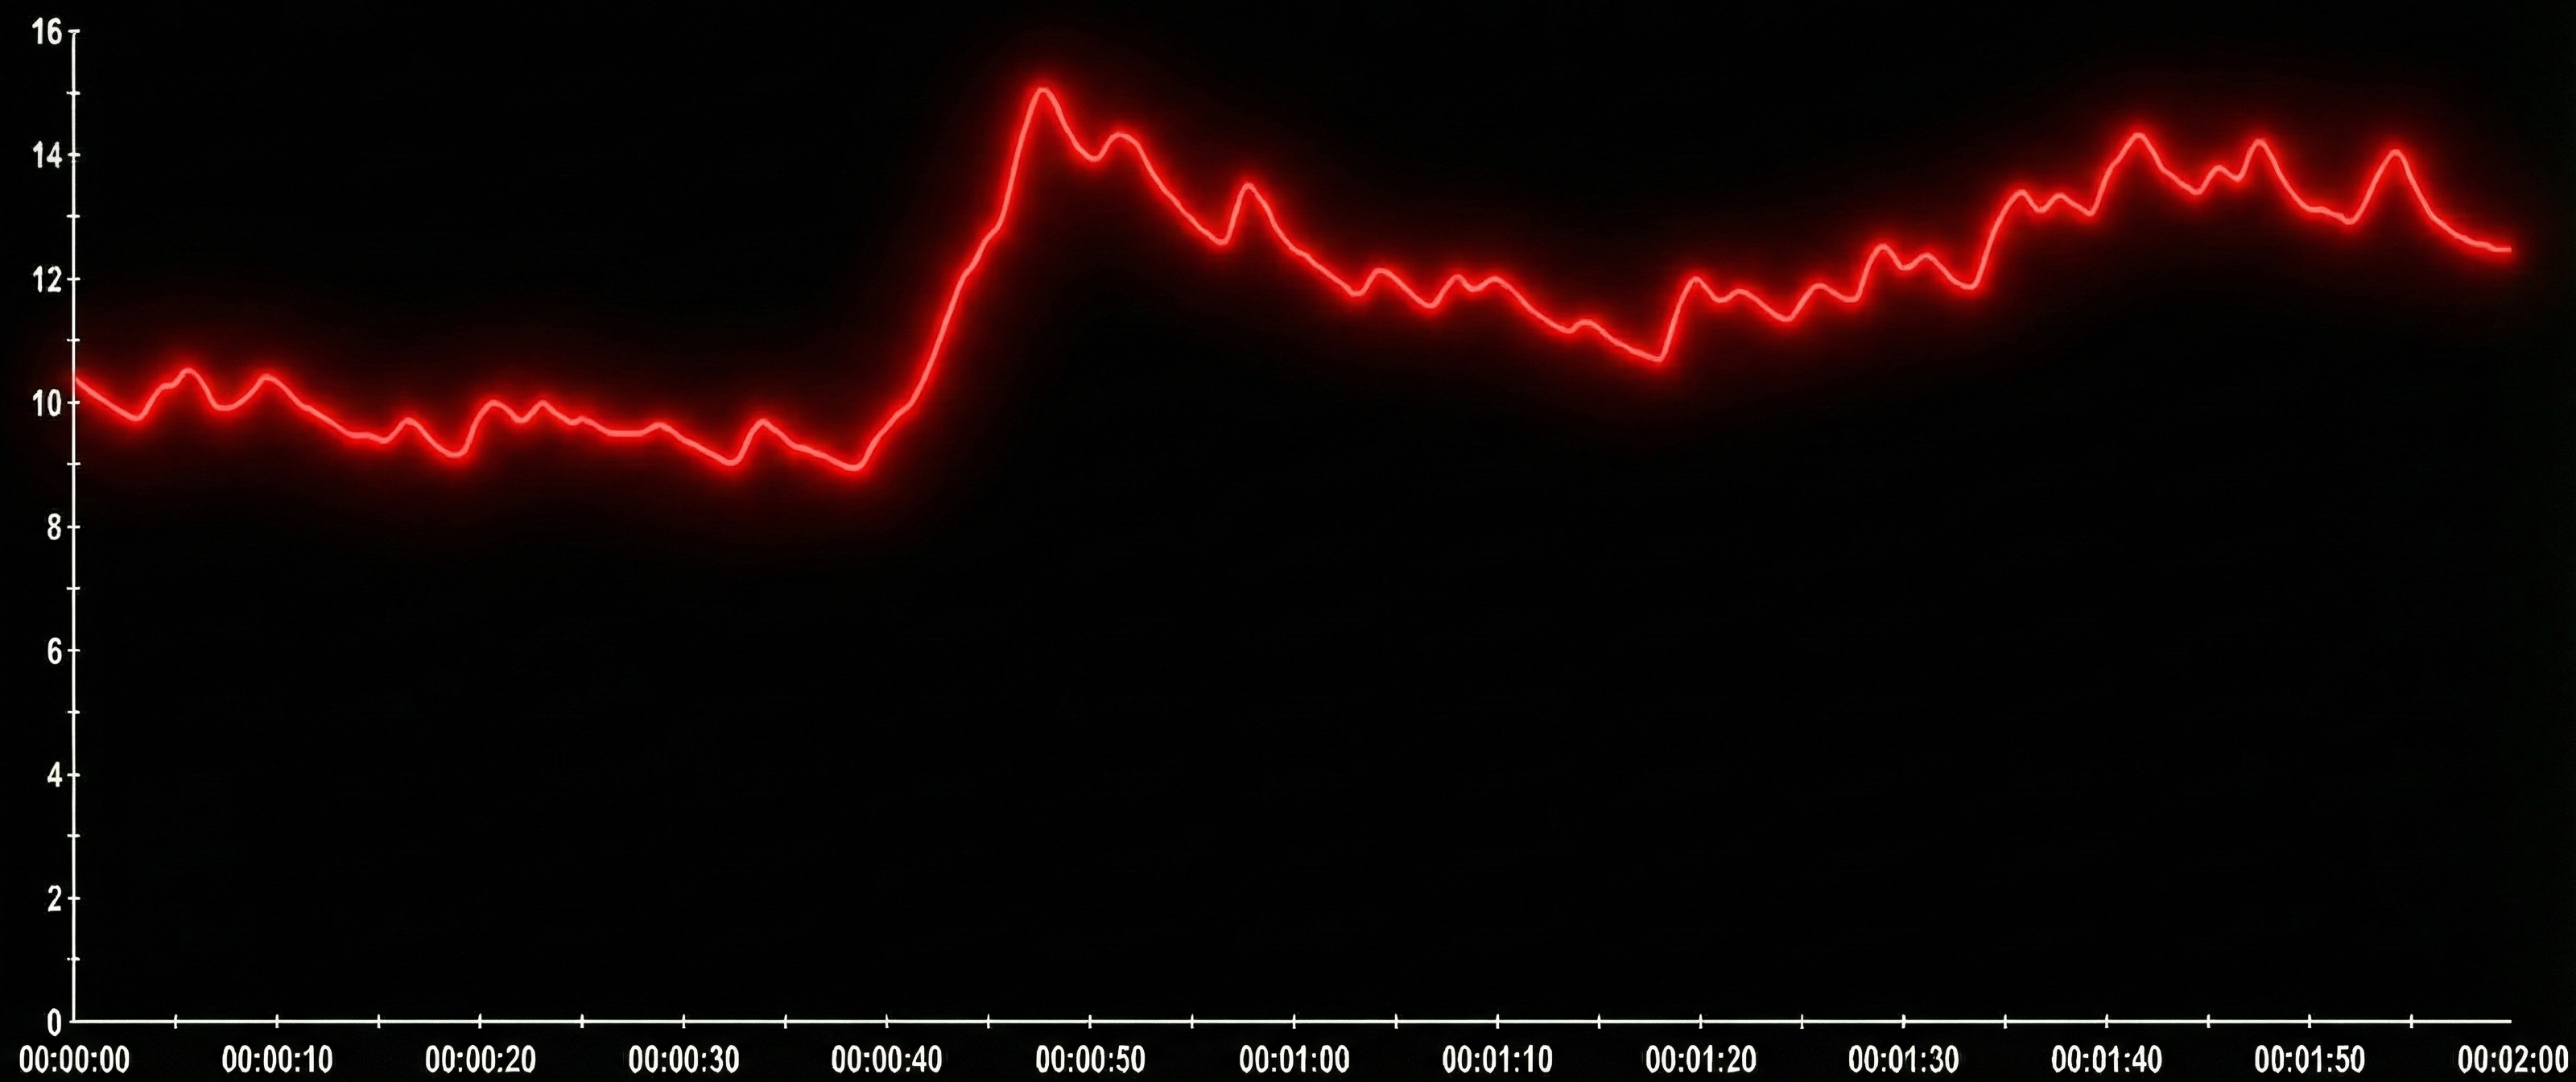
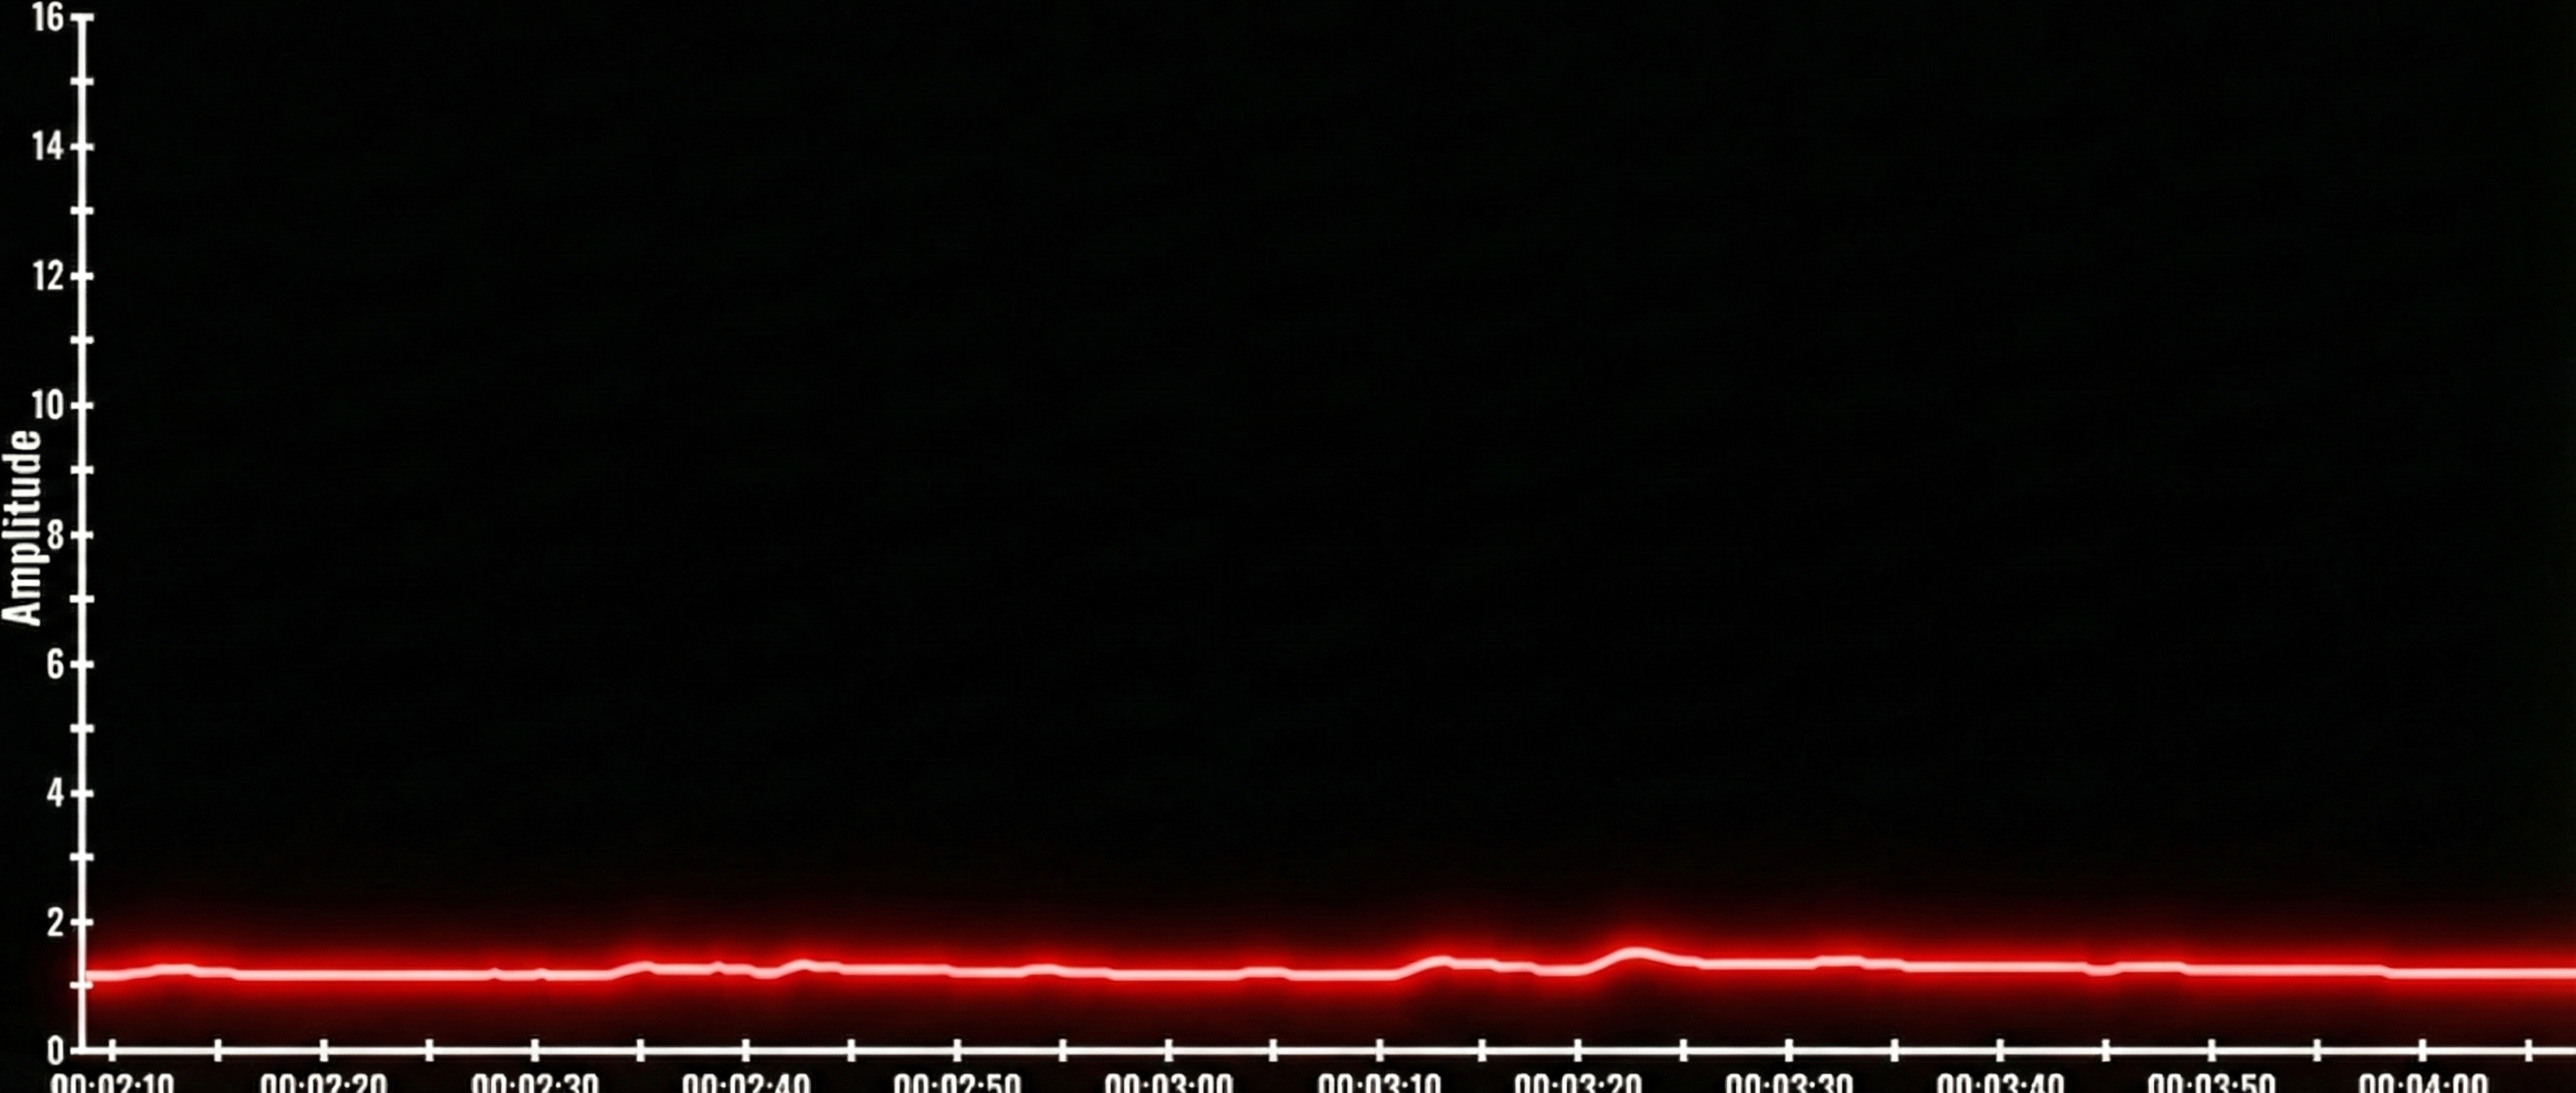
Under-reactors produce low amplitude SCRs and show minimal emotional reactions. An under-reactor's skin conductance signal shows very low amplitude SCRs and a low SCL. Note the amplitude scale between 0 and 16 microsiemens. Graphic reproduced with permission from Didier Combatalade, Thought Technology, Ltd.
Understanding Electrodermal Lability. The Toomim typology reflects a broader concept in psychophysiology: electrodermal lability-stability, first described by Lacey and Lacey (1958). Lability refers to stable individual differences in the frequency and amplitude of spontaneous SCRs. Labile individuals produce frequent, high-amplitude responses and show slower habituation to repeated stimuli. Stable individuals produce fewer, lower-amplitude responses and habituate quickly. These are trait-like characteristics that remain relatively consistent across situations and over time, though they can be modified through training. The Toomim categories of variable-reactor, over-reactor, and under-reactor represent clinical observation patterns along this lability-stability continuum rather than formal diagnostic categories.
As clients relax and feel safe, SCL will slowly decrease in most cases. In rare cases, humidity and temperature may cause sweat to collect under the sensor, leading to a slight SCL increase over time.
When a person responds to a stimulus like a loud noise, being touched, gasping, being embarrassed, or an emotion-evoking thought, SCL will usually increase and decrease in less than 90 seconds. There is an average latency between a stimulus and the response of about 1 to 3 seconds (Schwartz & Andrasik, 2003). If the response activates fear or traumatic memory and the person struggles to terminate this reaction or no longer feels safe, increased SCLs will persist or even increase. Conversely, victims of abuse or other trauma may show a "paradoxically flat" SC pattern. Marjorie Toomim described this dissociative response as "going 90 miles per hour with the brake on" (Smith, 2005).
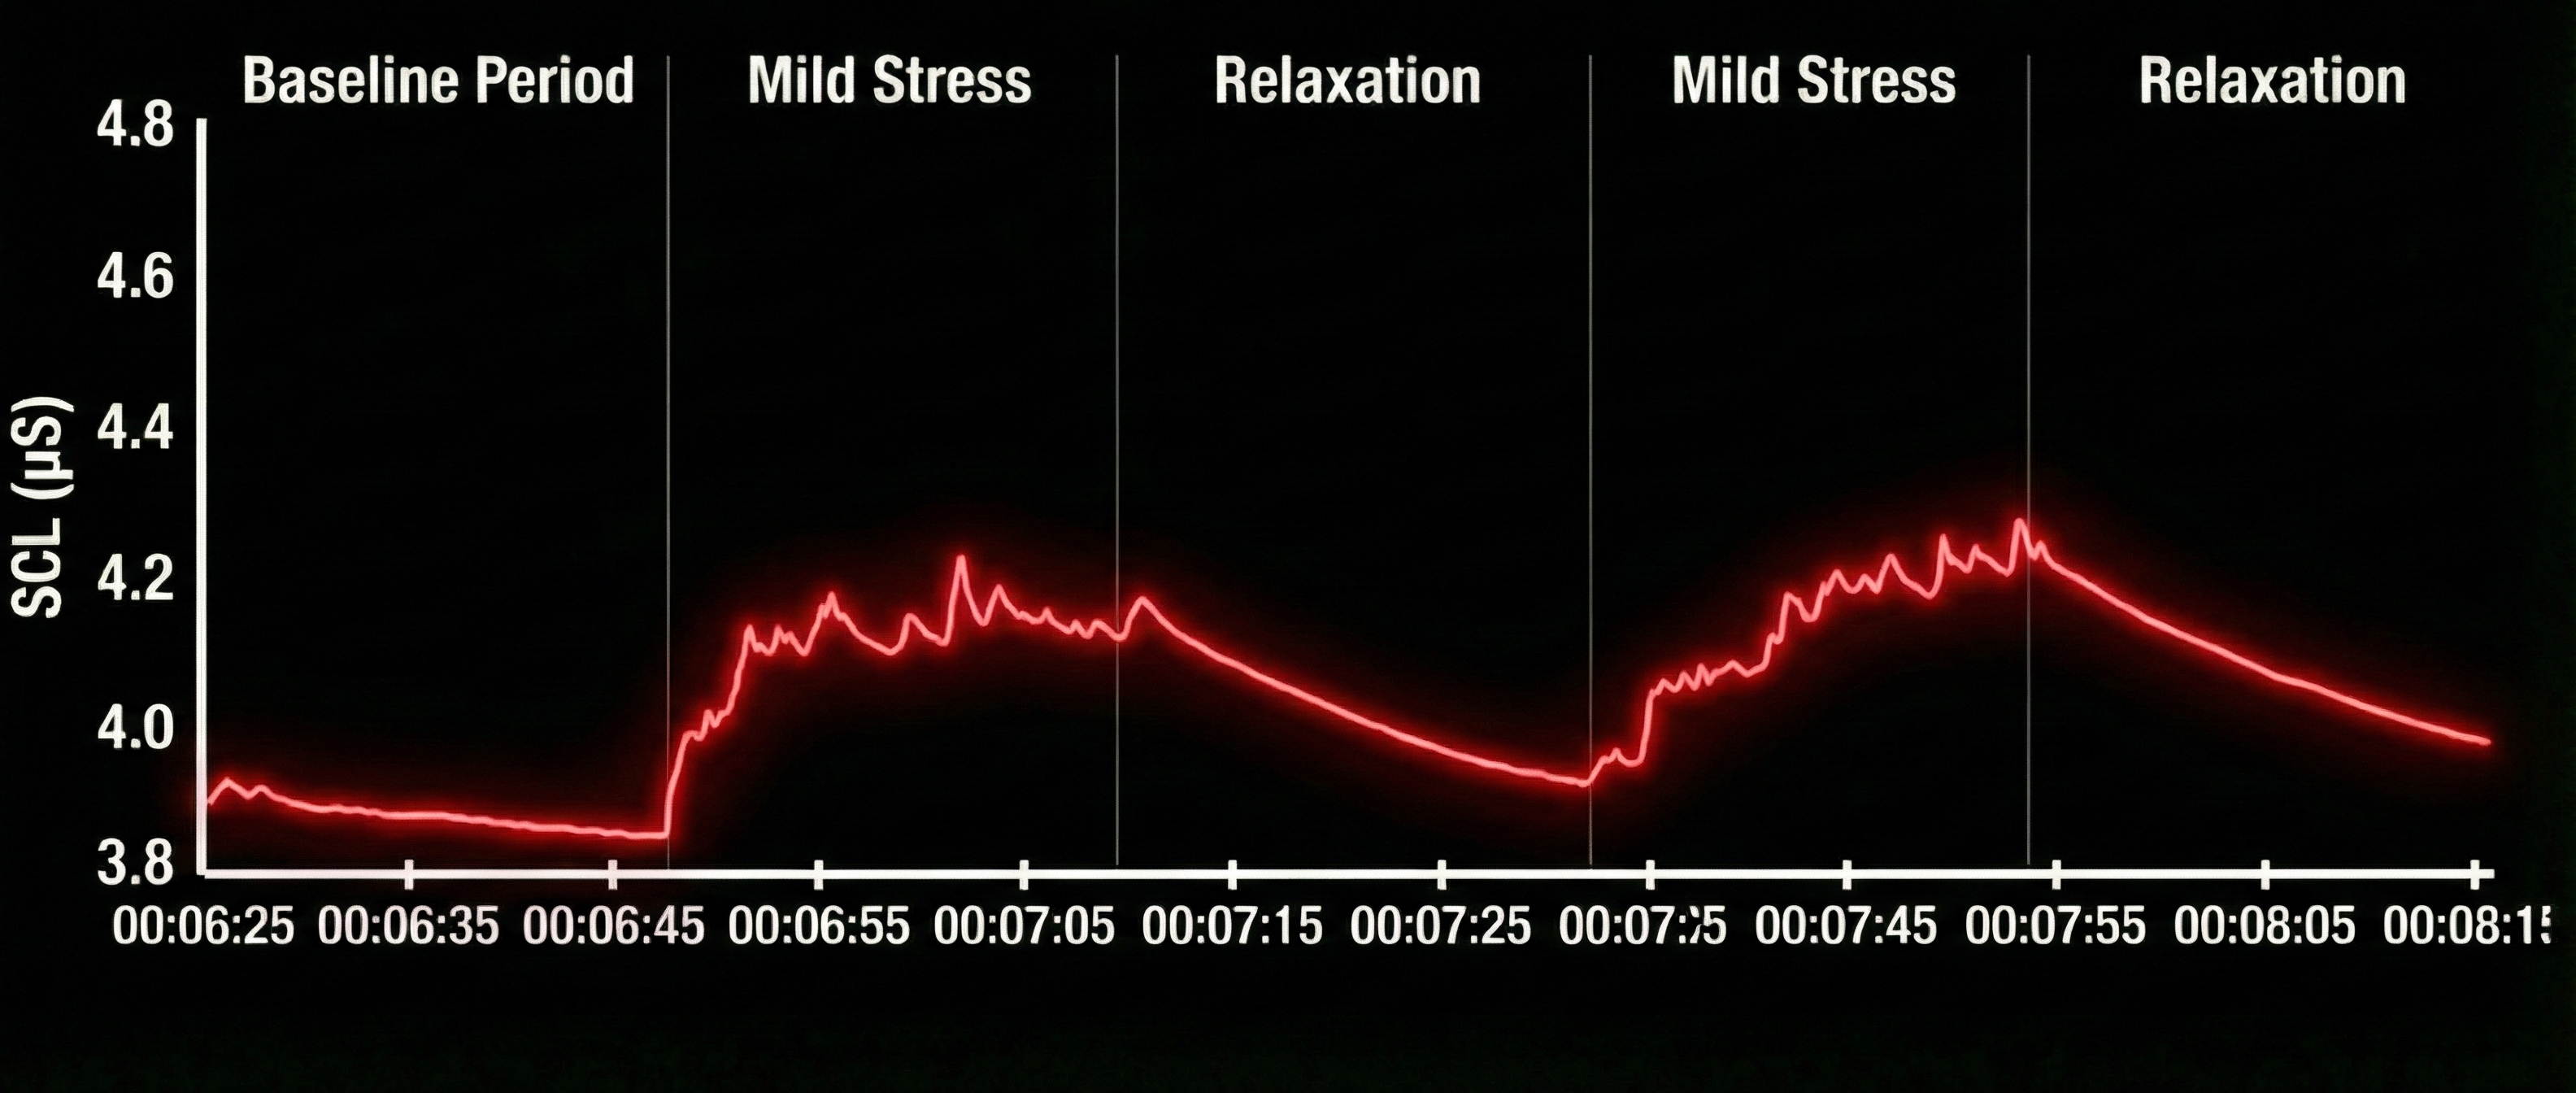
A stress assessment protocol can be used to assess a person's ability to return to a resting baseline level by alternating periods of mild stress with periods of relaxation. Note the SCRs during the mild stress trials and recovery during relaxation trials. The amplitude scale is between 0 and 5 microsiemens. Graphic reproduced with permission from Didier Combatalade, Thought Technology, Ltd.
For educational and clinical purposes, the two most important components of EDA are SCR amplitude and the time it takes for the SCL to return to baseline. Skin conductance biofeedback training generally consists of teaching individuals to lower their SCL and decrease the number of SCRs. At first, when participants observe a display of their EDA, an initial response to an externally-generated stimulus may be followed by a reaction to their internally-generated stimulus. This is analogous to the experience of blushing. You start blushing, become aware of the blush, and then blush more.
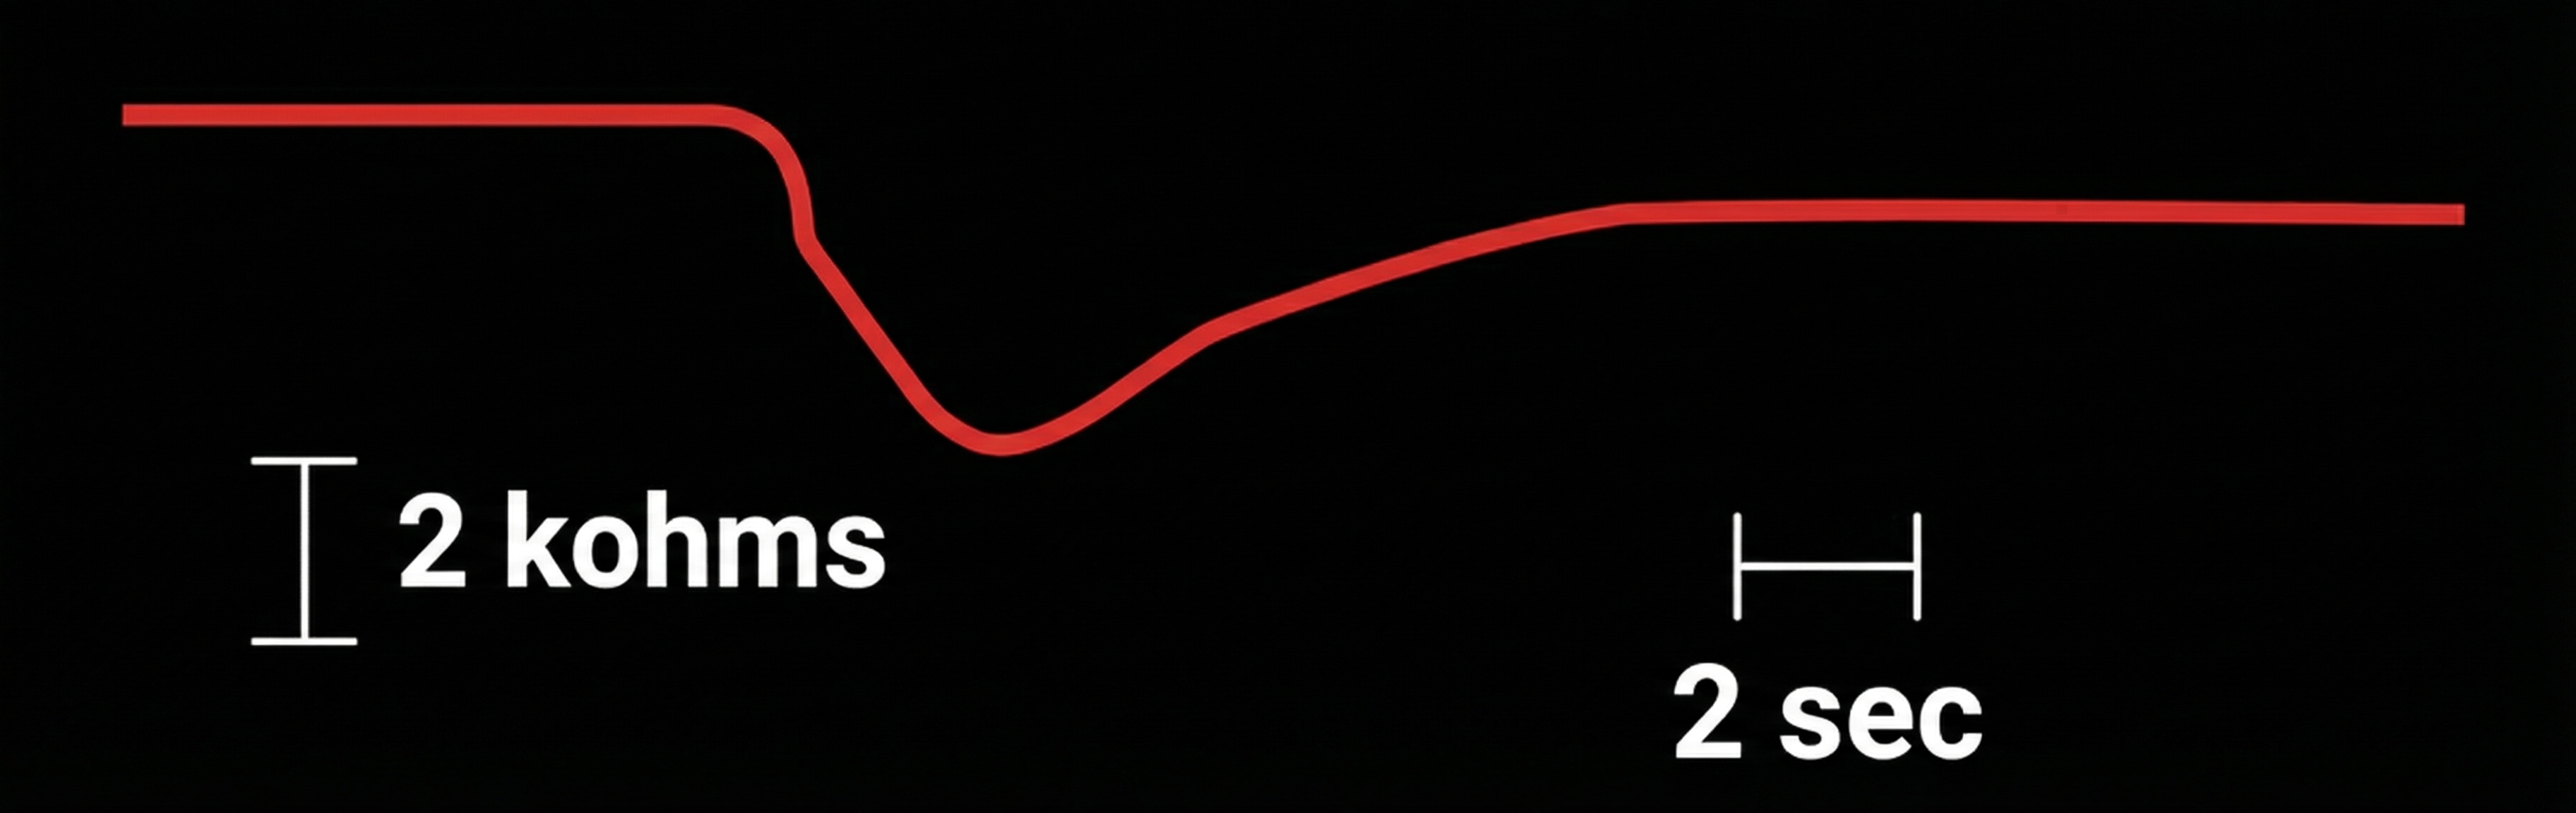
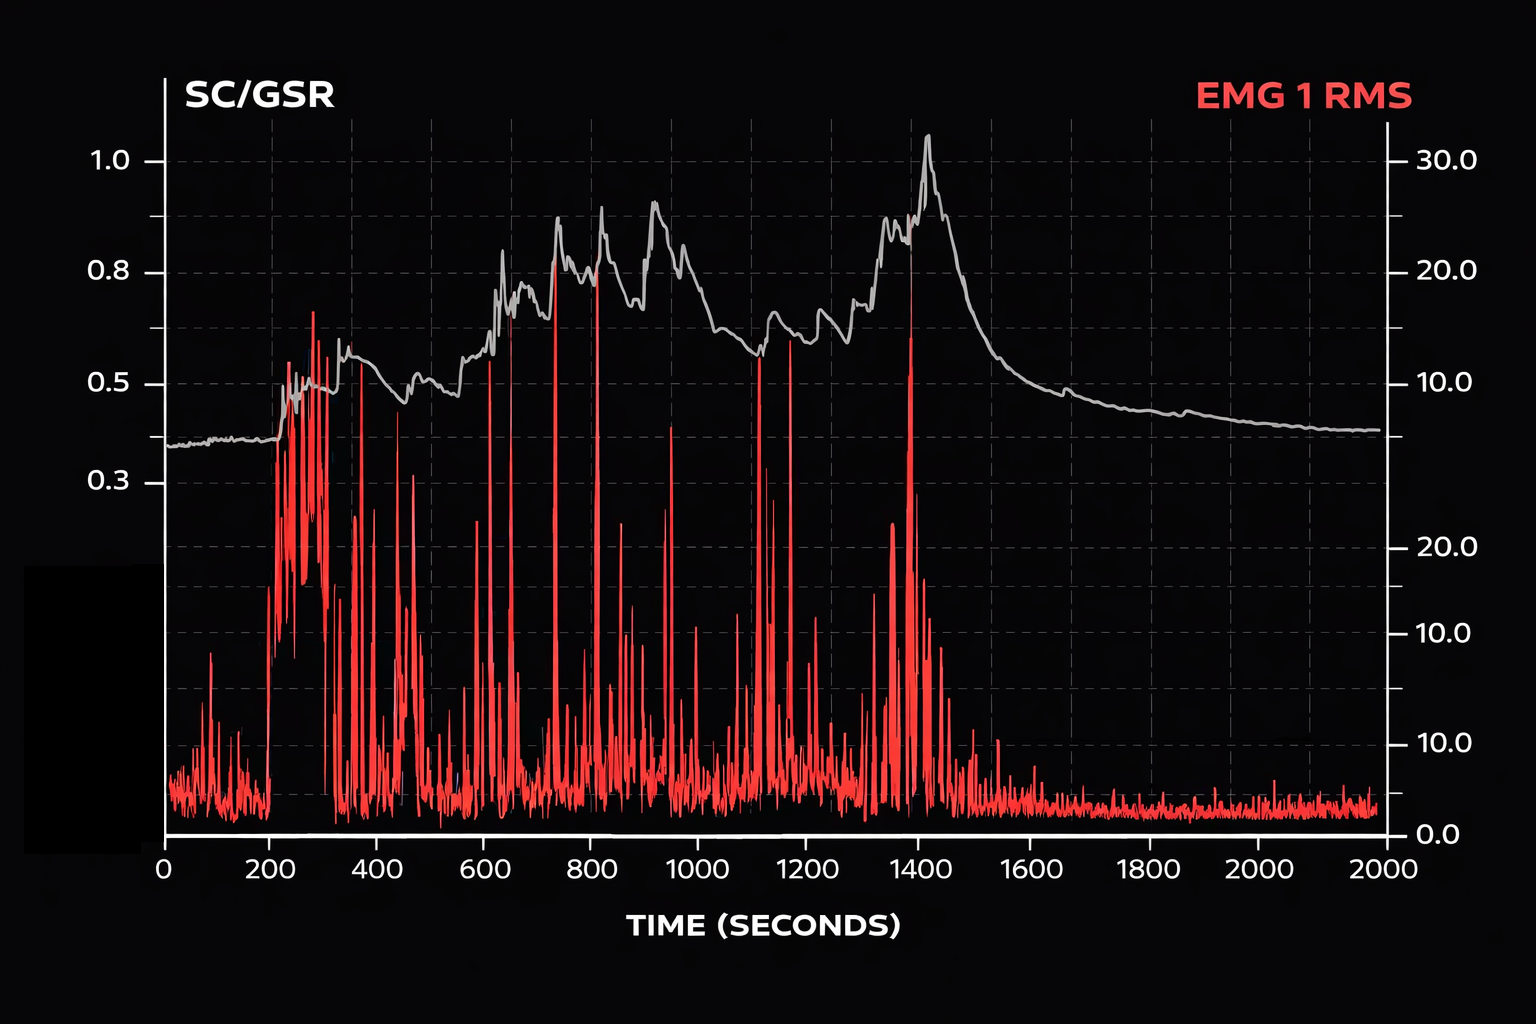
When they sigh, SCR increases for many people, and if the topic is emotionally charged, the SCR will not return to baseline until they let go of the emotion. The figure below shows an 18-minute EMG (red) and SC (black) recording. From minutes 4 through 14, the person discussed a very stressful event. Each spike in the EMG represented a sigh. EMG and SCR change while discussing a very stressful event. A repetitive strain injury is more than repeated movements. Reproduced with permission from Peper from an unpublished manuscript.
Comprehension Questions: Skin Conductance Patterns
- Describe the three electrodermal response patterns proposed by Toomim and Toomim, and explain what each pattern suggests about sympathetic nervous system activity.
- What does a "paradoxically flat" skin conductance pattern suggest about a client's psychological state?
- Why might sighing during a training session be clinically significant when monitoring electrodermal activity?
- What are the two most important EDA components for educational and clinical purposes?
Drug Effects
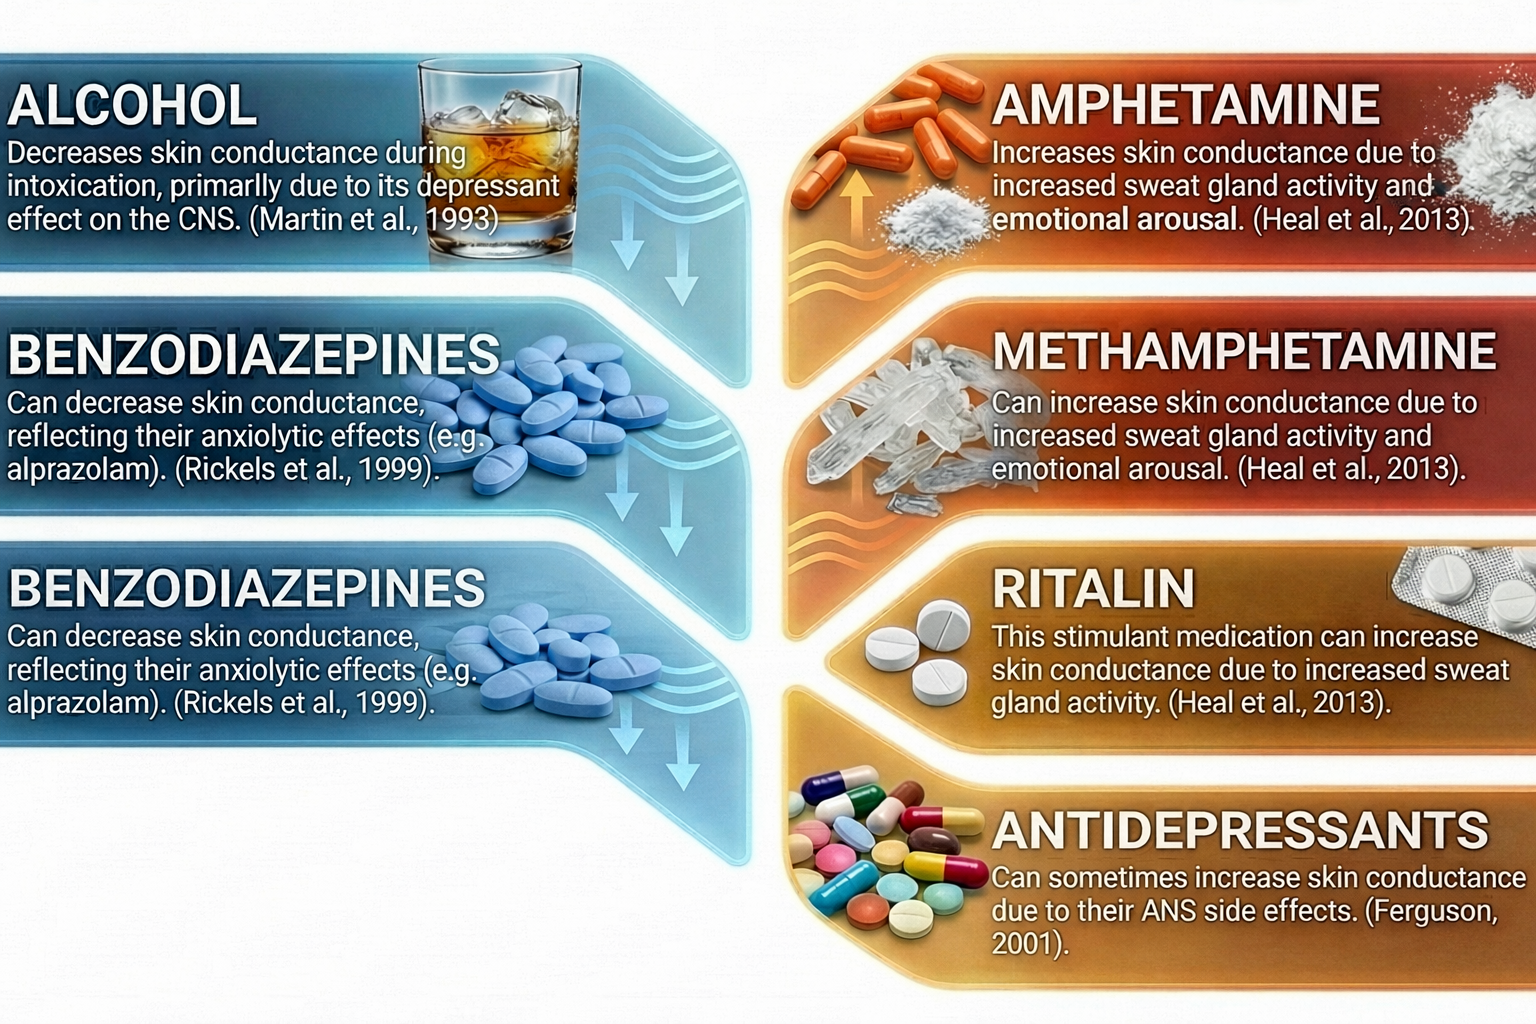
Many medications and substances can affect electrodermal activity. The table below summarizes the effects of various drug classes on EDA measurements. Clinicians should consider medication effects when interpreting electrodermal recordings and establishing treatment baselines.
Assessing Electrodermograph Accuracy
Standards
State-of-the-art biofeedback data acquisition systems achieve +/- 5% and +/- 0.2 μS accuracy.
Dummy Subject
A dummy subject is a circuit board with a fixed resistance that tests the accuracy of an electrodermograph. After you snap two recessed cup electrodes onto the circuit board's posts, you can measure SC or SR. The electrodermograph should display the value of the resistance.
Tracking Tests
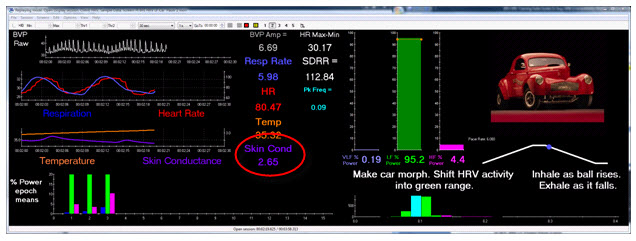
When starting a session, you can determine whether the signal you see on the screen mirrors your client's electrodermal activity by performing a tracking test. The test's purpose is to create a condition that should have an obvious and relatively instantaneous response. You can, for example, instruct your client to inhale deeply and then exhale rapidly and audibly or clap your hands behind the client. Both of these actions should cause a rapid increase in SC (or decrease in SR) within 1 to 3 seconds (see Figure 11). After the EDA response, the signal should slowly recover within 120 seconds (Peper, Gibney, Tylova, Harvey, & Combatalade, 2008).
A tracking test checks the integrity of the entire signal chain from the skin conductance sensor to the encoder and the correct software selection of input channels. It ensures that the sensor is intact and snugly inserted into the correct encoder input and the correct channel has been chosen for display.
Normal Values
Typical SCL values range from 1 to 30 μS per cm2, while SCR amplitudes range from around 0.01 to 5 μS per cm2 (Hugdahl, 1995).
Always doubt SCL measurements below 1 μS.
SCL values using finger straps range from 0.5 to 20 μS per cm2 and using a palmar placement range from 5 to 30 μS per cm2 (Shaffer, Combatalade, Peper, & Meehan, 2016). Average resting SCL readings using finger straps are below 5 μS per cm2 (Khazan, 2013, p. 46).
Following a stressor, clinicians may measure elevations above baseline and the time required to recover to baseline values. Proportional change may be more informative than absolute change (Khazan, 2013, p. 46). Why does this matter? Because baseline SCL varies enormously across individuals (1-30 μS range), a 2 μS response in someone with a 5 μS baseline represents a 40% increase, while the same absolute response in someone with a 20 μS baseline represents only a 10% increase. These responses reflect very different degrees of physiological activation relative to each individual's typical arousal level. Computing percentage change from baseline or using log transformations can help normalize data for meaningful comparisons across clients and sessions.
Accurate electrodermal assessment requires equipment that meets professional standards of +/- 5% and +/- 0.2 μS accuracy. Dummy subjects provide a reliable method for testing electrodermograph accuracy. Tracking tests verify that the displayed signal accurately mirrors the client's electrodermal activity. Clinicians should know typical value ranges: SCL from 1 to 30 μS/cm2, SCR amplitudes from 0.01 to 5 μS/cm2. Values below 1 μS should always be questioned. Medication effects must be considered when interpreting recordings.
Comprehension Questions: Assessing Electrodermograph Accuracy
- What accuracy standards should a state-of-the-art biofeedback data acquisition system meet for electrodermal measurement?
- What is a dummy subject, and how is it used to test electrodermograph accuracy?
- Describe how to perform a tracking test for electrodermal activity and what response you should expect.
- What SCL value range should make you question the validity of your measurements?
- Why might proportional change be more informative than absolute change when assessing stress responses?
Cutting Edge Topics in Electrodermal Monitoring
Wearable EDA Technology
Consumer wearable devices have transformed electrodermal monitoring from a laboratory-based procedure into a continuous, real-world assessment tool. Devices like the Empatica EmbracePlus (which replaced the now-retired Empatica E4), Fitbit Sense, and Samsung Galaxy Watch now incorporate EDA sensors alongside heart rate and accelerometer measurements. These wrist-worn devices can track electrodermal activity throughout the day and night, providing insights into stress patterns, sleep quality, and autonomic arousal that were previously impossible to capture outside clinical settings.
However, clinicians should interpret wrist-based EDA data cautiously. Research comparing consumer wearables to research-grade equipment has found that consumer devices show significantly lower reliability than laboratory instruments (Di Flumeri et al., 2023). Wrist-based measurements differ from traditional finger or palm placements in several important ways: lower eccrine sweat gland density at the wrist, greater influence of thermoregulatory sweating, and increased susceptibility to motion artifacts during daily activities. While wrist-based EDA shows acceptable correlation with palmar recordings for detecting gross stress responses and emotional arousal, it may miss subtle phasic components that are clinically meaningful. For research requiring precise temporal resolution of SCRs, traditional finger or palm placement remains the gold standard.
Despite these limitations, wearables offer unique advantages for ecological momentary assessment. Clinicians can ask clients to wear these devices between sessions, gathering data that reveals how real-world stressors affect autonomic function over extended periods. This longitudinal perspective complements in-session biofeedback training by identifying patterns, triggers, and contexts that may not emerge during clinical appointments.
Alternative Recording Sites
Recent research has explored EDA collection from alternative body locations for situations where hands are unavailable, such as virtual reality applications or clinical settings requiring hand mobility (Rodrigues et al., 2025). The chest shows promise as an alternative site but requires further validation, as results have been inconsistent. The forehead should be excluded as an alternative site, at least for short-term measurements, due to poor signal quality. When hands are available, palmar or finger placement remains strongly preferred due to the high density of eccrine sweat glands and established normative data.
Machine Learning and EDA Pattern Recognition
Artificial intelligence algorithms are revolutionizing how we analyze and interpret electrodermal data. Traditional analysis requires clinicians to manually identify SCRs and distinguish them from artifacts, a time-consuming process prone to human error. Machine learning models trained on large datasets can now automatically detect SCRs with greater than 95% accuracy, identify and remove movement artifacts, and even classify emotional states based on EDA patterns. Some systems can distinguish between anxiety, excitement, and cognitive load based solely on the morphology and timing of electrodermal responses. For biofeedback practitioners, these tools promise more objective session assessments and the ability to identify subtle patterns that might escape visual inspection.
Multimodal Stress Assessment
Contemporary research increasingly combines electrodermal activity with other physiological measures to create comprehensive stress profiles. The combination of EDA with heart rate variability, respiration, and electromyography provides a more complete picture of autonomic and somatic stress responses than any single measure alone. Studies have shown that while some individuals are "EDA responders" who show primary stress reactivity through skin conductance, others are "cardiac responders" or "muscle responders." By monitoring multiple channels simultaneously, clinicians can identify each client's unique response pattern and tailor biofeedback interventions accordingly. This multimodal approach has proven particularly valuable in trauma populations, where dissociative responses may mask stress in one physiological system while revealing it in another.
EDA and Emotional Regulation Research
Electrodermal activity has become a key measure in research exploring emotional regulation and its clinical applications. Studies using simultaneous EDA and functional MRI have revealed the neural circuits underlying sympathetic arousal, showing how prefrontal cortex activity modulates the amygdala's influence on electrodermal responses. This research has clinical implications: effective emotional regulation strategies produce distinct EDA signatures, and biofeedback training that targets these patterns appears to strengthen prefrontal-limbic connectivity. For conditions like anxiety disorders and PTSD, EDA biofeedback is being integrated with cognitive therapy approaches, providing clients with real-time physiological feedback while they practice exposure and cognitive restructuring techniques.
Electrodermal Hyporeactivity in Clinical Populations
While traditional biofeedback training often focuses on reducing excessive sympathetic arousal, emerging research highlights the clinical significance of electrodermal hyporeactivity. Low baseline SCL and reduced SCR amplitude have been associated with antisocial behavior, alexithymia (difficulty identifying emotions), dissociative disorders, and certain depression subtypes. Understanding that some clients need to increase rather than decrease their electrodermal responsiveness represents a paradigm shift in clinical practice. New biofeedback protocols are being developed to help hyporeactive clients reconnect with their physiological signals, using awareness training and gentle activation exercises rather than traditional relaxation approaches.
HRV Biofeedback Integration with EDA Monitoring
Heart rate variability (HRV) biofeedback has emerged as a complementary approach to EDA-based training, particularly for trauma populations. A 2024 meta-analysis examining HRV biofeedback for military service members with PTSD found moderate-to-large effects (Hedges's g = -0.557) in reducing PTSD symptoms, with notably low attrition rates of only 5.8% compared to higher dropout rates typical of traditional psychological treatments (Lalanza et al., 2024). This finding supports the multimodal assessment approach: clinicians who monitor both EDA and HRV can identify whether a client is primarily an "EDA responder" or a "cardiac responder" and tailor interventions accordingly. Some clients may show minimal EDA reactivity but pronounced HRV changes, or vice versa, making comprehensive physiological profiling essential for effective treatment planning.
Digital Signal Processing and Analysis Software
Open-source tools have democratized sophisticated EDA analysis. Ledalab (MATLAB-based) provides continuous decomposition analysis to separate tonic and phasic components. EDA Explorer offers automated artifact detection and SCR identification. Newer toolkits like LOTUS have been developed specifically for processing data from wearable devices like the Empatica EmbracePlus. These tools enable clinicians and researchers to move beyond simple visual inspection of EDA waveforms to quantitative analysis of response patterns, habituation rates, and recovery dynamics. Standard signal processing parameters include bandpass filtering between 0.05 Hz and 2 Hz to remove both slow drift and high-frequency noise.
Glossary
alternating current (AC): an electric current that periodically reverses its direction.
amplitude: the average SCR value from only those trials with a measurable response.
biphasic waveform: in a skin potential response (SPR), a negative voltage is followed by a positive one.
bipolar recording: the placement of two electrodermal sensors over active sites.
constant voltage system: a method for measuring skin conductance that holds the voltage through the skin constant so that current changes with resistance.
direct current (DC): an electric current that flows in only one direction, as in a flashlight.
driver artifact: the distortion of electrodermal measurements when a constant current system allows excessive current to irritate eccrine sweat glands.
dummy subject: a device consisting of two resistors that simulates the skin-electrode impedance of a human subject to measure the accuracy of an electrodermograph.
electrode gel: an electrically-conductive solution that is used to standardize electrodermal measurement.
electrode stabilization time: the recommended 5-10 minute waiting period after electrode application before beginning data collection, allowing the gel to equilibrate with the skin and sweat duct contents.
electrodermal lability-stability: stable individual differences in the frequency and amplitude of spontaneous SCRs. Labile individuals produce frequent, high-amplitude responses and show slower habituation; stable individuals produce fewer, lower-amplitude responses and habituate quickly. First described by Lacey and Lacey (1958).
event-related skin conductance response (ER-SCR): skin conductance responses that are elicited by specific stimuli.
exosomatically: a measurement method where the current comes from outside the body.
half-recovery time (rec t/2): in an event-related skin conductance response (ER-SCR), the interval between the SCR peak and 50% recovery of amplitude (2 to 10 seconds).
hand temperature: the temperature of the hand, which may lower or raise EDA values.
individual differences: variability among clients and research subjects. Age, race, lability-stability, and stage of the menstrual cycle influence EDA.
latency: in an event-related skin conductance response (ER-SCR), the interval between a stimulus and the SCR onset, 1 to 3 seconds.
level: a tonic measure of EDA that quantifies the average amplitude over a specified period and indexes baseline values.
magnitude: the average SCR value across all stimulus trials, including those with no response.
microsiemen: a unit of conductance that is a millionth of a siemen. The microsiemen has replaced the micromho.
monophasic waveform: in a skin potential response (SPR), a negative or positive voltage.
monopolar recording: the placement of one electrode over an active site and the other over an inactive site with fewer eccrine sweat glands. An additional reference lead may be placed on an inactive site (forearm) on the same side of the body when 50/60Hz artifact is a problem.
movement artifact: artifact that results when movement increases or decreases electrode contact with the skin.
nonspecific skin conductance response (NS-SCR): a skin conductance response that occurs when identifiable stimuli are absent.
over-reactors: individuals who continuously produce SCRs as if they need excessive sympathetic arousal. They overreact to stimuli with high-amplitude responses and slowly return to baseline.
palmar surface: the ventral or volar aspect of the hand.
phasic: a brief change in physiological activity in response to a discrete stimulus. For example, a single skin potential response in reaction to a sudden tone.
plantar surface: the sole of the foot.
polarization: when electrodes develop persistent charges that impede current flow.
respiration patterns: breathing patterns that can subtly affect SCL values.
response: a phasic measure of electrodermal activity representing a spontaneous or stimulus-elicited change in sweat gland activity.
rise time: in an event-related skin conductance response (ER-SCR), the interval between SCR onset and peak, 1 to 3 seconds.
sampling rate: the frequency at which the EDA signal is digitized. Laboratory equipment typically samples at 64 Hz or higher; most wearable devices sample at 4 Hz. Higher sampling rates provide better temporal resolution for detecting rapid phasic changes.
SCR detection threshold: the minimum amplitude change required to identify an SCR. Traditional threshold is 0.05 μS; modern digital systems often use 0.01 μS for event-related SCRs.
siemen: the official unit of conductance that replaced the mho in 1971.
silver/silver-chloride: a combination of silver and silver-chloride used in electrodes that monitor electrodermal activity.
skin condition: skin moisture and the presence or absence of abrasions, cuts, or calluses, which can each influence electrodermal measurements.
skin conductance (SC): the skin's ability to carry an electric current.
skin conductance level (SCL): a tonic measurement of the skin's ability to carry an electric current measured in microsiemens.
skin conductance response (SCR): a phasic measurement of changes in the skin's ability to carry an electric current measured in microsiemens.
skin potential (SP): the voltage difference between sweat glands and internal tissues that is measured endosomatically by placing electrodes over active (palmar surface of the hand) and relatively-inactive (forearm) sites.
skin potential level (SPL): a tonic measurement of the voltage difference between sweat glands and internal tissues measured in millivolts.
skin potential response (SPR): a phasic measurement of changes in the voltage difference between sweat glands and internal tissues measured in millivolts.
skin resistance (SR): a tonic measurement of the opposition of the skin to the passage of an electric current.
skin resistance level (SRL): a tonic measurement of the opposition of the skin to the passage of an electric current measured in Kohms.
skin resistance response (SRR): a phasic measurement of changes in the opposition of the skin to the passage of an electric current that is measured in Kohms.
tonic: the background level of physiological activity. For example, a 5-minute average of the skin conductance level.
tracking test: check whether the biofeedback display mirrors client behavior. An unexpected sound should elicit a skin conductance response.
triphasic waveform: in a skin potential response (SPR), a negative voltage is followed by a positive and negative voltage.
under-reactors: individuals who produce low amplitude SCRs and show minimal emotional reactions.
variable-reactors: individuals who produce SCRs in response to a stimulus like a loud clap and then quickly return to baseline.
zinc/zinc-sulphate electrodes: a combination of zinc and zinc-sulphate used in electrodes that monitor electrodermal activity.
Test Yourself
Click on the ClassMarker logo to take 10-question tests over this unit without an exam password.

Review Flashcards on Quizlet
Click on the Quizlet logo to review our chapter flashcards.

Visit the BioSource Software Website
BioSource Software offers Human Physiology, which satisfies BCIA's Human Anatomy and Physiology requirement, and Biofeedback100, which provides extensive multiple-choice testing over BCIA's Biofeedback Blueprint.

Essential Skills
To demonstrate mastery of electrodermal biofeedback, you should be able to explain the SC/SP signal and biofeedback to a client. You should explain sensor attachment to a client and obtain permission to monitor them. You should explain how to select a placement site and demonstrate how to attach a sensor to minimize movement artifacts. You should explain how to protect the client from infection transmitted by the sensor. You should perform a tracking test by asking your client to take three quick breaths. You should identify common artifacts in the raw SC/SP signal, including movement and respiration, and explain how to control them and remove them from the raw data. You should demonstrate how to instruct a client to utilize a feedback display. You should demonstrate an electrodermal biofeedback training session, including record keeping, goal setting, site selection, baseline measurement, display and threshold setting, coaching, and debriefing at the end of the session. You should demonstrate how to select and assign a practice assignment based on training session results. Finally, you should evaluate and summarize client progress during a training session.
Assignment
Now that you have completed this module, describe the method your electrodermograph uses to measure electrodermal activity and the site(s) you use for recording. Summarize the precautions you take to ensure accurate measurements.
References
Andreassi, J. L. (2007). Psychophysiology: Human behavior and physiological response (5th ed.). Lawrence Erlbaum and Associates, Inc.
Boucsein, W. (2012). Electrodermal activity (2nd ed.). Springer.
Boucsein, W., Fowles, D. C., Grimnes, S., Ben-Shakhar, G., Roth, W. T., Dawson, M. E., & Filion, D. L. (2012). Publication recommendations for electrodermal measurements. Psychophysiology, 49(8), 1017-1034. https://doi.org/10.1111/j.1469-8986.2012.01384.x
Dawson, M. E., Schell, A. M., & Filion, D. L. (2016). The electrodermal system. In J. T. Cacioppo, L. G. Tassinary, & G. G. Berntson (Eds.), Handbook of psychophysiology (4th ed.). Cambridge University Press.
Di Flumeri, G., Ronca, V., Giorgi, A., Vozzi, A., Aricò, P., Sciaraffa, N., Zeng, H., Dai, G., Kong, W., Babiloni, F., & Borghini, G. (2023). Wearable technologies for electrodermal and cardiac activity measurements: A comparison between Fitbit Sense, Empatica E4, and Shimmer GSR3+. Sensors, 23(13), 5847. https://doi.org/10.3390/s23135847
Edelberg, R. (1967). Electrical properties of the skin. In C. C. Brown (Ed.), Methods in psychophysiology (pp. 1-53). Williams & Wilkins.
Ferguson, J. M. (2001). SSRI antidepressant medications: Adverse effects and tolerability. Primary Care Companion to the Journal of Clinical Psychiatry, 3(1), 22-27. https://doi.org/10.4088/pcc.v03n0105
Fowles, D. C., Christie, M. J., Edelberg, R., Grings, W. W., Lykken, D. T., & Venables, P. H. (1981). Publication recommendations for electrodermal measurements. Psychophysiology, 18(3), 232-239. https://doi.org/10.1111/j.1469-8986.1981.tb03024.x
General Conference on Weights and Measures. (n.d.). In Wikipedia. Retrieved February 5, 2016, from https://en.wikipedia.org/wiki/General_Conference_on_Weights_and_Measures
Hassett, J. (1978). A primer of psychophysiology. W. H. Freeman and Company.
Heal, D. J., Smith, S. L., Gosden, J., & Nutt, D. J. (2013). Amphetamine, past and present: A pharmacological and clinical perspective. Journal of Psychopharmacology, 27(6), 479-496. https://doi.org/10.1177/0269881113482532
Hugdahl, K. (1995). Psychophysiology: The mind-body perspective. Harvard University Press.
Khazan, I. Z. (2013). The clinical handbook of biofeedback: A step-by-step guide for training and practice with mindfulness. John Wiley & Sons, Ltd.
Lacey, J. I., & Lacey, B. C. (1958). Verification and extension of the principle of autonomic response-stereotypy. American Journal of Psychology, 71(1), 50-73. https://doi.org/10.2307/1419197
Lalanza, J. F., Sanchez-Gonzalez, J., & Losilla, J. M. (2024). Heart rate variability biofeedback for military service members with PTSD: A meta-analysis. Military Medicine, 189(9-10), e1903-e1910. https://doi.org/10.1093/milmed/usae076
Martin, C. S., & Earleywine, M. (1990). Ascending and descending rates of change in blood alcohol concentrations and subjective intoxication ratings. Journal of Substance Abuse, 2(3), 345-352. https://doi.org/10.1016/s0899-3289(10)80006-9
Massot, B., Desmazure, E., Montalibet, A., McAdams, E. T., & Géhin, C. (2024). Electrodermal activity monitoring with flexible dry electrodes and AC measurement. IEEE Sensors Journal, 24(15), 24892-24903. https://doi.org/10.1109/JSEN.2024.3412376
Montagu, J. D. (1964). The psycho-galvanic reflex: A comparison of AC skin resistance and skin potential changes. Journal of Neurology, Neurosurgery & Psychiatry, 27(4), 345-350.
Peper, E., Gibney, K. H., Tylova, H., Harvey, R., & Combatalade, D. (2008). Biofeedback mastery: An experiential teaching and self-training manual. Association for Applied Psychophysiology and Biofeedback.
Peper, E., Shaffer, F., & Lin, I-M. (2010). Garbage in, garbage out: Identify blood volume pulse (BVP) artifacts before analyzing and interpreting BVP, blood volume pulse amplitude, and heart rate. Biofeedback, 38(1), 19-23. https://doi.org/10.1007/s10484-011-9168
Rickels, K., Fox, I. L., Greenblatt, D. J., Sandler, K. R., & Schless, A. (1988). Clorazepate and lorazepam: Clinical improvement and rebound anxiety. The American Journal of Psychiatry, 145(3), 312-317. https://doi.org/10.1176/ajp.145.3.312
Rodrigues, J. P., Fernandes, A. M., Pinto, D., Cabral, J., & Cunha, J. P. S. (2025). Electrodermal activity analysis at different body locations. Sensors, 25(6), 1762. https://doi.org/10.3390/s25061762
Schell, A. M., Dawson, M. E., & Filion, D. L. (1988). Psychophysiological correlates of electrodermal lability. Psychophysiology, 25, 619-632. https://doi.org/10.1111/j.1469-8986.1988.tb01899.x
Schwartz, M. S., & Andrasik, F. (Eds.). (2003). Biofeedback: A practitioner's guide (3rd ed.). The Guilford Press.
Shaffer, F., & Combatalade, D. (2013). Don't add or miss a beat: A guide to cleaner heart rate variability recordings. Biofeedback, 41(3), 121-130. https://doi.org/10.5298/1081-5937-41.3.04
Shaffer, F., Combatalade, D., Peper, E., & Meehan, Z. (2016). A guide to cleaner electrodermal activity measurements. Biofeedback, 44(2), 90-100. https://doi.org/10.5298/1081-5937-44.2.01
Smith, M. R. (2005). Marjorie Toomim: A remembrance. Biofeedback, 33(4), 77-78.
Stern, R. M., Ray, W. J., & Quigley, K. S. (2001). Psychophysiological recording (2nd ed.). Oxford University Press.
Toomim, M., & Toomim, H. (1975). GSR biofeedback in psychotherapy: Some clinical observations. Psychotherapy: Theory, Research and Practice, 12(1), 33-38. https://psycnet.apa.org/doi/10.1037/h0086402
Tronstad, C., Amini, M., Bach, D. R., & Martinsen, Ø. G. (2022). Current trends and opportunities in the methodology of electrodermal activity measurement. Physiological Measurement, 43(2), 02TR01. https://doi.org/10.1088/1361-6579/ac5007
Venables, P. H., & Christie, M. J. (1980). Electrodermal activity. In I. Martin & P. H. Venables (Eds.), Techniques of psychophysiology (pp. 3-67). Cambridge University Press.
Zaccara, G., & Schmidt, D. (2016). Do traditional anti-seizure drugs have a future? A review of potential anti-seizure drugs in clinical development. Pharmacological Research, 104, 38-48. https://doi.org/10.1016/j.phrs.2015.12.011