Electricity
Why Biofeedback Providers Need Electrical Theory
Picture yourself in a session with a client who has chronic lower back pain. You attach surface EMG electrodes to monitor muscle tension, but the display shows wild fluctuations that do not match your client's movements. Is the client doing something unusual, or is something wrong with your equipment? Without understanding basic electrical principles, you cannot answer this question, and you risk providing training based on meaningless data.
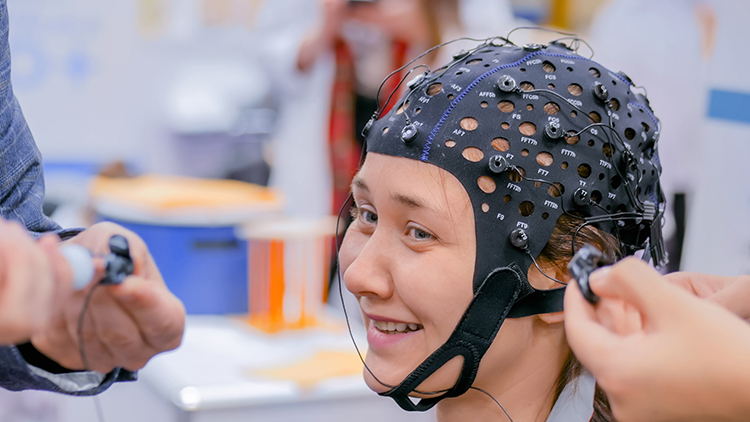
Every biological signal you monitor in biofeedback is electrical in nature. The brain waves you track in neurofeedback, the muscle tension you measure in EMG training, and the sweat gland activity you assess in skin conductance work all involve the movement of charged particles. Your equipment detects these signals, amplifies them, and displays them so clients can learn to modify their physiology. Understanding how this process works helps you recognize when signals are valid and when something has gone wrong.
This unit connects electrical concepts directly to your daily biofeedback practice. You will learn why proper skin preparation improves signal quality, what impedance readings actually tell you, how to troubleshoot equipment problems, and what protects your clients from electrical hazards. Each concept will be tied to specific procedures you will perform with clients.
BCIA Blueprint Coverage: This unit addresses Sources of artifact (III-B), Identification and elimination of electrical shock hazards (III-C), and Essential electronic terms and concepts for biofeedback applications (III-D).
Where Biological Signals Come From
Before you can monitor biological signals, you need to understand what produces them. When a neuron fires in your client's brain or a muscle fiber contracts in their forearm, charged particles called ions flow across cell membranes. These ion movements create tiny electrical currents that your biofeedback equipment detects. To grasp how this works, we need to start with the basic building blocks of matter.
Atoms and Their Charged Particles
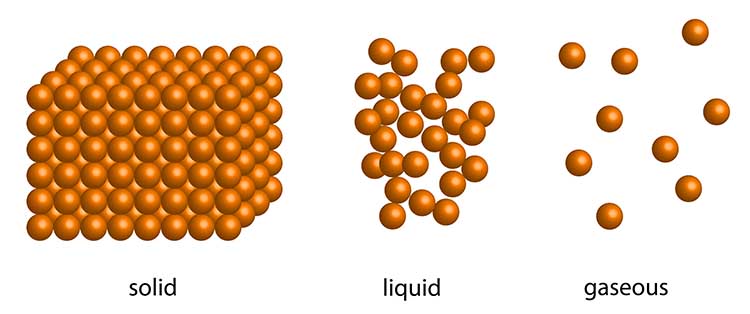
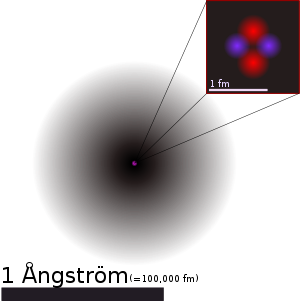
Matter is anything that takes up space and has mass, including the solid, liquid, and gaseous components of your client's body. All matter is made of atoms, which are the smallest units that retain the properties of an element. Think of an atom as having two main parts: a dense central core called the nucleus, surrounded by smaller particles that orbit around it.
The nucleus contains two types of particles. Protons carry a positive electrical charge, while neutrons carry no charge at all. Orbiting the nucleus are electrons, which carry a negative charge equal in strength but opposite in sign to a proton's positive charge. In a normal atom, the number of electrons equals the number of protons, so the overall electrical charge is zero.
Why does this matter for biofeedback? The biological signals you monitor occur because atoms can gain or lose electrons, becoming electrically charged. When an atom gains or loses electrons, it becomes an ion. Ions carry either positive or negative charges, and their movement through body tissues creates the electrical signals that your equipment detects.

Elements and Why They Matter for Physiology
Elements are pure substances made of identical atoms that cannot be broken down by ordinary chemical reactions. Each element has a unique atomic number, which is simply the count of protons in its nucleus. Carbon has 6 protons, sodium has 11, and potassium has 19. The atomic weight approximately equals the number of protons plus neutrons.

Several elements are critical to generating the signals you will monitor. Calcium (Ca), chloride (Cl), potassium (K), and sodium (Na) are the key players. When these elements gain or lose electrons, they become the ions that flow across nerve and muscle cell membranes. For example, when a cortical neuron fires during brain activity, sodium ions rush into the cell while potassium ions flow out, creating the voltage changes that appear on an EEG display.
Recent research by Quigley et al. (2024) in guidelines published by the Society for Psychophysiological Research has emphasized the importance of understanding these ionic mechanisms for proper interpretation of psychophysiological recordings. The authors note that heart rate variability, for instance, reflects complex interactions between sympathetic and parasympathetic neural control systems that operate through ion channel activity. This same ionic foundation underlies the electrodermal, electromyographic, and electroencephalographic signals you will monitor in clinical practice.
Every modality you use in biofeedback depends on ion movements. The brain waves (EEG) you monitor in neurofeedback result from millions of neurons exchanging sodium and potassium ions. The muscle voltages (SEMG) that appear on your EMG display reflect calcium and sodium ions triggering muscle fiber contractions. Even the skin conductance (EDA) changes you observe during stress assessments depend on chloride ions in sweat gland secretions. Understanding this shared electrical foundation helps you see why electrical principles apply across all biofeedback modalities.
Every biological signal you monitor in biofeedback originates from the movement of charged particles called ions. Atoms consist of positively charged protons, uncharged neutrons, and negatively charged electrons. When atoms gain or lose electrons, they become ions with positive or negative charges. The key ions for biofeedback are chloride, potassium, and sodium, which generate the EEG, SEMG, and EDA signals you will monitor with your clients.
Check Your Understanding: Where Signals Come From
- What distinguishes an atom from an ion, and why does this distinction matter for biofeedback?
- Which three ions are primarily responsible for generating EEG, EDA, and SEMG signals?
- Why is an atom considered electrically neutral?
- How would you explain to a client why their biological signals are described as "currents of ions"?
How Signals Travel From Body to Equipment
Now that you understand where biological signals originate, you need to know how they travel from your client's body into your biofeedback equipment. This journey involves two different types of electrical movement: the flow of ions inside the body and the flow of electrons through your equipment. Understanding both is essential because problems at any point in this pathway can produce invalid readings.
Current: The Movement of Charged Particles
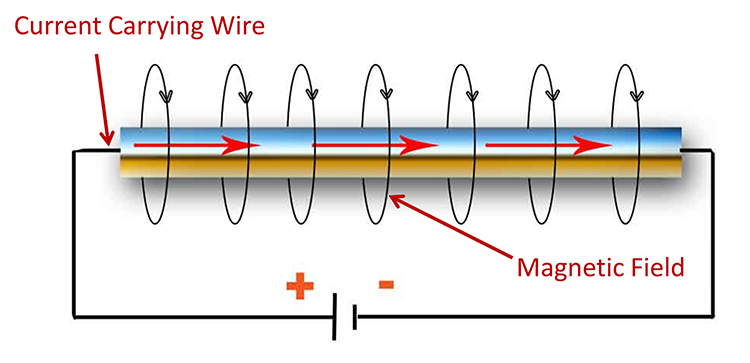
Current (I) refers to the movement of charged particles through a material. In your equipment, current consists of electrons flowing through wires. The classic model explains this movement through the attraction and repulsion of electrical charges. Opposite charges attract each other, so electrons (negative) flow toward positive regions. Identical charges repel each other, so electrons move away from negative regions.
Listen to a mini-lecture on Current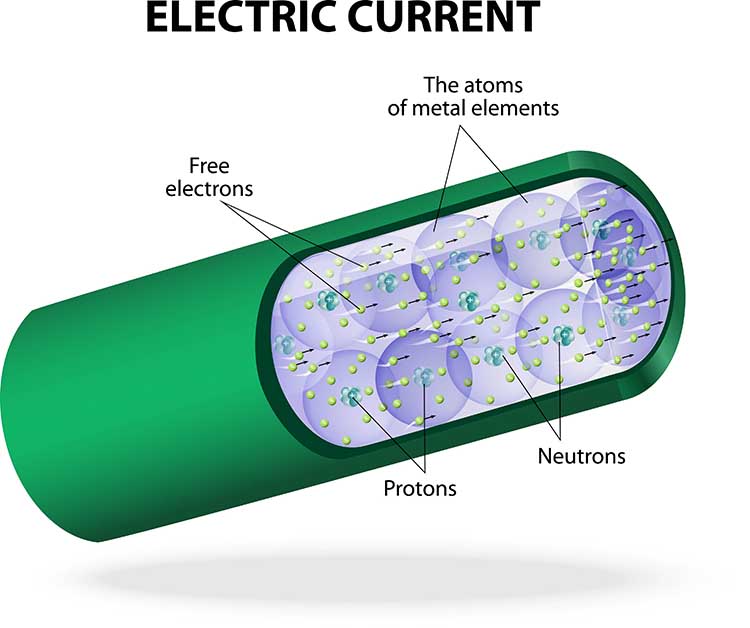
Materials differ in how easily they allow current to flow. Conductors like copper wires allow electrons to move freely, which is why your electrode cables use copper to carry signals from sensors to your equipment. Insulators like rubber and plastic resist electron movement, which is why your cables are coated in protective material that prevents signals from leaking out or interference from leaking in.
Listen to a mini-lecture on Conductors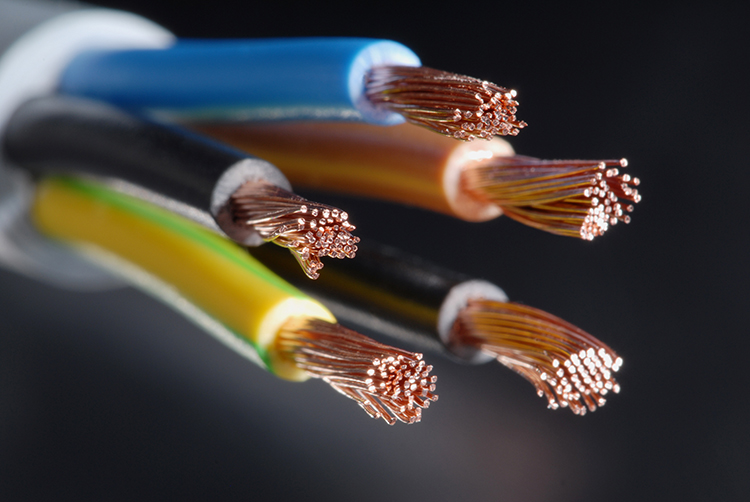
Volume Conduction: How Signals Reach the Skin Surface
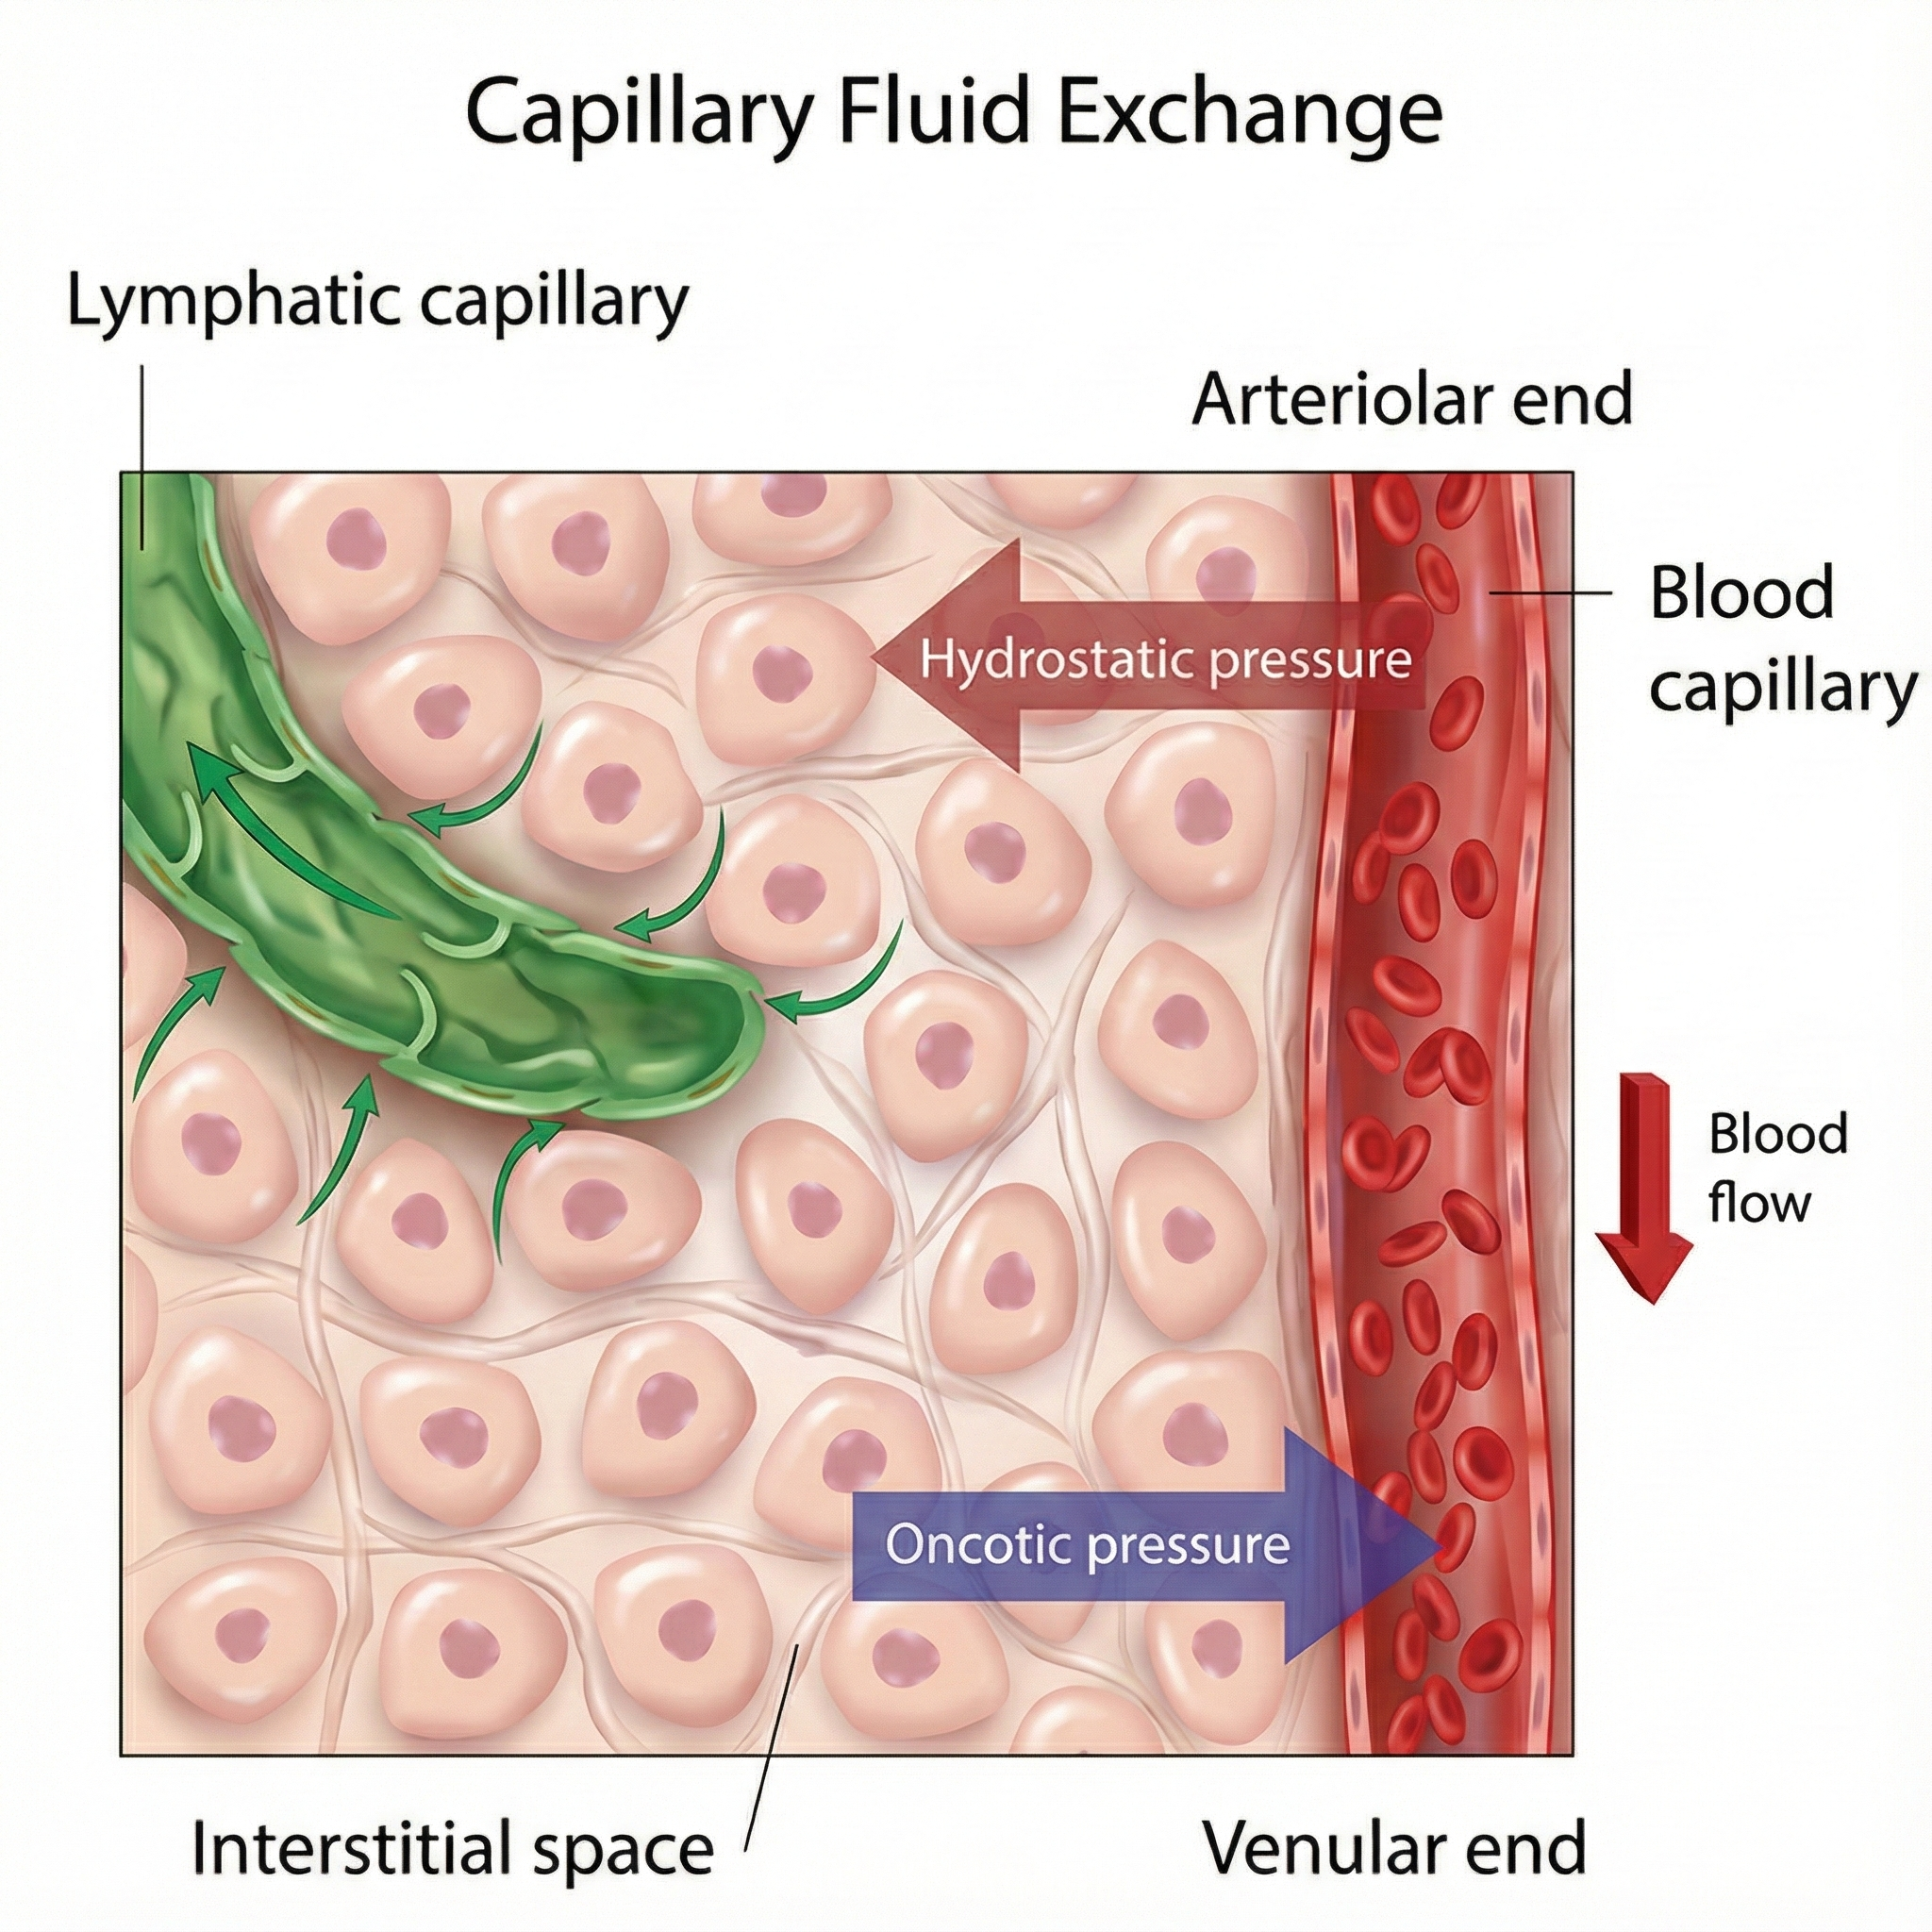
Inside your client's body, signals do not travel through wires. Instead, ion currents move through interstitial fluid, the liquid that fills the spaces between cells. This process is called volume conduction, and it explains why you can detect brain activity from the scalp or muscle activity from the skin surface rather than having to insert electrodes directly into the tissue.
Think of volume conduction like ripples spreading across a pond. When a stone drops into water, waves spread outward in all directions. Similarly, when a neuron fires or a muscle contracts, the resulting electrical disturbance spreads through the interstitial fluid until it reaches the skin surface. Your electrodes detect this disturbance much like a buoy detects passing waves.
Research by Chowdhury et al. (2023) has demonstrated that volume conduction creates significant challenges for EMG signal interpretation. In their systematic review of noise and artifact reduction techniques, the authors found that as much as 30% of a signal detected directly over an active muscle can appear at inactive recording sites through volume conduction (Chowdhury et al., 2023). This phenomenon, called crosstalk, occurs when electrical activity from one muscle contaminates recordings from another muscle, potentially leading to incorrect conclusions about which muscles are active during a movement.
Volume conduction has practical implications for your biofeedback practice. When monitoring muscle activity with surface EMG, you are not detecting signals from individual muscle fibers. Instead, you are picking up the combined electrical activity of many motor units as their signals spread through body fluids. This spreading can cause crosstalk, where activity from one muscle contaminates your readings of another muscle. Understanding volume conduction helps you position electrodes strategically to minimize crosstalk and maximize signal quality.
Volume conduction also explains why ECG artifact can appear in SEMG recordings. When the heart muscle contracts, it generates strong electrical signals that spread throughout the body via volume conduction. If you place SEMG electrodes on the torso or upper back, these heart signals may appear as sharp vertical spikes (R-spikes) superimposed on the muscle activity you are trying to measure. Recognizing this artifact prevents you from misinterpreting heart signals as muscle tension.
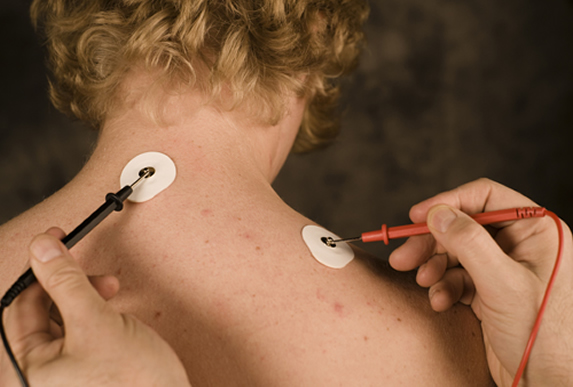
Electrodes: Converting Ions to Electrons
Electrodes are specialized conductors that serve as the bridge between the body's ion currents and your equipment's electron currents. They convert the ionic signal at the skin surface into an electronic signal that can travel through your cables and into your amplifier. Without this conversion, your equipment would have nothing to display.
For EEG monitoring, electrodes function like tiny antennas picking up the weak signals that macrocolumns of cortical neurons broadcast to the scalp surface. The signals arrive as currents of ions that have volume conducted through the skull and scalp tissues. The electrode captures these signals and converts them to electron currents that travel down the cable to your electroencephalograph.
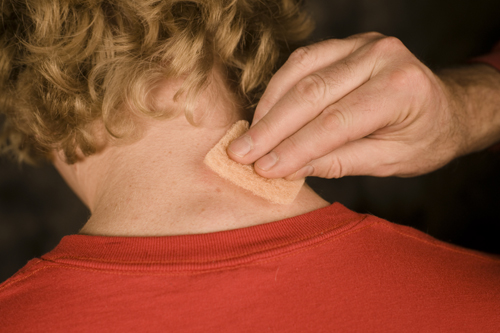
Here is why skin preparation matters so much. The outer layer of skin (the epidermis), along with oils, dead cells, and body fat, all act as insulators that interfere with ion current flow. These barriers significantly reduce the signal that reaches your electrodes, potentially burying valid biological data in electrical noise. When you clean, abrade, and apply conductive gel to a client's skin, you are reducing this insulating barrier so more of the biological signal can reach your electrodes.
Understanding Current Measurement
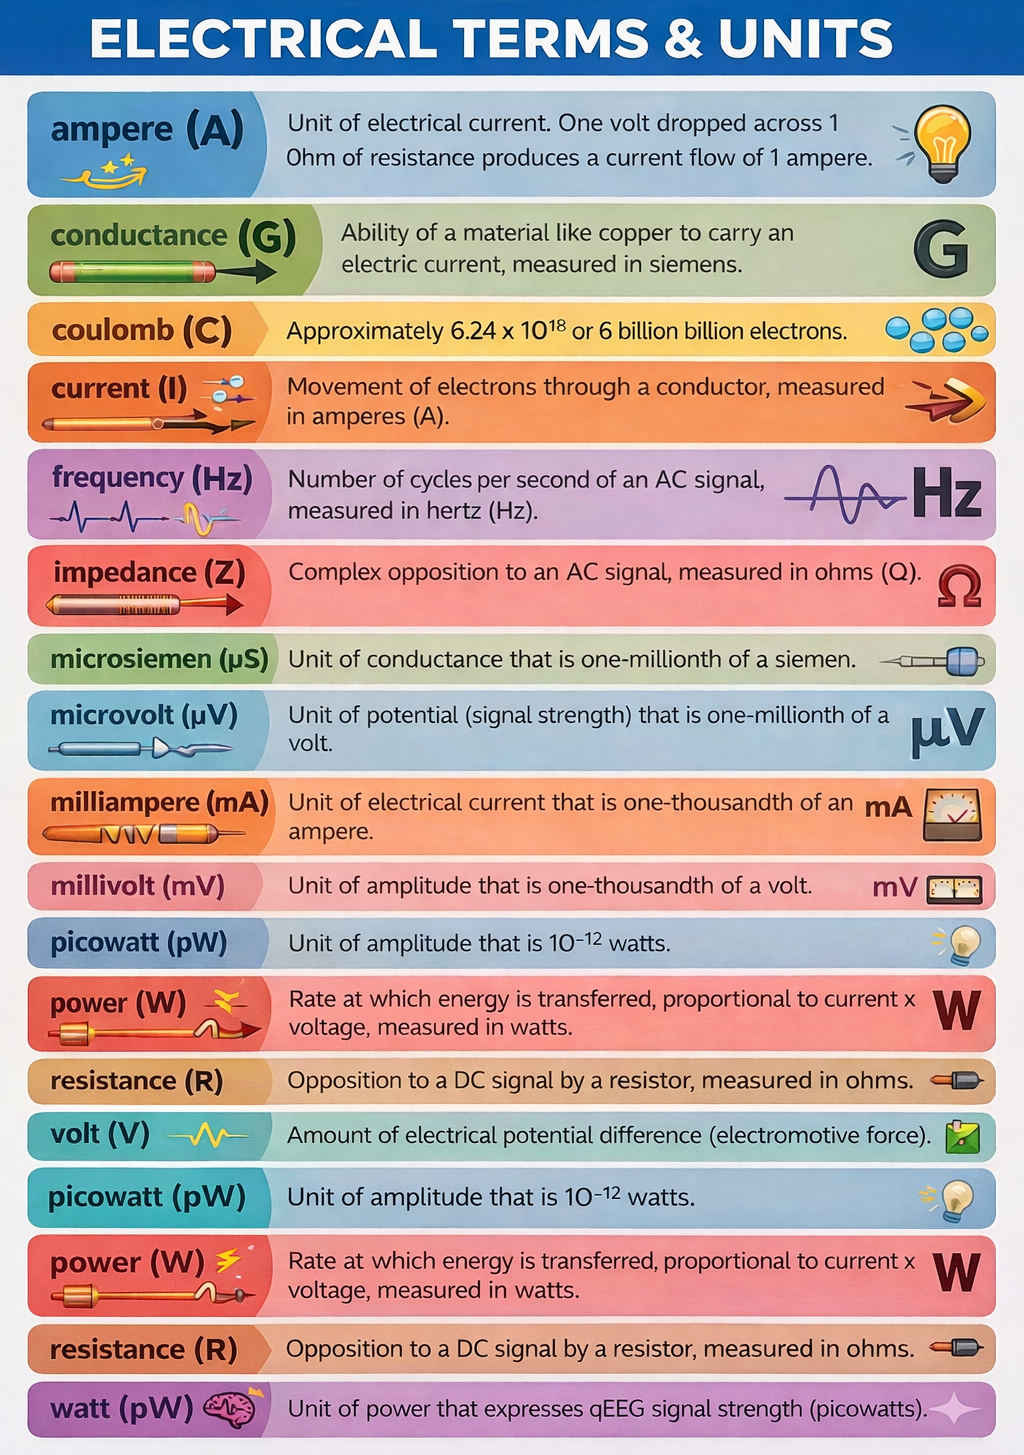
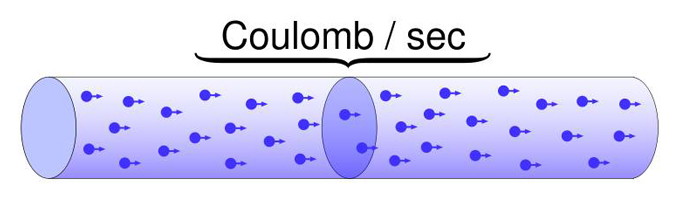
Current is measured in amperes (A). One ampere equals one coulomb of charge (approximately 6.24 x 10¹⁸ electrons) passing a point in one second. You will rarely work with full amperes in biofeedback since biological signals involve much smaller currents, typically measured in milliamperes (mA, thousandths of an ampere) or microamperes (μA, millionths of an ampere).
Two Types of Current: DC and AC
Electricity travels in two fundamental patterns, and understanding both is essential because different biofeedback modalities measure different types of signals. Direct current (DC) flows in one direction only, like water flowing downhill. Alternating current (AC) periodically reverses direction, like water sloshing back and forth in a bathtub.
Listen to a mini-lecture on DC and AC
Many biofeedback modalities measure DC signals. Blood volume pulse, skin temperature, and respiratory signals are all DC because they represent quantities that change gradually in one direction before reversing. When you monitor hand warming in temperature biofeedback, you are tracking a DC signal that slowly rises as blood vessels dilate and slowly falls as they constrict.
Other modalities measure AC signals. The EEG, ECG, and SEMG all contain waveforms that oscillate above and below a baseline many times per second. The frequency of an AC signal, measured in hertz (Hz), tells you how many complete cycles occur each second. When you train a client to increase alpha waves in neurofeedback, you are working with AC signals that oscillate at 8 to 12 cycles per second (8-12 Hz).
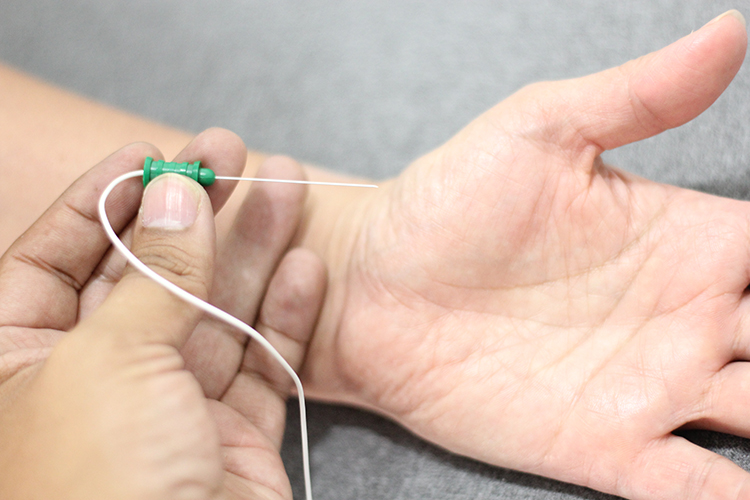
EMG signals contain frequencies ranging from 2 to 10,000 Hz, but surface electrodes can only detect frequencies up to about 1,000 Hz. Higher frequencies are absorbed by the fat and skin layers before reaching the surface, which is why needle electrodes inserted directly into muscle can detect a wider frequency range than surface electrodes.
Listen to a mini-lecture on EMG Electrodes
What Pushes Current Through a Circuit
For current to flow, there must be a difference in electrical potential between two points. This difference, called electromotive force (EMF), provides the "push" that drives electrons through a circuit. In a flashlight battery, the negative terminal has excess electrons that repel each other, while the positive terminal has a deficit of electrons that attracts them. This difference creates the push that makes current flow.
Biological signals work on the same principle. When a neuron fires, the inside of the cell briefly becomes more positive than the outside, creating a potential difference. This voltage difference drives ion current through the surrounding tissue. When that current reaches your electrodes, the electrodes convert it to electron current that flows through your equipment because of the potential differences created by your amplifier.
A Modern Understanding of Electrical Energy
The classic model of electrons physically traveling through wires is actually a simplification. Electrons do not race from a power plant to your light bulb or from a battery to your flashlight. Instead, electromagnetic fields carry energy through space, causing electrons to move slightly in their local positions. This is true for all electrical systems, including the biological signals you monitor. Watch the YouTube video The Big Misconception About Electricity for an excellent explanation of this concept.
Biological signals travel from their source to the skin surface through volume conduction, where ion currents spread through interstitial fluid. Electrodes convert these ion currents into electron currents that your equipment can process. DC signals flow in one direction and include temperature and blood volume pulse. AC signals reverse direction many times per second and include EEG and SEMG. Understanding these concepts helps you recognize valid signals and identify artifacts like ECG contamination of SEMG recordings.
Check Your Understanding: Signal Travel
- Explain the difference between how biological signals travel (as ion currents) versus how signals travel through your equipment (as electron currents).
- What is volume conduction, and why does it matter for surface EMG recordings?
- A client asks why you need to prepare the skin before attaching EMG electrodes. How would you explain this using the concept of insulators?
- What is the key difference between DC and AC signals, and which biofeedback modalities use each type?
Measuring Signal Strength and Opposition
When you perform biofeedback, you need to know whether your equipment is receiving an adequate signal. Two measurements help you evaluate this: voltage (which indicates signal strength) and impedance (which indicates how much opposition the signal encounters). Understanding these concepts and their relationship through Ohm's law will help you troubleshoot problems and ensure valid recordings.
Voltage: Measuring Signal Strength
The strength of an electrical signal is measured in volts (V), with voltage abbreviated as E in equations. Think of voltage as the "pressure" pushing electrons through a circuit, similar to water pressure pushing water through a pipe. A typical flashlight battery produces 1.5 volts. One volt is the potential difference needed to make one coulomb of charge perform one joule of work.
Biological signals are measured in much smaller units. EEG and SEMG amplitudes are typically less than 100 microvolts (μV), where one microvolt is one millionth of a volt. ECG signals are somewhat larger, measured in millivolts (mV), where one millivolt is one thousandth of a volt. When you see SEMG readings of 5 μV on your display, you are looking at an extremely weak signal that your equipment has amplified thousands of times.
Power: Voltage and Current Combined
The overall power of an electrical signal depends on both how much current flows and how much voltage drives it. Power is measured in watts (W) and calculated by multiplying amperes by volts. For example, an appliance drawing 10 amperes at 115 volts consumes 1,150 watts.
In quantitative EEG (qEEG) analysis, clinicians and researchers increasingly express signal strength in picowatts, which are trillionths of a watt. The qEEG is digitized statistical brain mapping that uses at least 19 channels to measure EEG amplitude within specific frequency bands. Expressing results in power units helps standardize comparisons across different recording conditions.
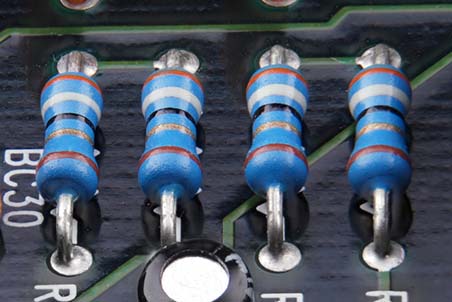
Resistance: Opposition in DC Circuits
Resistance (R) is the opposition that electrons encounter as they move through a material. Resistance is measured in ohms (Ω). Every conductor has some resistance, even excellent conductors like copper wire. The amount of resistance depends on the material's atomic structure. Atoms with more electrons in their outer energy level hold onto those electrons more tightly, creating greater resistance.
Listen to a mini-lecture on Resistance and Conductance

Resistance directly affects the signal quality you achieve with clients. Dead skin cells, oils, and dirt all create resistance that blocks biological signals from reaching your electrodes. These barriers force the weak biological signal to compete with stronger electrical noise from the environment. This is why skin preparation is not optional for EEG and SEMG monitoring. When you clean, abrade, and apply conductive gel, you are reducing resistance so that more of the biological signal can reach your equipment.

Resistance is also a biological signal in its own right. Skin resistance level (SRL) measures how much the skin opposes current flow, expressed in kilohms per square centimeter (Kohms/cm²). Typical values range from 0 to 500 Kohms/cm². When your client experiences emotional arousal, increased sweat gland activity adds moisture to the skin, which reduces resistance. Monitoring this change is the basis of skin conductance biofeedback.
Recent research has expanded our understanding of skin electrical properties. Schach et al. (2022) found that electrodermal activity biofeedback can alter functional brain networks in people with epilepsy, demonstrating the close relationship between peripheral sympathetic activity and central nervous system function. Their work showed that training individuals to control their skin conductance levels may influence cortical excitability, highlighting how the electrical properties you measure at the skin surface reflect deeper neurophysiological processes.
Conductance: The Opposite of Resistance
Conductance (G) is the flip side of resistance. While resistance measures how much a material opposes current flow, conductance measures how easily current flows through it. Mathematically, conductance is the reciprocal of resistance (G = 1/R). Conductance is measured in siemens (previously called mhos, which is ohm spelled backward).
Some biofeedback systems measure electrodermal activity as skin conductance rather than skin resistance. Skin conductance level (SCL) is expressed in microsiemens (μS). When sweat gland activity increases, skin conductance goes up because moisture improves the skin's ability to conduct electricity. Whether your system measures resistance or conductance, you are monitoring the same underlying phenomenon from opposite perspectives.
Ohm's Law: The Fundamental Relationship
Ohm's law describes the mathematical relationship between voltage, current, and resistance: Voltage (E) = Current (I) × Resistance (R). This simple equation has profound practical implications for biofeedback. If you know any two values, you can calculate the third. More importantly, you can use this relationship to understand why certain procedures improve signal quality.
Listen to a mini-lecture on Ohm's LawAlso, check out the YouTube video MAKE Presents: Ohms Law.

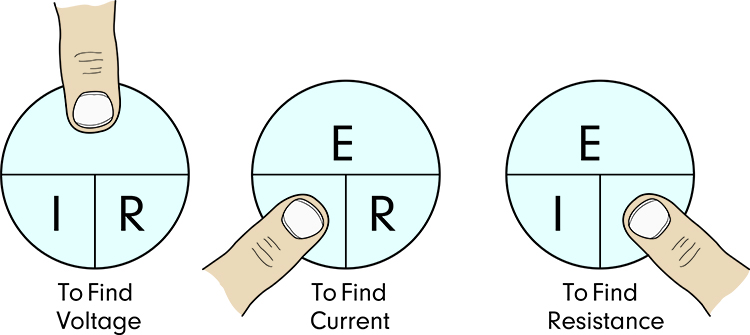
Ohm's law explains why biofeedback equipment and procedures work the way they do. Your amplifier uses a high differential input impedance (a network of resistors) to increase the voltage of incoming signals. According to Ohm's law, E = I × R, so increasing R (resistance) increases E (voltage) for any given current. This boosted voltage helps your equipment distinguish weak biological signals from background noise.
You can also rearrange Ohm's law to understand skin preparation. If Current (I) = Voltage (E) / Resistance (R), then reducing resistance increases current. When you clean and abrade a client's skin, you reduce the resistance that biological signals must overcome. This allows more current to reach your electrodes, improving signal quality. The same principle explains why applying conductive gel helps: the gel provides a low-resistance pathway between skin and electrode.
Dry electrodes, like those in some modern EEG systems, do not require skin preparation or conductive paste. These electrodes use design innovations to achieve adequate signal quality without the traditional preparation steps. They save setup time but may not achieve the same signal quality as properly prepared wet electrodes.
Impedance: Opposition in AC Circuits
Impedance (Z) is the opposition that AC signals encounter in a circuit, measured in ohms. Impedance is more complex than simple resistance because it includes the effects of frequency. When current reverses direction many times per second, it encounters additional opposition from circuit components that store and release energy. For practical purposes in biofeedback, you can think of impedance as the AC equivalent of resistance.
Listen to a mini-lecture on Impedance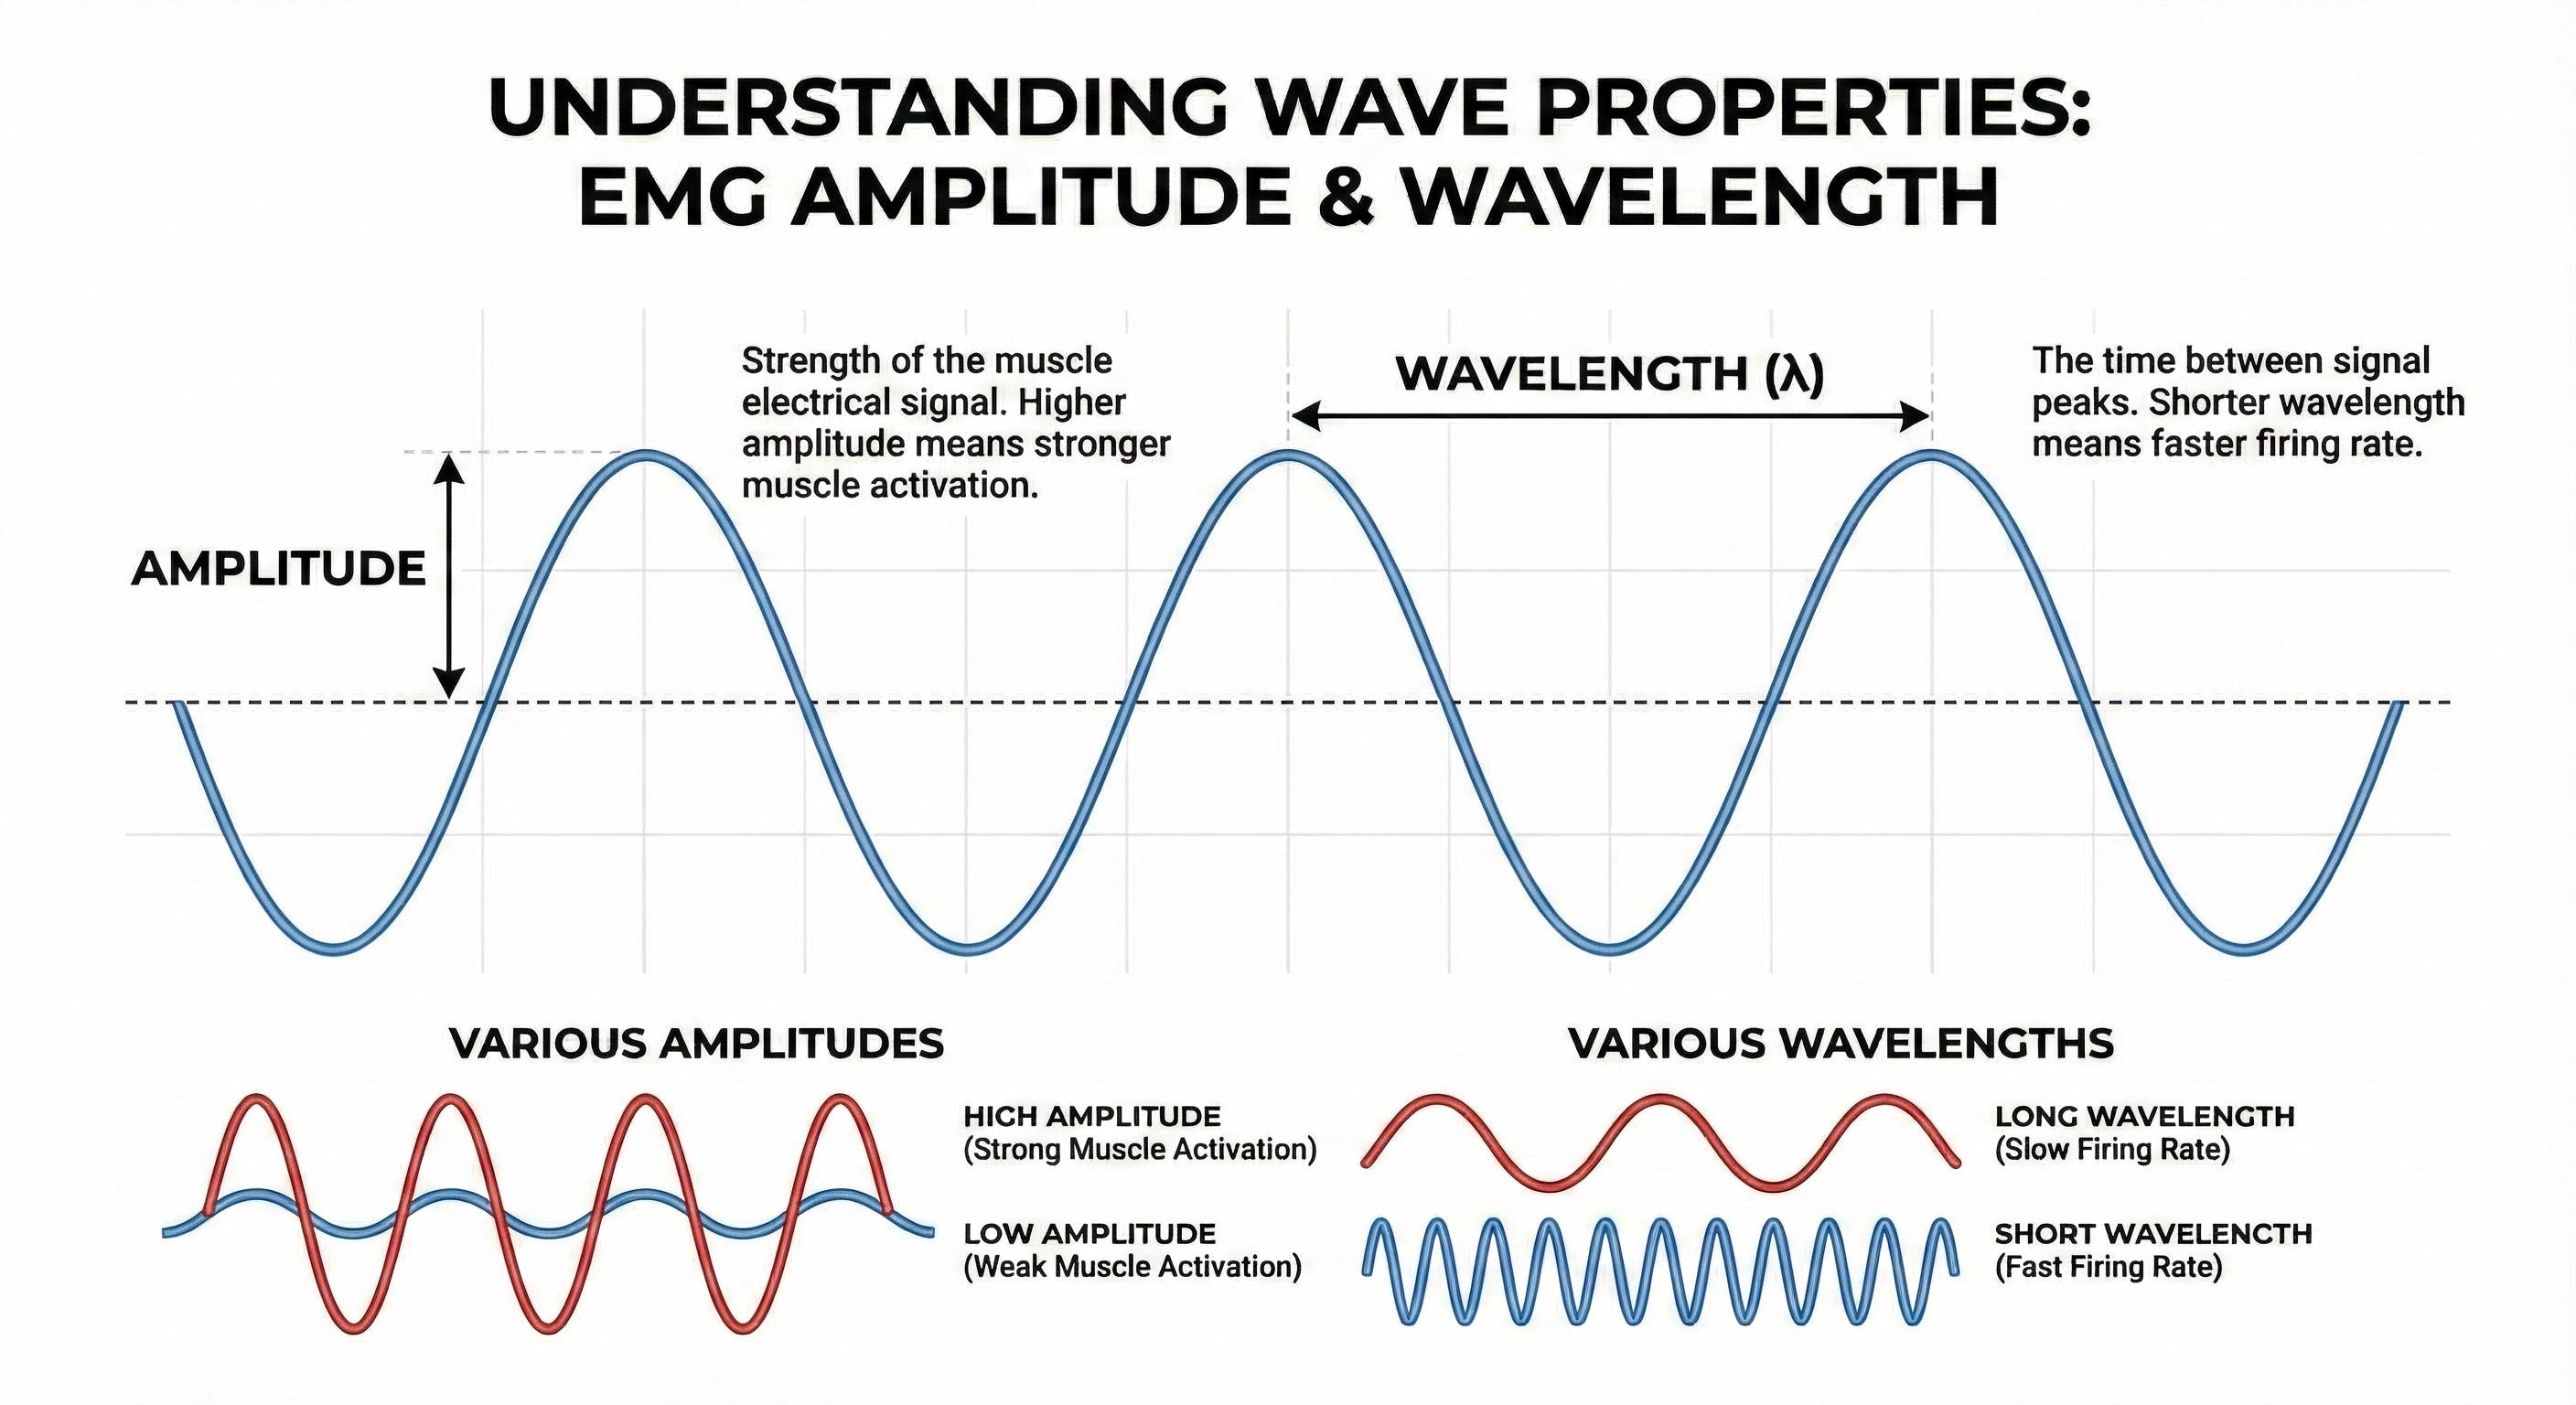
Murphy et al. (2021) conducted a landmark study examining how the skin-electrode interface impedance changes over time under different skin treatments. Their research compared mechanical abrasion, chemical exfoliation, microporation, and no treatment in healthy human subjects over 24 hours. The findings revealed that mechanical abrasion yields the lowest initial impedance, while other treatments provide only modest improvement compared to untreated skin (Murphy et al., 2021). This research confirms why the traditional practice of mild abrasion before electrode placement remains the gold standard for achieving low, stable impedance in clinical biofeedback applications.
The impedance test is one of the most important quality checks you will perform in biofeedback practice. This test determines whether you have prepared the skin adequately and attached electrodes properly. If impedance is too high, your weak biological signal must compete with stronger electrical noise from power lines, fluorescent lights, and other sources. The result can be a display that shows power line fluctuations at 50 or 60 Hz instead of your client's actual physiological activity.
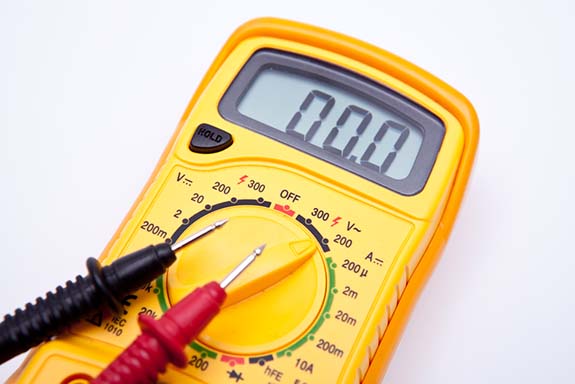
You can measure impedance manually using an impedance meter (for AC) or voltohmmeter (for DC), or you can use software integrated with your biofeedback system. Many modern systems include automatic impedance checking that displays values for each electrode site.
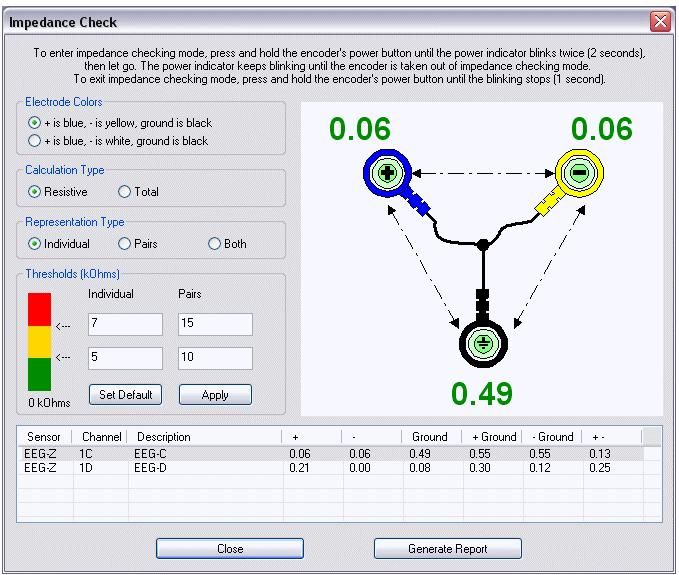
For SEMG biofeedback, follow this practical guideline: impedance should not exceed 10 kilohms (10 Kohms), and the impedance at each electrode site should be balanced within 5 Kohms. If one electrode has much higher impedance than another, the imbalance can cause artifacts that distort your readings. When impedance is too high or unbalanced, clean and abrade the skin again, apply fresh conductive gel, and retest.
For AC circuits, Ohm's law becomes: voltage = current × impedance (e = i × z), using lowercase letters to indicate AC values. The relationship works the same way as for DC circuits. Higher impedance reduces current flow for any given voltage.
Voltage measures signal strength, while resistance and impedance measure opposition to current flow. Ohm's law (E = I × R) describes the mathematical relationship between these quantities. High input impedance in your amplifier boosts the voltage of weak biological signals. Reducing skin resistance through proper preparation increases the current reaching your electrodes. For SEMG, keep impedance below 10 Kohms and balanced within 5 Kohms between electrode sites to ensure clean signal acquisition.
Check Your Understanding: Signal Strength and Opposition
- Using Ohm's law, explain why skin preparation improves SEMG signal quality.
- What is the difference between resistance and impedance?
- What impedance values are acceptable for SEMG biofeedback, and why does impedance balance matter?
- Why do neurofeedback clinicians increasingly express qEEG signal strength in picowatts rather than microvolts?
Signal Processing and Equipment Troubleshooting
Your biofeedback equipment does far more than simply display raw biological signals. It processes those signals through multiple stages: dropping them across input impedance, amplifying them, filtering out unwanted frequencies, and converting them into visual or auditory feedback. Understanding this signal chain helps you troubleshoot problems when your displays do not match what your client is actually doing.
Recording Methods: Monopolar and Bipolar
Monopolar recording uses one active electrode and one reference electrode to produce a single signal. This method captures activity at one location relative to a neutral reference point. Bipolar recording uses two active electrodes and a shared reference, producing two signals that can be compared or subtracted from each other. Bipolar recording helps reject noise that appears equally at both active sites.
When SEMG signals enter your electromyograph, they are dropped across an input impedance (a network of resistors), then amplified, filtered to remove unwanted frequencies, rectified to convert the AC signal to DC, integrated over time, measured by a level detector, and finally displayed. Problems at any stage can produce invalid readings that do not reflect your client's actual muscle activity.
Recent advances in wearable technology have introduced new challenges for signal processing. Böttcher et al. (2022) evaluated data quality in wearable neurophysiological monitoring and found that all recording modalities, including accelerometry, electrodermal activity, and blood volume pulse, are affected by artifacts. Their study of over 127,000 hours of recordings revealed that data loss was significantly higher when using data streaming compared to onboard device storage (Böttcher et al., 2022). For biofeedback practitioners, this research underscores the importance of understanding how your equipment processes and transmits data, as signal processing choices can substantially affect the quality of the feedback you provide to clients.
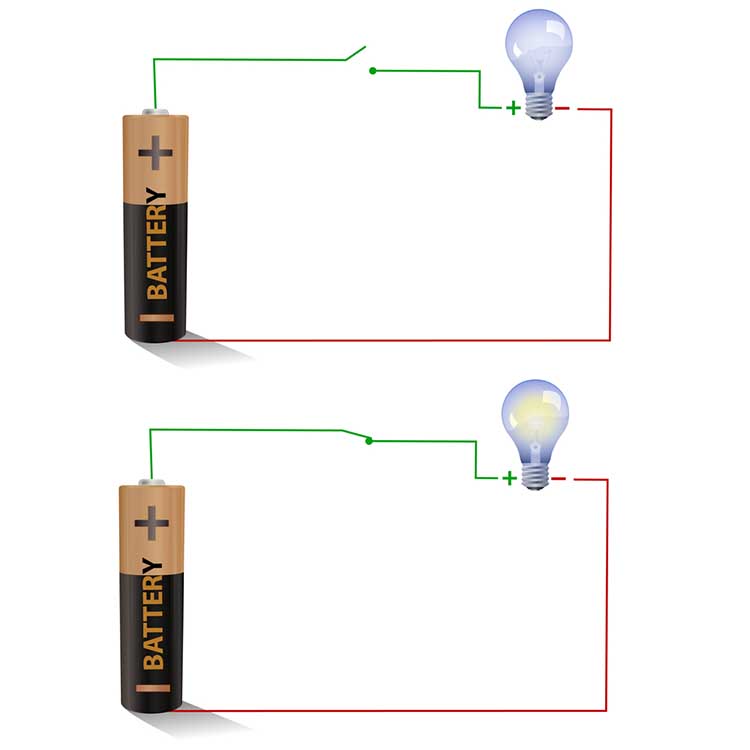
Open Circuits: When the Signal Path Breaks
A closed circuit provides a complete path for current to flow from source to destination and back. An open circuit has a break somewhere in this path that stops current flow entirely. The most common cause of open circuits in biofeedback is a broken electrode cable. If the wire inside the cable has fractured, electrons cannot travel from your electrodes to your amplifier, and no signal will appear on your display.
You can detect a broken cable by performing a continuity test. Send a test signal down the cable and measure the opposition to current flow. If the cable is intact (continuous), impedance will be very low because current flows easily through the conductor. If the cable is broken (open), impedance will be infinite because current cannot flow across empty space. Replacing a broken cable immediately solves this problem.
Listen to a mini-lecture on Open and Closed Circuits
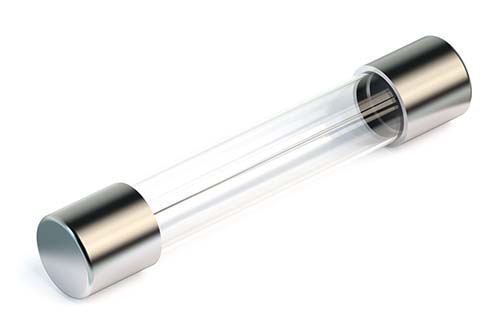
A blown fuse is another example of an open circuit. Fuses contain a thin filament that melts when current exceeds safe levels, intentionally breaking the circuit to prevent damage. If your equipment suddenly stops working after a power surge, a blown fuse may be the cause.
Behavioral Tests: Verifying the Entire System
A continuity test only tells you whether current can flow through a cable. It does not tell you whether your entire system is accurately tracking your client's physiological activity. For that, you need a behavioral test, also called a tracking test. This test verifies that the complete signal chain (sensor, preamplifier, cable, encoder, and computer) responds appropriately to known physiological changes.
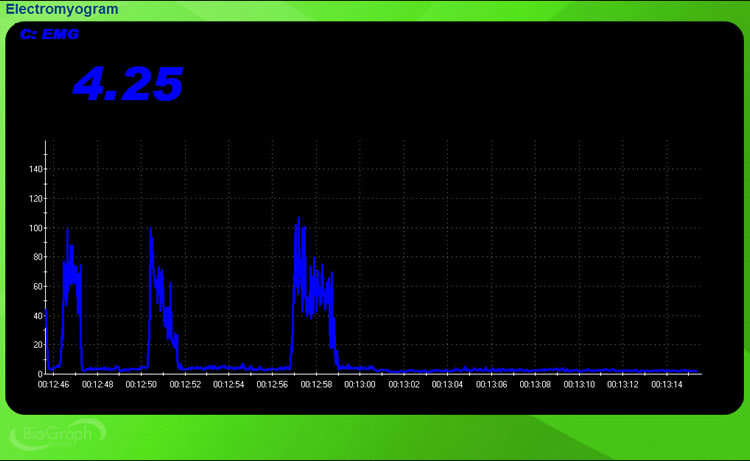
Listen to a mini-lecture on Behavioral TestsHere is how to perform a behavioral test for EMG. After attaching electrodes and checking impedance, ask your client to contract the target muscle briefly, then relax it, then contract again. Watch your display. You should see the SEMG amplitude increase during each contraction and return to baseline during each relaxation period. If the display tracks these voluntary movements accurately, your system has passed the behavioral test and you can trust that subsequent readings reflect actual muscle activity.
Always perform a behavioral test before beginning training with a client. This simple check catches problems that impedance testing alone would miss, such as software configuration errors, display calibration issues, or sensor malfunctions. If your display does not track voluntary muscle activity, do not proceed with training until you identify and correct the problem.
Short Circuits: When Current Takes a Wrong Turn
A short circuit occurs when an unintended connection creates a new pathway for current to flow. This new pathway typically has much lower resistance than the intended circuit, so it draws excessive current away from the proper route. On an impedance meter, a short circuit reads close to 0 Kohms because current flows very easily through the unintended pathway.
Listen to a mini-lecture on Short Circuits
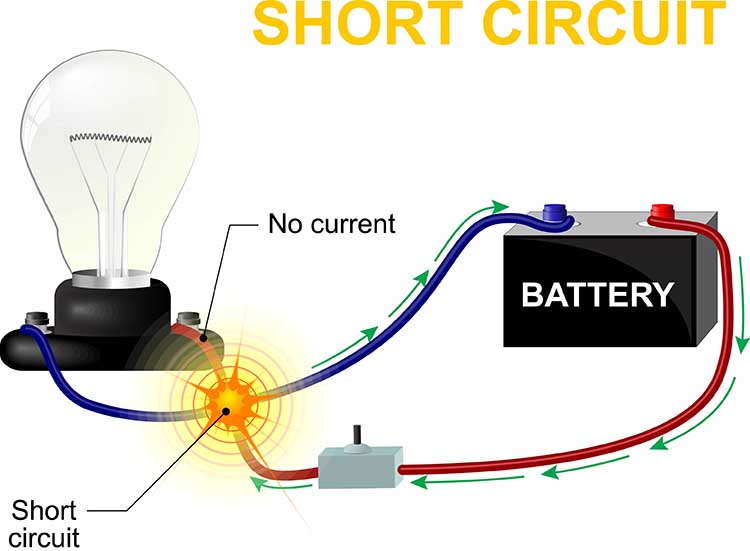
Short circuits are dangerous because the reduced resistance allows excessive current to flow. According to Ohm's law, if resistance decreases while voltage stays constant, current must increase. This increased current can generate enough heat to melt wires, damage components, or cause electrical burns. Imagine a bare wire inside an electroencephalograph touching its metal case. AC from the power outlet could leak through the case and shock anyone who touches the equipment.
Maintaining Signal Quality
The biological signals you monitor are extremely weak compared to the electromagnetic noise that surrounds them. Power lines, fluorescent lights, computer monitors, and cell phones all generate electrical fields that can contaminate your recordings. Your equipment amplifies the biological signal to make it distinguishable from this noise, but amplification works on everything: it boosts the signal you want while also boosting any noise that got through.
This is why connection quality matters at every point in the signal chain. The skin surface must be properly prepared to reduce impedance. The conductive gel or paste must provide good contact between skin and electrode. The sensors must be firmly attached and properly positioned. The connecting wires must be intact and properly shielded. Problems at any of these points degrade signal quality and can produce displays that mislead both you and your client.
Your biofeedback equipment processes signals through multiple stages from input impedance to final display. Open circuits (breaks in the signal path) stop current flow entirely and show infinite impedance. Short circuits (unintended connections) have very low impedance and can cause dangerous current levels. Continuity tests check for cable breaks, while behavioral tests verify that your entire system accurately tracks physiological activity. Always perform both tests before beginning client training.
Check Your Understanding: Signal Processing
- What is the difference between a continuity test and a behavioral test?
- Why would an open circuit show infinite impedance on an impedance meter?
- How would you explain to a new clinician why behavioral tests are important before beginning a session?
- What happens to current flow during a short circuit, and why is this dangerous?
Protecting Clients From Electrical Hazards
Every time you connect a client to biofeedback equipment, you become responsible for their electrical safety. Modern equipment includes multiple protective features, but understanding these safeguards helps you use them properly and recognize when something might be wrong. The stakes are real: electrical current at surprisingly low levels can cause injury or death.
Listen to a mini-lecture on Shock 
Understanding Dangerous Current Levels
The numbers are sobering. A 1-second exposure to just 5 milliamperes (5 mA) can cause injury. At 18 mA, current can interfere with breathing. At 50 mA, current can trigger ventricular fibrillation, a life-threatening condition where the heart's lower chambers quiver chaotically instead of pumping blood. To put this in perspective, a typical household outlet can deliver thousands of milliamperes.
Biomedical engineers have developed multiple strategies to protect clients from these hazards. Modern biofeedback equipment uses ground fault interrupt circuits, optical isolation, fiber optic connections, and wireless telemetry to prevent dangerous current from reaching clients. Understanding how each protection works helps you verify that safety systems are functioning properly.
Listen to a mini-lecture on Precautions
The IEC 60601 standard, published by the International Electrotechnical Commission, provides the foundational framework for electrical safety in medical devices worldwide. This series of standards covers general requirements for basic safety and essential performance of medical electrical equipment, including the biofeedback devices you use in clinical practice. The standard specifies allowable leakage current limits, which is the small amount of current that can flow through insulation or along unintended paths even in properly functioning equipment. Understanding that these international standards govern your equipment's design helps you appreciate the multiple layers of protection built into modern biofeedback systems.
Ground Fault Interrupt Circuits
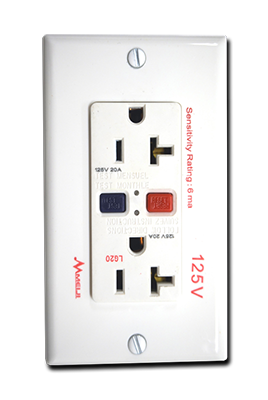
A ground fault interrupt circuit (GFIC) monitors the current flowing through equipment and automatically shuts off power when it detects a problem. Specifically, it watches for current "leaking" from the circuit to ground, which indicates that electricity is flowing through an unintended pathway. When leakage exceeds 5 mA, the GFIC triggers a circuit breaker that cuts power immediately.
Montgomery (2004) recommended plugging your entire biofeedback system into the same power outlet. This creates a common ground reference so that any current leakage in your equipment will trigger the GFIC protection. If you spread equipment across multiple outlets on different circuits, some leakage might not be detected because it returns through a different ground path.
Optical Isolation
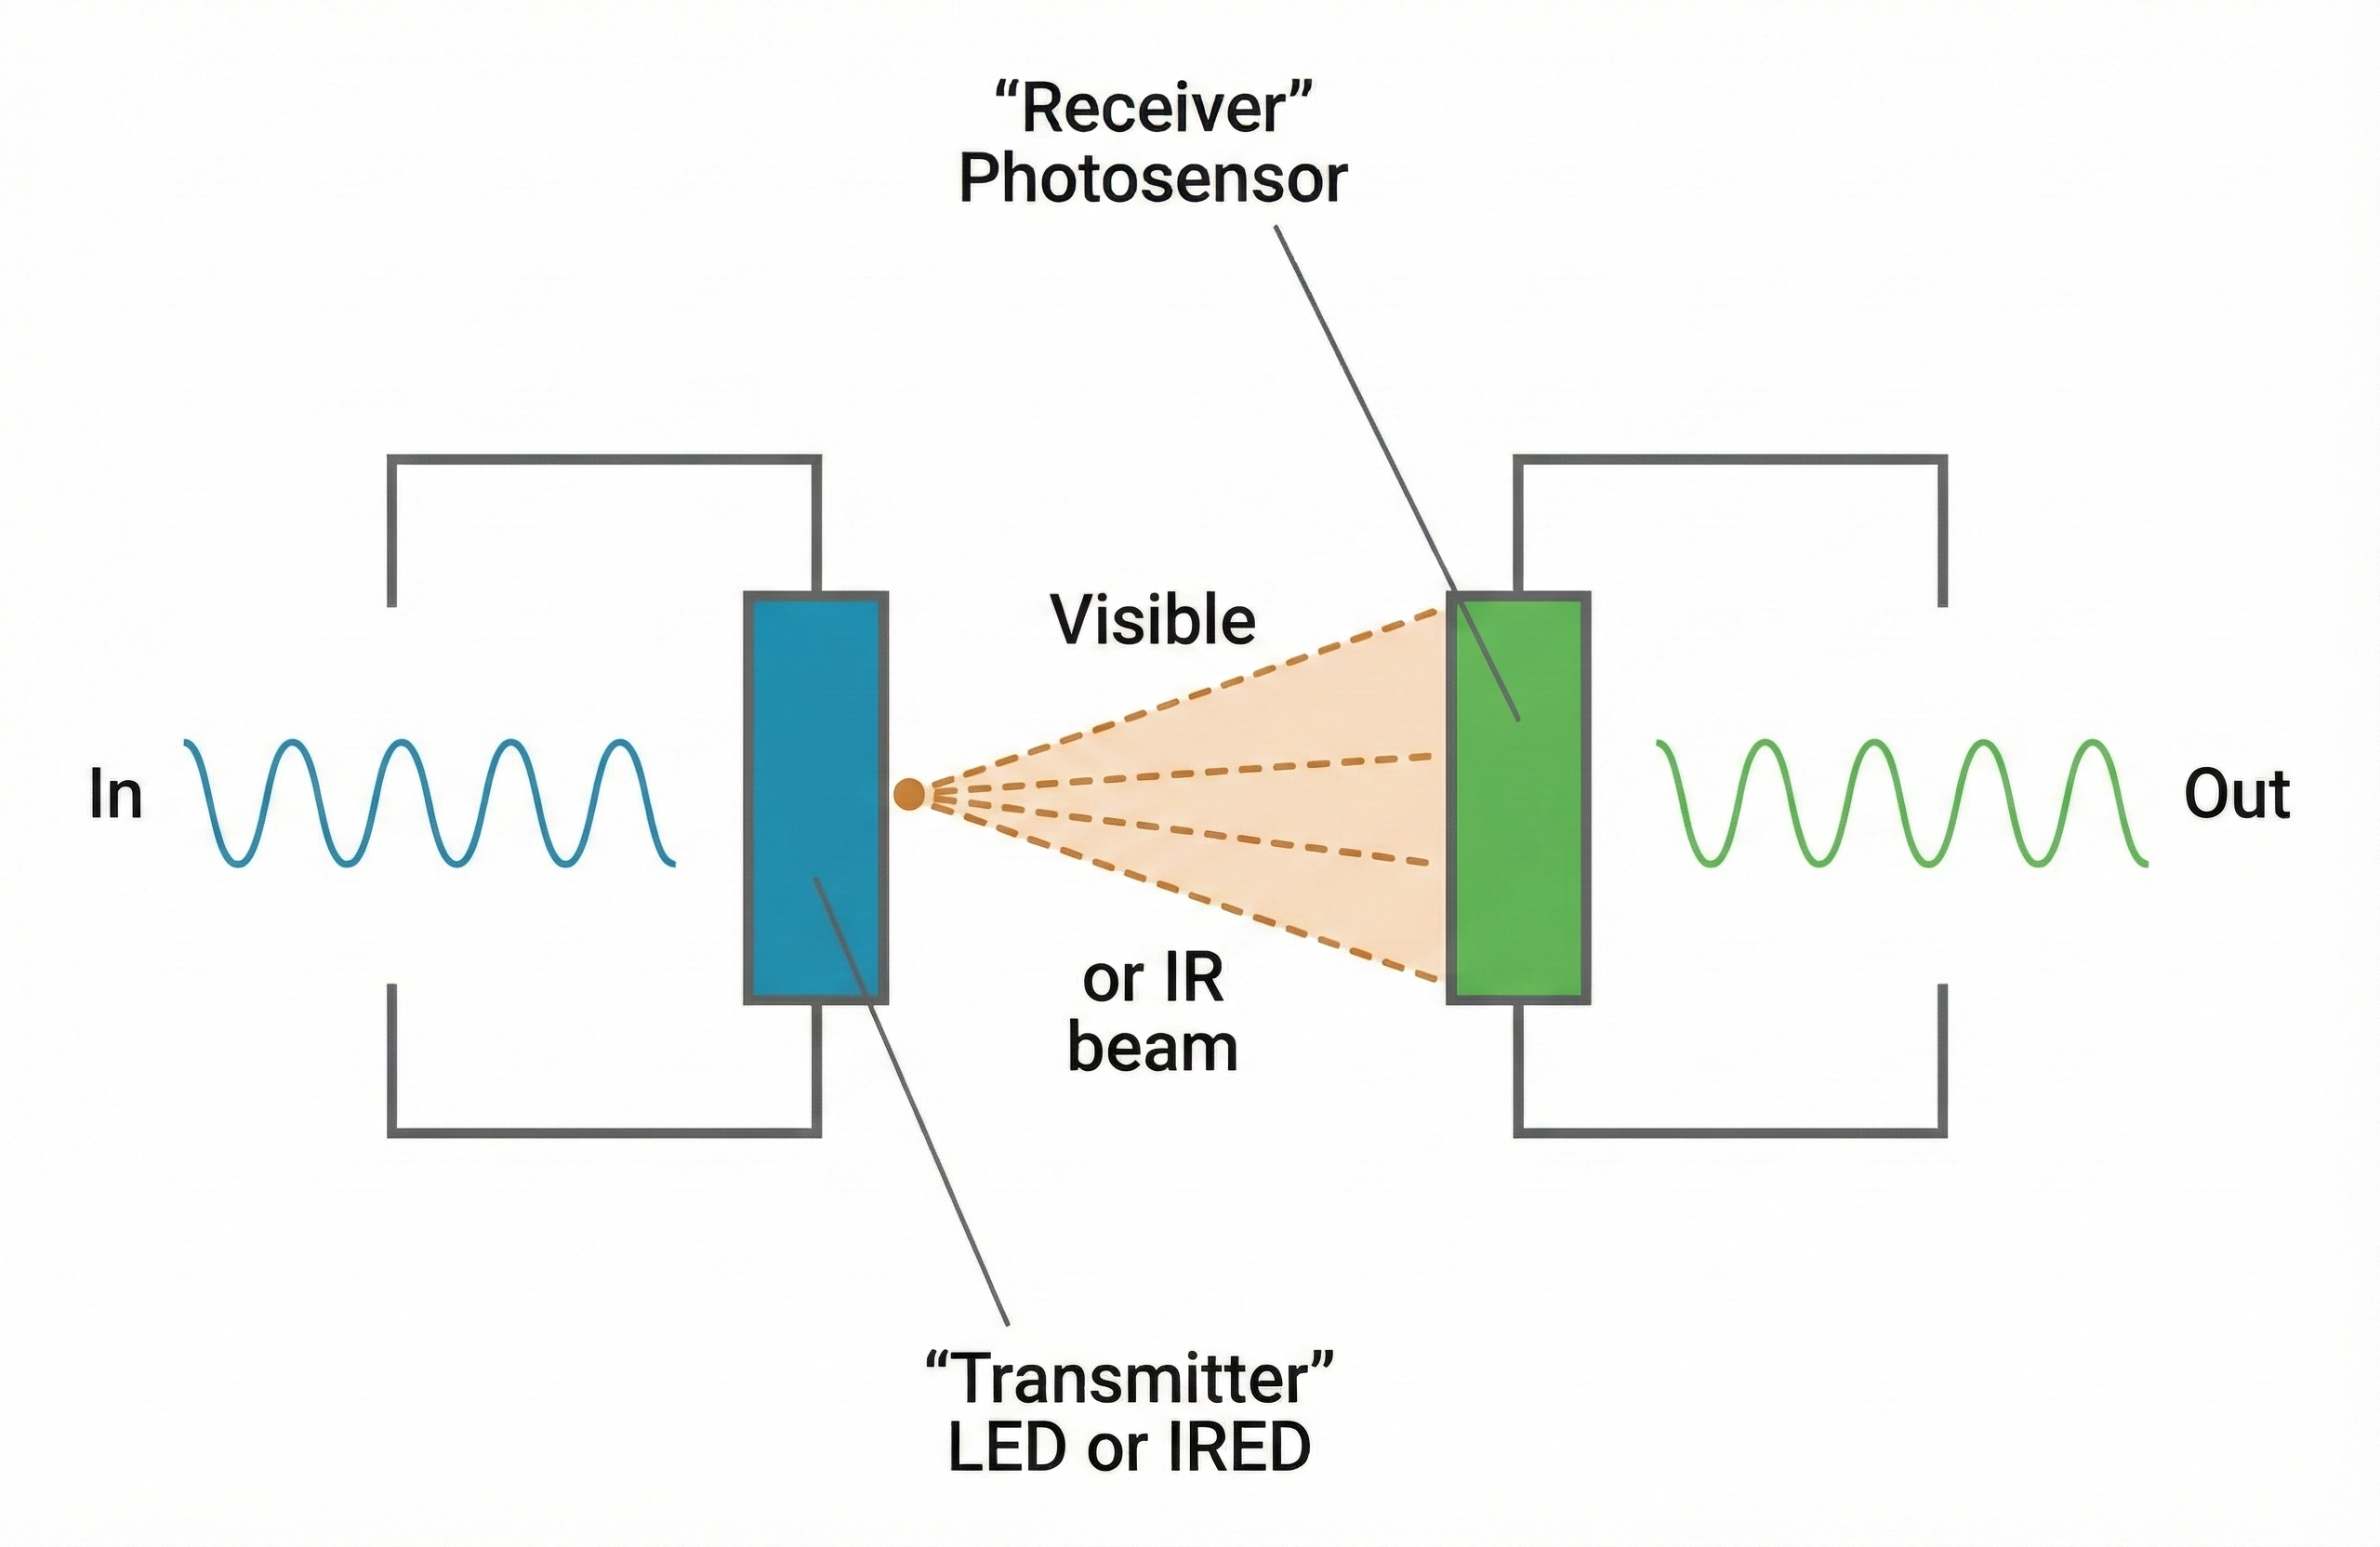
Optical isolation protects clients from equipment that receives AC power by converting electrical signals to light and back again. Inside an optical isolator, the biological signal drives a light-emitting component. The light crosses a physical gap (which is actually an open circuit that blocks electron flow), and a light-sensitive component on the other side converts the light back into an electrical signal. Current cannot flow across the gap, so a malfunction in the powered equipment cannot send dangerous current to the client.
Fiber Optic Connections
Fiber optic cables carry signals as pulses of light through thin, flexible glass or plastic fibers. Because light consists of photons rather than electrons, fiber optic cables cannot conduct electrical current. When your biofeedback system uses fiber optic connections between the electrodes and the computer, it becomes physically impossible for electrical current to leak from the computer to your client.
Fiber optic connections provide an additional benefit: they are immune to electromagnetic interference. Power line noise, radio waves, and other electrical disturbances cannot contaminate a light signal the way they can contaminate an electrical signal. This means cleaner recordings with less artifact.
Wireless Telemetry
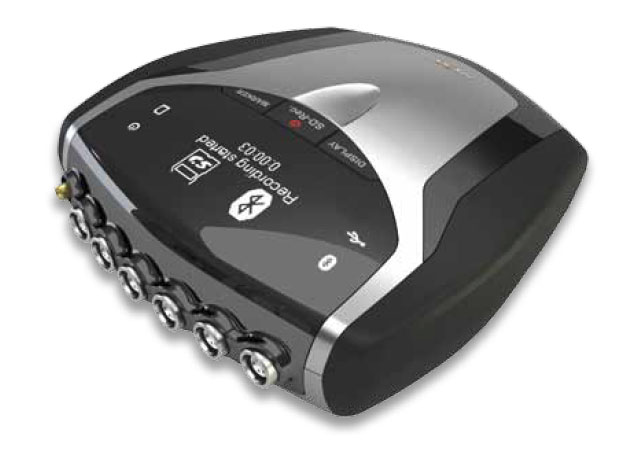
Telemetry transmits physiological data wirelessly from a battery-powered encoder unit worn by the client to a computer several meters away. Because there is no physical electrical connection between the client and the computer, current surges cannot reach the client even if the computer malfunctions. The encoder unit uses its own batteries, so it is not connected to building power.
Battery-powered encoder boxes are standard in modern biofeedback systems. Even when these units connect to computers via cables rather than wirelessly, the battery power isolates clients from building electrical systems. Combined with optical isolation and fiber optic connections, multiple layers of protection stand between your client and potential electrical hazards.

Safety is paramount in biofeedback practice. Current as low as 5 mA can cause injury, and 50 mA can trigger fatal ventricular fibrillation. Modern biofeedback equipment protects clients through ground fault interrupt circuits (which shut off power when leakage exceeds 5 mA), optical isolation (which converts electrical signals to light), fiber optic cables (which prevent electron flow), and wireless telemetry (which eliminates direct electrical connections). Always plug equipment into the same outlet to ensure ground fault protection works properly.
Check Your Understanding: Safety Precautions
- At what current level does the risk of injury begin, and at what level can ventricular fibrillation occur?
- How does optical isolation protect clients from electrical shock?
- Why did Montgomery recommend plugging all biofeedback equipment into the same power outlet?
- Explain how telemetry provides an additional layer of safety protection.
- What should you do immediately if water is spilled near your biofeedback equipment during a session?
Cutting Edge Topics in Instrumentation
The Promise and Limitations of Dry Electrodes
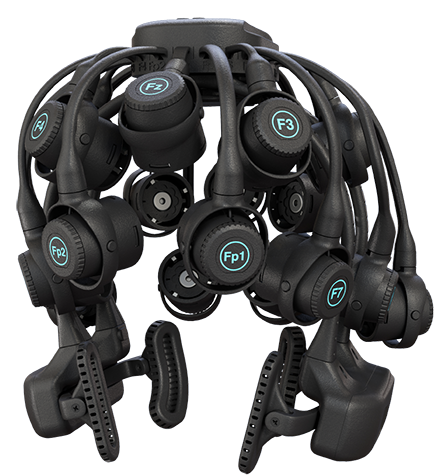
Traditional wet electrodes using silver/silver chloride (Ag/AgCl) with conductive gel have long been the gold standard for biofeedback recording. However, preparing these electrodes takes time, the gel can dry out during long sessions, and some clients experience skin irritation from repeated use. These frustrations have driven researchers to develop dry electrodes, which are sensors that make direct contact with the skin without requiring conductive gel or paste (Liu et al., 2023). The technology sounds appealing, but understanding when dry electrodes work well and when they fall short will help you make informed equipment choices.
Dry electrodes offer several genuine advantages in clinical settings. They dramatically reduce preparation time since there is no gel to apply or clean up afterward (Ehrhardt et al., 2024). Studies comparing dry and wet EEG systems have found that dry electrodes significantly reduce setup time while maintaining acceptable signal quality for many applications (Kleeva et al., 2024). Clients also tend to find dry electrodes more comfortable, especially during longer sessions when wet electrode gel can become sticky or irritating. For applications like neurofeedback where clients return repeatedly, dry electrodes eliminate the need for washing hair after each session.
The tradeoff comes in signal quality. Dry electrodes typically produce higher impedance values than properly prepared wet electrodes because there is no conductive medium bridging the gap between the electrode surface and the skin (Liu et al., 2023). This higher impedance makes recordings more susceptible to noise and motion artifact, which is signal contamination caused by movement of electrodes, cables, or the subject during recording. Research has shown that dry EEG produces results similar to wet EEG during resting-state recordings, particularly in higher frequency bands, but may show more variability during movement or cognitive tasks (Ehrhardt et al., 2024).
Different dry electrode designs address these challenges in various ways. Multipin dry electrodes use multiple small pins or prongs that can penetrate through hair to reach the scalp surface more effectively. These designs have shown promising results in multichannel EEG with 64 or more electrodes (Fiedler et al., 2022). Some manufacturers have developed semi-dry electrodes that release small amounts of saline or other conductive fluid to improve contact without the mess of traditional gel. The bottom line for practitioners is that dry electrodes work best for screening, training applications where some signal noise is acceptable, and situations where convenience outweighs the need for research-grade precision.
How Low Does Impedance Really Need to Be?
If you have spent any time with biofeedback equipment, you have probably heard that lower impedance is better. But what do the numbers actually mean, and how low is low enough? The answer depends on your equipment, your application, and whether you care more about absolute impedance values or the balance between electrodes. Understanding these distinctions will help you troubleshoot recording problems and know when to invest more preparation time.
Impedance mismatch occurs when the impedance values at different electrode sites differ significantly from each other, potentially degrading signal quality by converting common-mode noise into differential signals. Clinical guidelines from the American Clinical Neurophysiology Society indicate that with modern digital EEG recording equipment, impedances up to 10 kilohms are acceptable, though optimal recording still requires impedances that are balanced across electrode sites (Halford et al., 2016). The American Academy of Sleep Medicine recommends an upper limit of 5 kilohms for EEG and EOG electrodes, and 10 kilohms for EMG electrodes (American Academy of Sleep Technology, 2021).
What matters as much as absolute impedance is common mode rejection, which refers to the amplifier's ability to reject electrical noise that appears equally at both inputs while amplifying the biological signal of interest. When electrode impedances are mismatched, the amplifier's ability to reject common-mode interference becomes compromised (Ferree et al., 2001). A pair of electrodes at 8 kilohms each will often produce cleaner recordings than one electrode at 2 kilohms and another at 12 kilohms, even though the second pair has a lower average impedance.
Modern high-input-impedance amplifiers have changed the game considerably. Research has demonstrated that with amplifiers having input impedances of 200 megohms or higher, there is no significant amplitude reduction in EEG frequency bands even when scalp-electrode impedances reach 40 kilohms (Ferree et al., 2001). This finding has important practical implications since it means you can often obtain high-quality recordings without aggressive skin abrasion, reducing infection risk and client discomfort. However, impedances should not fall below 100 ohms, as this usually indicates a short circuit or electrode bridging that will corrupt your recordings (Halford et al., 2016).
For surface EMG, the principles are similar but the acceptable ranges differ. The broader frequency content of EMG signals (extending up to several hundred hertz) means that capacitive effects of impedance become more relevant. Most EMG systems perform well with impedances under 10 kilohms, but again, matching between electrode pairs matters more than achieving the lowest possible absolute value. When troubleshooting noisy recordings, check impedance balance first before assuming you need to re-prep all your electrodes.
Consumer Wearables: What They Can and Cannot Do
Your clients may arrive at sessions wearing smartwatches or fitness trackers that claim to measure heart rate, heart rate variability, and even stress levels. These consumer wearables are devices marketed to the general public that use optical sensors to estimate cardiovascular parameters from the wrist, finger, or ear. Understanding what these devices actually measure and their limitations will help you counsel clients appropriately and decide when wearable data might supplement your clinical work.
Most consumer wearables use photoplethysmography (PPG), an optical technique that shines light into the skin and measures changes in light absorption as blood pulses through the vessels (Lee et al., 2020). This differs fundamentally from the electrocardiography (ECG) used in clinical settings, which measures the electrical activity of the heart directly. PPG-based devices measure pulse rate and pulse rate variability, which correlate with but are not identical to heart rate and heart rate variability derived from ECG (Sinichi et al., 2025). Research from West Virginia University has confirmed that what consumer wearables report as HRV is physiologically different from clinical ECG-based measurements due to pulse transit time effects (Tenan et al., 2024).
Motion creates significant challenges for PPG accuracy. Studies have shown that wearable PPG devices are accurate primarily during resting or slow walking conditions, with error rates increasing substantially during more vigorous activity (Lee et al., 2020). The normal frequency range for PPG signals overlaps considerably with motion artifact frequencies, making it difficult to separate true cardiac signals from movement noise. Some validation studies report that PPG-based heart rate error can exceed 20% during cycling or resistance exercise (Bent et al., 2020). For this reason, nocturnal or resting measurements from wearables tend to be more reliable than daytime active measurements.
Skin tone presents another consideration. The green light wavelengths commonly used in consumer wearables are absorbed more strongly by melanin, which can reduce signal quality in individuals with darker skin (Colvonen et al., 2021). Monte Carlo modeling studies have demonstrated that increased skin tone can induce relative signal loss of up to 32 to 61 percent depending on the device configuration (Abuhasira et al., 2022). While some recent studies have found smaller effects than initially feared, practitioners should be aware that wearable accuracy may vary across populations and recommend that clients with darker skin tones verify their device's readings against clinical measurements.
Despite these limitations, consumer wearables offer genuine value for longitudinal self-monitoring and trend detection. Validation studies have found that devices like the Oura ring and Polar chest straps show reasonable agreement with research-grade equipment for resting heart rate and nocturnal HRV measurements (Miller et al., 2022). The key is understanding appropriate use cases. Wearables work well for tracking relative changes over time within an individual, detecting major deviations from personal baselines, and motivating client engagement with their physiological data. They are not suitable for diagnostic purposes, absolute comparisons between individuals, or situations requiring clinical-grade precision.
Glossary
alpha blocking: the replacement of the alpha rhythm by low-amplitude desynchronized beta activity during movement, attention, mental effort like complex problem-solving, and visual processing.
alternating current (AC): an electric current that periodically reverses its direction.
ampere (A): a unit of electrical current or the flow rate of electrons through a conductor. One volt dropped across one ohm of resistance produces a current flow of one ampere.
artifact: false signals like 50/60Hz noise produced by line current.
atom: the basic unit of matter consisting of a central nucleus that contains protons and neutrons and orbiting electrons.
atomic number: the number of protons in the nucleus of an atom that defines an element.
atomic weight: approximately the number of protons and neutrons in the nucleus of an atom.
behavioral test (tracking test): a procedure to ensure that a biofeedback instrument accurately detects and displays subject performance.
bipolar recording: a recording method that uses two active electrodes and a shared reference.
closed circuit: a complete path that allows electrons to travel from the power source, through the conductor and resistance, and back to the source.
common mode rejection: an amplifier's ability to reject electrical noise that appears equally at both inputs while amplifying the biological signal that differs between inputs.
conductance (G): the ability of a material like copper or silver to carry an electric current. Conductance is measured in siemens (formerly mhos).
conductor: a material that readily allows electron movement like a copper wire.
consumer wearable: a device marketed to the general public, such as a smartwatch or fitness tracker, that uses optical or other sensors to estimate physiological parameters like heart rate and activity levels.
continuity test: a procedure to ensure that a circuit is closed, for example, that a cable is not broken.
coulomb (C): approximately 6.24 x 10¹⁸ or 6 billion billion electrons.
crosstalk: the contamination of an EMG recording by electrical activity from muscles other than the target muscle, occurring through volume conduction.
current (I): the movement of electrons through a conductor measured in amperes (A).
differential input impedance: the opposition to an AC signal entering a differential amplifier as it is dropped across a resistor network.
direct current (DC): an electric current that flows in only one direction, as in a flashlight.
dry electrode: electrode that does not require a conductive gel or paste.
electrode: specialized conductor that converts biological signals like the EEG into currents of electrons.
electromotive force (EMF): a difference in electrical potential that "pushes" electrons to move in a circuit.
electron: negatively charged particle that rotates around the nucleus at varying distances and participates in chemical reactions.
energy level: one of an electron's possible orbits around a nucleus at a constant distance.
epidermis: the outermost skin layer.
fiber optic cable: a thin, flexible cable that transmits digital signals as pulses of light with the advantages of high-speed data transmission, electrical isolation, and resistance to electromagnetic interference.
frequency (Hz): the number of complete cycles that an AC signal completes in a second, usually expressed in hertz.
ground fault interrupt circuit: a protective device that opens a circuit, shutting down power, when current leakage exceeds 5 mA.
IEC 60601: the international standard published by the International Electrotechnical Commission that specifies safety and essential performance requirements for medical electrical equipment, including biofeedback devices.
impedance (Z): complex opposition to an AC signal measured in Kohms.
impedance meter: device that uses an AC signal to measure impedance in an electric circuit, such as between active and reference electrodes.
impedance mismatch: a condition in which impedance values at different electrode sites differ significantly, potentially degrading signal quality by converting common-mode noise into differential signals.
insulator: material that resists the flow of electricity like glass and rubber.
interstitial fluid: fluid between cells through which biological signals travel via volume conduction.
ion: an atom or molecule with a positive or negative electrical charge.
leakage current: the small amount of electrical current that flows through insulation or along unintended paths in electrical equipment, even when the equipment is functioning properly.
mho: unit of conductance replaced by the siemen.
microsiemen (μS): the unit of conductance that is one-millionth of a siemen.
microvolt (μV): the unit of amplitude (signal strength) that is one-millionth of a volt.
milliampere (mA): the unit of electrical current that is one-thousandth of an ampere.
millivolt (mV): unit of amplitude (signal strength) that is one-thousandth of a volt.
monopolar recording: a recording method that uses one active and one reference electrode.
motion artifact: signal contamination caused by movement of electrodes, cables, or the subject during recording, which can distort or obscure valid biological signals.
motor unit: an alpha motor neuron and the skeletal muscle fibers it innervates.
multipin dry electrode: a type of dry electrode that uses multiple small pins or prongs to penetrate through hair and improve contact with the scalp surface.
nucleus: the central mass of an atom that contains protons and neutrons.
Ohm's law: voltage (E) = current (I) X resistance (R). The "amount" of current (I) flowing through a conductor is equal to the voltage (E) or "push" divided by the resistance (R).
open circuit: an incomplete path that prevents electron movement from the power source, through the conductor, and back to the source. For example, a broken sensor cable.
optical isolation: a device that converts a biological signal into a beam of light, the light crosses a gap (open circuit), and a photoreceptor reconverts the light into an electrical signal.
photoplethysmography (PPG): an optical technique that shines light into the skin and measures changes in light absorption as blood pulses through vessels, used in consumer wearables to estimate heart rate and heart rate variability.
power (W): the rate at which energy is transferred, proportional to current and voltage products. Power is measured in watts and picowatts (trillionths of a watt).
proton: positively charged subatomic particle found in the nucleus of an atom.
Quantitative EEG (qEEG): digitized statistical brain mapping using at least a 19-channel montage to measure EEG amplitude within specific frequency bins.
resistance (R): the opposition to a DC signal by a resistor measured in ohms.
resistor: the component in an electric circuit that resists current flow.
short circuit: an unintended connection between two points in a circuit that creates a low-resistance pathway, potentially causing excessive current flow and equipment damage or injury.
skin conductance level (SCL): a tonic measurement of how easily an AC or DC passes through the skin, expressed in microsiemens.
skin conductance response (SCR): a phasic, rapid change in skin conductance in response to a stimulus, reflecting sympathetic nervous system activation.
skin resistance level (SRL): a tonic (resting) measurement of the opposition to an AC or DC as it passes through the skin, expressed in Kohms.
superconductor: a material that conducts electricity without resistance.
ventricular fibrillation: a medical emergency in which the lower heart chambers contract in a rapid and unsynchronized fashion and cannot pump blood.
volt (V): the unit of electrical potential difference (electromotive force) that moves electrons in a circuit.
voltage (E): the amount of electrical potential difference (electromotive force).
voltohmmeter: a device that uses a DC signal to measure resistance in an electric circuit, such as between active and reference electrodes.
volume conduction: movement of biological signals through interstitial fluid.
watt (W): the unit of power used to express signal strength in the qEEG.
Test Yourself
Click on the ClassMarker logo to take 10-question tests over this unit without an exam password.

Review Flashcards on Quizlet
Click on the Quizlet logo to review our chapter flashcards.

Visit the BioSource Software Website
BioSource Software offers Human Physiology, which satisfies BCIA's Human Anatomy and Physiology requirement, and Biofeedback100, which provides extensive multiple-choice testing over BCIA's Biofeedback Blueprint.

Assignment
Now that you have completed this module, review how you check whether your electrode is intact and measure impedance with your own biofeedback equipment.
References
American Academy of Sleep Technology. (2021). AAST technical guideline: Standard polysomnography. https://aastweb.org/wp-content/uploads/2025/03/AAST-PSG-Guideline-Final.pdf
Andreassi, J. L. (2000). Psychophysiology: Human behavior and physiological response. Lawrence Erlbaum and Associates, Inc.
Basmajian, J. V. (Ed.). (1989). Biofeedback: Principles and practice for clinicians. Williams & Wilkins.
Bent, B., Goldstein, B. A., Kibbe, W. A., & Dunn, J. P. (2020). Investigating sources of inaccuracy in wearable optical heart rate sensors. NPJ Digital Medicine, 3, Article 18. https://doi.org/10.1038/s41746-020-0226-6
Böttcher, S., Bruno, E., Manyakov, N. V., Epitashvili, N., Claes, K., Glasstetter, M., Thorpe, S., Lees, S., Dümpelmann, M., van Laerhoven, K., Richardson, M. P., Brinkmann, B. H., Schulze-Bonhage, A., & Baud, M. O. (2022). Data quality evaluation in wearable monitoring. Scientific Reports, 12, Article 21412. https://doi.org/10.1038/s41598-022-25949-x
Cacioppo, J. T., & Tassinary, L. G. (Eds.). (1990). Principles of psychophysiology. Cambridge University Press.
Chowdhury, R. H., Reaz, M. B. I., Ali, M. A. B. M., Bakar, A. A. A., Chellappan, K., & Chang, T. G. (2023). Reducing noise, artifacts and interference in single-channel EMG signals: A review. Sensors, 23(6), Article 2927. https://doi.org/10.3390/s23062927
Colvonen, P. J. (2021). Response to: Investigating sources of inaccuracy in wearable optical heart rate sensors. NPJ Digital Medicine, 4, Article 38. https://doi.org/10.1038/s41746-021-00408-5
Ehrhardt, N., Niehoff, M., Oßwald, S., Antonenko, D., Lucchese, G., & Fleischmann, R. (2024). Comparison of dry and wet electroencephalography for the assessment of cognitive evoked potentials and sensor-level connectivity. Frontiers in Human Neuroscience, 18, Article 1497763. https://doi.org/10.3389/fnhum.2024.1497763
Ferree, T. C., Luu, P., Russell, G. S., & Tucker, D. M. (2001). Scalp electrode impedance, infection risk, and EEG data quality. Clinical Neurophysiology, 112(3), 536-544. https://doi.org/10.1016/S1388-2457(00)00533-2
Fiedler, P., Graichen, U., Zimmer, C., & Haueisen, J. (2022). A high-density 256-channel cap for dry electroencephalography. Human Brain Mapping, 43(4), 1227-1240. https://doi.org/10.1002/hbm.25721
Floyd, T. L. (1987). Electronics fundamentals: Circuits, devices, and applications. Merrill Publishing Company.
Grant, A. (2015). Four elements earn permanent seats on the periodic table. Science News.
Halford, J. J., Sabau, D., Drislane, F. W., Tsuchida, T. N., & Sinha, S. R. (2016). American Clinical Neurophysiology Society guideline 4: Recording clinical EEG on digital media. Journal of Clinical Neurophysiology, 33(4), 317-319. https://doi.org/10.1097/WNP.0000000000000270
Kleeva, D., Ninenko, I., & Lebedev, M. A. (2024). Resting-state EEG recorded with gel-based vs. consumer dry electrodes: Spectral characteristics and across-device correlations. Frontiers in Neuroscience, 18, Article 1326139. https://doi.org/10.3389/fnins.2024.1326139
Kubala, T. (2009). Electricity 1: Devices, circuits, and materials (9th ed.). Cengage Learning.
Lehrer, P., Kaur, K., Sharma, A., Shah, K., Huseby, R., Bhavsar, J., Sgobba, P., & Zhang, Y. (2020). Heart rate variability biofeedback improves emotional and physical health and performance: A systematic review and meta analysis. Applied Psychophysiology and Biofeedback, 45(3), 109-129. https://doi.org/10.1007/s10484-020-09466-z
Lee, I., Park, N., Lee, H., Hwang, C., Kim, J. H., & Park, S. (2020). Motion artifact reduction in wearable photoplethysmography based on multi-channel sensors with multiple wavelengths. Sensors, 20(5), Article 1493. https://doi.org/10.3390/s20051493
Liu, Q., Yang, L., Zhang, Z., Yang, H., Zhang, Y., & Wu, J. (2023). The feature, performance, and prospect of advanced electrodes for electroencephalogram. Biosensors, 13(1), Article 101. https://doi.org/10.3390/bios13010101
Miller, D. J., Lastella, M., Scanlan, A. T., Bellenger, C., Halson, S. L., Roach, G. D., & Sargent, C. (2022). A validation study of the WHOOP strap against polysomnography to assess sleep. Journal of Sports Sciences, 40(22), 2571-2578. https://doi.org/10.1080/02640414.2022.2163703
Montgomery, D. (2004). Introduction to biofeedback. Module 3: Psychophysiological recording. Association for Applied Psychophysiology and Biofeedback.
Murphy, B. B., Scheid, B. H., Hendricks, Q., Apollo, N. V., Litt, B., & Vitale, F. (2021). Time evolution of the skin-electrode interface impedance under different skin treatments. Sensors, 21(15), Article 5210. https://doi.org/10.3390/s21155210
Nilsson, J. W., & Riedel, S. A. (2008). Electric circuits (8th ed.). Pearson Prentice-Hall.
Peek, C. J. (2016). A primer of traditional biofeedback instrumentation. In M. S. Schwartz & F. Andrasik (Eds.), Biofeedback: A practitioner's guide (4th ed.). The Guilford Press.
Quigley, K. S., Gianaros, P. J., Norman, G. J., Jennings, J. R., Berntson, G. G., & de Geus, E. J. C. (2024). Publication guidelines for human heart rate and heart rate variability studies in psychophysiology—Part 1: Physiological underpinnings and foundations of measurement. Psychophysiology, 61(9), Article e14604. https://doi.org/10.1111/psyp.14604
Schach, S., Rings, T., Bregulla, L., Witt, J.-A., Bröhl, T., Surges, R., von Wrede, R., Lehnertz, K., & Helmstaedter, C. (2022). Electrodermal activity biofeedback alters evolving functional brain networks in people with epilepsy, but in a non-specific manner. Frontiers in Neuroscience, 16, Article 828283. https://doi.org/10.3389/fnins.2022.828283
Sinichi, M., Gevonden, M. J., & Krabbendam, L. (2025). Quality in question: Assessing the accuracy of four heart rate wearables and the implications for psychophysiological research. Psychophysiology, 62(2), Article e14745. https://doi.org/10.1111/psyp.14745
Stern, R. M., Ray, W. J., & Quigley, K. S. (2001). Psychophysiological recording (2nd ed.). Oxford University Press.
Tenan, M. S., Brothers, R. M., Tweedell, A. J., Hackney, A. C., & Griffin, L. (2024). Wearable photoplethysmographic sensors differ from electrocardiography for heart rate variability. Sports Medicine, 54(11), 2907-2926. https://doi.org/10.1007/s40279-024-02077-2