EEG Hardware
What You Will Learn
Have you ever wondered how clinicians can "read" the electrical conversations happening inside your brain? In this unit, you will discover the fascinating technology that makes neurofeedback possible. You will learn how electrodes detect the brain's tiny electrical signals (measured in millionths of a volt), how the International 10-20 System ensures clinicians worldwide speak the same language when placing electrodes, and why a device called a differential amplifier is essential for separating genuine brain activity from unwanted noise.
Along the way, you will explore common artifacts that can masquerade as brain activity, from eye blinks to muscle tension to powerline interference, and learn practical strategies to recognize and minimize them. By the end of this unit, you will understand the complete journey from neuronal firing to feedback display, giving you the foundation to conduct accurate EEG assessments and effective neurofeedback training.
BCIA Blueprint Coverage
Although BCIA addresses the anatomy and physiology of the EEG in its Neurofeedback Blueprint, we include this important topic to provide a comprehensive introduction to the field.
This unit covers electrodes, the electroencephalograph, EEG filters that define the EEG signal, the International 10-20 System, the Modified Combinatorial Nomenclature, 10-20 System electrode placement, site preparation, elimination of artifact from EEG recording, recognizing normal EEG patterns, EEG displays, and drug effects on the EEG.
Clinicians monitor EEG activity using the classical International 10-20 System for standardized electrode placement or the modified "10-10" system known as the Modified Combinatorial Nomenclature System. They often record from several sites and measure the amplitude of EEG signals within frequency bands (like alpha and theta) to provide a complete picture of brain activity. Software-based montage reformatting allows clinicians to reanalyze session data by referencing an electrode to other sites or combinations of sites. This system also allows for the computation of multiple variables associated with communication and network functions within the central nervous system (CNS).
The Quantitative EEG (qEEG) measures EEG amplitudes within selected frequency bands. A full-cap 21-channel EEG recording (19 scalp sensors plus two "reference" sensors) and resulting qEEG analysis may be valuable in designing treatment protocols for complicated cases like Asperger syndrome or traumatic brain injury. EEG topography displays the qEEG on a cortical surface map to show the spatial distribution of EEG activity.
Contamination of the EEG by physiological and exogenous artifacts requires that clinicians take extensive precautions, examine the raw EEG record, and remove contaminated epochs through artifacting. Impedance tests and behavioral tests help ensure the fidelity of EEG recording.
Finally, clinicians interpret EEG recordings with an understanding of typical values. They recognize the effects of eye closure, age, diurnal influences, alertness and drowsiness, medication, and relaxation on these readings.
How Electrodes Detect Brain Signals
Your brain is constantly buzzing with electrical activity, but those signals are incredibly faint, measured in millionths of a volt. How do we capture something so small? The answer lies in specialized sensors called electrodes.
Electrode Basics
Electrodes are transducers, devices that convert one form of energy into another. In this case, they transform the ionic currents flowing through your scalp into electrical signals that equipment can amplify and display. Think of electrodes as translators between the chemical language of your neurons and the electrical language of computers.
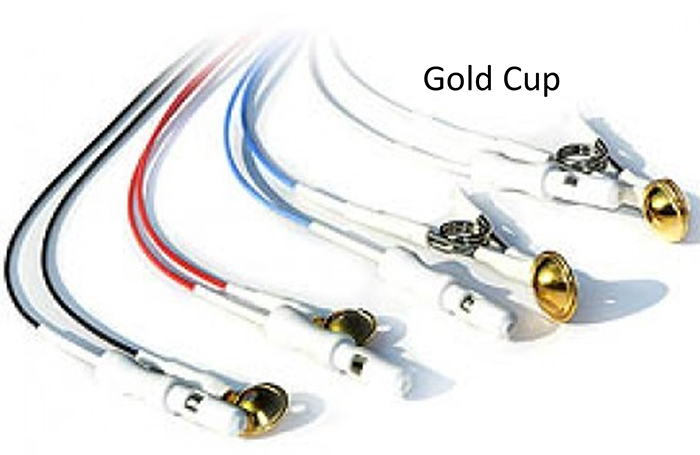
EEG electrodes come in several varieties. Gold and silver electrodes are common choices because they conduct electricity well and resist corrosion. Silver/silver-chloride electrodes are particularly valued because they remain stable during recording and work well for capturing very slow brain rhythms. Most electrodes are small cups or discs that attach to the scalp with conductive gel or paste.
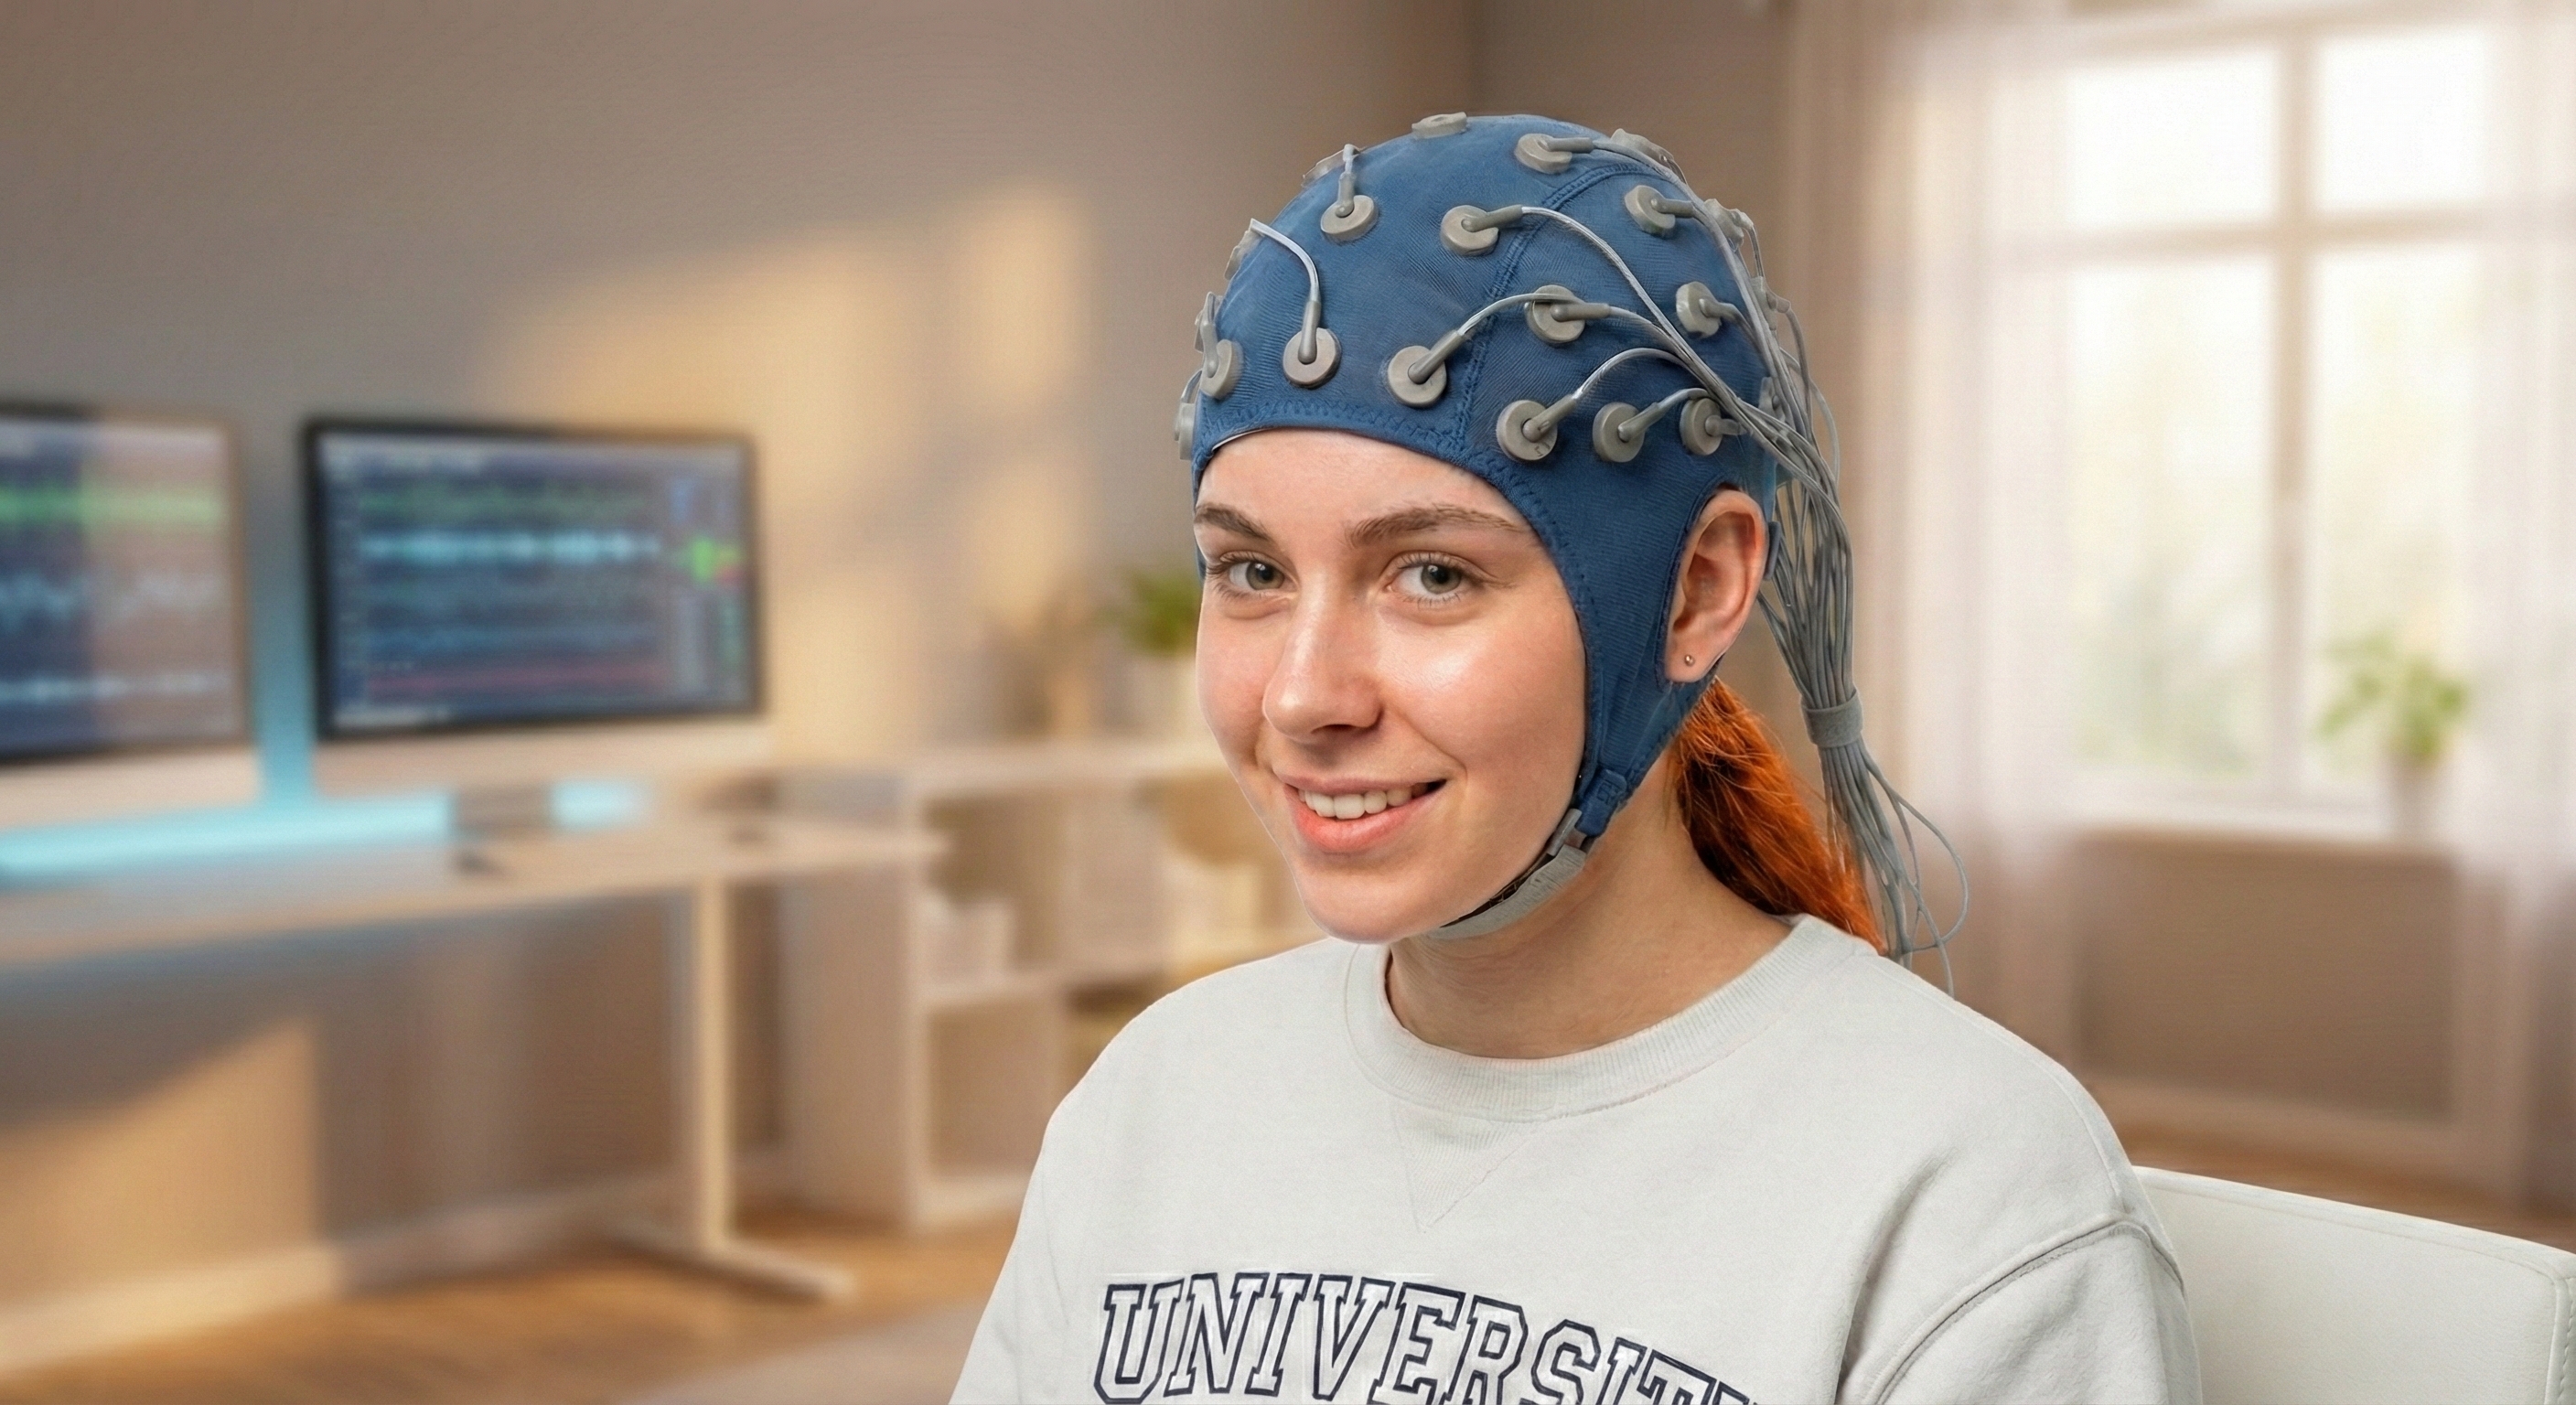
For recording from many sites at once, clinicians often use electrode caps. These look like swim caps with electrodes already sewn into position at standardized locations. Caps dramatically speed up setup time since you do not have to measure and place each electrode individually.
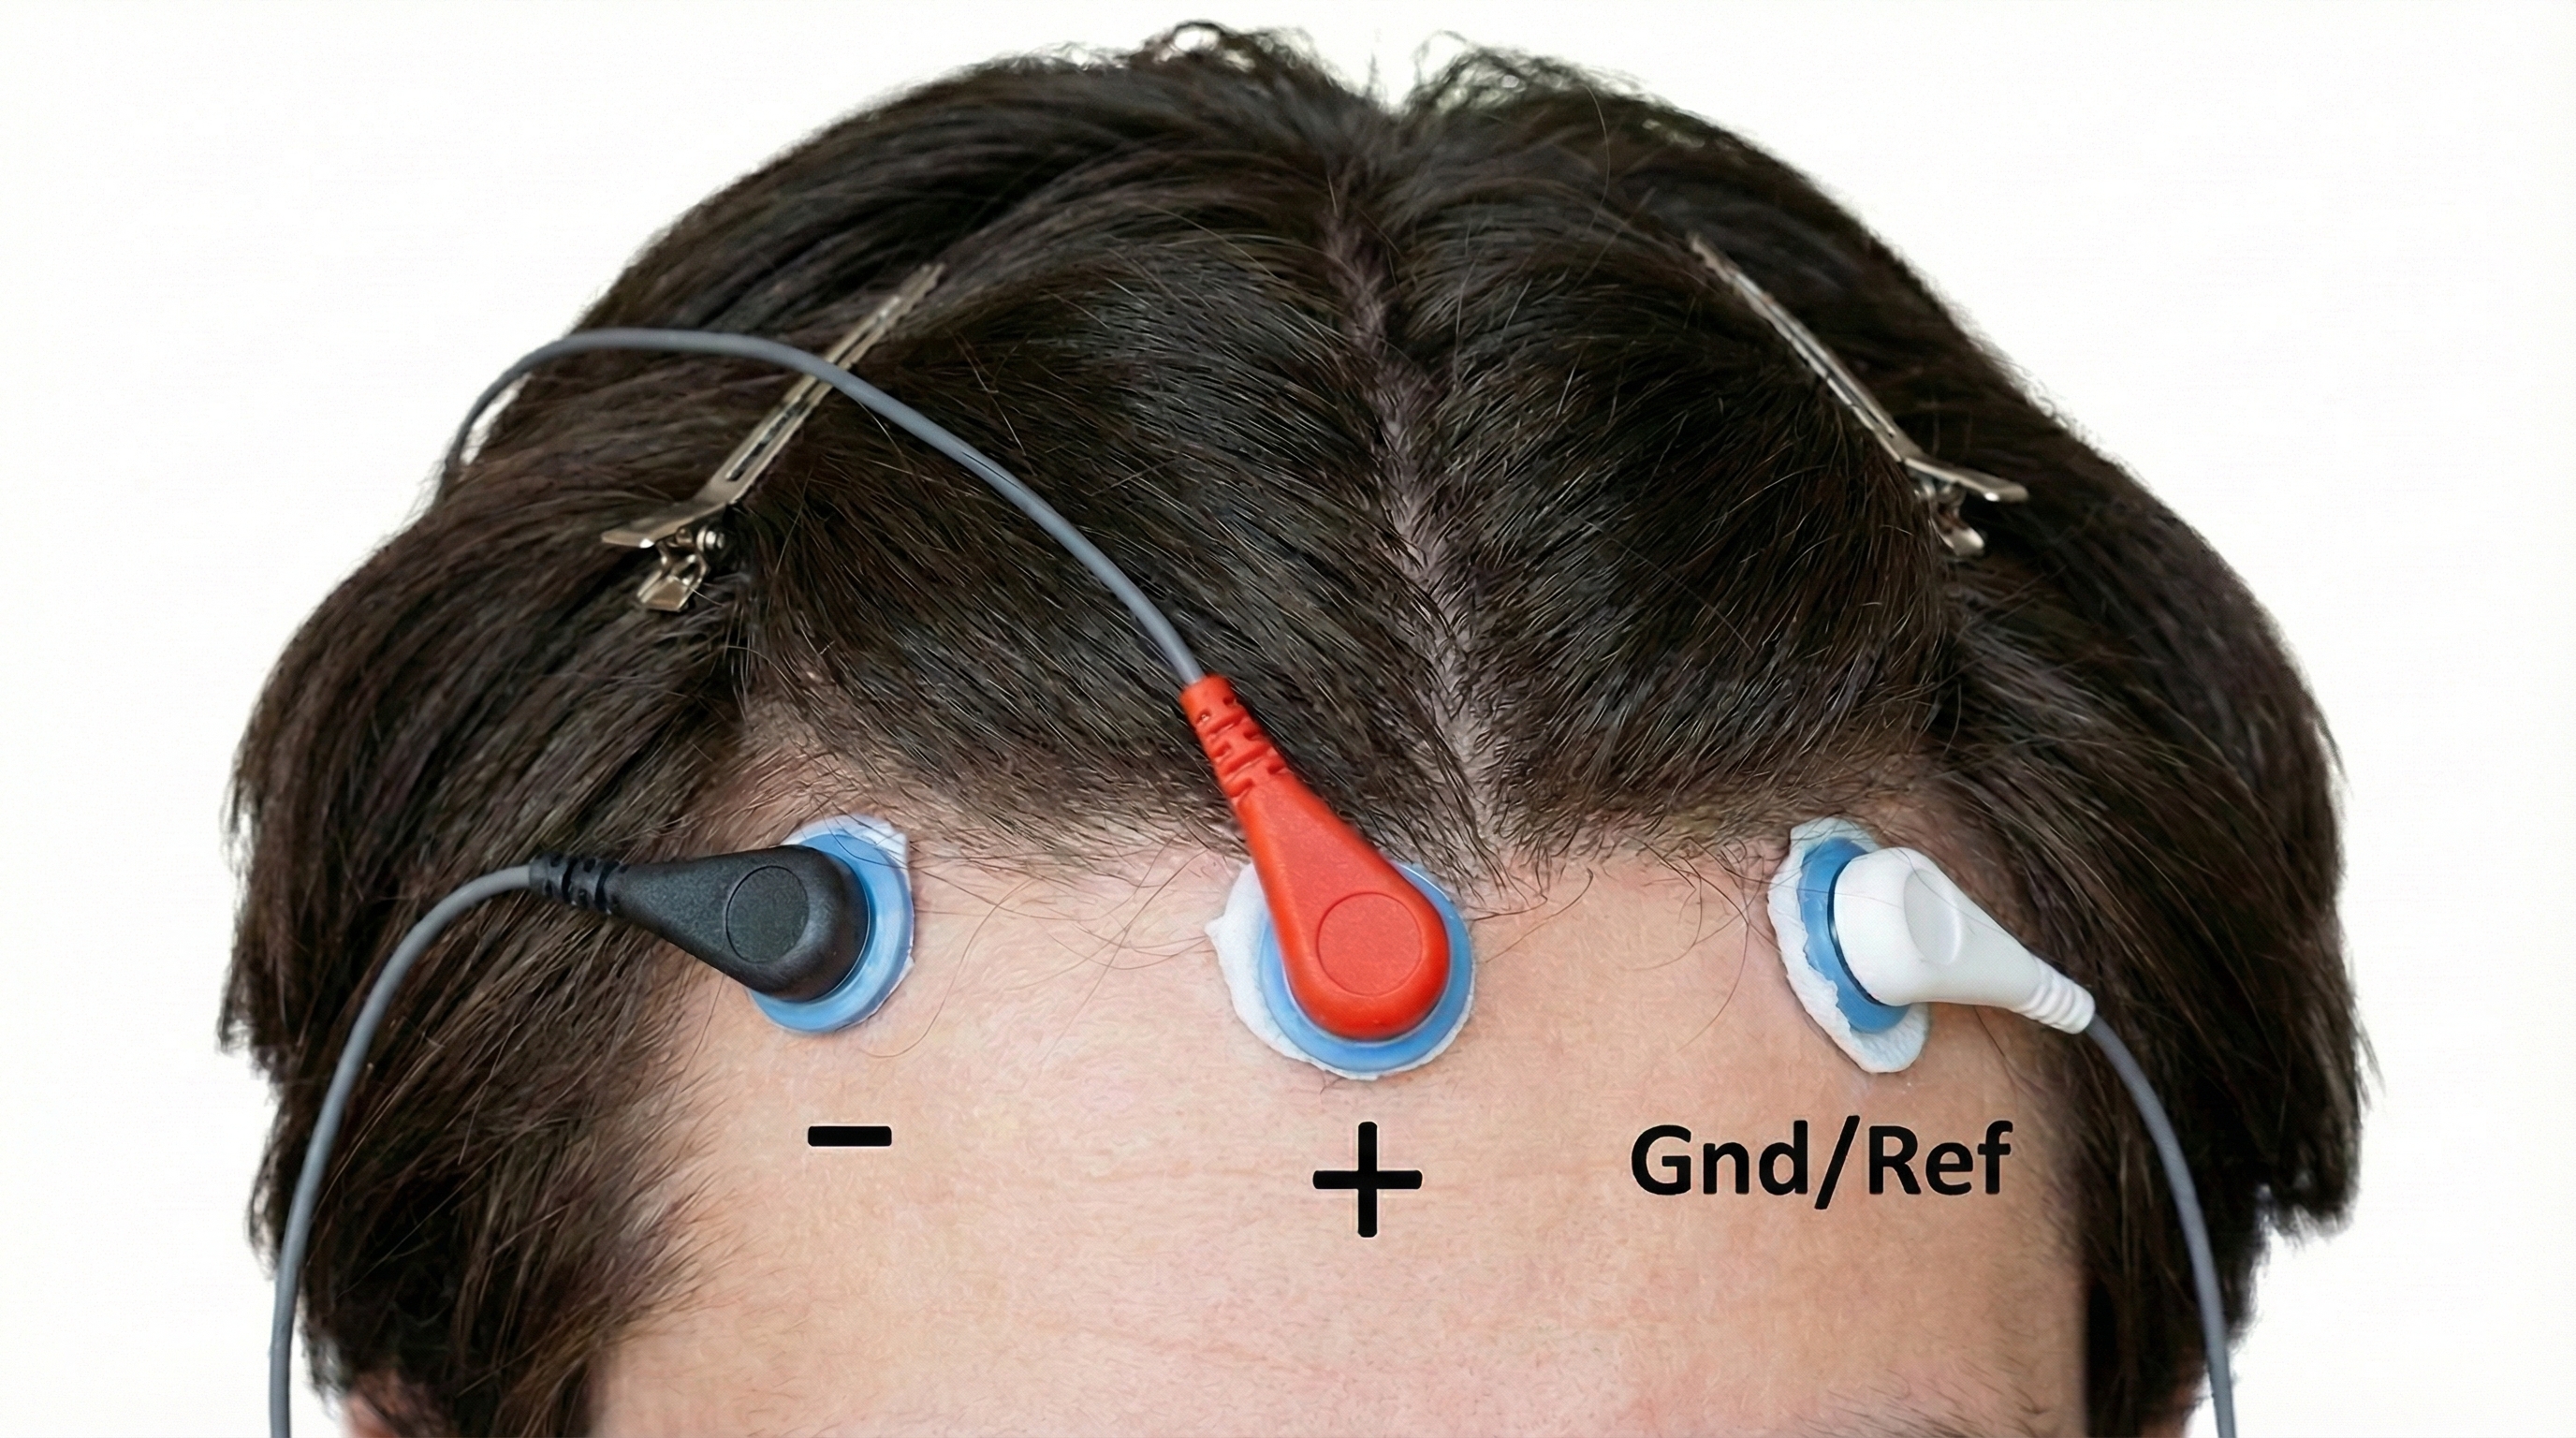
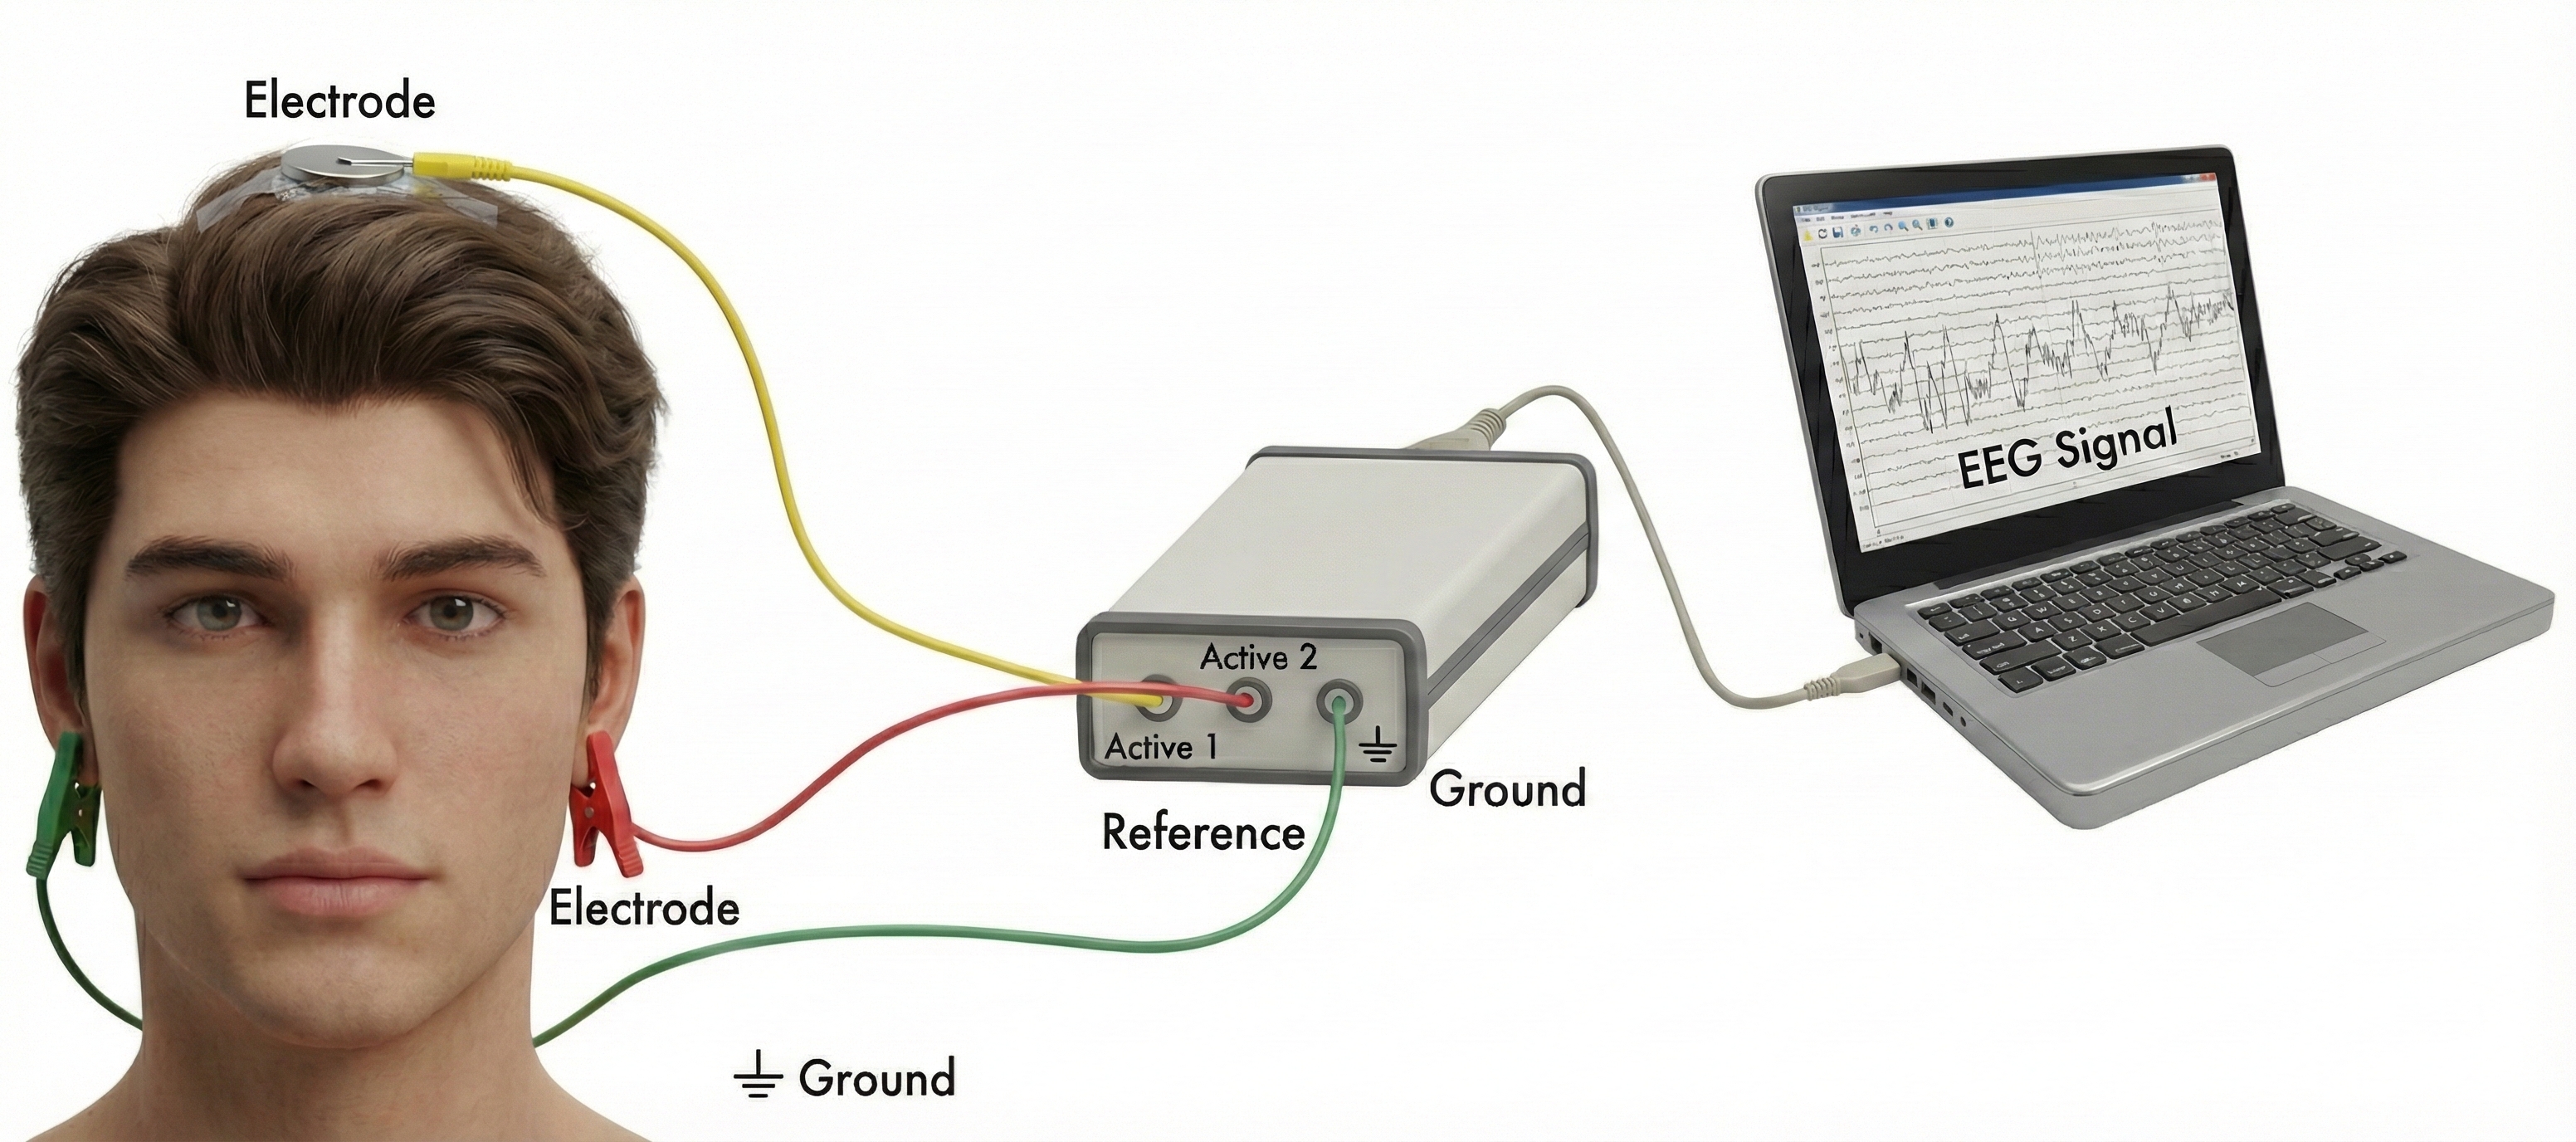
The Three-Electrode System: Active, Reference, and Ground
Here is something that surprises many students: you cannot measure voltage at a single point. Voltage is always the difference between two locations, like measuring the height of a hill by comparing the top to the bottom. This is why EEG recording requires at least three electrodes working together.
The active electrode sits over the brain region you want to monitor. If you are interested in activity over the motor cortex, for example, you would place your active electrode at the top of the head. This electrode picks up the brain signals you care about, but it also picks up noise from powerlines, muscle activity, and other sources.
The reference electrode provides the comparison point for measuring voltage. It is typically placed somewhere relatively quiet electrically, like an earlobe or the mastoid bone behind the ear. The electroencephalograph compares the signal at the active site to the signal at the reference site and amplifies the difference.
The ground electrode provides a common baseline for the entire system and helps eliminate noise that affects all electrodes equally. It connects to the amplifier's ground circuit and is usually placed on the scalp, earlobe, or mastoid (Demos, 2019).
One Channel or Nineteen? The Power of Multi-Channel Recording
Imagine trying to understand a symphony by listening through a single microphone in the corner of the concert hall. You would hear something, but you would miss the spatial richness of different instrument sections. Single-channel EEG recording faces a similar limitation.
A single-channel recording uses one active electrode and tells you what is happening at one scalp location. This approach is simple, affordable, and sufficient for basic neurofeedback training protocols. Many successful clinicians have built their practices around single-channel work.
However, 19-channel qEEG recording captures brain activity from across the entire scalp simultaneously. Peer-reviewed evidence suggests that more EEG channels provide a more accurate assessment and achieve superior clinical or performance outcomes compared with fewer channels (Lau et al., 2012). This comprehensive approach offers several advantages. First, it reveals the spatial distribution of activity, showing whether elevated theta is localized to one region or spread across the brain. Second, it allows calculation of coherence and phase metrics that measure how well different brain regions communicate with each other. Third, clinicians can compare recordings to normative databases to identify patterns that deviate from typical brain function.
For complex cases involving traumatic brain injury, autism spectrum disorders, or epilepsy, multi-channel assessment often reveals patterns that single-channel recording would miss entirely (Thompson & Thompson, 2015). The tradeoff is increased cost, longer setup time, and more complex data analysis.
Clinical Application: When More Channels Matter
Marcus, a 12-year-old with attention difficulties following a concussion, came to neurofeedback clinician Sarah for assessment. A single-channel recording at Cz showed mildly elevated theta, suggesting a straightforward protocol. However, Sarah decided to conduct a 19-channel qEEG first. The comprehensive assessment revealed something the single channel missed: poor coherence between Marcus's frontal and parietal regions, suggesting disrupted communication networks from the injury. This finding completely changed the treatment approach, leading Sarah to use a connectivity-focused protocol that produced much better outcomes than a simple theta-reduction approach would have.
Key Takeaways: Electrodes and Recording
Electrodes are transducers that convert the brain's ionic currents into electrical signals. Recording requires three electrodes: the active electrode over the site of interest, a reference electrode for comparison, and a ground electrode to eliminate common noise. Single-channel recording is simple and effective for basic protocols, while 19-channel qEEG provides spatial detail and connectivity metrics valuable for complex cases.
Comprehension Questions
- Why do you need at least two electrodes to measure voltage?
- What is the role of the ground electrode in EEG recording?
- What additional information does 19-channel qEEG provide that single-channel recording cannot?
The Electroencephalograph: Making Sense of Brain Signals
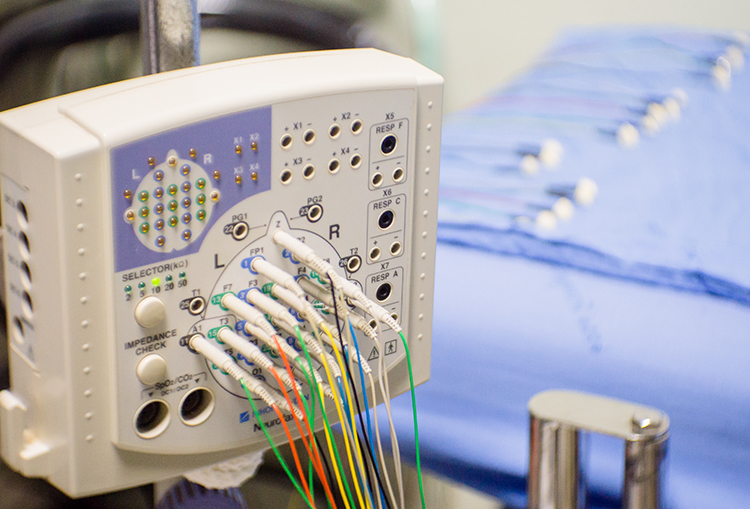
Raw brain signals are far too weak to display directly. They need to be amplified, organized, and broken down into meaningful components. The electroencephalograph handles all of this, transforming faint scalp voltages into the colorful displays clinicians use for assessment and training.
EEG Channels
An EEG channel represents the electrical signal recorded from a specific electrode site or combination of electrode sites on the scalp. The number of channels used in clinical and research applications varies considerably depending on the purpose of the recording. Standard clinical EEG typically employs 19 to 21 channels based on the International 10-20 System (Jasper, 1958), while high-density research arrays may utilize 64, 128, or even 256 channels to achieve finer spatial resolution (Luck, 2014).
Each channel captures voltage fluctuations over time, reflecting the summed postsynaptic potentials of large populations of cortical pyramidal neurons oriented perpendicular to the scalp surface (Niedermeyer & da Silva, 2005). The choice of channel count involves a trade-off between spatial resolution and practical considerations such as setup time, computational demands, and the clinical question being addressed.
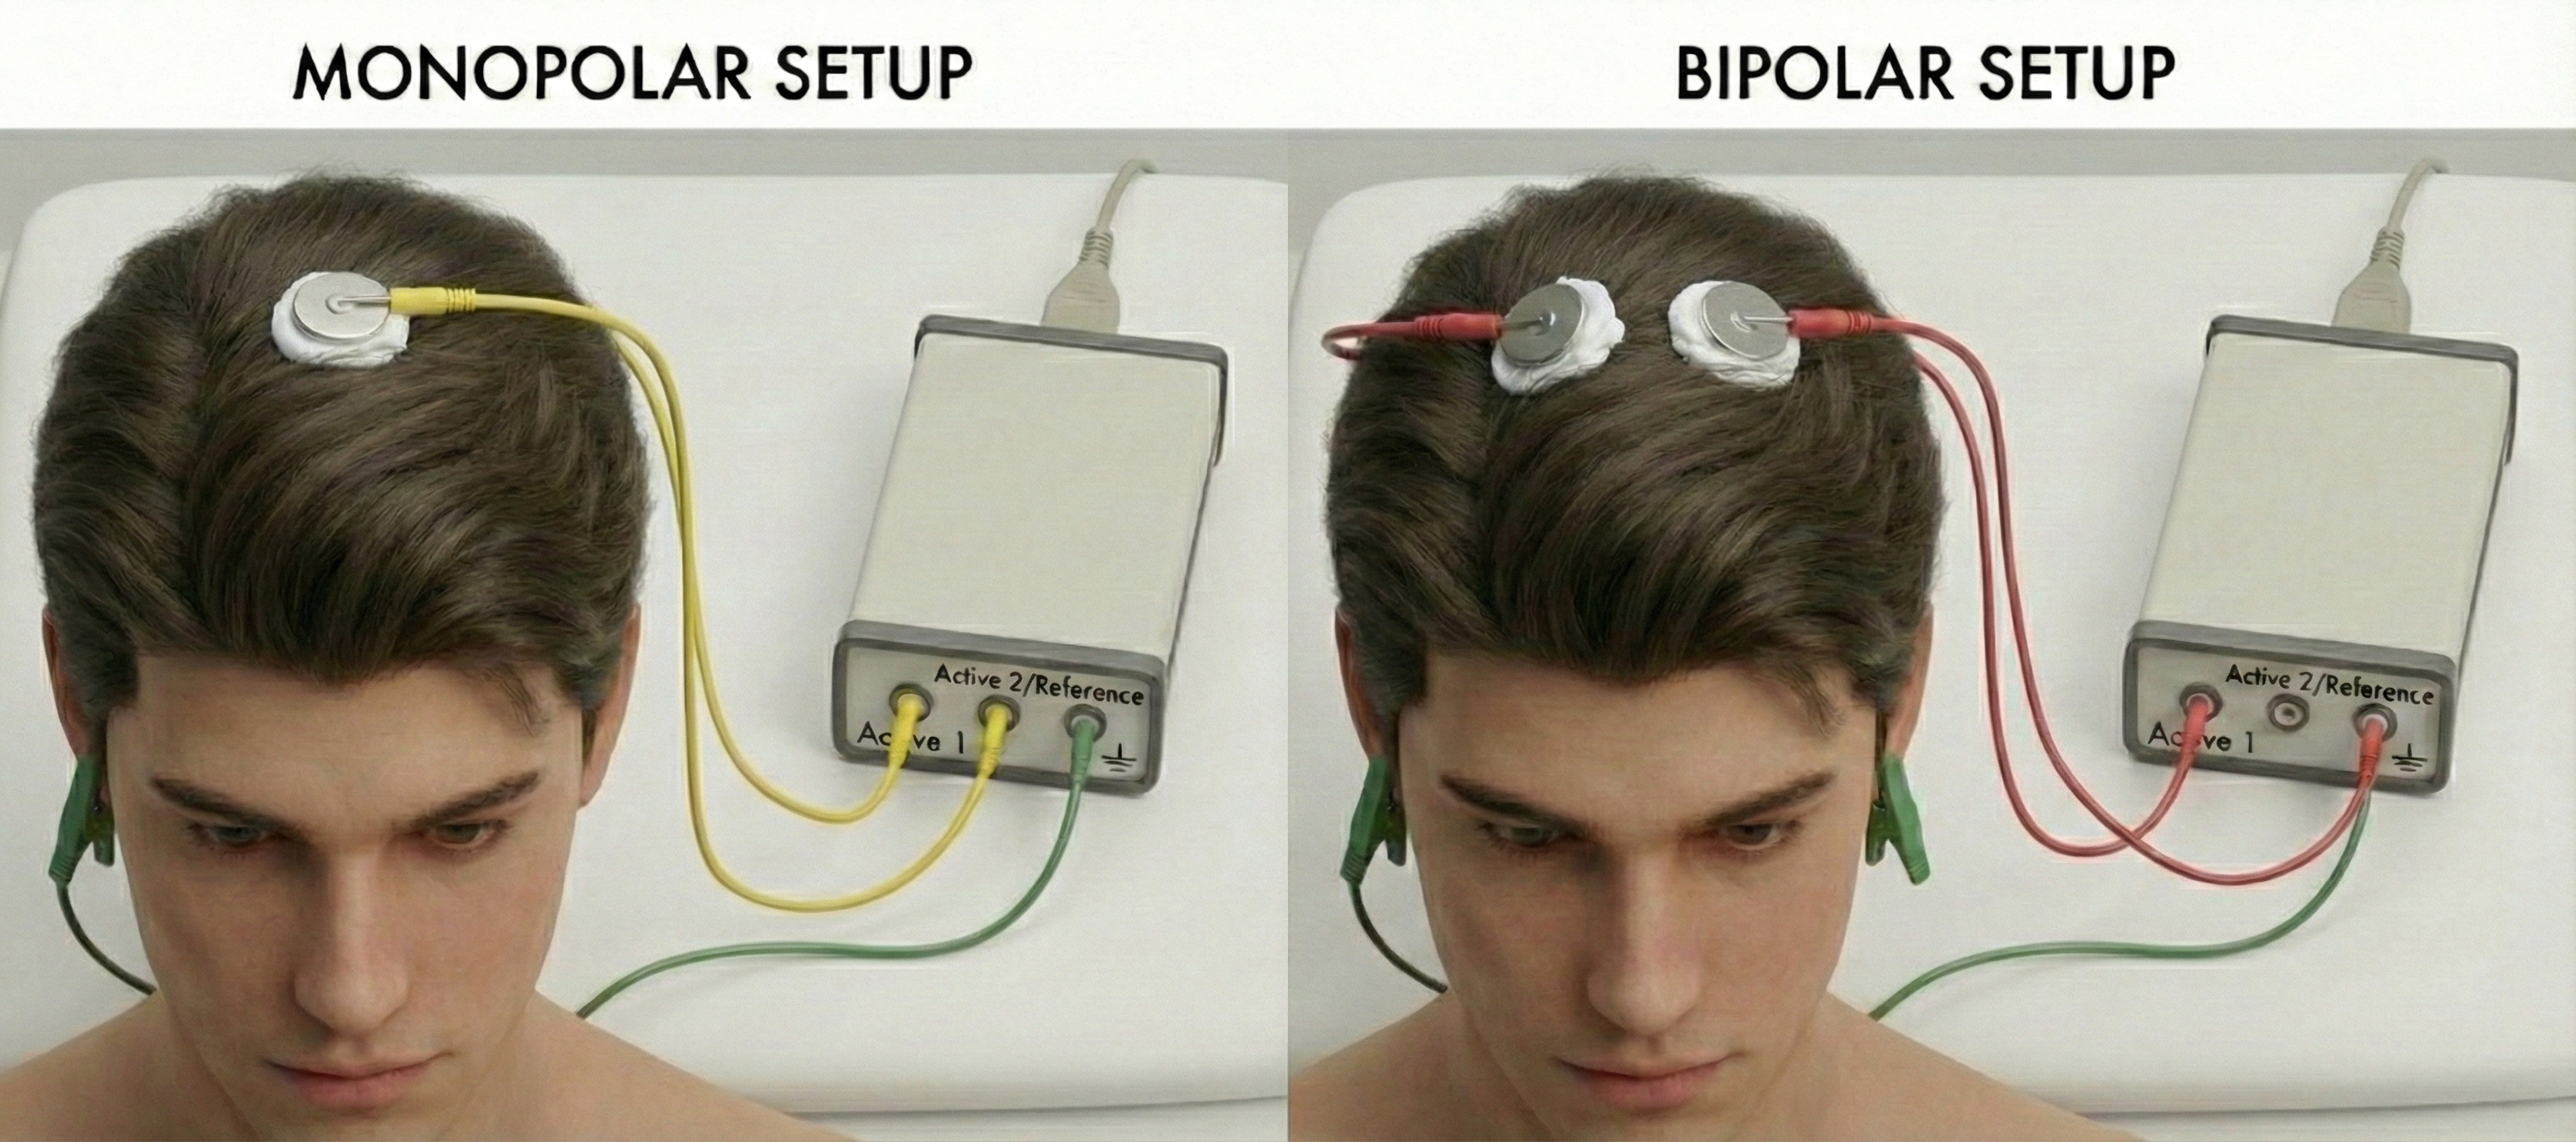
Monopolar vs. Bipolar Recording
Monopolar recording (also called referential recording) measures the voltage difference between an active electrode placed over a region of interest and a reference electrode positioned at a site assumed to be electrically neutral or distant from brain activity, such as the earlobes, mastoids, or linked ears (Teplan, 2002). This arrangement captures the absolute activity at each electrode site relative to a common reference, making it useful for identifying the location and amplitude of focal brain activity. However, monopolar recording is susceptible to contamination if the reference site is not truly inactive, and common artifacts can appear across all channels.
In contrast, bipolar recording measures the voltage difference between two adjacent active electrodes, both positioned over the scalp. This approach effectively cancels out activity that is common to both electrodes (such as distant artifacts or widespread potentials) and emphasizes localized electrical gradients between the two sites (Fisch, 1999). Bipolar montages excel at localizing focal abnormalities and reducing artifact contamination, but they may attenuate broadly distributed activity and can produce phase reversals that require careful interpretation. Clinicians often use both approaches complementarily, switching between montages to clarify ambiguous findings.
Montages: Different Perspectives on the Same Brain
A montage is simply the arrangement of electrode pairings you use for recording (Thomas, 2007). Think of it like choosing camera angles for filming a scene. Different angles reveal different aspects of the action, and no single angle captures everything.
The most common montage types each have their strengths. A referential montage compares each scalp electrode to the same reference point (like an earlobe), making it easy to see the absolute activity level at each site. A bipolar montage compares adjacent scalp electrodes to each other, which is excellent for pinpointing exactly where abnormal activity originates. An average reference montage compares each electrode to the average of all other electrodes, providing a balanced view that minimizes the influence of any single noisy site.
Modern software allows clinicians to switch between montages after recording, reanalyzing the same data from different perspectives. This flexibility means you do not have to decide in advance which view will be most informative.
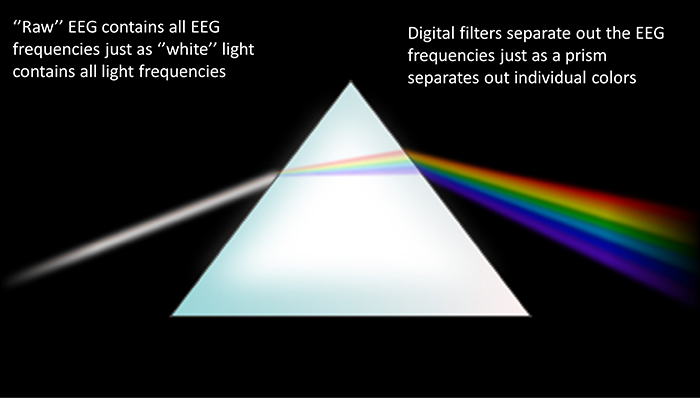
Frequency Bands: The Brain's Different Rhythms
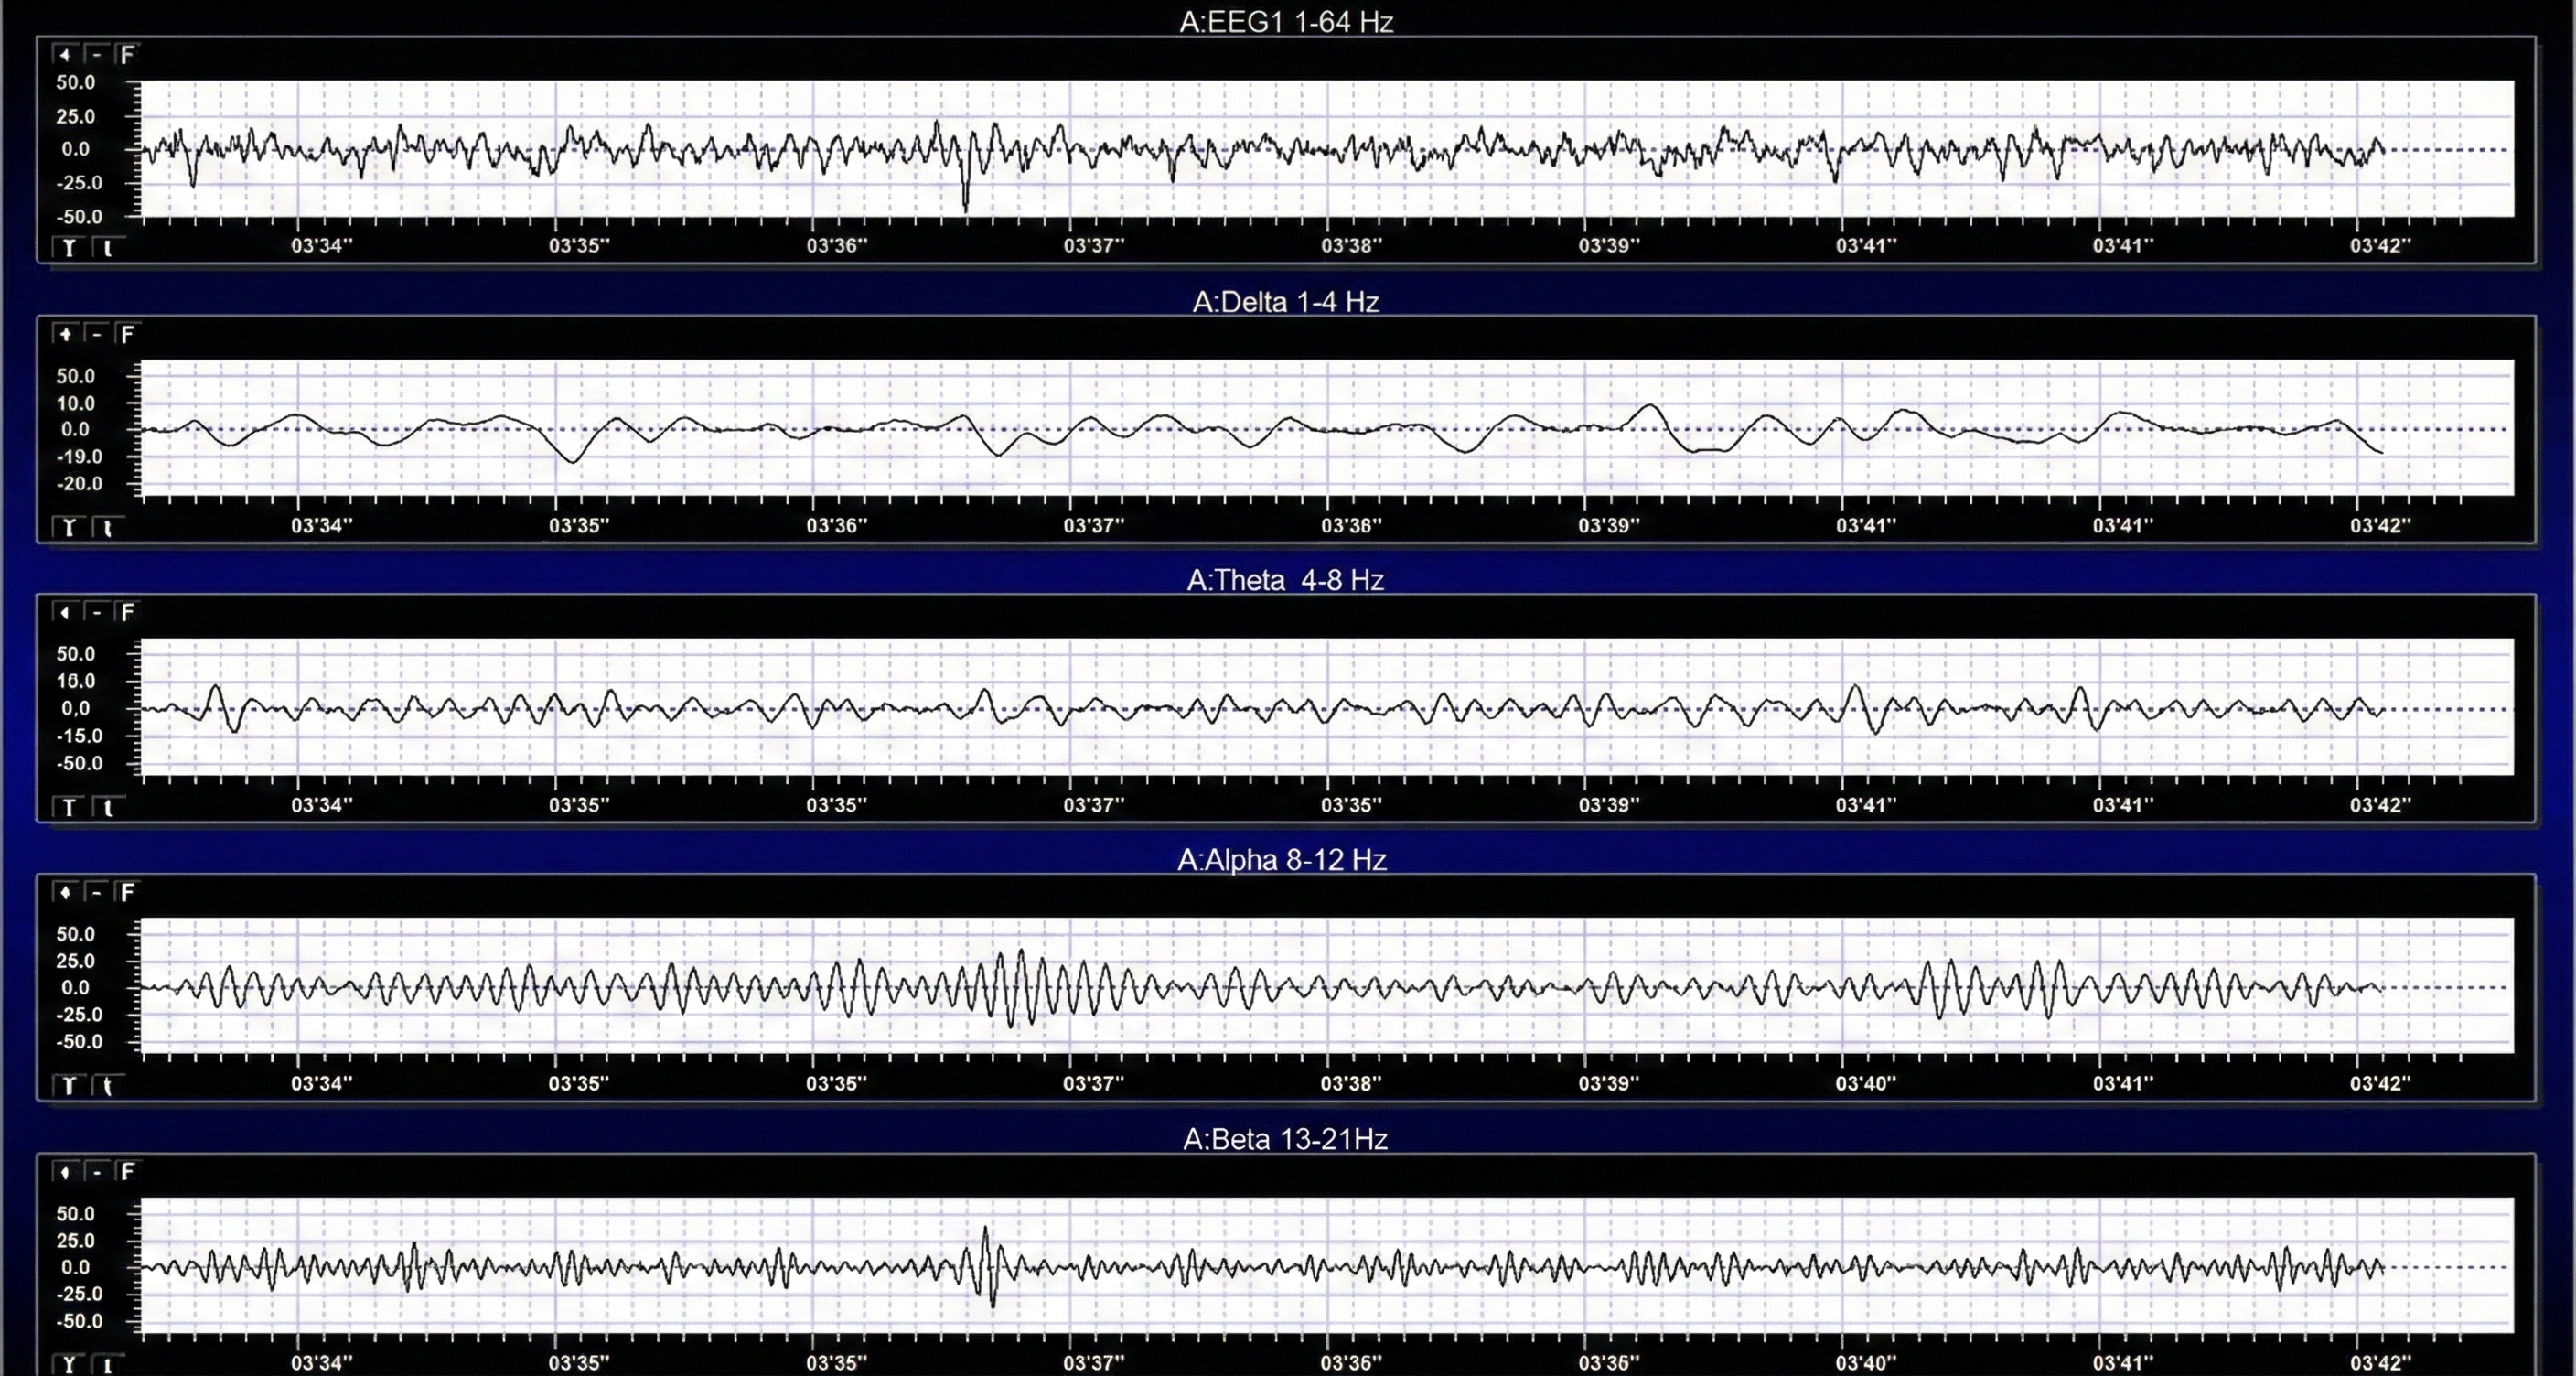
Your brain does not produce a single tone. It generates a complex symphony of rhythms at different frequencies, each associated with different mental states. The electroencephalograph separates these rhythms the way a prism separates white light into its component colors.
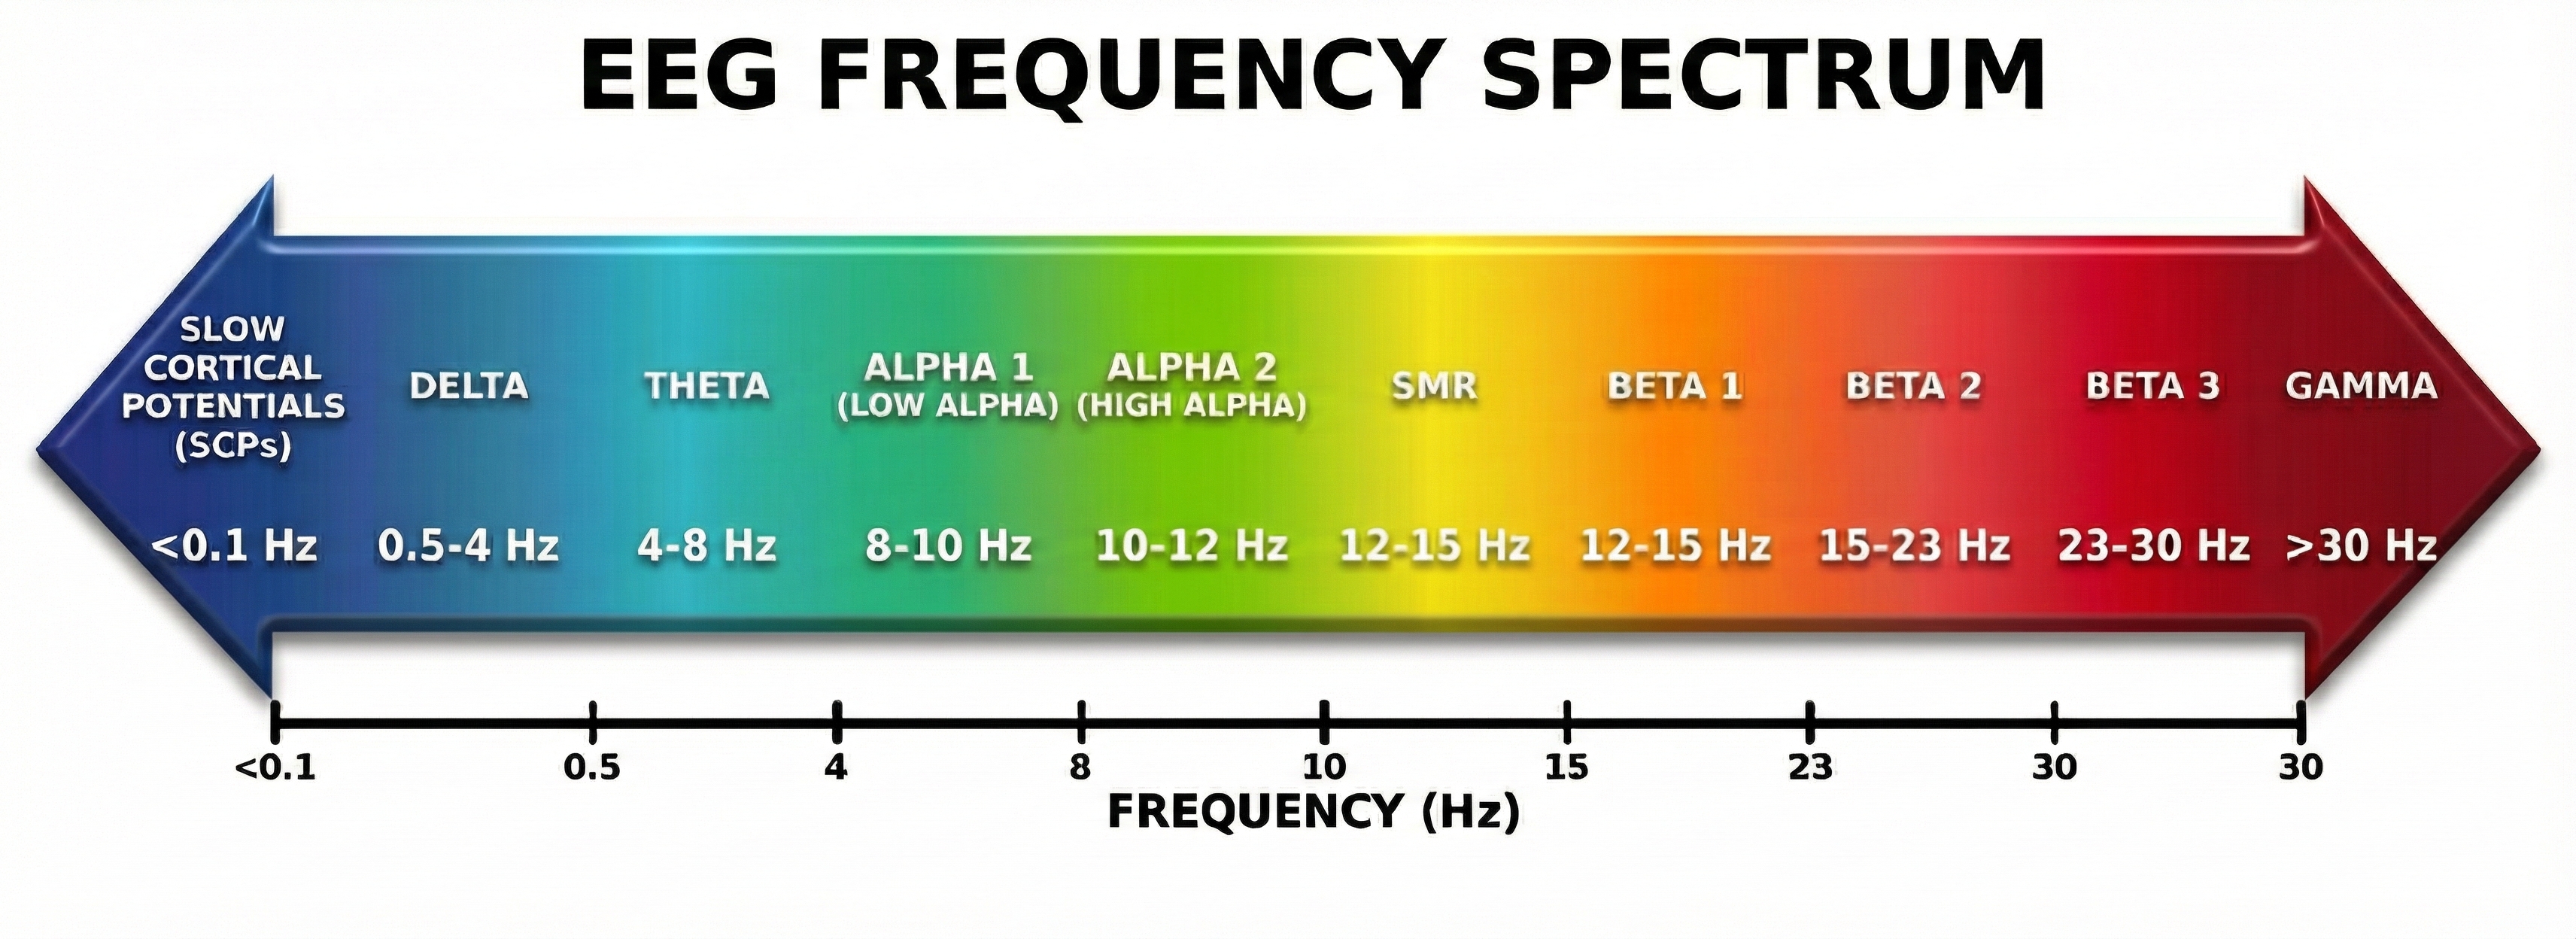
Delta waves (0.5-4 Hz) are the slowest rhythms, dominant during deep sleep. Excessive delta during waking hours may indicate brain injury or dysfunction.
Theta waves (4-8 Hz) appear during drowsiness, light sleep, and internally-focused states like daydreaming or meditation. Elevated theta during tasks requiring attention is a hallmark of ADHD.
Alpha waves (8-12 Hz) are the brain's "idle" rhythm, prominent when you are relaxed with your eyes closed but not actively processing information. Alpha blocks (decreases) when you open your eyes or engage in mental effort.
Beta waves (12-30 Hz) dominate during active thinking, problem-solving, and focused attention. Different sub-ranges of beta are associated with calm focus versus anxiety and overthinking.
Gamma waves (30+ Hz) are the fastest rhythms, linked to higher cognitive functions, perception, and consciousness. They are harder to record because muscle artifact often contaminates this range.
Measuring Amplitude: How Strong Is the Signal?
Frequency tells you how fast the brain waves oscillate, but amplitude tells you how strong they are. EEG amplitude is measured in microvolts (µV), millionths of a volt, because brain signals are incredibly small.
There are several ways to express amplitude, and knowing which method was used matters when comparing values across studies or equipment.
The peak-to-peak method measures the total distance from the lowest valley to the highest peak of a wave. This gives the largest number and represents the full range of the oscillation.
The peak amplitude is simply half the peak-to-peak value, measuring from the baseline to either the peak or the valley.
The root mean square (RMS) provides a kind of average that accounts for the wave's shape. RMS equals about 0.707 times the peak value. Many biofeedback systems report RMS because it represents the signal's overall energy content.
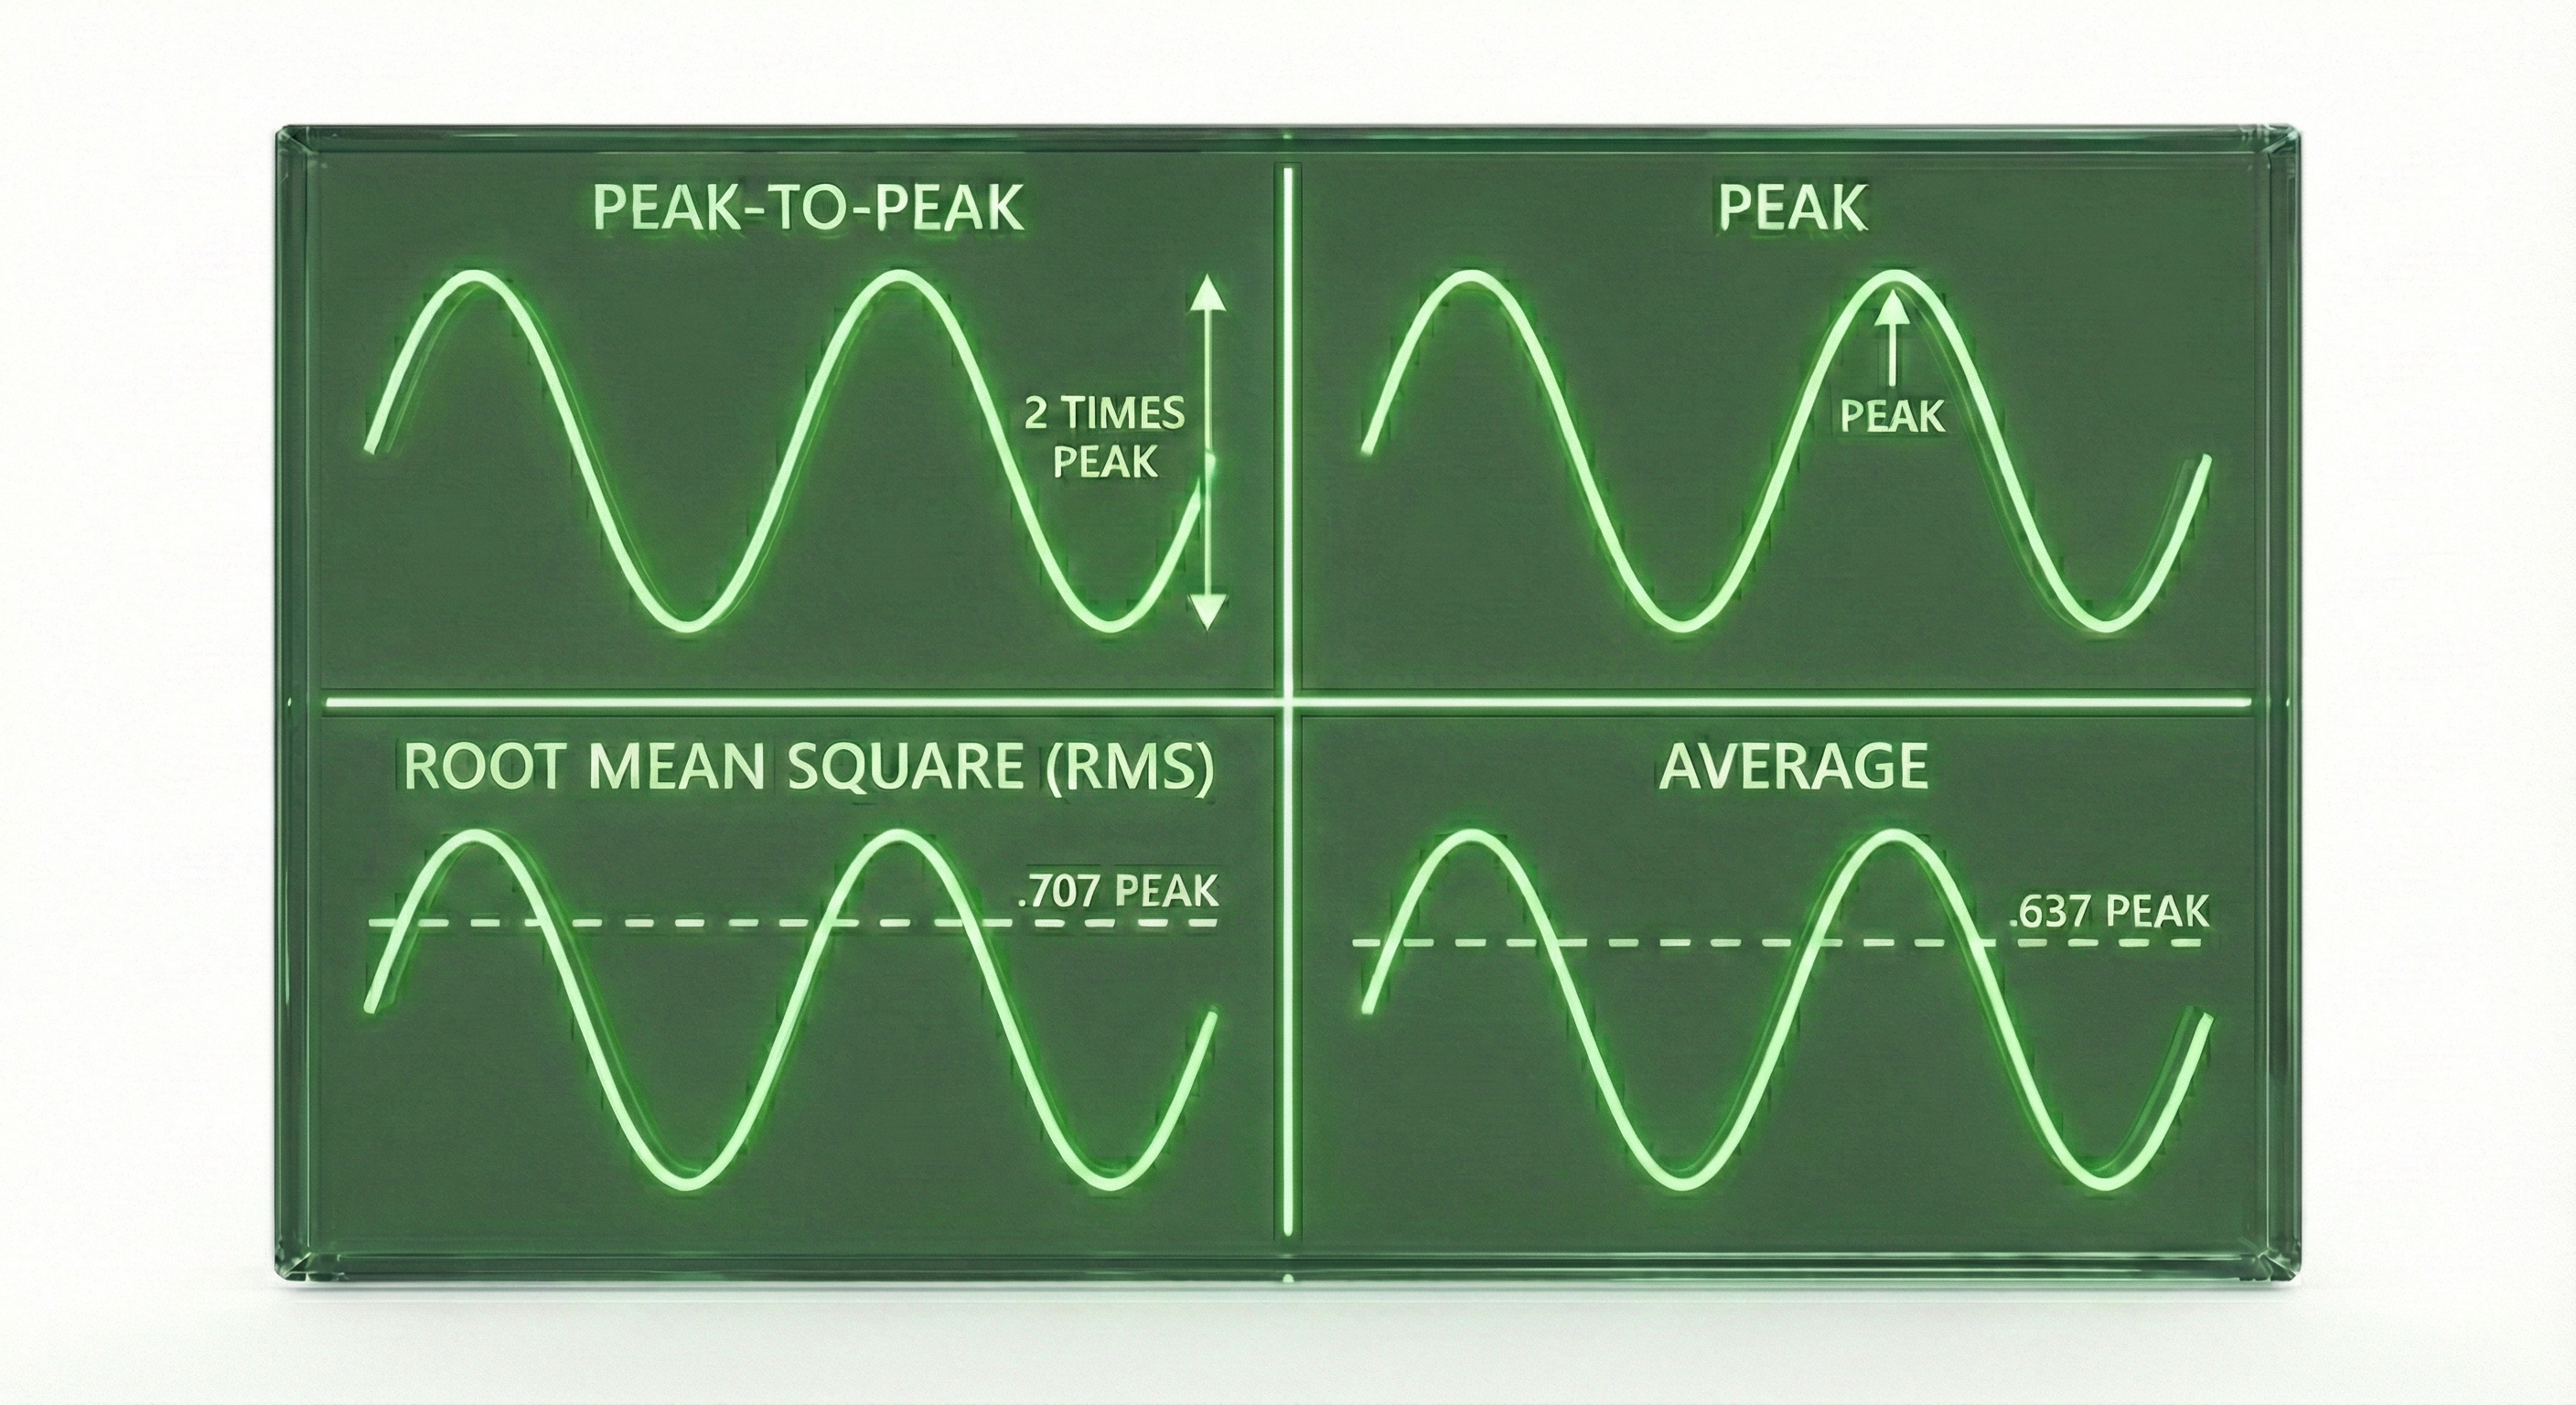
Here is a practical example: if a signal has a peak-to-peak amplitude of 20 µV, its peak amplitude is 10 µV, and its RMS amplitude is about 7 µV. The same brain activity, three different numbers, so always check which measurement method is being used!
Key Takeaways: The Electroencephalograph
A montage is the arrangement of electrode pairings used for recording, with different montages revealing different aspects of brain activity. The EEG separates brain signals into frequency bands: delta (deep sleep), theta (drowsiness), alpha (relaxed wakefulness), beta (active thinking), and gamma (higher cognition). Amplitude is measured in microvolts using methods like peak-to-peak or RMS, and knowing which method is used is essential for accurate interpretation.
Comprehension Questions
- What is a montage, and why might a clinician want to view the same recording using different montages?
- Which frequency band is associated with relaxed, eyes-closed wakefulness, and what happens to it when you open your eyes?
- If a signal has a peak-to-peak amplitude of 40 µV, what is its approximate RMS amplitude?
EEG Filters: Cleaning Up the Signal
Raw EEG recordings are messy. They contain the brain signals you want mixed with noise you do not want: slow drifts from electrode movement, fast spikes from muscle tension, and steady hums from nearby powerlines. Filters act like selective gates, allowing certain frequencies to pass through while blocking others.
Understanding filters is essential because the wrong filter settings can remove genuine brain activity or allow artifact to contaminate your data. Let us look at the four main types.
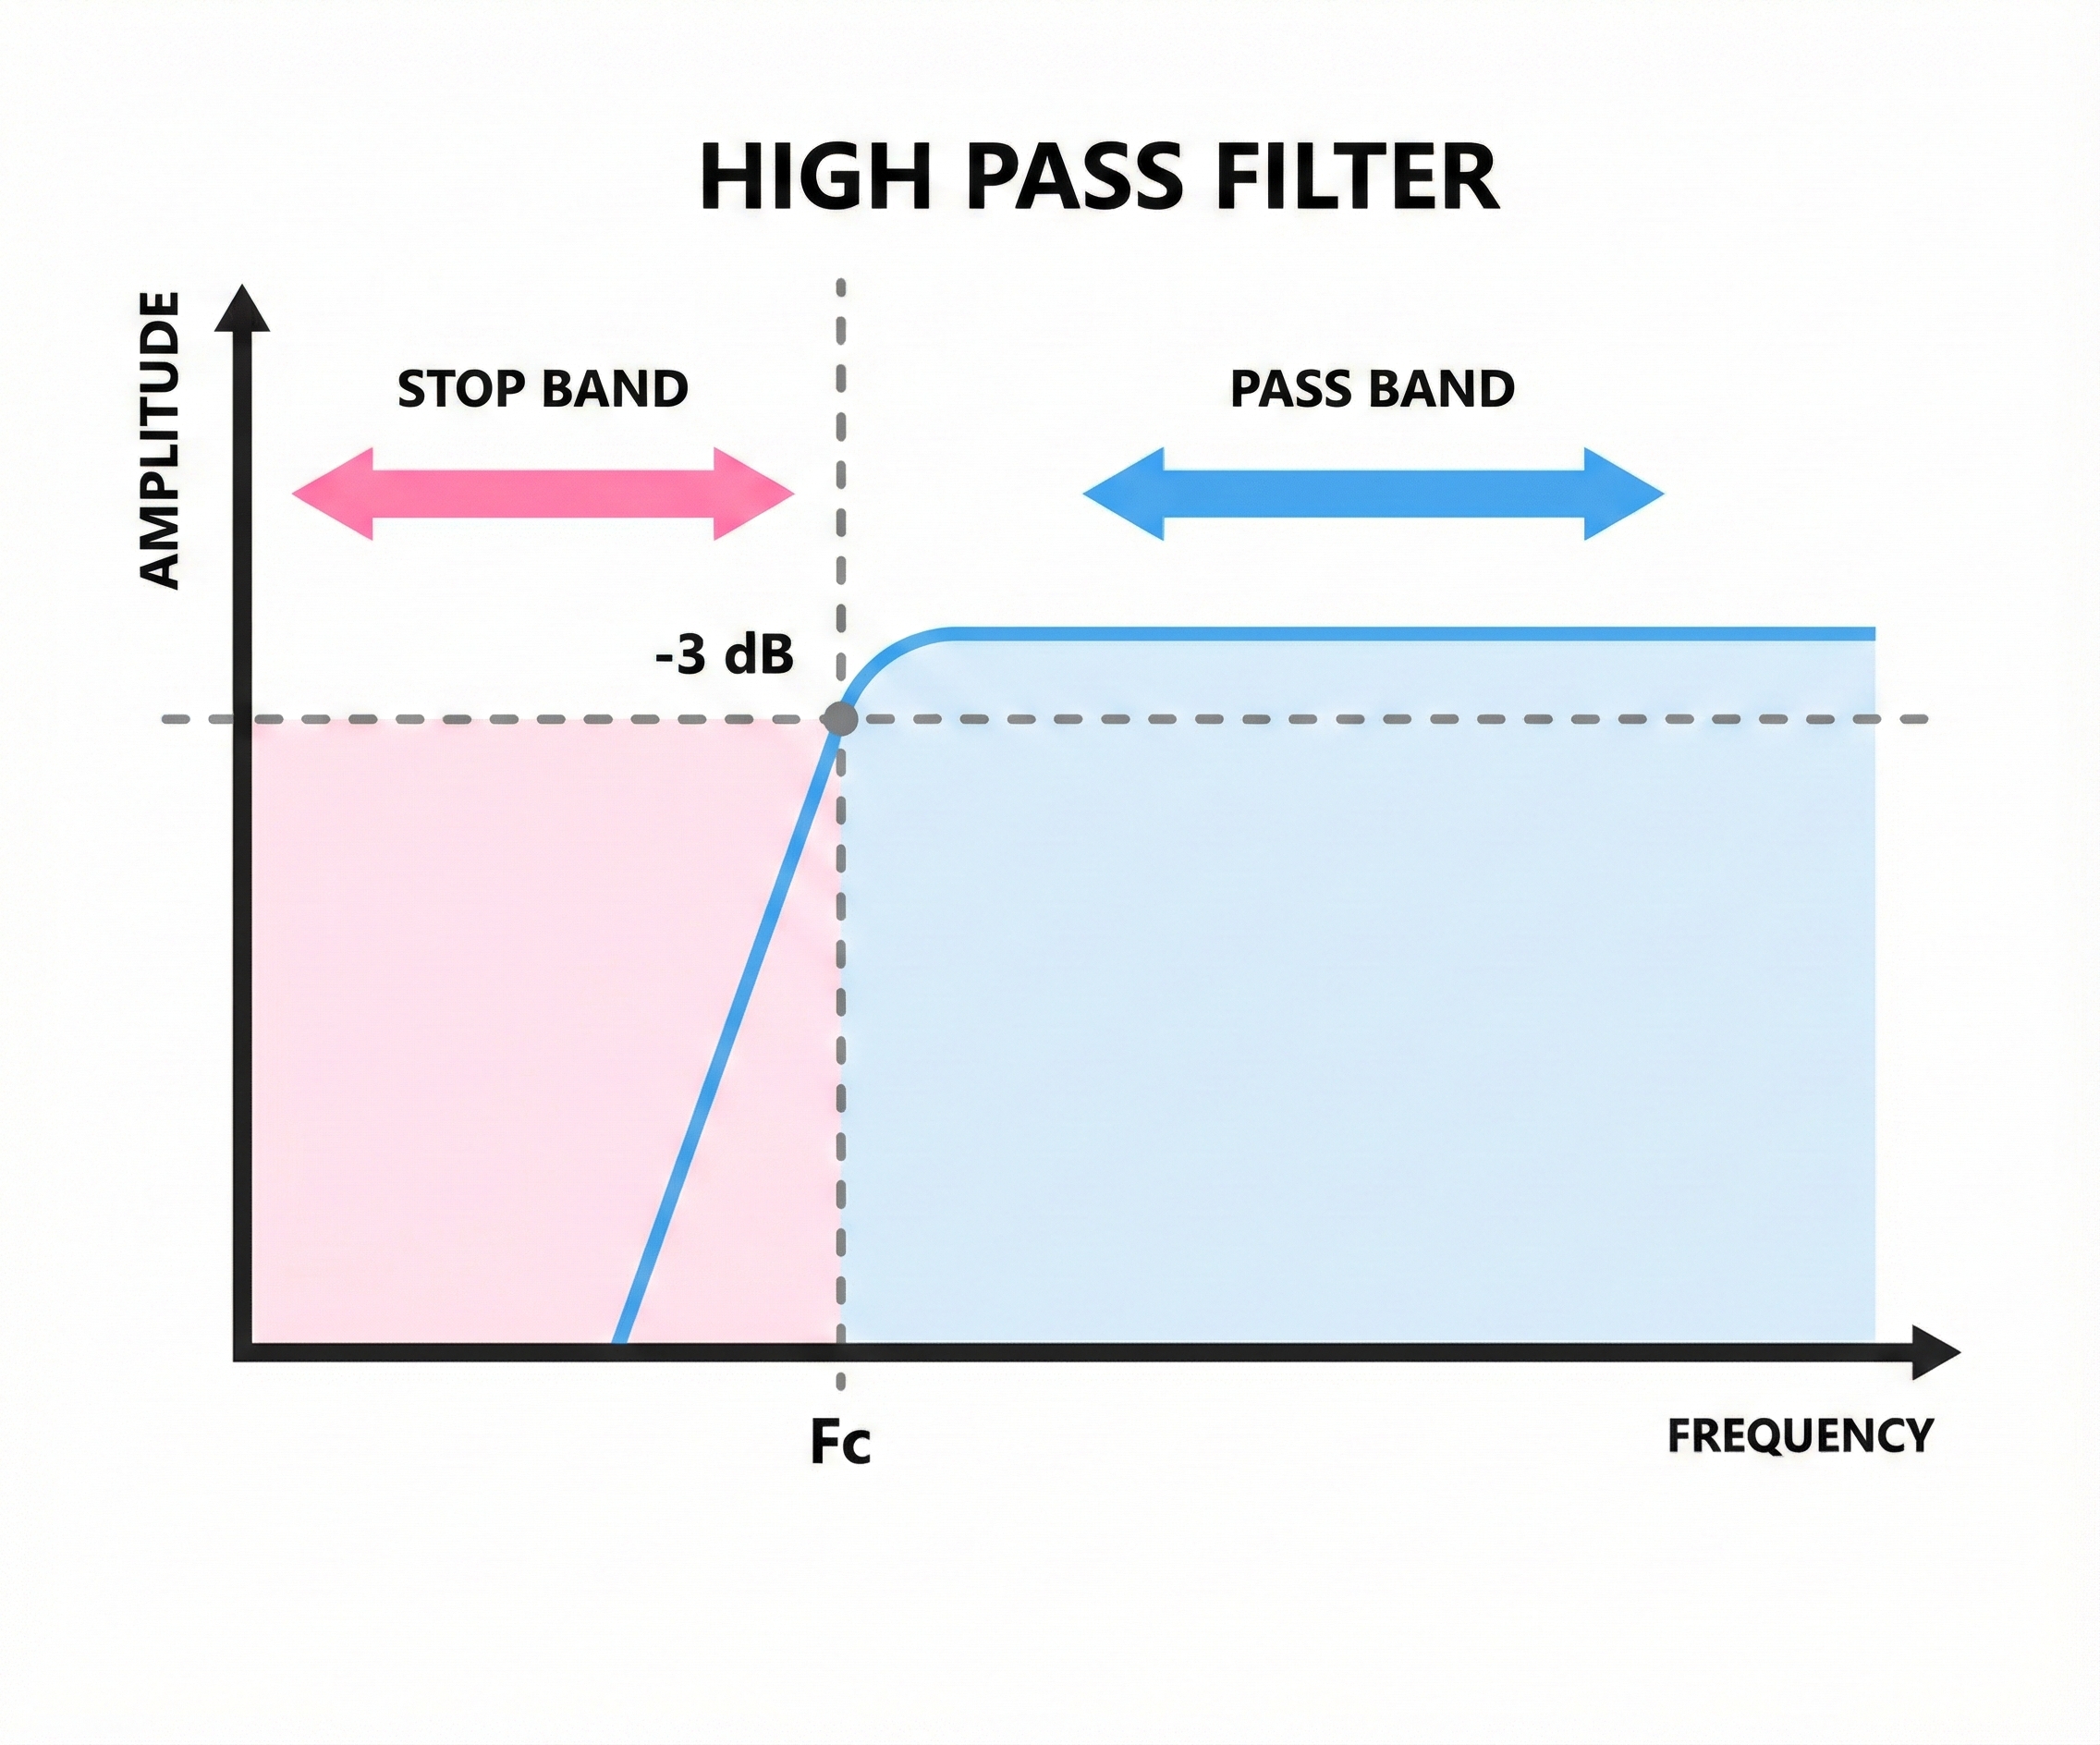
High-Pass Filters: Blocking the Slow Stuff
A high-pass filter allows high frequencies to pass through while blocking low frequencies. If you set a high-pass filter at 1 Hz, it will remove everything slower than 1 Hz, including slow drifts from breathing, movement, and sweat that can make your baseline wander up and down.
Think of it like a door that only tall people can walk through. Anything below the cutoff height (frequency) gets blocked.
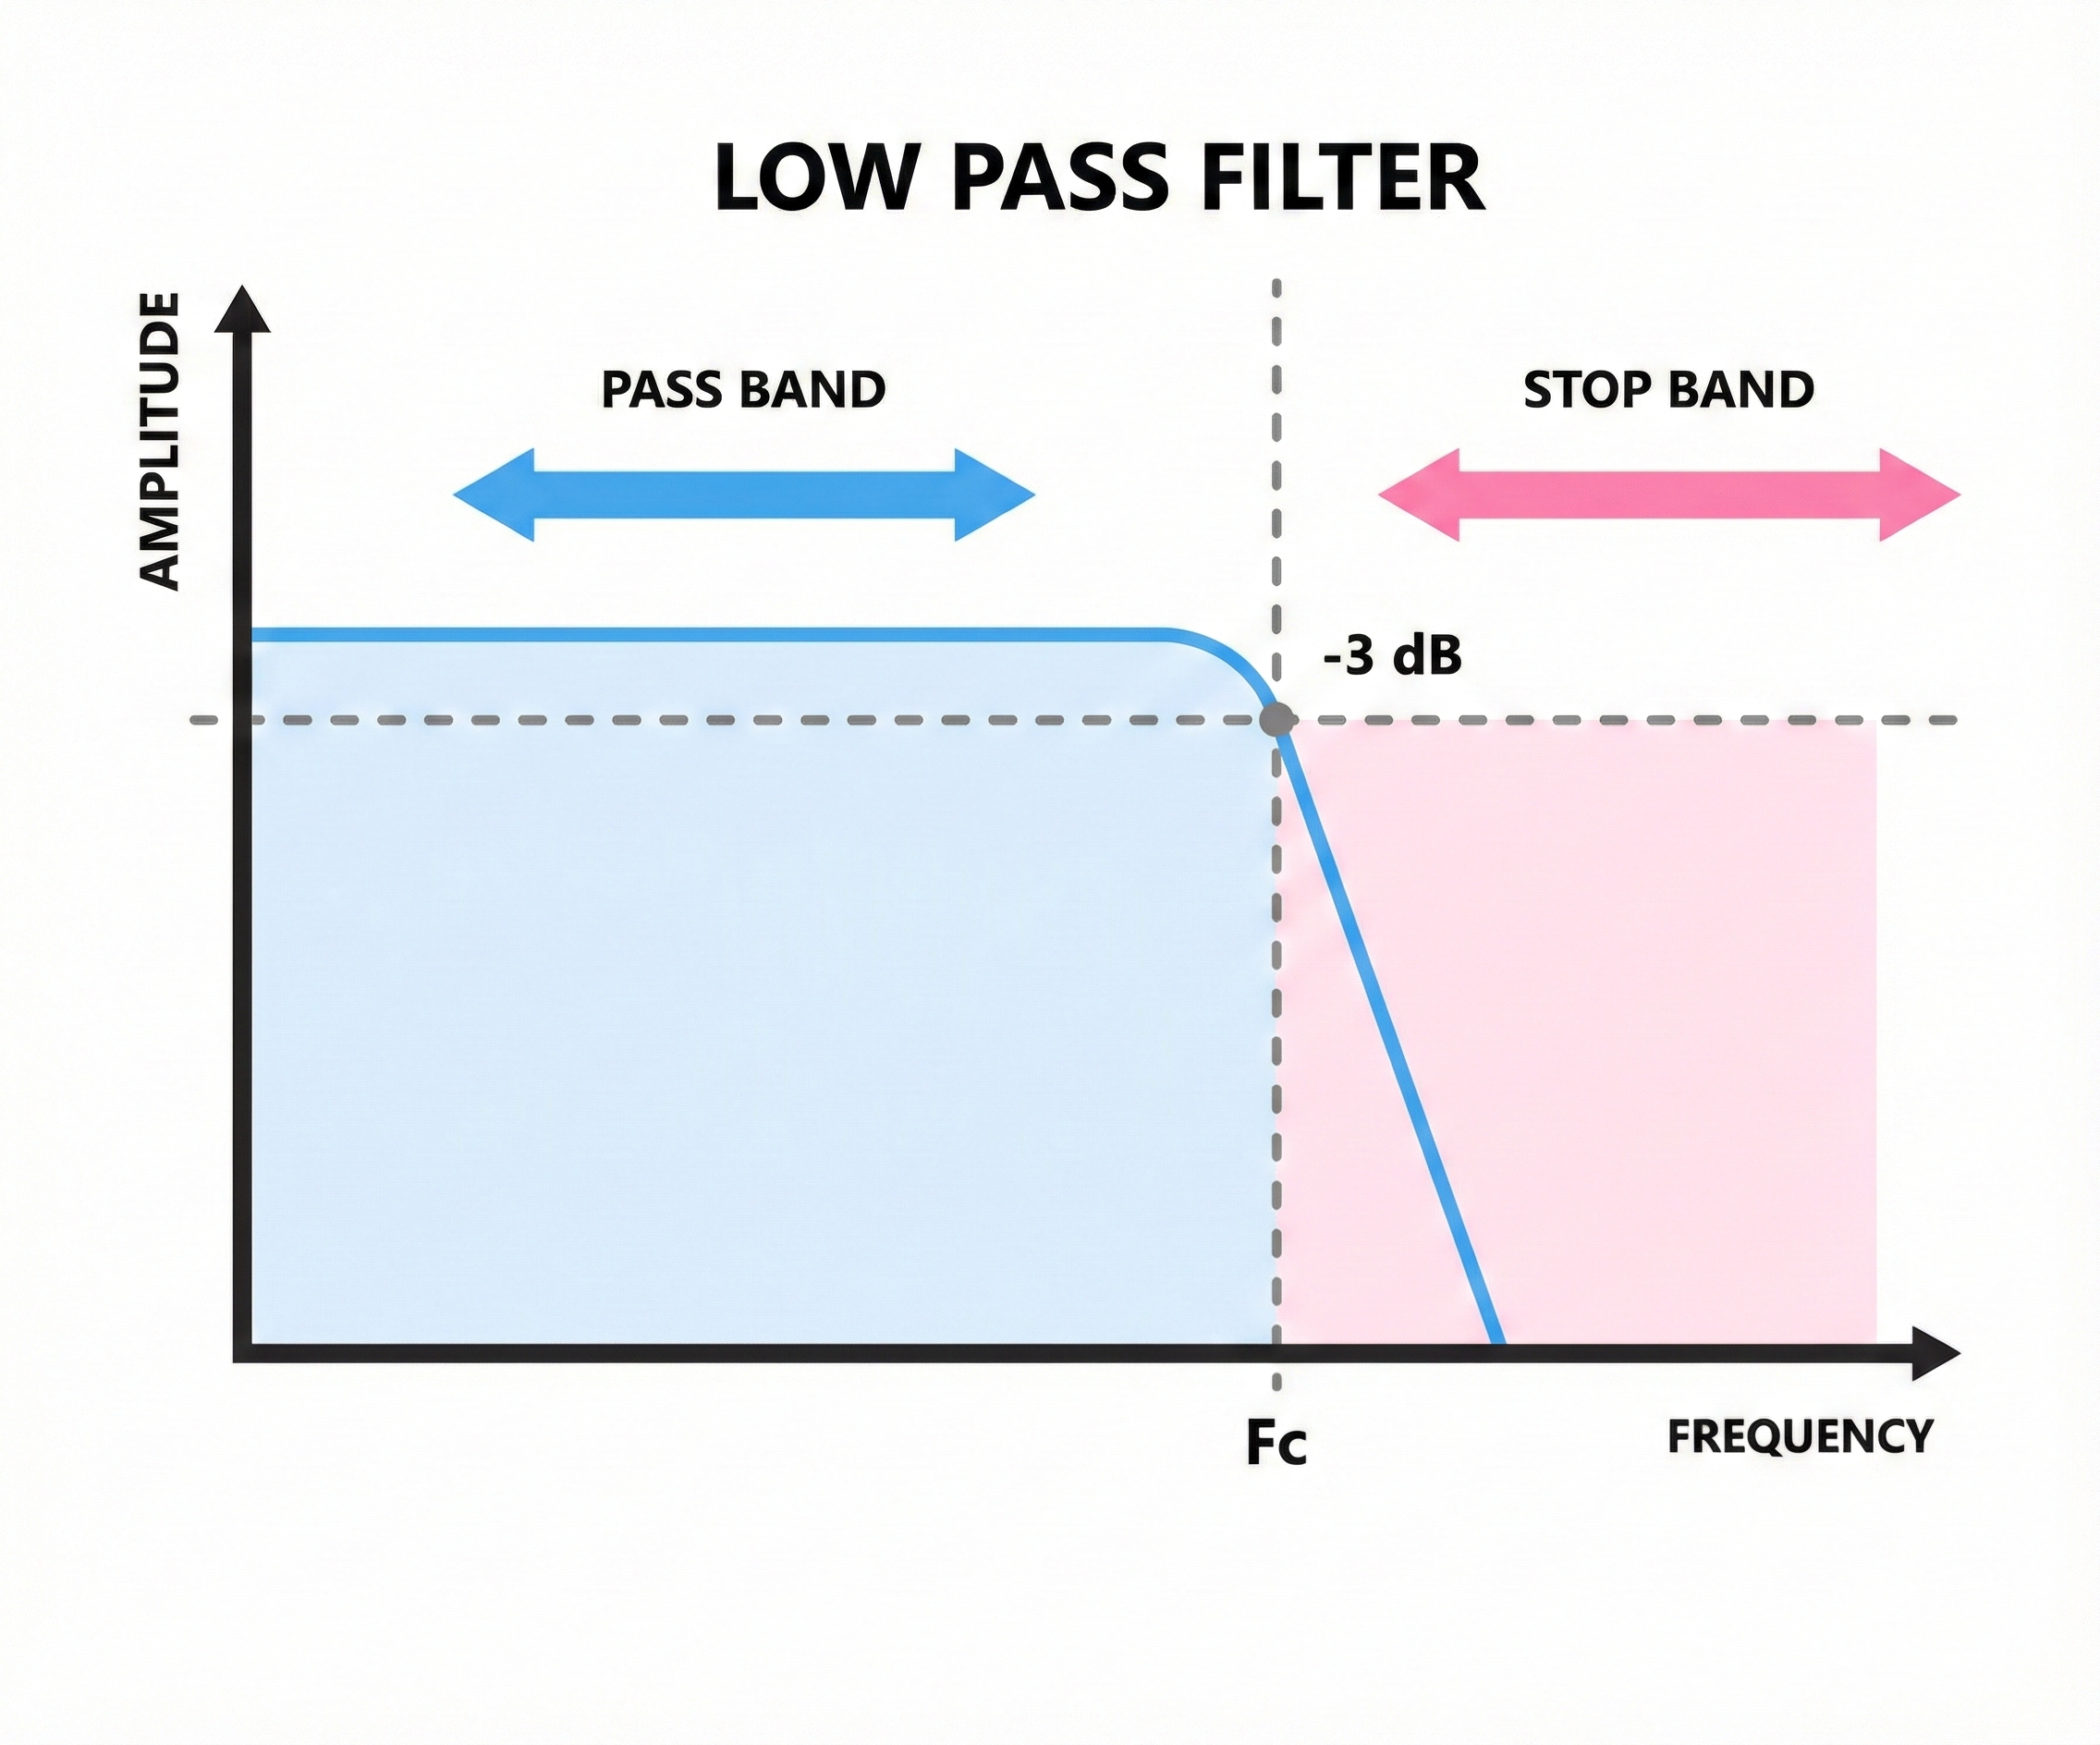
Low-Pass Filters: Blocking the Fast Stuff
A low-pass filter does the opposite, allowing low frequencies through while blocking high frequencies. Setting a low-pass filter at 40 Hz removes muscle artifact and other high-frequency noise that contaminates the EEG.
This is like a door that only short people can walk through. Anything above the cutoff gets blocked.
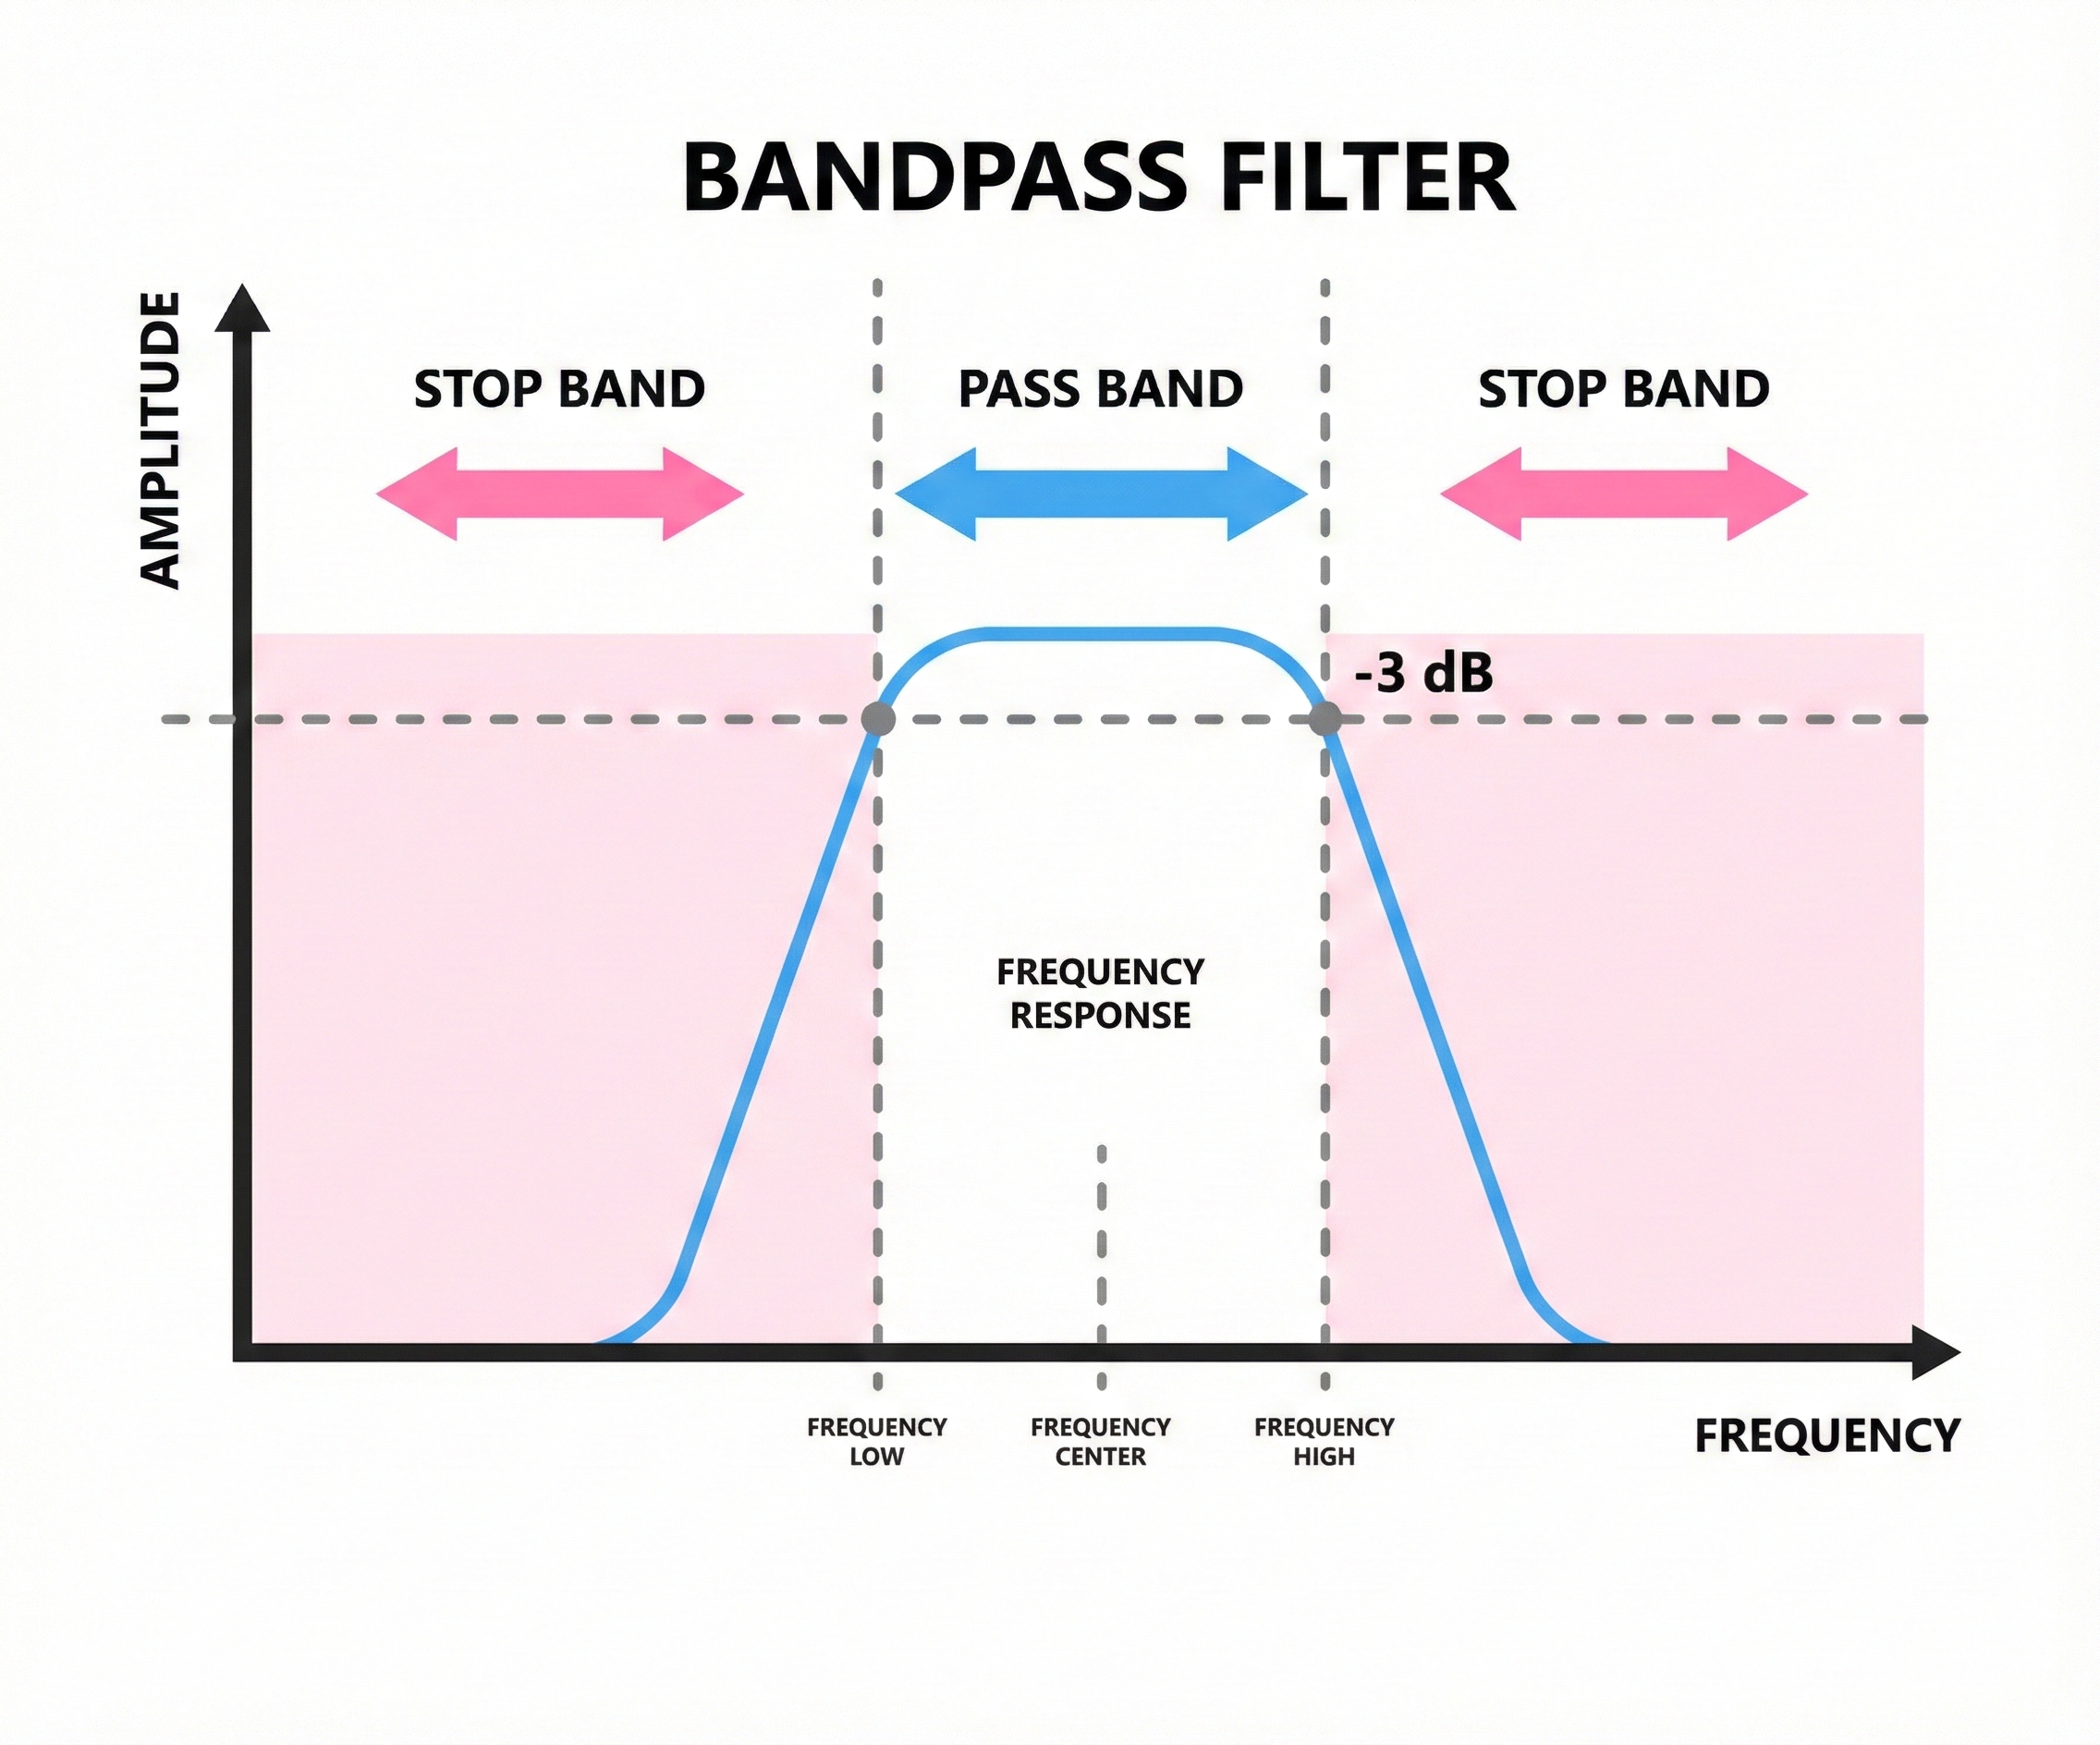
Bandpass Filters: Selecting a Frequency Window
A bandpass filter combines both approaches, allowing only a specific range of frequencies to pass. If you set a bandpass filter from 1 to 40 Hz, you block everything below 1 Hz and everything above 40 Hz, keeping only the middle range where most EEG activity lives.
Most EEG recordings use bandpass filtering because it removes unwanted slow and fast noise while preserving the frequencies clinicians care about.
Notch Filters: Targeting Powerline Noise
Electrical powerlines operate at 60 Hz in North America (50 Hz in many other countries), and this frequency can sneak into EEG recordings as a steady hum. A notch filter removes a very narrow band of frequencies, cutting out the powerline interference while leaving nearby frequencies intact.
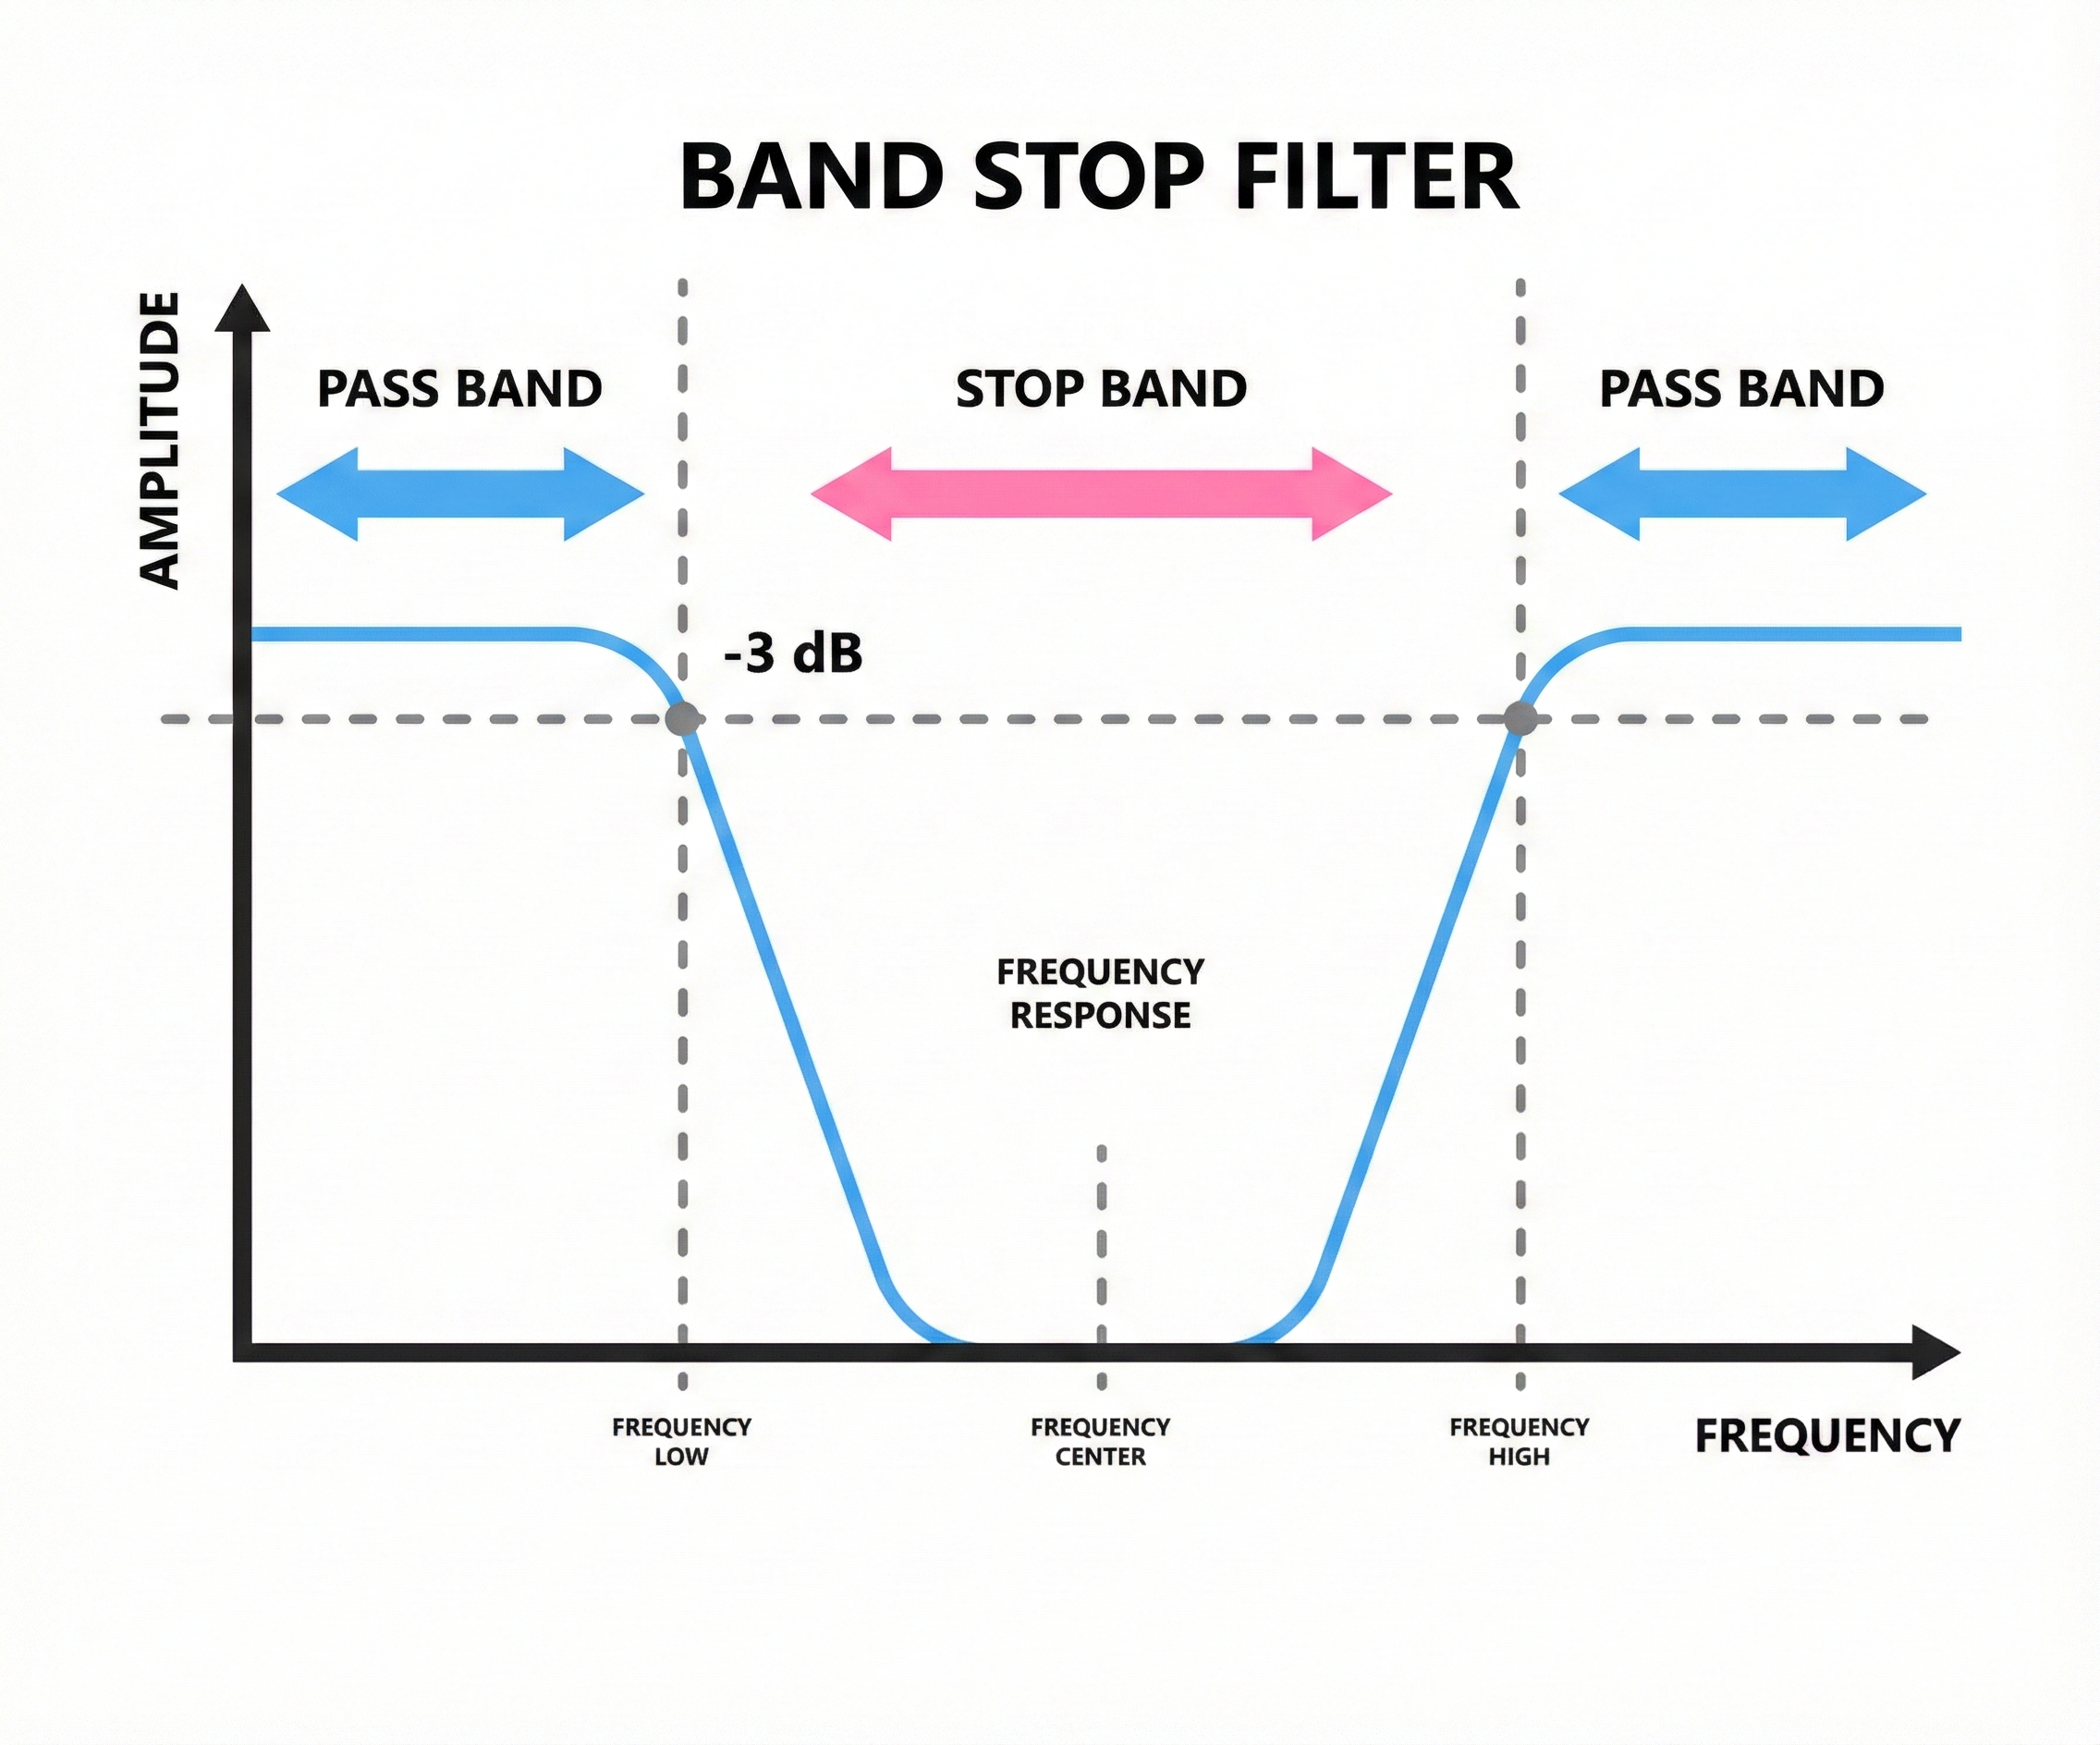
Use notch filters sparingly! They should be a last resort after you have tried to eliminate powerline noise through better electrode preparation and cable management. Notch filters can distort brain activity near 60 Hz, which overlaps with the gamma band and high beta range.
Key Takeaways: EEG Filters
Filters selectively block certain frequencies while allowing others to pass. High-pass filters remove slow frequencies (like drift), low-pass filters remove fast frequencies (like muscle artifact), and bandpass filters keep only a specified range. Notch filters remove narrow frequency bands like 60-Hz powerline noise but should be used sparingly because they can distort nearby frequencies.
Comprehension Questions
- What type of filter would you use to remove slow baseline drift from an EEG recording?
- Why might a clinician prefer a bandpass filter over using separate high-pass and low-pass filters?
- Why should notch filters be used as a last resort rather than a standard setting?
Electrode Placement Systems: Speaking the Same Language
Imagine trying to give someone directions without street names or landmarks. "Go to the spot on the left side of the head, kind of toward the front" would not get anyone very far. The International 10-20 System solves this problem by providing a standardized map for electrode placement that clinicians worldwide can use to communicate precisely about brain locations.
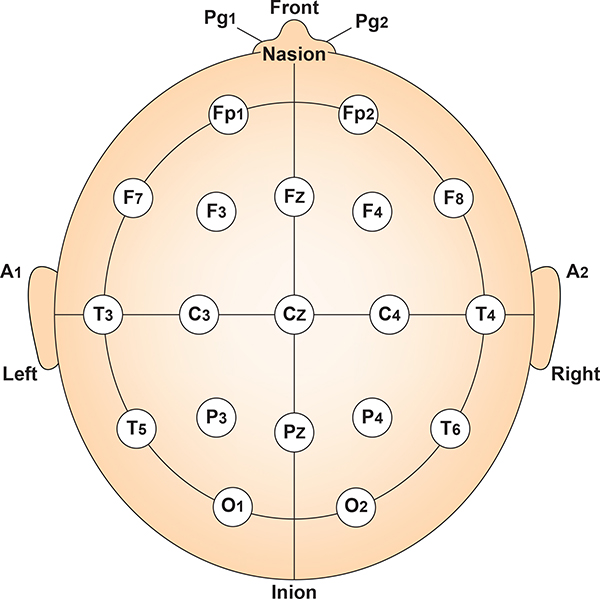
The International 10-20 System
Developed in the 1950s, the 10-20 System gets its name from the way it divides the head. Electrodes are placed at intervals of either 10% or 20% of the distance between specific anatomical landmarks. This percentage-based approach means the system works regardless of head size, automatically scaling to fit each individual.
The system uses letter-number combinations to identify each site. Letters indicate the brain region: Fp for frontopolar (forehead), F for frontal, C for central, P for parietal, T for temporal, and O for occipital. Numbers indicate position: odd numbers are on the left hemisphere, even numbers are on the right, and z marks the midline. So Cz sits at the very top of the head on the midline, while C3 is over the left motor cortex and C4 is over the right.
Finding Your Landmarks
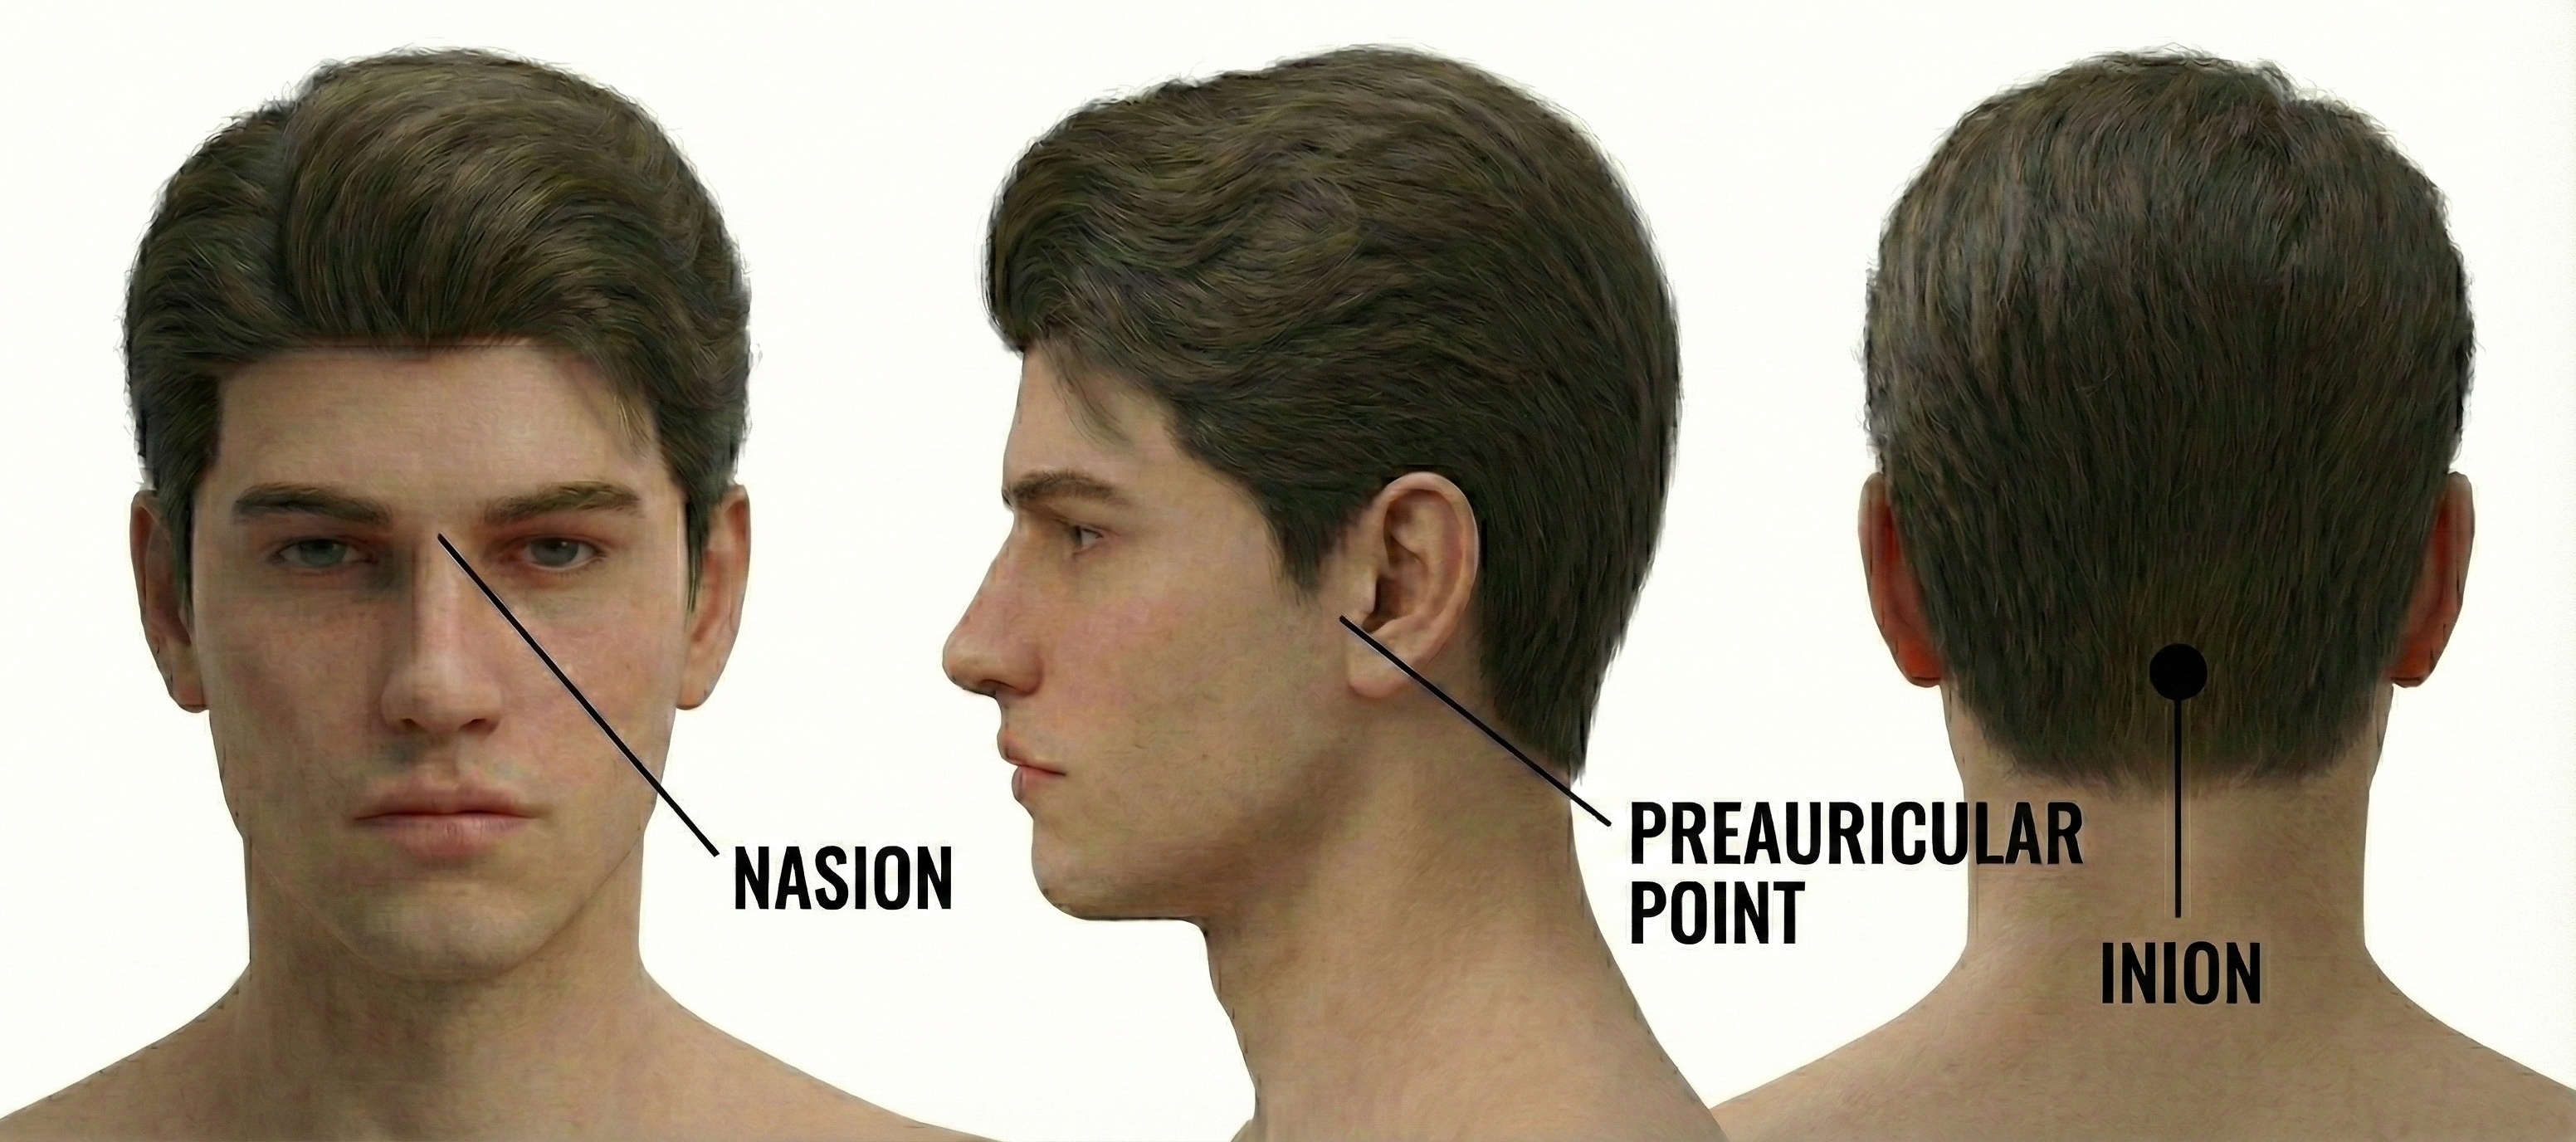
To place electrodes accurately, you need to locate four anatomical landmarks on every client. These landmarks serve as the reference points for all measurements.
The nasion is the depression at the bridge of the nose, right where the forehead meets the nose. You can feel it as a slight dip between your eyebrows.
The inion is the bony bump at the back of the skull, roughly where your head meets your neck. Run your fingers up from your neck until you feel a small protrusion on the midline.
The preauricular points are small depressions just in front of each ear, above the earlobe. To find them, locate the tragus (the small flap covering the ear opening) and move slightly forward to feel a depression where the jaw meets the skull.
The vertex (Cz) sits at the intersection of two imaginary lines: one running from nasion to inion along the midline, and one running from the left preauricular point to the right. Cz is exactly 50% of each distance, placing it at the very top of the head.
The 10-10 System: More Sites, More Precision
The standard 10-20 System provides 19 electrode positions, which is sufficient for many clinical applications. However, some situations call for finer spatial resolution. The Modified Combinatorial Nomenclature, commonly called the 10-10 System, expands the grid to 75 possible electrode sites by placing electrodes at every 10% interval rather than mixing 10% and 20% intervals.
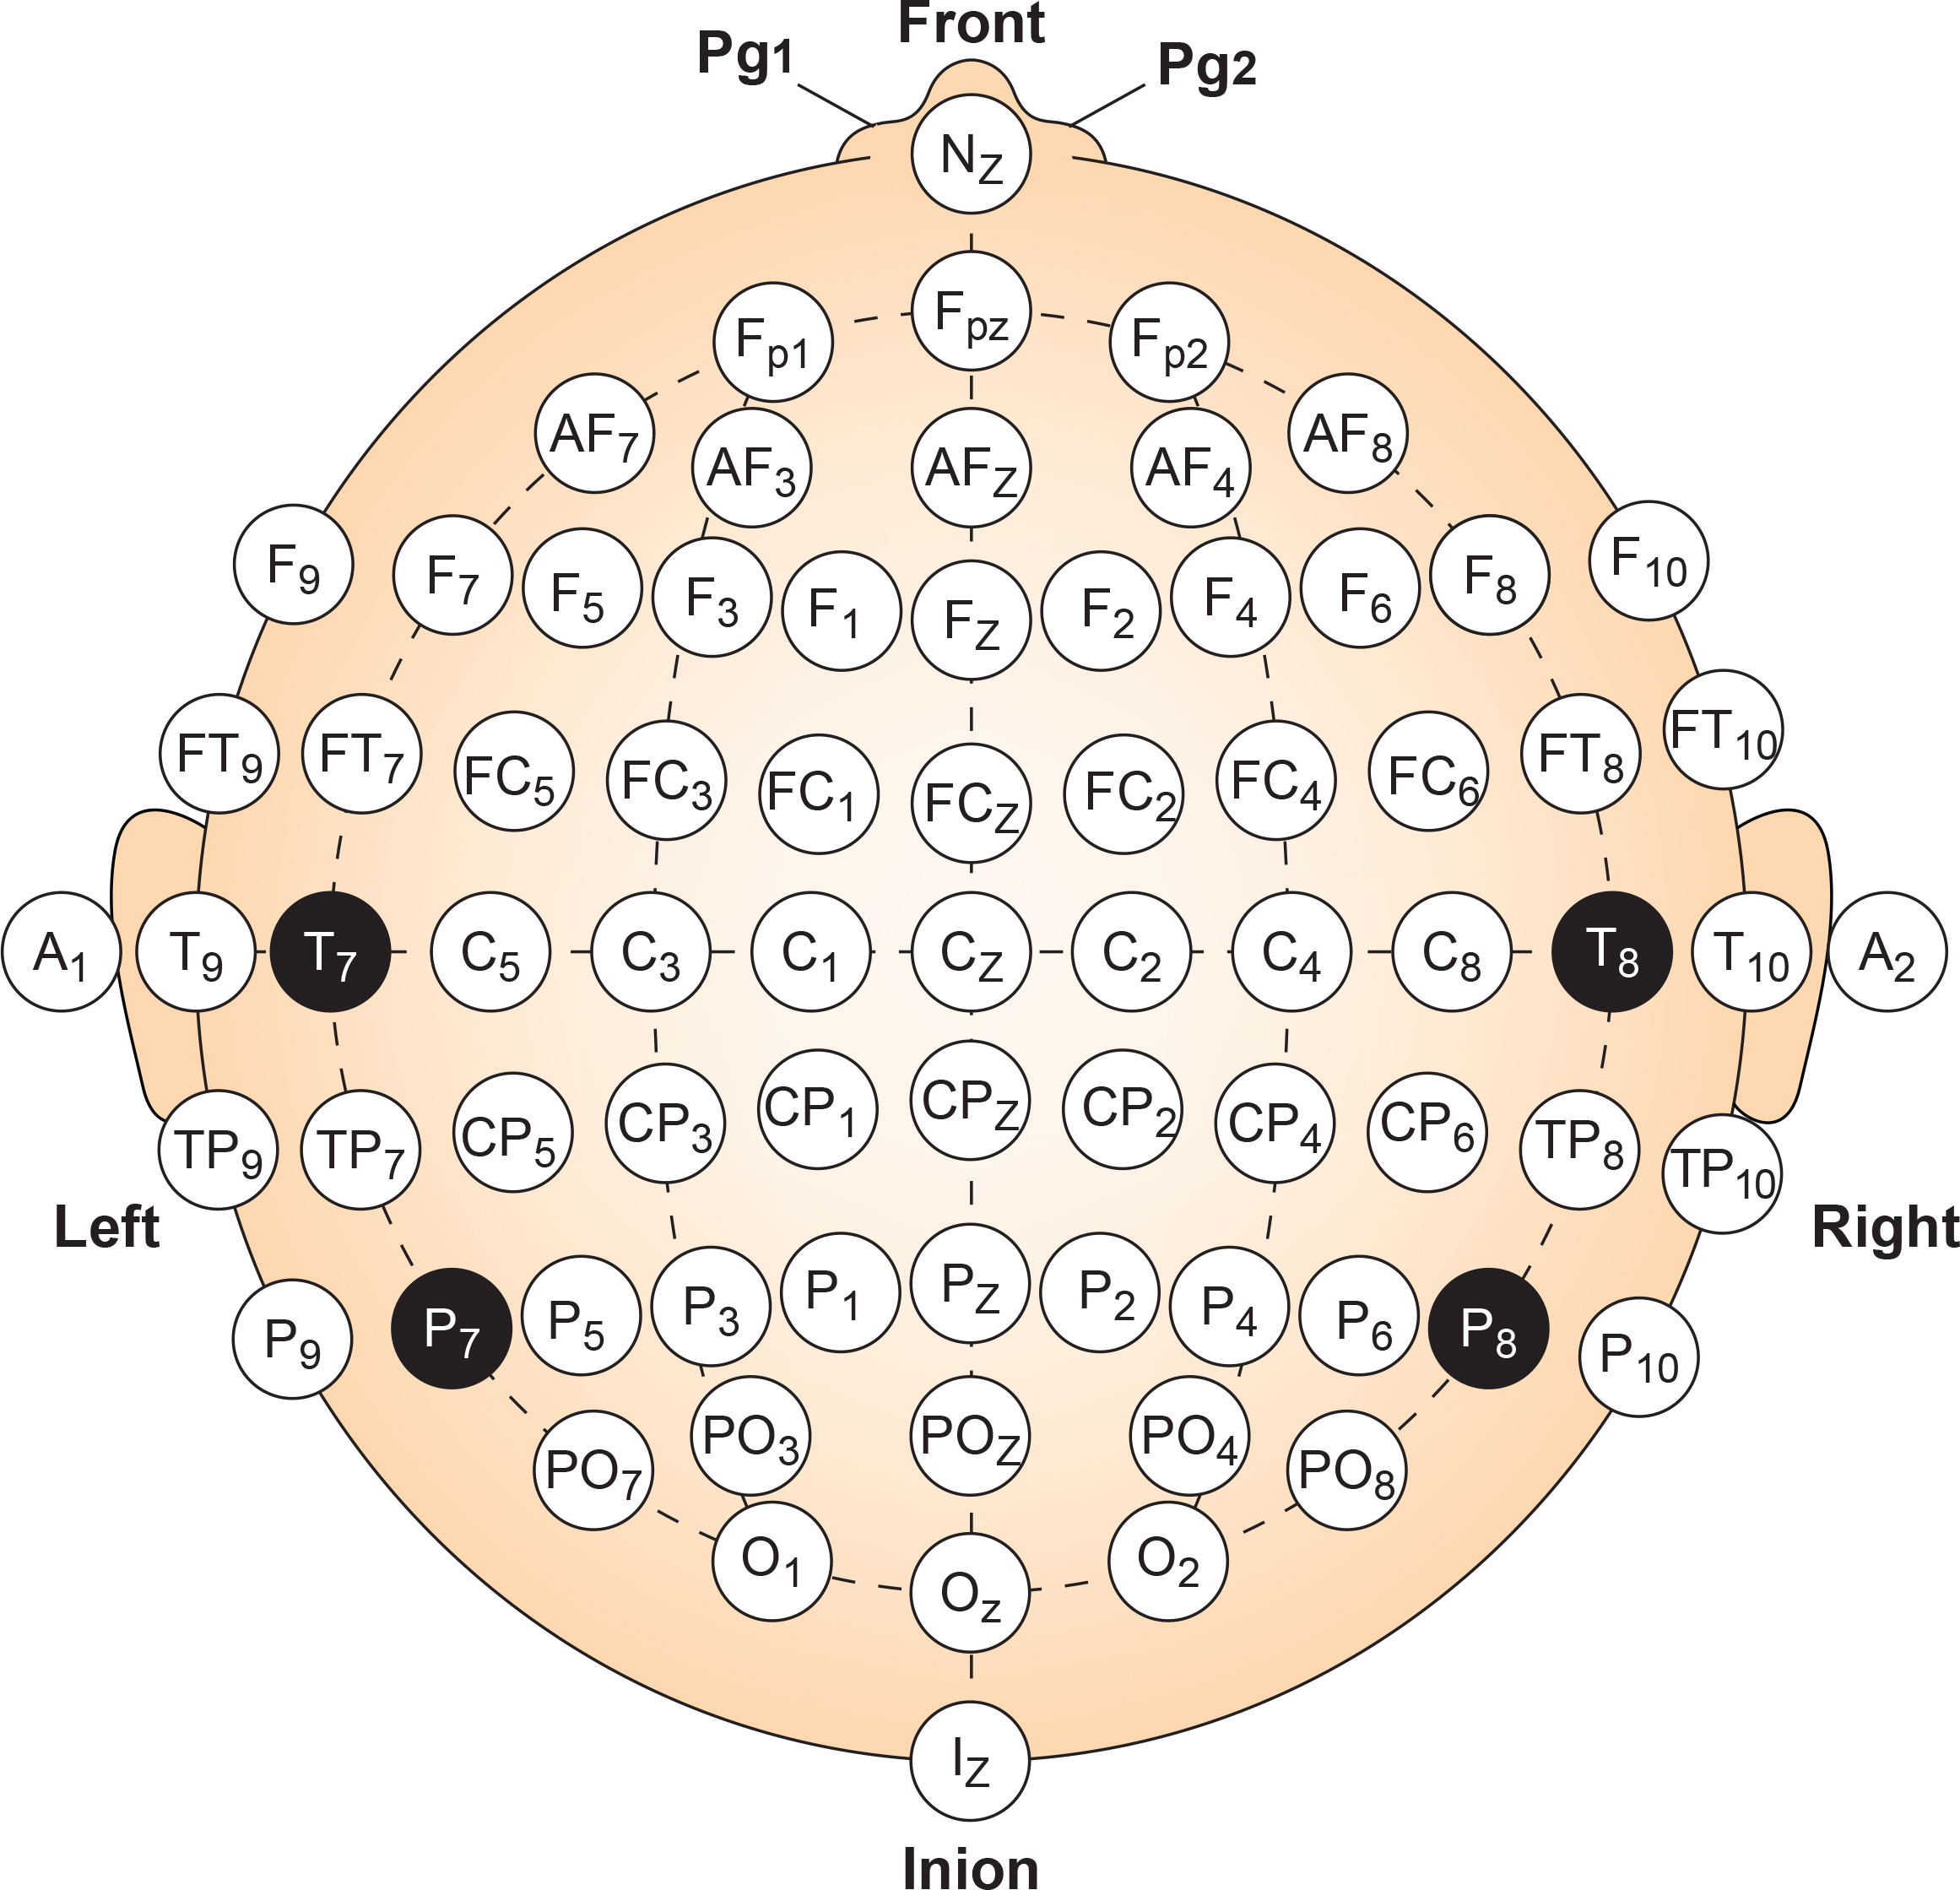
Why would anyone need 75 electrodes? The denser grid helps clinicians pinpoint exactly where abnormal activity originates, which is particularly valuable for surgical planning in epilepsy cases. It also improves the detection of localized events like evoked potentials (brain responses to specific stimuli) that might fall between the standard 10-20 sites. Research applications frequently use high-density electrode arrays with 64, 128, or even 256 sensors to capture the finest spatial details of brain activity.
For everyday neurofeedback practice, the standard 19-channel 10-20 layout remains the workhorse. But knowing that the 10-10 System exists helps you understand research literature and prepares you for specialized applications you may encounter.
Key Takeaways: Electrode Placement Systems
The International 10-20 System provides a standardized map for electrode placement using percentage-based measurements from anatomical landmarks. Letters indicate brain regions (F for frontal, C for central, etc.) while numbers indicate left (odd) or right (even) position. The four key landmarks are the nasion, inion, and left and right preauricular points. The 10-10 System expands to 75 sites for applications requiring finer spatial resolution, such as epilepsy localization.
Comprehension Questions
- What do the letter and number in an electrode name like "C3" tell you about its location?
- How would you locate the vertex (Cz) on a client's head?
- In what clinical situations might the 75-site 10-10 System be preferable to the standard 19-site 10-20 System?
Site Preparation: Setting Up for Success
Even the most sophisticated electroencephalograph cannot produce good data if the electrodes are not properly connected to the scalp. Site preparation may seem tedious, but it is the foundation of reliable recording. Shortcuts here create headaches later.
The Basics
Start by asking clients to arrive with clean, dry hair and no styling products. Conditioners, gels, and sprays create barriers between the electrode and scalp that weaken the signal. A recent haircut helps, especially for children, since shorter hair is easier to work around.
Once you have identified the electrode site using your 10-20 measurements, clean the skin with alcohol to remove oils and dead skin cells. Let the alcohol dry completely before proceeding. Applying electrodes to wet skin creates problems.
Next, apply a small amount of conductive gel or paste to the electrode cup. The gel bridges the gap between the metal electrode and the skin, providing a low-resistance pathway for electrical signals. Too little gel means weak contact; too much can spread and create bridges between adjacent electrodes.

Secure the electrode with tape or a headband, making sure the cable has some slack to prevent tugging. Strain relief is important: if the cable pulls on the electrode, it creates movement artifact and may detach the sensor entirely.
Checking Your Work: The Impedance Test
How do you know if your preparation is good enough? The impedance test measures the resistance between the electrode and the scalp. High impedance means poor contact, which weakens the brain signal while allowing noise to dominate.
Modern equipment typically displays impedance values for each electrode. Traditional guidelines called for impedance below 5,000 ohms (5 kΩ), though contemporary amplifiers with high input impedance can work well with somewhat higher values. The old standard of achieving skin-electrode impedance below 5 kΩ has been challenged as unnecessary and risks infection transmission when using abrasive preparation techniques (Ferree et al., 2001). More important than hitting a specific number is ensuring that impedance is balanced across electrodes. If one electrode has much higher impedance than its reference, the differential amplifier cannot effectively reject noise.
If impedance is too high, the fix is usually simple: recheck that the electrode has good contact, add a bit more gel, or gently re-prep the site. Patience at this stage prevents frustration during recording.
Key Takeaways: Site Preparation
Good recordings start with good preparation. Clients should arrive with clean, product-free hair. Clean each site with alcohol before applying conductive gel and the electrode. Use strain relief to prevent cable movement. Always check impedance before recording, aiming for balanced values across electrodes rather than just hitting a specific threshold.
Artifacts: Imposters in Your Recording
Not everything that looks like brain activity actually comes from the brain. Artifacts are signals from other sources that sneak into your recording and masquerade as neural activity. Learning to recognize and minimize artifacts is one of the most important skills in EEG work.
Artifacts fall into two categories: physiological artifacts come from the client's own body, while exogenous artifacts come from external sources like equipment or the environment.
Physiological Artifacts
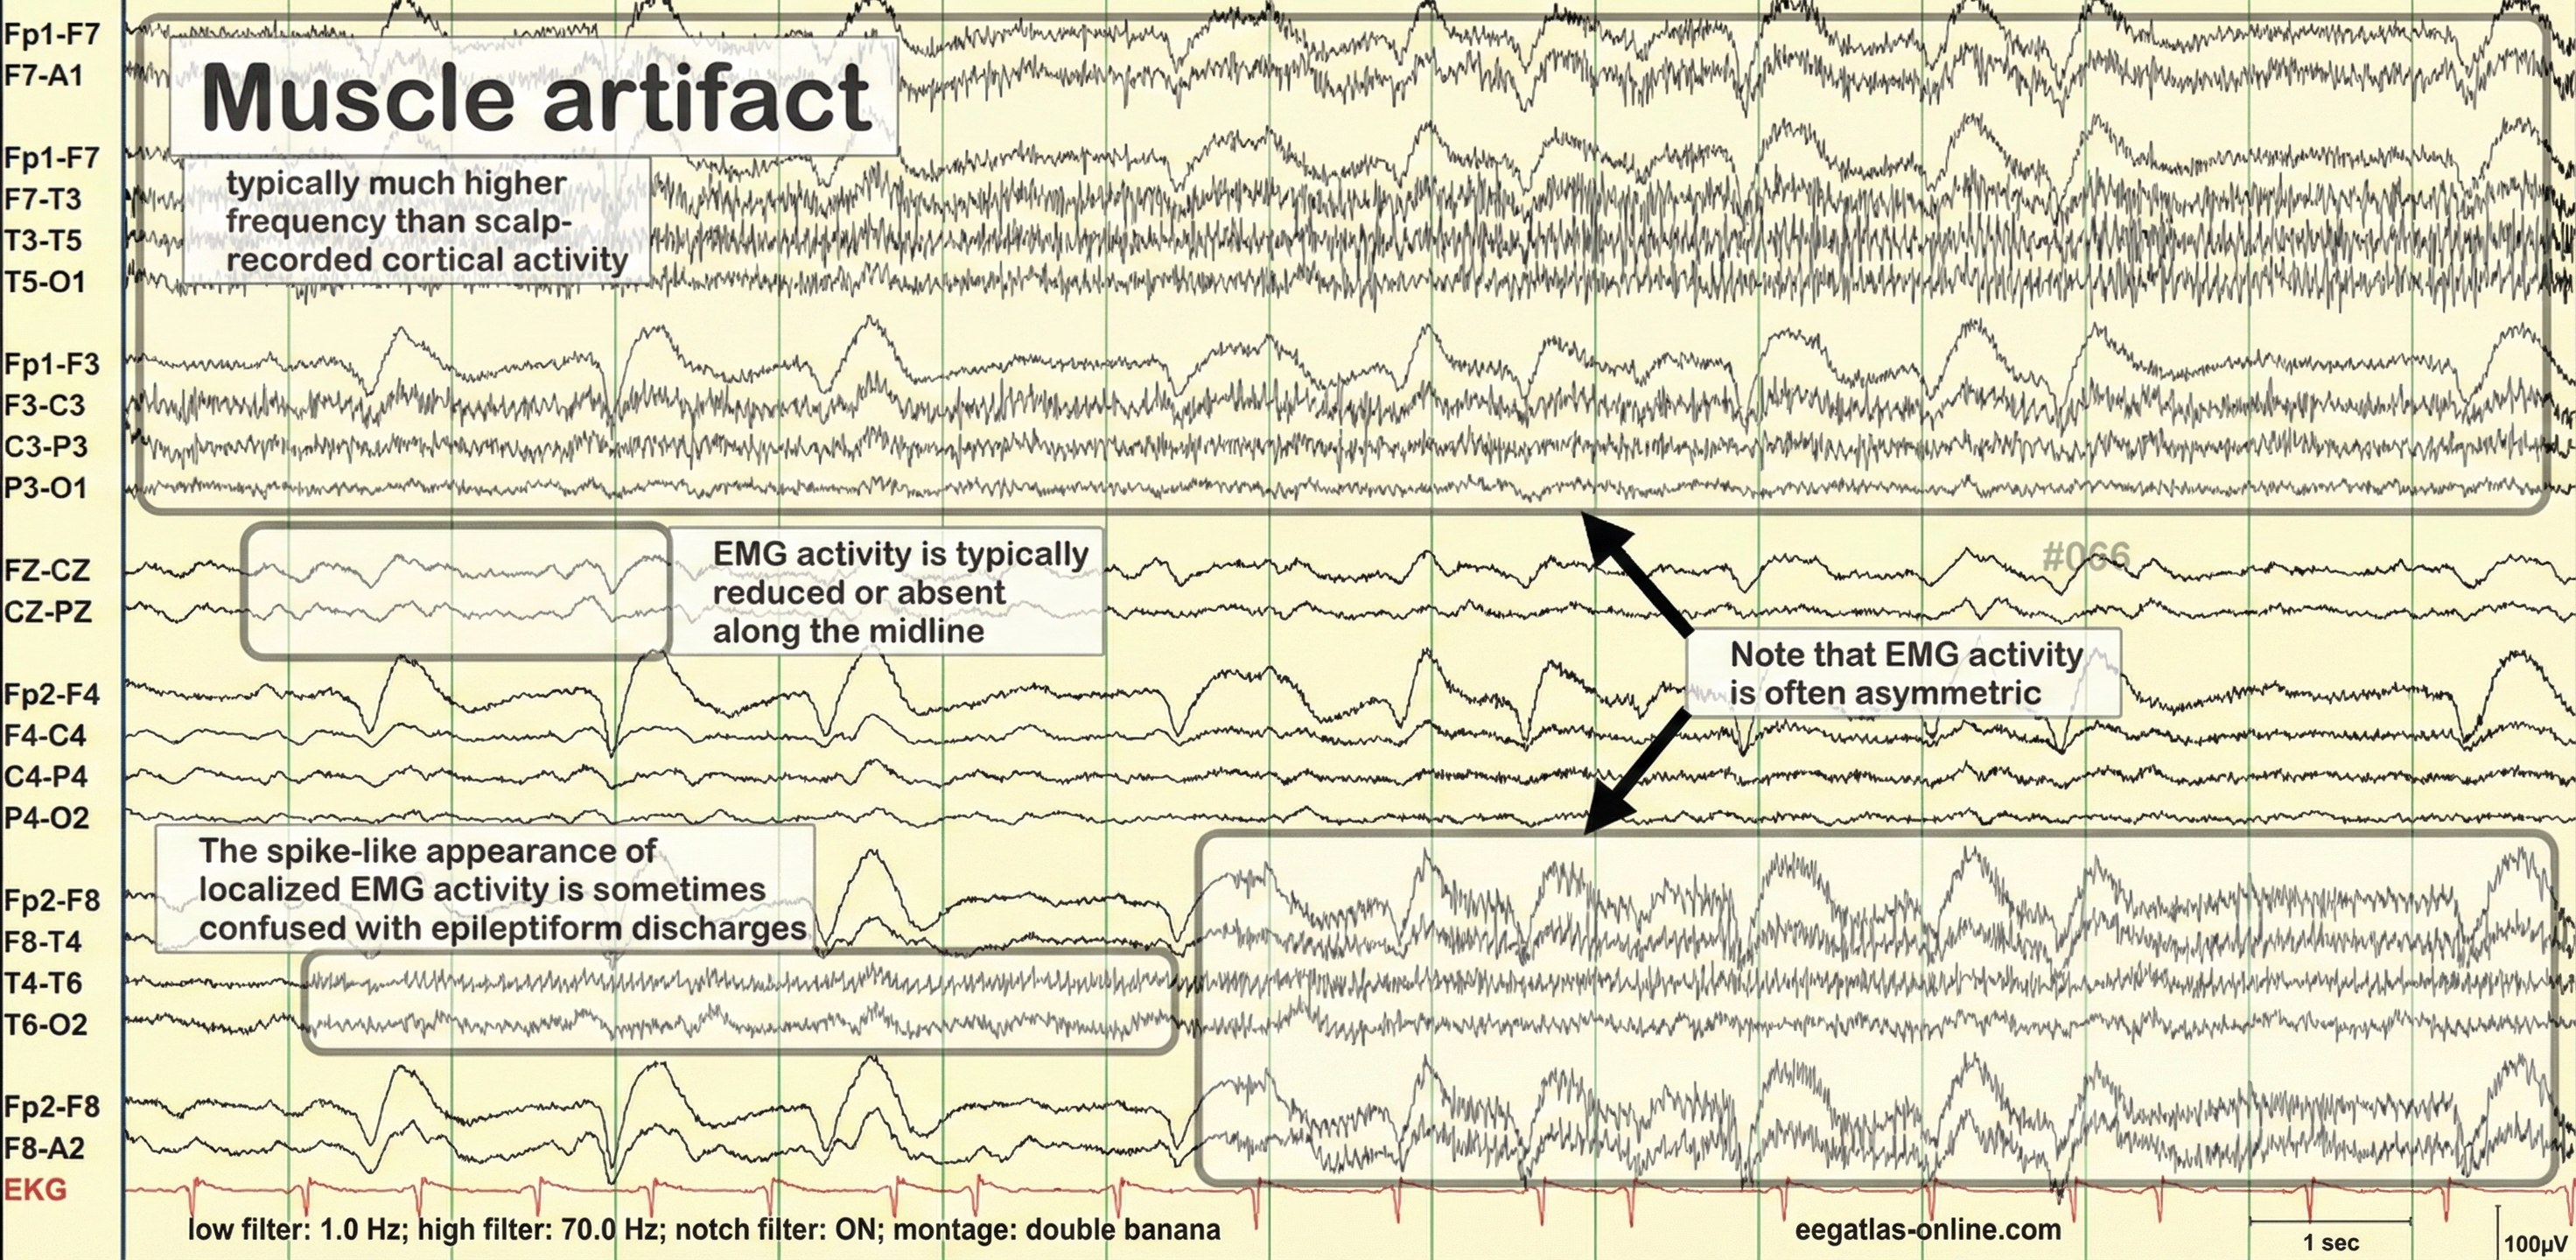
EMG (muscle) artifact is the most common troublemaker. When clients tense their jaw, furrow their brow, or clench their neck muscles, the electrical activity from those muscles shows up in the EEG as high-frequency "fuzz" that can be mistaken for beta activity. EMG artifacts are readily detected because they affect one or two channels, particularly at T3 and T4 at the periphery, and less often at O1, O2, Fp1, and Fp2 (Thompson & Thompson, 2015). Ask clients to relax their face and jaw, and watch for signs of tension during recording.
Eye movement artifact appears because the eye acts like a small battery, with the front positive and the back negative. Every blink and eye movement shifts this electrical field, creating waves that contaminate frontal electrodes. Anxious patient eyelid flutter may cause deflections at Fp1 and Fp2 (Klass, 2008). Instruct clients to keep their gaze steady and blink naturally rather than suppressing blinks (which just creates tension).
Cardiac artifact occurs when the heart's electrical signal travels to the scalp, appearing as rhythmic spikes that repeat with each heartbeat, about once per second (Thompson & Thompson, 2015). This is more common when ear electrodes contact the neck or when electrode impedances are imbalanced.
Sweat artifact shows up as slow, wandering baseline shifts when perspiration changes the electrical properties of the skin under the electrodes. This artifact usually appears as isolated 1-2 Hz slow waves of 1-2-second duration at frontal and temporal sites (Thompson & Thompson, 2015). Keep the room comfortably cool and give anxious clients time to settle before recording.
Drowsiness artifact is tricky because it represents actual brain activity, just not the kind you want during an eyes-closed assessment. As clients slip toward sleep, alpha drops and theta rises. Watch for this pattern and prompt clients to stay alert if needed.
Exogenous Artifacts
60-Hz artifact (50 Hz in many countries) comes from nearby powerlines and electrical equipment. It appears as a steady, rhythmic hum that contaminates your recording. Good electrode preparation, balanced impedances, and moving away from electrical devices usually solve this problem.
Movement artifact occurs when electrodes shift on the scalp or when cables sway. The result is sudden, sharp deflections that clearly do not look like brain activity. Secure your electrodes well and use strain relief on cables.
Electrode pop is a sudden, dramatic spike that occurs when an electrode briefly loses contact with the scalp. If you see these, check that the offending electrode is still securely attached.
Dealing with Contaminated Data
Even with careful preparation, some artifacts will slip through. The process of artifacting involves reviewing your recording and marking or removing contaminated segments (called epochs) before analysis. Most software allows you to flag bad epochs so they are excluded from calculations. Worst case, as with a hyperactive child, none of the EEG channels may contain usable data, and you will need to repeat the assessment. Where artifact only contaminates a few channels, you may base assessment on the clean channels (Demos, 2019).
Prevention is always better than cleanup. While evoked potentials increase recording variability and reduce its reliability, they minimally affect averaged data (Thompson & Thompson, 2015). A few extra minutes spent on preparation and client instruction will save you from throwing out large portions of your data.
Key Takeaways: Artifacts
Artifacts are non-brain signals that contaminate recordings. Physiological artifacts come from the client's body: muscle tension (EMG), eye movements, heartbeat (cardiac), sweat, and drowsiness. Exogenous artifacts come from external sources: 60-Hz powerline noise, movement, and electrode problems. Prevention through good preparation and client instruction is more effective than trying to clean up contaminated data after the fact.
Comprehension Questions
- A client's frontal channels show rhythmic spikes that repeat about once per second. What artifact should you suspect?
- How would you distinguish EMG artifact from genuine high-beta brain activity?
- What would you do if you noticed a client's alpha decreasing and theta increasing during an eyes-closed recording?
Recognizing Normal EEG Patterns
Before you can identify abnormal brain activity, you need to know what normal looks like. The healthy adult EEG has characteristic patterns that shift predictably with changes in state and behavior.
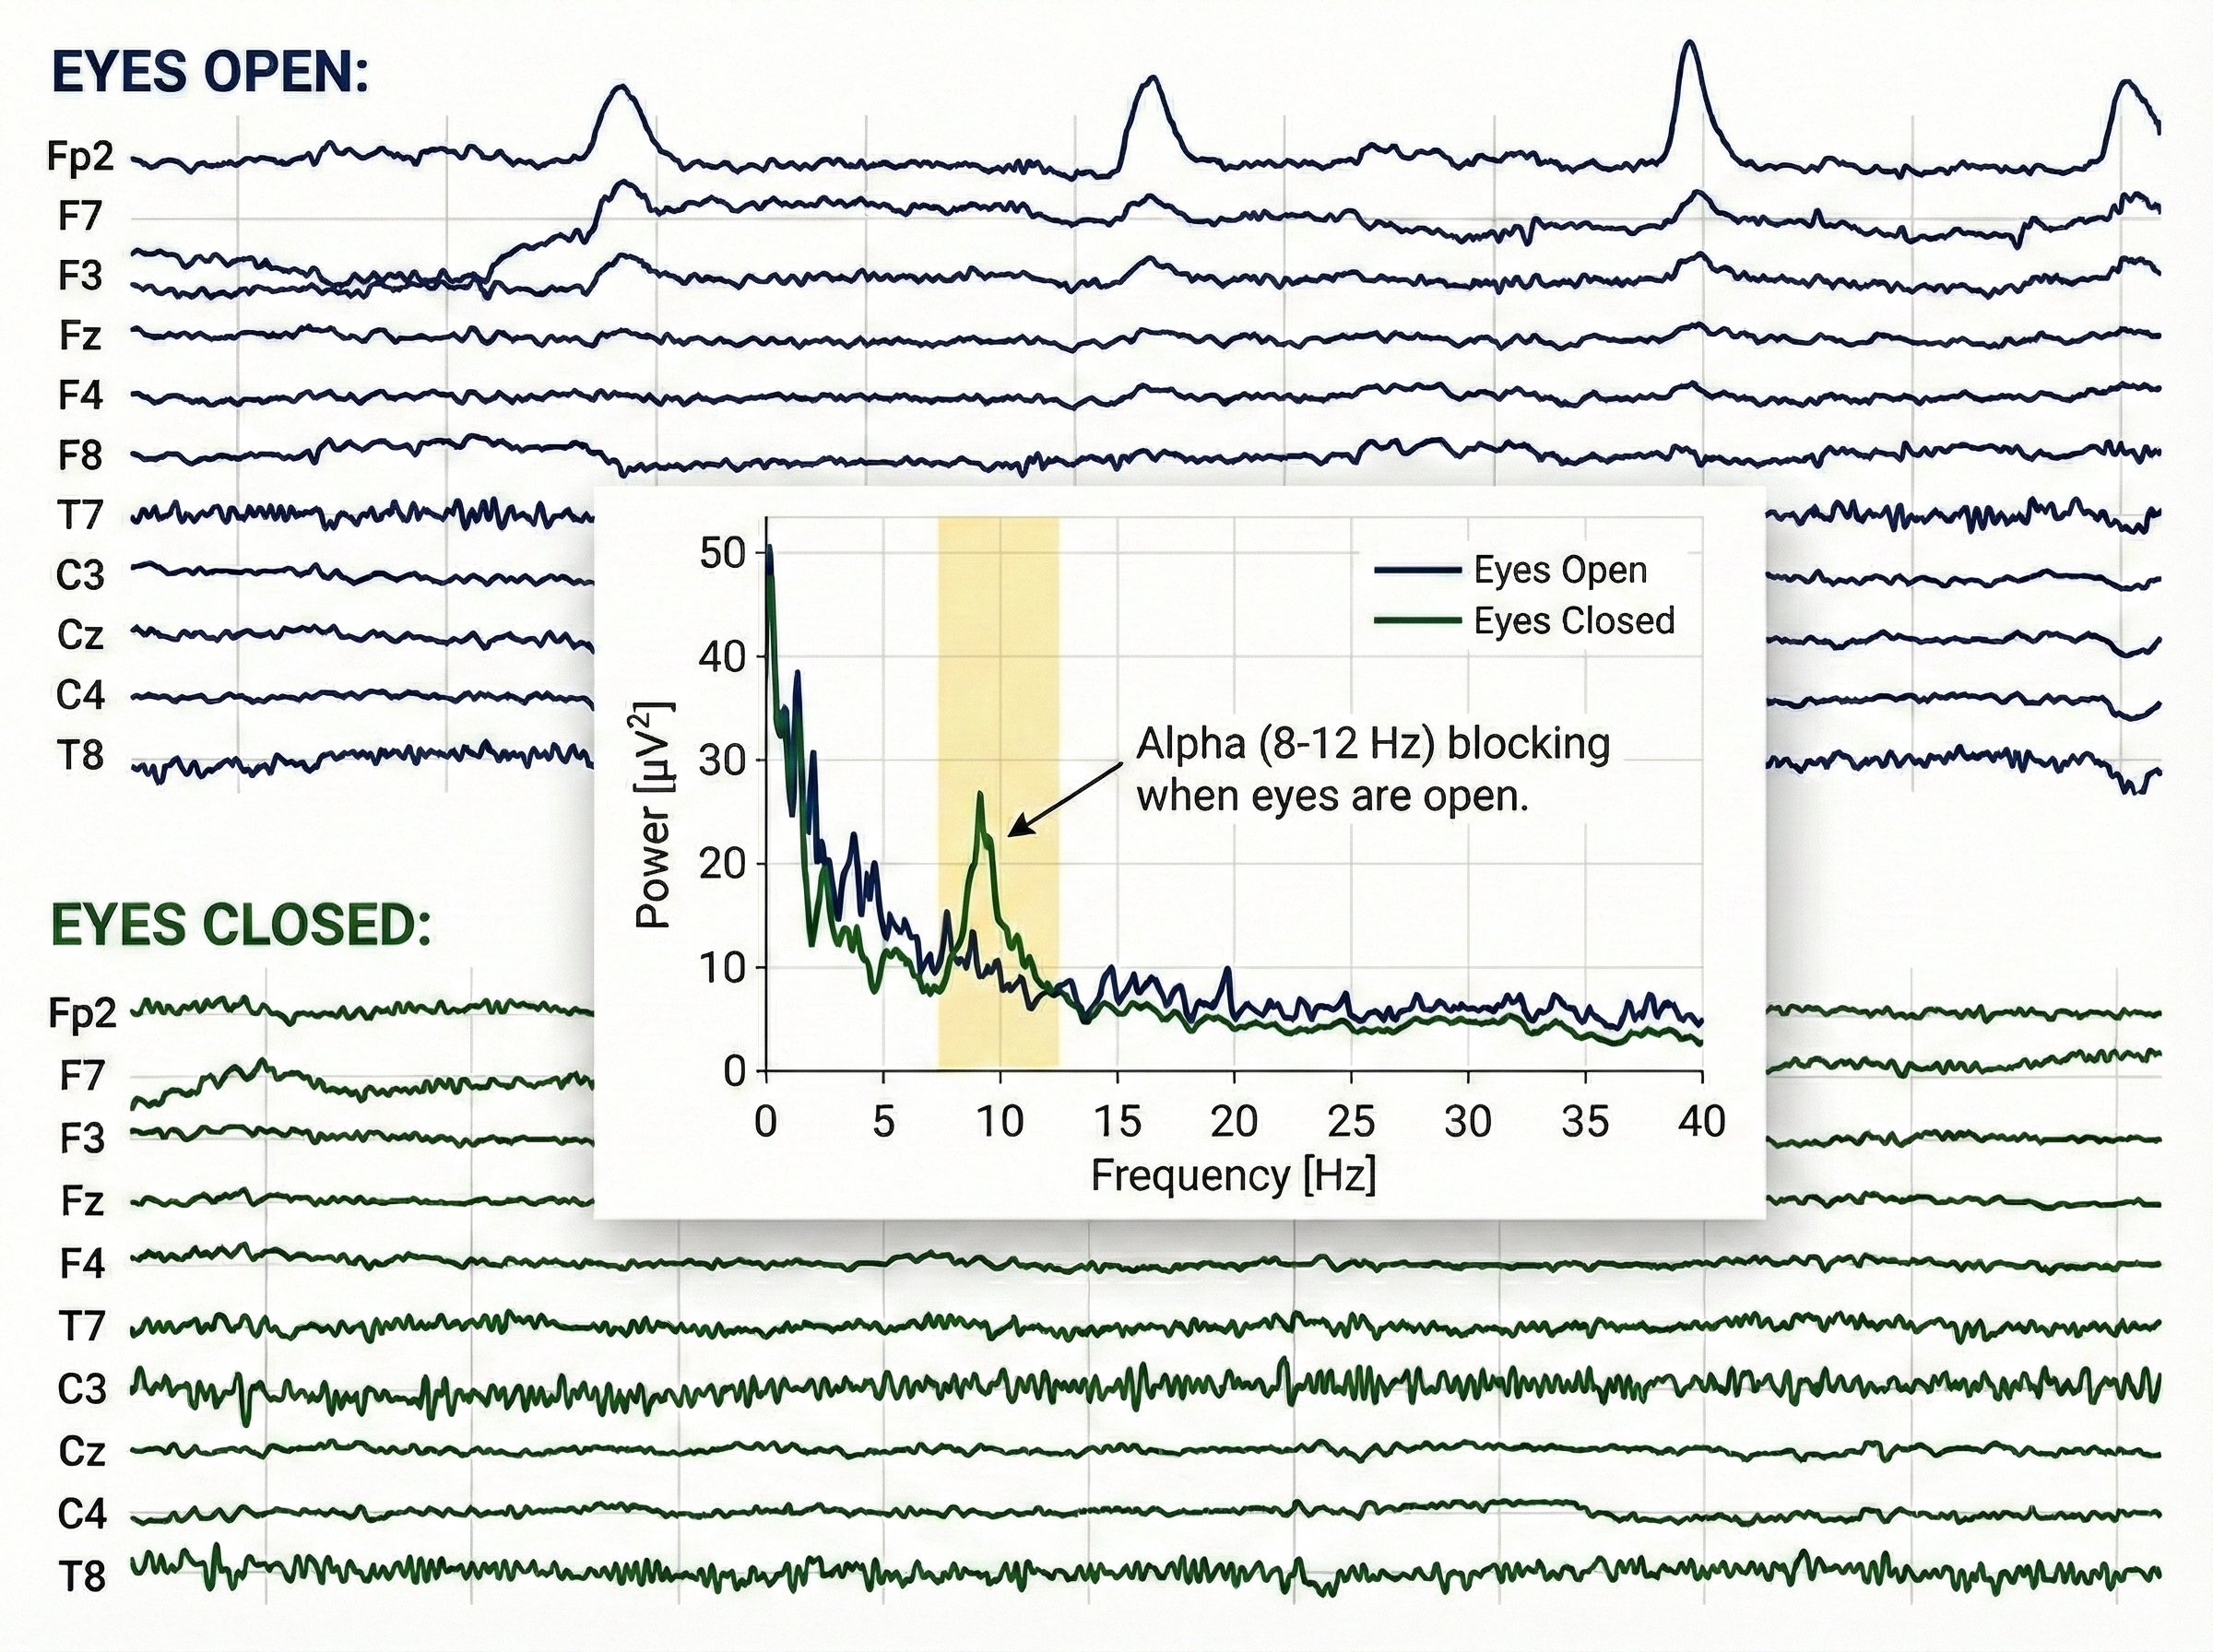
The Eyes-Open/Eyes-Closed Shift
One of the most reliable phenomena in EEG is alpha blocking. When a person sits quietly with eyes closed, prominent alpha waves (8-12 Hz) appear over the back of the head. The moment they open their eyes, this alpha rhythm dramatically decreases, replaced by lower-amplitude, faster activity. Hans Berger first described this phenomenon in 1929, and it remains a useful check that your recording system is working properly.
The video below demonstrates this classic pattern. Watch for alpha activity appearing with eyes closed around 14 seconds, then blocking when eyes open at about 45 seconds.
The Posterior Dominant Rhythm
The posterior dominant rhythm (PDR) is the strongest rhythm detected over the back of the head when eyes are closed. In healthy adults, the PDR typically runs around 10 Hz. A PDR slower than 9 Hz or faster than 11 Hz may indicate dysfunction or medication effects and warrants further investigation.
The alpha rhythm (8–12 Hz) is often described as the brain's conductor because it orchestrates the timing and flow of information across the cortex, much like a conductor keeps an orchestra in sync. Instead of merely "idling," alpha waves play an active role in inhibitory gating—effectively "quieting" irrelevant neural regions so that important signals can be processed without distraction. By establishing this precise temporal window, the alpha rhythm synchronizes communication between distant brain areas, ensuring that sensory inputs and cognitive tasks are integrated into a cohesive conscious experience.
Checking the PDR is a quick way to assess overall brain function. If a client's PDR is significantly slower than expected, consider whether medications, fatigue, or underlying conditions might explain the finding.
Clinical Application: The Telltale PDR
During Maria's initial assessment, Dr. Chen measured her posterior dominant rhythm at 8.2 Hz, noticeably slower than the typical 10 Hz. Rather than jumping to conclusions, Dr. Chen reviewed Maria's medication list and discovered she had recently started a new anti-anxiety medication. Many psychoactive drugs slow the PDR, so this finding likely reflected medication effects rather than brain dysfunction. Dr. Chen noted the baseline and planned to track whether the PDR changed as Maria's treatment progressed.
Drug Effects on the EEG
Medications and recreational substances can dramatically alter EEG patterns. Before interpreting any recording, you need to know what your client is taking.
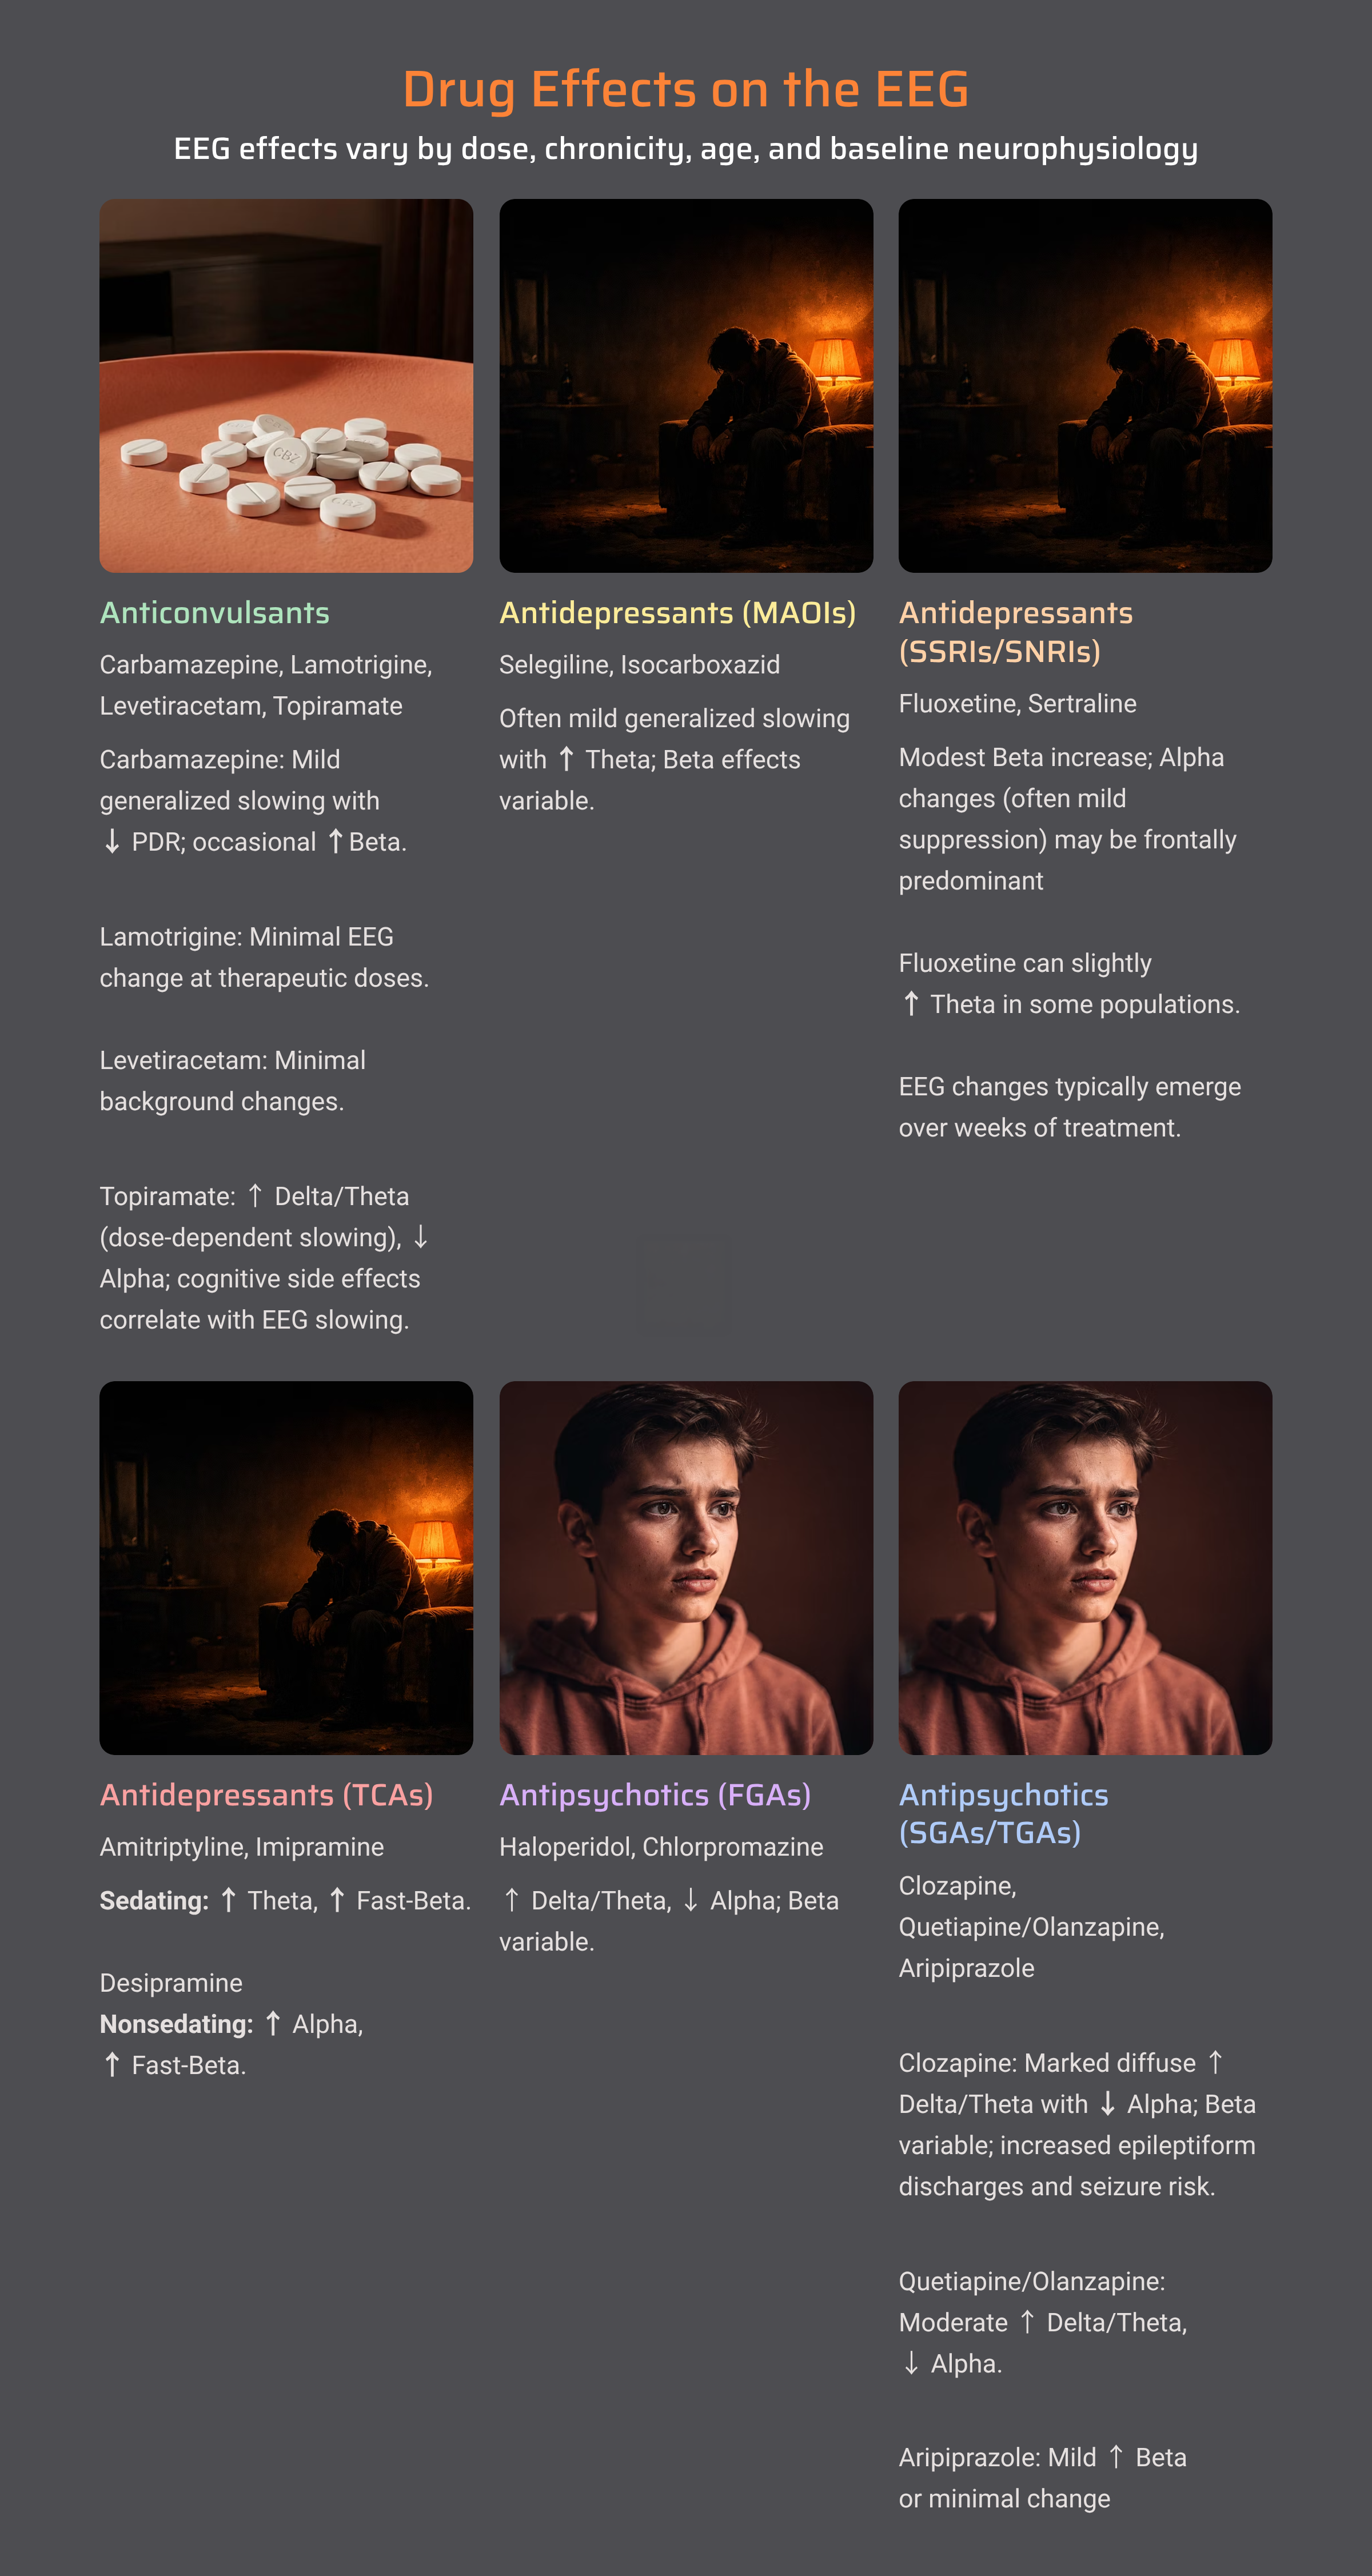
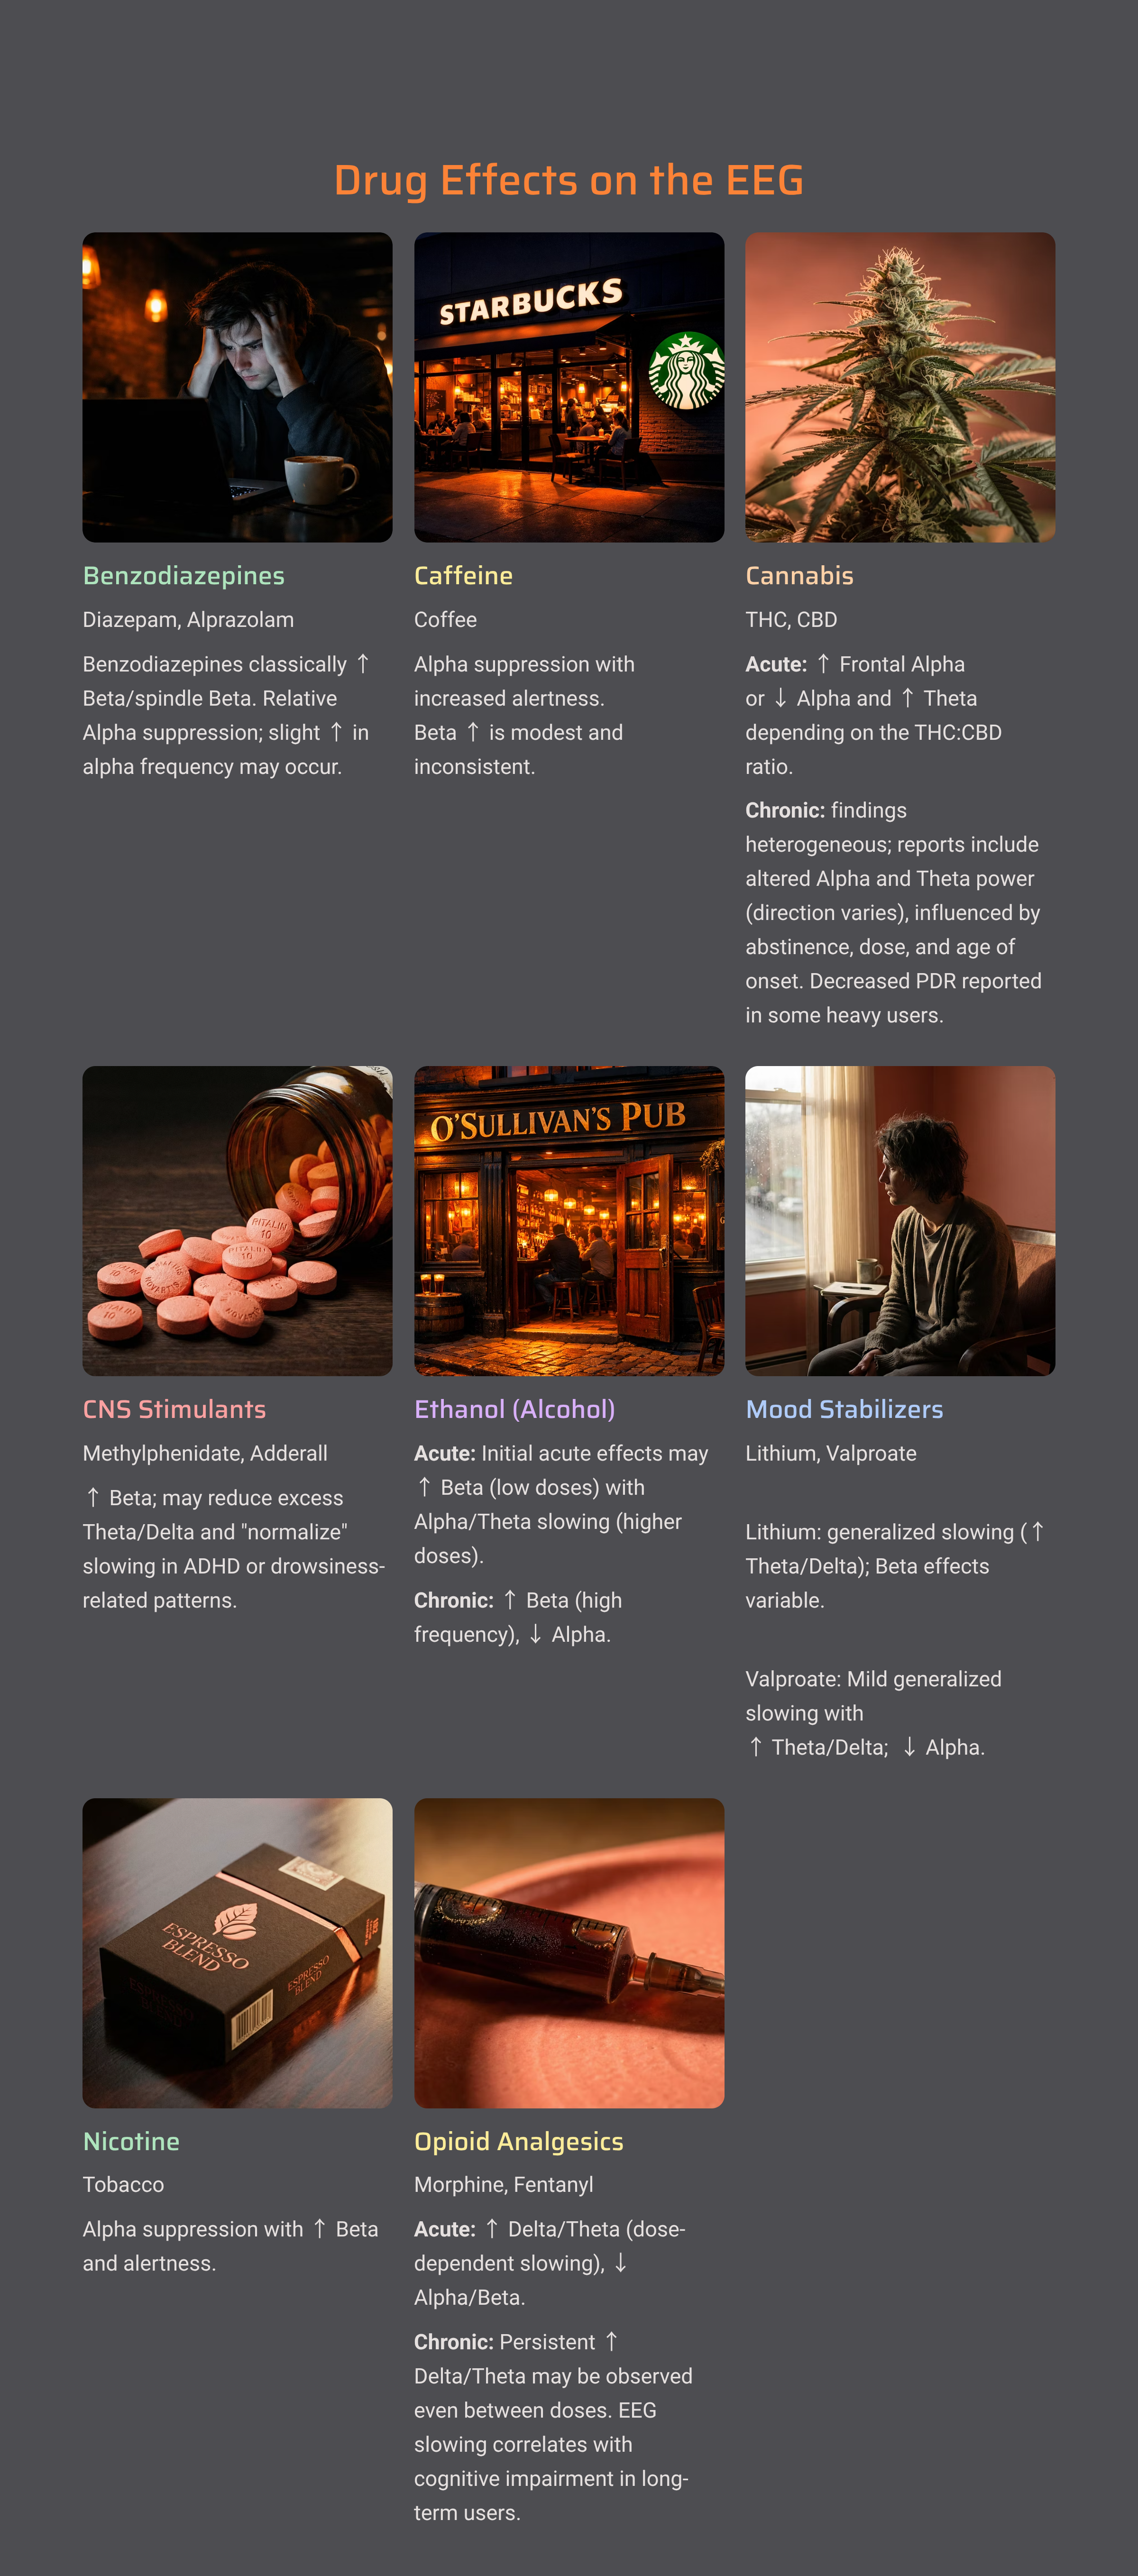
As a general rule, sedating substances (benzodiazepines, alcohol, opioids) tend to increase slow activity and may produce characteristic fast activity called beta spindles. Stimulants often increase fast activity and may reduce slower rhythms. Anticonvulsants have varied effects depending on the specific medication.
Always document all medications, supplements, and recent substance use before recording. This information is essential for accurate interpretation and helps you distinguish drug effects from genuine brain dysfunction.
Cutting Edge Topics in EEG Research
The field of EEG continues to evolve rapidly. Here are some developments worth watching.
Dry Electrode Technology
Traditional EEG requires conductive gel, which is messy and time-consuming. Researchers are developing dry electrodes that record without gel. While early versions produced noisier signals, recent advances have made dry electrodes viable for many applications, potentially reducing setup time from 30 minutes to just 5.
Machine Learning for Artifact Removal
Artificial intelligence can now identify and remove artifacts with impressive accuracy, catching subtle contamination that human reviewers might miss while preserving genuine brain signals that traditional methods might reject.
Wearable EEG
Consumer-grade EEG headsets are enabling brain monitoring outside the clinic. Clients can track their brain states at home, during work, or while sleeping. While data quality varies, the best wearable devices now approach laboratory standards for certain applications.
Glossary
10-10 System: an expanded electrode placement system with 75 sites for finer spatial resolution.
active electrode: an electrode placed over a site of interest to detect EEG signals.
alpha blocking: the reduction of alpha rhythm when eyes open or during mental effort.
alpha rhythm: 8-12 Hz activity associated with relaxed, eyes-closed wakefulness.
amplitude: the strength of an EEG signal, measured in microvolts.
artifact: non-brain electrical activity that contaminates EEG recordings.
bandpass filter: a filter that passes only frequencies within a specified range.
beta rhythm: 12-30 Hz activity associated with active thinking and attention.
bipolar recording: an EEG recording technique that measures the voltage difference between two adjacent active scalp electrodes, emphasizing localized electrical activity while canceling signals common to both sites.
channel (EEG channel): a single recording pathway representing the electrical signal obtained from one electrode site (or electrode pair), displayed as a continuous waveform of voltage over time.
coherence: a measure of how strongly two brain regions are communicating.
delta rhythm: 0.5-4 Hz activity dominant during deep sleep.
electrode: a sensor that detects electrical signals from the scalp.
electrode cap: a cap with electrodes pre-positioned at standard locations.
exogenous artifact: artifact from external sources like equipment or the environment.
filter: a device that selectively passes certain frequencies while blocking others.
gamma rhythm: activity above 30 Hz, associated with higher cognitive functions.
ground electrode: an electrode that provides a common baseline and helps eliminate noise.
high-pass filter: a filter that passes high frequencies while blocking low frequencies.
impedance: resistance to electrical current flow, measured in ohms.
inion: the bony prominence at the back of the skull.
International 10-20 System: a standardized system for electrode placement using 19 sites.
low-pass filter: a filter that passes low frequencies while blocking high frequencies.
microvolts (µV): millionths of a volt, the unit for measuring EEG amplitude.
montage: the arrangement of electrode pairings used for recording.
monopolar recording: an EEG recording technique (also called referential recording) that measures the voltage difference between an active electrode over a brain region and a reference electrode placed at an electrically neutral or distant location.
nasion: the depression at the bridge of the nose.
notch filter: a filter that removes a narrow frequency band, typically 50 or 60 Hz.
peak-to-peak: amplitude measured from the lowest valley to highest peak of a wave.
physiological artifact: artifact originating from the client's body.
posterior dominant rhythm (PDR): the strongest rhythm at the back of the head with eyes closed, typically around 10 Hz in adults.
preauricular point: a depression just in front of the ear used as a landmark for electrode placement.
Quantitative EEG (qEEG): digitized analysis of EEG amplitude across frequency bands, typically using 19 channels.
reference electrode: an electrode providing a comparison point for measuring voltage.
root mean square (RMS): a method of measuring amplitude that represents average signal energy.
theta rhythm: 4-8 Hz activity associated with drowsiness.
tragus: the small flap covering the ear opening.
transducer: a device that converts energy from one form to another.
vertex (Cz): the topmost point of the head, at the intersection of nasion-inion and preauricular lines.
Test Yourself
Click on the ClassMarker logo to take 10-question tests over this unit.

Review Flashcards on Quizlet
Click on the Quizlet logo to review chapter flashcards.

Visit the BioSource Software Website
BioSource Software offers Human Physiology, which satisfies BCIA's Human Anatomy and Physiology requirement, and Biofeedback100, which provides extensive multiple-choice testing over BCIA's Biofeedback Blueprint.

Essential Skills
Upon completing this unit, you should be able to demonstrate the following competencies:
1. Explain the EEG and neurofeedback to a client.
2. Explain skin preparation and electrode placement to a client, and obtain permission to monitor.
3. Identify the major sites of the 10-20 system using a tape measure and marking pencil.
4. Demonstrate skin preparation and electrode placement for scalp and earlobe sites.
5. Explain how to protect the client from infection transmitted by the sensor.
6. Measure electrode impedance and ensure values are sufficiently low and balanced.
7. Identify common artifacts in the raw EEG signal and explain how to minimize them.
8. Demonstrate how to instruct a client to utilize a feedback display.
9. Demonstrate a neurofeedback training session, including record keeping, goal setting, site selection, monitored frequency bands, baseline measurement, display and threshold setting, coaching, and debriefing.
10. Evaluate and summarize client progress during a training session.
Assignment
Now that you have completed this module, describe the difference between single-channel and 19-channel qEEG recording. When might each approach be most appropriate?
References
Andreassi, J. L. (2007). Psychophysiology: Human behavior and physiological response (5th ed.). Lawrence Erlbaum and Associates.
Demos, J. N. (2019). Getting started with neurofeedback (2nd ed.). W. W. Norton & Company.
Ferree, T. C., Luu, P., Russell, G. S., & Tucker, D. M. (2001). Scalp electrode impedance, infection risk, and EEG data quality. Clinical Neurophysiology, 112, 536-544. https://doi.org/10.1016/s1388-2457(00)00533-2
Fisch, B. J. (1999). Fisch and Spehlmann's EEG primer (3rd ed.). Elsevier.
Jasper, H. H. (1958). The ten-twenty electrode system of the International Federation. Electroencephalography and Clinical Neurophysiology, 10, 371–375.
Klass, D. W. (2008). The continuing challenge of artifacts in the EEG. EEG artifacts. American Society of Electroneurodiagnostic Technologists, Inc.
Lau, T. M., Gwin, J. T., & Ferris, D. P. (2012). How many electrodes are really needed for EEG-based mobile brain imaging? Journal of Behavioral and Brain Science, 2(3), 387-393. https://doi.org/10.4236/jbbs.2012.23044
Luck, S. J. (2014). An introduction to the event-related potential technique (2nd ed.). MIT Press.
Niedermeyer, E., & da Silva, F. L. (Eds.). (2005). Electroencephalography: Basic principles, clinical applications, and related fields (5th ed.). Lippincott Williams & Wilkins.
Teplan, M. (2002). Fundamentals of EEG measurement. Measurement Science Review, 2(2), 1–11.
Thomas, C. (2007). What is a montage? EEG instrumentation. American Society of Electroneurodiagnostic Technologists, Inc.
Thompson, M., & Thompson, L. (2015). The biofeedback book: An introduction to basic concepts in applied psychophysiology (2nd ed.). Association for Applied Psychophysiology and Biofeedback.