EMG Hardware
What You Will Learn
This chapter demystifies the electromyograph, transforming it from an intimidating black box into a tool you understand and can use with confidence. You will learn how surface electrodes detect the tiny electrical signals that muscles produce during contraction, and why proper skin preparation and electrode placement are essential for accurate readings. You will discover how differential amplifiers separate the muscle signal from environmental noise, why bandpass and notch filters help clean up recordings, and how integration methods convert raw electrical activity into meaningful microvolt values. The chapter explores common artifacts that can contaminate your recordings, from 50/60 Hz powerline interference to ECG contamination from the heart, and teaches you practical strategies to identify and minimize each one. By the end, you will be able to perform tracking tests, interpret normal values, select appropriate display settings, and troubleshoot common problems. Whether you are conducting relaxation training, neuromuscular rehabilitation, or research, this knowledge will make you a more effective practitioner.
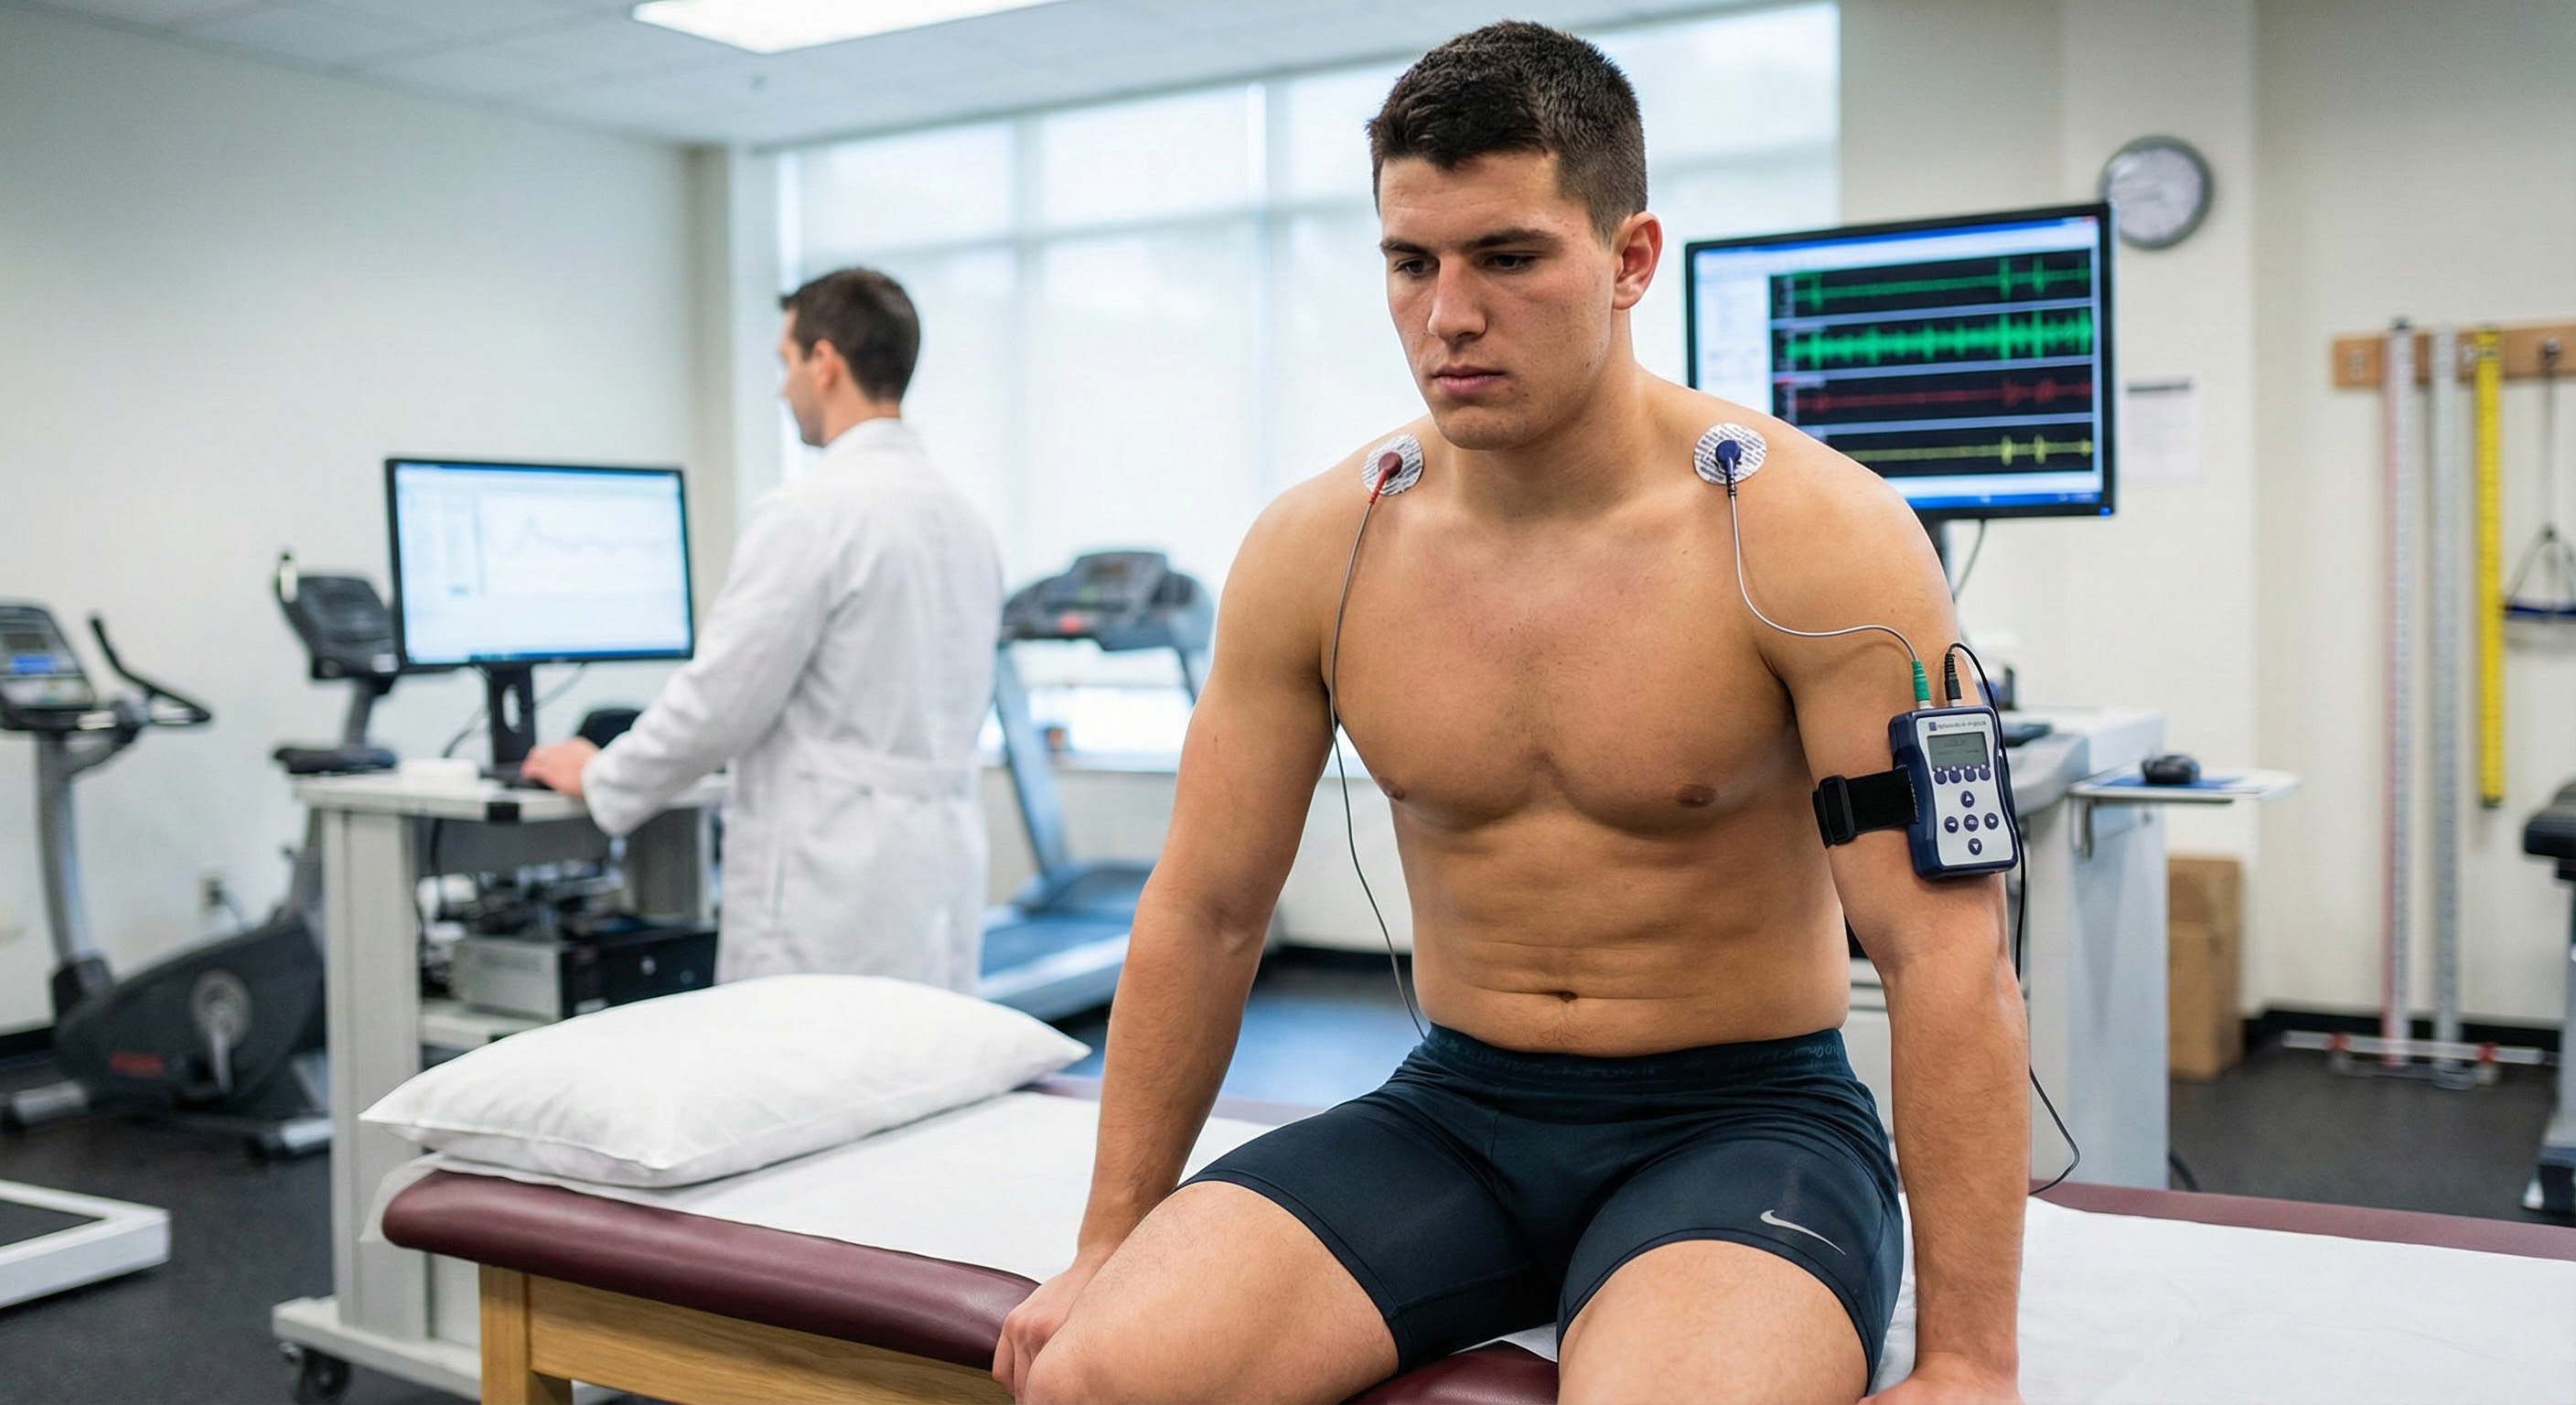
Biofeedback instruments supplement our awareness of biological processes ranging from the contraction of the tibialis anterior muscle in the leg to the synchronous firing of cortical neurons. Hardware provides immediate and accurate information about our performance. Signals are detected, processed and quantified, and displayed (Peek, 2016). Beginners often view biofeedback equipment as intimidating "black boxes" that stand between them and treating their patients.
Why should a psychologist or nurse understand filter settings or skin-electrode impedances? Practical knowledge about these black boxes allows us to make informed purchases, use instruments effectively, and recognize malfunctions.
Technicians and their supervisors need to understand the science, instrumentation concepts, and protocols that are the foundation of biofeedback. A technician who does not know what a box does cannot provide safe and effective training.
Fixed vs. Selectable Features: A Roadmap
Here is a helpful way to think about what is inside an electromyograph. Some features are fixed, meaning they are built into the hardware and work automatically without any decisions on your part. Others are selectable, meaning you actively choose or adjust them during a session. Fixed features include the differential amplifier that rejects noise common to both active electrodes, the method of rectification that converts the AC signal to positive values you can sum, the differential input impedance that ensures most of the electrode signal reaches the amplifier, the sampling rate that captures enough data points to reconstruct your signal accurately, the bit depth that determines how finely the instrument distinguishes between voltage levels, and optical isolation circuits that protect clients from electrical shock. You will never flip a switch or click a setting to activate these features because they operate behind the scenes every time you power on the device. Selectable features, by contrast, require your clinical judgment. You choose the filter bandpass (narrow or wide) based on noise conditions, decide whether to engage the notch filter to reduce powerline interference, prepare the skin to achieve low and balanced skin-electrode impedance, and adjust display settings like vertical scale and display speed to provide useful feedback for your client.
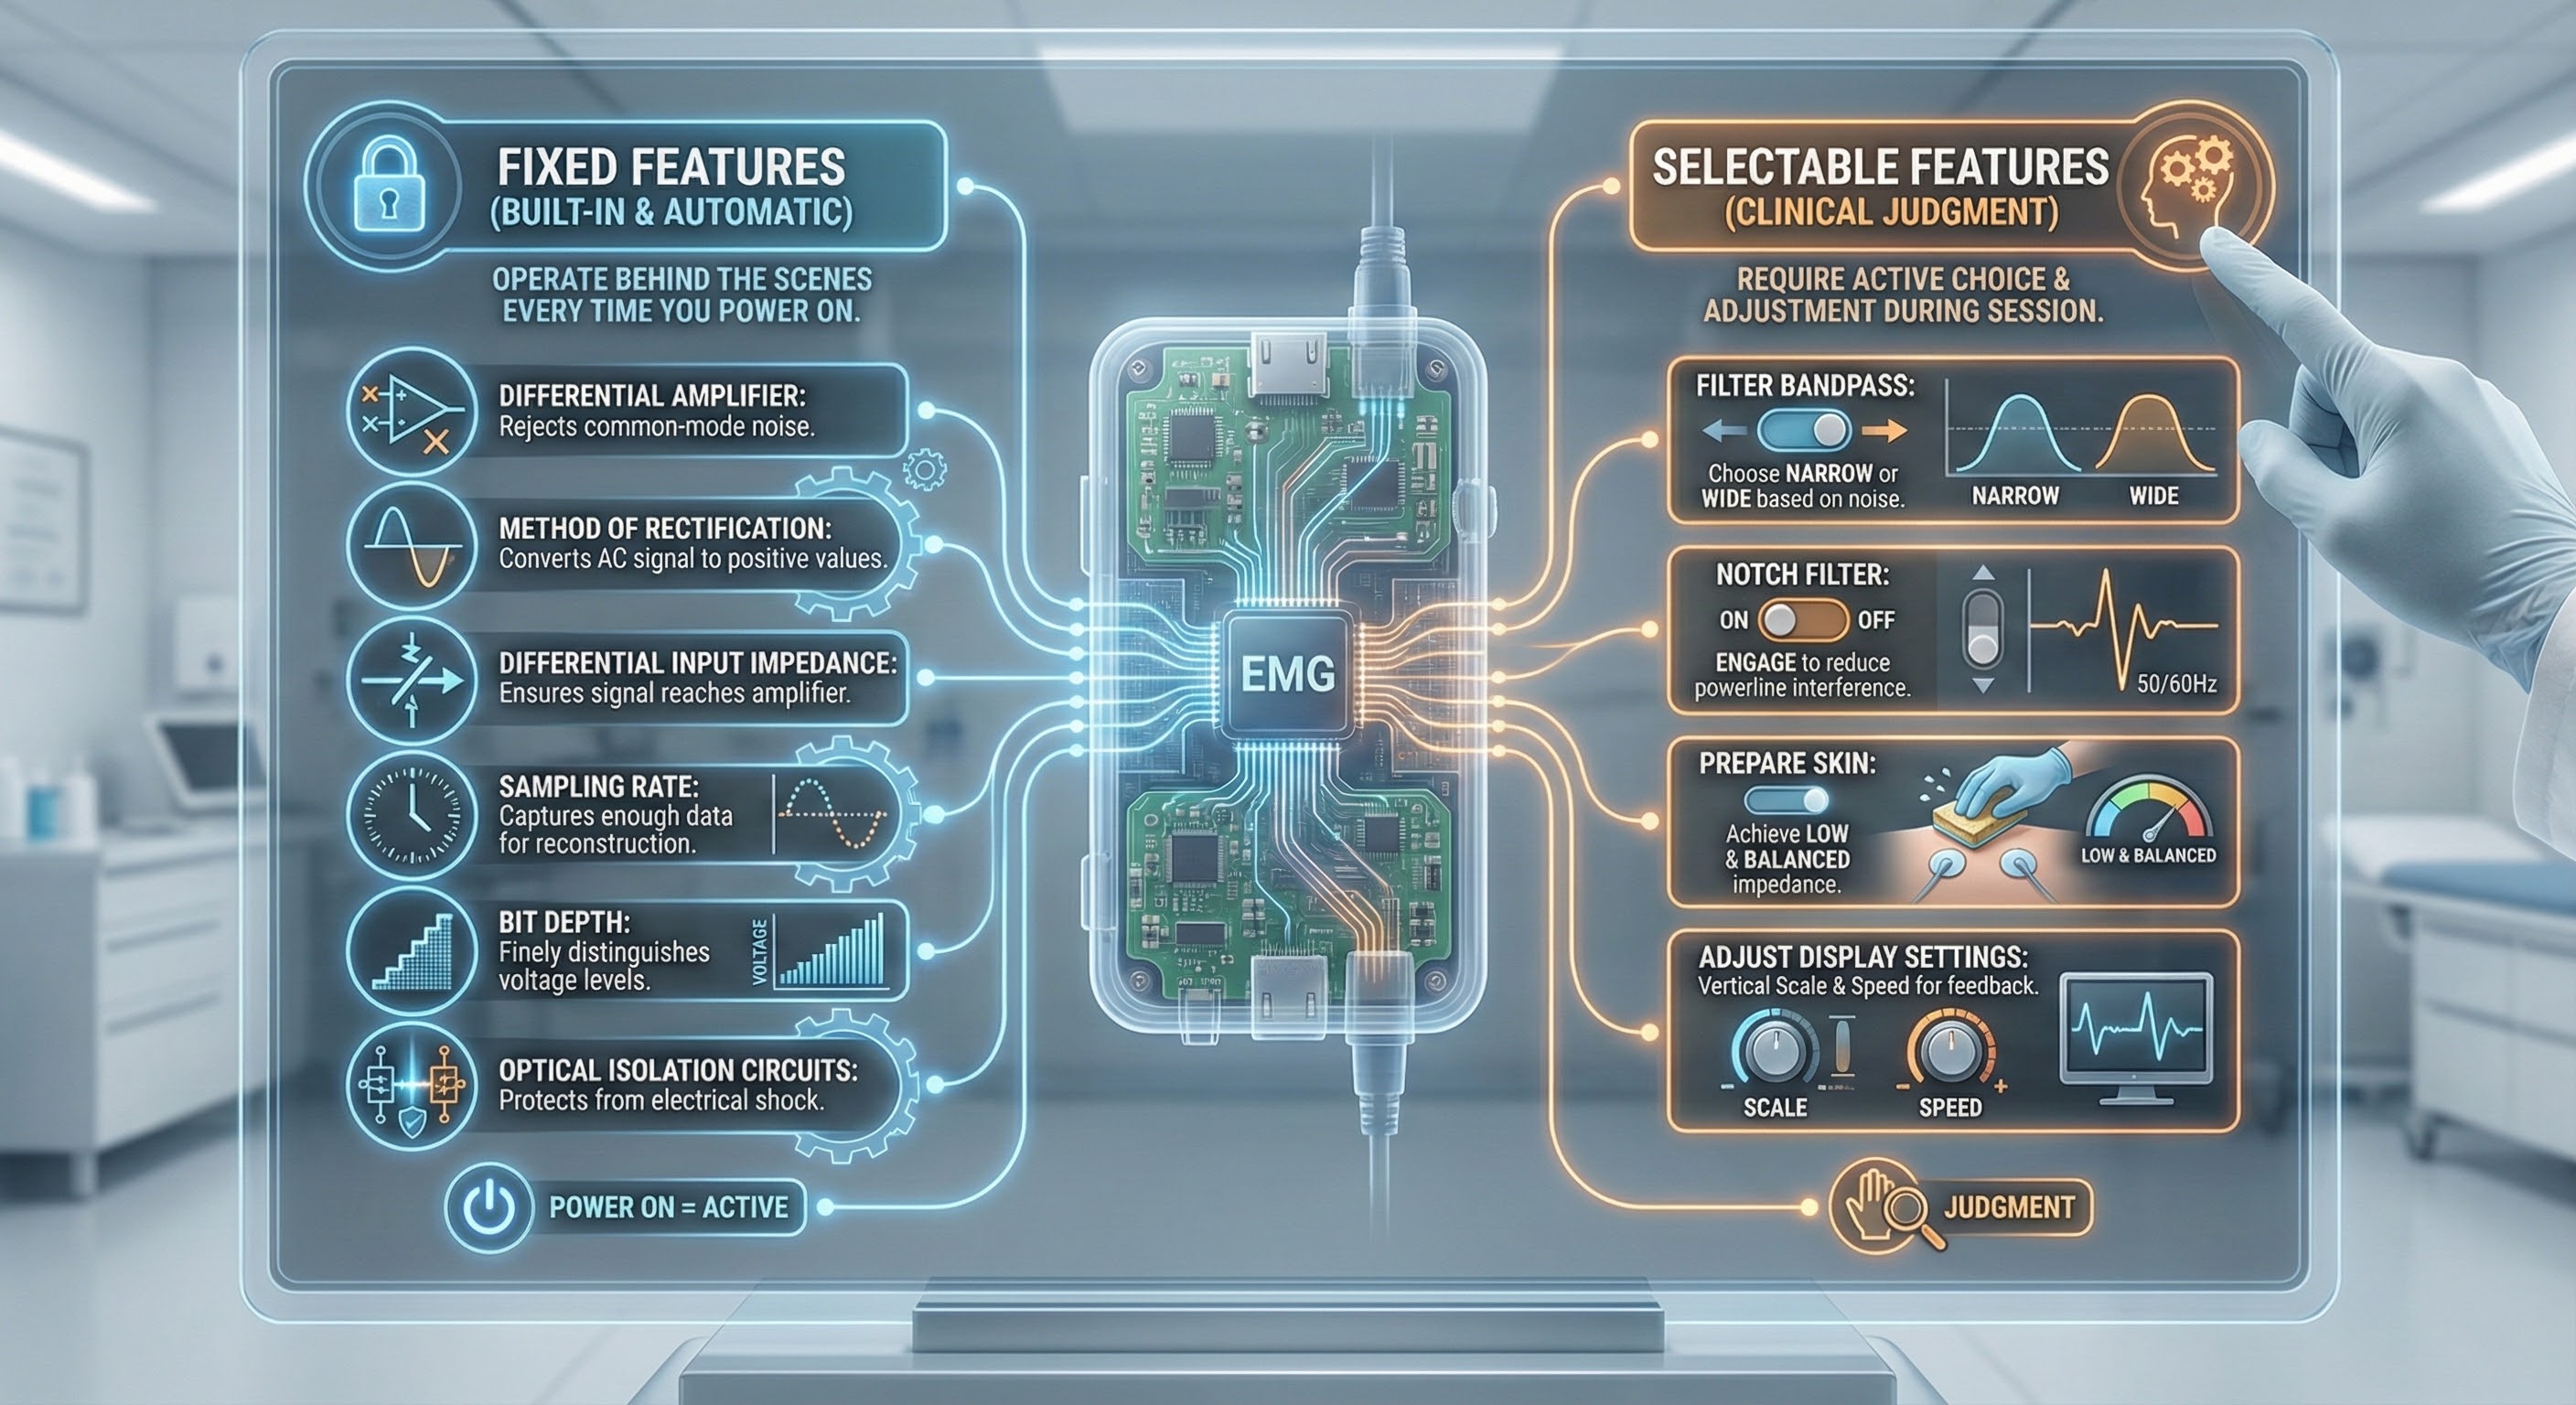
Why should you care about features you cannot change? Because understanding them helps you appreciate what the instrument does for you and why it costs what it costs. A high common-mode rejection ratio means your device is working hard to subtract environmental noise from the muscle signal, giving you cleaner data you can trust. Adequate sampling rate and bit depth mean the electromyograph captures fine-grained detail in muscle activity rather than producing a crude approximation. Optical isolation means you can confidently attach electrodes to a client knowing the device meets safety standards. When you understand these built-in protections and capabilities, you can make smarter purchasing decisions, troubleshoot problems more effectively, and explain to clients why the readings on the screen actually mean something. The fixed features are the foundation; the selectable features are where your clinical skill comes into play.
Although this unit uses the electromyograph to illustrate instrumentation concepts, most of this discussion also applies to electroencephalographs. We will discuss instrumentation for each of the major biofeedback modalities in later units.
BCIA Blueprint Coverage
This unit addresses Descriptions of the most commonly employed biofeedback modalities: SEMG (III-A), Sources of artifact (III-B), and Essential electronic terms and concepts for biofeedback applications (III-D).
This unit covers Biological Signals, Electrodes, Site Preparation, Impedance Testing, Signal Processing, Biofeedback Display Settings, Display Options, Shape Performance Using a Threshold, Artifacts, Tracking Tests, Normal Values, and Computers in Biofeedback.
🎧 Listen to the Full Chapter Lecture
Biological Signals
Biofeedback instruments measure performance directly or indirectly. While a muscle sensor directly monitors voltage sources like skeletal muscles, it indirectly monitors muscle contraction since an electromyograph does not measure force, movement, or range of motion. The electrical signal is linearly related to isometric muscle contraction, during which muscle length is constant (Peek, 2016; Stern et al., 2001).
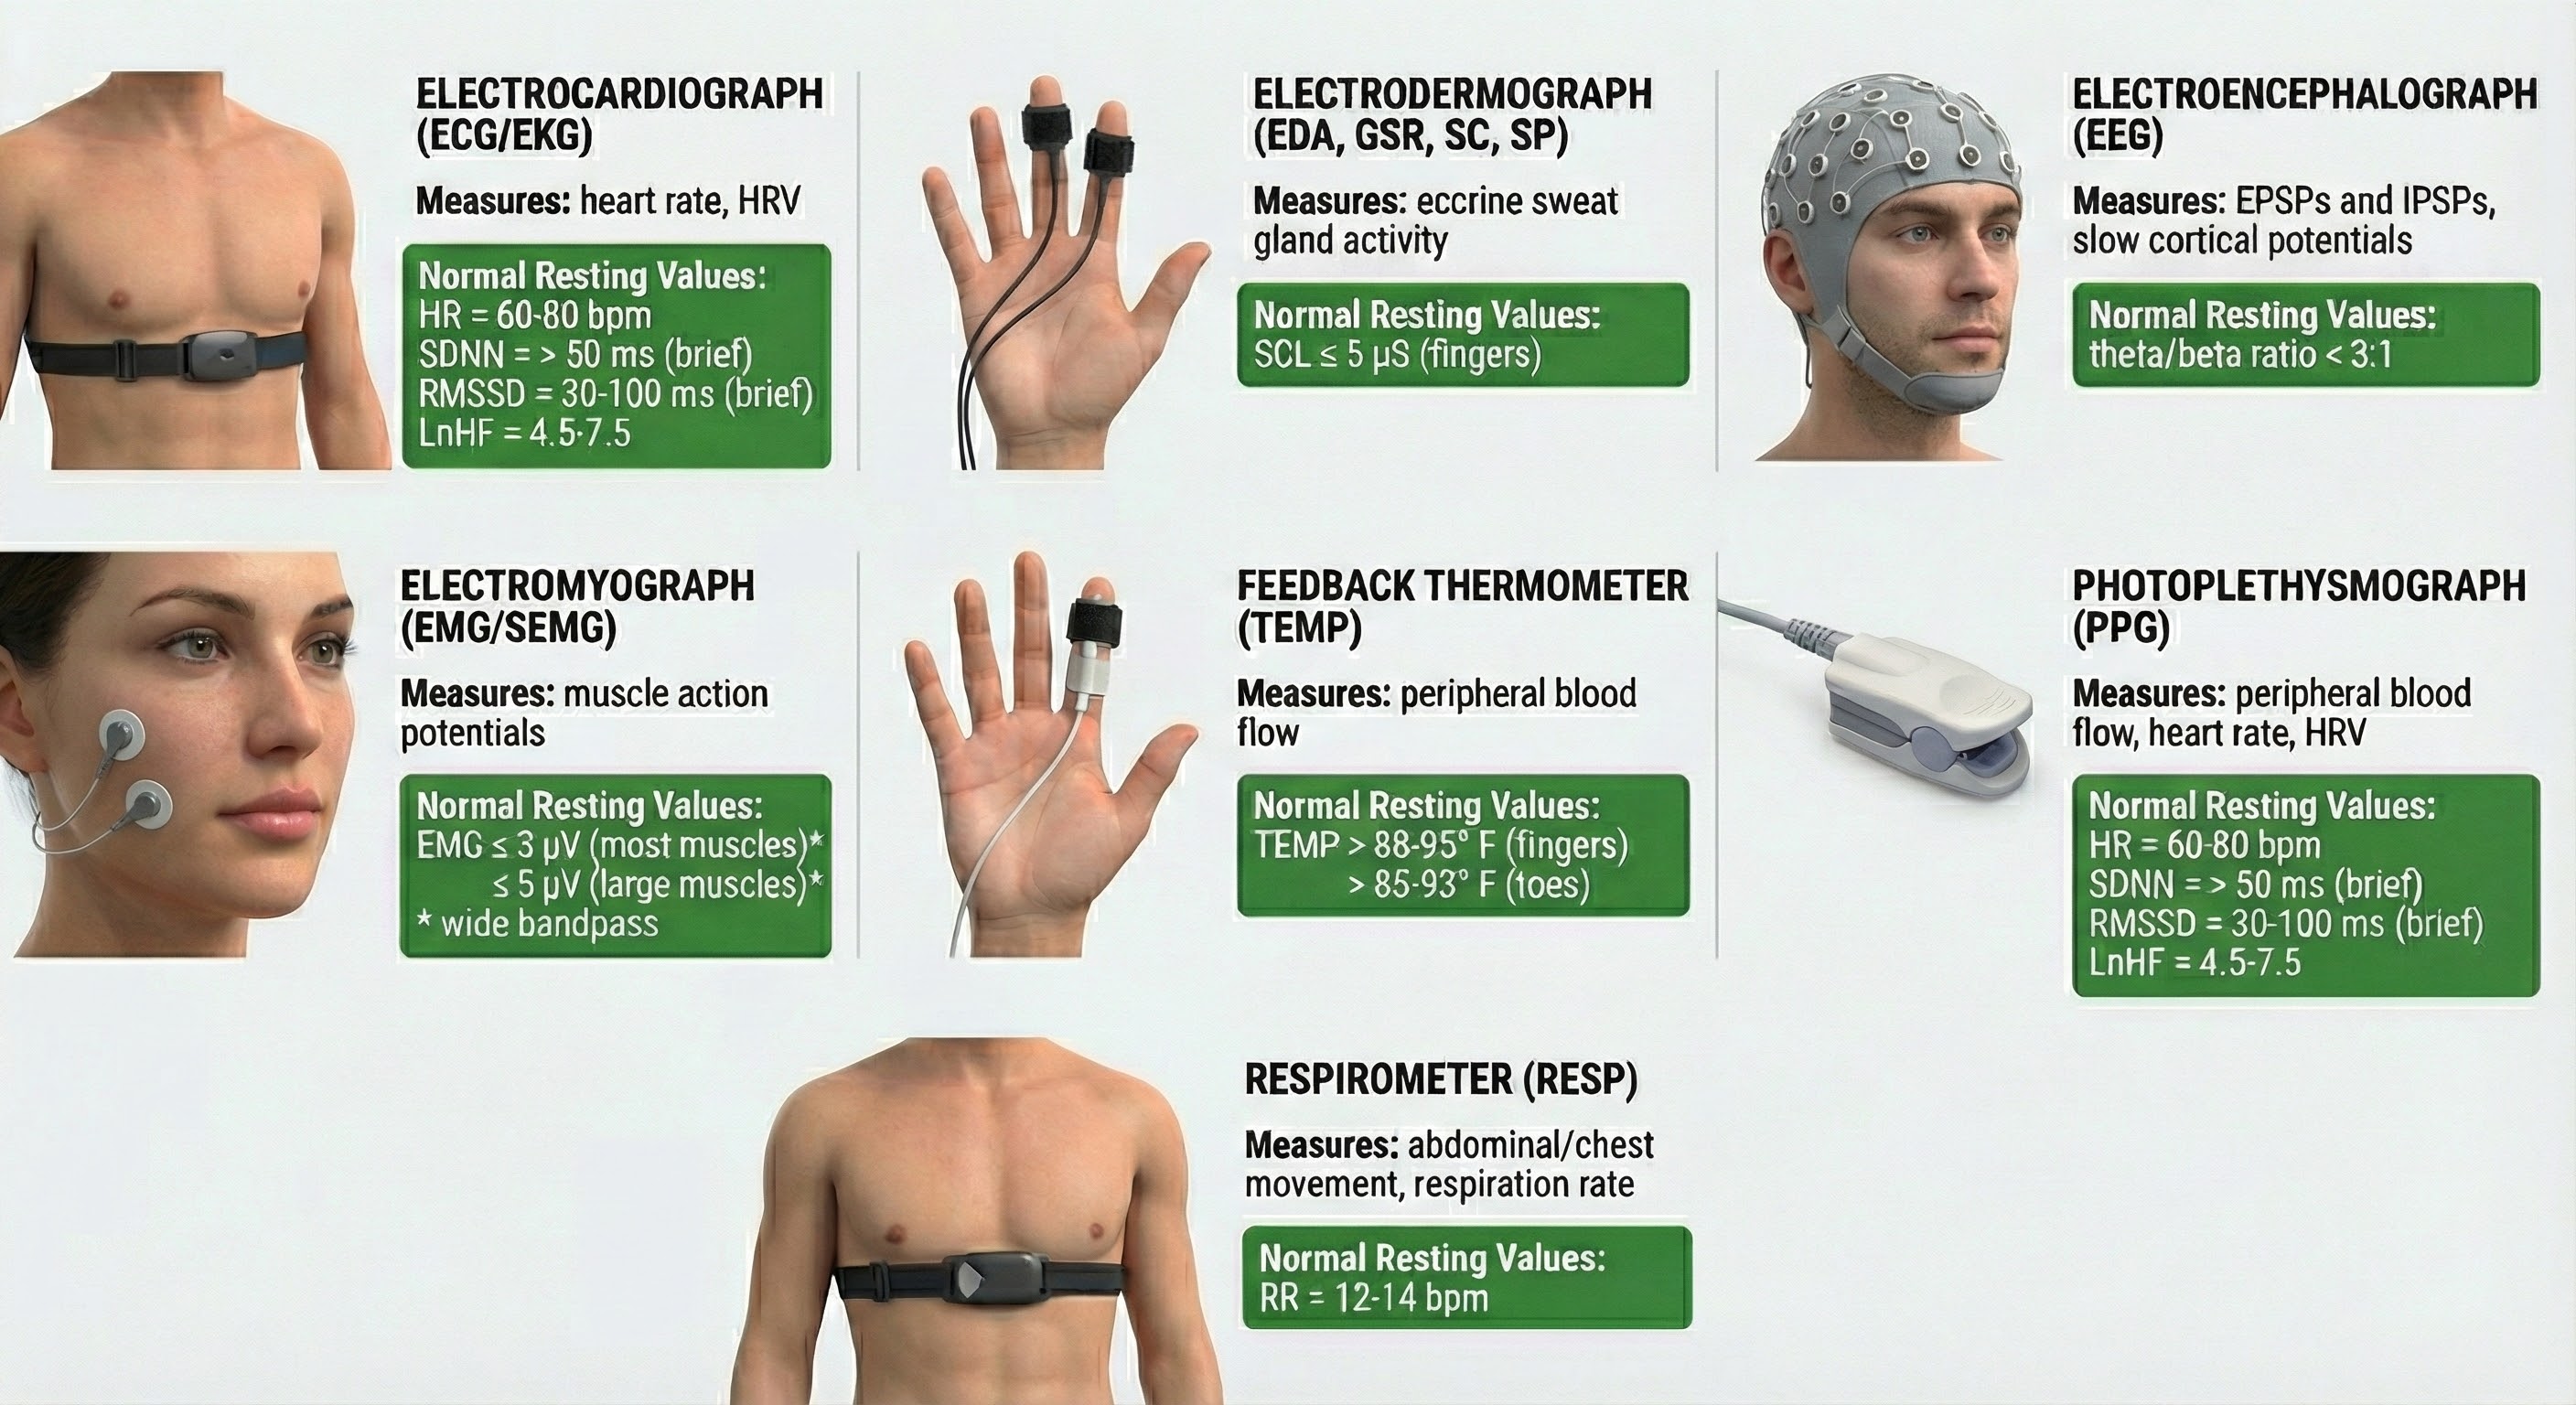
Signals we measure directly include the EEG, ECG, and SEMG.
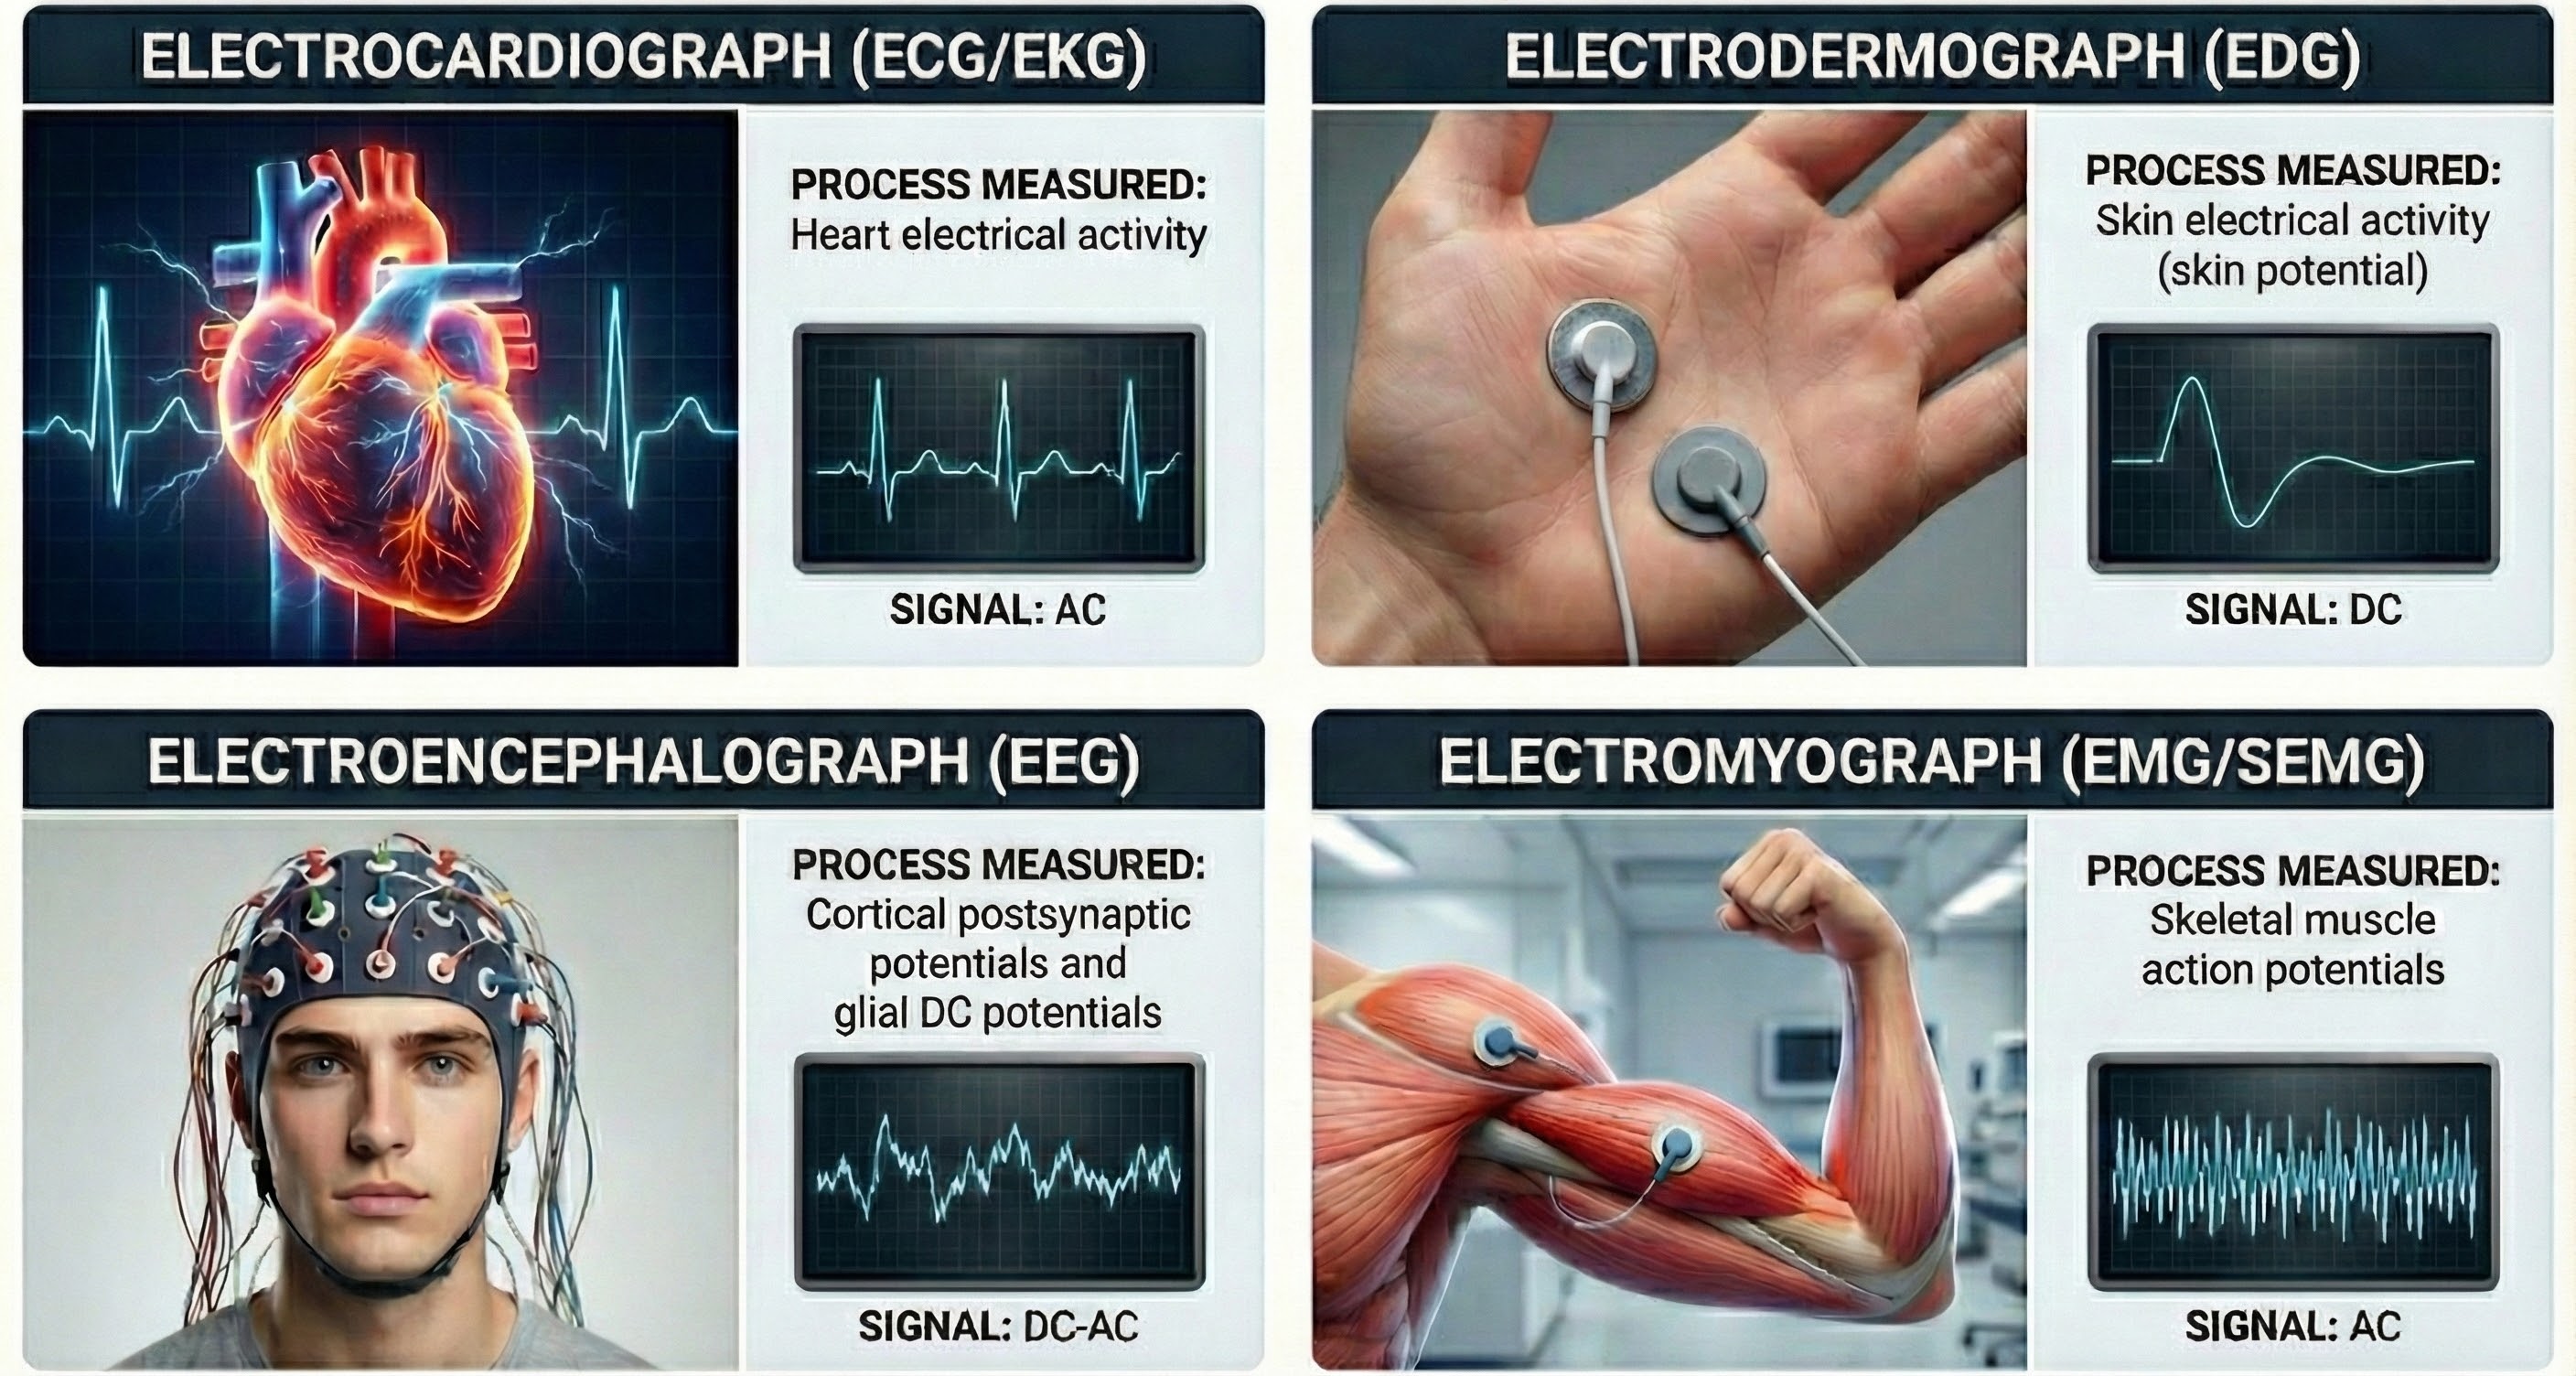
In contrast, a skin sensor registers temperature changes indirectly as shifts in its electrical resistance. Signals we measure indirectly include skin temperature, skin conductance, respiration, and blood volume pulse.
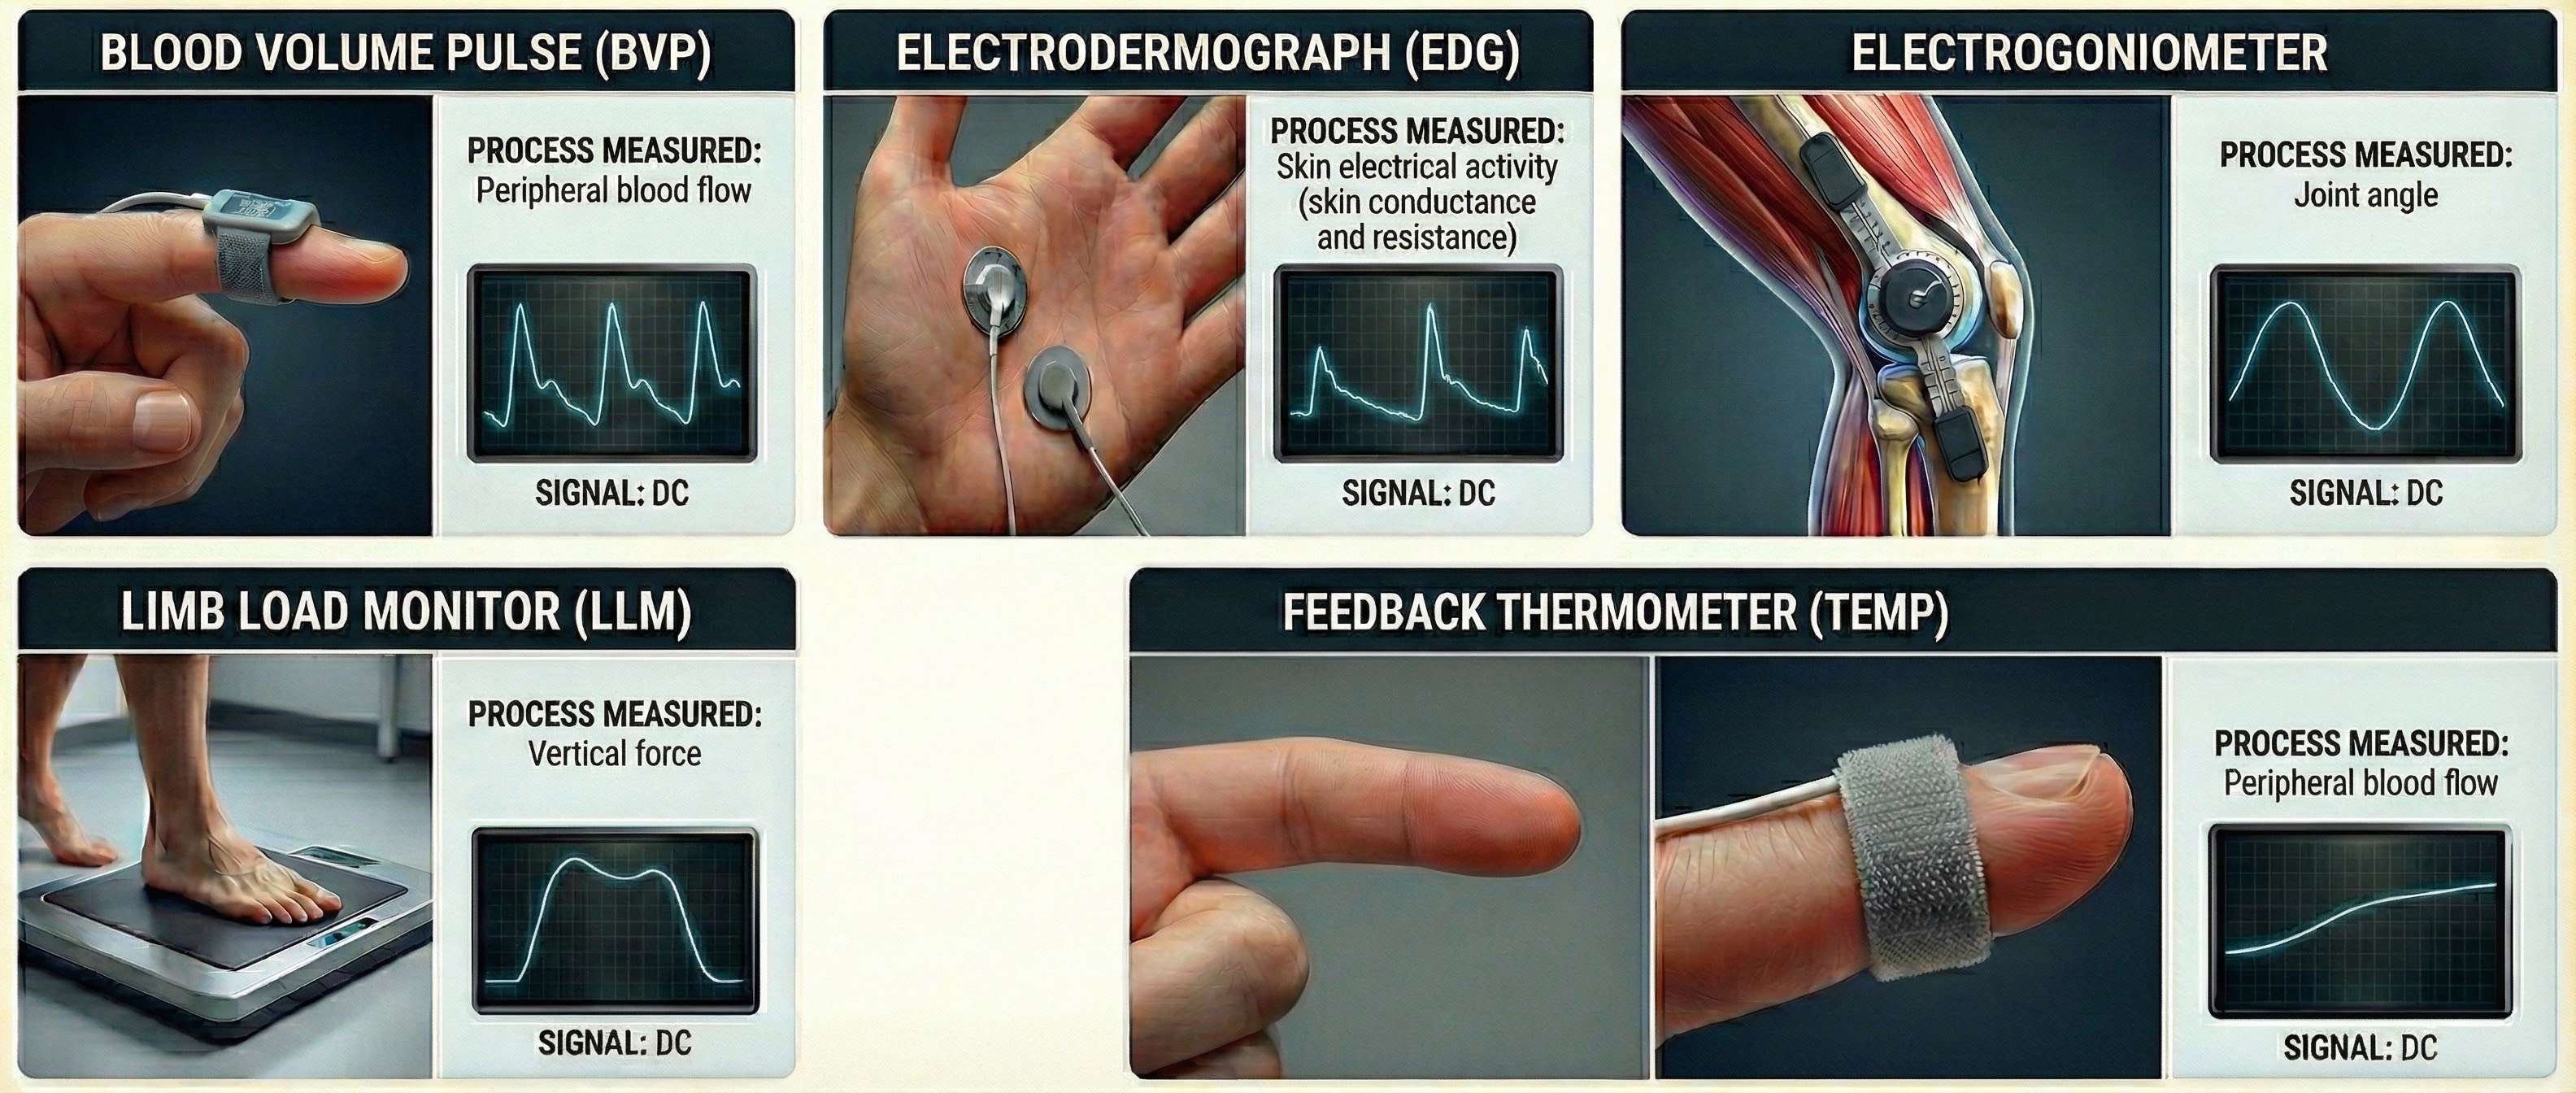
Biofeedback instruments measure some signals directly (EEG, ECG, SEMG) and others indirectly (temperature, skin conductance). The SEMG signal is linearly related to isometric muscle contraction but does not measure force or movement directly.
Electrodes
Electrodes detect biological signals. They are also transducers since they convert energy from one form to another. Graphic © Thought Technology Ltd.
Consider how surface EMG (SEMG) electrodes work. Muscle fibers must become more positive inside (depolarize) before contracting. This positive shift produces a current of ions (muscle action potentials) that travels through the fluid surrounding body cells. Since the interstitial fluid is a superb conductor, SEMG electrodes can detect potentials from remote motor units. This process is called volume conduction.
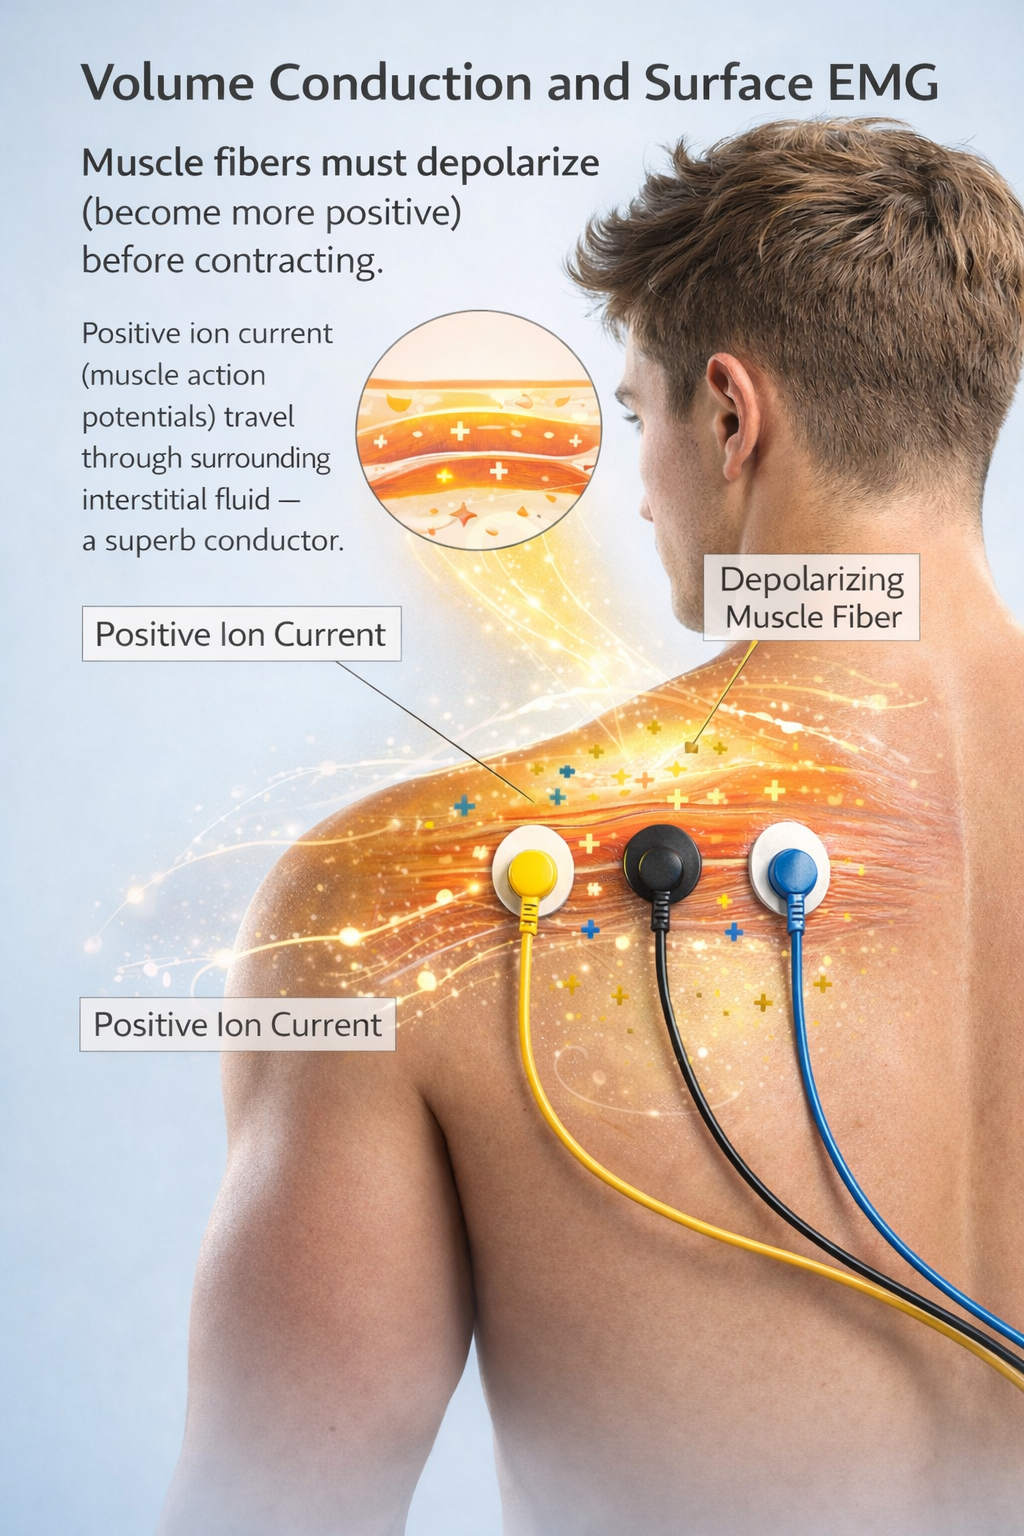
Electrodes transform a current of ions into a current of electrons that flows through the cable into an electromyograph's input jack. Check out the YouTube video Muscle Contraction, It's so Easy!!!
Signal strength is lost during volume conduction. Whereas a muscle action potential is measured in millivolts or thousandths of a volt, a volume-conducted signal that reaches SEMG electrodes has been reduced to microvolts or millionths of a volt, particularly by the absorption of its higher frequencies by intervening tissue (Montgomery, 2004).
Floating Skin Electrodes
The floating skin electrode is the industry standard for surface measurement of electrical signals. This design minimizes movement artifact, a false signal produced when an electrode detaches from the skin, eliminating direct contact between metal and skin. Graphic © Thought Technology Ltd.

A recessed metal disk is filled with an electrolyte, a conductive gel or paste. The electrolyte maintains contact between electrode metal and skin even during moderate patient movement.

Pre-Gelled Electrodes
Pre-gelled disposable snap-on self-adhesive electrodes save preparation time, ensure the correct amount of gel, and reduce the risk of infection transmission. Graphic © Thought Technology Ltd.
How SEMG Electrodes Work
When a SEMG electrode is filled with an electrolyte, the electrode metal donates ions to the electrolyte. In turn, the electrolyte contributes ions to the metal surface. Signal conduction succeeds as long as electrode and electrolyte ions are freely exchanged.
However, conduction breaks down when chemical reactions produce separate positive and negative charge regions where the electrode and gel make contact. When an electrode is polarized, ion exchange is reduced, and impedance increases, weakening the signal reaching the electromyograph. This problem can develop during routine clinical use. Silver/silver-chloride or gold electrodes resist polarization.
Why Do We Prefer Three Electrodes?
At least two electrodes, designated active and reference, are needed to measure the SEMG signal. These resemble a dipole antenna used to receive FM broadcasts.
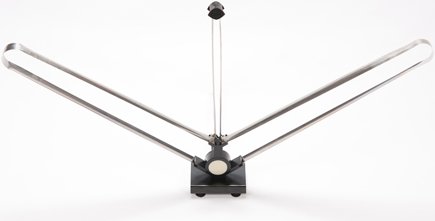
We place the active electrode over a target muscle and the reference electrode over a less active site. Since our electrodes should see different amounts of SEMG activity (the active electrode should detect more energy), a voltage should develop between them. An electromyograph processes this voltage. Graphic © Delsys Inc.
A clinician must know sufficient muscle anatomy (location) and kinesiology (action) to correctly position active and reference electrodes.
Active electrodes must be placed along the target muscle belly (central region) to record the strongest signal.
🎧 Mini-Lecture: Sensor Placement
Electrode placement near a muscle's insertion into a tendon or offset to the side will reduce the strength of the EMG signal. Graphic adapted from AdvancerTechnologies.com.
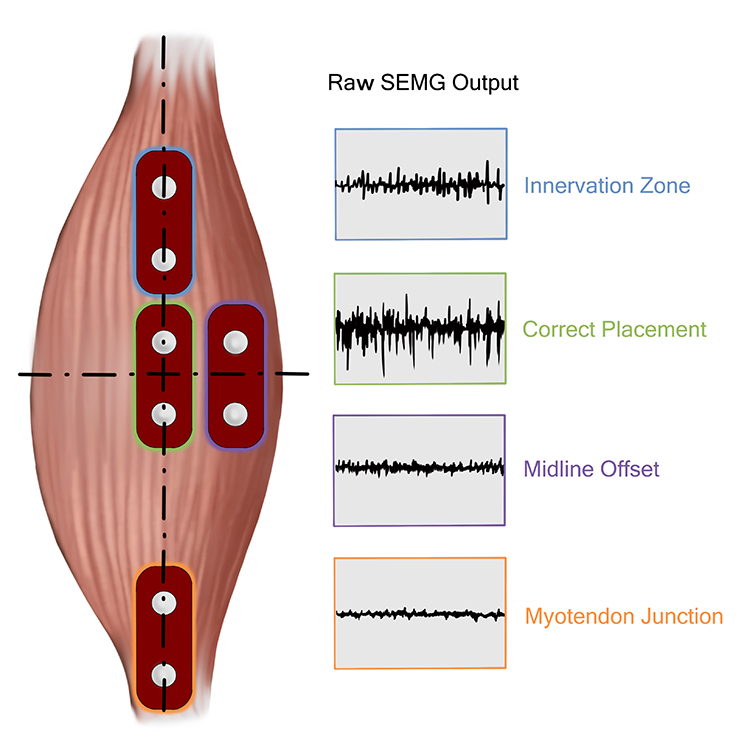
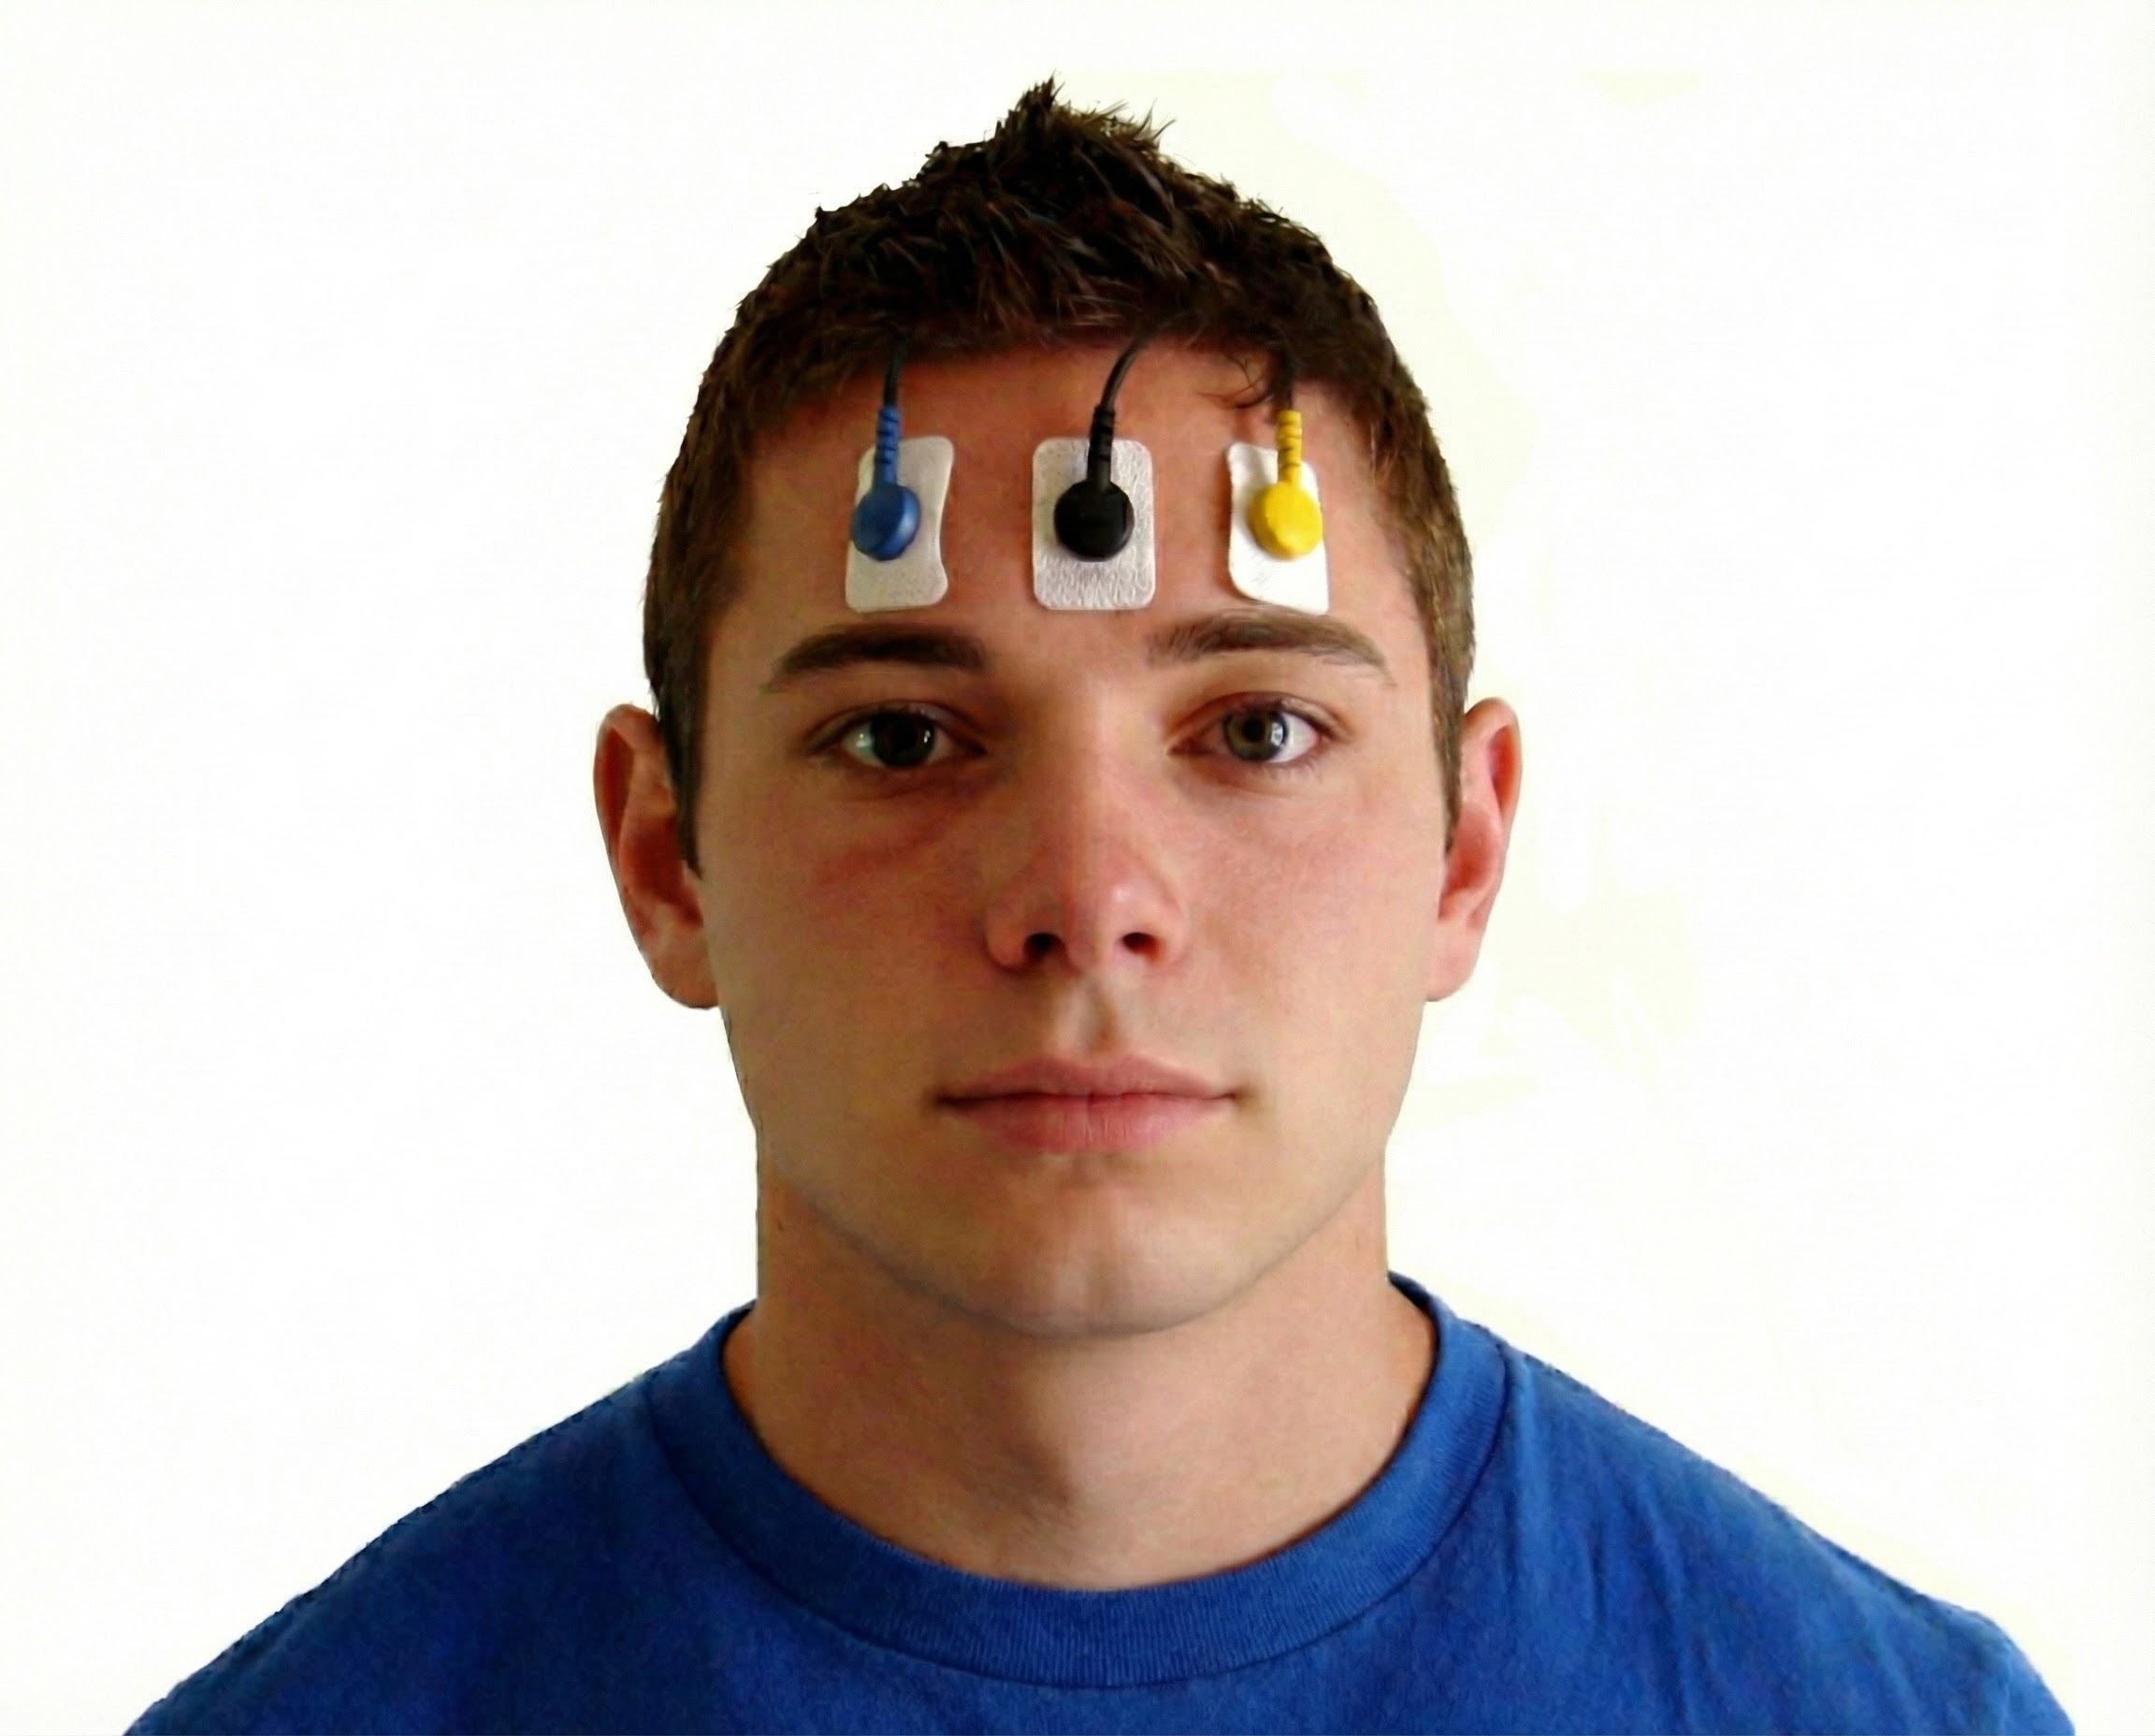
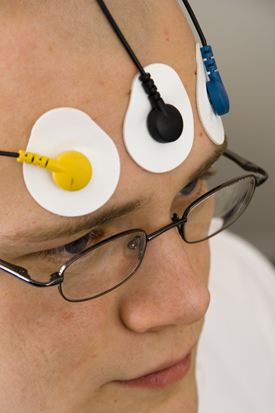
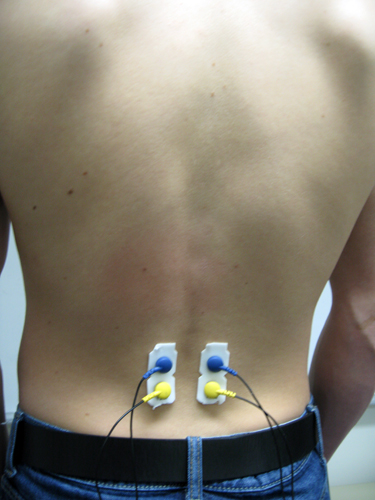
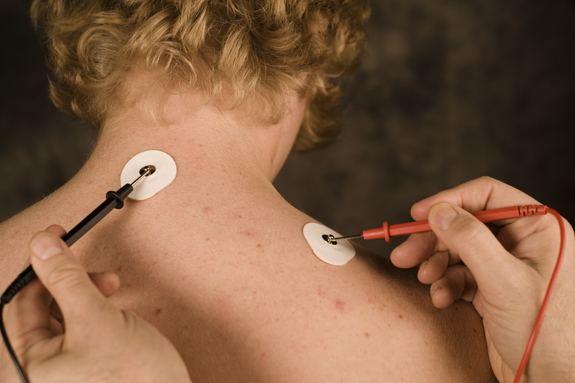
Active placement over the wrong muscle or at an angle from the muscle body will result in misleading signals (Sherman, 2002). Reference electrode (black) positioning is less critical since it may be located within 6 inches of either active. Note that the color code for active electrodes varies with the manufacturer. For Thought Technology Ltd., the active electrodes are blue and yellow. The photograph shows a bipolar frontal placement.
SEMG recording can be monopolar or bipolar. Monopolar recording uses one active and one reference electrode. Since the active sees more SEMG activity than the reference, a voltage develops between them.
Bipolar recording uses two actives and a shared reference electrode. Since each active is paired with the reference, bipolar recording produces two voltages.
🎧 Mini-Lecture: Bipolar Recording
Bipolar is superior to monopolar recording because it allows us to obtain a cleaner signal.
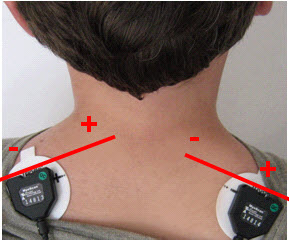
Clinicians and researchers prefer bipolar recording because it monitors a wider surface area, which is ideal for relaxation training, and allows a differential amplifier stage to remove contamination appearing at both active electrodes. Note that the colors white and red designate active electrodes in the graphic below. Trapezius placement graphic created by Devid Abd on fiverr.com.
SEMG scanning allows clinicians to test muscles with a movable sensor sequentially. Instead of attaching multiple sets of EMG electrodes, a clinician can quickly move a SEMG scanning electrode from muscle to muscle.
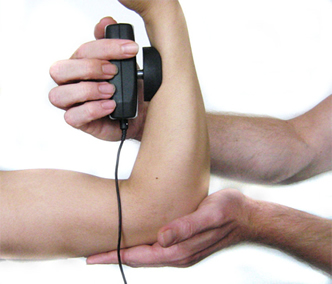
Telemetry
Telemetry systems, like the NeXus-10 and Thought Technology Ltd.'s Tele-Infiniti telemetry systems shown below, solve two problems. First, telemetry protects clients from electrical shock since there is no wired connection to a computer powered by a wall outlet. Second, telemetry allows us to monitor clients during unrestricted movement.
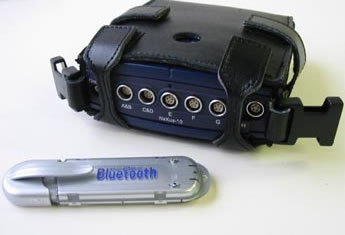

A miniature telemetry unit attached to an encoder box transmits real-time information to a computer more than 30 feet away. It provides immediate feedback that can be used to correct performance. The possible applications are diverse, including athletics, ergonomics, and rehabilitative medicine. Graphic © Biodex.

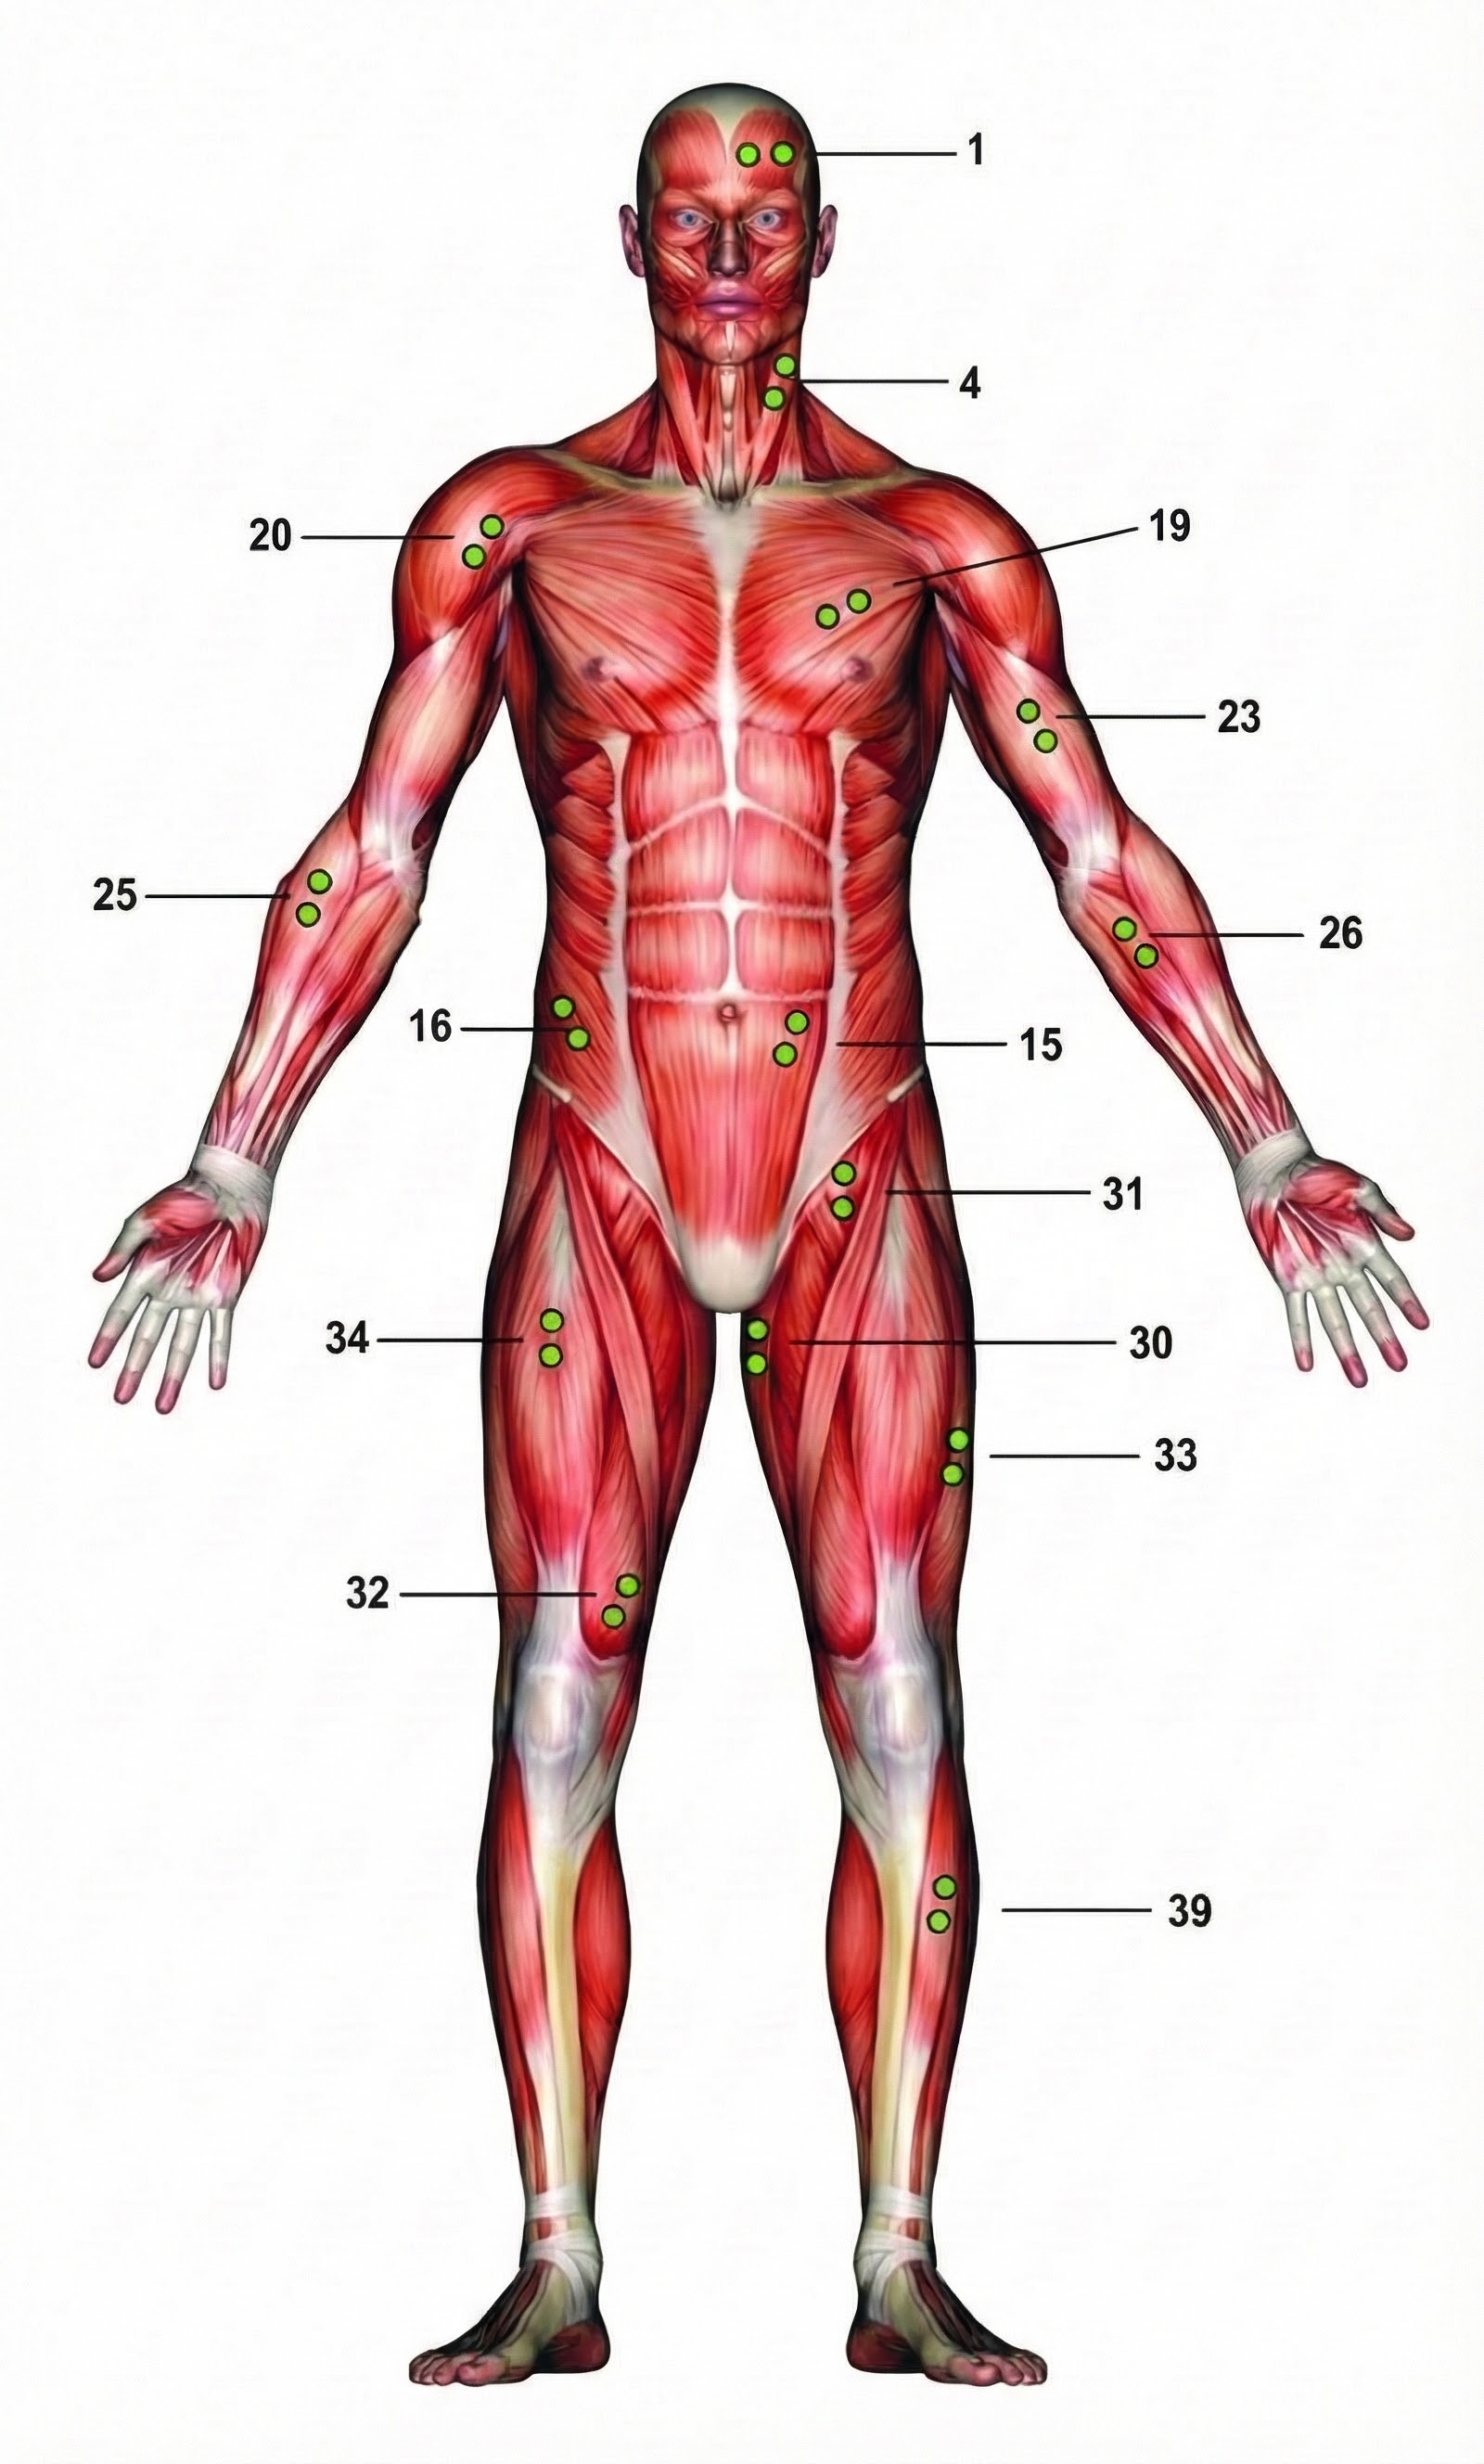
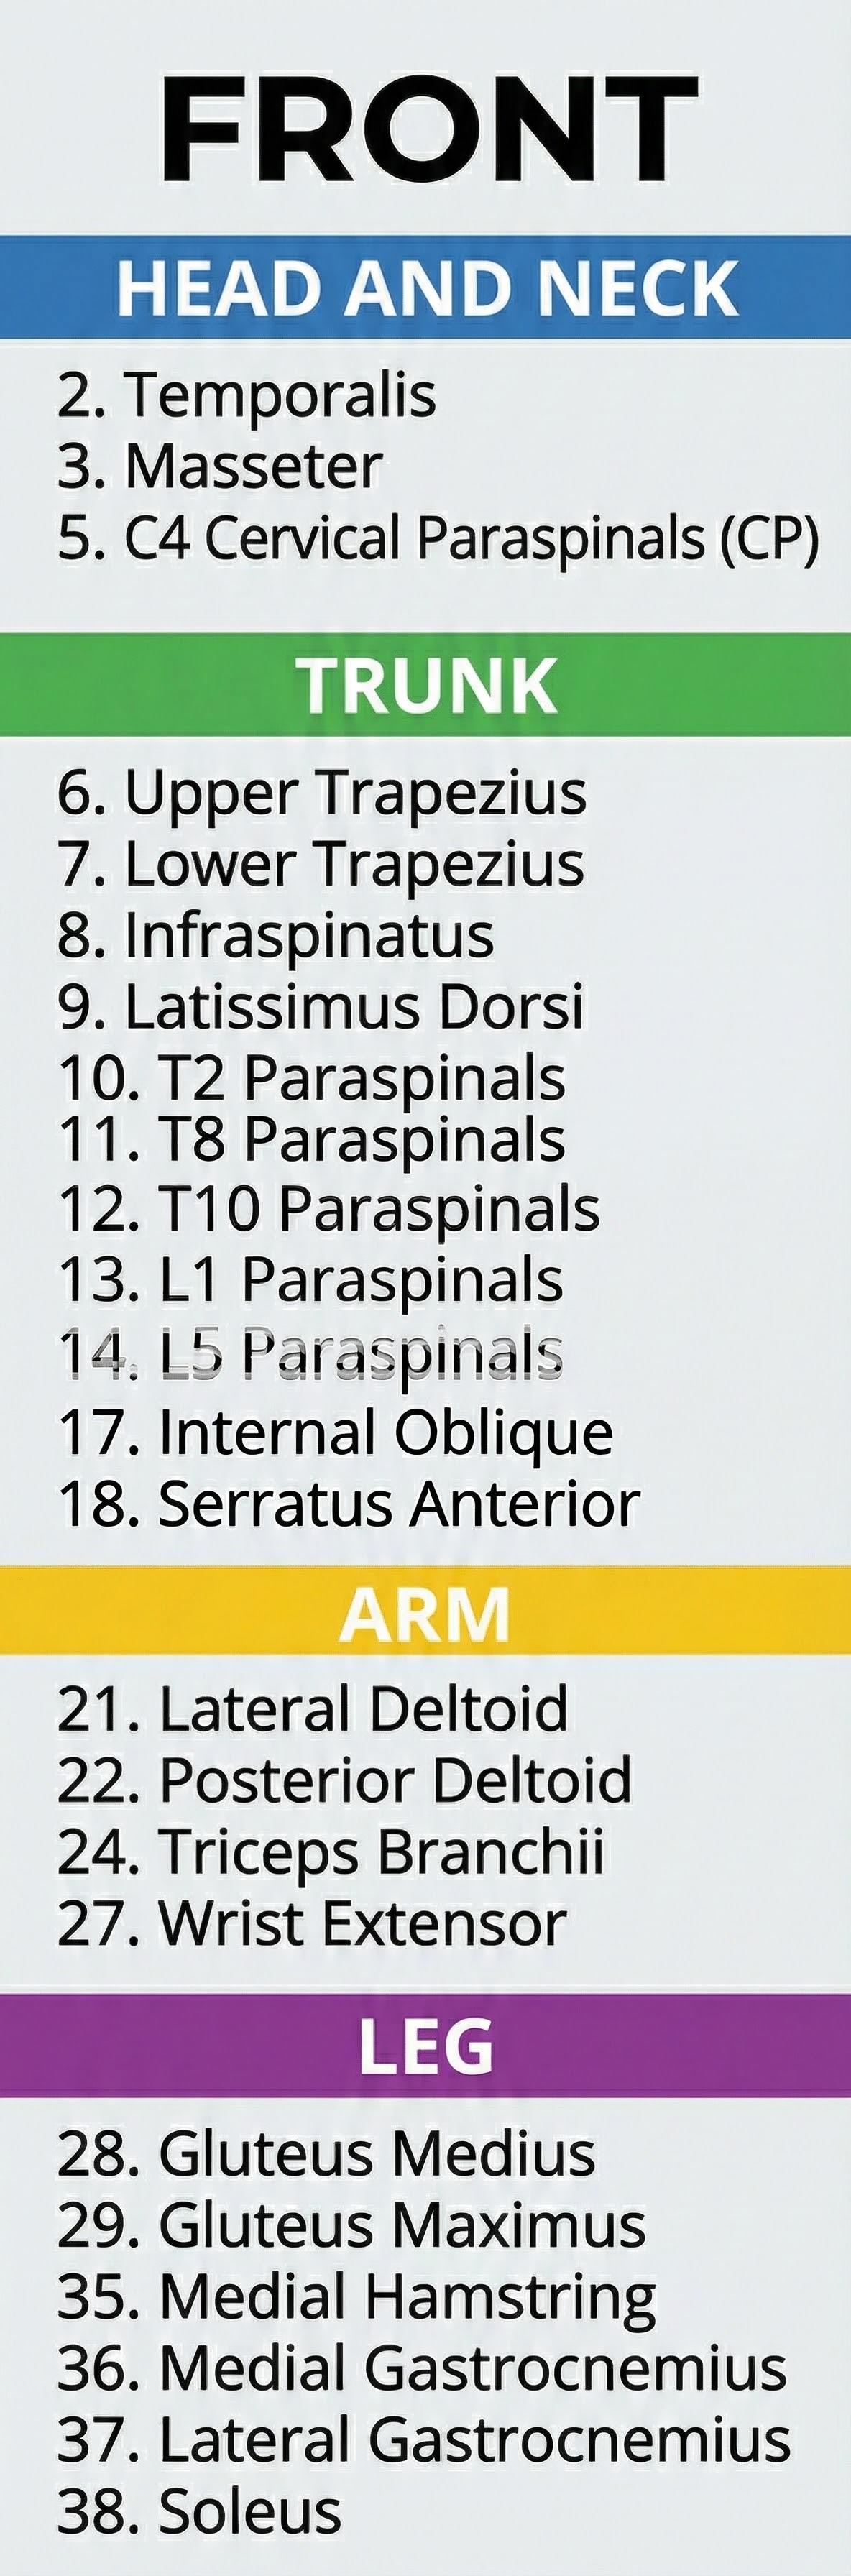
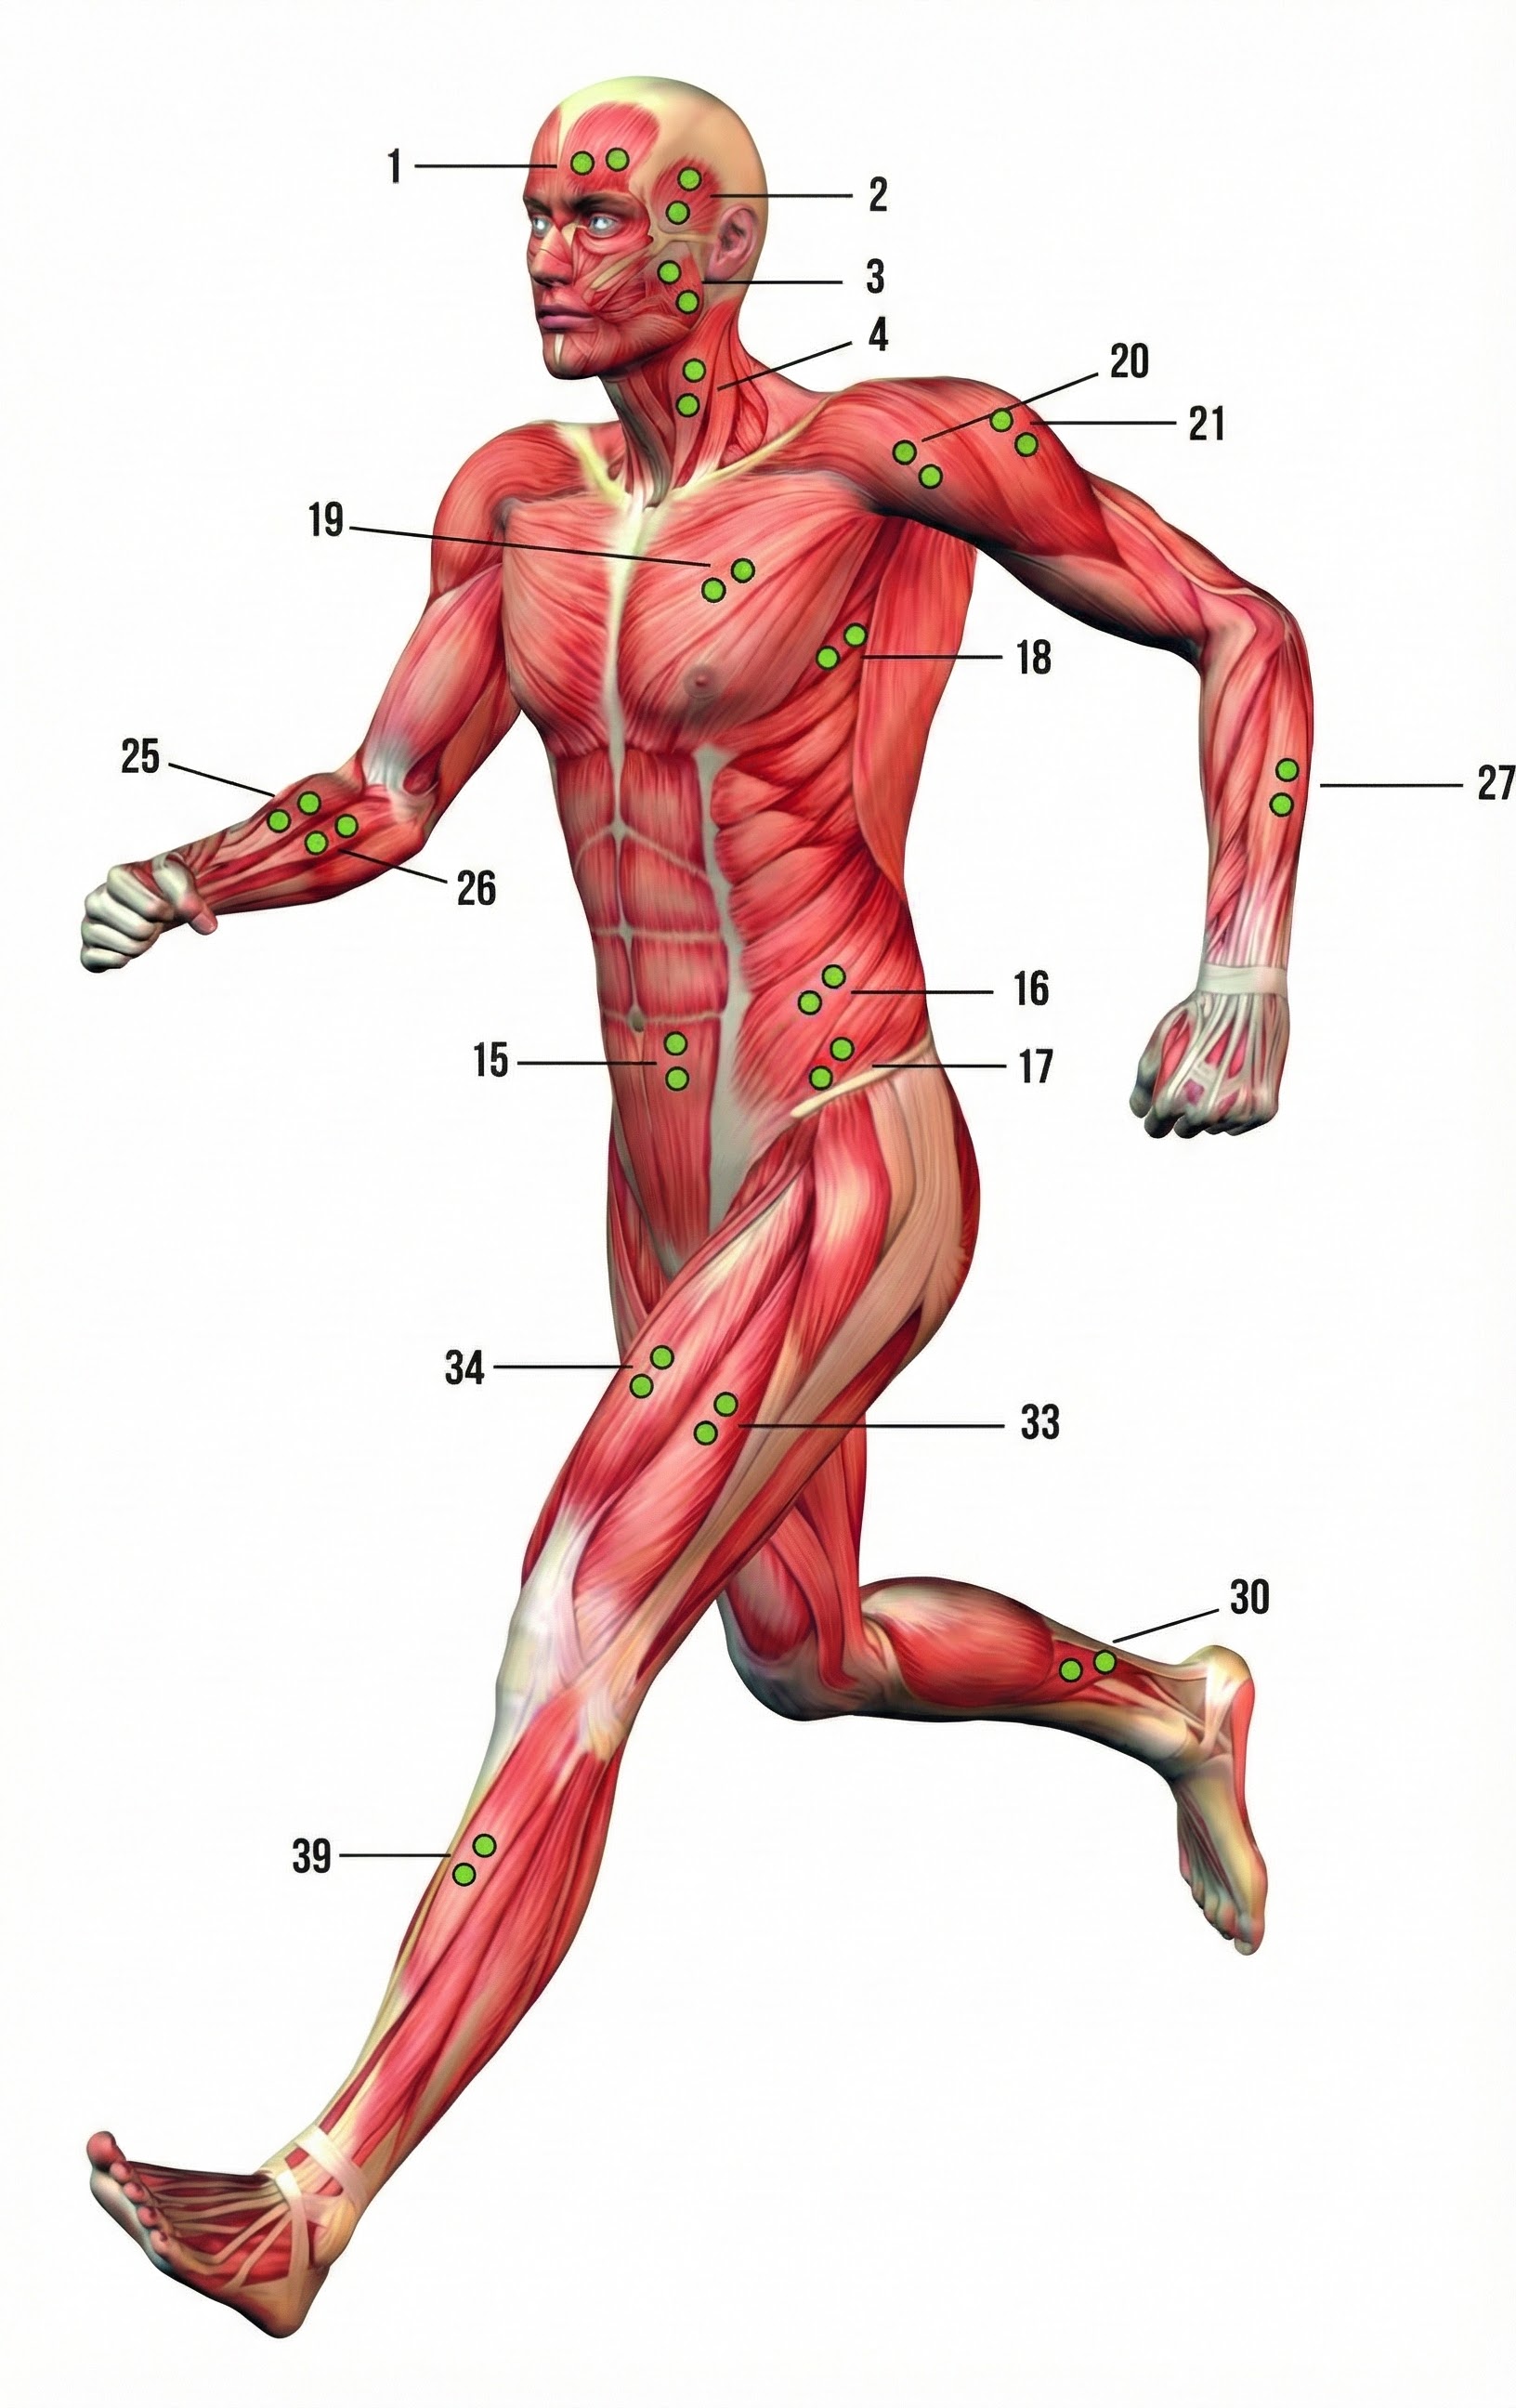
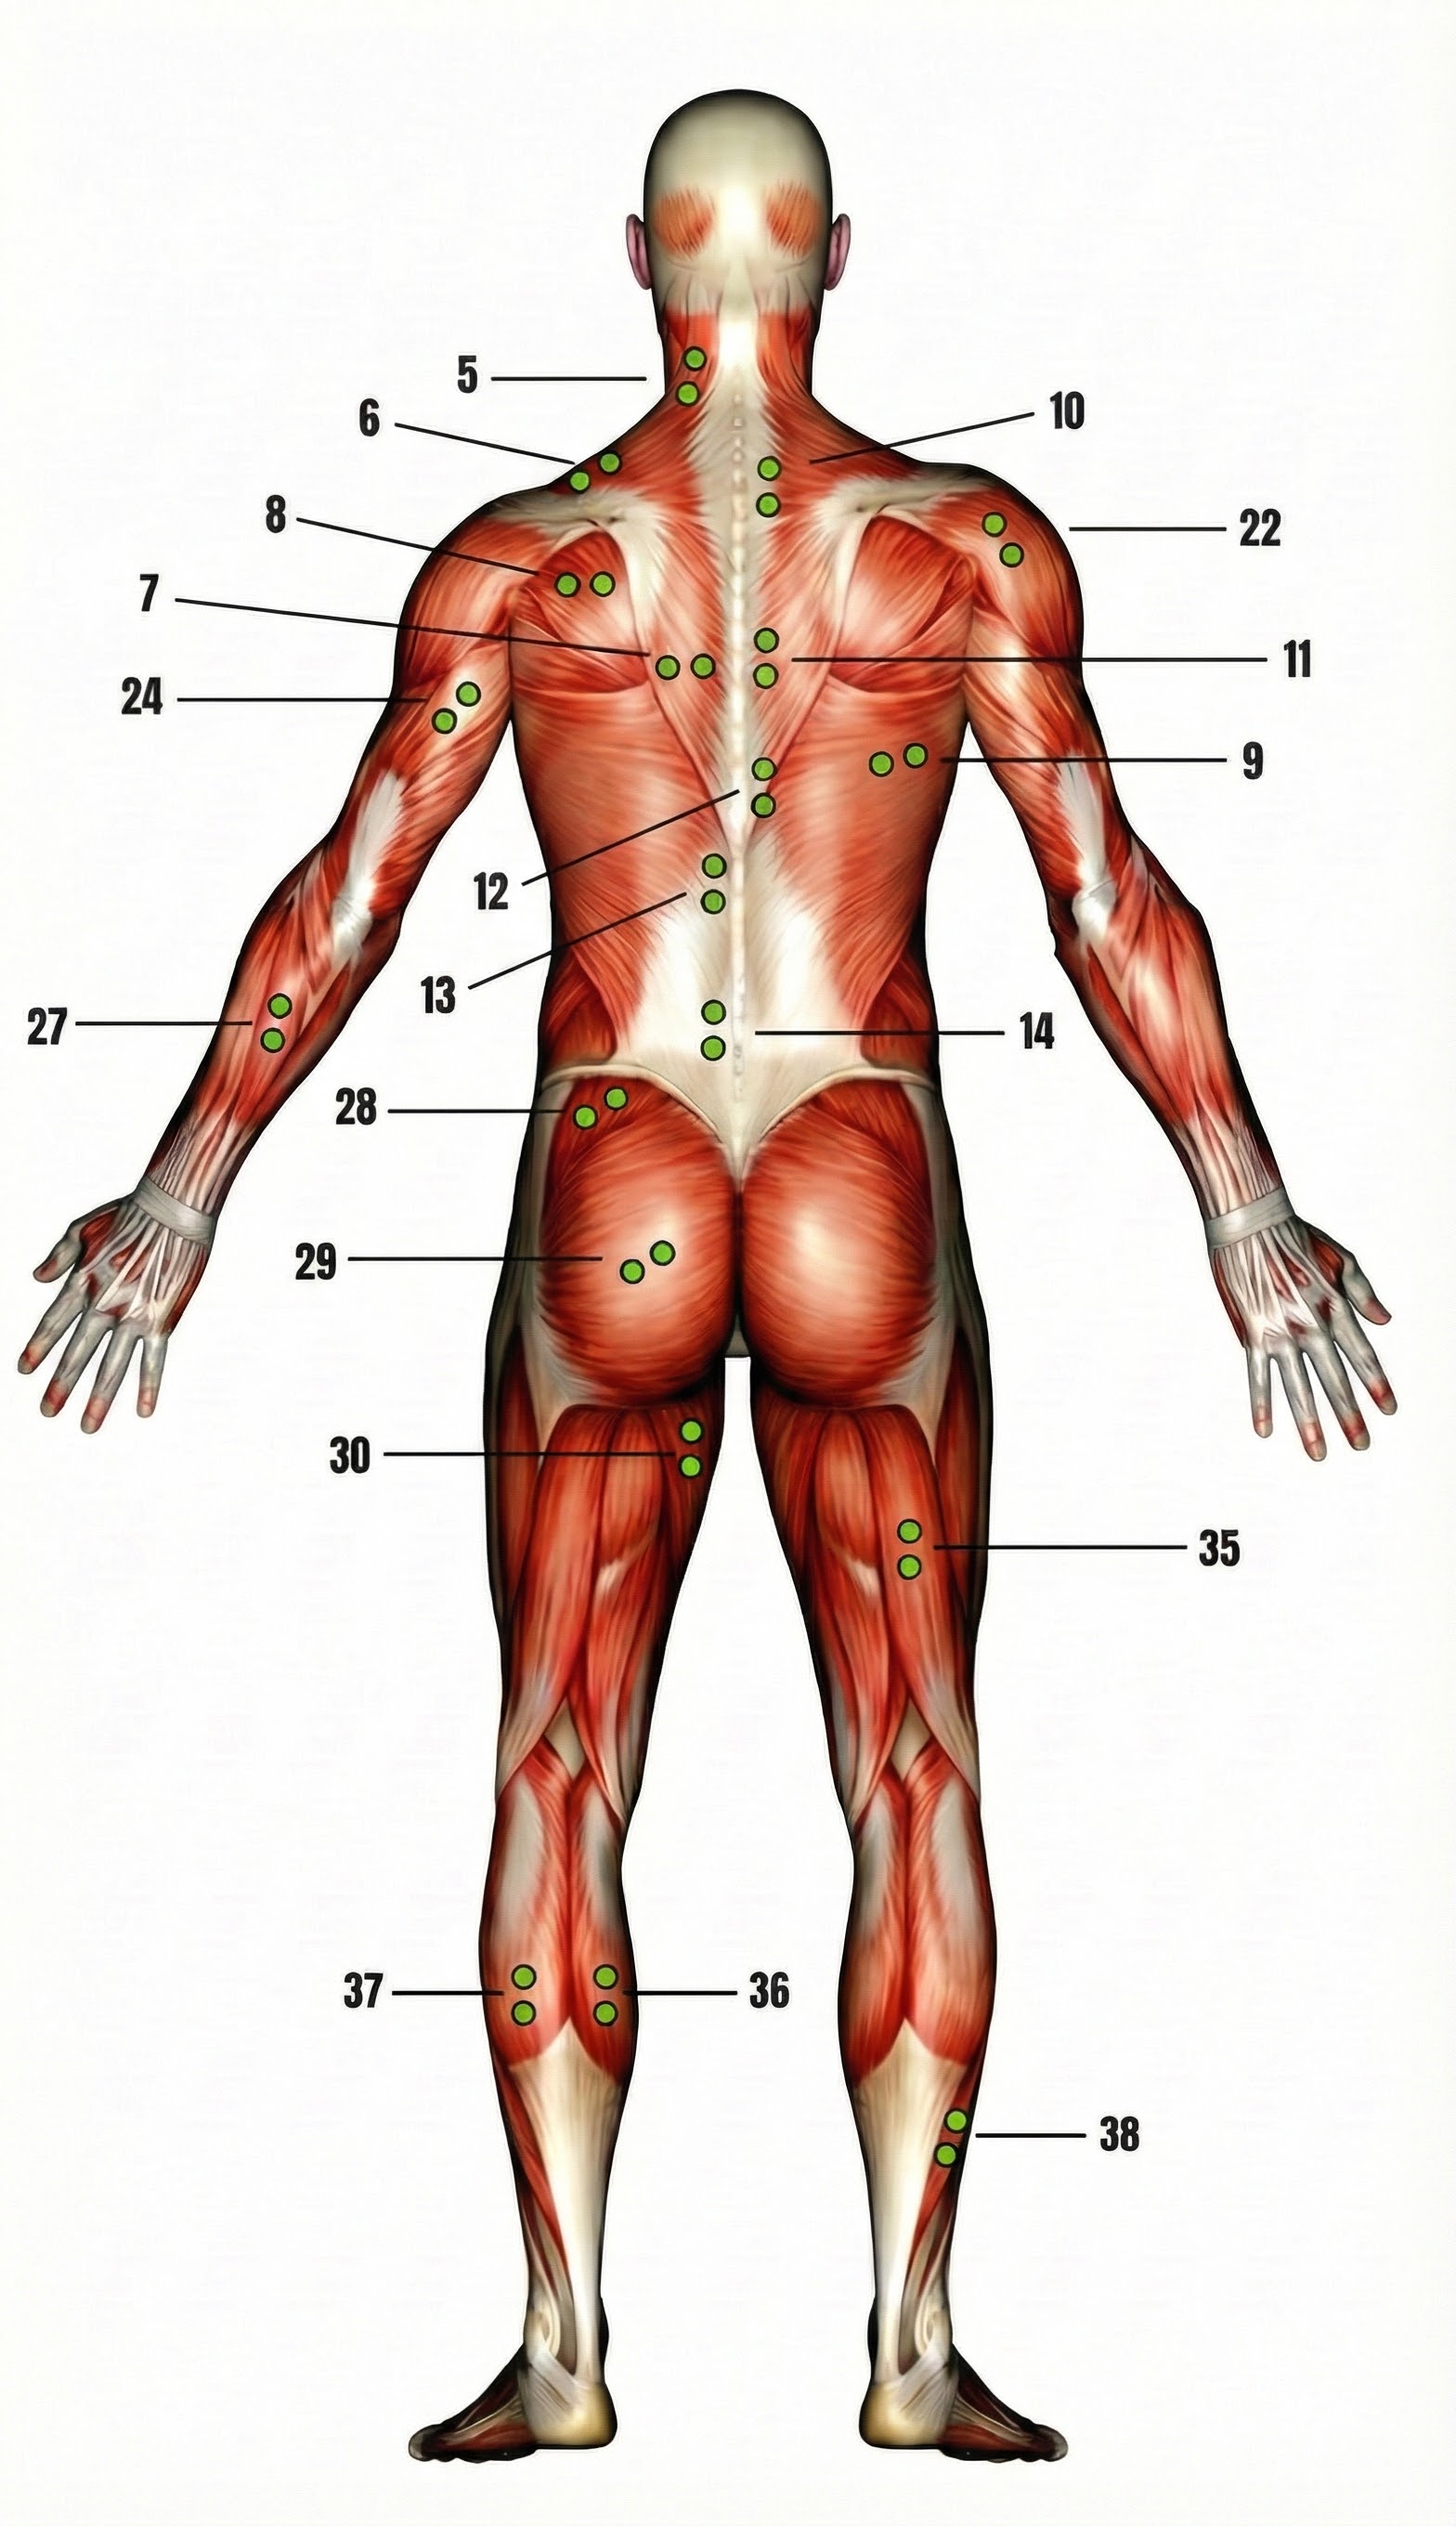
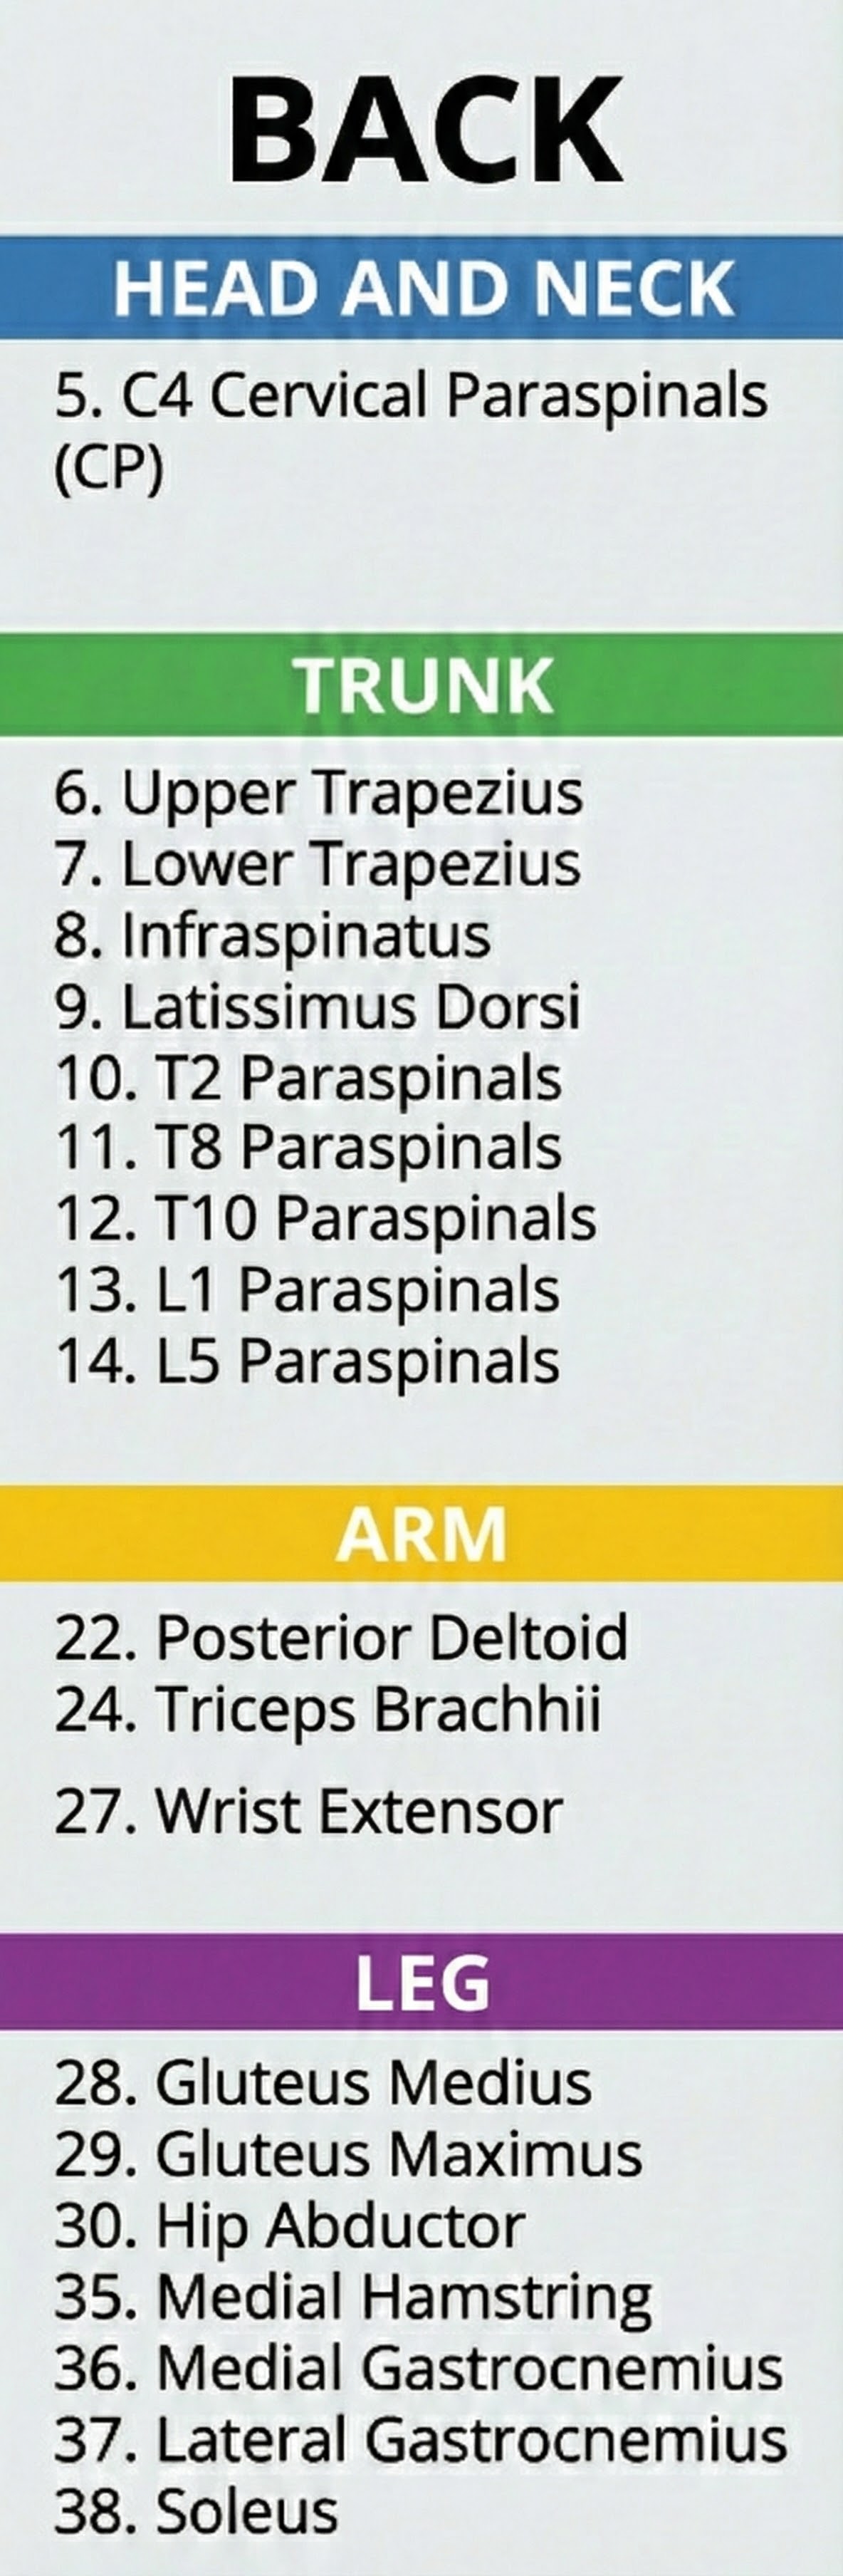
Typical Electrode Placements
Thought Technology Ltd. generously provided the diagrams below from their Basics of Surface Electromyography Applied to Physical Rehabilitation and Biomechanics (2009).
 |
 |
 |
 |
 |
 |
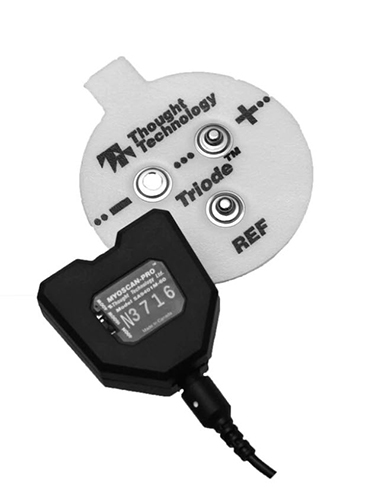
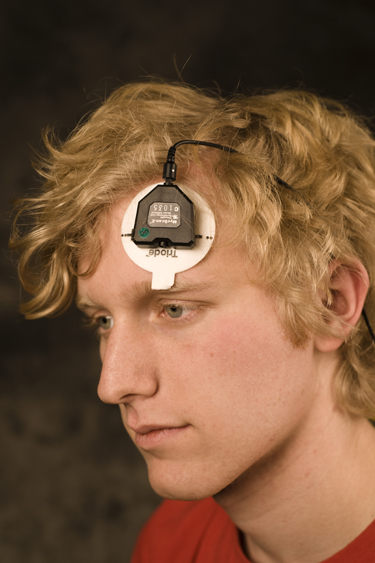
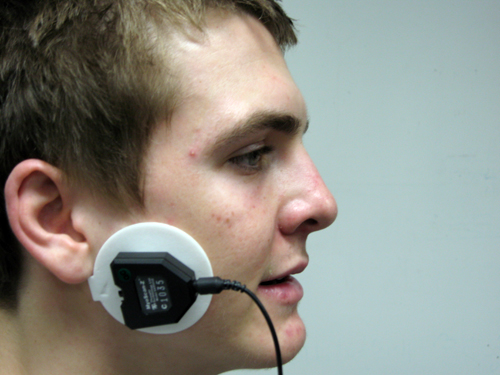
A Thought Technology Ltd. Triode sensor incorporates one reference and two active electrodes. A disposable electrode is snapped into the sensor shell. Graphic © Thought Technology Ltd.
Photographs are courtesy of the Biofeedback Federation of Europe, Erik Peper, and BioSource Software, Ltd.
Upper Trapezius
Frontalis (wide)
Frontalis (narrow)
Masseter
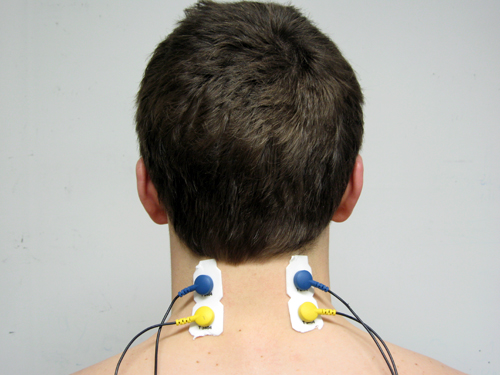
Cervical Paraspinal (CP)
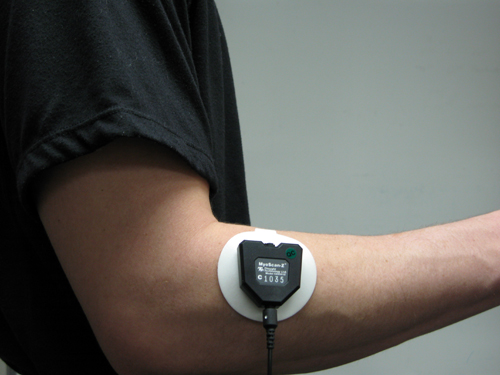
Forearm Extensor
Anterior Deltoid
Erector Spinae (reference not shown)
Electrodes are transducers that detect SEMG signals through volume conduction. Bipolar recording using three electrodes (two actives and one reference) is preferred because differential amplifiers can remove noise common to both channels. Proper placement over the muscle belly is critical for accurate readings.
Comprehension Questions
- Why is bipolar recording preferred over monopolar recording for SEMG biofeedback?
- What is volume conduction and why does it result in signal loss?
- Where should active electrodes be placed for the strongest SEMG signal?
- How do floating skin electrodes minimize movement artifact?
- What two problems does telemetry solve in biofeedback applications?
Site Preparation
🎧 Mini-Lecture: Skin Preparation
Impedance Testing
Measure the quality of skin-electrode contact, which is called impedance. An impedance meter, which sends a nonpolarizing AC signal through the skin, provides the most valid impedance measurement.
In bipolar recording, we measure impedance between each active electrode and the shared reference. Impedance testing results in two measurements in the Kohm (thousand-ohm) range.
Low and Balanced Skin-Electrode Impedances Are Critical
A conservative rule is that each measurement should be less than 10 Kohms and within 5 Kohms of each other.
Why? Two reasons. First, high skin-electrode impedance reduces SEMG signal strength and makes it harder to differentiate from contamination. Second, a differential amplifier subtracts voltages that look identical because they are probably artifacts like 50/60Hz. Imbalanced impedance makes voltages look different (the signal with higher impedance will appear smaller), allowing artifacts to "sneak" through.
Inadequate skin preparation and the application of insufficient electroconductive gel can produce high and imbalanced impedances.
Impedance imbalance can lower SEMG values and the signal-to-noise ratio and increase signal contamination.
This problem is illustrated by the recording shown below adapted from Peper, Gibney, Tylova, Harvey, and Combatalade (2008).
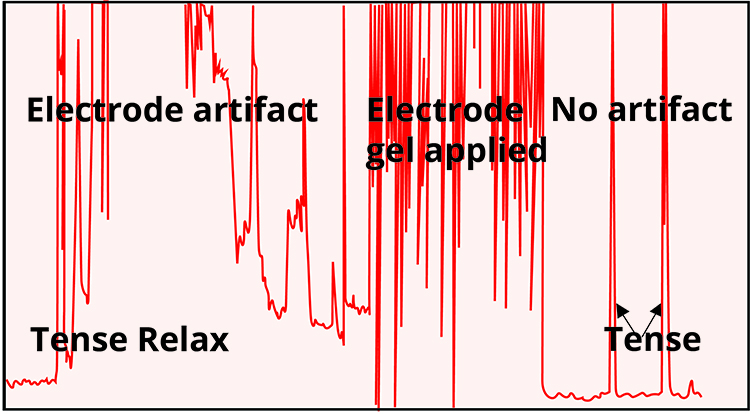
🎧 Mini-Lecture: Electrode Contact Artifact
Sherman (2002) cautions that high impedance due to poor skin preparation can make a highly-contracted muscle look virtually silent by reducing its amplitude to one-tenth of its actual value.
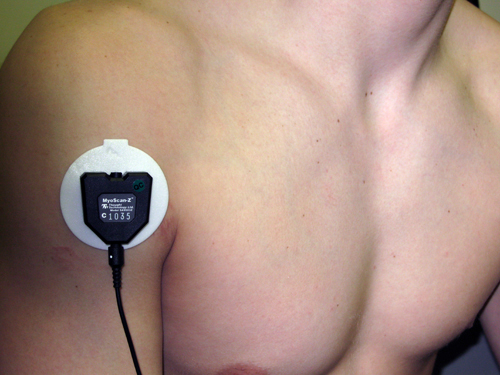
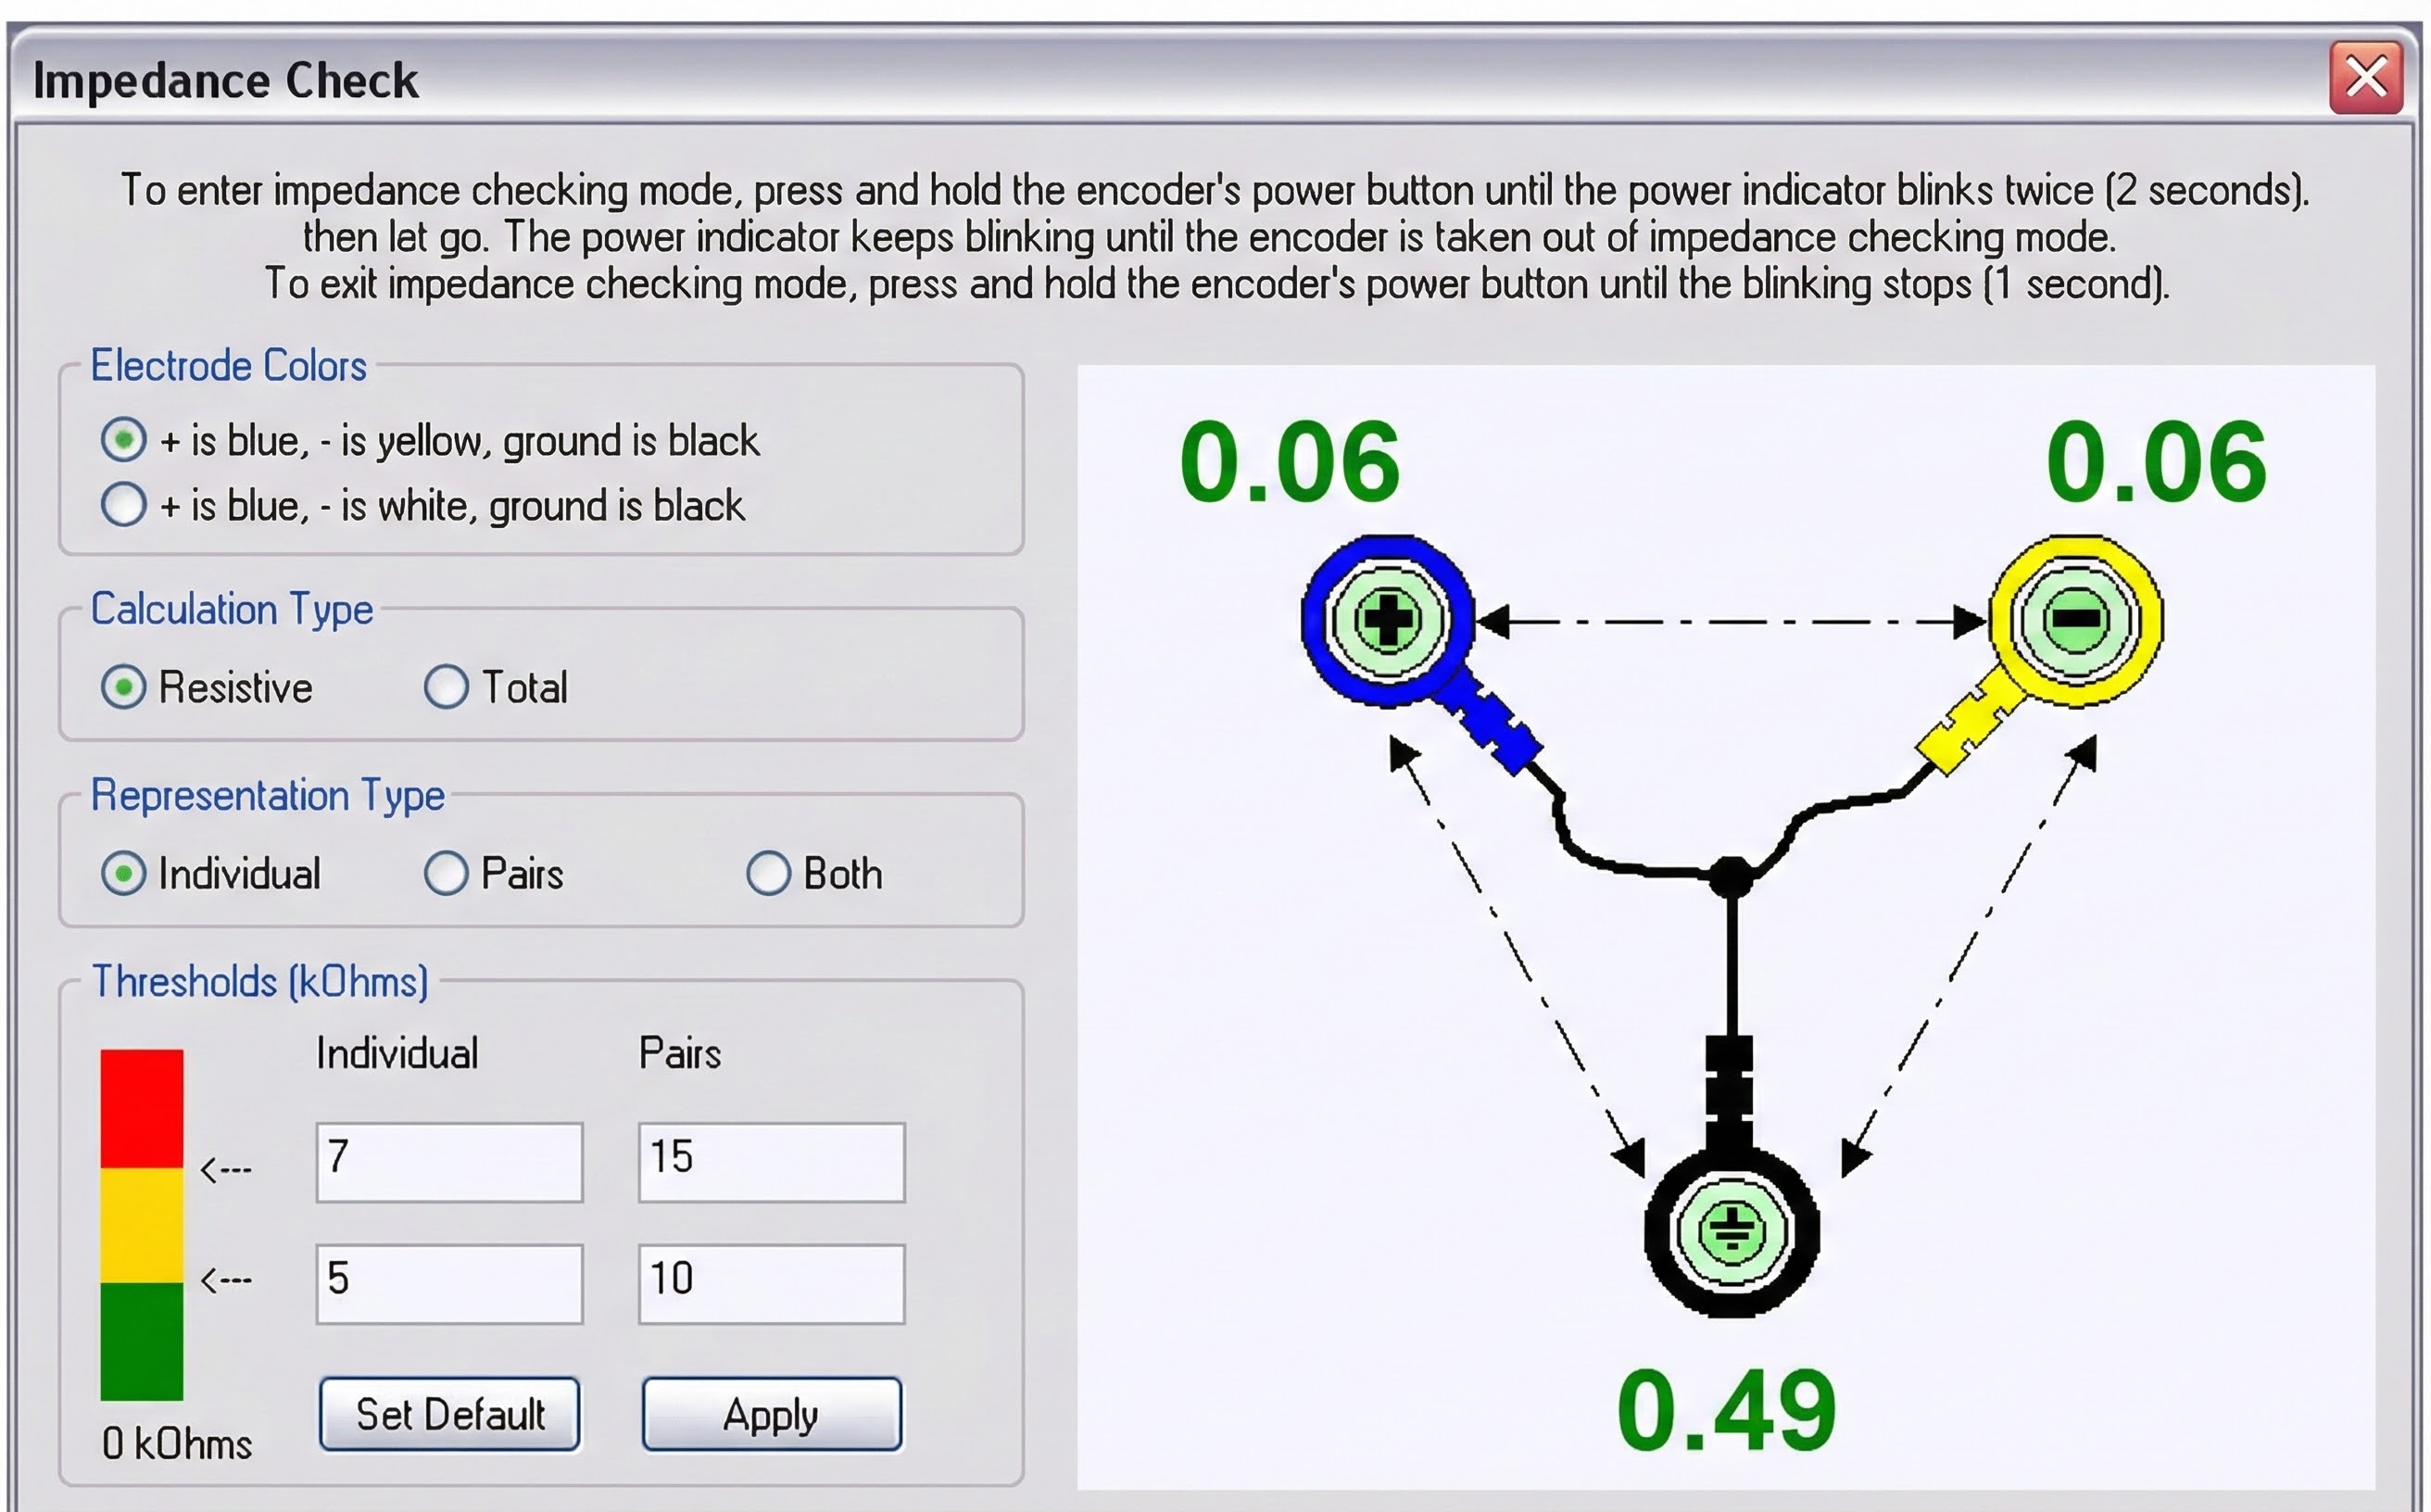
An impedance test can be performed manually with a separate impedance meter or voltohmmeter or automatically by data acquisition system software like the MyoScan-Z using BioGraph Infiniti 5.0 and later software.
🎧 Mini-Lecture: Impedance Testing
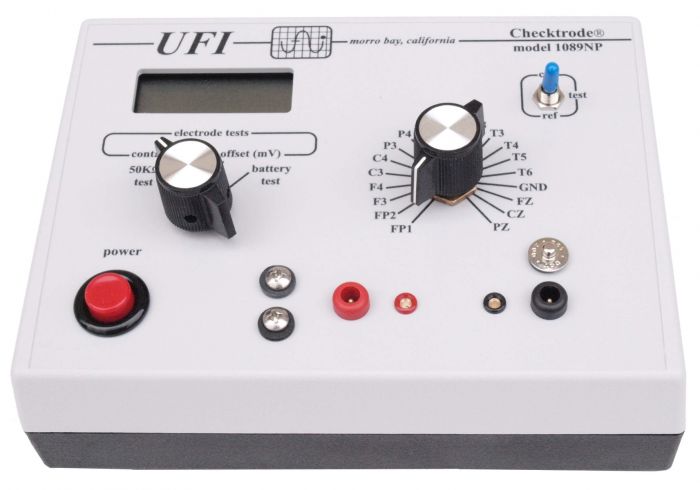
Manual impedance testing
Automatic testing of skin-electrode contact
Gel-Bridge Artifact Short-Circuits the EEG and SEMG Signal
Gel-bridge artifact occurs when electrodes are closely spaced and the electrode gel smears, creating a bridge between the active and reference electrodes. A gel-bridge creates a short circuit and results in abnormally low readings. Disposable pre-gelled electrodes avoid this problem. For permanent electrodes, remove the electrodes, clean the skin, remove the smeared gel, and reapply the electrodes to fix this problem.
Proper skin preparation and impedance testing are essential for quality SEMG recordings. Target impedance below 10 Kohms with less than 5 Kohms imbalance between channels. High or imbalanced impedance reduces signal strength and allows artifact contamination.
Comprehension Questions
- What are the target impedance values for SEMG recording?
- Why does impedance imbalance allow artifacts to contaminate recordings?
- How can high impedance make a contracted muscle appear relaxed?
- What causes gel-bridge artifact and how can you prevent it?
Signal Processing
Biological signals enter the black box via an electrode cable or Bluetooth. SEMG signals entering an electromyograph are dropped across an input impedance, amplified, filtered, rectified, integrated, measured by a level detector, and finally displayed as shown in the diagram below from Thought Technology Ltd.'s Basics of Surface Electromyography Applied to Physical Rehabilitation and Biomechanics (2009).
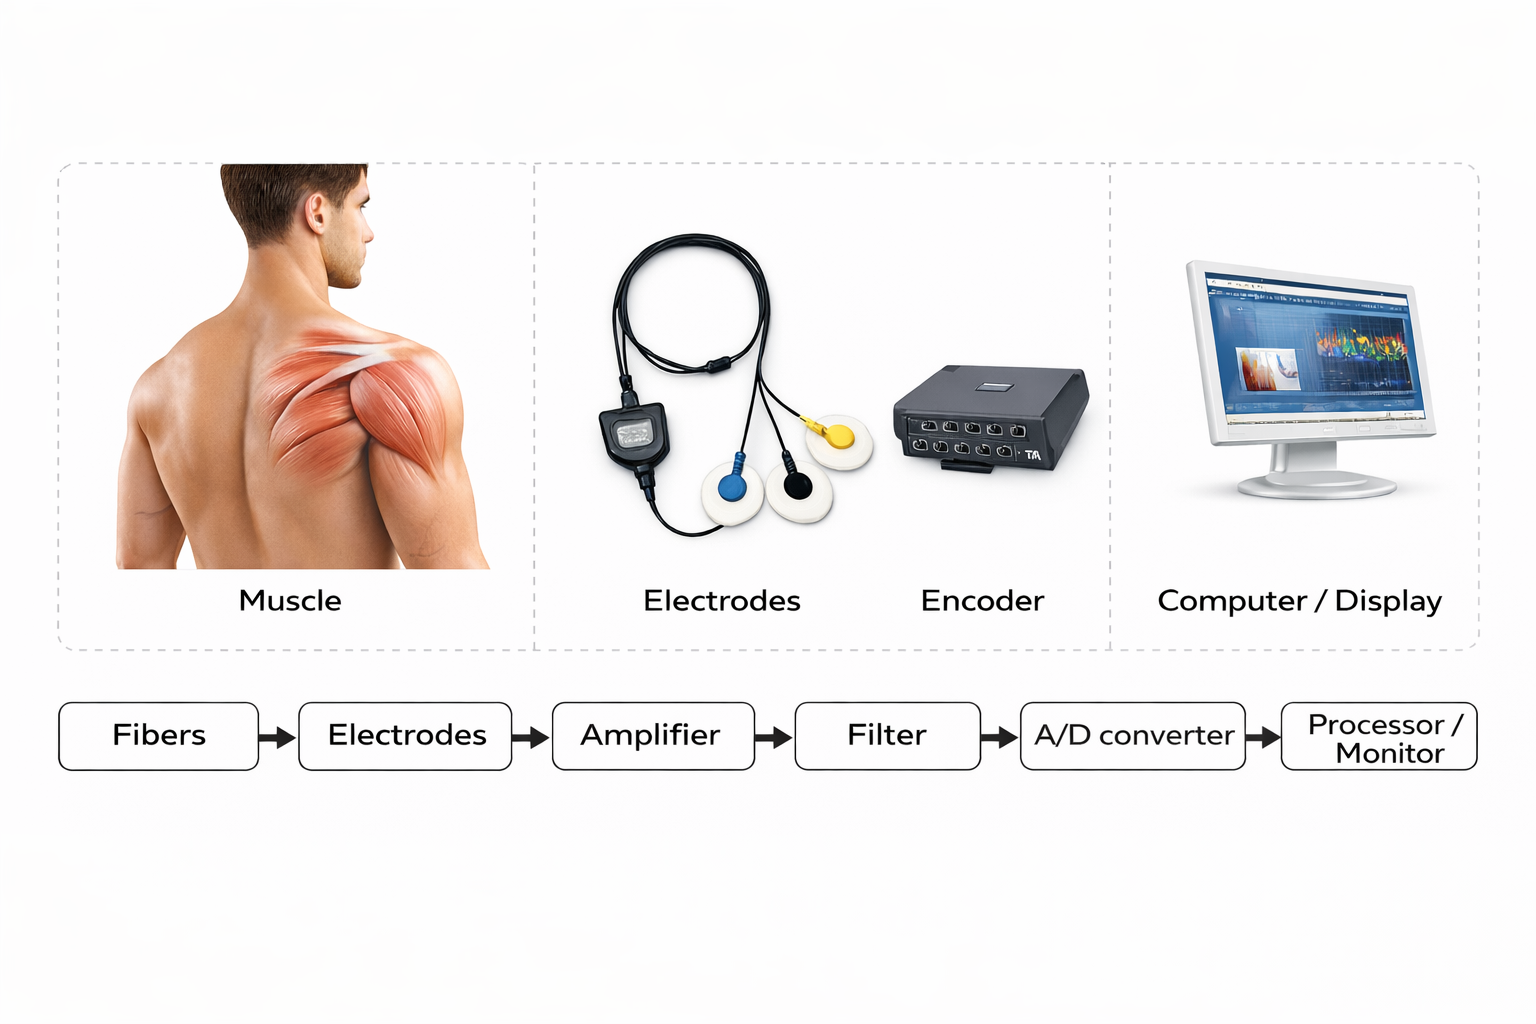
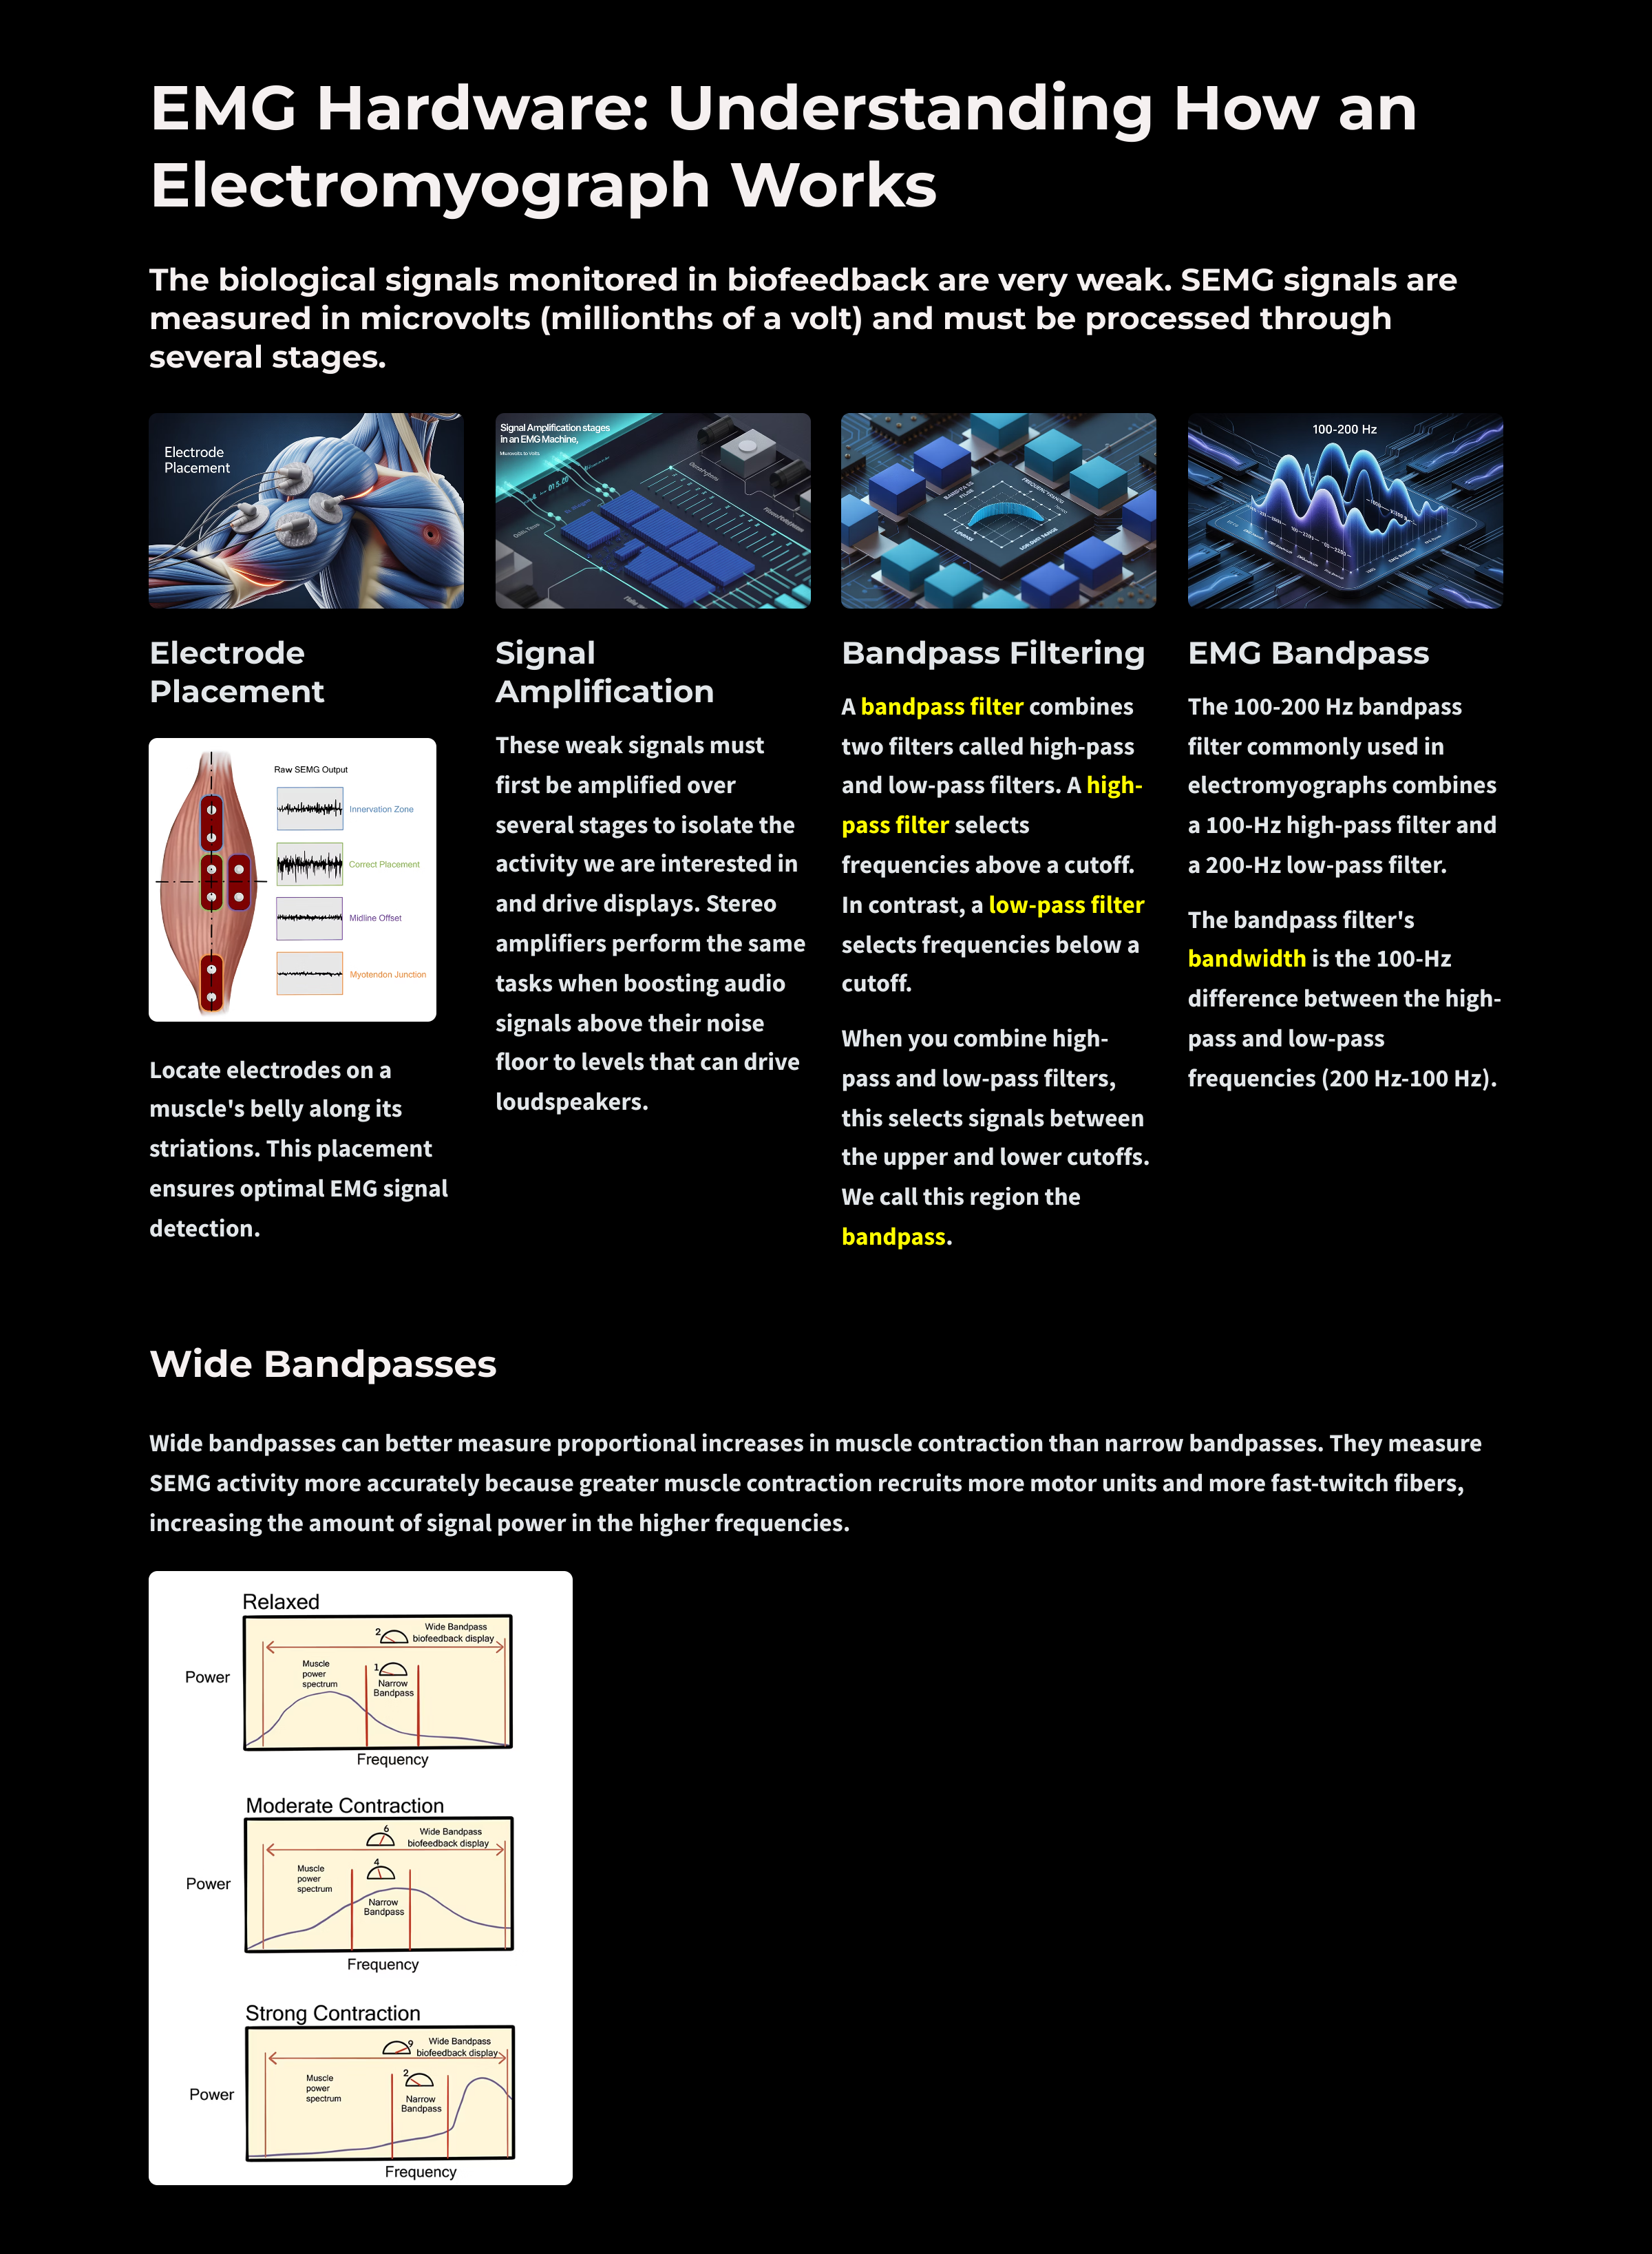
The biological signals monitored in biofeedback are very weak. The SEMG signal, for example, is measured in microvolts (millionths of a volt). These signals must first be amplified over several stages to isolate the activity we are interested in and drive displays. Stereo amplifiers perform the same tasks when boosting audio signals above their noise floor to levels that can drive loudspeakers.
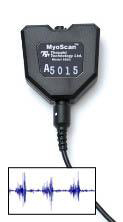
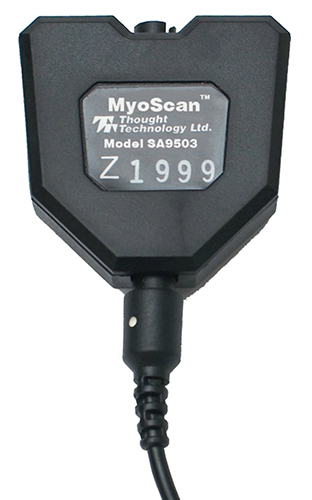
Electromyographs boost incoming signals in stages. The first amplification stage is called a preamplifier. A manufacturer may place the preamplifier in the sensor shell to reduce signal loss, as in Thought Technology Myoscan-Z shown below. The "Z" designation means that software can perform an impedance (Z) check.
While AC signals can be amplified using single-ended or differential amplifiers, differential amplifiers yield cleaner signals. This is one of those fixed features working for you behind the scenes.
A single-ended amplifier is used during monopolar recording, producing only one signal. Think of it as an indiscriminate booster: it amplifies everything it receives, whether that is genuine muscle activity or unwanted noise from the lights overhead. This results in excessive contamination. Current electromyographs use differential amplifiers for bipolar recording instead, and that is a good thing.
A differential amplifier is used during bipolar recording, where two active electrodes each pick up a signal. The clever part is that both electrodes receive the same environmental noise (because noise from fluorescent lights or nearby equipment hits them equally), but they receive different amounts of muscle activity (because they sit over different parts of the muscle). The differential amplifier subtracts the two inputs, which cancels out the identical noise while preserving the muscle signal that differed between the electrodes. Imagine two people standing in a noisy crowd: if they both hear the same background chatter but one hears an extra whisper, subtracting their experiences leaves only the whisper. A perfect differential amplifier receiving pure noise and no muscle activity would output zero.
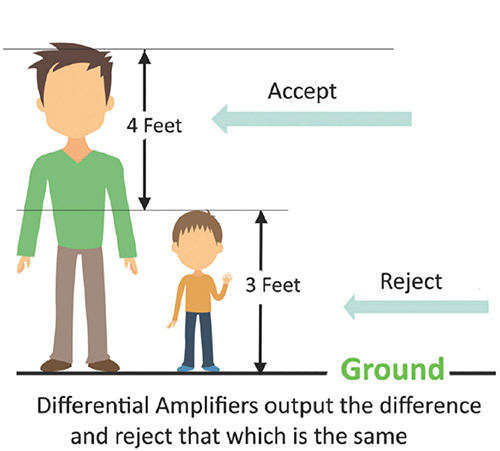
The graphic below was redrawn from John Demos' BCIA-recommended Getting Started with EEG Neurofeedback (2nd ed.). A differential amplifier rejects the common voltage (e.g., 3 feet) and outputs the voltage difference (e.g., 4 feet). A single-ended amplifier outputs the entire voltage (e.g., 7 feet, EEG artifact and signal value).
Common Mode Rejection Reduces Artifact
The common-mode rejection ratio (CMRR) tells you how effectively a differential amplifier separates signal from noise. No differential amplifier is perfect, so some noise sneaks through. CMRR compares how much the amplifier boosts the signal you want (differential gain) versus the noise you do not want (common-mode gain). You will not measure CMRR yourself; manufacturers do this for you at 50/60Hz, where the most troublesome noise lives. Look for a CMRR of at least 100 dB (100,000:1), meaning the signal gets amplified 100,000 times more than the noise. State-of-the-art equipment achieves 180 dB or higher. The higher this number, the cleaner your recordings will be.
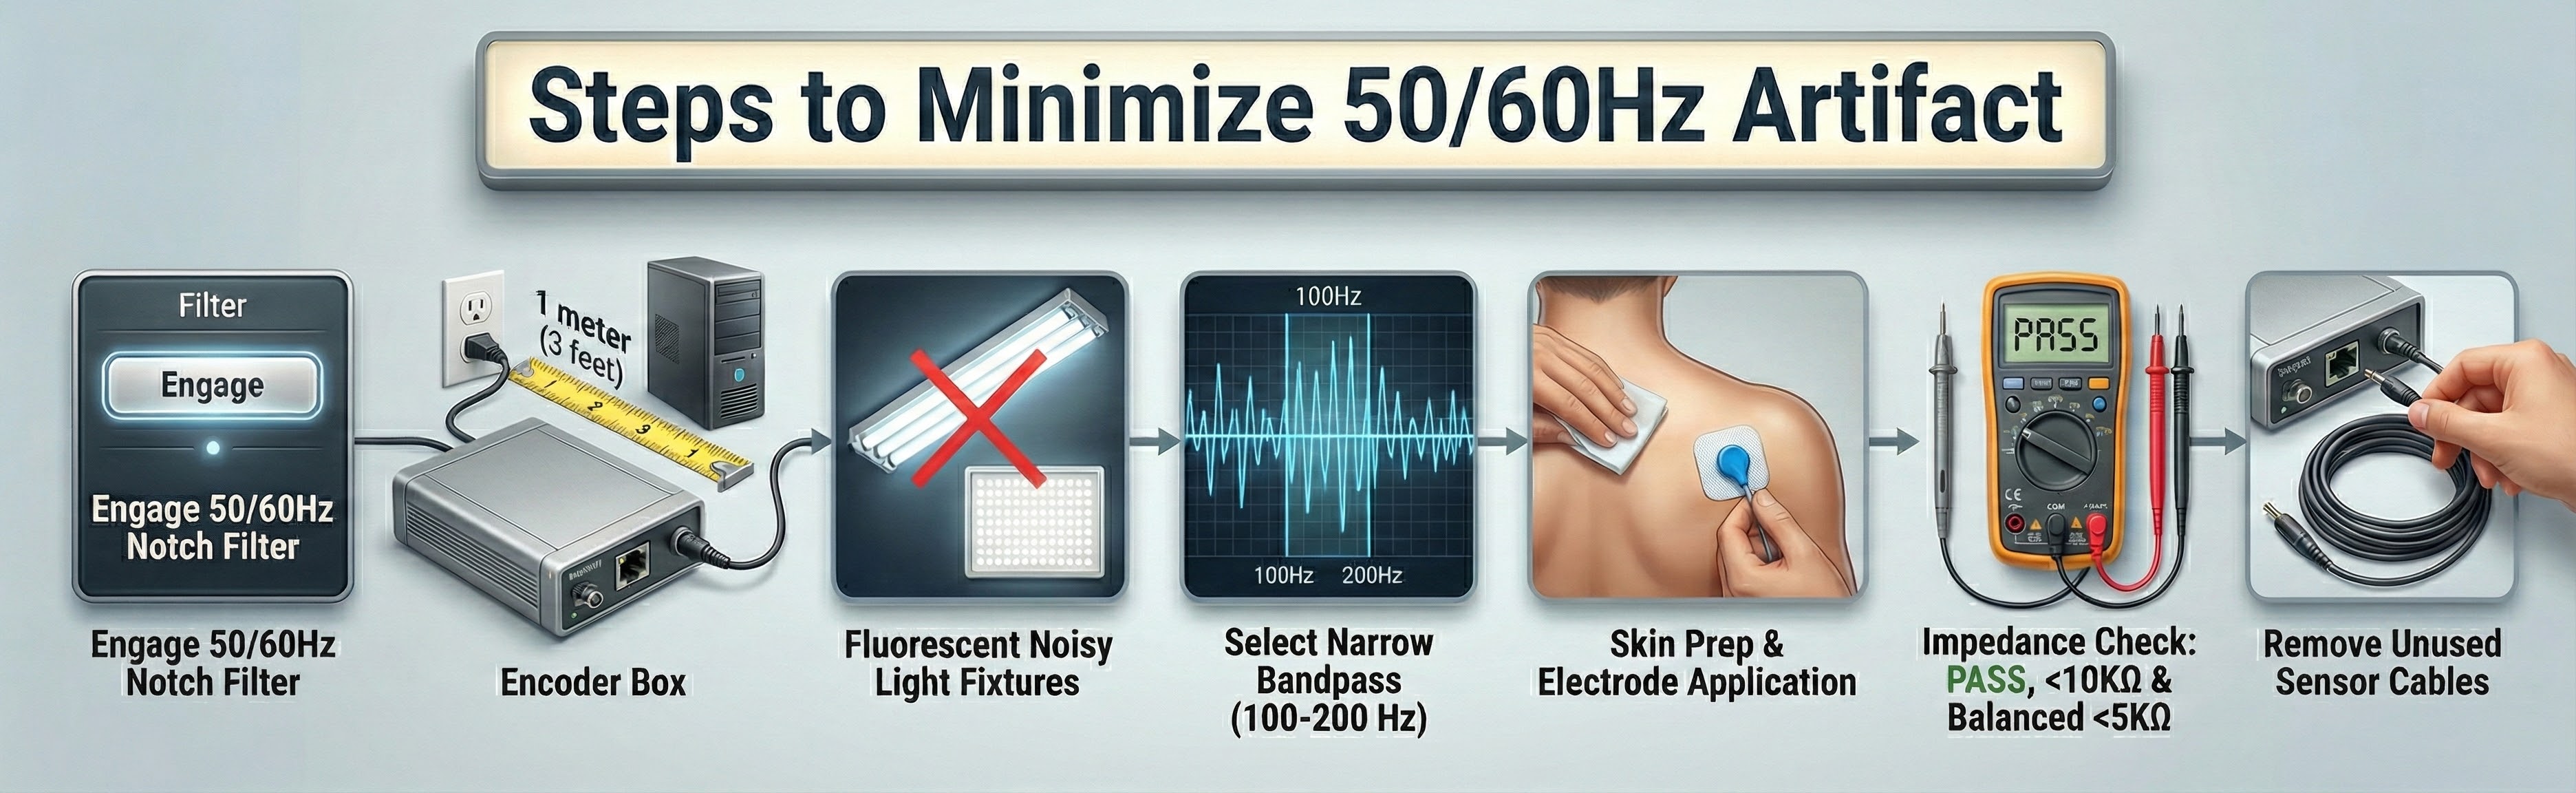
How to Record Cleaner Signals
You can take four steps to maximize common-mode rejection. First, identify artifact sources. If you have a portable electromyograph, use it like a Geiger counter. Move the unit around the room with SEMG sensors connected but held in your hand. Artifact sources should produce the largest display values.
Second, remove the artifact sources you find. For example, fluorescent lights can be replaced with fixtures that produce less 50/60Hz noise.
Third, position the electromyograph and electrode cable to reduce artifact reception. Use the location and angle that yield the lowest readings when not attached to a patient.
Fourth, keep skin-electrode impedances balanced within 5 Kohms. If both actives receive identical noise signals, the imbalance will make the signals look different and prevent the complete subtraction of artifacts.
Choose an Electromyograph with High Differential Input Impedance
Here is another fixed feature working quietly in your favor. An electromyograph contains a network of resistors that creates very high differential input impedance, typically measured in billions of ohms (Gohms). Why does this matter? Think of it like a wide pipe versus a narrow pipe: when the instrument's input impedance is vastly higher than the impedance at your electrodes, almost all of the signal flows into the instrument rather than getting lost along the way. State-of-the-art electromyographs achieve 10 Gohms, and this is built into the device. You will never adjust it.
Differential input impedance must be at least 100 times skin-electrode impedance. This ratio allows 99% or more of the SEMG signal to enter an electromyograph. Stronger signal voltages enable an electromyograph to differentiate SEMG activity from artifacts, resulting in more accurate measurement and feedback.
Your job is to keep skin-electrode impedance low (below 10 Kohms) and balanced (within 5 Kohms) through good skin preparation. The high input impedance built into the device then ensures that the signal you worked to capture actually makes it into the processing chain.
Operational Amplifiers
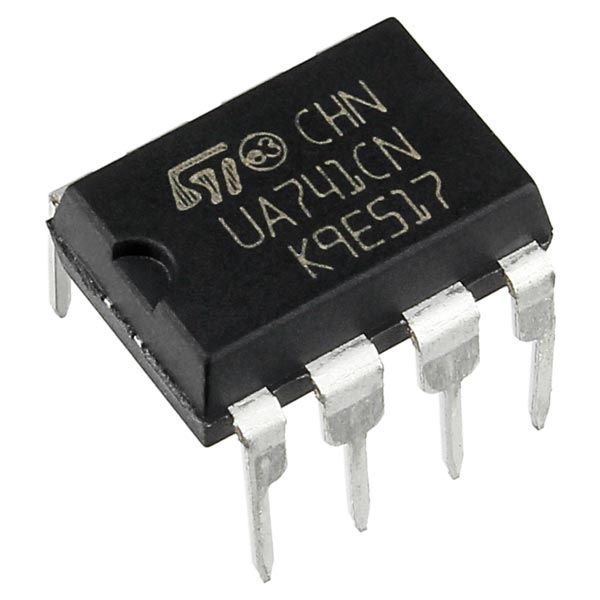
DC signals, like temperature, are amplified using an operational amplifier (op-amp). This circuit is a very high gain DC amplifier that uses external feedback to perform computations like addition, subtraction, and averaging biological signals. Like the integrated circuit below, operational amplifiers are used in feedback thermometers (skin temperature) and electrodermographs (skin electrical activity).
Filters
Filters can help differential amplifiers reduce contamination of the SEMG signal by artifacts. Filters select the frequencies we want to measure and essentially ignore the ones we do not. Let us unpack the term frequency.
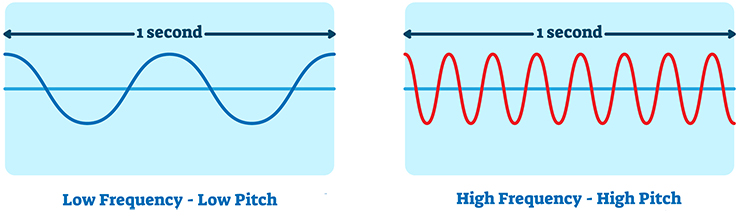
Frequency is the number of complete cycles that an AC signal completes in a second. We express this in hertz (Hz), which means cycles per second. Frequency is the basis of pitch perception. Graphic © VectorMine/Shutterstock.com.
Bandpass filters and notch filters perform this function in an electromyograph.
Bandpass Filters
A bandpass filter combines two filters called high-pass and low-pass filters. A high-pass filter selects frequencies above a cutoff. In contrast, a low-pass filter selects frequencies below a cutoff.
When you combine high-pass and low-pass filters, this selects signals between the upper and lower cutoffs. We call this region the bandpass.
🎧 Mini-Lecture: Bandpass Filters
For example, the 100-200 Hz bandpass filter commonly used in electromyographs combines a 100-Hz high-pass filter and a 200-Hz low-pass filter.
The bandpass filter's bandwidth is the 100-Hz difference between the high-pass and low-pass frequencies (200 Hz - 100 Hz).
A bandpass filter is defined by its center frequency, cutoff frequencies, and slope.
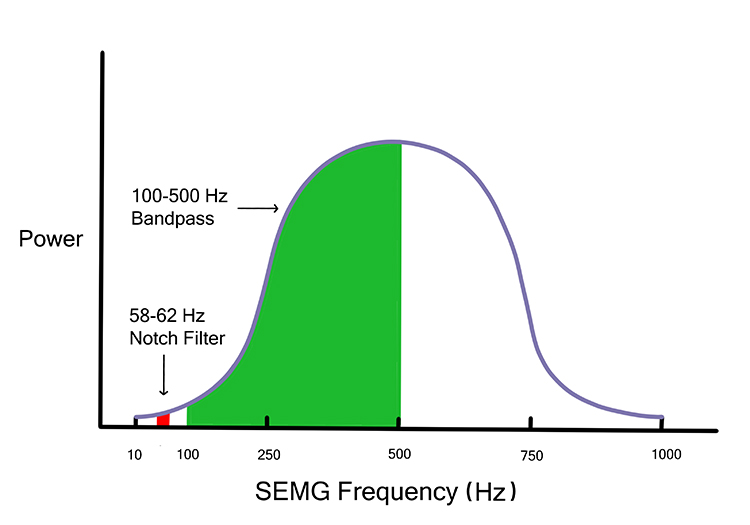
The center frequency lies in the middle of the bandpass. For a 100-500 Hz bandpass filter, the center frequency is 300 Hz. Send a 300-Hz signal into this filter, and 100% will reach the next stage.
Cutoff or corner frequencies are the points where voltage is reduced to 0.707 of its initial strength. For a 100-500 Hz bandpass filter, the cutoffs are 100 Hz and 500 Hz. Send a 100-Hz signal into this filter, and only 71% will get through. This graphic was adapted from Schwartz and Andrasik (2016).
Filter slope is the rate by which voltage is reduced as frequency changes. The slope is expressed as a ratio of decibels (logarithmic ratio of signal strength) per octave (doubling of frequencies).
Filter slopes determine how rapidly an electromyograph excludes frequencies outside the bandpass. Steeper slopes, expressed as higher ratios, are needed when artifacts occupy frequencies near the cutoff frequencies (50/60Hz noise).
How to Select the Right Bandpass
Electromyographs can process frequencies from 20-1000 Hz. Most signal power lies below 200 Hz; 80% of power ranges from 30-80 Hz. There is minimal power above 500 Hz (Bolek et al., 2016; Cram, 1991).
You can select a bandpass by a switch on stand-alone electromyographs and in the sensor housing or software on data acquisition systems.
🎧 Mini-Lecture: Narrow vs. Wide Bandpasses
Two choices are narrow (100-200 Hz) or wide (20-500 Hz) bandpasses. The actual ranges will differ across manufacturers.
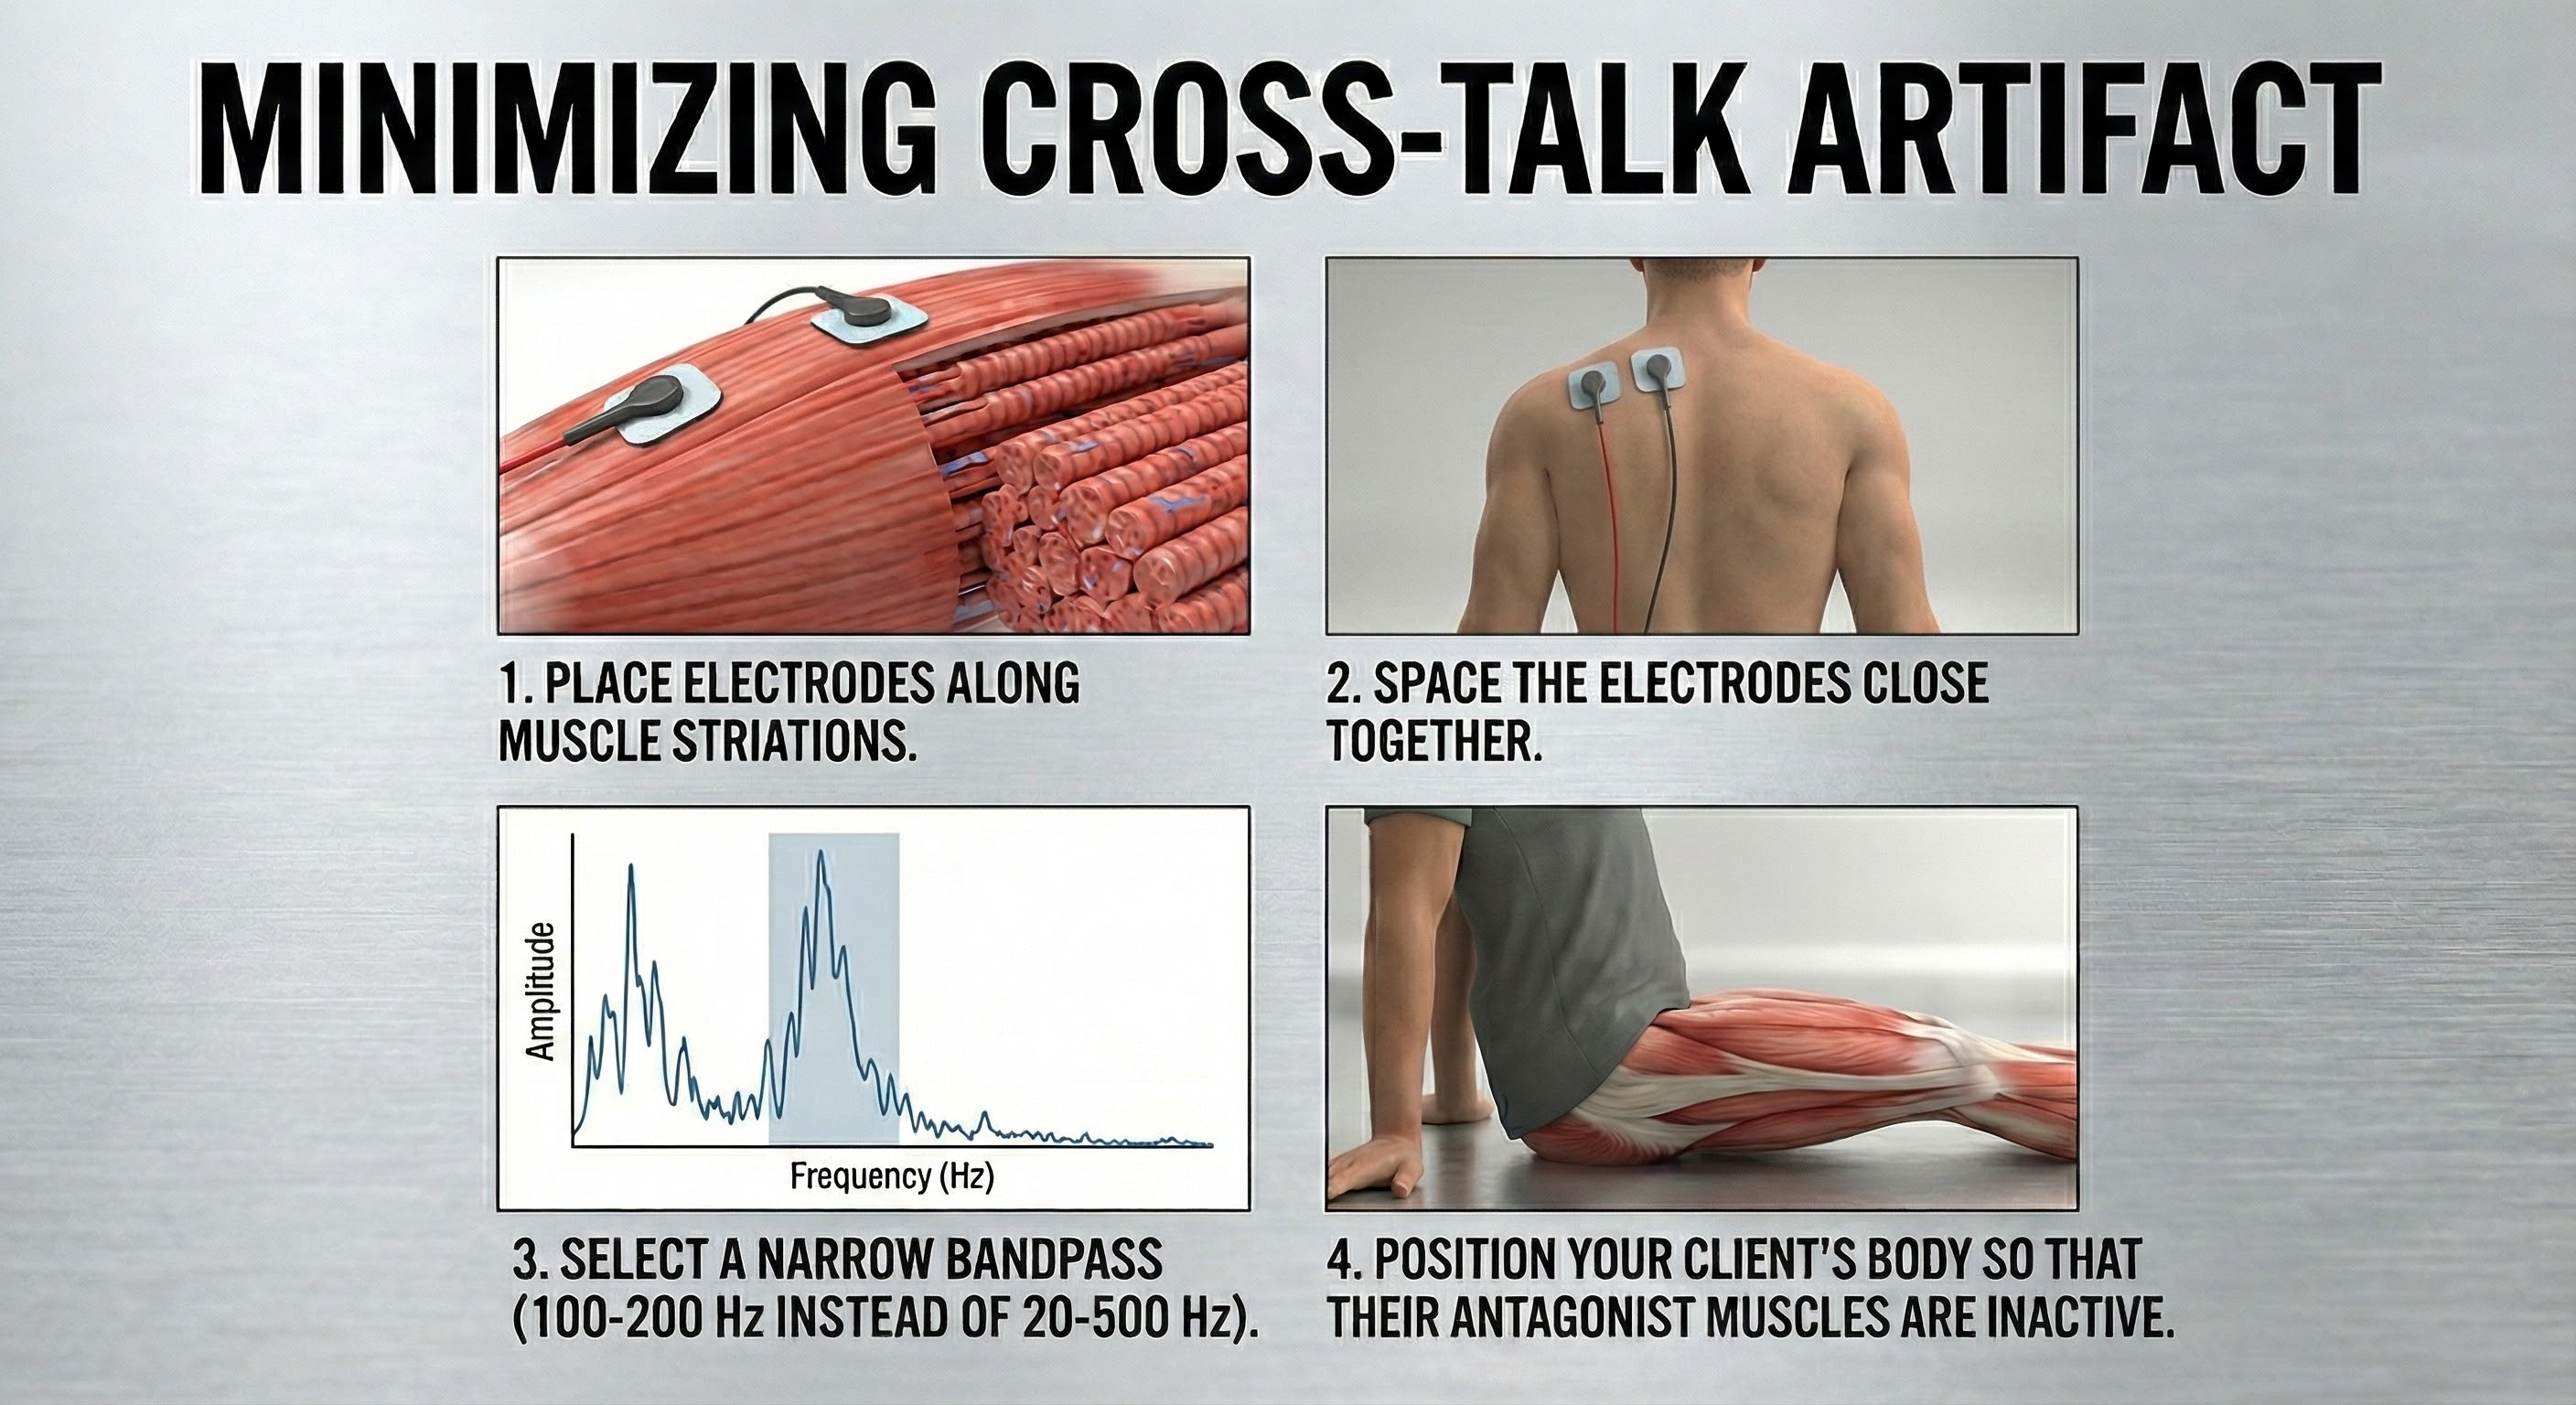
Consider a narrow bandpass when there are high environmental noise levels or when nearby muscles contaminate the measurement of the muscle you are monitoring. A narrow bandpass will result in lower SEMG values than a wide bandpass (Peek, 2016). Select a wide bandpass when noise is acceptable.
Use a wide bandpass when artifact and muscle cross-talk are not problems. Under ideal conditions, a wide bandpass will represent SEMG activity more accurately.
Wide bandpasses can better measure proportional increases in muscle contraction than narrow bandpasses (Sherman, 2002). Wide bandpasses measure SEMG activity more accurately because greater muscle contraction recruits more motor units and more fast-twitch fibers, increasing the amount of signal power in the higher frequencies.
While a wide bandpass can easily detect an increase in power in the 200-500 Hz range, a narrow bandpass can be insensitive to this change because it attenuates frequencies over 200 Hz.
As a client moves from muscle relaxation to strong contraction in the diagram below, a wide bandpass shows an increase from 2 to 9 microvolts, while a narrow bandpass only shows an increase from 1 to 2 microvolts. Diagram adapted from Richard Sherman.
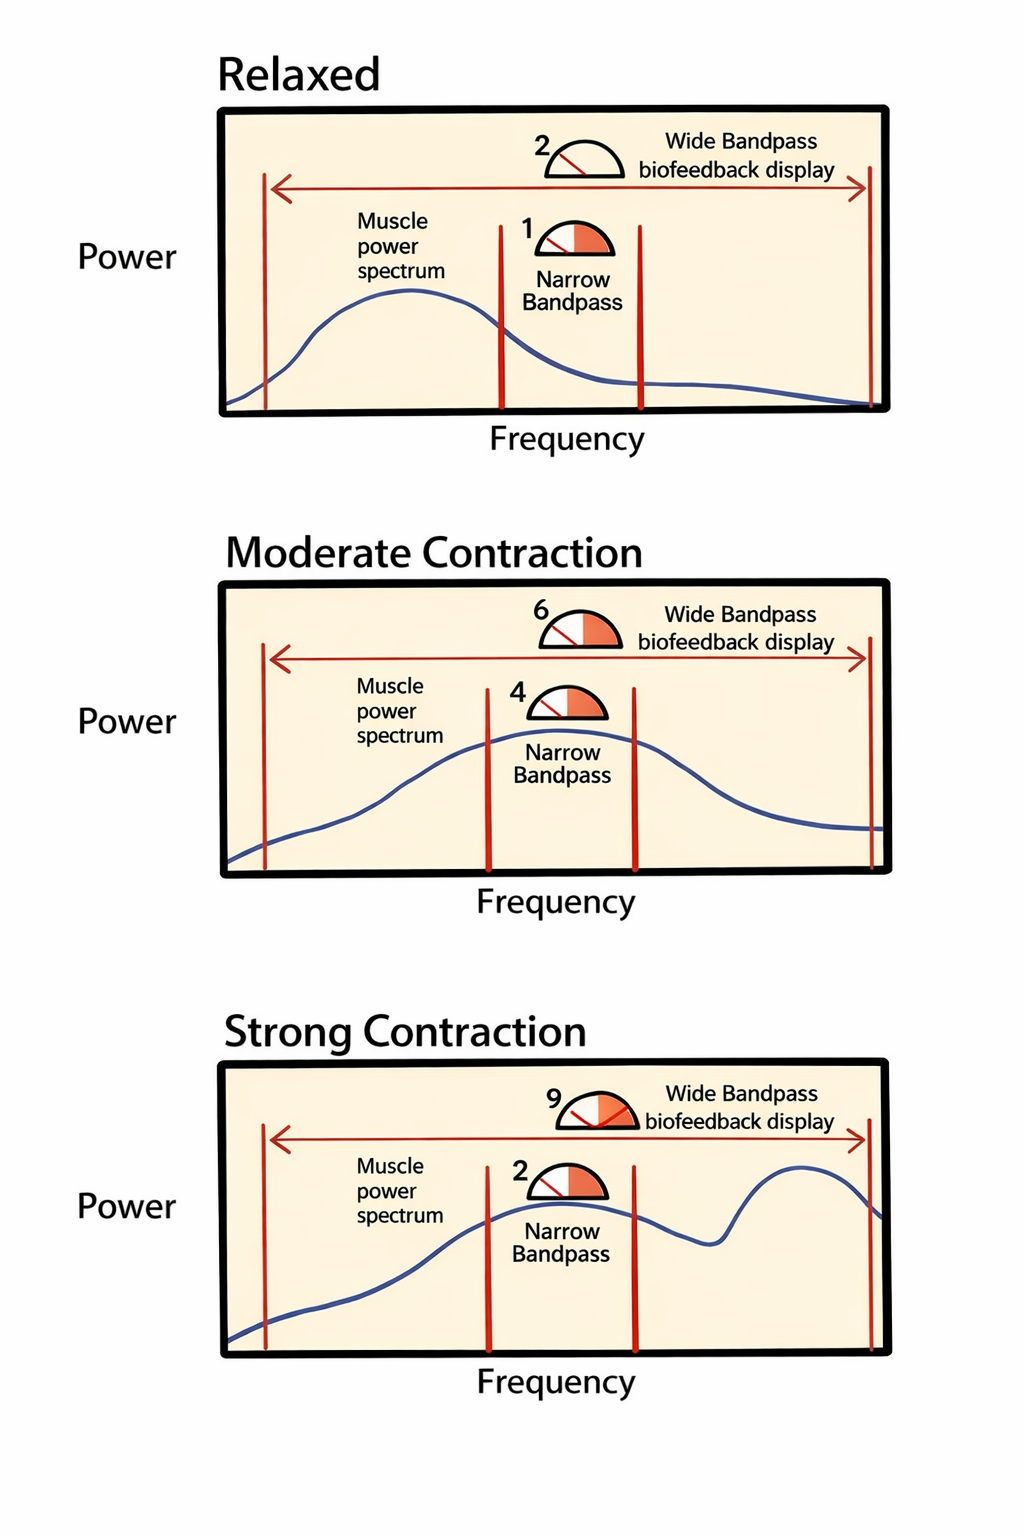
A wide bandpass filter accommodates this spectral shift, allowing it to accurately detect the surge in high-frequency energy; consequently, the display shows a representative increase from 2 microvolts in the relaxed state to 9 microvolts during strong contraction. In contrast, a narrow bandpass filter attenuates frequencies above 200 Hz, making it insensitive to the high-frequency power generated by strong contractions. As a result, the narrow bandpass significantly underestimates the change in muscle effort, registering a marginal increase from only 1 microvolt to 2 microvolts.
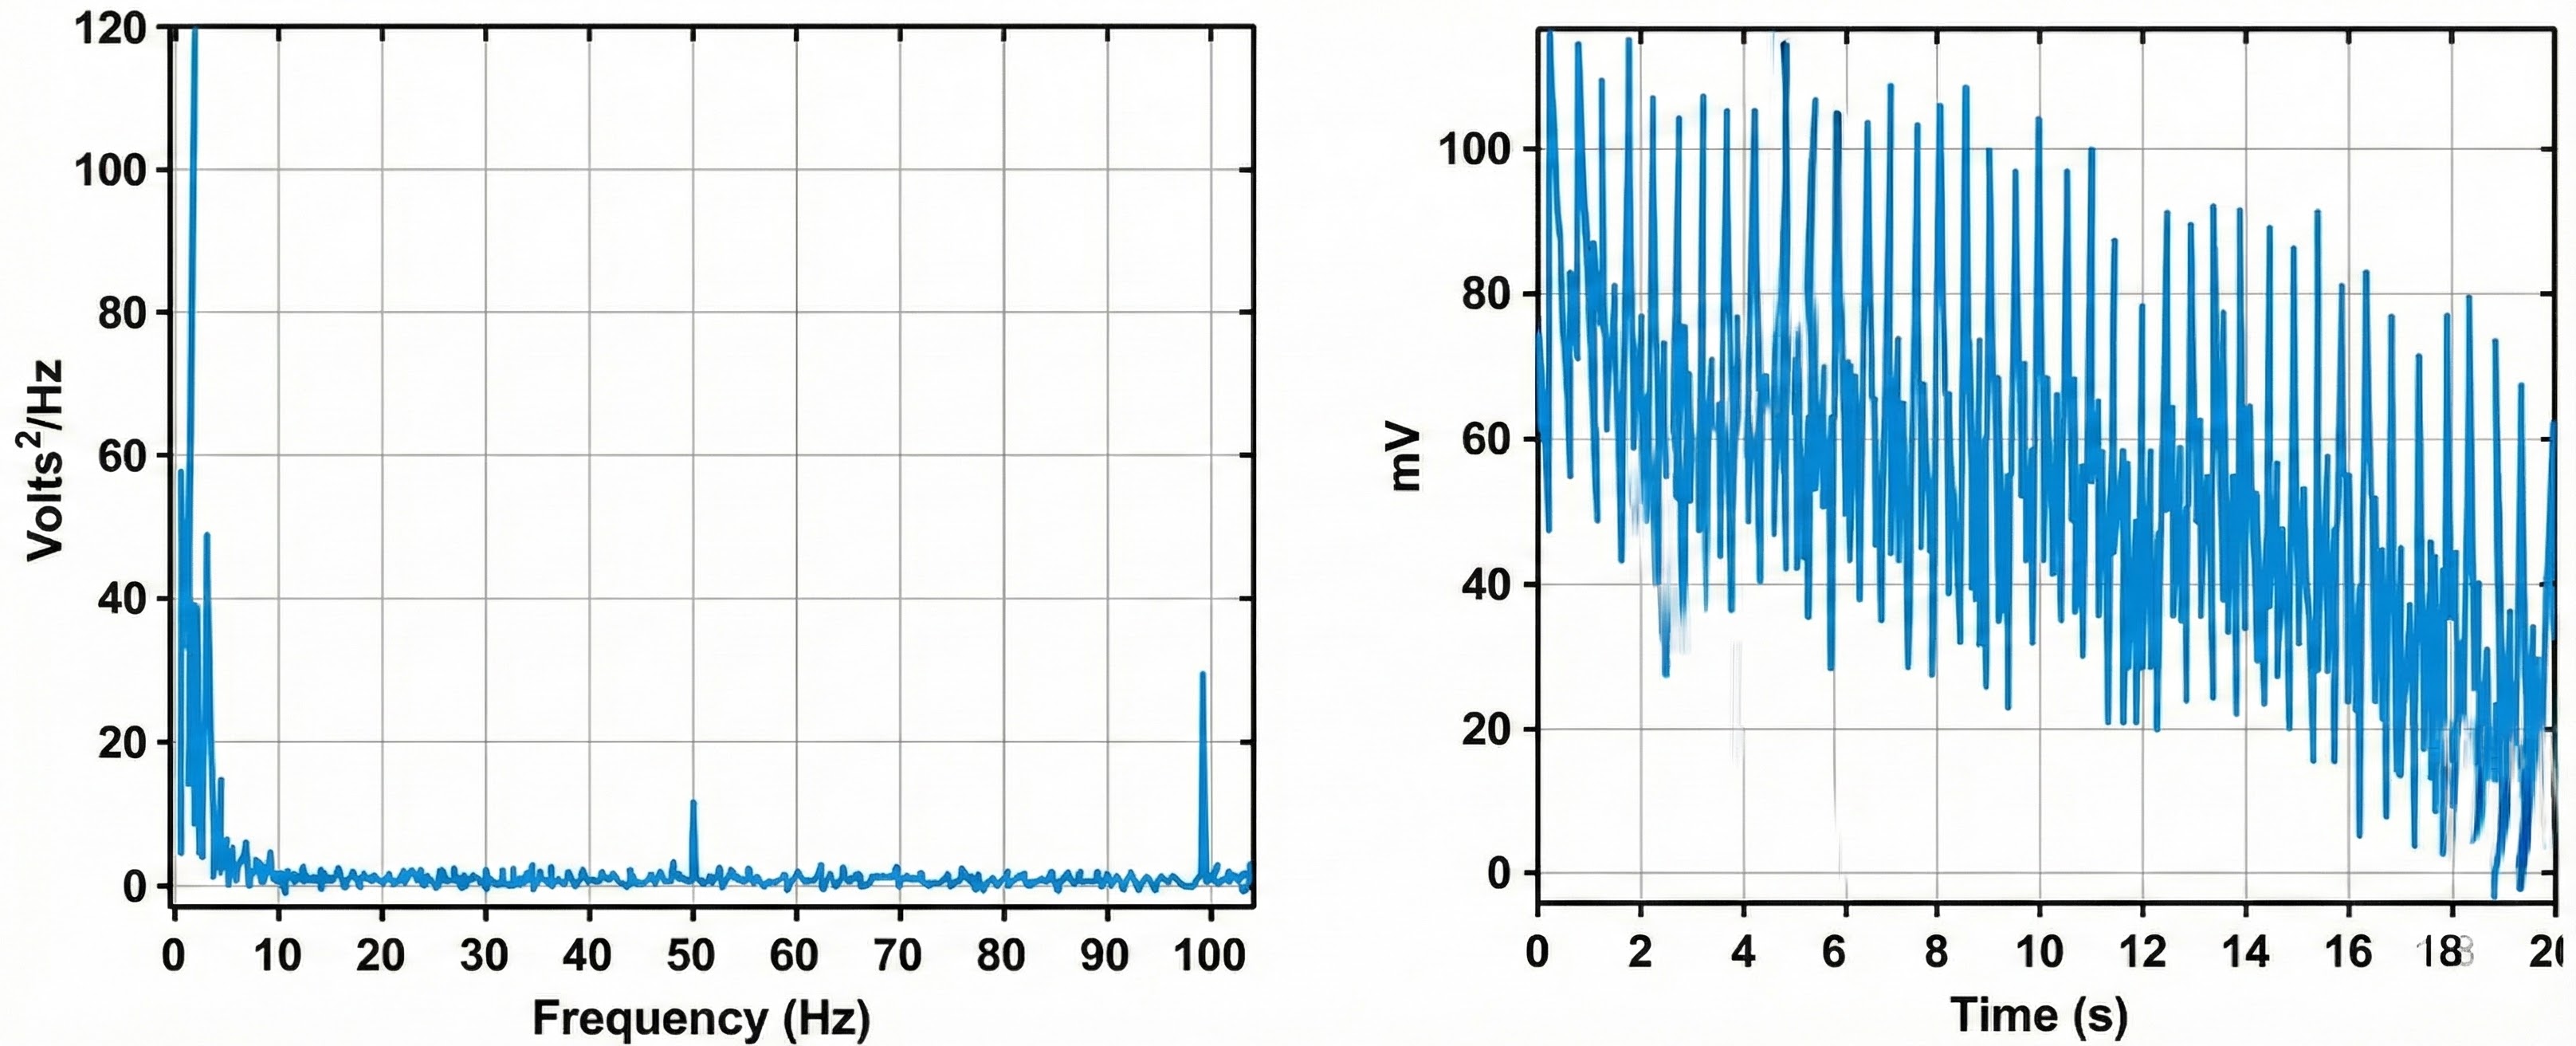
Below is a BioGraph Infiniti display of the raw and integrated SEMG signal and the power spectrum. Power shifts to the higher frequencies, increasing the median frequency as the client contracts the frontales muscles.
Notch Filters Help Control Artifact
Bandpass filters reduce signal voltages above and below the cutoff frequencies. The degree of signal attenuation depends on the filter slope. Engineers developed notch filters because artifacts can contaminate SEMG signals within the bandpass.
A notch filter rejects a narrow range of frequencies within the bandpass that contain the most energetic artifacts like 50/60Hz.
Practically, these signals may still contaminate measurements to some degree. A notch filter is designed to reject a narrow range of frequencies (containing artifact) admitted by the bandpass filter. Fifty/sixty-Hz artifact removal is illustrated below by a recreated screen from Thought Technology Ltd.'s Basics of Surface Electromyography Applied to Physical Rehabilitation and Biomechanics (2009).
Engineers design electromyographs with selectable notch filters for your region's power line frequency, which will generally be 50 Hz or 60 Hz. Power grid reversal 50 or 60 times a second generates these frequencies. Your powerline frequency is the most potent source of environmental SEMG contamination.
Notch filters significantly reduce signals from about 48-52 for 50-Hz power line frequencies and 58-62 Hz for 60-Hz frequencies.
Although a notch filter preserves common-mode rejection in high-noise environments, there is no free lunch in biomedical engineering. Notch filters suffer two main limitations.
First, a 50/60Hz notch filter does not affect harmonics or multiples of 50/60Hz artifact (analogous to spreading ripples on a still pond) at 100/120 Hz, 150/180 Hz, and 200/240 Hz.
Second, biological signals we want to measure may be eliminated along with artifact since the bulk of the SEMG signal lies between 10 and 150 Hz (Andreassi, 2007). The decision to enable a notch filter should depend on the degree to which artifact would contaminate a recording. While imperfect, notch filters strike a reasonable compromise between artifact reduction and signal preservation.
Signal-to-Noise Ratio and Sensitivity
Skin preparation, differential amplification, bandpass selection, and notch filters collectively determine the amount of artifact that contaminates the SEMG signal. The signal-to-noise ratio compares SEMG and artifact voltages. This specification should exceed 60 dB (1,000:1) at 50/60Hz for adequate sensitivity or detection of weak signals.
Sensitivity allows an electromyograph to discriminate a low SEMG value during relaxation from background noise. State-of-the-art instruments achieve ratios exceeding 100 dB (100,000:1).
Dummy Subjects Allow Us to Measure Total Noise
You can measure total noise in your clinic or laboratory environment using a dummy subject.
🎧 Mini-Lecture: Dummy Subjects
Attach an EMG electrode cable to a circuit board called a dummy subject. Its two 10-Kohm resistors (shown below) simulate the impedance of a human subject. Simply insert the cable with the dummy subject connected into an electromyograph channel in your encoder box and record the resulting activity in microvolts for 1 minute.
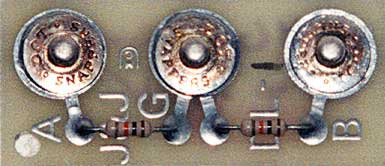
The average value calculated by the electromyograph will represent total noise: environmental and hardware-generated noise. The value should be under 0.25 microvolts so that you can distinguish muscle relaxation from background noise. Most muscles should be under 3 microvolts (Khazan, 2019).
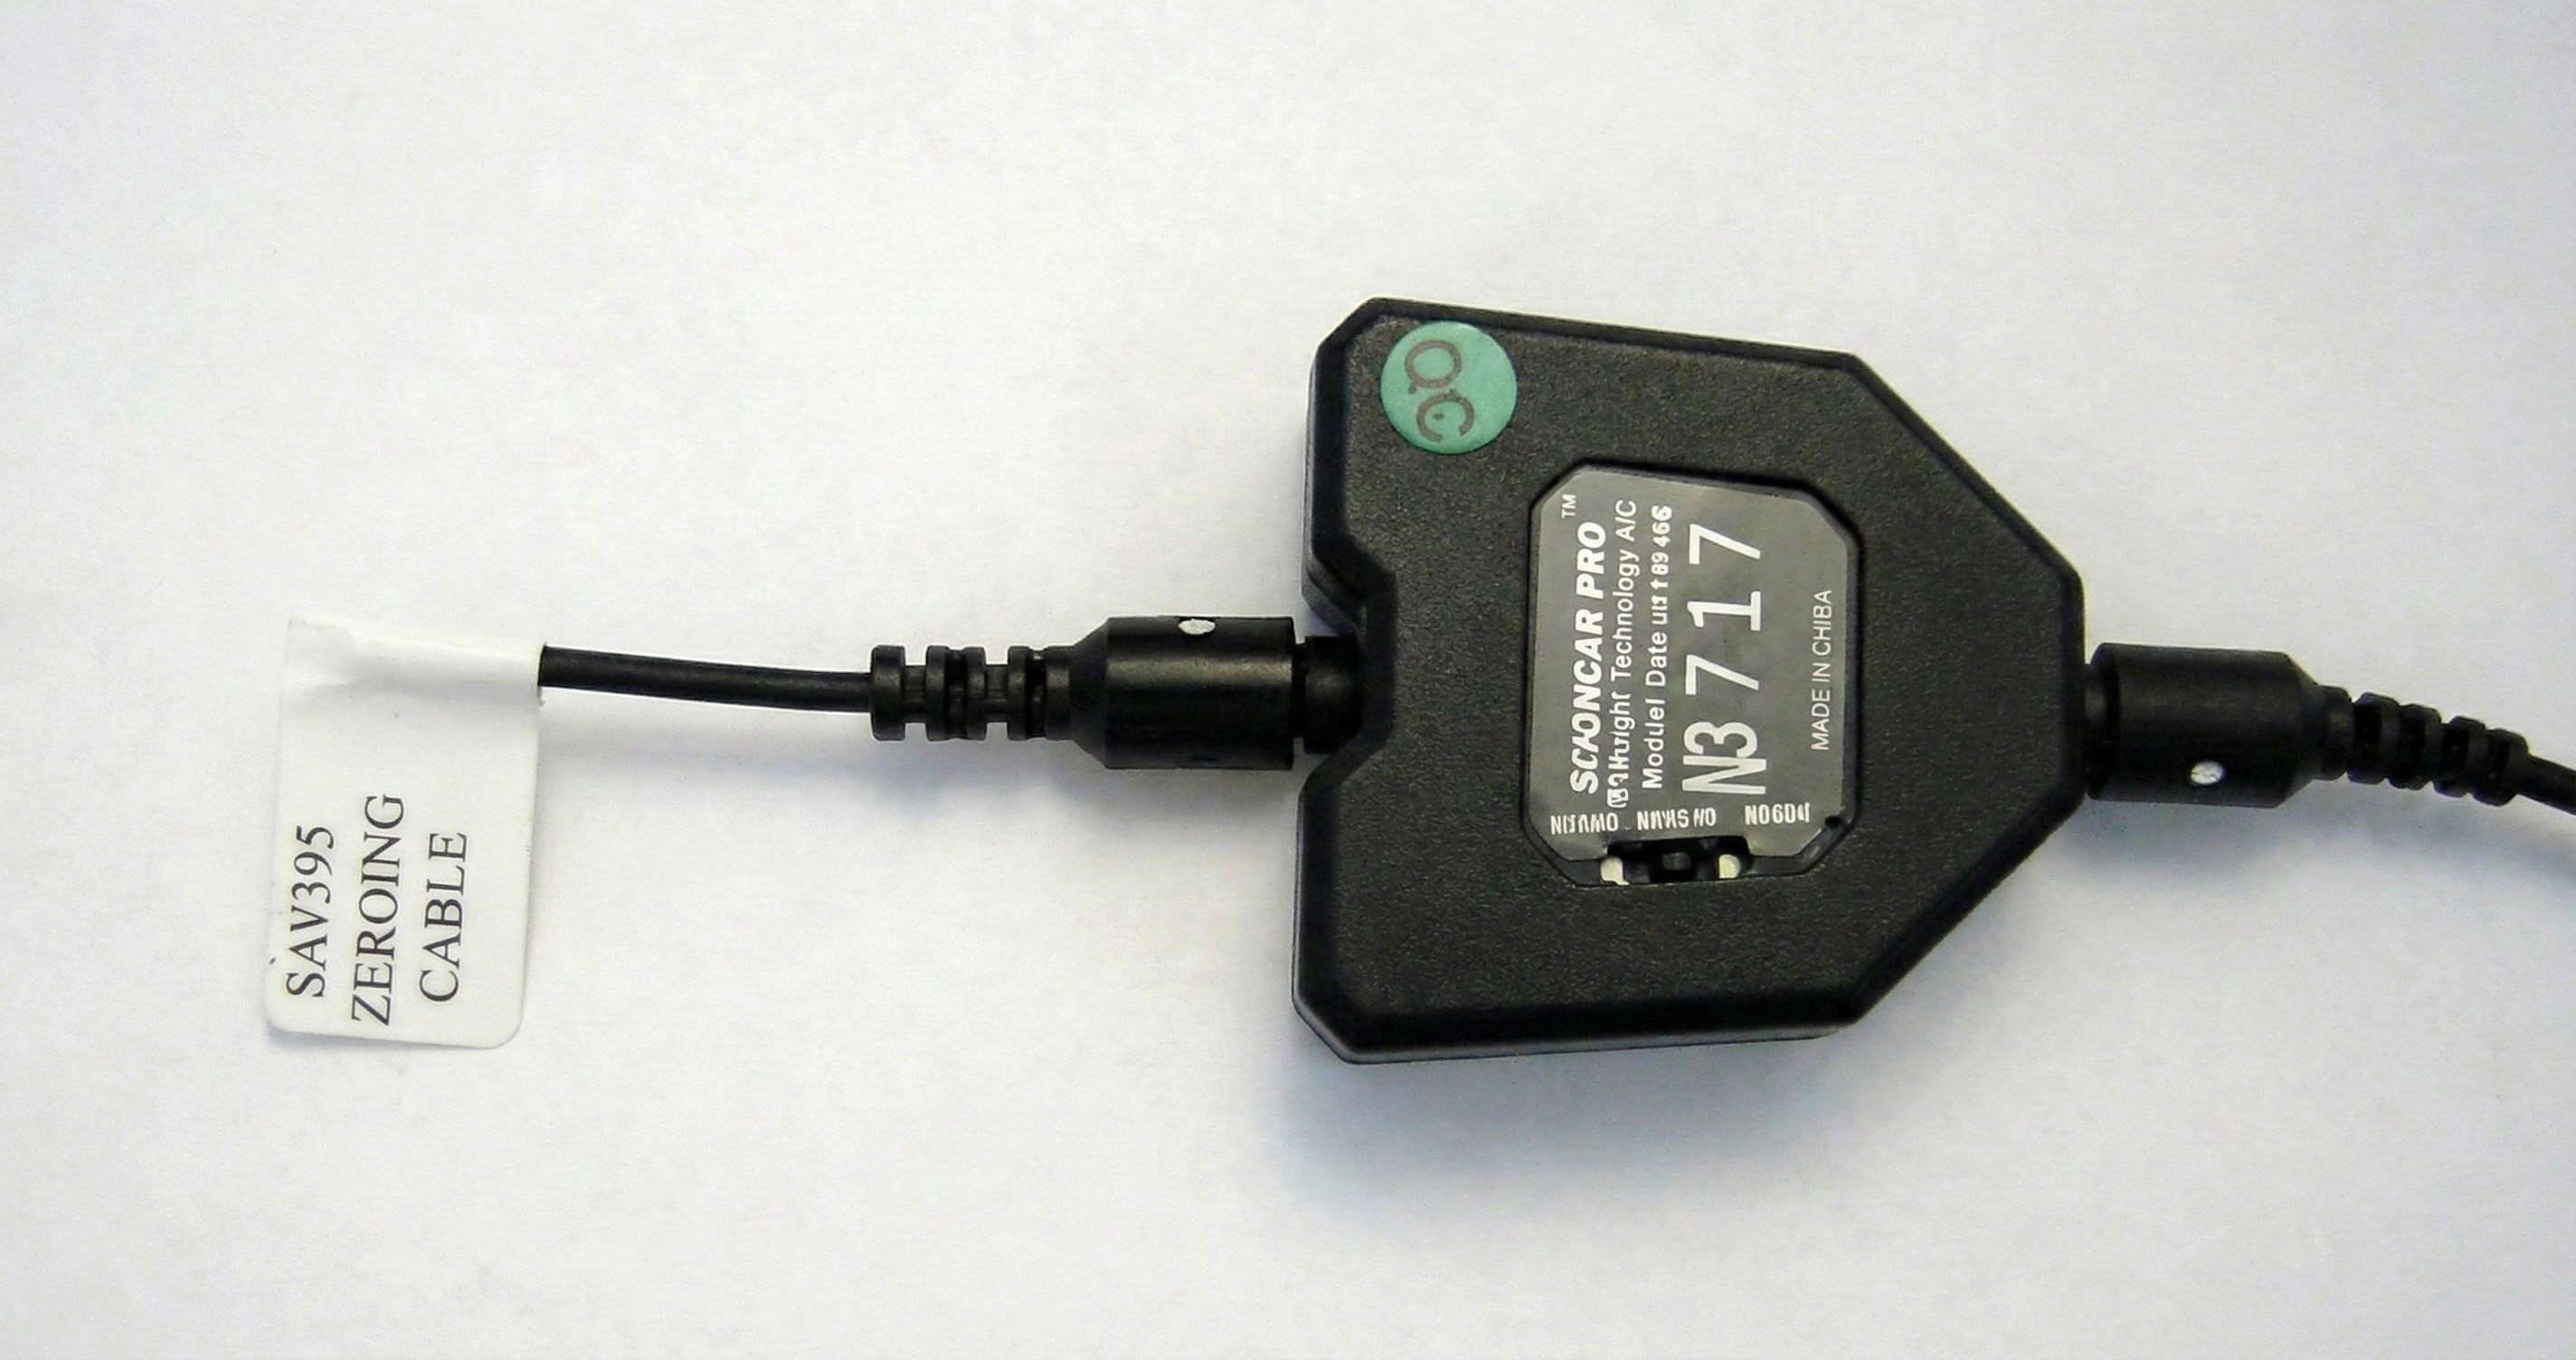
Calibrate Your SEMG Sensor
Some data acquisition systems like Thought Technology Ltd.'s Infiniti system allow you to calibrate a specific SEMG sensor for a particular SEMG channel by inserting a zeroing clip.
A zeroing clip shorts the sensor's inputs to allow the system to adjust for offset errors (readings that are too high or low). For example, if the SEMG amplitude for a specific sensor in one particular channel is 0.1 microvolts too high, the software will subtract 0.1 microvolts from all its future readings. You will need to repeat calibration whenever you replace the original SEMG sensor.
Rectification
Here is another fixed feature that works automatically every time you record. The filtered SEMG signal is an AC waveform, meaning it swings above and below zero like a sine wave. If you tried to add up all those positive and negative swings, they would cancel each other out, giving you a total of zero, which is not very useful for measuring muscle activity.
A rectifier solves this problem by flipping the negative portions of the signal to positive, so everything can be summed meaningfully. You do not choose your rectifier; the manufacturer built it into your device.
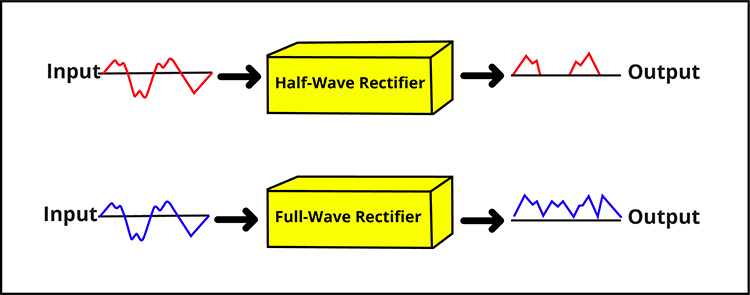
Manufacturers use one of two approaches. A half-wave rectifier keeps only the positive half of each cycle and discards the negative half. A full-wave rectifier flips the negative half to positive, preserving all the signal energy. Full-wave rectification captures more information and is more common in modern instruments. Graphic adapted from Schwartz and Andrasik (2016).
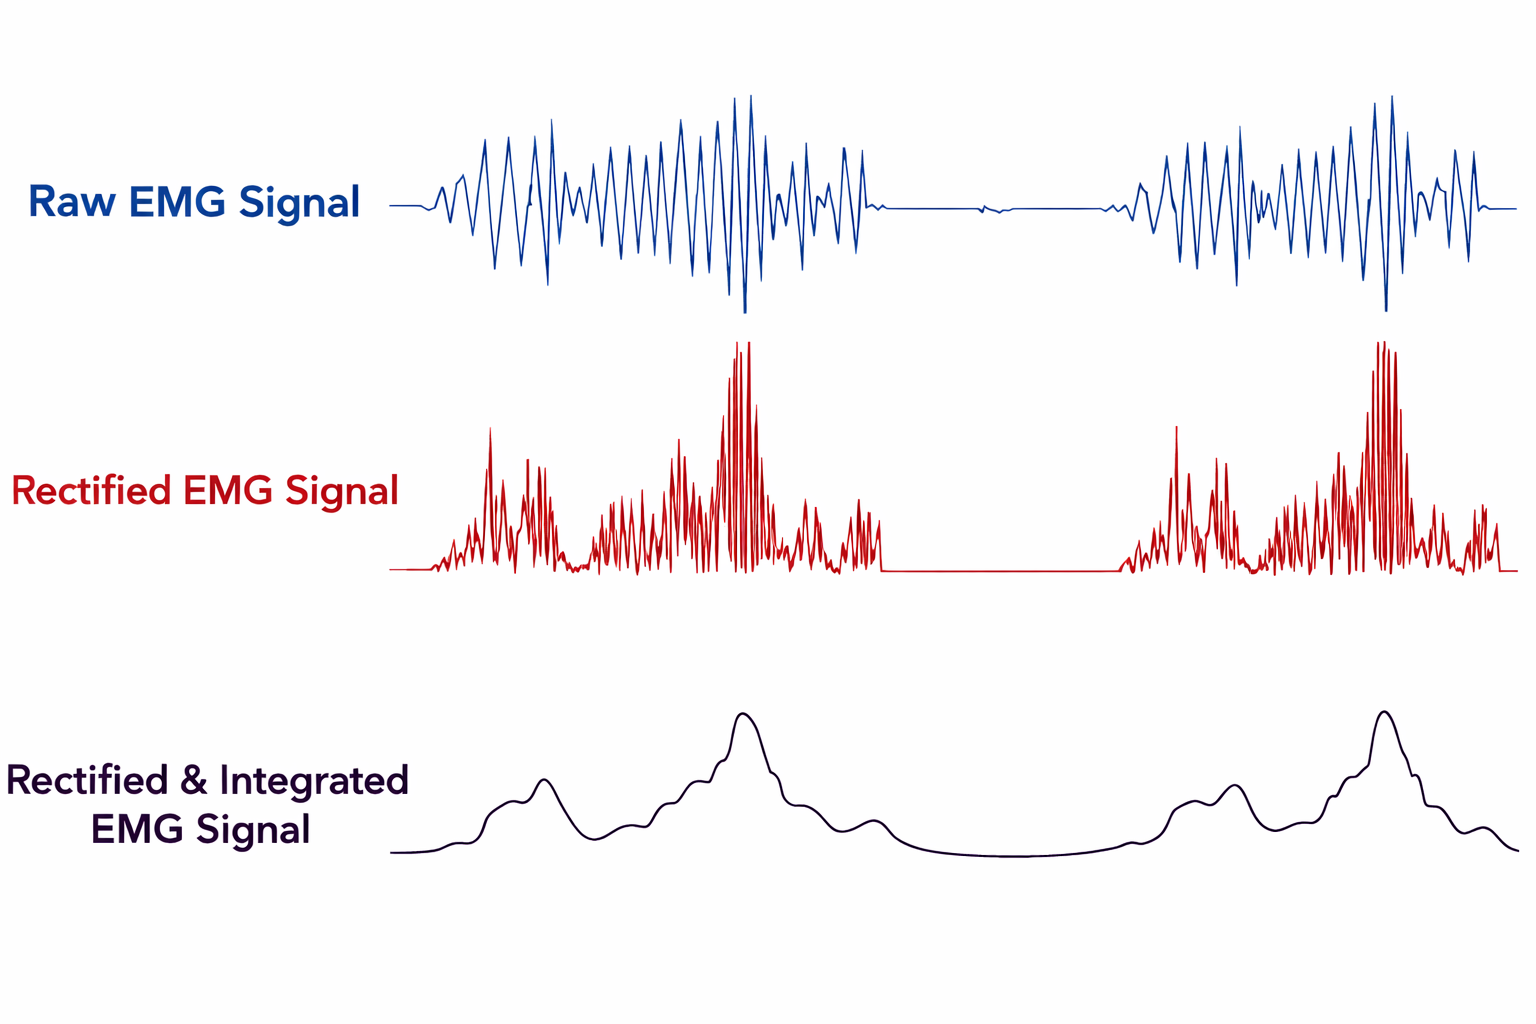
Raw, rectified, and integrated SEMG signals are shown below. Notice how rectification transforms the raw signal into something that can be meaningfully summed. Graphic adapted from AdvancerTechnologies.com.
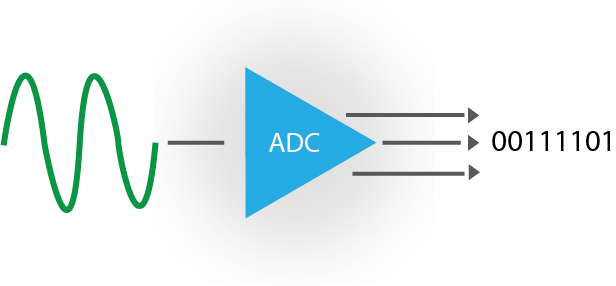
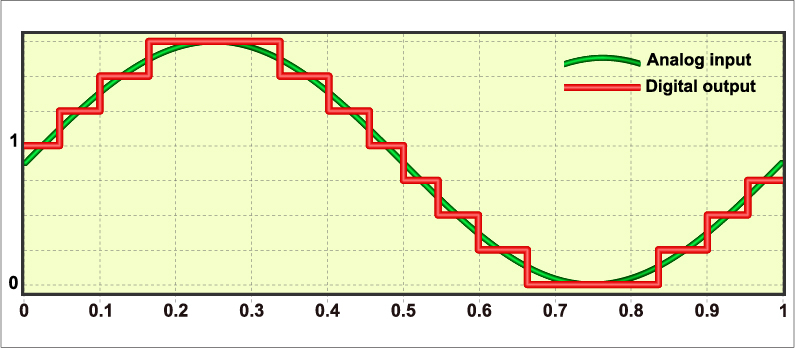
Analog-to-Digital Conversion
Up to this point, the signal has been analog, a continuous voltage that varies smoothly over time. But computers work with numbers, specifically zeros and ones. Before your electromyograph can measure, store, or display the signal, it must convert that smooth analog wave into digital data. This is another fixed feature happening automatically inside your device. Graphic from OpenLabPro.com.
Sampling Rate
An analog-to-digital (A/D) converter takes snapshots of the voltage at regular intervals. The sampling rate is how many snapshots it takes per second. Think of it like frames in a video: too few frames per second and the motion looks jerky; too few samples per second and the signal looks distorted. Quality A/D converters should resolve voltages as small as 0.5 microvolts, capturing subtle changes in muscle activity. Graphic from Fouad A. Saad/Shutterstock.com.
Nyquist Theorem
The Nyquist theorem provides a simple rule: sample at least twice as fast as the highest frequency you want to capture. Since SEMG signals contain minimal power above 500 Hz, a sampling rate of at least 1,000 samples per second works well. For slower signals like skin conductance and temperature, which max out around 16 Hz, 32 samples per second suffices.
Sample too slowly and you get aliasing, where high-frequency components masquerade as lower frequencies, creating false signals that were never really there (Lubar & Gunkelman, 2003; Teplan, 2002; Thompson & Thompson, 2016). Fortunately, manufacturers set the sampling rate appropriately for each modality, so this is handled for you.
Bit Depth
Bit depth determines how finely the A/D converter can distinguish between different voltage levels. Using the equation N = 2 to the power of X, where X is the number of bits, you can calculate the number of distinct levels. A 16-bit converter discriminates among 65,536 voltage levels, while a 24-bit converter discriminates among over 16 million levels. Greater bit depth means the instrument can detect smaller changes in muscle activity, which matters when you are training subtle relaxation or detecting early fatigue.
An A/D converter with a bit depth of 16 calculates 65,536 values, and one with a bit depth of 24 calculates 16,722,216 values. The greater the bit depth, the smaller the physiological changes detected.
For SEMG biofeedback training, 16-bit processing is recommended, while for research, 24-bit resolution may be preferred (Bolek, 2013). For neurofeedback training, 16-bit resolution is preferred (Lubar & Gunkelman, 2003).
Mind Media's NeXus-10 claims 24-bit resolution and a sampling rate of 2048 samples per second, while Thought Technology Ltd.'s ProComp Infiniti claims 14-bit resolution and a sampling rate of 2048 samples per second.
Integration Allows Us to Measure SEMG Voltage
Now that we have a rectified signal that has been converted into 0's and 1's, we can add SEMG voltage over time to determine whether a muscle is relaxed or tense. The rectified SEMG signal is sent to an integrator to measure signal amplitude in microvolts.
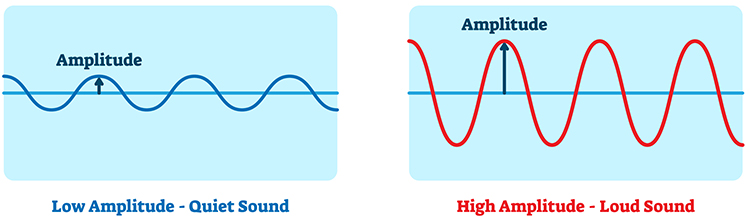
Amplitude, the strength of the EMG signal measured in microvolts, is analogous to the loudness of a sound. Graphic from VectorMine/Shutterstock.com.
Four Integration Methods
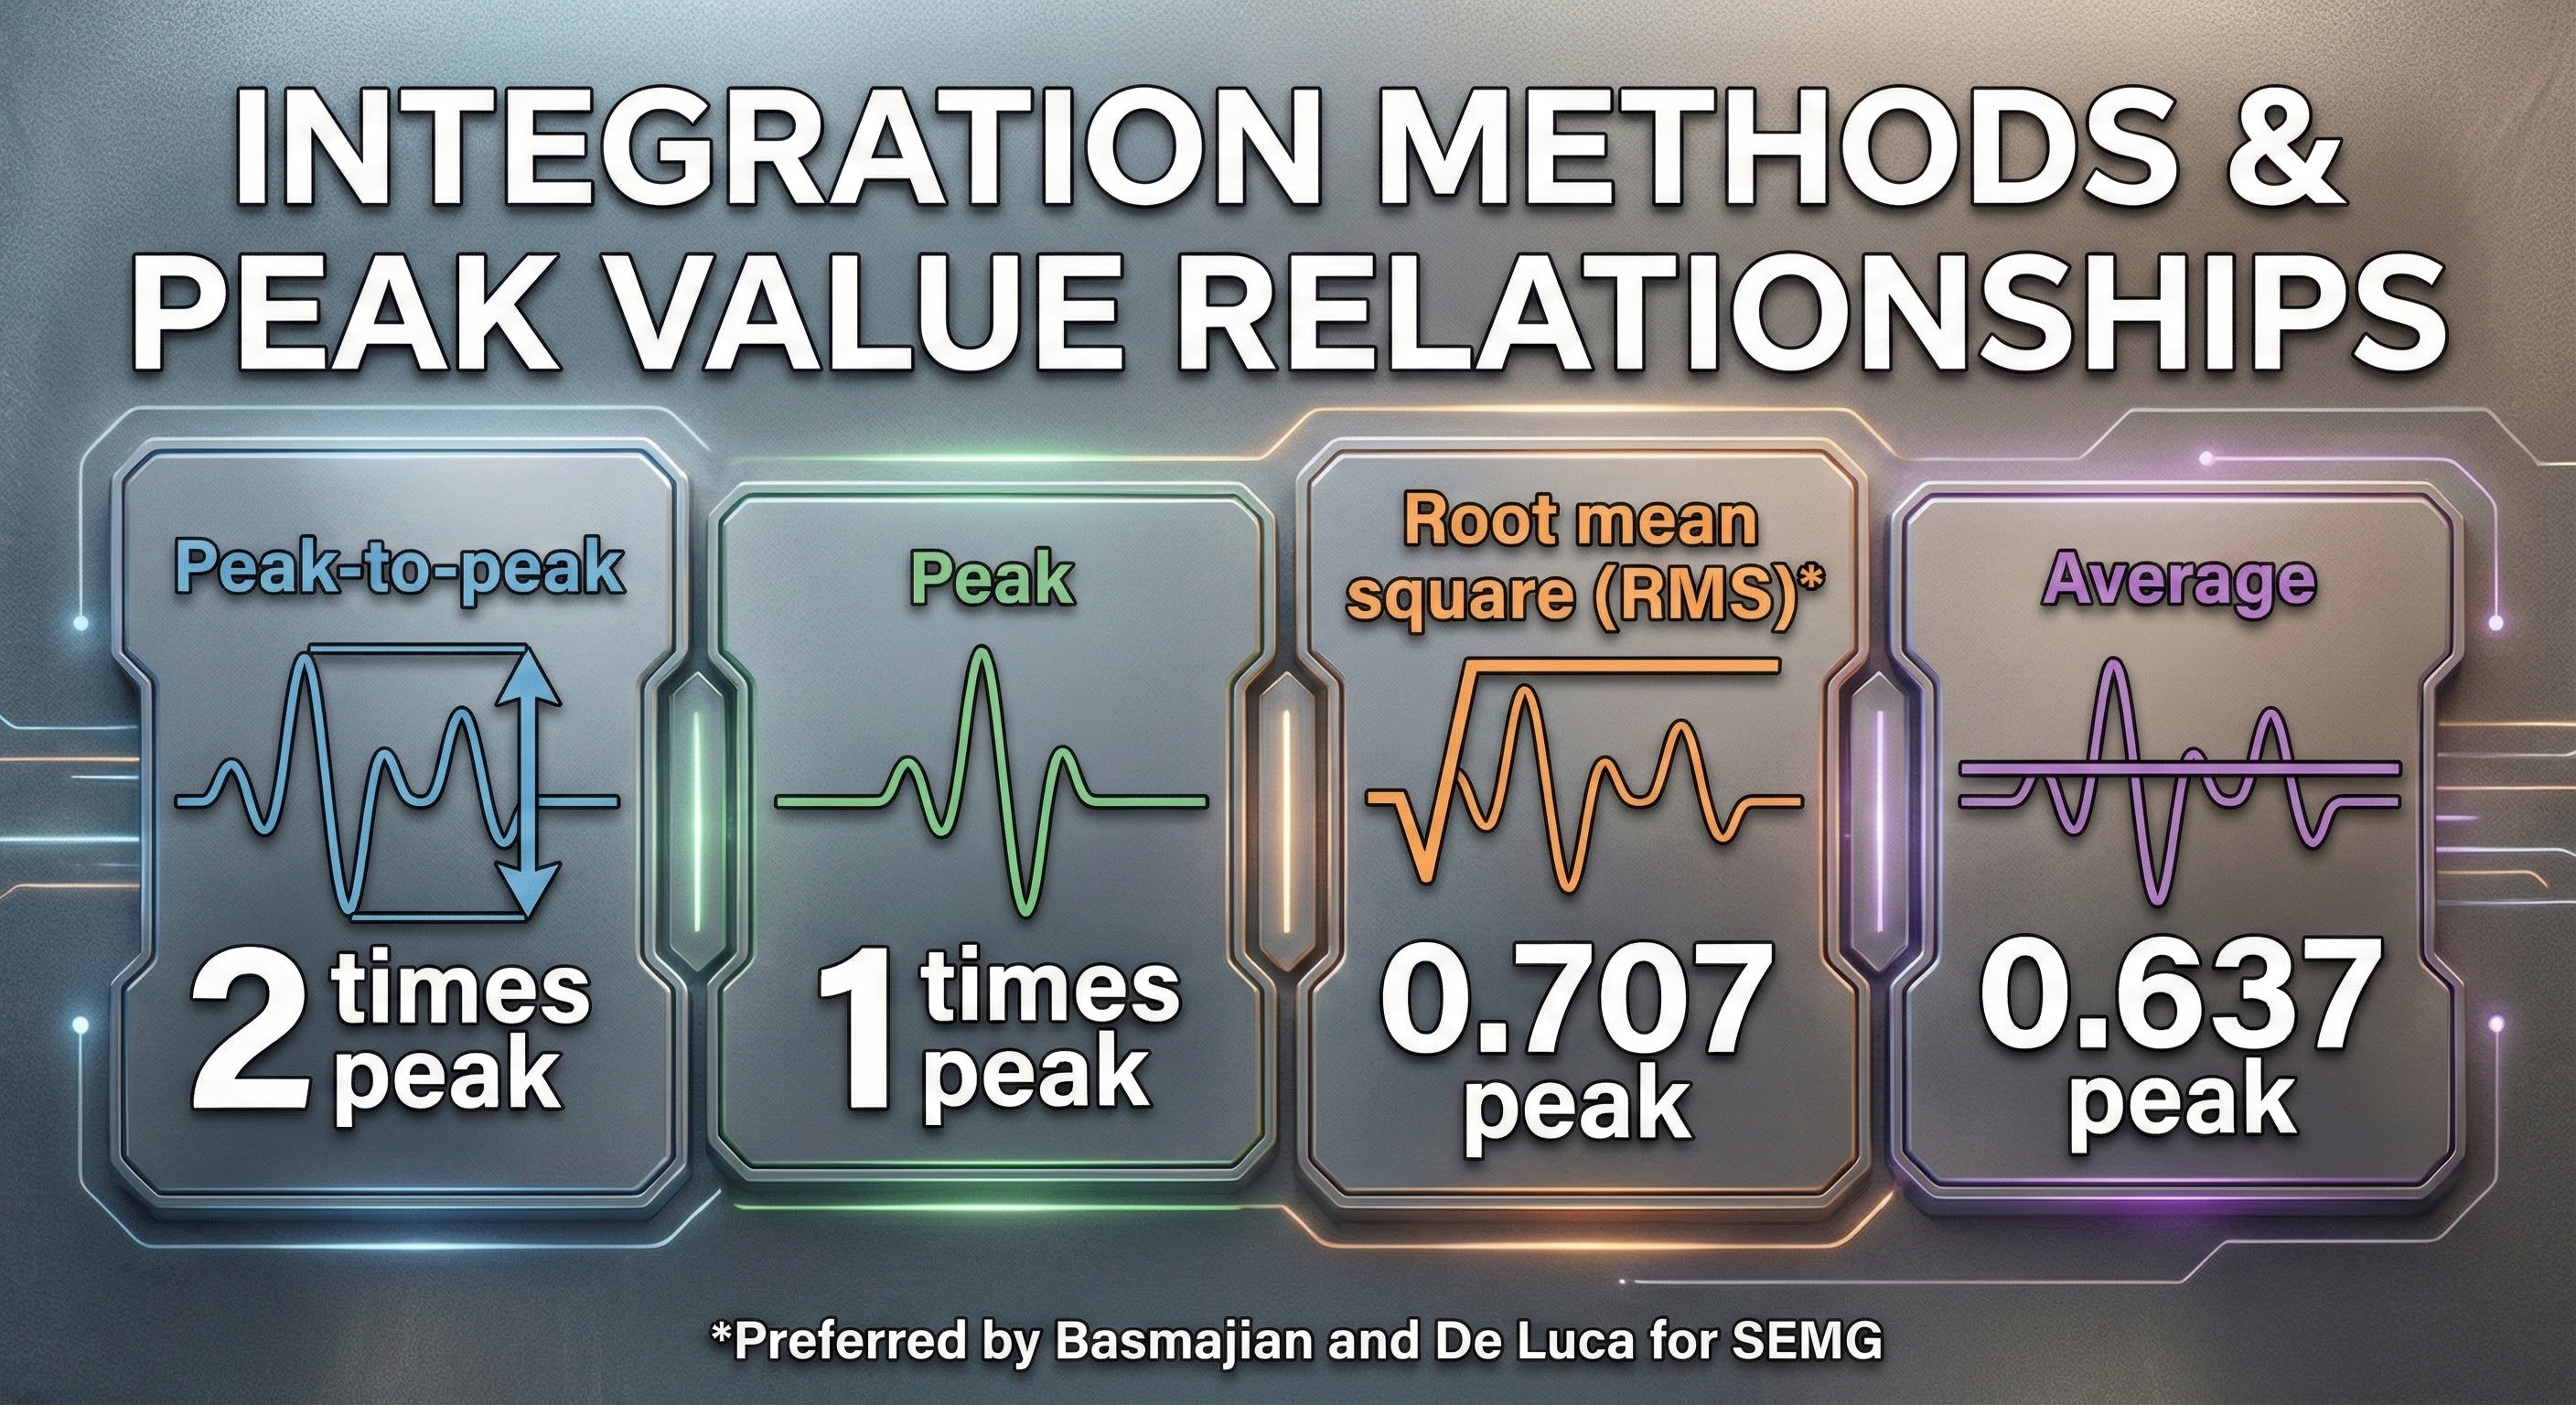
Integrators use four methods to calculate voltage: peak-to-peak, peak, root mean square, and average.
The peak-to-peak method provides the largest estimate, equivalent to the energy between the positive and negative peaks of the original AC waveform, which is 2 times the peak value.
Peak voltage is 0.5 of the peak-to-peak value.
Root mean square (RMS) voltage is 0.707 of the peak value and 20% higher than the average voltage.
Average voltage is 0.637 of the peak value.
Conversion among these methods is straightforward. If peak-to-peak voltage is 20 microvolts, peak voltage is 10 microvolts, root mean square voltage is 7.07 microvolts, and average voltage is 6.37 microvolts.
EMG signal integration using the RMS method is shown below by a graphic adapted from Thought Technology Ltd.'s Basics of Surface Electromyography Applied to Physical Rehabilitation and Biomechanics (2009).
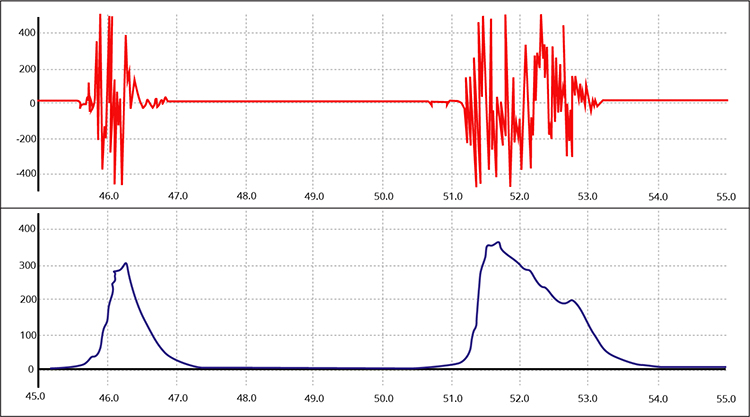
Biomedical engineers mainly use the root mean square and average methods to measure EEG and SEMG signals. Basmajian and DeLuca recommended the root mean square method for quantifying the SEMG.
Below is a NeXus-10 BioTrace+ display of the raw and integrated 100-500 Hz SEMG signal generously provided by John S. Anderson.
SEMG Voltages Are Relative, Not Absolute
Whereas two different feedback thermometers should register the same room temperature, we cannot assume the same for two electromyographs' measurement of SEMG voltage. Another elephant in the room is that SEMG amplitude is a relative measurement of skeletal muscle electrical activity because measurement depends on a surprising number of parameters, some controllable and others intrinsic to your client or electromyograph. Graphic from Aleksandr_Kuzmin/Shutterstock.com.
.jpg)
🎧 Mini-Lecture: Factors That Influence SEMG Voltage
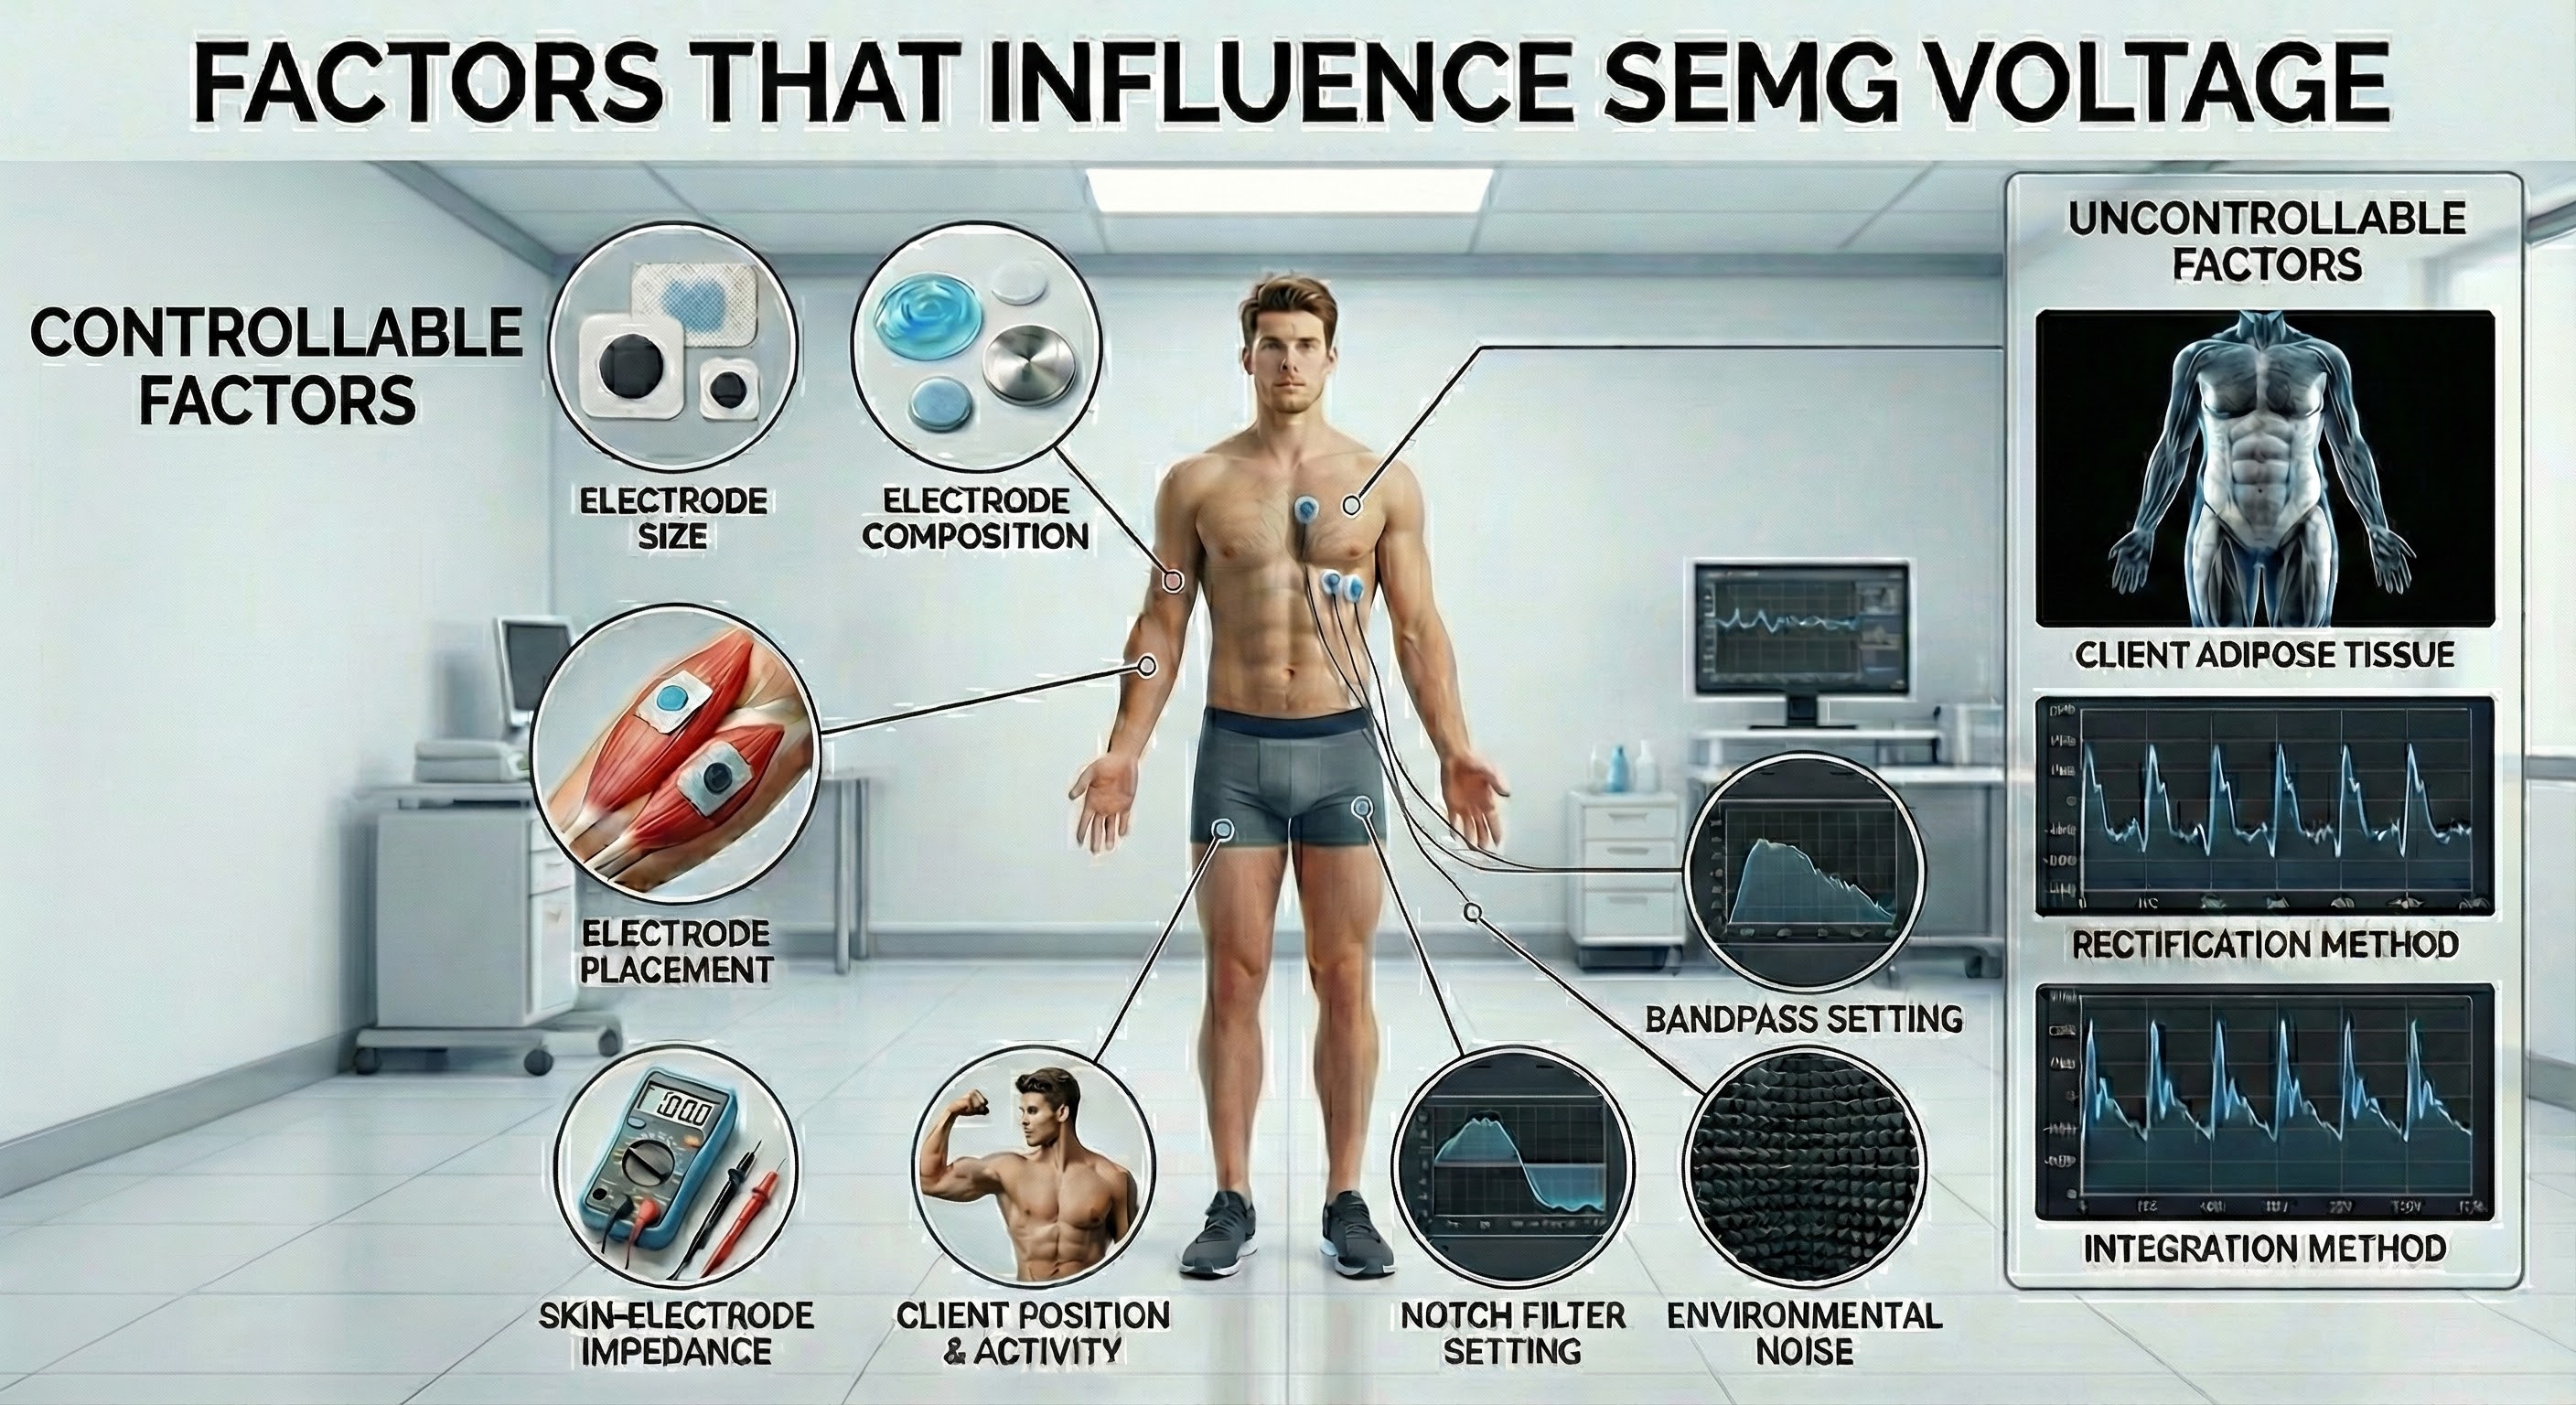
The relativity of SEMG voltages characterizes all biofeedback modalities. Temperatures are no more absolute than SEMG values. When you attach a temperature probe to a client, factors like cold exposure before entering the clinic, stabilization period, sensor placement, task, and your relationship with the client can greatly affect temperature readings. All psychophysiological measurements are affected by hardware, environmental, procedural, and client factors. Experienced clinicians and researchers manipulate controllable factors and standardize those not controllable to increase measurement validity.
To compare SEMG values across session pre-baselines, standardize the electrodes, placement, skin-electrode impedance, baseline conditions, location in the room, bandpass and notch filter settings, and rectification and integration methods.
Consider Your Client's Adiposity When Interpreting SEMG Values
Adipose tissue filters the SEMG signal and reduces its amplitude. Consider your client's subcutaneous fat when interpreting SEMG measurements from different sites on the same individual or the same location between individuals (Shaffer & Neblett, 2010).
A reading of 5 microvolts obtained from one electromyograph could easily be 8 microvolts on another due to different bandpasses and integration methods. In contrast, temperature measurements are absolute because two feedback thermometers should register the same room temperature.
SEMG Values Do Not Measure Contraction Force

Signal processing involves amplification, filtering, rectification, and integration. Differential amplifiers reject common-mode noise. Bandpass filters select frequencies of interest while notch filters remove powerline interference. The sampling rate must be at least twice the highest frequency to avoid aliasing. SEMG values are relative measurements affected by many factors.
Comprehension Questions
- How does a differential amplifier reduce artifact contamination?
- What is the minimum acceptable CMRR for a biofeedback instrument?
- When would you choose a narrow bandpass versus a wide bandpass?
- Why must the sampling rate be at least twice the highest signal frequency?
- What factors make SEMG a relative rather than absolute measurement?
Biofeedback Display Settings
Now that we can integrate SEMG voltages, we must display this information to a client. We will need to choose an appropriate time constant, vertical scale, and display speed.
Time Constant
We have to decide how long to average them before displaying SEMG activity to a client. Software allows us to select a time constant that specifies the averaging period. Your choice of time constant will depend on the goal of SEMG training.
🎧 Mini-Lecture: Time Constants
For neuromuscular rehabilitation, a short time constant (0.5 seconds) that reveals minute, rapid changes could be valuable. However, a longer time constant (2 seconds) that updates the display more slowly would be more appropriate for relaxation training.
Vertical Scale (Resolution)
We can automatically or manually adjust a biofeedback screen's resolution (the degree of signal change) by changing its scale (the range of values displayed).
🎧 Mini-Lecture: Display Resolution
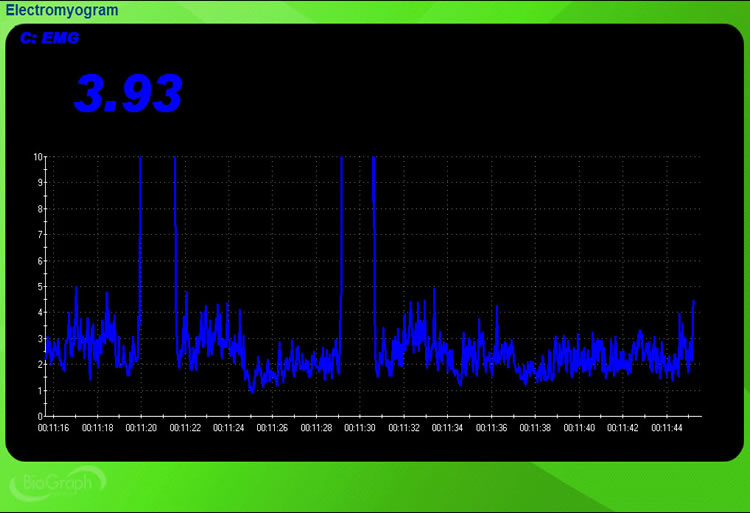
The scale should provide sufficient information to enable a client to recognize changes in signal strength and learn voluntary control. You can determine the vertical scale by examining the vertical axis range on the left of the display. In the BioGraph Infiniti display below, a 0-10 microvolt scale is too narrow to show the two vigorous contractions, so it cuts off the 100-microvolt signal peaks.
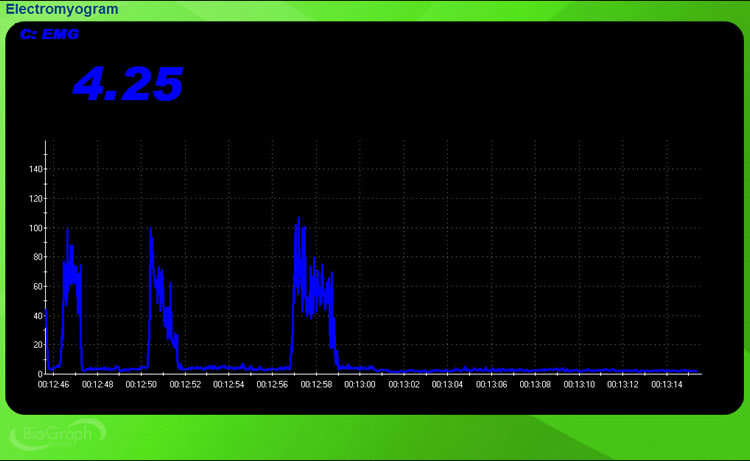
In the BioGraph Infiniti display below, a 0-150 microvolt scale accommodates the large voltage changes.
When a muscle is weak or when a client has reached a plateau, the SEMG signal may not show any change. An unresponsive display can be highly frustrating for a client. To remedy this problem, you can increase the display resolution to reveal smaller change increments. For example, instead of a vertical range of 0-5 microvolts, you might choose 0-2 microvolts. For SEMG training, a resolution of 0.1 to 0.25 microvolts may be desirable when signal voltage does not rapidly change.
Select an Appropriate Display Speed
The display speed determines how quickly a screen refreshes.
We can determine the display speed by examining the horizontal timeline at the bottom of the screen, which runs from 12.46 to 13.16 (30 seconds).
A speed that is too slow (e.g., 2 minutes) is no longer real-time, making it harder for a client to associate sensations and strategies with physiological change. However, a speed that is too rapid (e.g., 10 seconds) can overwhelm a client with too much information, interfering with learning. Although clients and training goals differ, a Goldilocks zone may be around 30 seconds.
Display Options
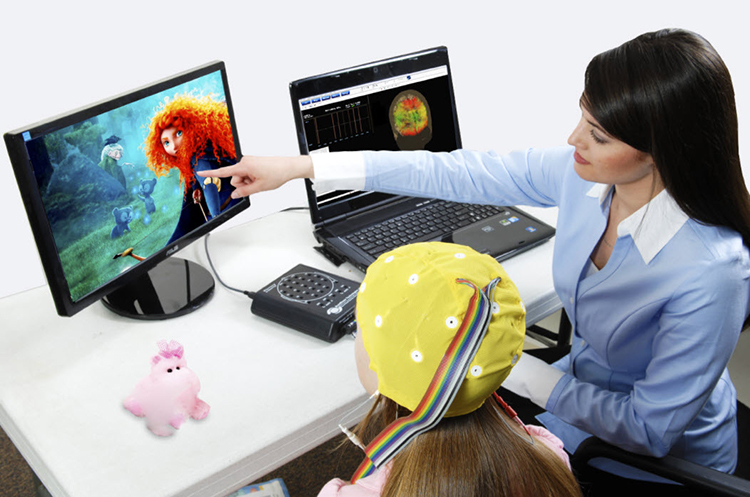
Clinicians can now provide patients with an extensive selection of informative and engaging displays for adults and children like those from BrainMaster Technologies.
Software provides analog, digital, binary, and power spectral feedback.
Analog Feedback
Analog displays vary continuously in proportion to change in signal strength.
🎧 Mini-Lecture: Analog Displays
Below is a BioGraph Infiniti frontalis SEMG display. The roller coaster's movement increases as the client relaxes the frontales muscles.
Below is a NeXus-10 BioTrace+ screen. Relaxing music plays, the water calms, and the bar becomes smaller as the client reduces SEMG activity.
Digital Feedback
A digital display shows signal amplitude using numbers (e.g., 2.42 microvolts).
🎧 Mini-Lecture: Digital Displays
Below is a NeXus-10 BioTrace+ screen generously provided by John S. Anderson. The flower opens as the client reduces SEMG activity.
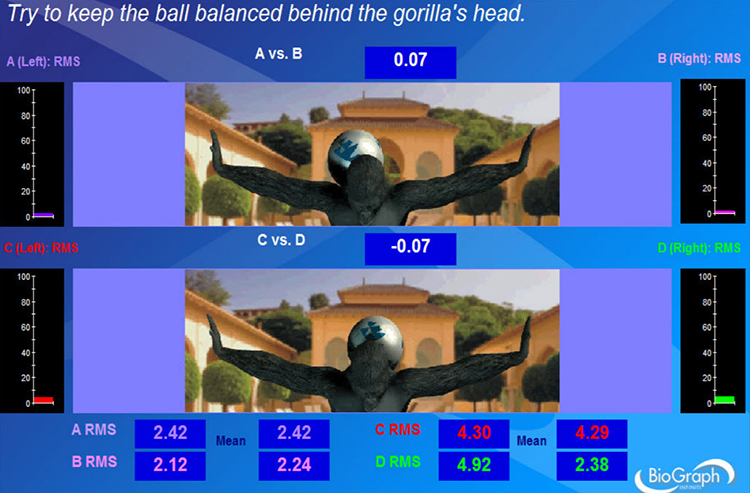
The Thought Technology Ltd. Rehabilitation Suite screen below combines analog (0-100 microvolts) with digital feedback for absolute EMG in RMS for sensors A-D and EMG symmetry (A vs. B and C vs. D). The ball's position on the gorilla's back shifts in response to changes in left-right balance. Animations can increase the engagement of both adults and children.
Binary Feedback
A binary display shows whether the signal is above or below a threshold or goal.
🎧 Mini-Lecture: Binary Displays
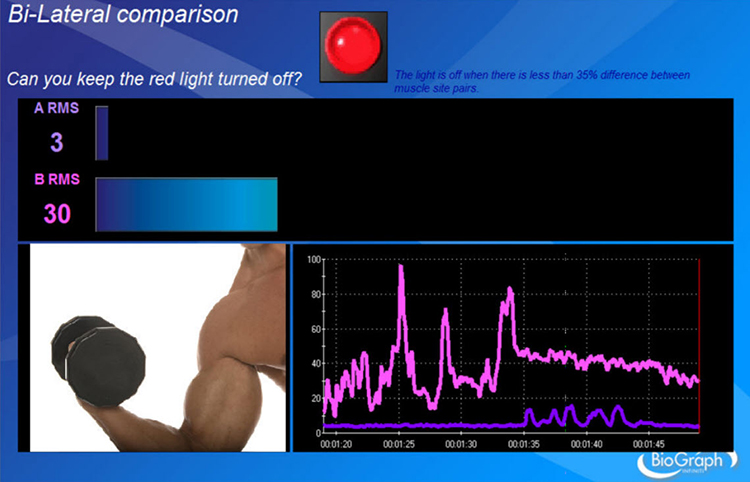
Performance above or below a threshold can turn an animation, sound, or visual display on or off. A frequent goal in rehabilitation is to reduce asymmetry in the SEMG voltages of two muscles. In the Thought Technology Ltd. Rehabilitation Suite screen below, the red light turns off when asymmetry between left and right muscle sites falls below 35%.
Power Spectral Displays
Power spectral analysis measures amplitude across a signal's frequency range. The EEG and SEMG signals comprise many frequencies, each with its voltage. Mathematical techniques like Fast Fourier Transform (FFT) analysis and autoregressive (AR) modeling decompose a complex signal into its component sine waves analogous to a prism's refracting white light. Graphic from Mopic/Shutterstock.com.

Review this post to learn more about Fast Fourier power spectral analysis.
Below is an EEG display that utilizes power spectral analysis.
🎧 Mini-Lecture: Power Spectral Displays
The top BioTrace+/NeXus-10 spectral display shows a frequency range from 1-21 Hz (X-axis) with the amplitude in microvolts (Y-axis). Time progresses from the back of the display to the front. The bottom raw EEG oscilloscope display of the same sample data shows frequencies from 2-45 Hz. John S. Anderson generously provided this movie.
Display settings should match training goals. Short time constants work for rehabilitation; longer ones suit relaxation training. Vertical scale should show meaningful change without cutting off peaks. Display speed around 30 seconds typically balances real-time feedback with information overload.
Shape Performance Using a Threshold
A biofeedback therapist routinely shapes patient performance by adjusting a threshold or goal.
🎧 Mini-Lecture: Shaping Using a Threshold
A therapist can manually select a threshold or allow a data acquisition system to calculate one based on client performance automatically. A therapist or software may choose a more challenging threshold after a client has succeeded more than 70% of the time.
Thresholds are depicted as orange lines on two vertical analog displays on the bottom right of the Thought Technology Ltd. Rehabilitation Suite screen below.
A level detector decides whether SEMG activity is above or below the threshold setting to adjust a feedback display. For example, tone feedback may disappear to signal reward when SEMG activity falls below this value.
Artifacts
Artifacts are false values produced by the client's body (abnormal heartbeats) and actions (movement), the environment (50/60Hz), and hardware limitations (light leakage).
Graphic from Victor Correia/Shutterstock.com.

Use clean signals as a reference to help you recognize artifacts. Graphic retrieved from Delsys Inc.
Major artifacts contaminating SEMG recordings include 50/60Hz, ECG, electrostatic, movement, and cross talk.
Line Interference (50/60Hz)
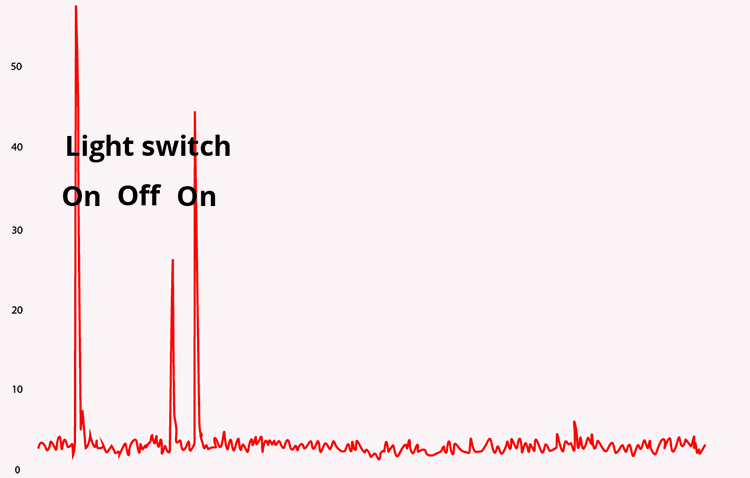
Fifty/sixty-Hz artifact comes from electrical power plants and is transmitted by wall outlets and fluorescent lights.
🎧 Mini-Lecture: 50/60Hz Artifact
Graphic from silvabom/Shutterstock.com.

The recording of the effect of turning on a light switch was adapted from Peper, Gibney, Tylova, Harvey, and Combatalade (2008).
A BioGraph Infiniti display of 60-Hz artifact is shown below. Note the cyclical voltage fluctuations and the 60-Hz peak in the power spectral display.
ECG Artifact
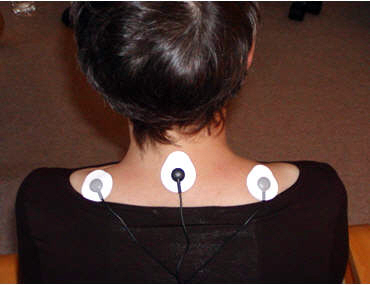
ECG artifact results when the R-spike is detected by sensors on the upper limbs or trunk. A wide trapezius placement is particularly vulnerable to this contamination.
Peper, Gibney, Tylova, Harvey, and Combatalade (2008) generously provided the photograph below.
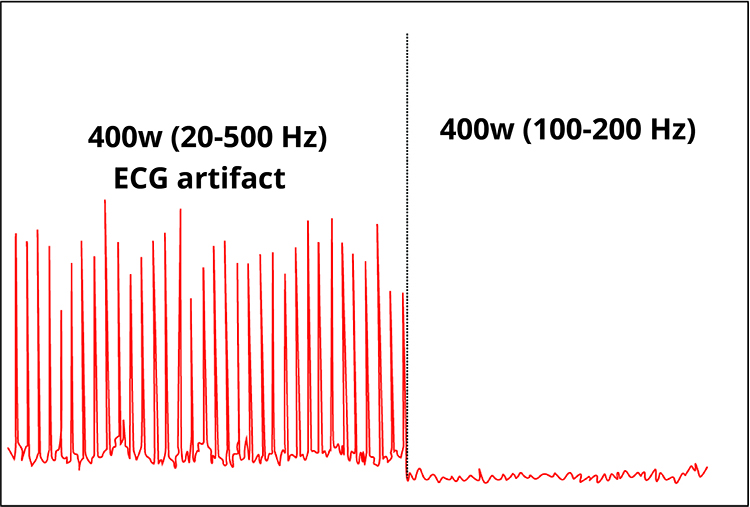
The frequency range for this artifact is 0.05-80 Hz. ECG contamination is seen in rhythmic meter fluctuations in the signal (20-500 Hz) displayed below by a screen from Thought Technology Ltd.'s Basics of Surface Electromyography Applied to Physical Rehabilitation and Biomechanics (2009). Clinicians must visually inspect the analog signal because digital values can conceal artifacts.
![]()
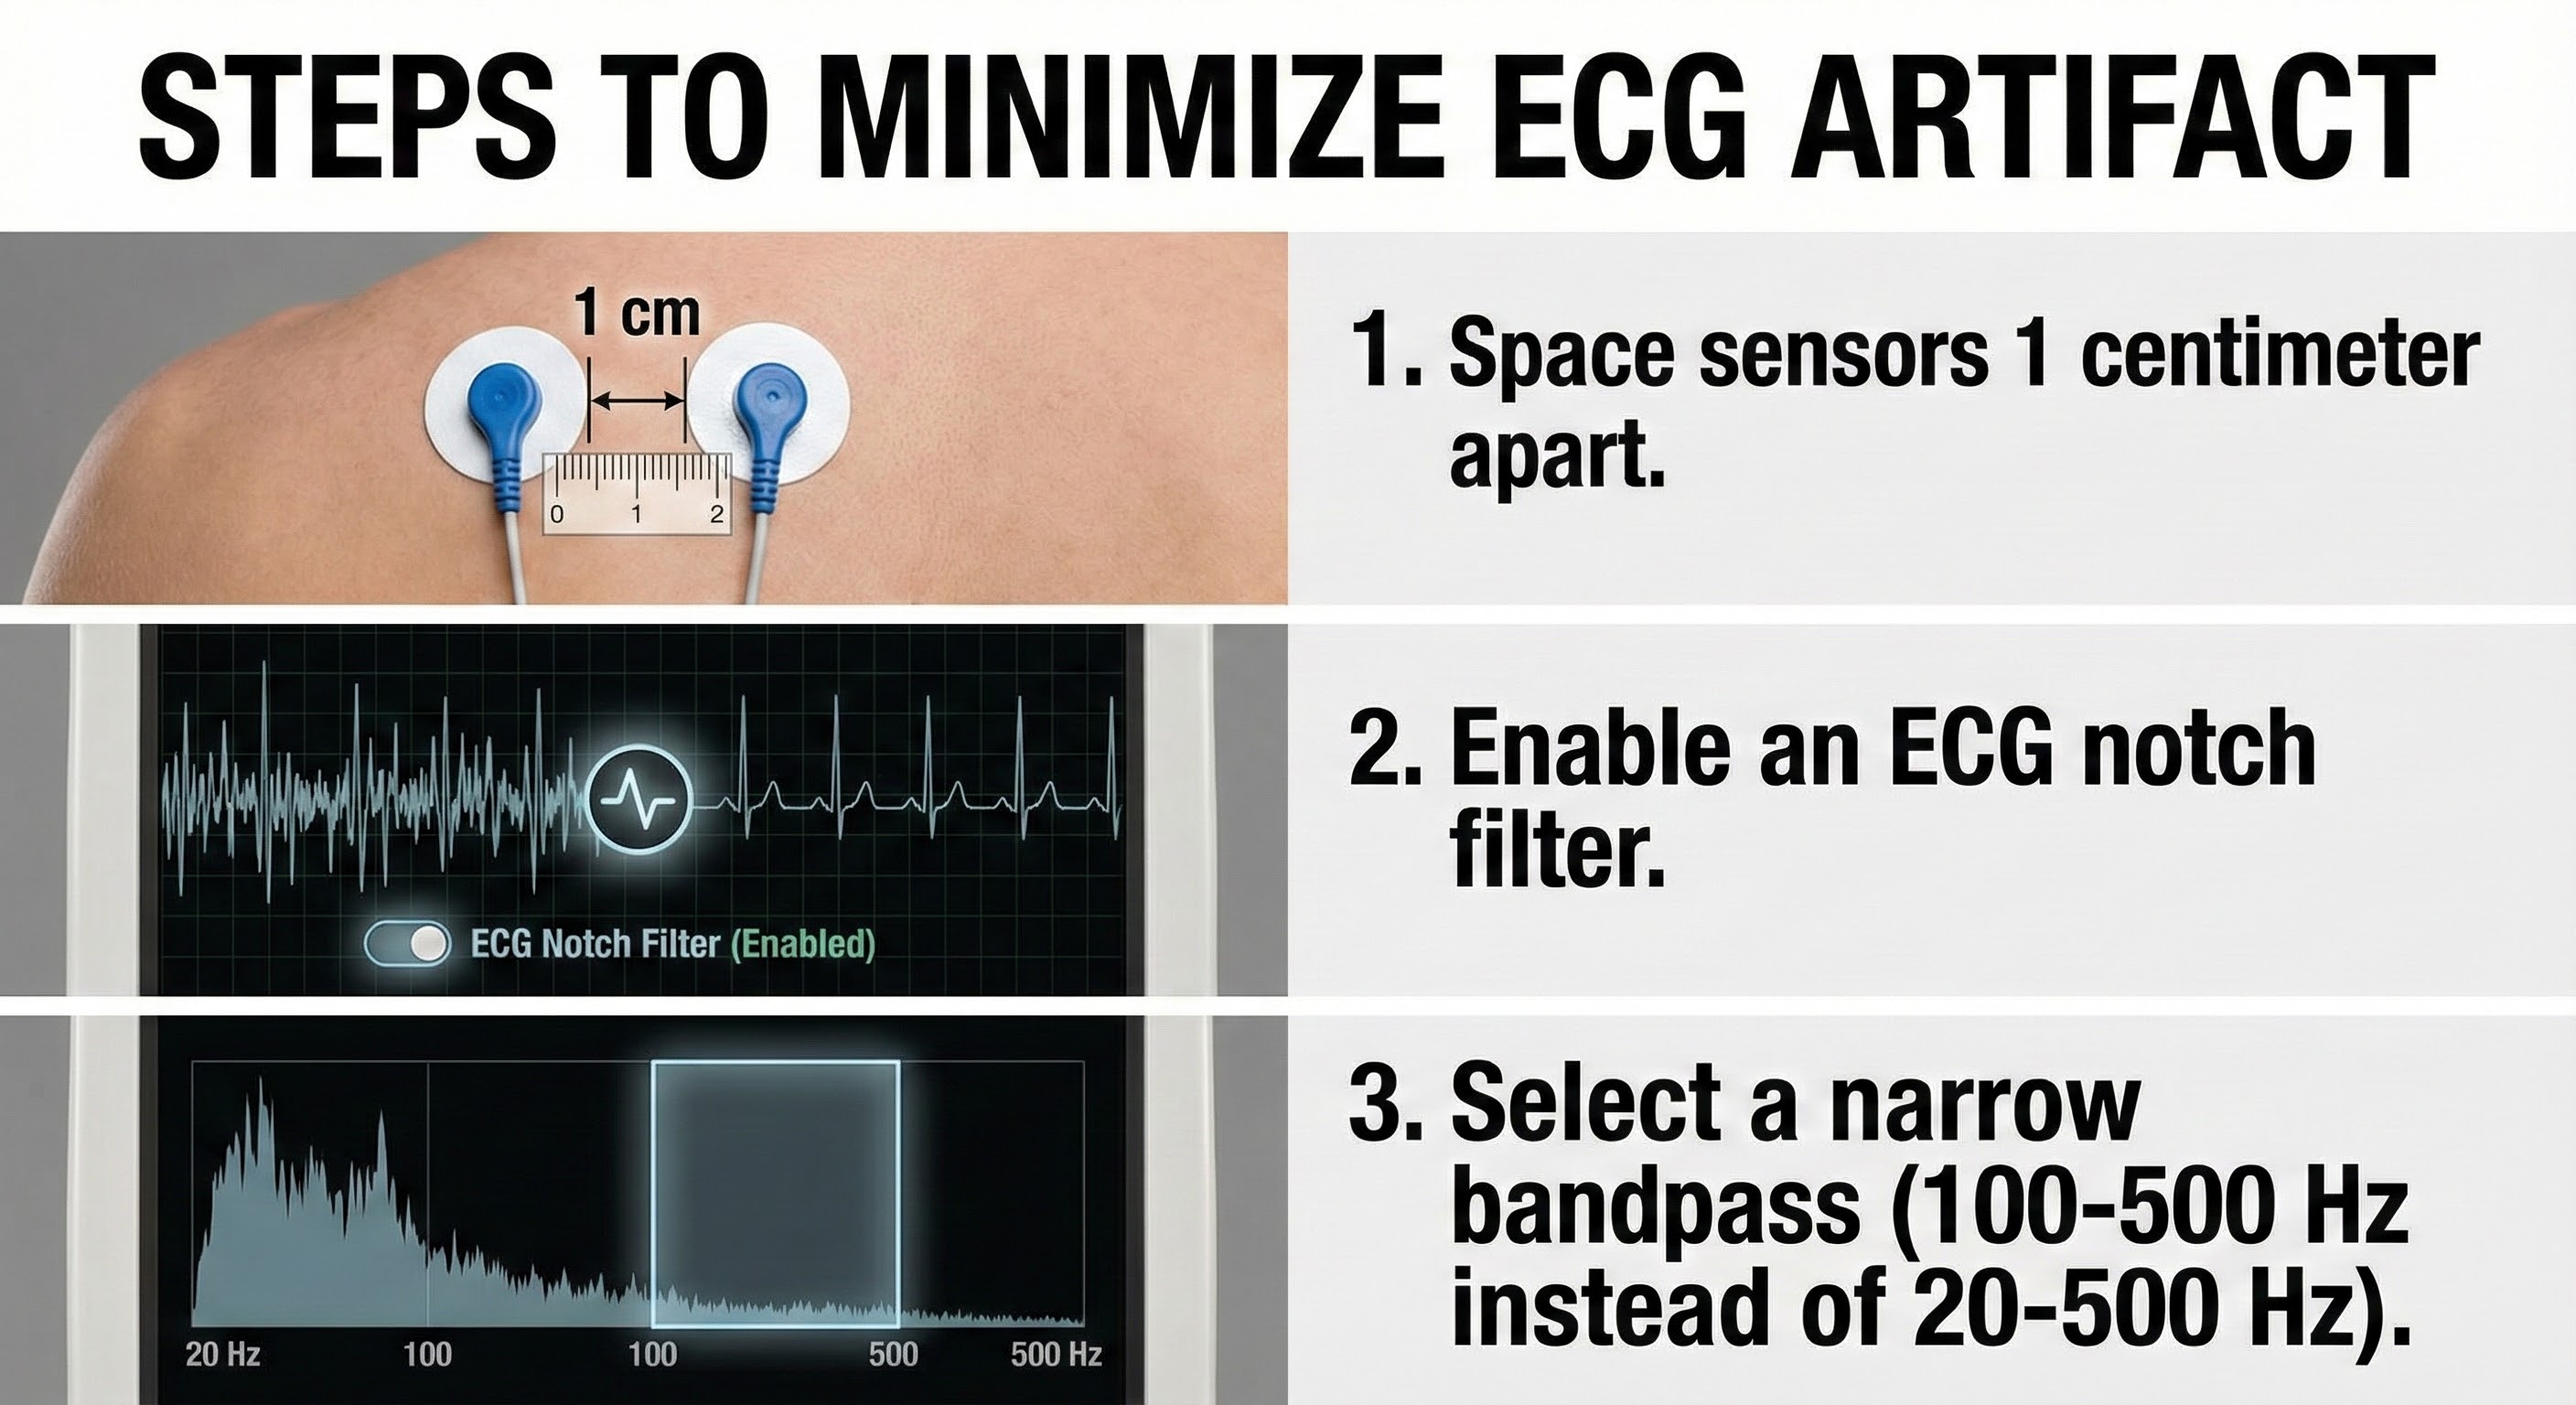
The recording below adapted from Peper, Gibney, Tylova, Harvey, and Combatalade (2008) shows that a narrow bandpass (100-200 Hz) can minimize ECG artifact.
Below is a BioGraph Infiniti display of ECG-artifact contamination of a trapezius SEMG recording. Note the sharp upward deflection of the R-spike almost every second.
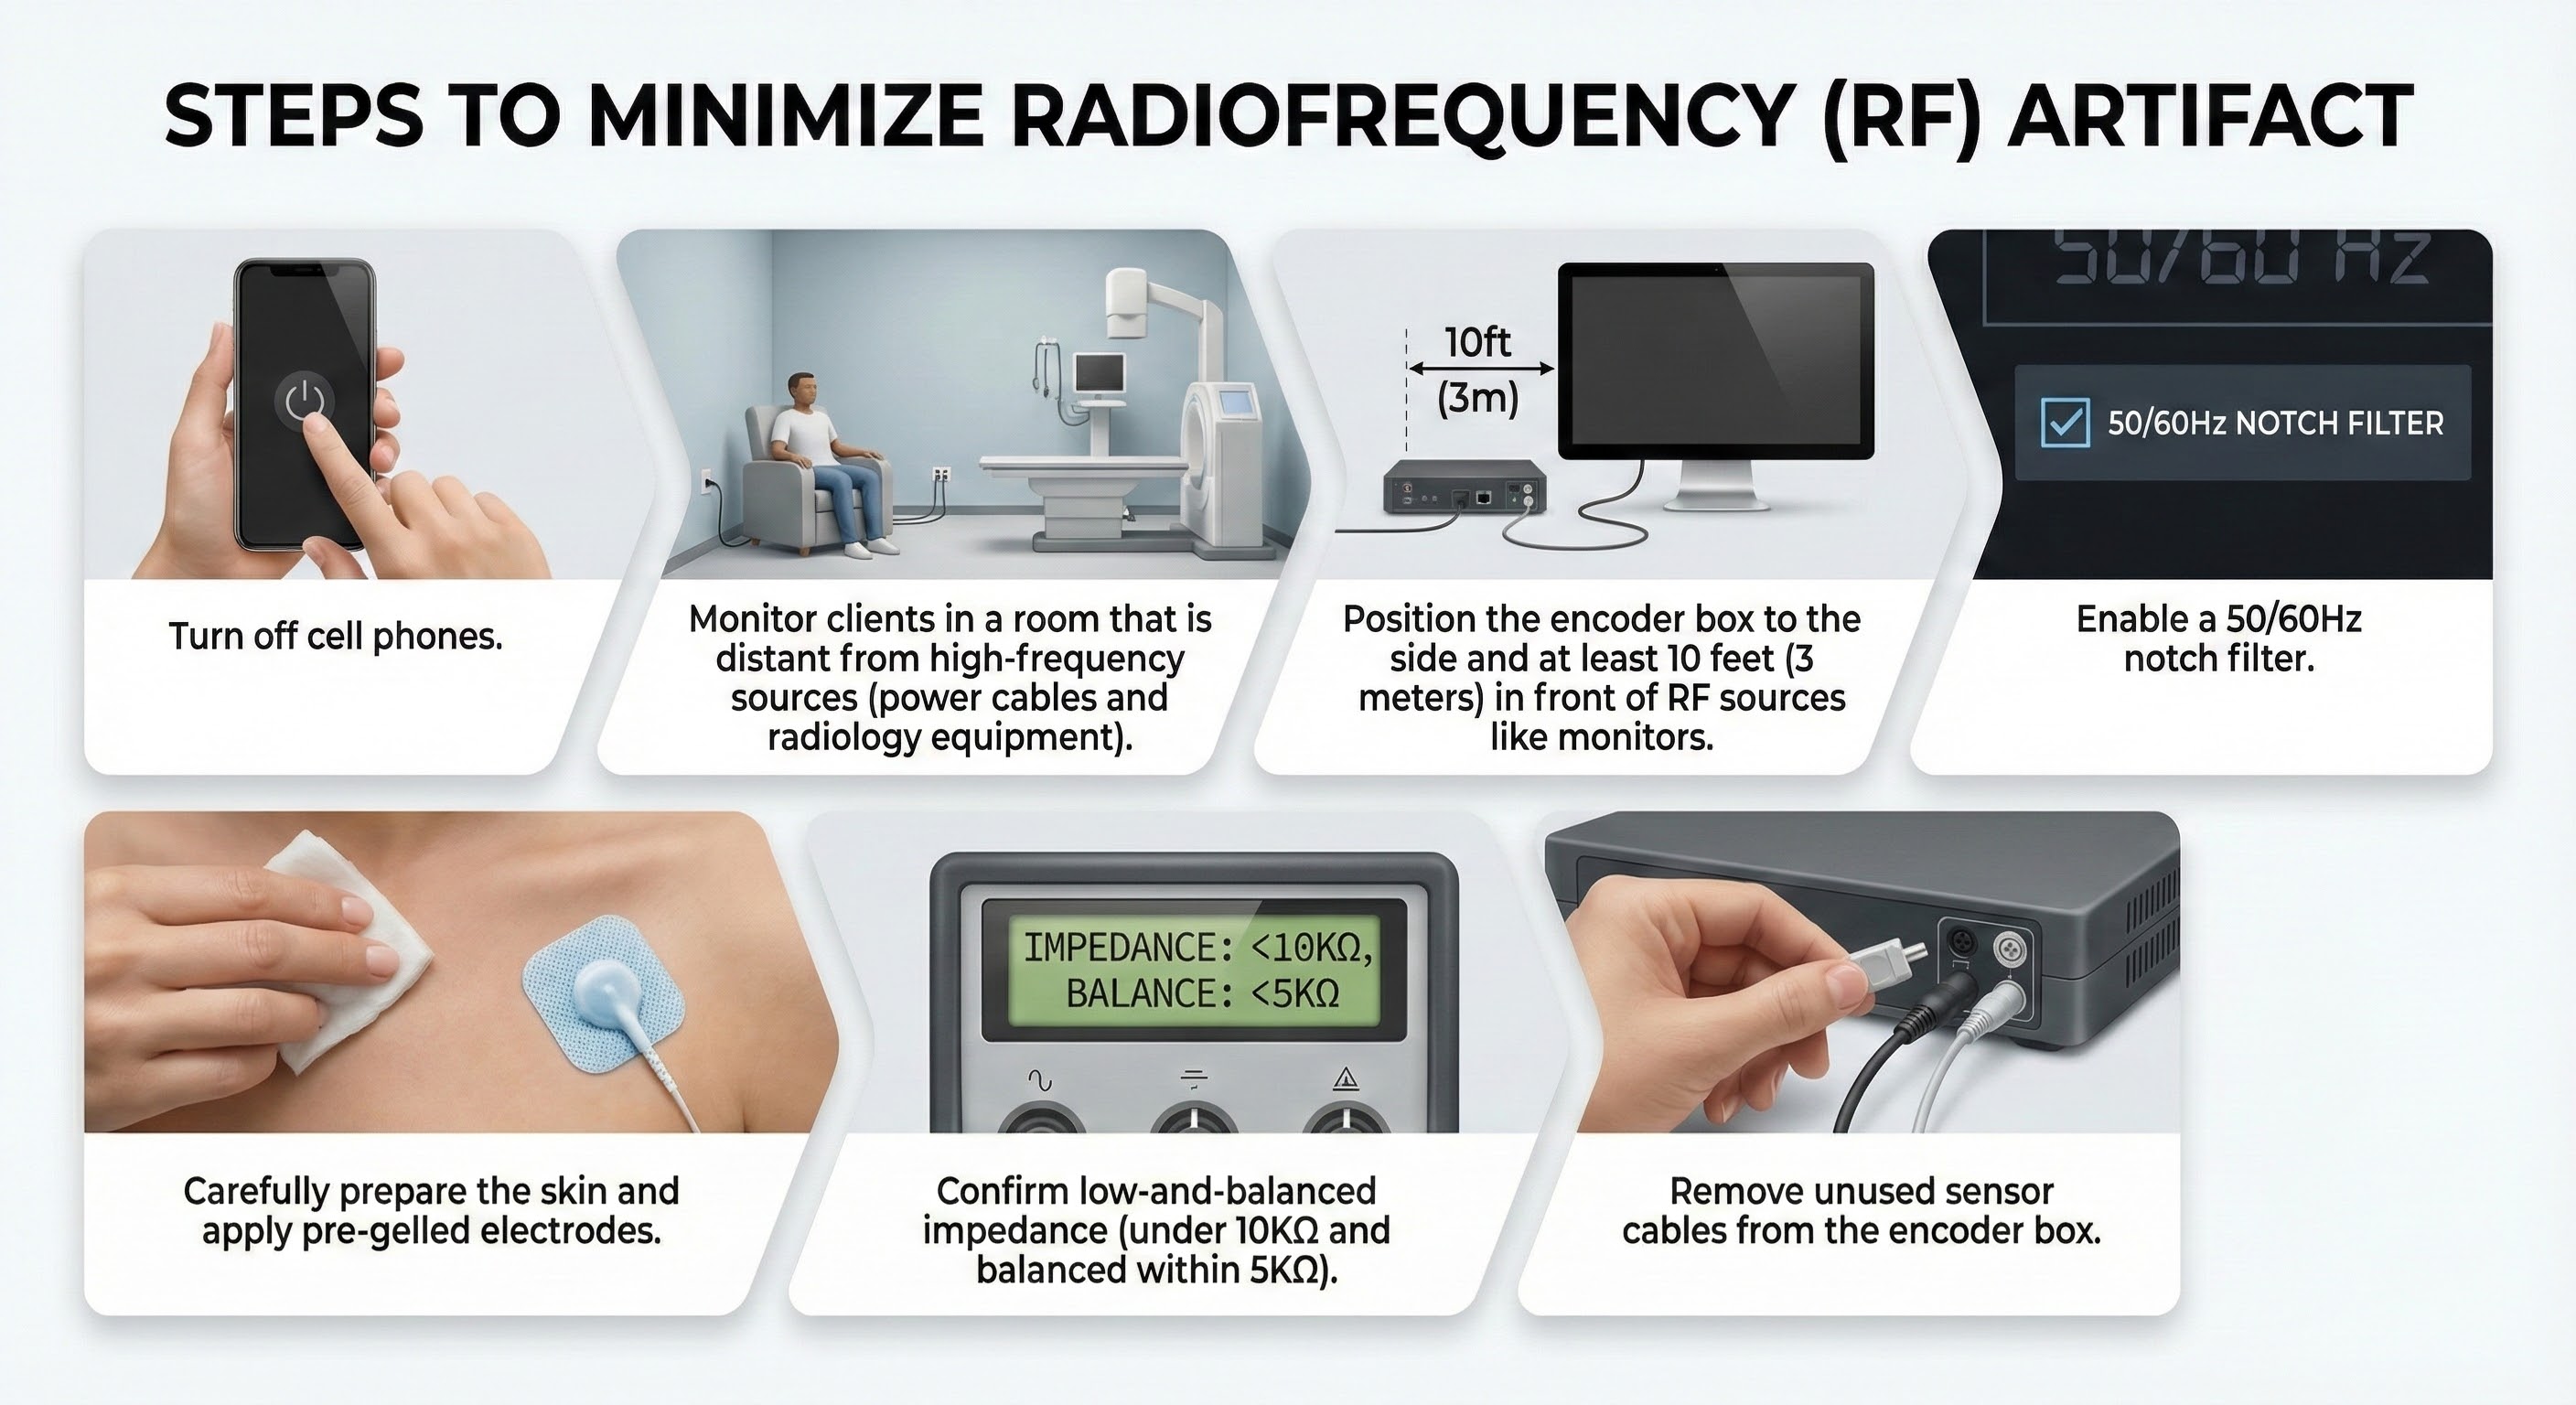
Radiofrequency Artifact
Radiofrequency (RF) artifact radiates outward like a cone from the front of televisions and computer monitors (Montgomery, 2004).
🎧 Mini-Lecture: Radiofrequency Artifact
The recording below adapted from Peper, Gibney, Tylova, Harvey, and Combatalade (2008) shows the effect of a cell phone on the SEMG signal.
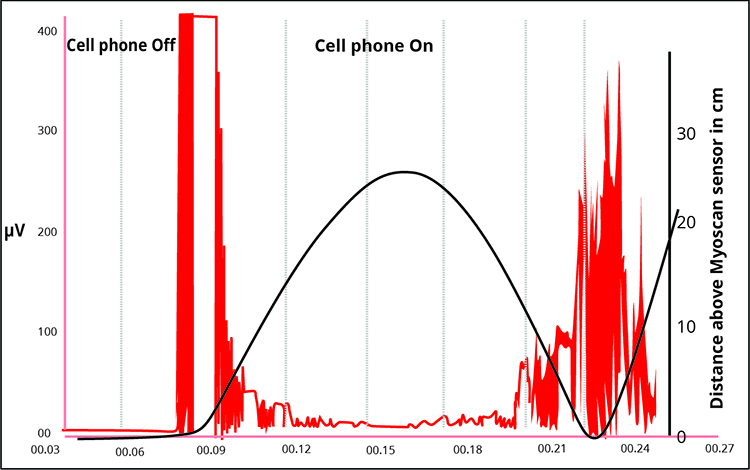
Below is a BioGraph Infiniti display of radiofrequency artifact contamination of a masseter SEMG recording. Note the contamination at 60 Hz and its harmonics (120 Hz, 180 Hz, 240 Hz, 300 Hz, 360 Hz, 420 Hz, and 480 Hz) across the EMG spectrum. Artifact amplitude fluctuates with the distance of the cell phone from the electrodes.
Electrostatic Artifact
Electrostatic artifact is produced by static electricity, often encountered in low-humidity environments. This artifact can produce false voltages (see the center of the screenshot below).
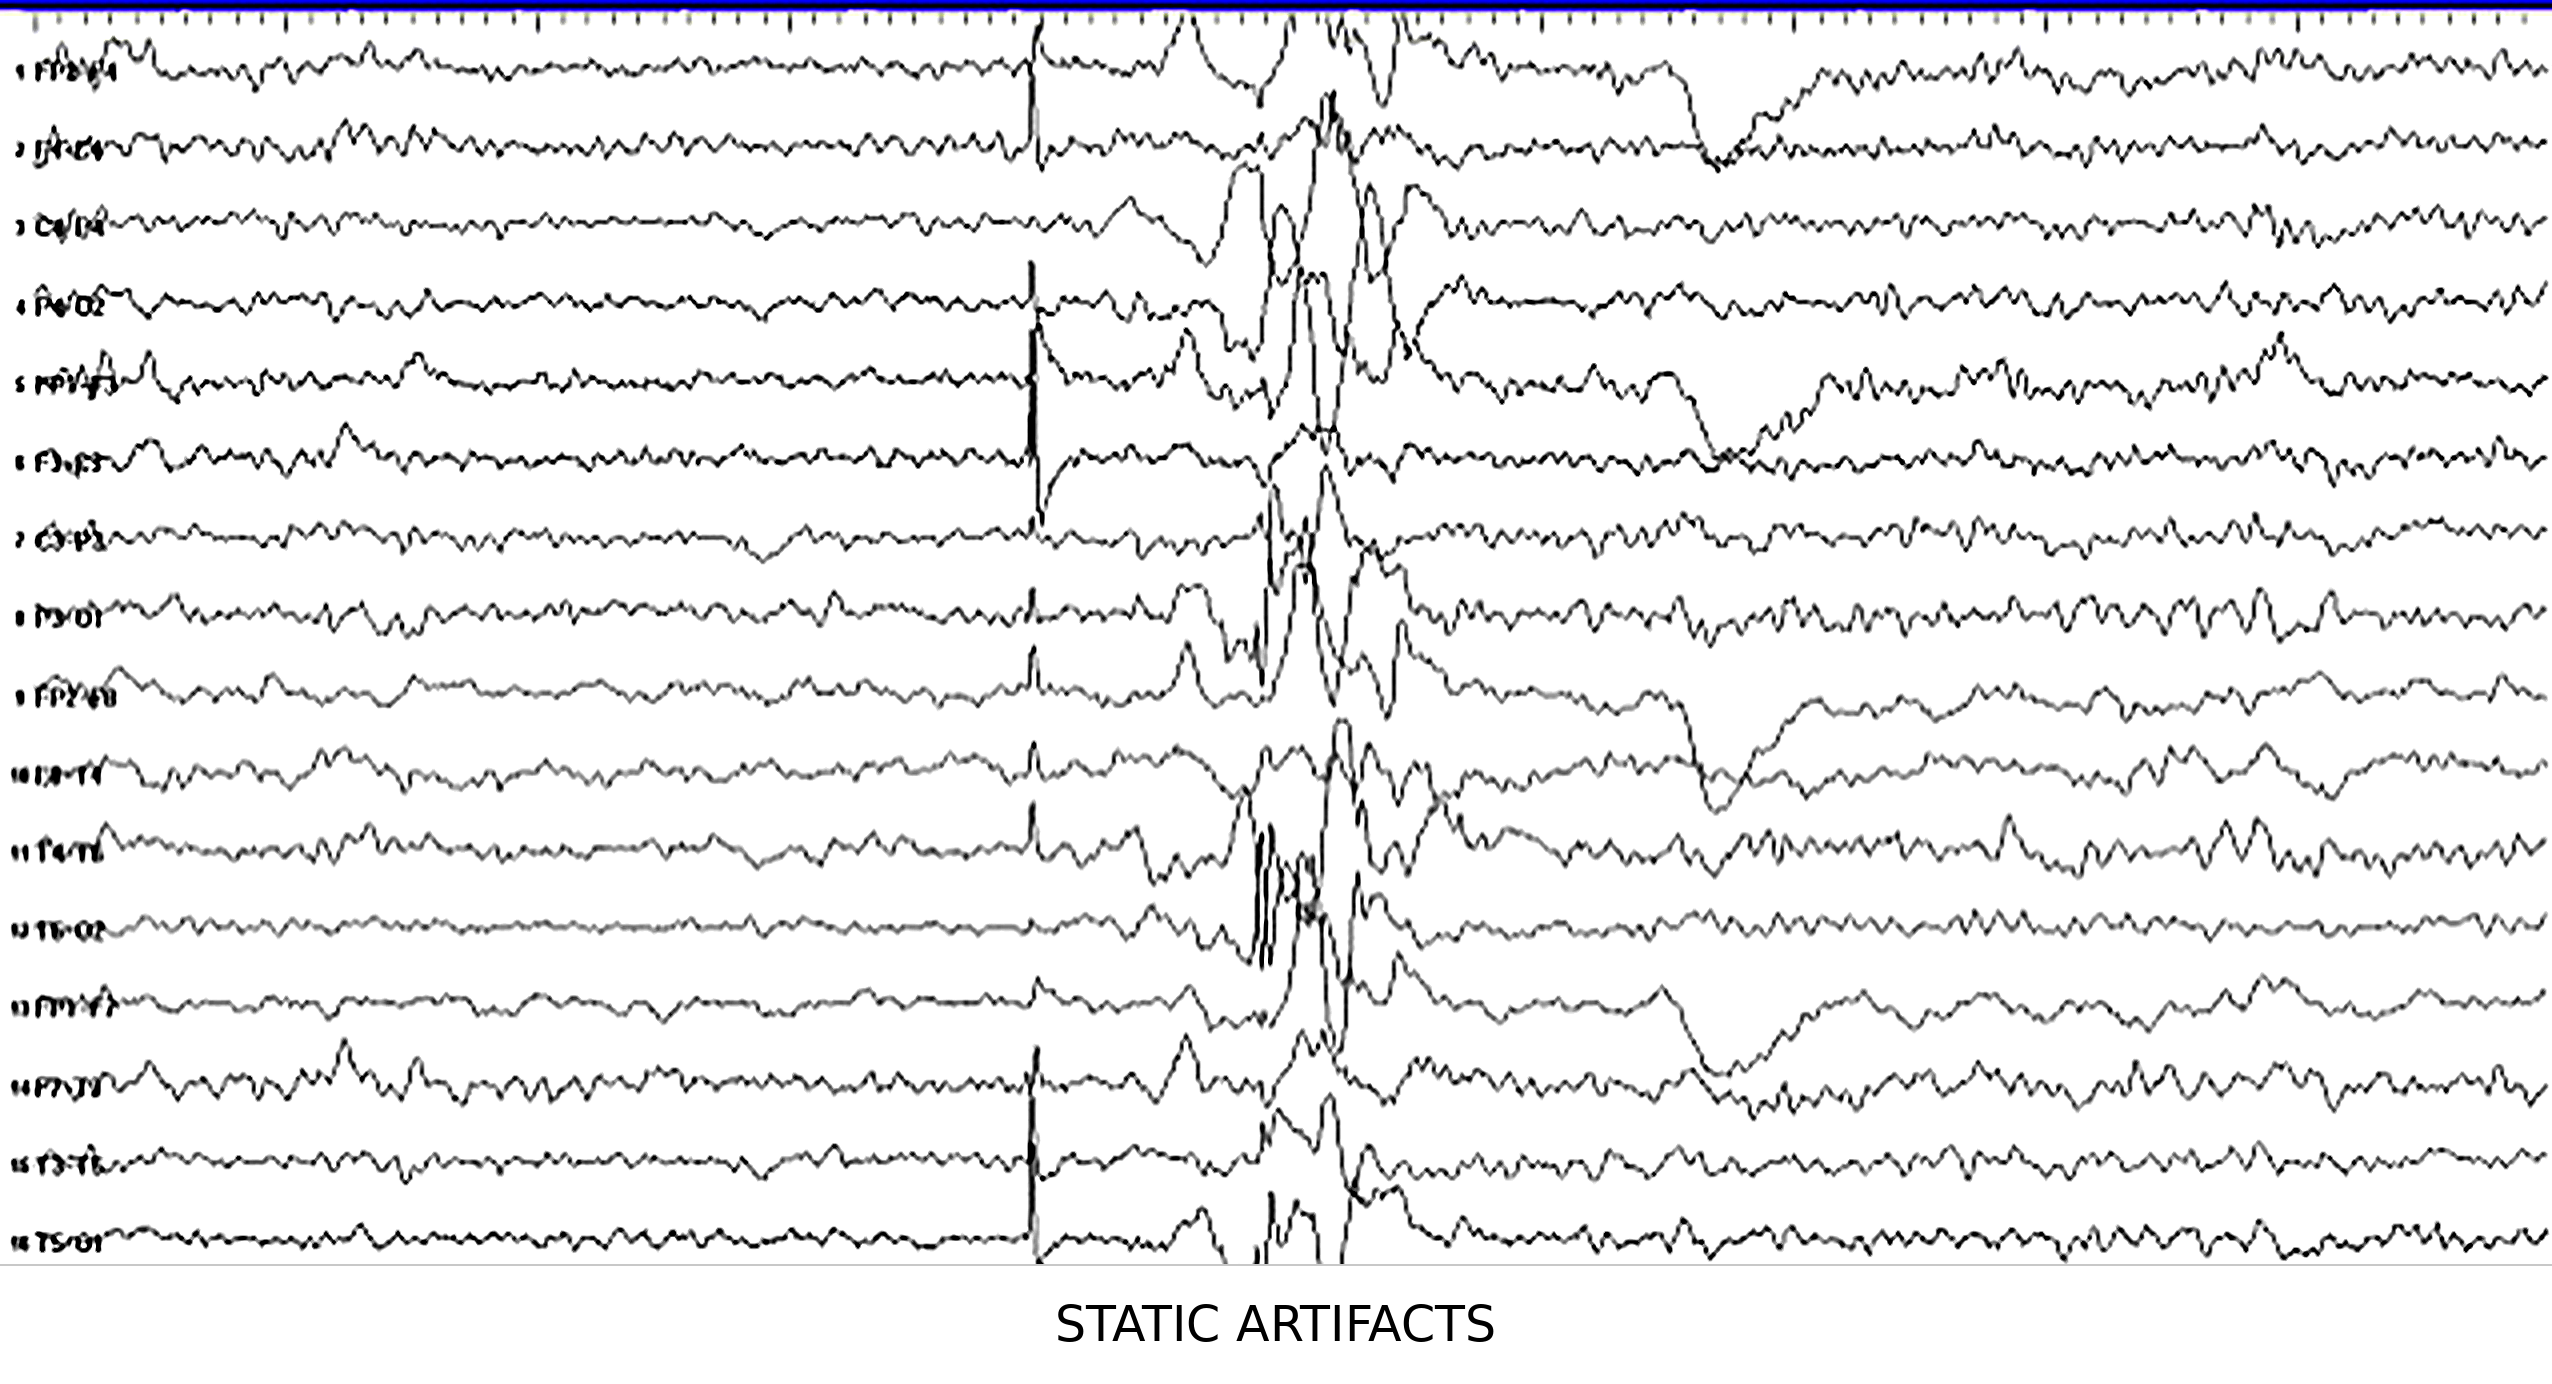
Electrostatic discharges can also damage circuitry.

Movement Artifact
Movement artifact occurs when patient movement displaces the electrode cable, shown below by a graphic adapted from Thought Technology Ltd.'s Basics of Surface Electromyography Applied to Physical Rehabilitation and Biomechanics (2009).
🎧 Mini-Lecture: Movement Artifact
You should suspect this artifact when you see unexpectedly elevated values or high-amplitude waveforms. Movement artifact occupies the region from 20 Hz and below (De Luca, 1997).
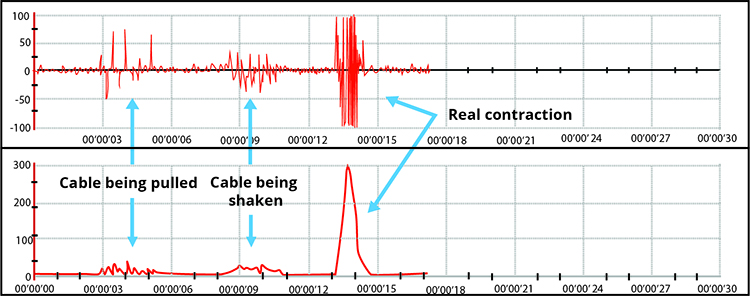
Note the four voltage spikes due to electrode cable movement in the BioGraph Infiniti display below.

Cross-Talk Artifact
Cross-talk artifact occurs when adjacent SEMG activity contaminates your readings. You can detect cross-talk by monitoring an adjacent muscle with a second SEMG channel.
The BioGraph Infiniti display below shows periodic masseter interference with recording from a frontales placement.
Clinicians performing relaxation training may intentionally place electrodes across muscle fibers (frontalis placement). They may place active electrodes on the belly of two separate muscles (bilateral upper trapezius placement). Also, they may position electrodes on non-specific sites away from any muscle belly (wrist-to-wrist placement) (Cram, 1998). In these cases, they invite cross-talk to help clients recognize and reduce patterns of muscle contraction that involve several muscle groups (Shaffer & Neblett, 2010).
Removing Artifacts
Data acquisition software has become increasingly sophisticated and can now assist clinicians in artifact detection and removal. For example, BioGraph Infiniti software automatically detects artifacts and highlights them for visual inspection and removal. After clinicians have removed contaminated data segments, they can calculate accurate session statistics from the remaining data.
Artifacts are false values that contaminate recordings. Common sources include 50/60Hz powerline interference, ECG from heartbeats, radiofrequency from electronics, electrostatic discharge, movement, and cross-talk from adjacent muscles. Each type has characteristic signatures and specific remediation strategies.
Comprehension Questions
- What are the five major types of artifacts that contaminate SEMG recordings?
- Why is wide trapezius placement particularly vulnerable to ECG artifact?
- How can you use a narrow bandpass to minimize ECG contamination?
- What frequency range does movement artifact occupy?
- When might a clinician intentionally invite cross-talk into a recording?
Tracking Tests
You can determine whether a SEMG display mirrors your client's muscle contraction by performing a tracking test, during which you instruct your client to contract and then relax the monitored muscles briefly.
🎧 Mini-Lecture: SEMG Tracking Tests
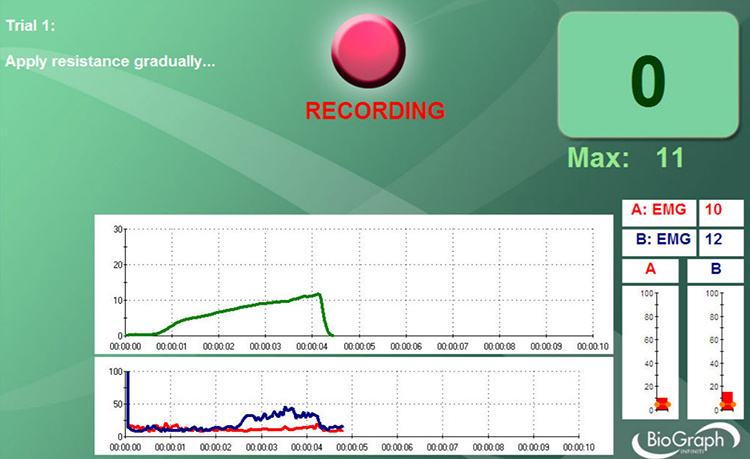
For example, for a frontal placement over the forehead, you might instruct your client, "Please gently tighten the muscles in your forehead for a few seconds and then allow them to relax." The integrated SEMG signal should increase during the contraction phase and decrease during the relaxation phase.
Below is a BioGraph Infiniti SEMG tracking test display in which the client briefly contracts and relaxes the frontales muscles.
A tracking test checks the entire signal chain's integrity from the three individual sensors to the encoder and the correct software selection of input channels.
Normal Values
SEMG values depend on muscle size, sensor placement, narrow (1.5-2 centimeters) or wide (6 centimeters), bandpass, narrow (100-200 Hz) or wide (20-500 Hz), degree of adipose tissue, client position, and muscle activity (Shaffer & Neblett, 2010). Graphic retrieved from mTrigger.com.
🎧 Mini-Lecture: Normal SEMG Values
During a resting baseline, typical values lie below 3 microvolts for small-to-moderate-sized muscles and below 5 microvolts for large muscles (Khazan, 2019). Clinicians may attempt to down-train SEMG activity to below 1 microvolt (Khazan, 2013, pp. 45, 143).
Computers in Biofeedback
Integrating computers into biofeedback has allowed more powerful data analysis, displays, and recordkeeping. Fast Fourier Transformation provides power spectral analysis of complex EEG, SEMG, and heart rate variability (HRV) signals. Z-score calculations allow neurofeedback training that compares performance to a normative database. Finally, computers also enable clinicians to administer and score psychological tests like the Minnesota Multiphasic Personality Inventory-2 (MMPI-2) and Tests of Variables of Attention (TOVA).

The downside of computer use is that they are sources of 50/60Hz artifact and radiofrequency artifact, and can present a shock hazard without proper electrical isolation. Modern biofeedback systems address this through optical isolation, a fixed safety feature built into quality instruments. Optical isolators use light rather than electrical connections to transmit signals between the client-connected sensors and the computer-connected processing circuitry. This creates a physical barrier that prevents dangerous currents from reaching the client even if the computer malfunctions. You never adjust or enable optical isolation; it works automatically as part of the device design. When purchasing equipment, verify that it includes appropriate isolation for client safety.
Drug Effects
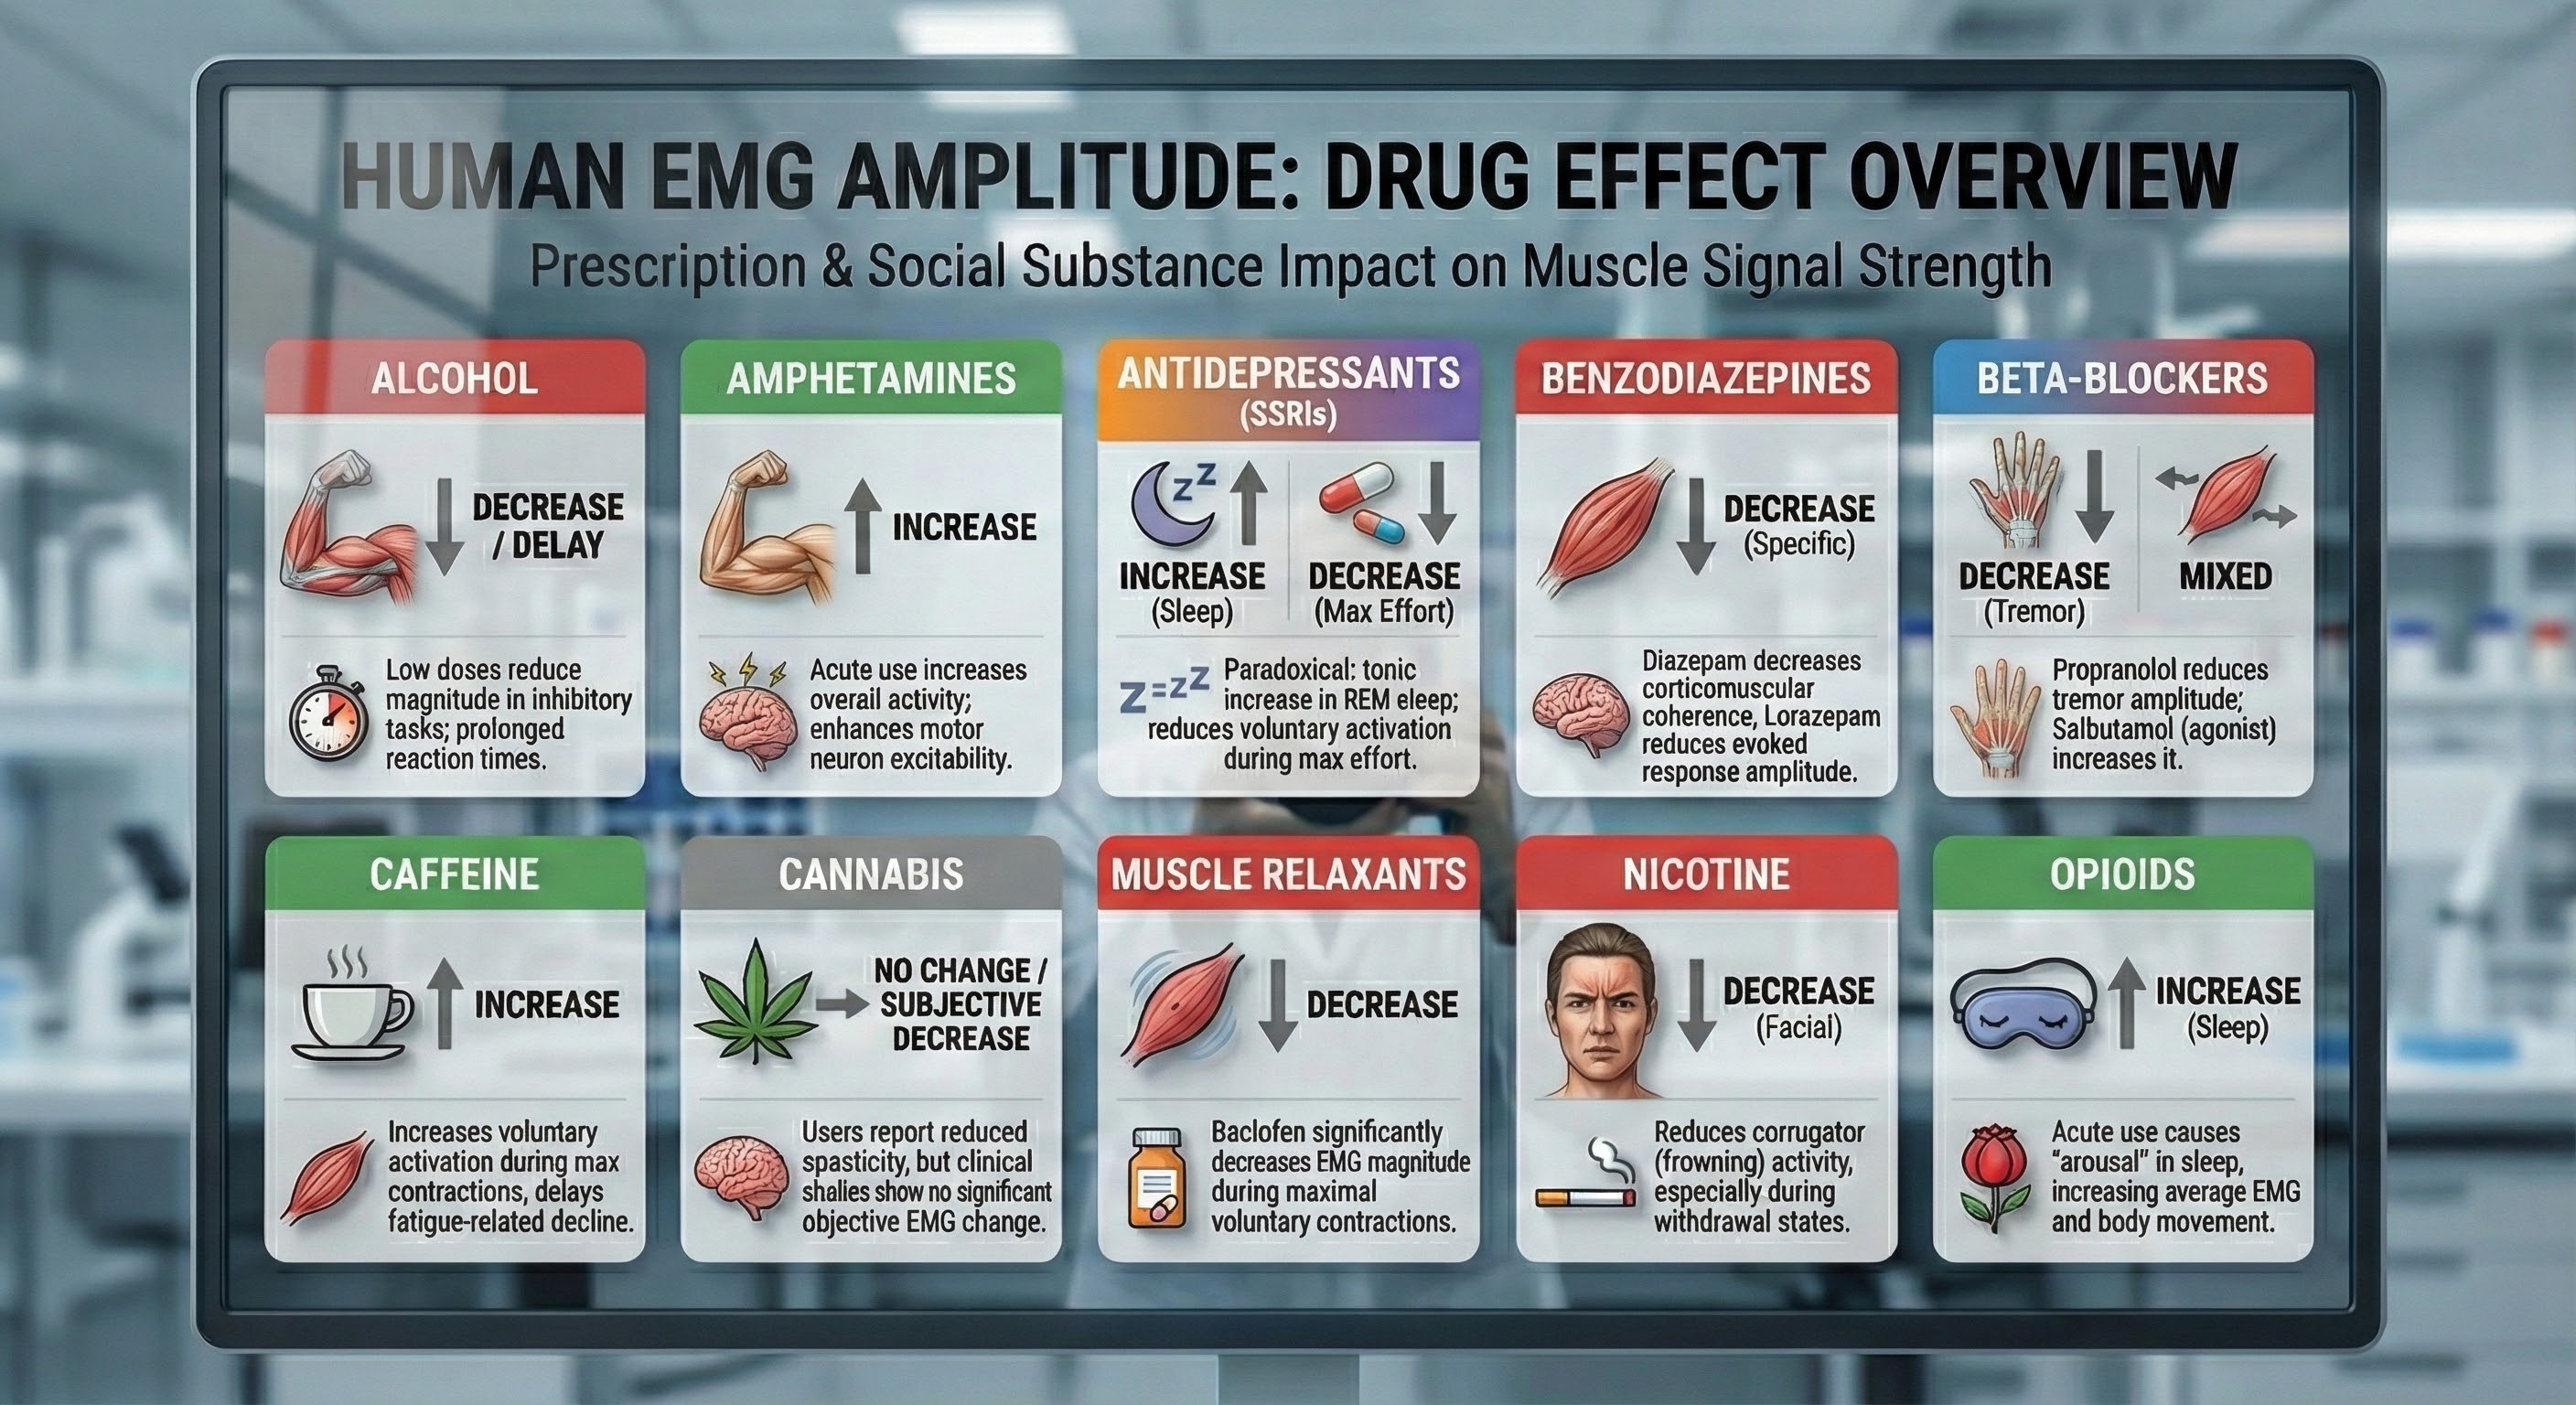
Since over-the-counter, prescription, and social drugs can affect SEMG values, identify all medications that clients are taking during the initial assessment and use this list to interpret readings. Muscle relaxation and reduced muscle spasms may reduce EMG.
Tracking tests verify the signal chain integrity. Normal resting SEMG values are below 3 microvolts for small muscles and below 5 microvolts for large muscles. Computers enhance biofeedback but introduce artifact sources. Drug effects on SEMG should be documented during assessment.
Comprehension Questions
- What is the purpose of a tracking test?
- What are typical resting SEMG values for small versus large muscles?
- Why should clinicians document medications during assessment?
- What are the benefits and drawbacks of using computers in biofeedback?
Cutting Edge Topics in EMG Hardware
High-Density Surface EMG Arrays
Traditional SEMG uses bipolar electrode configurations that provide a single channel of information from a muscle region, but what if you could see the entire electrical landscape of a muscle at once? High-density surface EMG (HD-sEMG) makes this possible by employing arrays of dozens or even hundreds of closely spaced electrodes to create detailed spatial maps of muscle activity. These sophisticated systems can decompose the complex interference pattern into individual motor unit action potentials, allowing researchers and clinicians to track the firing behavior of single motor units without inserting needle electrodes. For biofeedback applications, HD-sEMG offers unprecedented insight into muscle activation patterns, potentially enabling more precise neuromuscular rehabilitation by pinpointing specific dysfunctional regions within a muscle. While currently more common in research settings due to cost and complexity, ongoing miniaturization and improved algorithms are making this powerful technology increasingly accessible for everyday clinical applications.
Wireless and Wearable SEMG Systems
The evolution from tethered to wireless SEMG systems transformed biofeedback practice, freeing clients from cables that restricted movement and created artifact. Now, emerging wearable SEMG technologies push these boundaries even further into the realm of everyday life. Modern wearable devices incorporate flexible electronics, conductive fabrics, and dry electrode technologies that eliminate the need for gel application and allow continuous monitoring during daily activities. These systems can be integrated into compression garments, sleeves, or adhesive patches that clients wear throughout the day, providing ecological validity that laboratory-based recordings simply cannot match. For biofeedback practitioners, wearables open exciting possibilities: homework monitoring that captures real muscle tension patterns, assessment during actual work tasks rather than simulated ones, and gamified training applications on smartphones that engage clients between sessions. Challenges remain in achieving signal quality comparable to traditional wet electrodes, but advances in materials science and signal processing are steadily closing this gap.
Machine Learning for Artifact Detection and Signal Enhancement
Artifact rejection has always been one of the most challenging aspects of SEMG recording, requiring clinicians to carefully inspect signals and make judgment calls about data quality. Machine learning algorithms are now revolutionizing this process by learning complex patterns that distinguish true muscle activity from ECG contamination, movement artifact, and powerline interference with greater accuracy than traditional threshold-based methods. Deep learning approaches can enhance signal quality by removing noise while preserving the underlying muscle activity, potentially allowing reliable recordings in challenging environments where traditional methods would fail. Some cutting-edge systems now provide real-time artifact probability scores, helping clinicians make informed decisions about data quality during sessions rather than discovering problems only during post-session review. As these intelligent algorithms become embedded in commercial biofeedback systems, practitioners can expect cleaner signals and more reliable measurements even when recording conditions are far from ideal.
Integration with Inertial Measurement Units
Muscles do not contract in isolation; they produce movement. Combining SEMG with inertial measurement units (IMUs) that track movement, orientation, and acceleration creates powerful hybrid systems for understanding the crucial relationship between muscle activity and motion. This integration allows practitioners to correlate SEMG amplitude with specific phases of movement, joint angles, and functional tasks in ways that static recordings never could. In rehabilitation settings, synchronized SEMG-IMU recordings can reveal whether clients are using appropriate muscle activation strategies during exercises or compensating with unintended movement patterns that might perpetuate dysfunction. Some advanced systems use IMU data to automatically segment recordings into movement phases and apply context-specific artifact rejection, recognizing that what constitutes artifact during quiet sitting differs from artifact during walking. For biofeedback training, real-time fusion of muscle activity and movement data enables feedback paradigms that reward not just muscle relaxation or activation in isolation, but appropriate timing and coordination of muscle activity with functional movement patterns that matter in daily life.
Test Yourself
Click on the ClassMarker logo to take 10-question tests over this unit without an exam password.

Review Flashcards on Quizlet
Click on the Quizlet logo to review our chapter flashcards.

Visit the BioSource Software Website
BioSource Software offers Human Physiology, which satisfies BCIA's Human Anatomy and Physiology requirement, and Biofeedback100, which provides extensive multiple-choice testing over BCIA's Biofeedback Blueprint.

Essential Skills
Upon completing this unit, you should be able to explain the EMG and biofeedback to a client, explain skin preparation and electrode placement to a client and obtain permission to monitor her, and explain how to protect the client from infection transmitted by the sensor.
You should be able to identify active- and reference-electrode placements using a marking pencil for bilateral cervical paraspinal, frontalis, masseter, sternocleidomastoid, and trapezius sites. You should be able to demonstrate skin preparation and electrode placement, measure electrode impedance for each active-reference electrode pair and ensure that impedance is sufficiently low and balanced, and perform a tracking test for your placement by instructing the client to contract and then relax the monitored muscle.
You should be able to identify common artifacts in the raw EMG signal, including 50/60Hz, bridging, ECG, loose electrode, movement, and radiofrequency, and explain how to control for them and remove them from the raw data. You should be able to demonstrate how to instruct a client to utilize a feedback display.
You should be able to demonstrate a surface EMG biofeedback training session, including record keeping, goal setting, site selection, bilateral and unilateral recording, bandpass selection, baseline measurement, display and threshold setting, coaching, and debriefing at the end of the session. You should be able to demonstrate how to select and assign a practice assignment based on training session results and evaluate and summarize client progress during a training session.
Assignment
Now that you have completed this module, find the manual for your electromyograph, electroencephalograph, or data acquisition system. Find the following information: Bandpass, Common-mode rejection ratio, Input impedance, Integration method, and Signal-to-noise ratio.
Perform the behavioral test discussed in this module. Place a set of SEMG electrodes on the palmar surface (underside) of your arm, and then watch the display as you contract and relax these muscles.
If you have a portable electromyograph, insert an electrode and move it about the room to detect the lowest and highest zones for 50/60Hz noise.
Glossary
active electrode: the electrode placed over a target muscle like the masseter.
adhesive collars: self-adhering rings that secure SEMG electrodes to the skin.
adipose tissue: body fat that filters the SEMG signal and reduces its amplitude.
aliasing: an artifact created during analog-to-digital conversion of a continuous signal by a slow sampling rate.
algorithm: a step-by-step procedure or formula for solving a problem or accomplishing a task, used in biofeedback for signal processing and artifact detection.
amplitude: the strength of the EMG signal measured in microvolts.
analog display: a display that continuously represents biofeedback signal amplitude over time.
analog-to-digital (A/D) converter: an electronic device that converts continuous signals to discrete digital values.
autoregressive (AR) modeling: a mathematical technique that decomposes a complex signal into its component frequencies.
average voltage: 0.637 of the peak voltage.
autoregressive (AR) modeling: a mathematical technique that decomposes a complex signal into its component frequencies.
bandpass: a filter that combines a low-pass filter and high-pass filter.
bandpass filter: an electronic device that combines a low-pass filter and high-pass filter to transmit frequencies within a specific range and attenuate those outside that range, such as a 100-200 Hz bandpass filter.
bandwidth: the difference between a filter's lower and upper cutoff frequencies. The bandwidth of a 100-200 Hz bandpass filter is 100 Hz.
beat frequency: a false signal produced during analog-to-digital conversion by frequencies near the sampling rate.
binary display: displays that show whether the signal is above or below a threshold.
bipolar recording: a recording method that uses two active electrodes and a common reference.
bit depth: the number of voltage levels that an A/D converter can discern. A resolution of 16 bits means that the converter can discriminate among 65,536 voltage levels.
center frequency: the frequency located at the middle of a bandpass filter. For example, 150 Hz is the center frequency for a 100-200 Hz bandpass filter.
common-mode rejection ratio (CMRR): the degree by which a differential amplifier boosts signal (differential gain) and artifact (common-mode gain).
contraction phase: the segment of a SEMG tracking test where the patient is instructed to contract a monitored muscle.
corner or cutoff frequencies: the frequencies at which voltage is reduced to 0.707 of its center frequency strength. The corner frequencies are 100 Hz and 200 Hz for a 100-200 Hz bandpass filter.
cross-talk artifact: in SEMG biofeedback, interference with recording at one site by muscle action potentials generated by another muscle.
decibel: the logarithmic ratio of two measurements using the same unit of intensity or power. A ratio of 60 dB is 1000 to 1, and 100 dB is 100,000 to 1.
differential amplifier: an electronic amplifier containing two single-ended amplifiers that are 180 degrees out of phase that amplifies the difference between two input voltages.
differential input impedance: the opposition to an AC signal entering a differential amplifier as it is dropped across a resistor network.
digital display: the numeric display of signal amplitude, for example, a temperature display of 92 degrees F (33.3 degrees C).
disposable electrodes: surface electrodes that are discarded after use to prevent transmission of infection.
dummy subject: device consisting of two resistors that simulates the skin-electrode impedance of a human subject used to measure noise generated by the environment and instrument.
dry electrode: a surface electrode that does not require conductive gel, often used in wearable SEMG systems for convenience and long-term monitoring.
ecological validity: the degree to which research findings or measurements reflect real-world conditions and behaviors outside the laboratory setting.
ECG artifact: contamination of EEG or EMG signals by the 0.05-80-Hz components of the ECG signal generated by the heart.
electrode: a sensor that detects biological signals like the EMG by converting an ionic potential into an electrical potential.
electrode gel: an electrically-conductive solution used to detect biological potentials (e.g., ECG, EEG, and EMG) from the skin surface and standardize electrodermal measurement.
electrolyte: an electrically-conductive medium that contains free ions.
electrostatic artifact: artifactual voltages in EEG and EMG recording produced by static electricity.
epoch: a signal sampling period, for example, a 30-second sample of EMG activity.
epoch number: a location in a session's record. For example, epoch 52 is the 52nd 1-second epoch.
Fast Fourier Transform (FFT) analysis: an algorithm that decomposes a complex waveform into its component frequencies.
filter: an electronic circuit that removes or enhances signal components.
floating skin electrode: an SEMG electrode that contains a recessed reservoir for electrode gel.
frequency (Hz): the number of complete cycles that an AC signal completes in a second, usually expressed in hertz.
frontales placement: a horizontal placement of SEMG over the two frontales muscles. The actives are centered over each eye with the reference above the nose.
full-wave rectifier: an electronic device that changes an AC signal's upper and lower halves into a positive DC signal.
gel-bridge artifact: a short circuit created when electrode gel smears and creates a bridge between closely-spaced active and reference electrodes, resulting in abnormally low readings.
half-wave rectifier: an electronic device that changes an AC signal's upper or lower half into a positive DC signal.
high-density surface EMG (HD-sEMG): an advanced recording technique using arrays of multiple closely spaced electrodes to create detailed spatial maps of muscle activity and decompose signals into individual motor unit action potentials.
high-pass filter: an electronic device that selects frequencies above a cutoff, for example, a 100 Hz high-pass filter.
impedance (Z): the complex opposition to an AC signal measured in Kohms.
impedance meter: a device that measures skin-electrode impedance.
impedance test: the automated or manual measurement of skin-electrode impedance.
inertial measurement unit (IMU): a sensor device that measures acceleration, rotation, and orientation, often combined with SEMG to correlate muscle activity with movement and joint position.
integrator: a circuit that calculates rectified signal voltage.
interstitial fluid: the fluid between cells through which biological signals travel via volume conduction.
level detection: a device that decides whether the signal voltage matches the threshold setting to activate a feedback display.
line current artifact: the frequencies at 50/60Hz and their harmonics produced by AC devices can contaminate EEG, ECG, or SEMG recordings. A fluorescent light can create false SEMG voltages.
logarithmic display: the display of the logarithm of a biofeedback signal to feature greater resolution at the lower end of the scale.
low-pass filter: an electronic device that selects frequencies below a cutoff, for example, a 200 Hz low-pass filter.
machine learning: a branch of artificial intelligence in which computer algorithms improve through experience and data, used in modern biofeedback for artifact detection and signal enhancement.
microvolt: a unit of amplitude (signal strength) that is one-millionth of a volt.
millivolt: a unit of amplitude (signal strength) that is one-thousandth of a volt.
monopolar recording: recording method that uses one active and one reference electrode.
motor unit action potential: the electrical signal generated when a motor neuron activates all the muscle fibers it innervates, detectable through HD-sEMG decomposition techniques.
movement artifact: the high-amplitude signals produced by client movement that displaces the electrode cable that contaminates EEG and SEMG recordings.
muscle belly: the central region of a muscle where active electrodes should be placed for optimal signal detection.
narrow bandpass: a filter setting (typically 100-200 Hz) used when environmental noise or cross-talk is high.
notch filter: a circuit that suppresses a narrow band of frequencies, such as contamination produced by line current (50/60Hz artifact).
Nyquist-Shannon sampling theorem: position that the perfect reconstruction of an analog signal requires sampling at two times its highest frequency. A signal whose highest frequency is 1000 Hz should be sampled 2000 times per second.
octave: a 2:1 ratio between two frequencies. Filter slope is specified in dB per octave.
offset errors: readings that are systematically too high or low, corrected by calibration with a zeroing clip.
operational amplifier (op-amp): a high-gain DC amplifier that uses external feedback to perform computations like addition, subtraction, and averaging on biological signals.
passband: the frequencies transmitted by a bandpass filter, for example, 100-200 Hz.
peak frequency: the highest amplitude frequency in a signal.
peak voltage: 0.5 of the peak-to-peak voltage.
peak-to-peak voltage: the energy contained between the positive and negative peaks of the original AC waveform, which is 2 times peak voltage.
polarization: charge segregation produced by chemical reactions producing separate regions of positive and negative charge where an electrode and electrolyte make contact, reducing ion exchange.
power spectral analysis: the measurement of signal amplitude across its frequency range using a Fourier Transform algorithm.
preamplifier: the first amplification stage that prepares an electronic signal for additional processing. A preamplifier can be built into an EEG or SEMG electrode housing to reduce signal loss.
R-spike: an initial upward deflection in the QRS complex of the ECG.
radiofrequency (RF) artifact: the frequencies from 3 Hz to 300 GHz that contaminate EEG and SEMG recordings. Cell phone transmissions and computer monitors can produce spuriously raised SEMG amplitudes.
rectifier: an electronic device that changes an AC signal into a positive DC signal.
reference electrode: the electrode placed over a less electrically active site like the mastoid process behind the ear or the spine.
relaxation phase: the segment of a SEMG tracking test where the patient is instructed to relax a monitored muscle.
resolution: the degree of detail in a biofeedback display (0.1 microvolt) or the number of voltage levels that an A/D converter can discriminate (16 bits or discrimination among 65,536 voltage levels).
root mean square (RMS) voltage: 0.707 of the peak voltage.
sampling rate: the number of times per second that the voltage is measured.
scale: the range of displayed values, for example, a SEMG scale of 0-5 microvolts.
SEMG scanning: bipolar recording technique that involves the sequential monitoring of a series of muscle sites using two active post electrodes and a common reference.
sensitivity: the ability of a biofeedback device to detect weak signals that depends on its signal-to-noise ratio. The ability of an electromyograph to discriminate a 0.1 microvolt voltage from environmental and instrument noise.
shaping: an operant procedure where a clinician rewards successive approximations of a target behavior. Praise and auditory and visual feedback for progressively lower trapezius SEMG levels.
signal-to-noise ratio: the ratio between signal and artifact voltages that determines a biofeedback instrument's sensitivity.
silver-silver chloride electrode: an electrode fabricated from a combination of silver and silver-chloride to reduce electrode noise.
single-ended amplifier: an electronic amplifier that amplifies an input voltage.
slope: the rate by which voltage is reduced as frequency changes that is expressed as a ratio of decibels per octave, such as a 20 dB/octave slope.
stratum corneum: the outermost epidermal layer that is abraded during skin preparation for EEG and SEMG biofeedback.
telemetry: the remote monitoring and transmission of information. A biofeedback encoder measures physiological activity and transmits these data to a computer for analysis.
threshold: the signal value that is a training goal, for example, 2 microvolts.
time constant: the period during which a biological signal is averaged before it is displayed, for example, 5 seconds.
tracking test: a check whether a biofeedback display mirrors client behavior. SEMG amplitude should rise when your client contracts a monitored muscle.
transducers: devices that transform energy from one form to another. Electrodes convert ionic potentials into electrical potentials.
volume conduction: the movement of a biological signal through the interstitial fluid to the skin surface.
wearable SEMG: portable surface EMG devices integrated into garments, patches, or accessories that allow continuous monitoring during daily activities outside laboratory settings.
wide bandpass: a filter setting (typically 20-500 Hz) used under ideal conditions for more accurate SEMG representation.
zeroing clip: a device that shorts a sensor's inputs to allow a data acquisition system to adjust for offset errors, for example, EEG or SEMG zeroing clips.
References
Amar, P. B., McKee, M. G., Peavey, B. S., Schneider, C. J., Sherman, R. A., & Sterman, M. B. (1992). Standards and guidelines for biofeedback applications in psychophysiological self-regulation. Association for Applied Psychophysiology and Biofeedback.
Andreassi, J. L. (2007). Psychophysiology: Human behavior and physiological response (5th ed.). Lawrence Erlbaum and Associates, Inc.
Basmajian, J. V. (Ed.). (1989). Biofeedback: Principles and practice for clinicians. Williams & Wilkins.
Baker, M. R., & Baker, S. N. (2003). The effect of diazepam on motor cortical oscillations and corticomuscular coherence studied in man. The Journal of Physiology, 546(Pt 3), 931–942. https://doi.org/10.1113/jphysiol.2002.029561
Bolek, J. (2013). Digital sampling, bits, and psychophysiological data: A primer, with cautions. Applied Psychophysiology and Biofeedback, 38, 303-308. https://doi.org/10.1007/s10484-013-9227-4
Bolek, J. E., Rosenthal, R. L., & Sherman, R. A. (2016). Advanced topics in surface electromyography. In M. S. Schwartz & F. Andrasik (Eds.), Biofeedback: A practitioner's guide (4th ed.). The Guilford Press.
Brittain, J. S., Conway, B. A., Halliday, D. M., & Farmer, S. F. (2013). Beta-adrenergic modulation of tremor and corticomuscular coherence in humans. PLOS ONE, 8(6), e65567. https://doi.org/10.1371/journal.pone.0065567
Cote, K. A., & Tiffany, S. T. (2005). Facial EMG as an index of affective response to nicotine. Nicotine & Tobacco Research, 7(4), 517–526. https://doi.org/10.1080/14622200500186026
Cram, J. (1991). Clinical EMG for surface recordings: Vol. 2. Clinical Resources.
De Luca, C. J. (1997). The use of surface electromyography in biomechanics. Journal of Applied Biomechanics, 13, 135-163.
Florimond, V. (2009). Basics of surface electromyography applied to physical rehabilitation and biomechanics. Thought Technology Ltd.
Institute of Medicine. (1999). Marijuana and medicine: Assessing the science base. National Academies Press. (See Chapter 7: Muscle Spasticity).
Kalmar, J. M., & Cafarelli, E. (1999). Effects of caffeine on neuromuscular function. Journal of Applied Physiology, 87(2), 801–808. https://doi.org/10.1152/jappl.1999.87.2.801
Katzung, B. G., & Trevor, A. J. (2020). Basic and clinical pharmacology (15th ed.). McGraw-Hill Professional.
Kavanagh, J. J., & Taylor, J. L. (2022). Enhanced availability of serotonin limits muscle activation during high-intensity, but not low-intensity, fatiguing contractions. Journal of Neurophysiology, 127(3), 850–861.
Kay, D. C. (1979). Opioid effects on computer-derived sleep and EEG parameters in nondependent human addicts. Sleep, 2(2), 175–191. https://doi.org/10.1093/sleep/2.2.175
Khazan, I. (2013). The clinical handbook of biofeedback: A step-by-step guide for training and practice with mindfulness. John Wiley & Sons, Ltd.
Khazan, I. (2019). Biofeedback and mindfulness in everyday life. W.W. Norton & Company.
Kimiskidis, V. K., Papagiannopoulos, S., Sotirakoglou, K., Kazis, D. A., Dimopoulos, G., & Kazis, A. (2006). The effect of lorazepam on the excitability of the human motor cortex. Journal of Clinical Psychopharmacology, 26(1), 90–92.
Kubala, T. (2013). Electricity 1: Devices, circuits, and materials (10th ed.). Cengage Learning.
Lubar, J., & Gunkelman, J. (2003). Neurometrics, neurotherapy, and clinical practice. Workshop presented at the 34th annual Association for Applied Psychophysiology and Biofeedback convention, Jacksonville, Florida.
Montgomery, D. (2004). Introduction to biofeedback. Module 3: Psychophysiological recording. Association for Applied Psychophysiology and Biofeedback.
Nilsson, J. W., & Riedel, S. A. (2019). Electric circuits (11th ed.). Pearson Prentice-Hall.
Peek, C. J. (2016). A primer of traditional biofeedback instrumentation. In M. S. Schwartz & F. Andrasik (Eds.), Biofeedback: A practitioner's guide (4th ed.). The Guilford Press.
Peper, E., Gibney, K. H., Tylova, H., Harvey, R., & Combatalade, D. (2008). Biofeedback mastery: An experiential teaching and self-training manual. Association for Applied Psychophysiology and Biofeedback.
Schwartz, M. S., & Andrasik, F. (Eds.). (2016). Biofeedback: A practitioner's guide (4th ed.). The Guilford Press.
Shaffer, F., & Neblett, R. (2010). Practical anatomy and physiology: The skeletal muscle system. Biofeedback, 38(2), 47-51.
Sherman, R. (2002). Hooray! The revolution is here! (But don't stop it in its tracks). Biofeedback, 30(1), 7, 18.
Stern, R. M., Ray, W. J., & Quigley, K. S. (2001). Psychophysiological recording (2nd ed.). Oxford University Press.
Tassinary, L. G., Cacioppo, J. T., & Vanman, E. J. (2007). The skeletomotor system: Surface electromyography. In J. T. Cacioppo, L. G. Tassinary, & G. G. Berntson (Eds.), Handbook of psychophysiology (3rd ed.). Cambridge University Press.
Teplan, M. (2002). Fundamentals of EEG measurement. Measurement Science Review, 2(2), 1-11.
Thomas, C. K., Zijdewind, I., & Grumbles, R. M. (2010). Changes in voluntary torque and electromyographic activity following oral baclofen. Muscle & Nerve, 42(6), 923–931. https://doi.org/10.1002/mus.21782
Thompson, M., & Thompson, L. (2016). The biofeedback book: An introduction to basic concepts in applied psychophysiology (2nd ed.). Association for Applied Psychophysiology and Biofeedback.