Cardiovascular Hardware
What You Will Learn
This chapter transforms the seemingly complex world of cardiovascular biofeedback instruments into practical tools you can confidently use with your clients. You will discover how feedback thermometers translate the warmth of blood flowing through skin arterioles into meaningful temperature readings, and why the positioning of a tiny thermistor bead matters so much for accurate measurements. You will learn the distinction between temperature biofeedback, which captures slow tonic changes in peripheral blood flow, and blood volume pulse feedback, which detects rapid phasic shifts within seconds of a stressor. The chapter guides you through the workings of the photoplethysmograph, showing how infrared light passing through or reflecting off tissue reveals beat-to-beat changes in blood volume.
You will master the electrocardiograph and understand why it provides more accurate heart rate variability measurements than the blood volume pulse method, especially when your client's fingers are cold. Along the way, you will encounter the artifacts that can contaminate your cardiovascular recordings, from movement and cold exposure to 50/60 Hz powerline interference, and learn practical strategies to identify, minimize, and correct each one. By the end of this chapter, you will be prepared to conduct temperature biofeedback for stress-related disorders, heart rate variability training for autonomic regulation, and blood volume pulse monitoring for conditions ranging from migraines to hypertension.
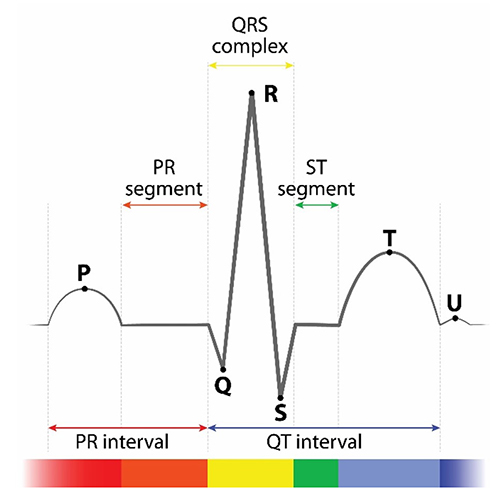
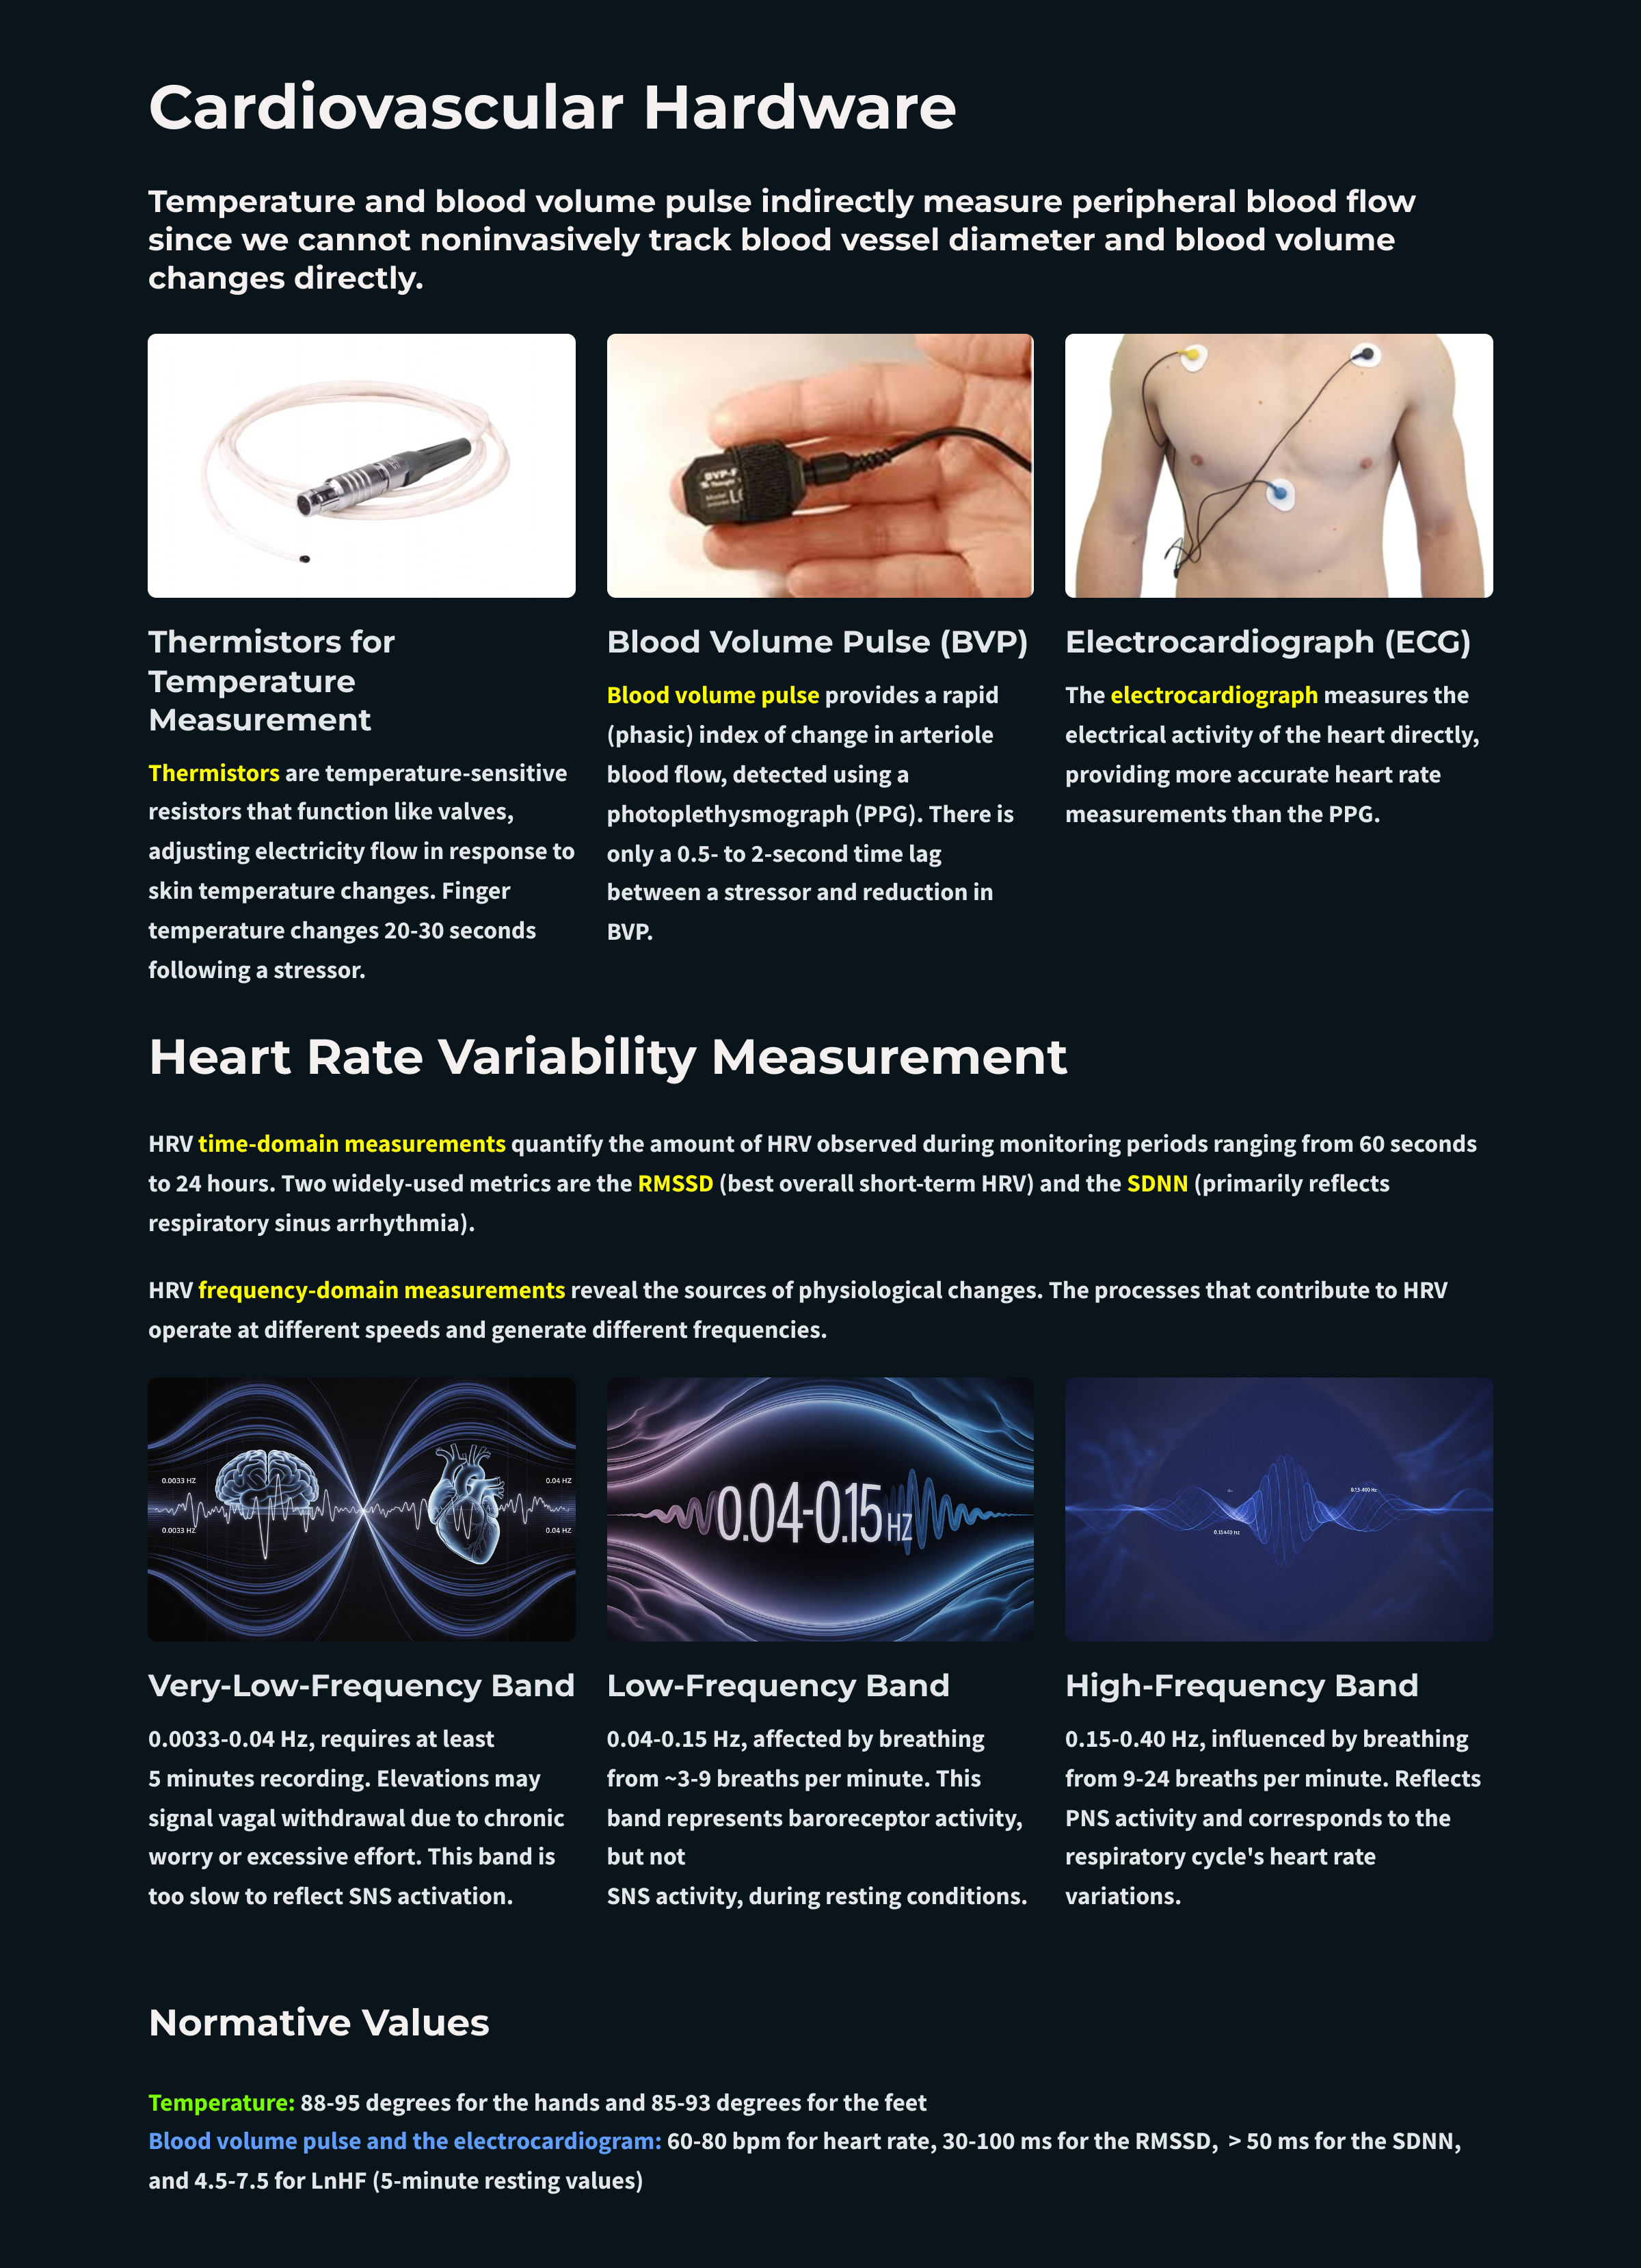
Temperature and blood volume pulse indirectly measure peripheral blood flow since we cannot noninvasively track blood vessel diameter and blood volume changes directly (Peek, 2016). These modalities play an essential role in biofeedback because they can help identify an individual's response stereotypy or unique response to stressors. Since they reflect autonomic activity, these instruments can help restore a healthy dynamic relationship between the parasympathetic and sympathetic branches. Graphic © Paulista/Shutterstock.com.
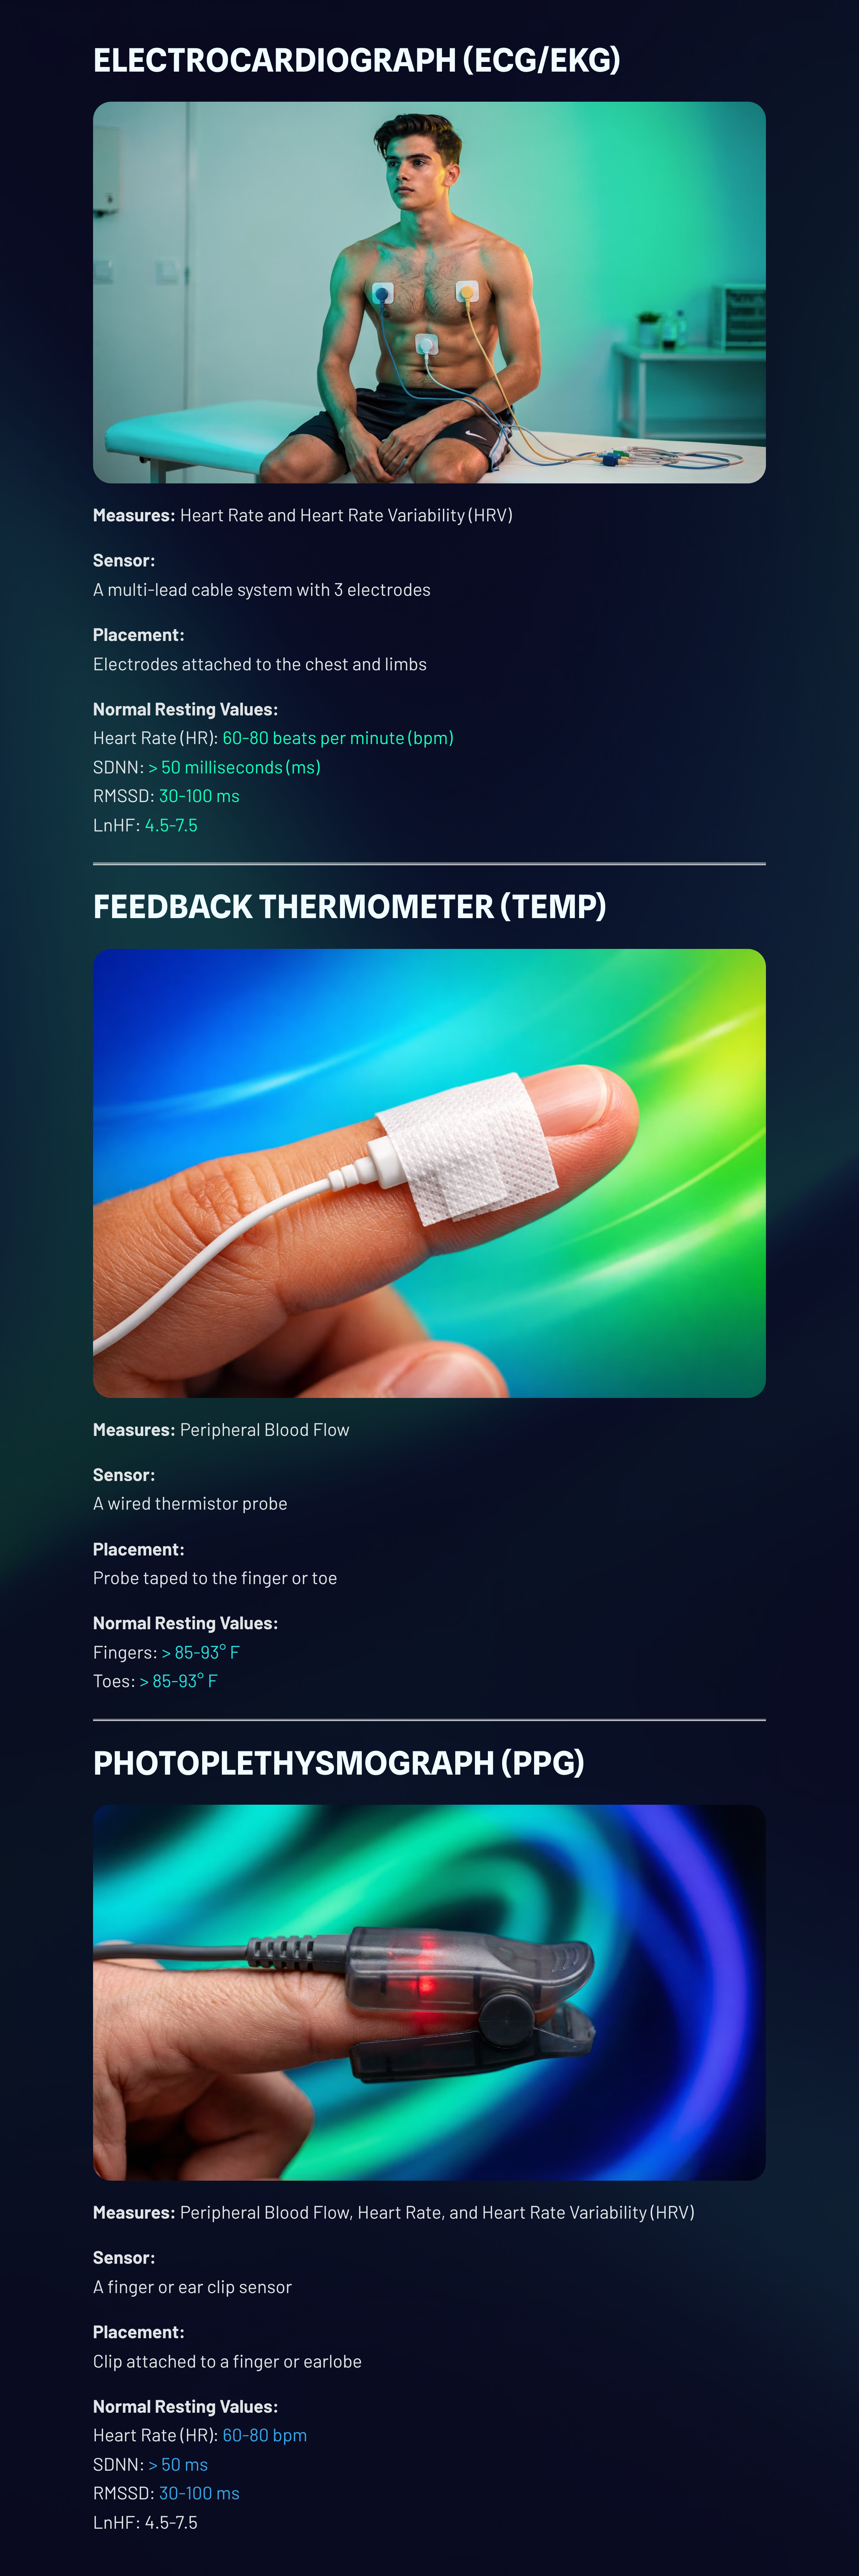
Temperature is a sluggish tonic index of blood flow in skin arterioles. Finger temperature may change from 20-30 seconds following a stressor. Blood volume pulse (BVP), in sharp contrast, is a rapid (phasic) index of change in arteriole blood flow. There is a 0.5- to 2-second time lag between a stressor and reduction in BVP. These measures complement each other. Temperature indexes average blood flow, while blood volume pulse tracks sudden changes.
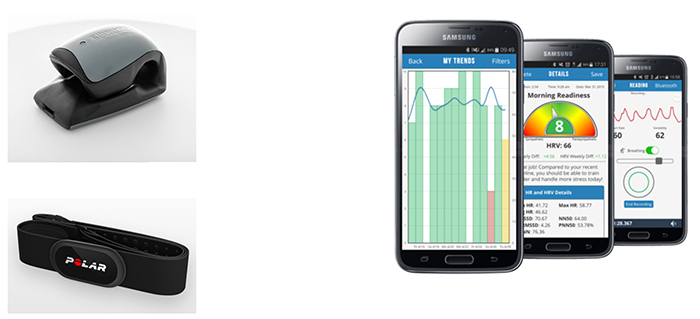
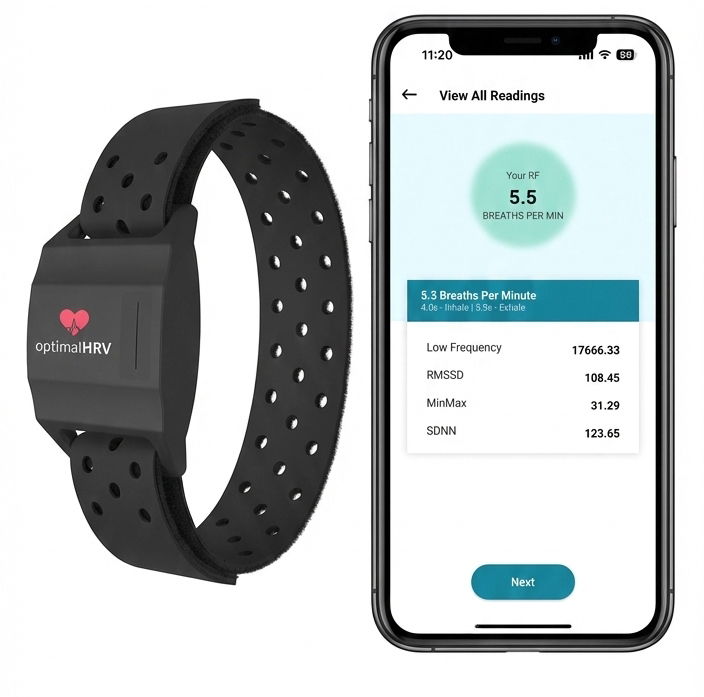
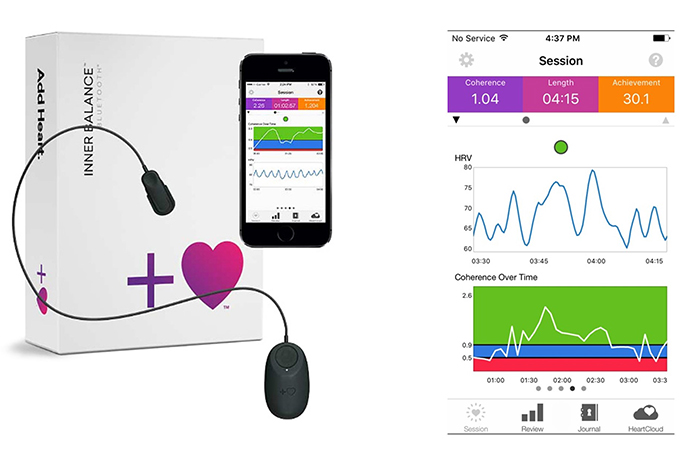
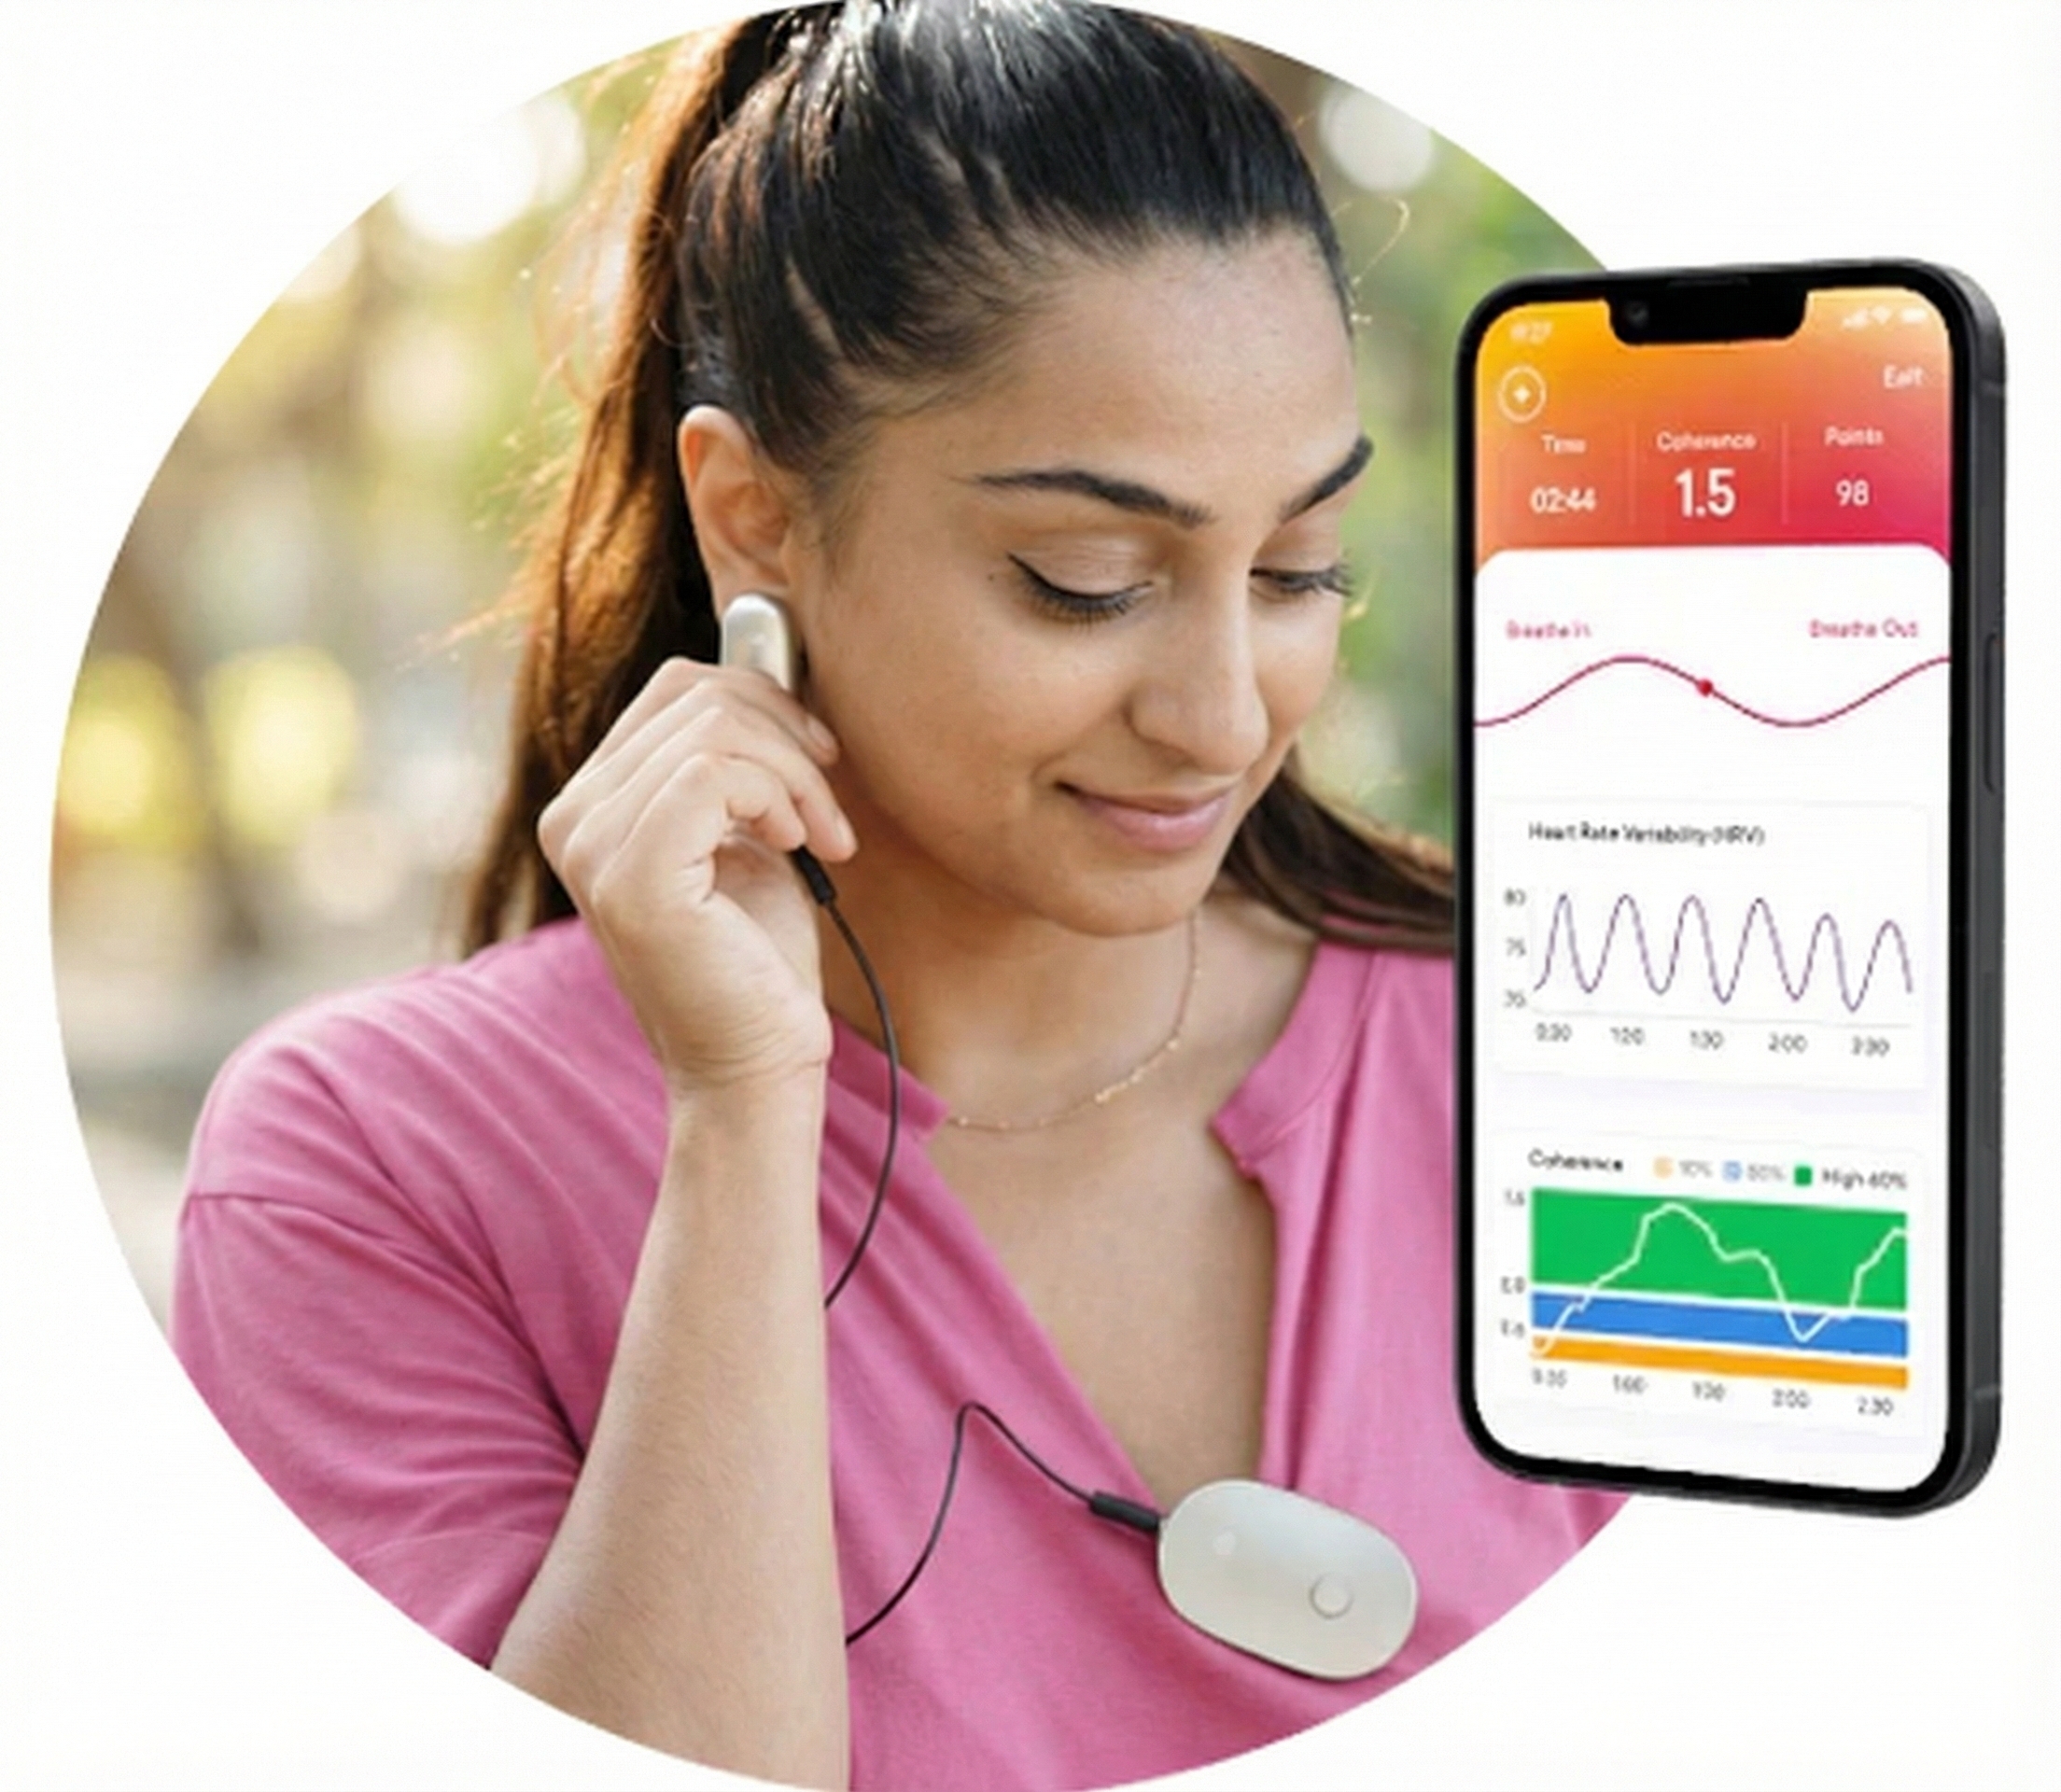
The photoplethysmograph (PPG) and electrocardiograph (ECG) are two methods of detecting heart rate (HR) and heart rate variability (HRV), consisting of beat-to-beat changes in the heart rhythm. Consumer wearable devices like the Elite HRV CoreSense, Institute of HeartMath Inner Balance, Optimal HRV, and Polar have become increasingly popular for recreation and self-regulation.
BCIA Blueprint Coverage
This unit addresses Descriptions of the most commonly employed biofeedback modalities: Temperature, blood volume pulse, EKG and HR (III-A), Sources of artifact (III-B), and Structure and function of the autonomic nervous system (V-A).
This unit covers the Feedback Thermometer, Infrared Thermometers, Photoplethysmograph, Electrocardiograph, Heart Rate Variability Metrics, and Drug Effects.
🎧 Listen to the Full Chapter Lecture
Feedback Thermometer
Thermistors
We detect temperature using a thermistor, a transducer that converts temperature into a resistance value.Thermistors are temperature-sensitive resistors. They function like valves that adjust the flow of electricity from a feedback thermometer in response to changes in skin temperature. As warming skin heats a probe, the valve opens, and more current flows. As cooling skin chills the probe, the valve closes, reducing the current (Peek, 2016). Thermistors exhibit a negative temperature coefficient (resistance to current flow drops with rising temperature).
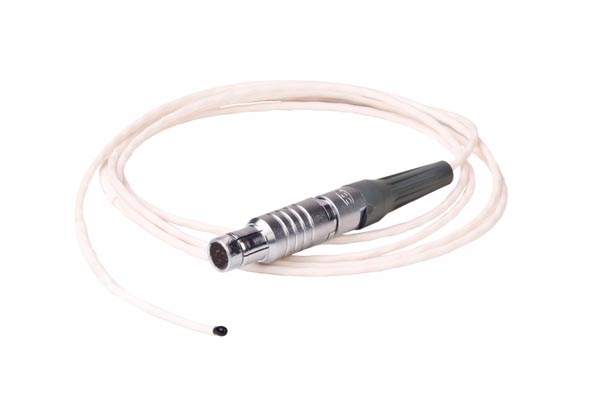
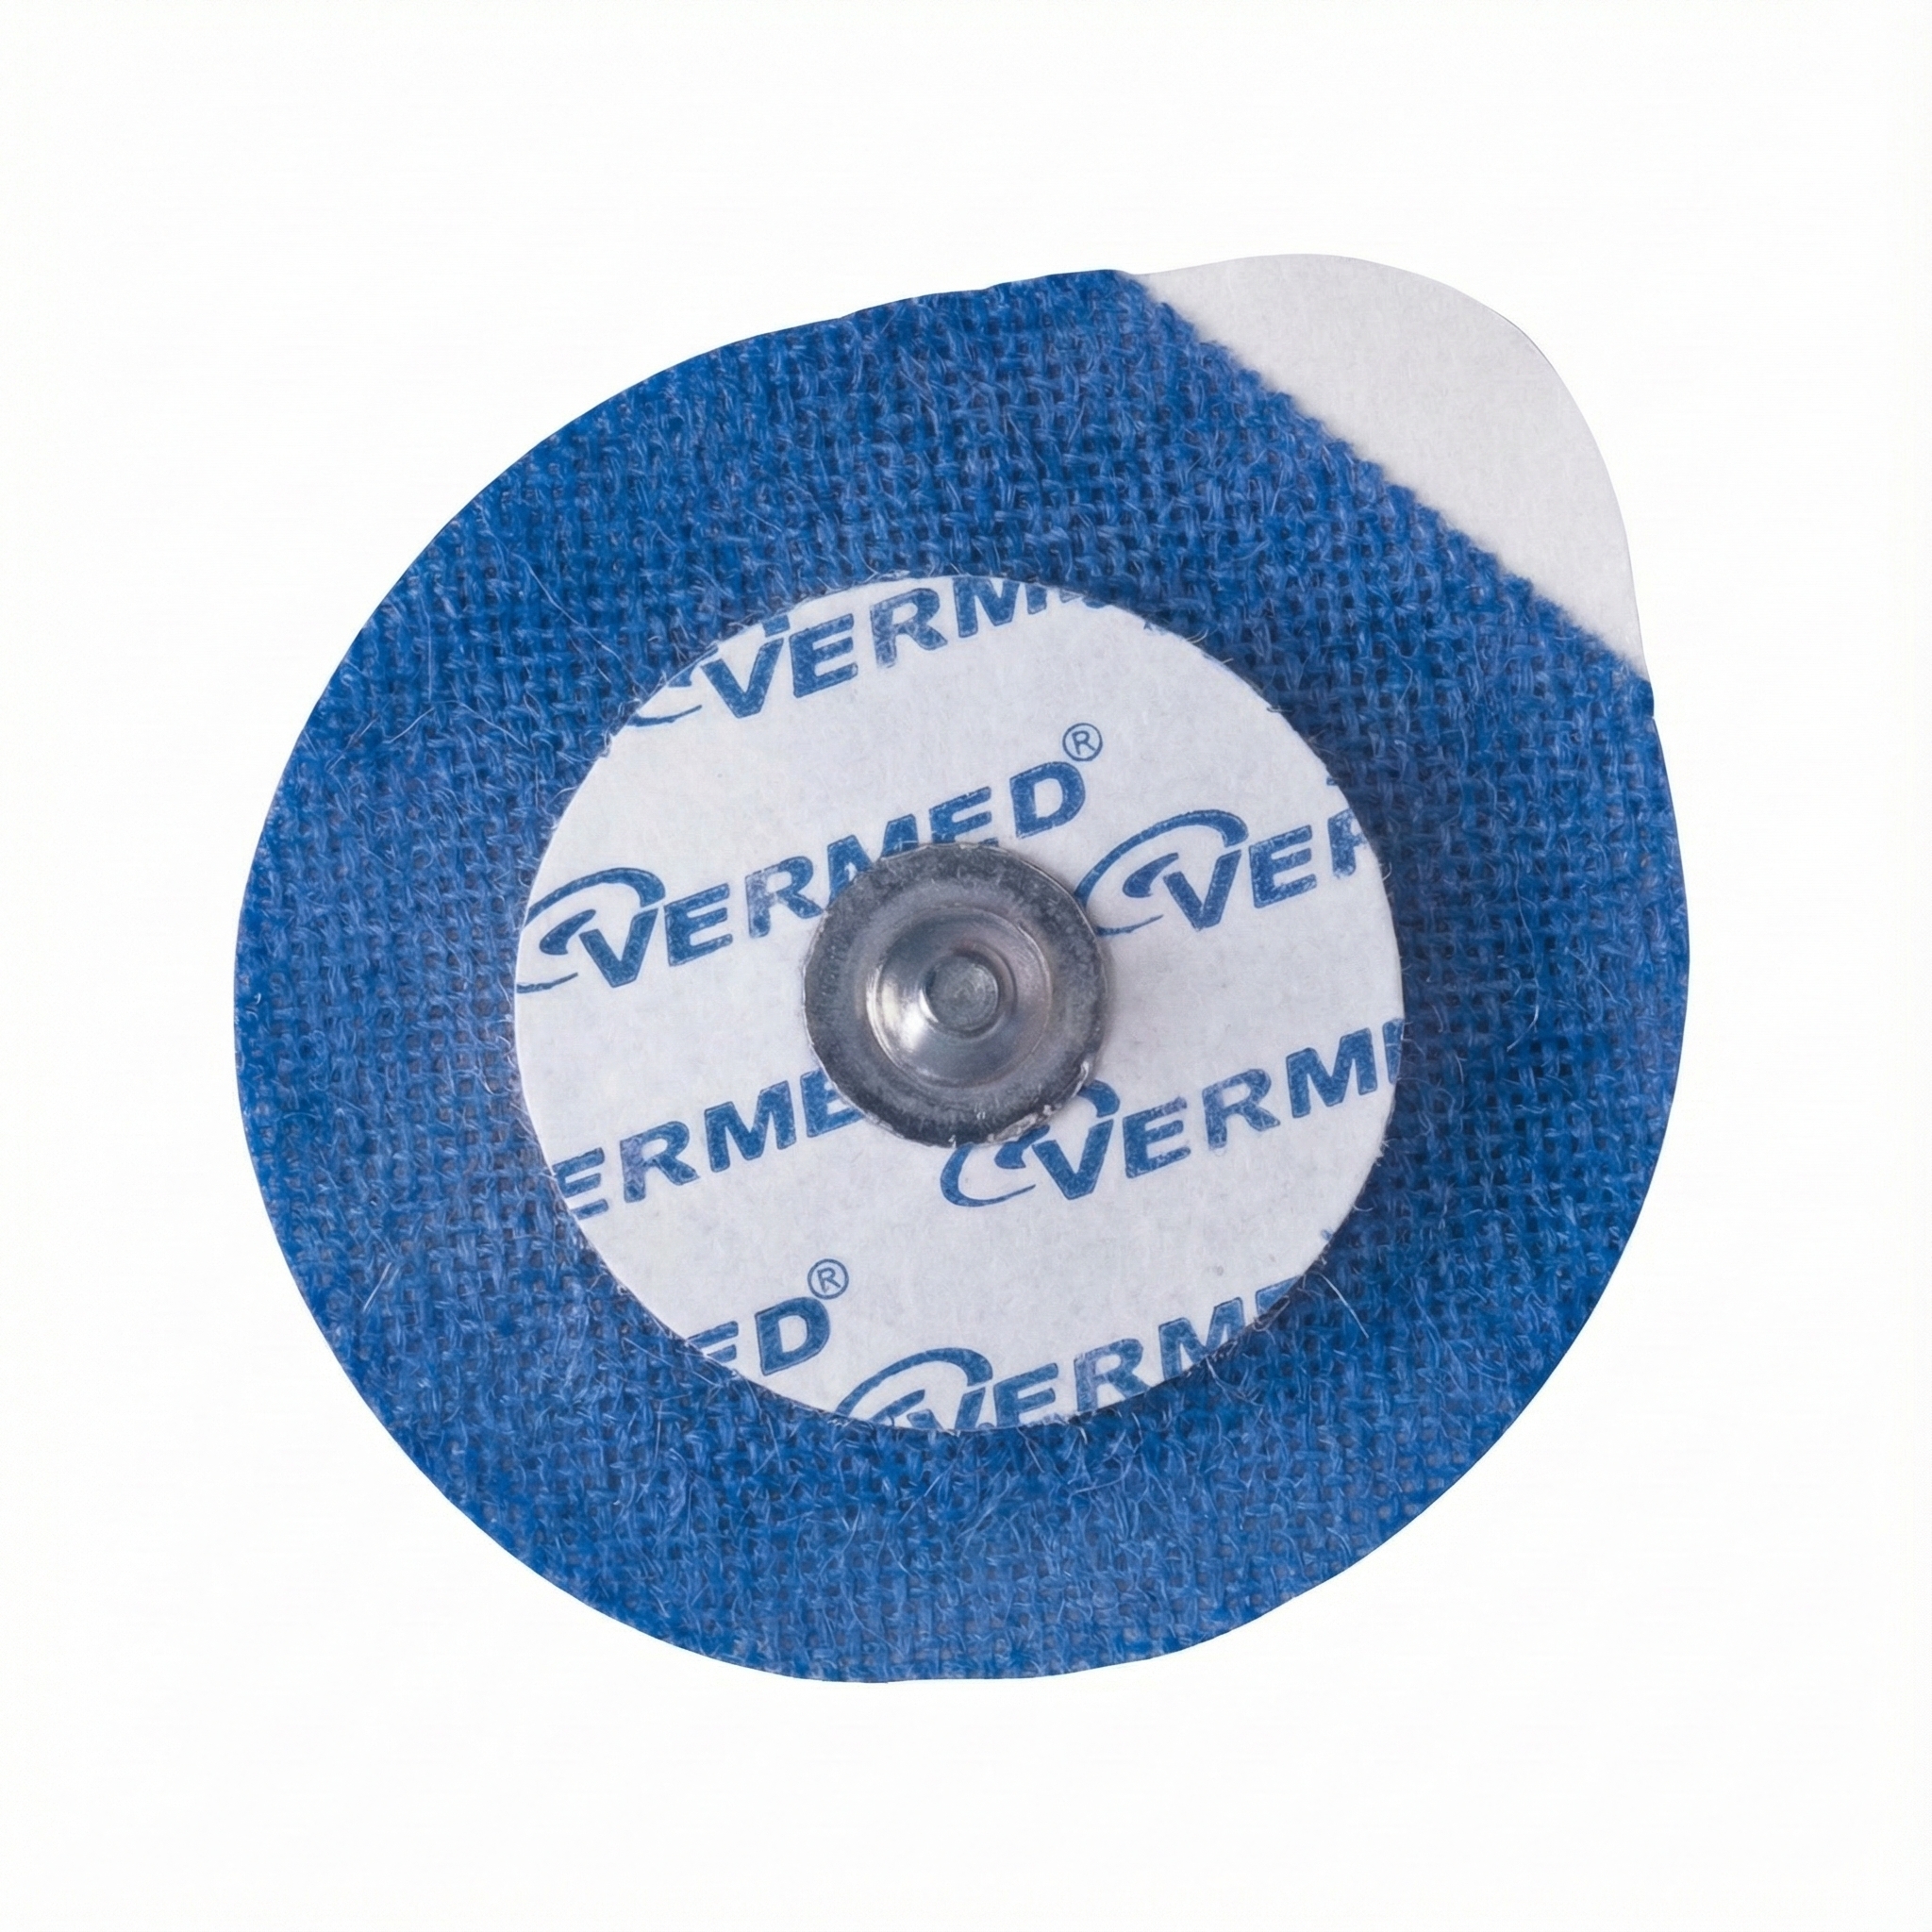
A thermistor is typically enclosed in an epoxy bead. The smaller the bead's mass, the faster the thermistor's responsiveness to changes in arteriole blood flow. For an analogy, a smaller pot of water boils more quickly than a larger pot. A MindMedia thermistor is shown below.
There is a time lag between a change in arteriole diameter and a feedback thermometer's display of the new temperature. This phenomenon, called thermal lag, consists of physiological and hardware components. Capillary response and skin storage of heat may slow response for several seconds. Thermistor sluggishness may add a 1-second delay. By the time blood volume change registers as a change in temperature, it has been significantly "averaged" (Peek, 2016).
A thermistor's speed is specified by its time constant. A time constant is the period required for the thermistor to reach 63.2% of a final value.
You're sitting in a 74°F (23.3° C) room. How long should a thermistor with a 1-second time constant take to register a hand temperature of 92° F (33.3° C)?
Answer: A thermistor will reach 99.8% of your hand temperature in 5 time constants, or 5 seconds. Time constants of 1 second or faster are recommended in clinical work to minimize the time lag between the temperature display and changes in blood vessel diameter.
Thermistor Attachment
Four precautions should be taken when attaching a thermistor. First, you should securely attach the first 3-5 inches (76-127 mm) of the thermistor to your client's skin using porous tape on the index finger. Taping ensures the thermistor bead's secure attachment to the skin.
🎧 Mini-Lecture: Thermistor Attachment and Placement
The existence of a stem effect in which body temperature is averaged with air temperature has been challenged (Zerr et al., 2015).
Second, when a thermistor is placed on a digit like a finger, the tape should be applied over the bead and cable (following the cable), not around the circumference of the digit, which could reduce blood flow and falsely lower readings.
Third, you should use only one tape layer since overwrapping could trap heat and artificially raise temperature via a blanketing effect of nearly 1°F (Zerr et al., 2015).
Finally, you should tape the thermistor cable down to your client's shirt or blouse (and possibly a reclining chair) with adequate slack to prevent movement artifact (sensor decoupling from the skin and signals produced by cable vibration).
Thermistor Placement
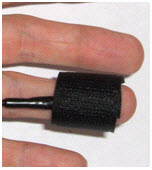
A thermistor should be attached using Velcro ® or Coban™ self-adhering tape to a site on the hand or foot that is well-supplied with blood vessels. The digits of the hand and web dorsum, located on the back of the hand (between the thumb and index finger), are two of many acceptable sites.
Velcro ®
Coban tape™
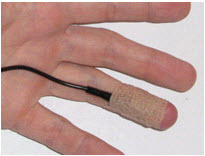
Thermography (infrared imaging) has shown that no single site is most responsive to stressors or relaxation exercises across most individuals. Monitor several sites simultaneously for widespread vasodilation and autonomic change. Warming can be confined to the digit you are monitoring. A client's feet can remain cold while the hands are warm.
Room Conditions
When measuring temperature, the room should be around 74° F (23° C). Rooms below 68° F (20° C) may produce a downward temperature drift. A client should be protected from drafts and cool surfaces and seated with good neck and knee support. Plants may be used to diffuse drafts. Conversely, warm rooms may elevate temperatures. A corpse's hand temperature will be 90° F (32° C) in a 90° F (32° C) room.
Thermistors attached to the hand should be heart-level or lower since temperature may drop if you place the hand above the heart.
Checking Thermistor Accuracy
Use an alcohol or mercury thermometer as your reference to test feedback thermometer accuracy.
A feedback thermometer should be accurate to within ± 1 degree F.
Place the thermistor next to the mercury thermometer and compare room temperature values. If they are within 1° F, the thermistor's accuracy is acceptable.
The most common cause of a malfunction is a damaged thermistor. If the feedback thermometer varies from your reference thermometer by more than 1° F or fails a tracking test, start your troubleshooting by replacing the thermistor.
Tracking Test
You can determine whether a temperature display mirrors a thermistor's temperature by performing a tracking test during which you gently blow on the thermistor bead to warm it. The temperature signal should increase within 20-30 seconds after blowing warm air over it. The temperature will decrease after you stop.
🎧 Mini-Lecture: Temperature Tracking Test
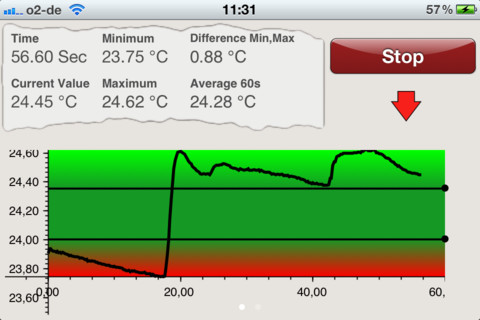
Below is a BioGraph Infiniti temperature display.
A tracking test checks the integrity of the entire signal chain from the thermistor to the encoder and the correct software selection of input channels. A tracking test ensures that a thermistor is intact, snugly inserted into the correct encoder input and that you have chosen the right channel for display.
Baselines
For research purposes, a baseline period should allow temperature to stabilize within 0.5° F (0.28° C) for 5 minutes. Baseline length will vary with each subject between 15 and 45 minutes in a 74° F (23° C) room. Exposure to cold outdoor temperature can delay stabilization by 20 minutes (Khazan, 2013).
Due to practical concerns, clinical baselines are often as brief as 5 minutes during training sessions. If a client hasn't stabilized before the training session starts, warming during the session may reflect an adjustment to the room environment instead of self-regulation.
Normal Values
Typical finger temperatures exceed 88° F (31° C), and toe temperatures reach about 85° F (29° C).
Clinicians can up-train finger temperature to 95° F (35° C) and toe temperature to 93° F (34° C) in a 74° F (23° C) room (Khazan, 2013, pp. 45, 159).
How a Feedback Thermometer Works
A feedback thermometer detects temperature indirectly.
This device passes a DC signal through a thermistor and back to a voltmeter. The voltmeter measures the return voltage, which is referenced to absolute temperature. For example, if a temperature module's output voltage were +4 VDC (volts DC), this might correspond to a temperature of 100° F (38° C).
Feedback thermometers use operational amplifiers to boost and process DC voltages. A basic operational amplifier is a high-gain DC amplifier that uses external feedback to add, subtract, or average thermistor signals. Feedback thermometers use operational amplifiers to calculate absolute temperature, average temperature, derivative temperature, and differential temperature.
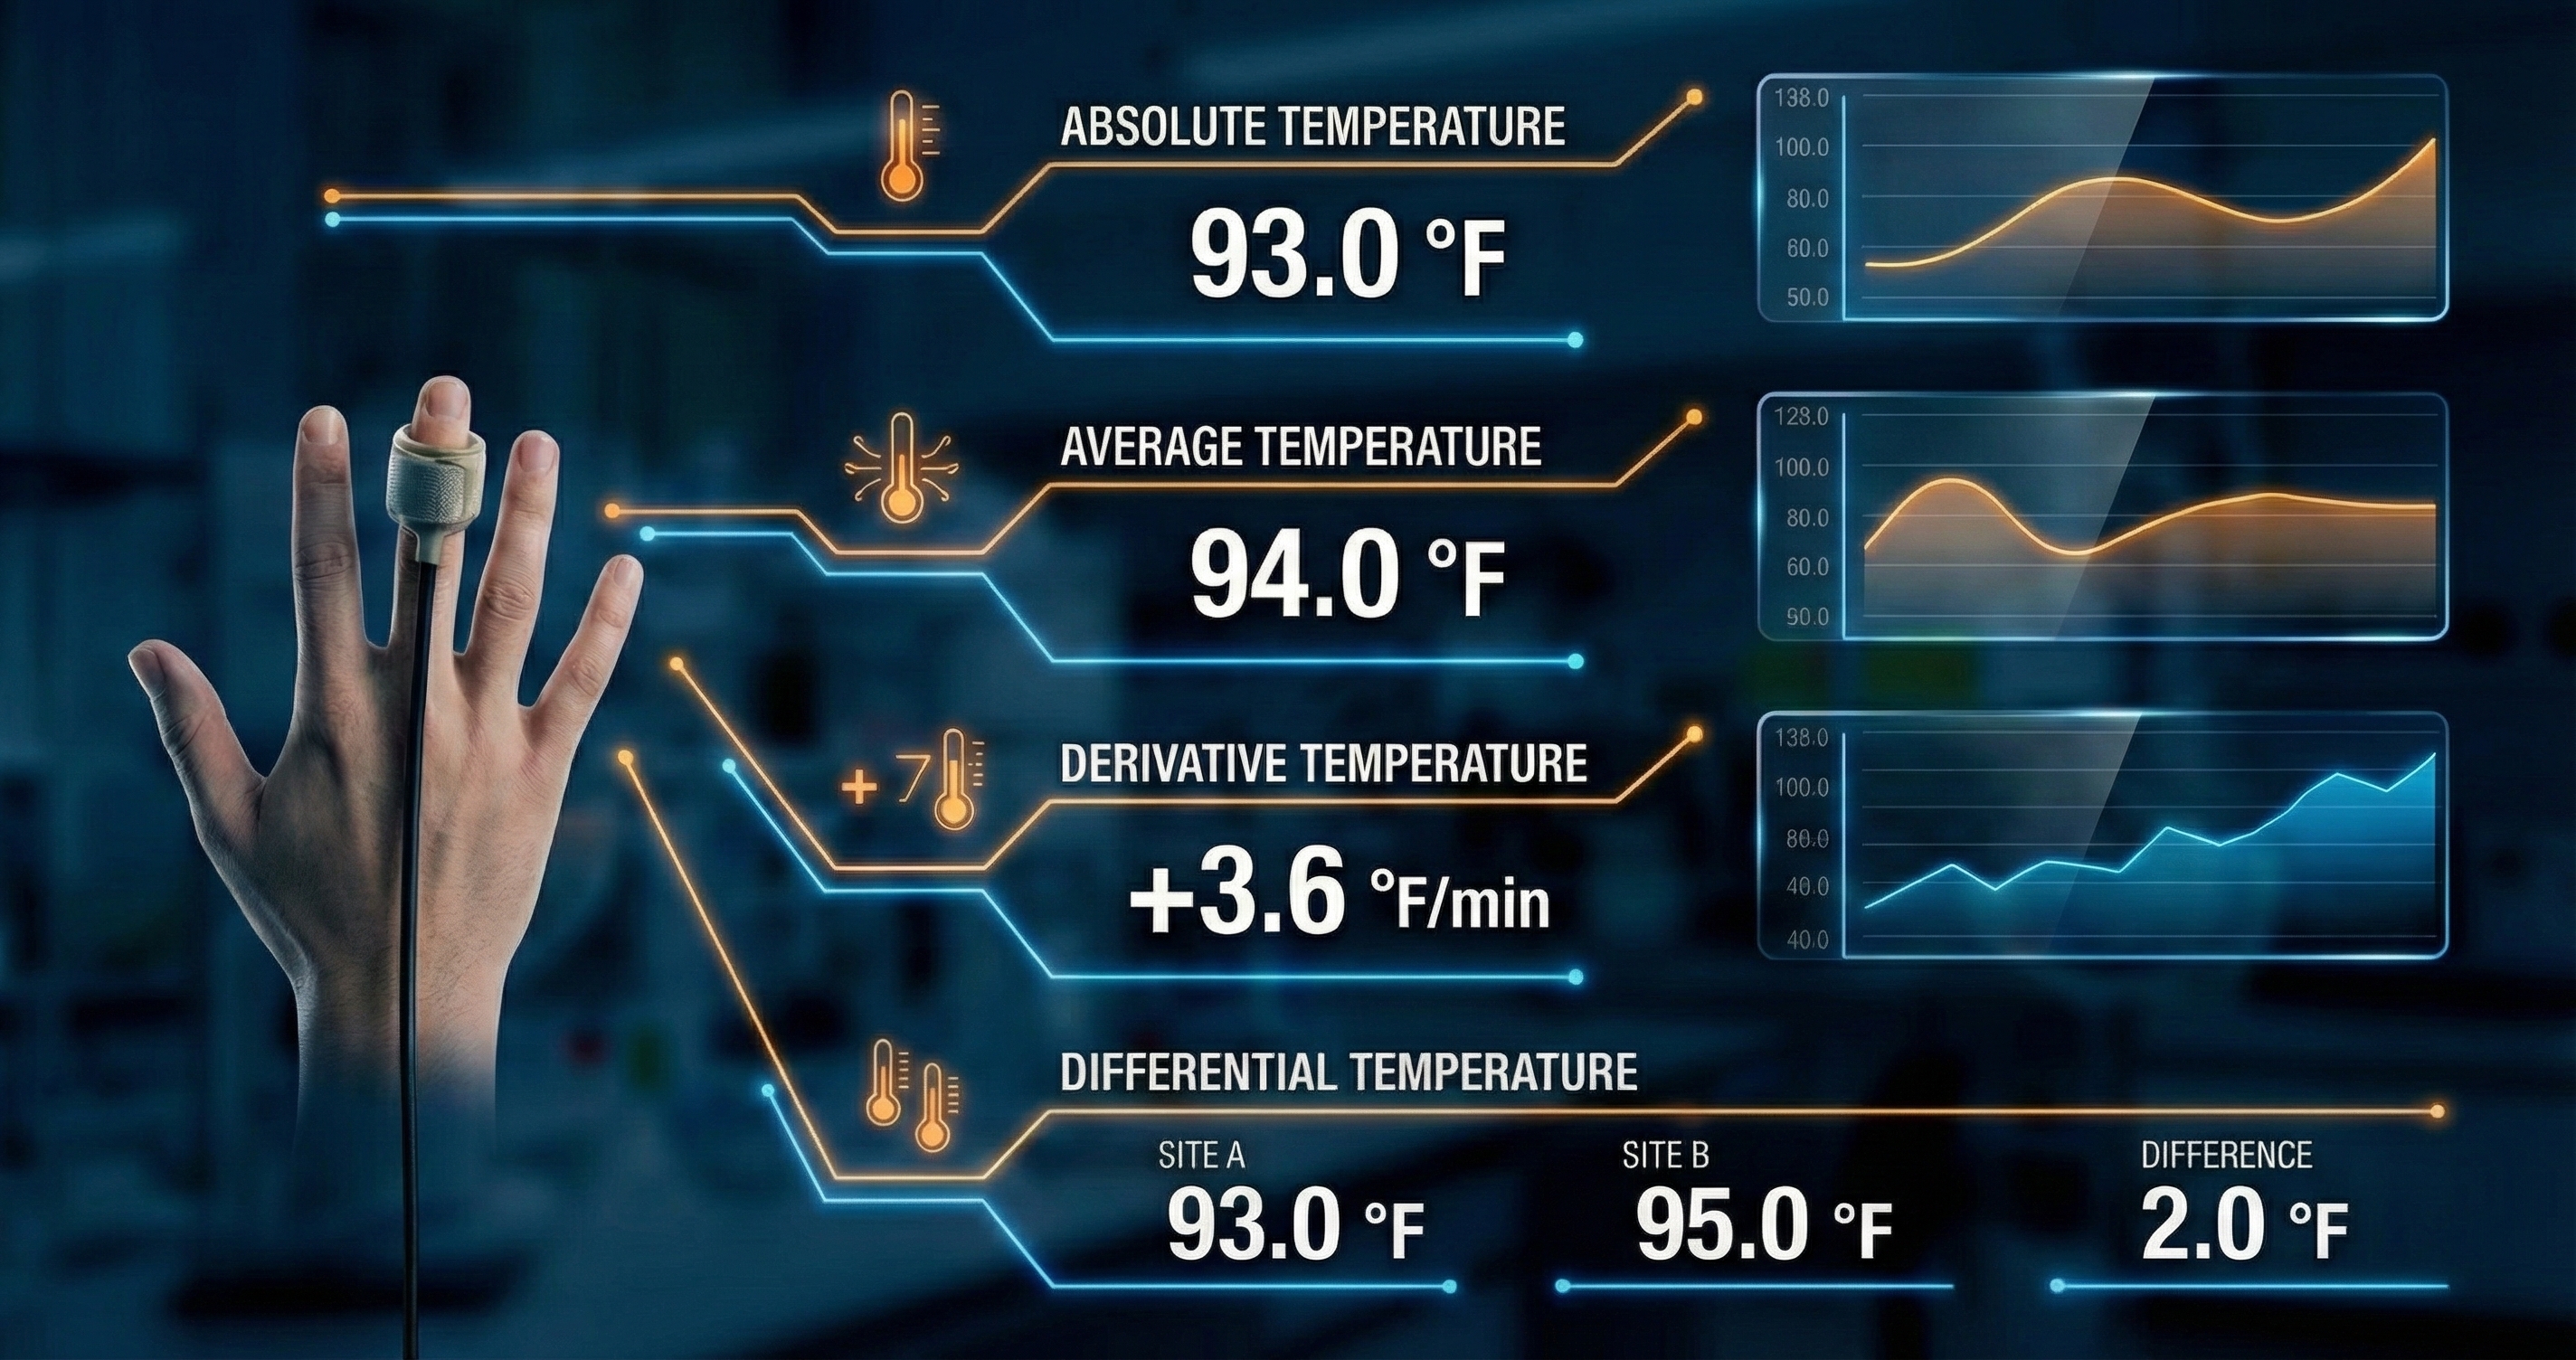
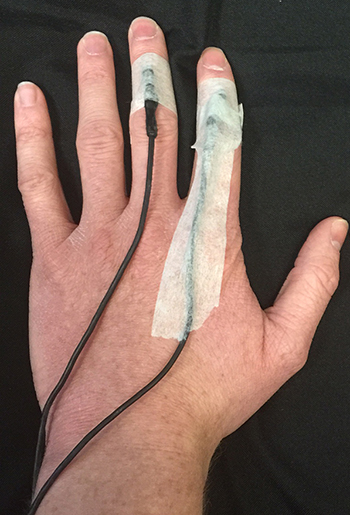
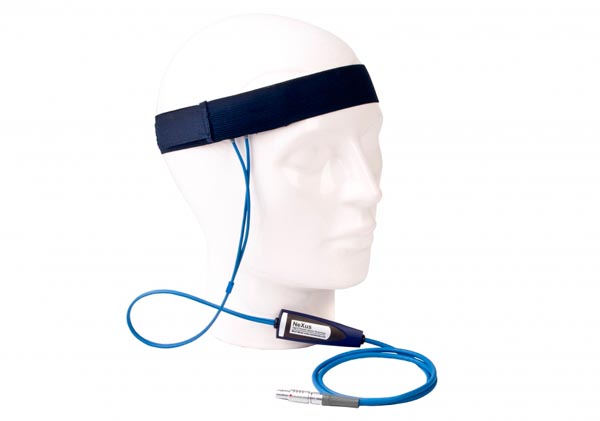
This diagram illustrates the standard configuration for acquiring peripheral skin temperature data, a common protocol in psychophysiology and biofeedback laboratories. The setup utilizes a high-sensitivity thermistor probe secured to the distal phalanx of the ring finger, with the velcro band positioned immediately below the nail bed to maximize contact with the dense capillary beds found in the fingertips. This specific placement allows for the precise detection of vasomotor activity controlled by the sympathetic nervous system. When a subject experiences stress, the "fight or flight" response triggers vasoconstriction, reducing blood flow to the extremities and lowering skin temperature; conversely, the relaxation response triggers vasodilation, increasing blood volume and warming the finger.
The digital interface visualizes this dynamic process through several distinct metrics. The Absolute Temperature readout provides the real-time thermal value, shown here as 93.0°F, while the Average Temperature offers a smoothed baseline to account for minor signal noise. Perhaps the most clinically significant metric for biofeedback training is the Derivative Temperature, which calculates the rate of change over time. A positive value, such as the +3.6°F/min displayed, indicates a rapid warming trend associated with successful relaxation. Finally, the Differential Temperature compares readings between two distinct sensor sites, allowing researchers to isolate specific physiological responses from general environmental factors.
The DC signal that leaves the operational amplifier is filtered above 1 Hz to prevent contamination by 50/60Hz and radio frequency (RF) interference. A low-pass filter selects signals below the 1-Hz cutoff frequency for processing by an integrator.
The filtered DC signal is not rectified since it is already DC. Rectification converts AC signals into DC signals to allow the measurement of signal strength. This voltage is then sent to an integrator for quantification like a rectified EMG signal.
Next, a level detector checks whether the integrated voltage matches a predetermined threshold value to control the feedback display. The training threshold can be adjusted automatically by software or manually by a clinician to shape patient performance progressively.
Feedback Thermometer Accuracy
A feedback thermometer should be accurate to within ± 1° F (0.56° C) when monitoring temperatures from 65 to 100° F (18-38° C). A feedback display should have a resolution (should display change) of at least 0.1° F (0.1° C) for clinical applications (Peek, 2016).
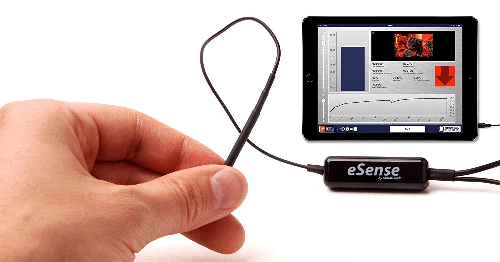
Smartphones can now function as feedback thermometers with specially designed hardware and apps like Mindfield's eSense Temperature.
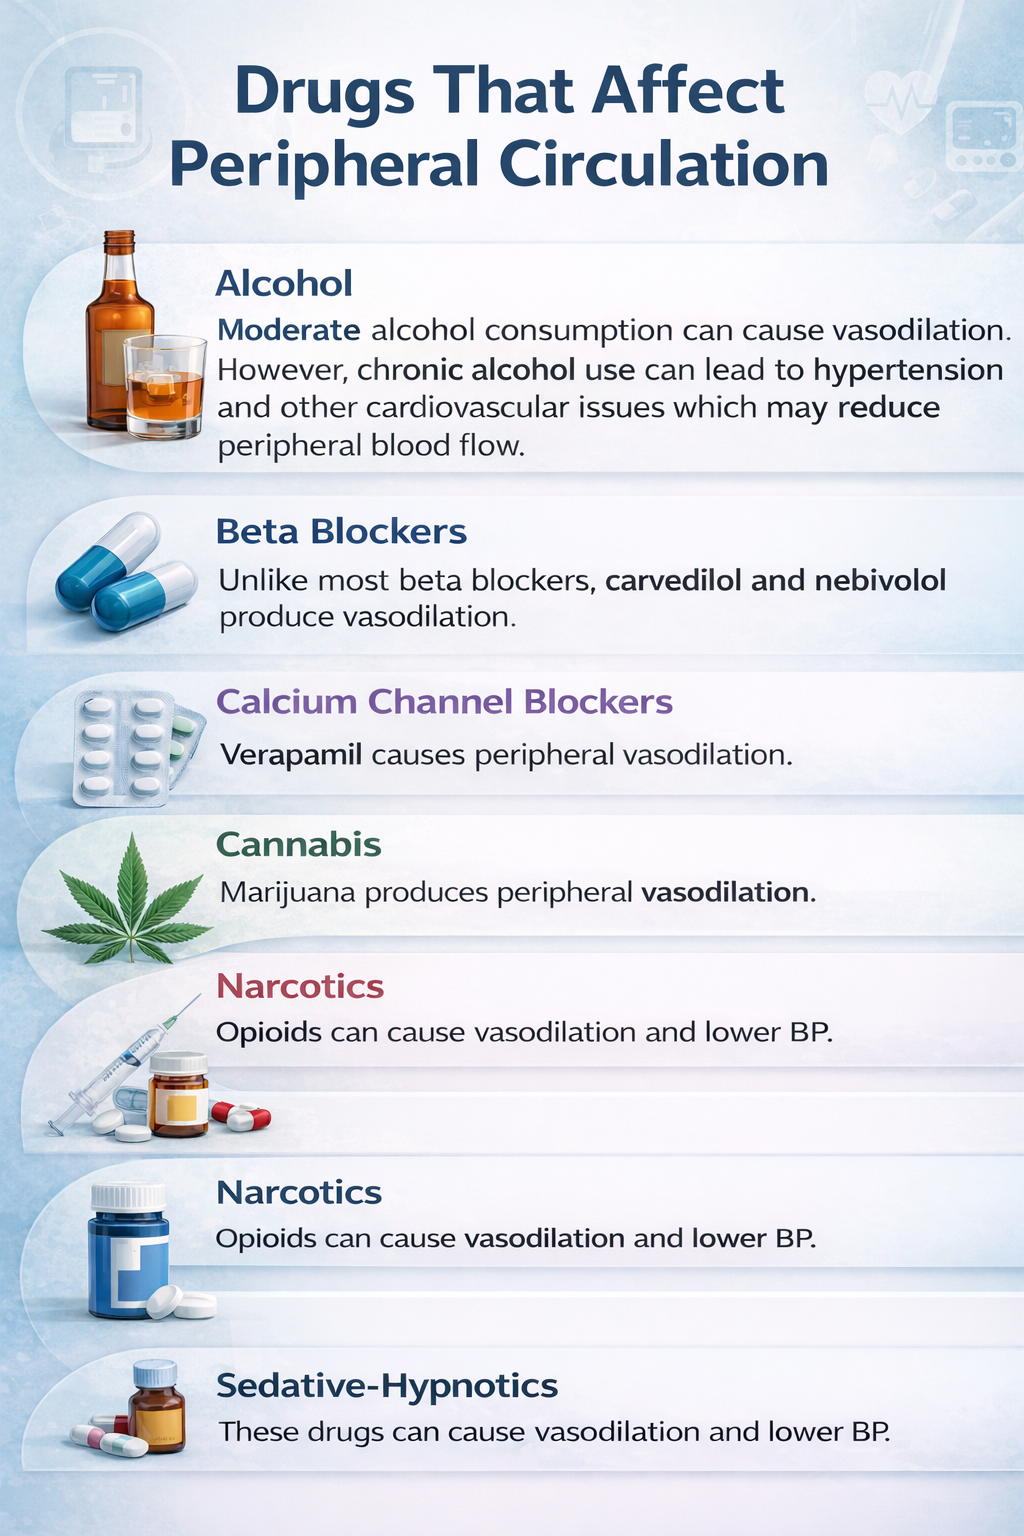
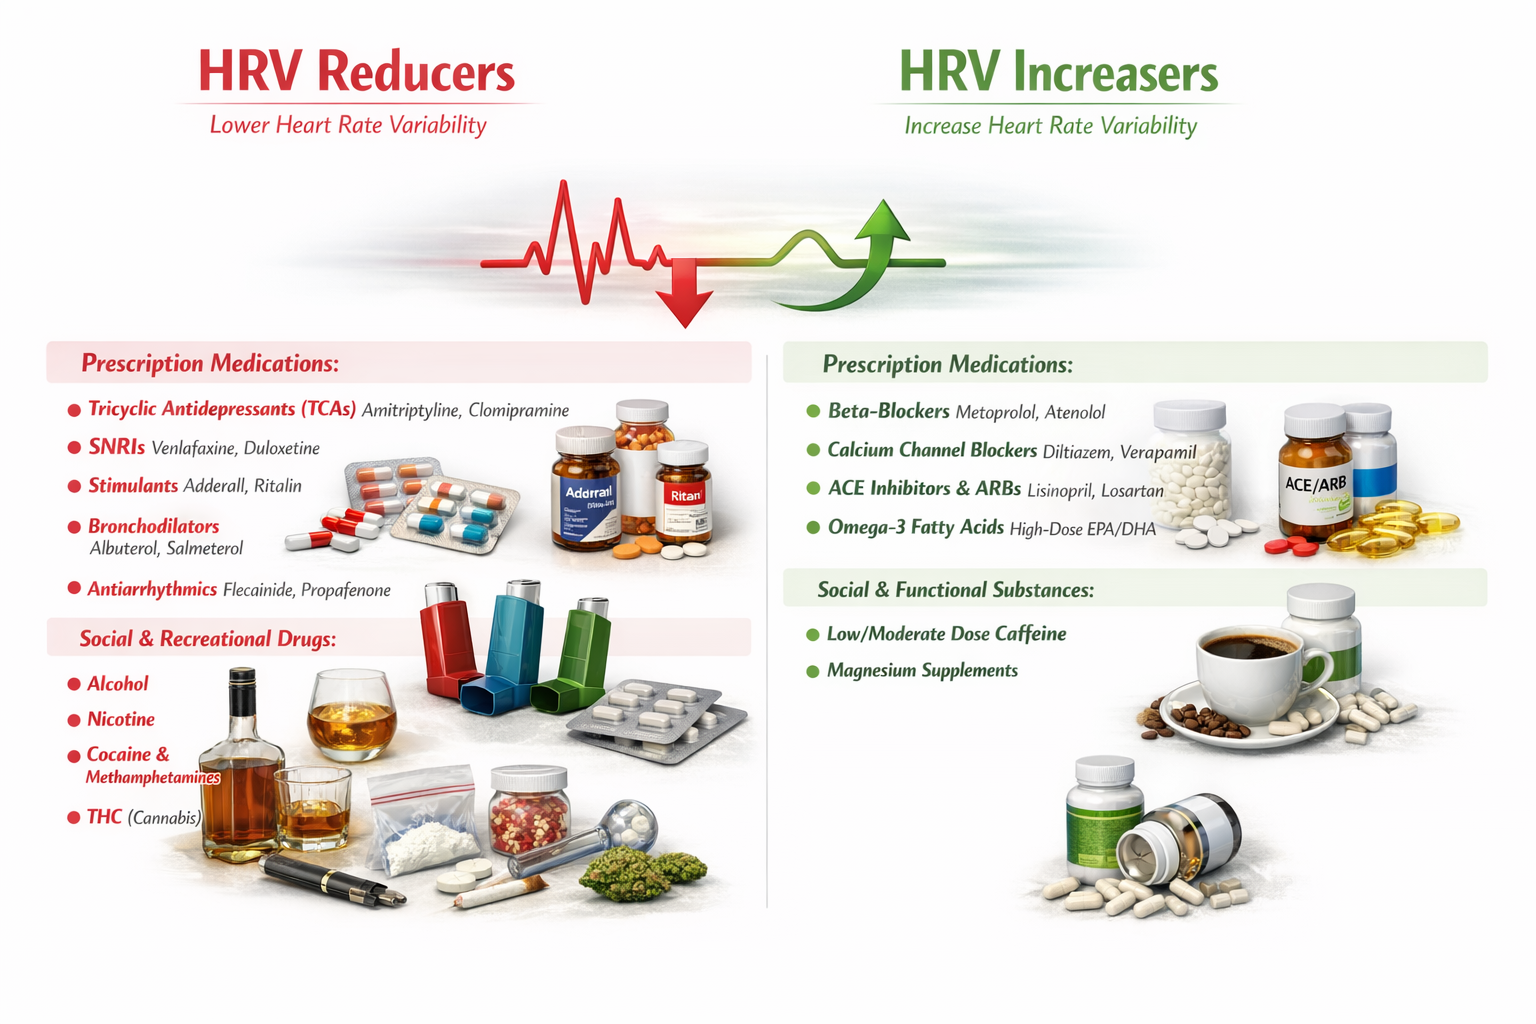
Drug Effects
The reviewed references describe effects on peripheral blood flow. Vasodilation may result in increased BVP and skin temperature. No studies directly measured skin temperature. As with all side effects, the change and its magnitude will vary across the population.
Temperature biofeedback uses thermistors to detect slow tonic changes in peripheral blood flow. Proper thermistor attachment involves securing the bead and first few inches of cable to the skin while avoiding circumferential wrapping that could impede blood flow. Thermal lag means there is always a delay between actual temperature change and display update. Normal finger temperatures exceed 88°F, with training targets of 95°F in a 74°F room. The blanketing effect from multiple tape layers and stem effect from unsecured cable can both distort readings. Feedback thermometers use operational amplifiers to process thermistor signals and low-pass filters to remove interference.
Comprehension Questions: Temperature Biofeedback
- What is a thermistor's time constant, and why does a 1-second or faster time constant matter for clinical applications?
- Why should you avoid wrapping tape around the circumference of a finger when attaching a thermistor?
- What is the recommended temperature stability criterion for research baselines, and why are clinical baselines often shorter?
- How do the stem effect and blanketing effect differ in their impact on temperature readings?
- What role do operational amplifiers play in a feedback thermometer, and what types of temperature calculations can they perform?
Infrared Thermometers
Peper and Olesen (1985) recommended that clinicians use a portable infrared thermometer to rapidly scan multiple sites on the same person or different individuals, monitor and provide temperature feedback from sites that a thermistor should not touch, and monitor temperature covertly.
An infrared thermometer may require approximately 0.5 seconds to measure the temperature of a single site on the hand. This speed permits a clinician to sequentially scan 10 different locations on the same patient in 5 seconds. Using a thermistor with a 1-second time constant, a clinician can only measure the temperature of a single site in the same 5 seconds.
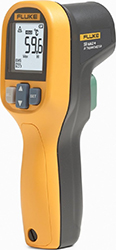
When a clinician is more concerned about the relative temperatures of multiple sites than their absolute values, an infrared thermometer's accuracy of ±1 to 2°C (1.79 to 3.58°F) favorably compares with the ±1°C (1.79°F) accuracy of clinical-grade thermistors. A Fluke infrared thermometer is shown below.
Photoplethysmograph
Blood Volume Pulse (BVP)
Blood volume is the amount of blood contained in an area. This measure mainly reflects venous tone.
🎧 Mini-Lecture: Blood Volume Pulse (BVP)
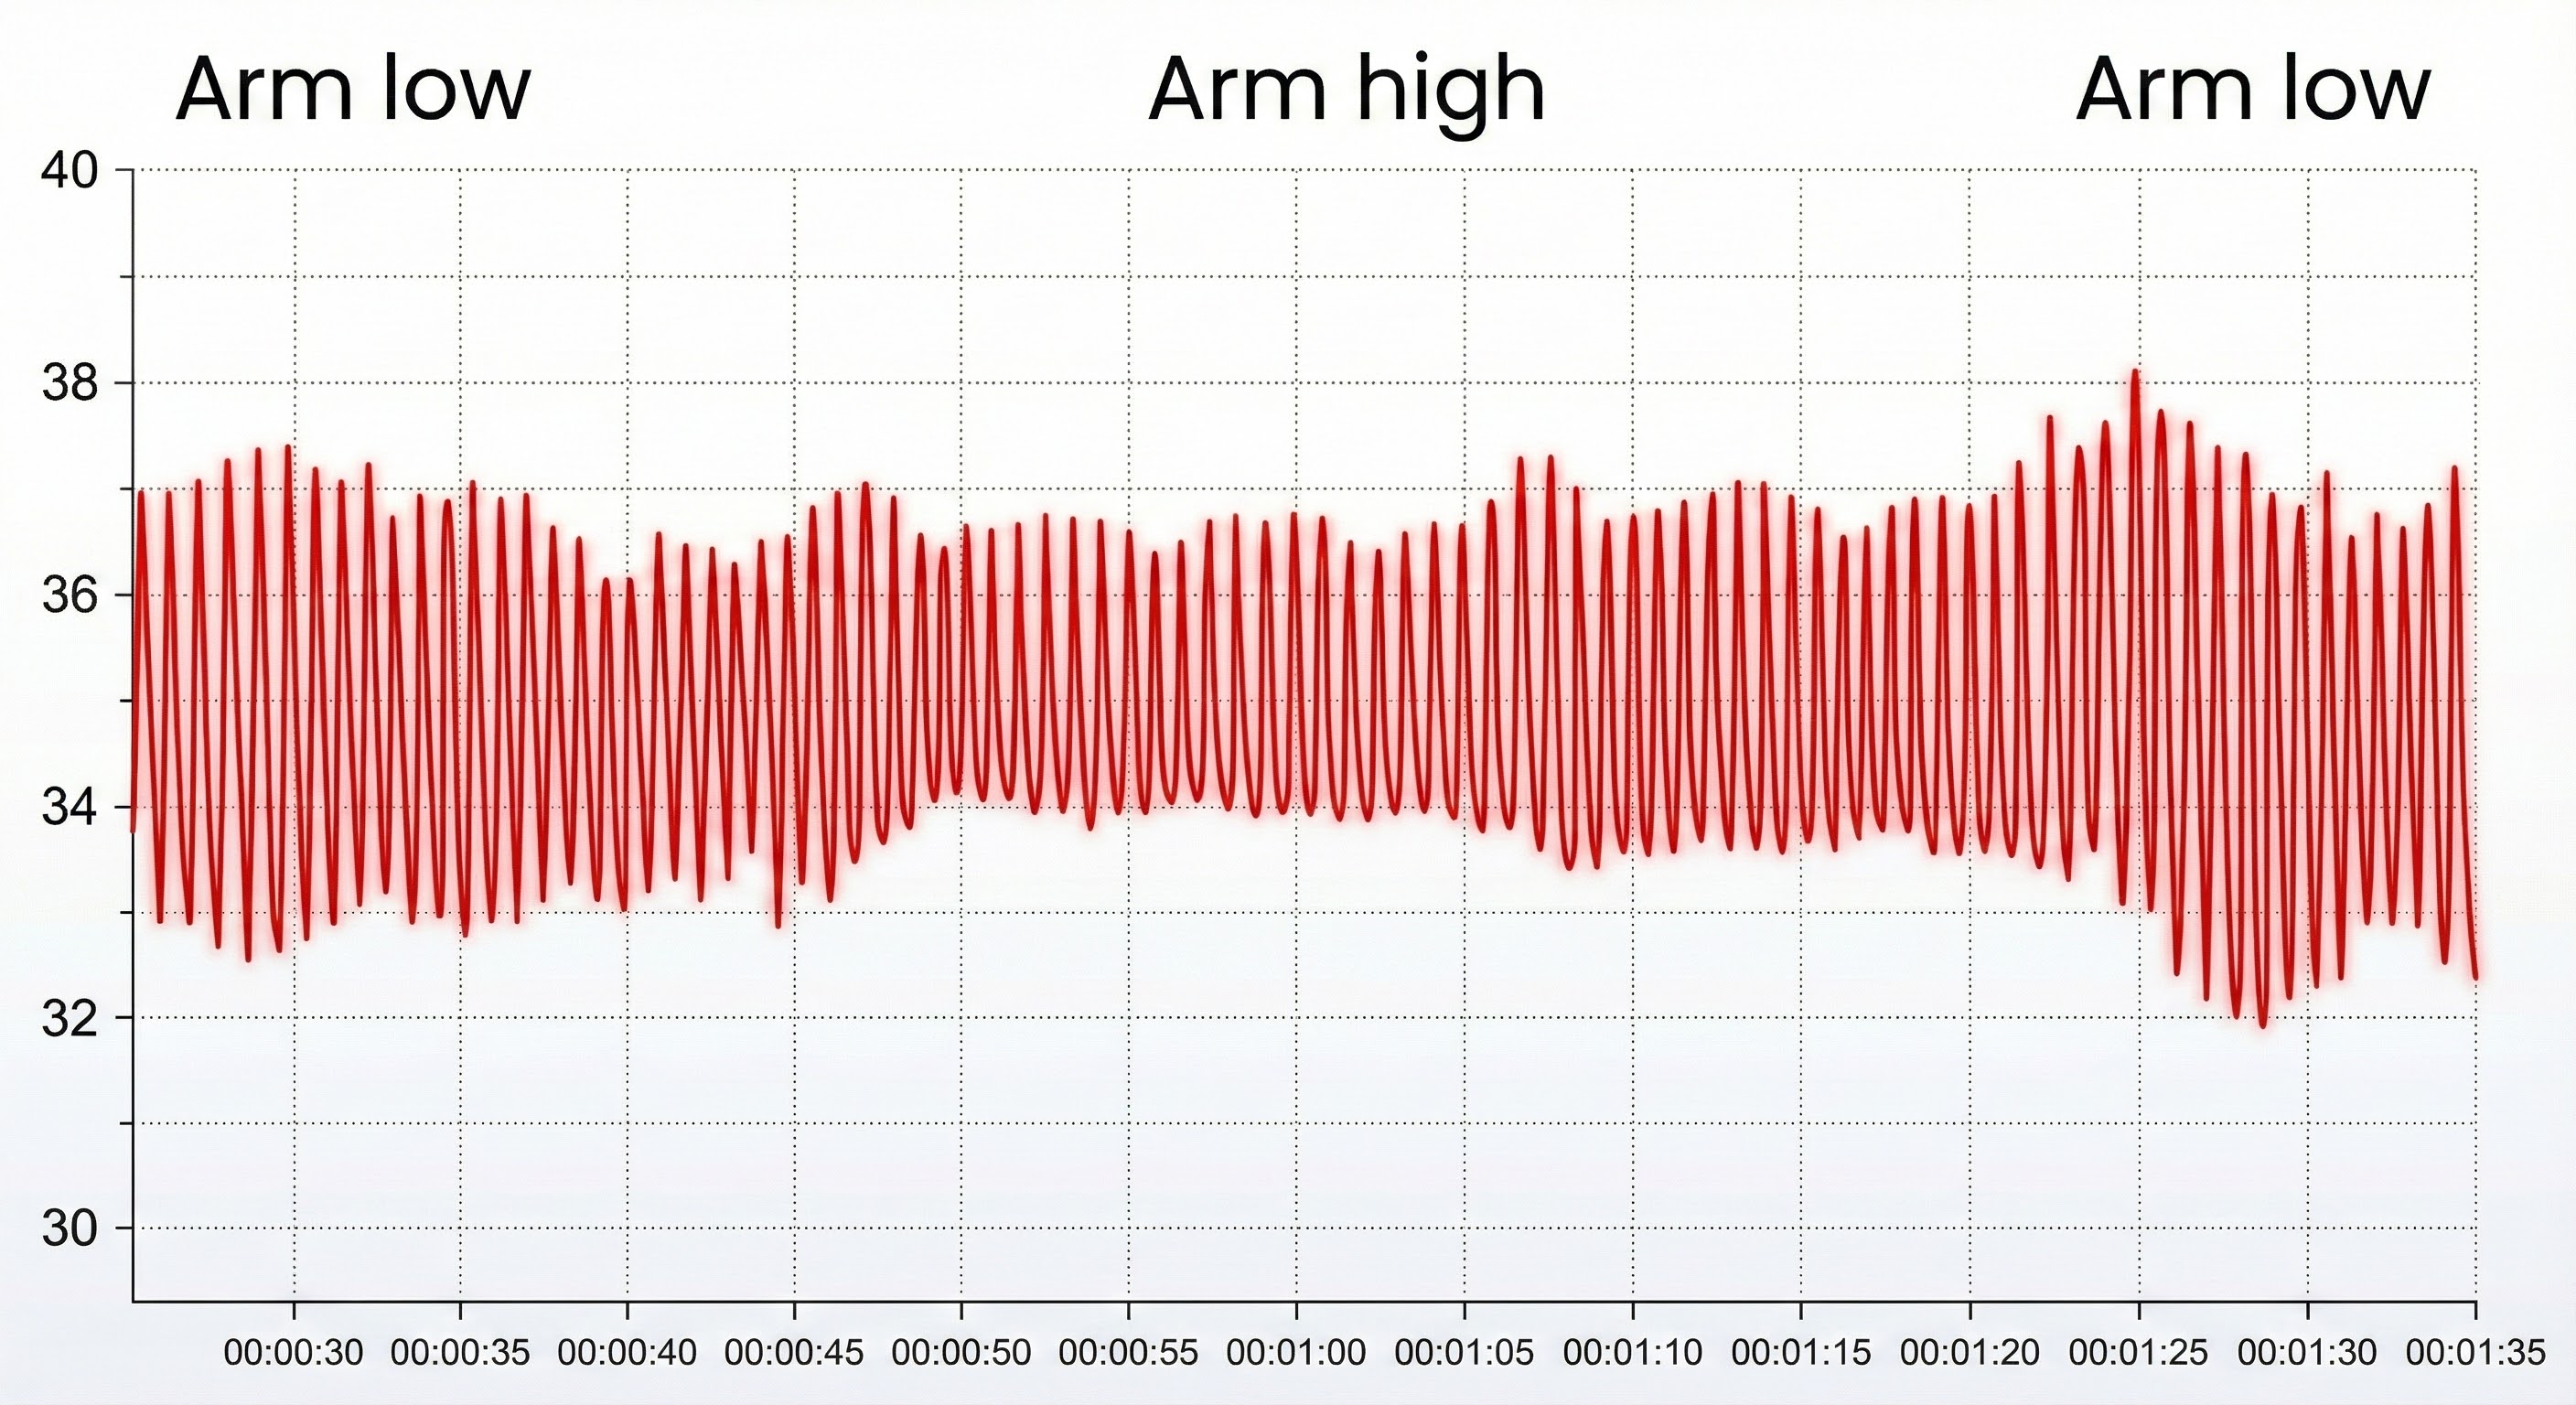
Blood volume pulse (BVP) indexes rapid changes in blood flow. It is calculated as the vertical distance between the minimum value of one pulse wave and the maximum value of the next. This measure mainly reflects blood flow and arteriolar tone (Peper, Shaffer, & Lin, 2010). Below is a BioGraph ® Infiniti BVP display.
PPG Sensor
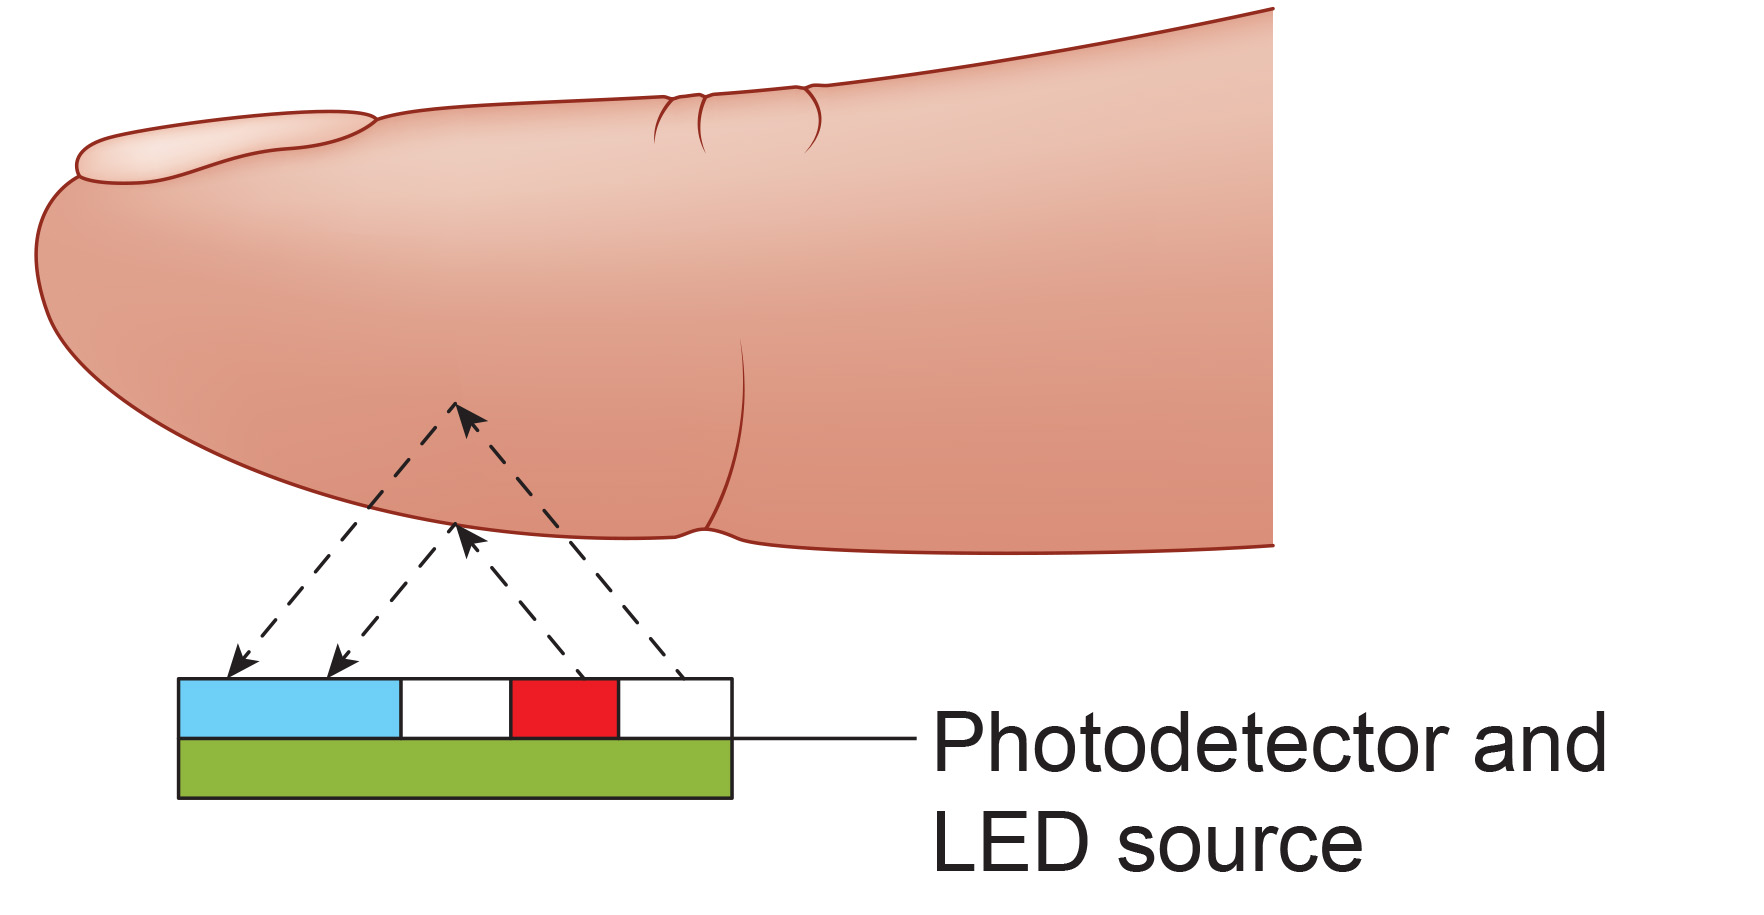
Blood volume pulse is detected using a photoplethysmograph (PPG). This device measures the relative amount of blood flow through tissue using a photoelectric transducer.
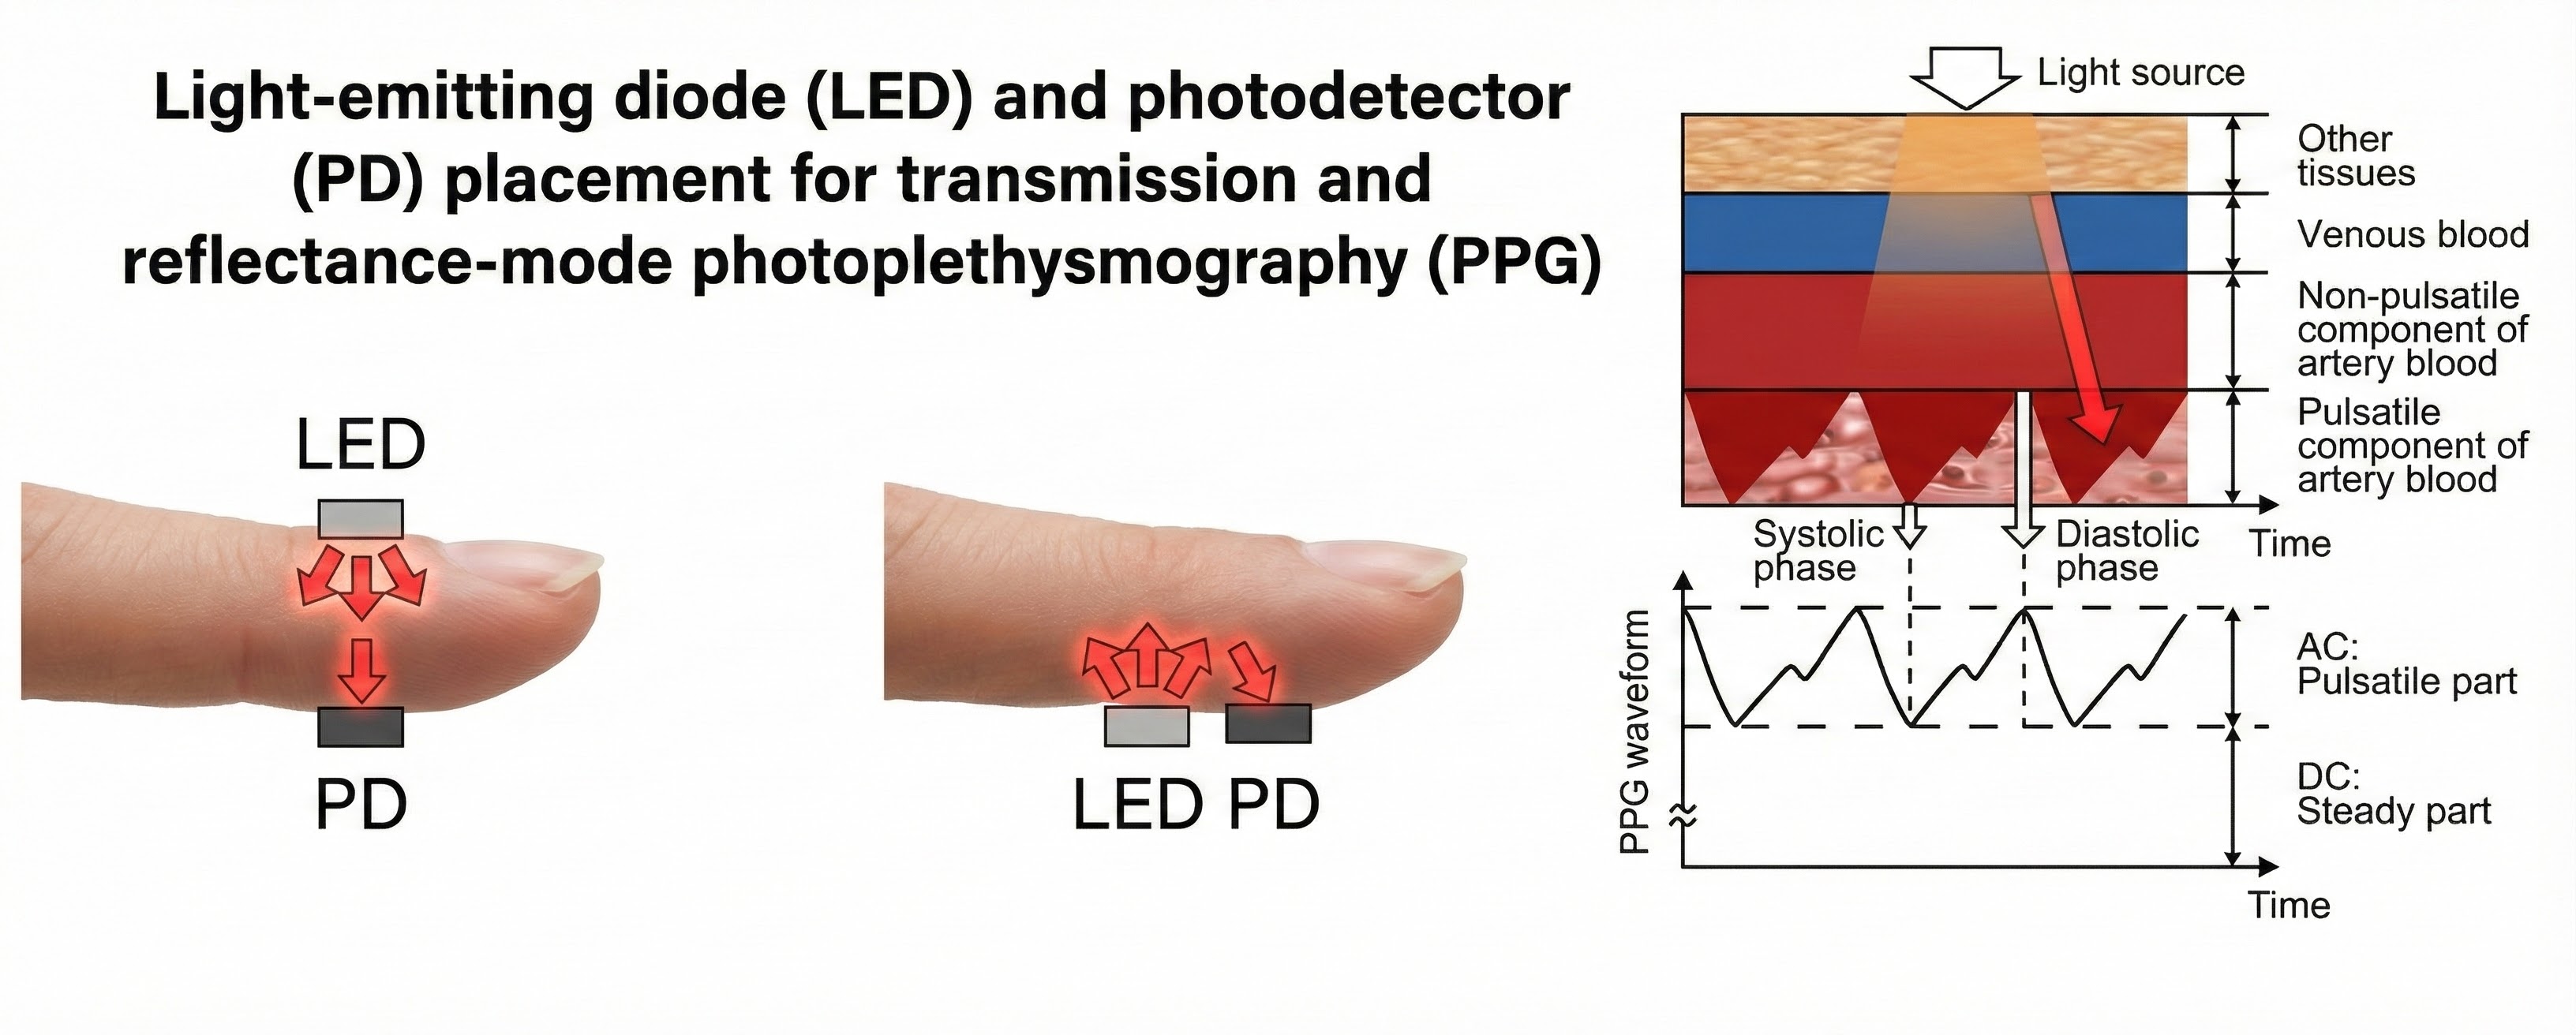
An infrared (7000-9000o A) light source is transmitted through or reflected off the tissue. The transmission technique places the light source and photodetector on the opposite sides of a digit.
The reflection technique places both light source and photodetector on the same side of the tissue. In both methods, the intensity of the light reaching the sensor varies with momentary shifts in blood volume (Shaffer & Combatalade, 2013).
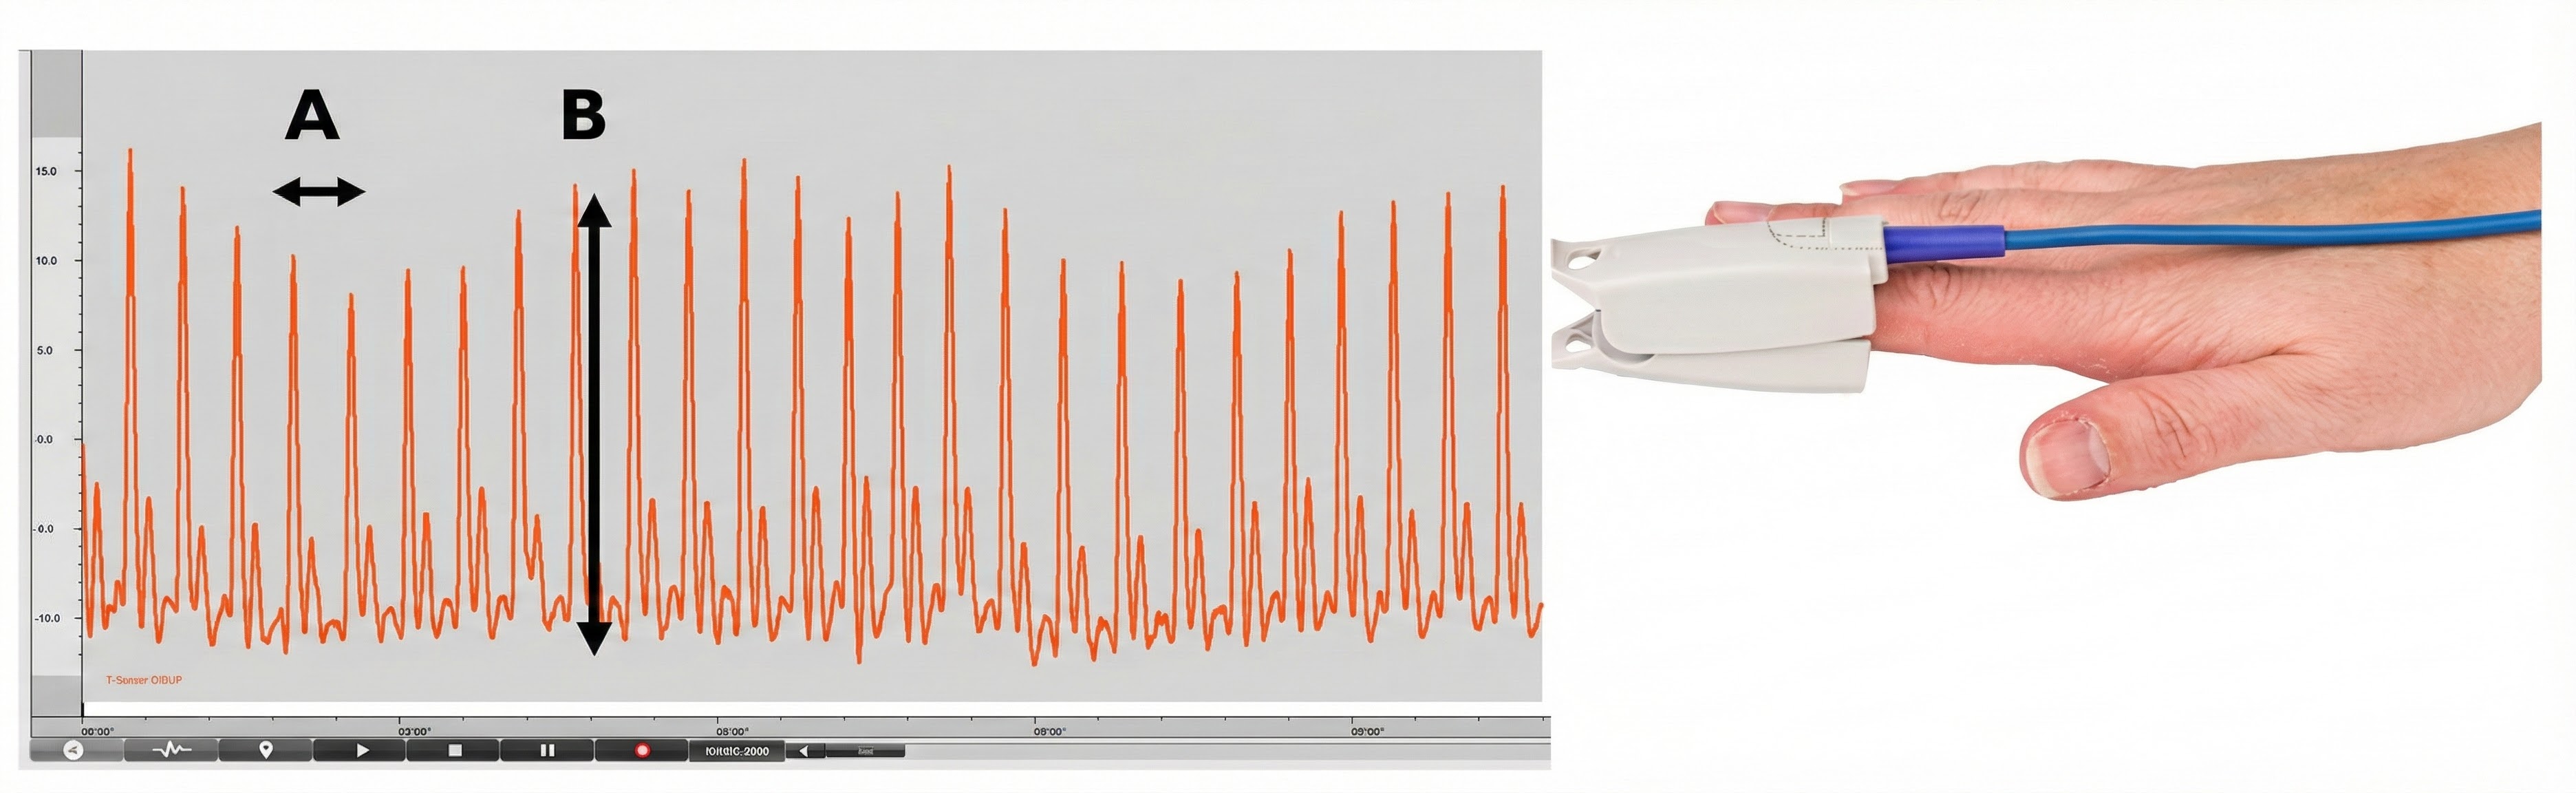
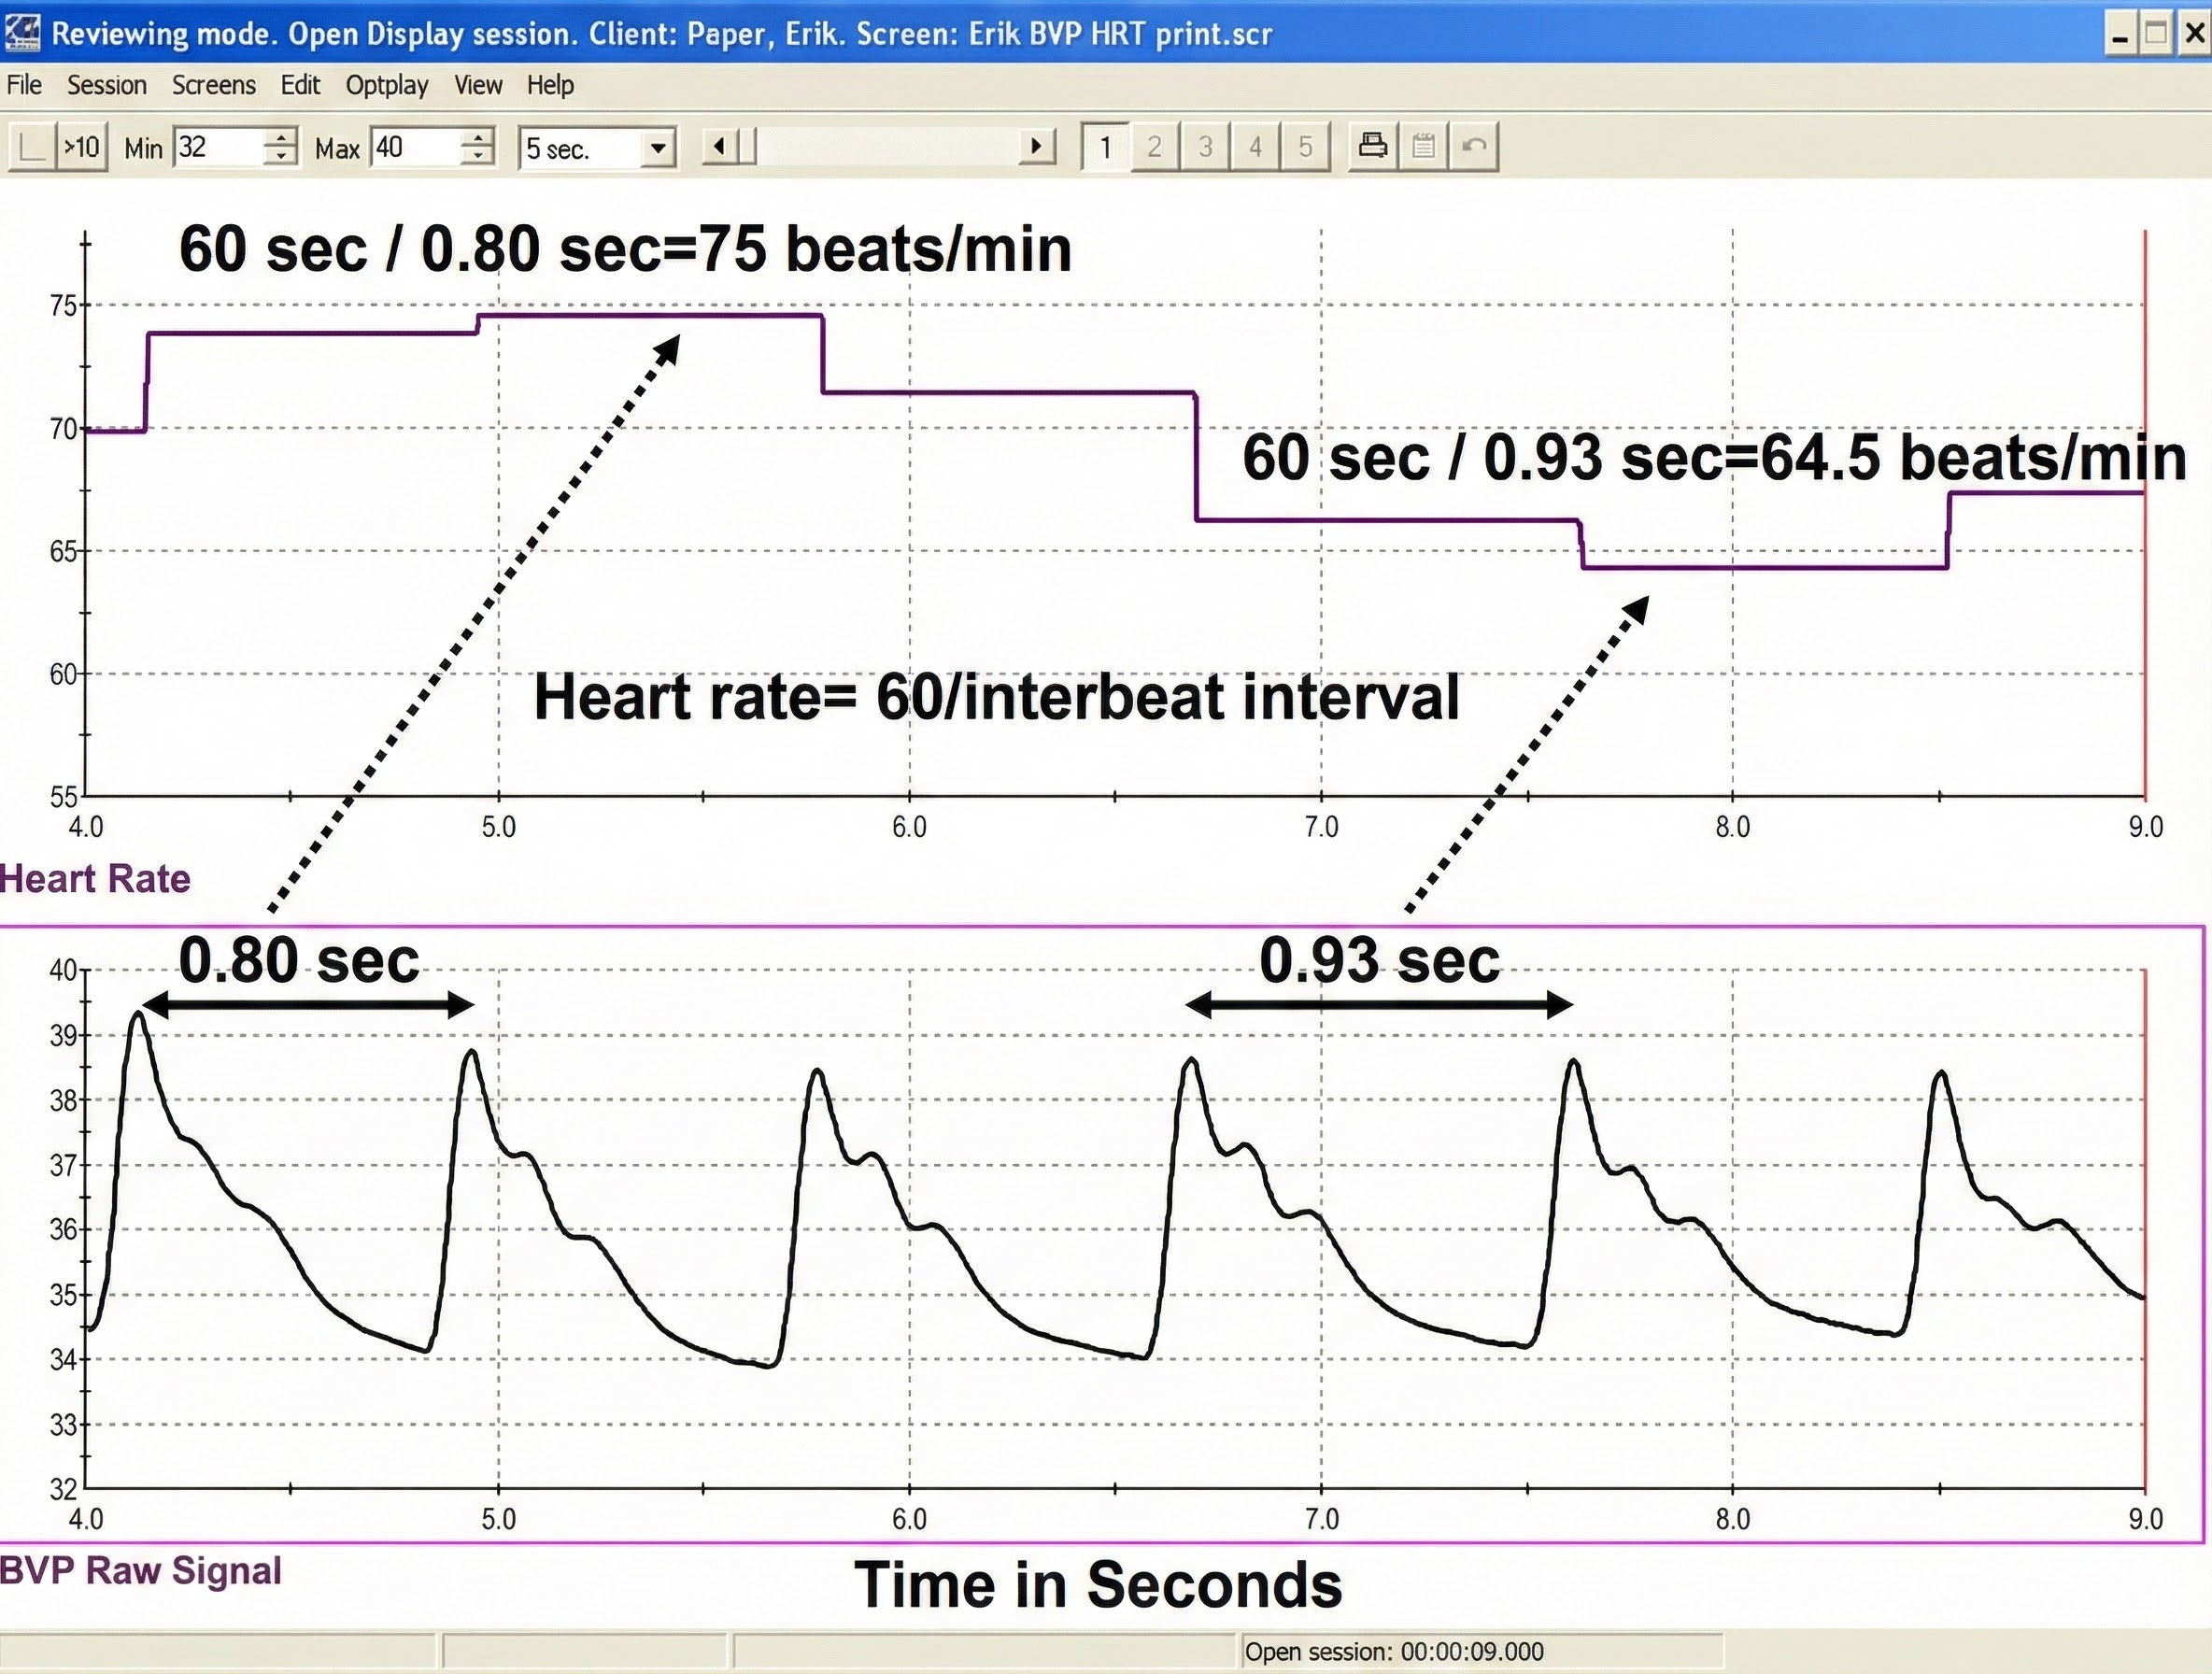
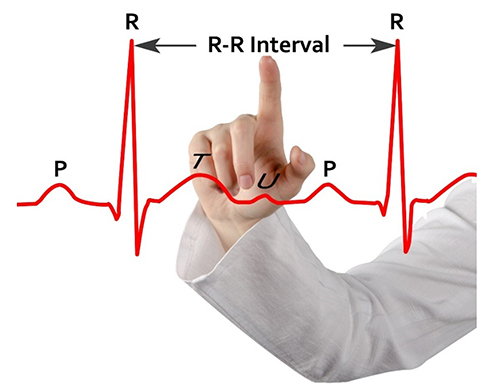
The interval between successive peaks (A) is called the interbeat interval (IBI). The peak-to-trough difference (B) shows the relative blood flow (Matto, 2018).
A photodetector detects and converts light into a positive DC signal in both transmission and reflectance modes.
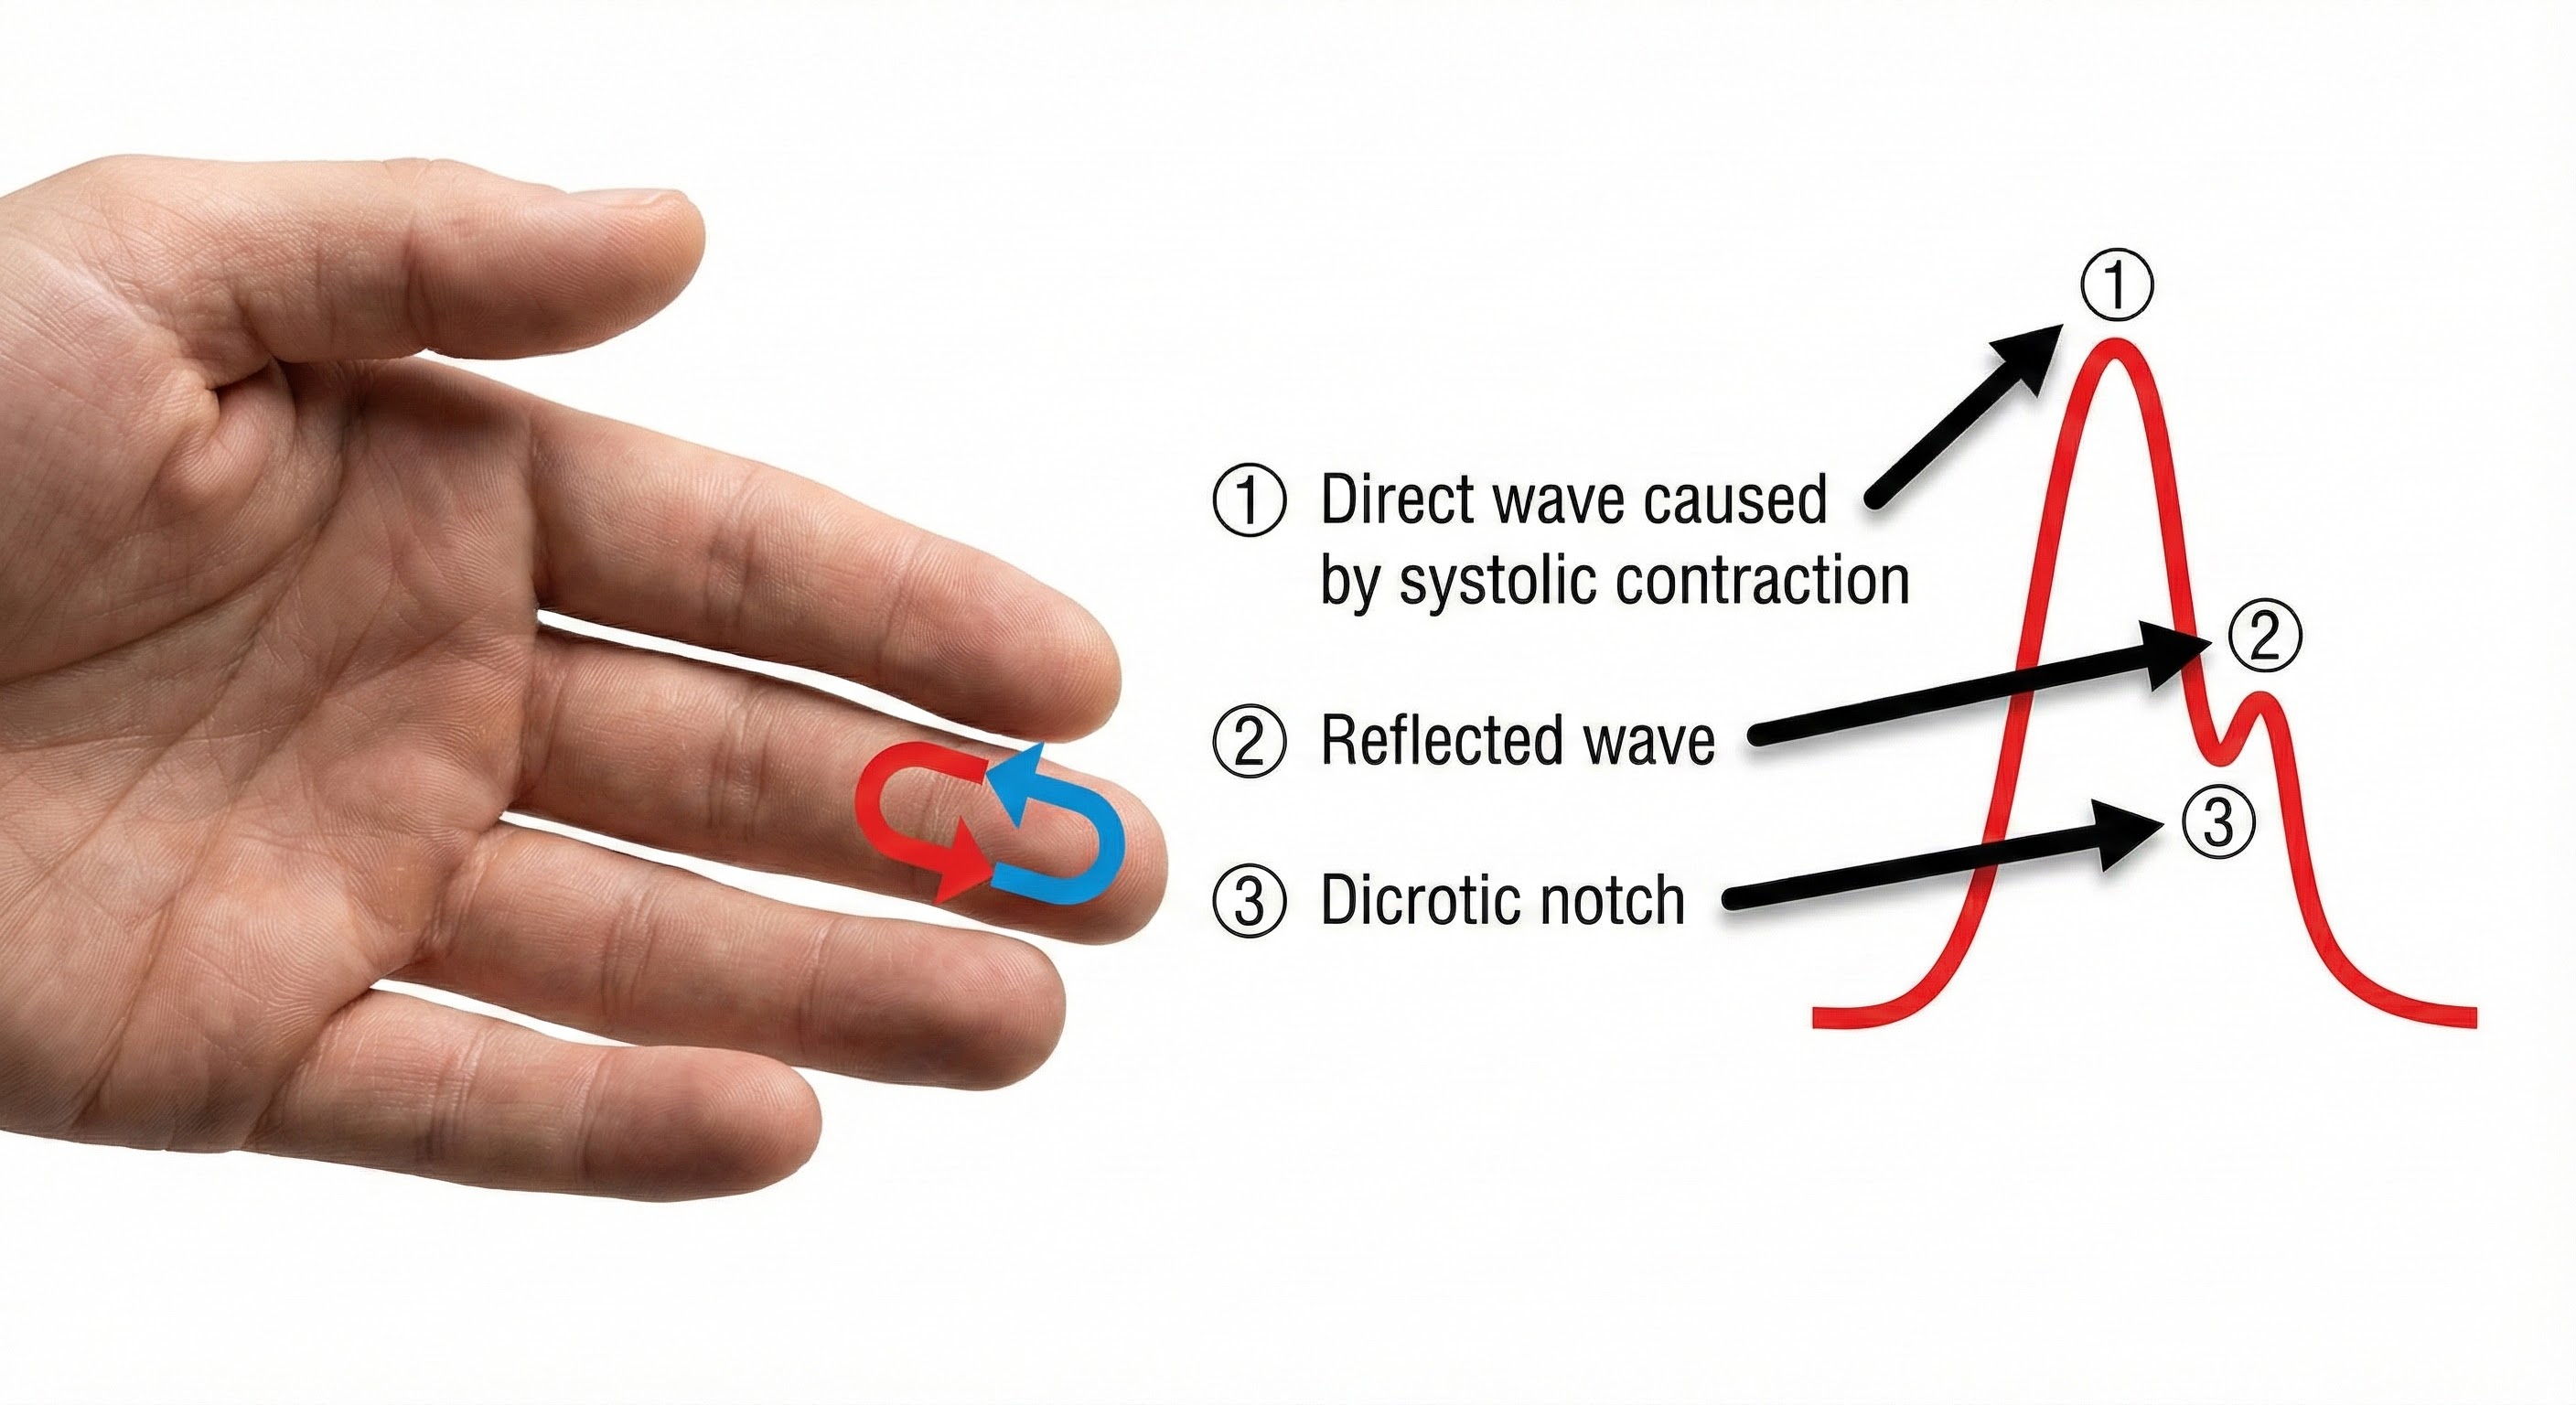
Blood appears red because it reflects red wavelengths. More light is reflected, and the BVP signal increases when the volume of blood increases. (1) As blood surges, more light is reflected, and the BVP signal peaks as the volume of blood increases. (2) As the pulse wave travels through the vascular tree, it is reflected by the lower body and appears as a second smaller peak. (3) The dicrotic notch is the gap between the direct and reflected waves.
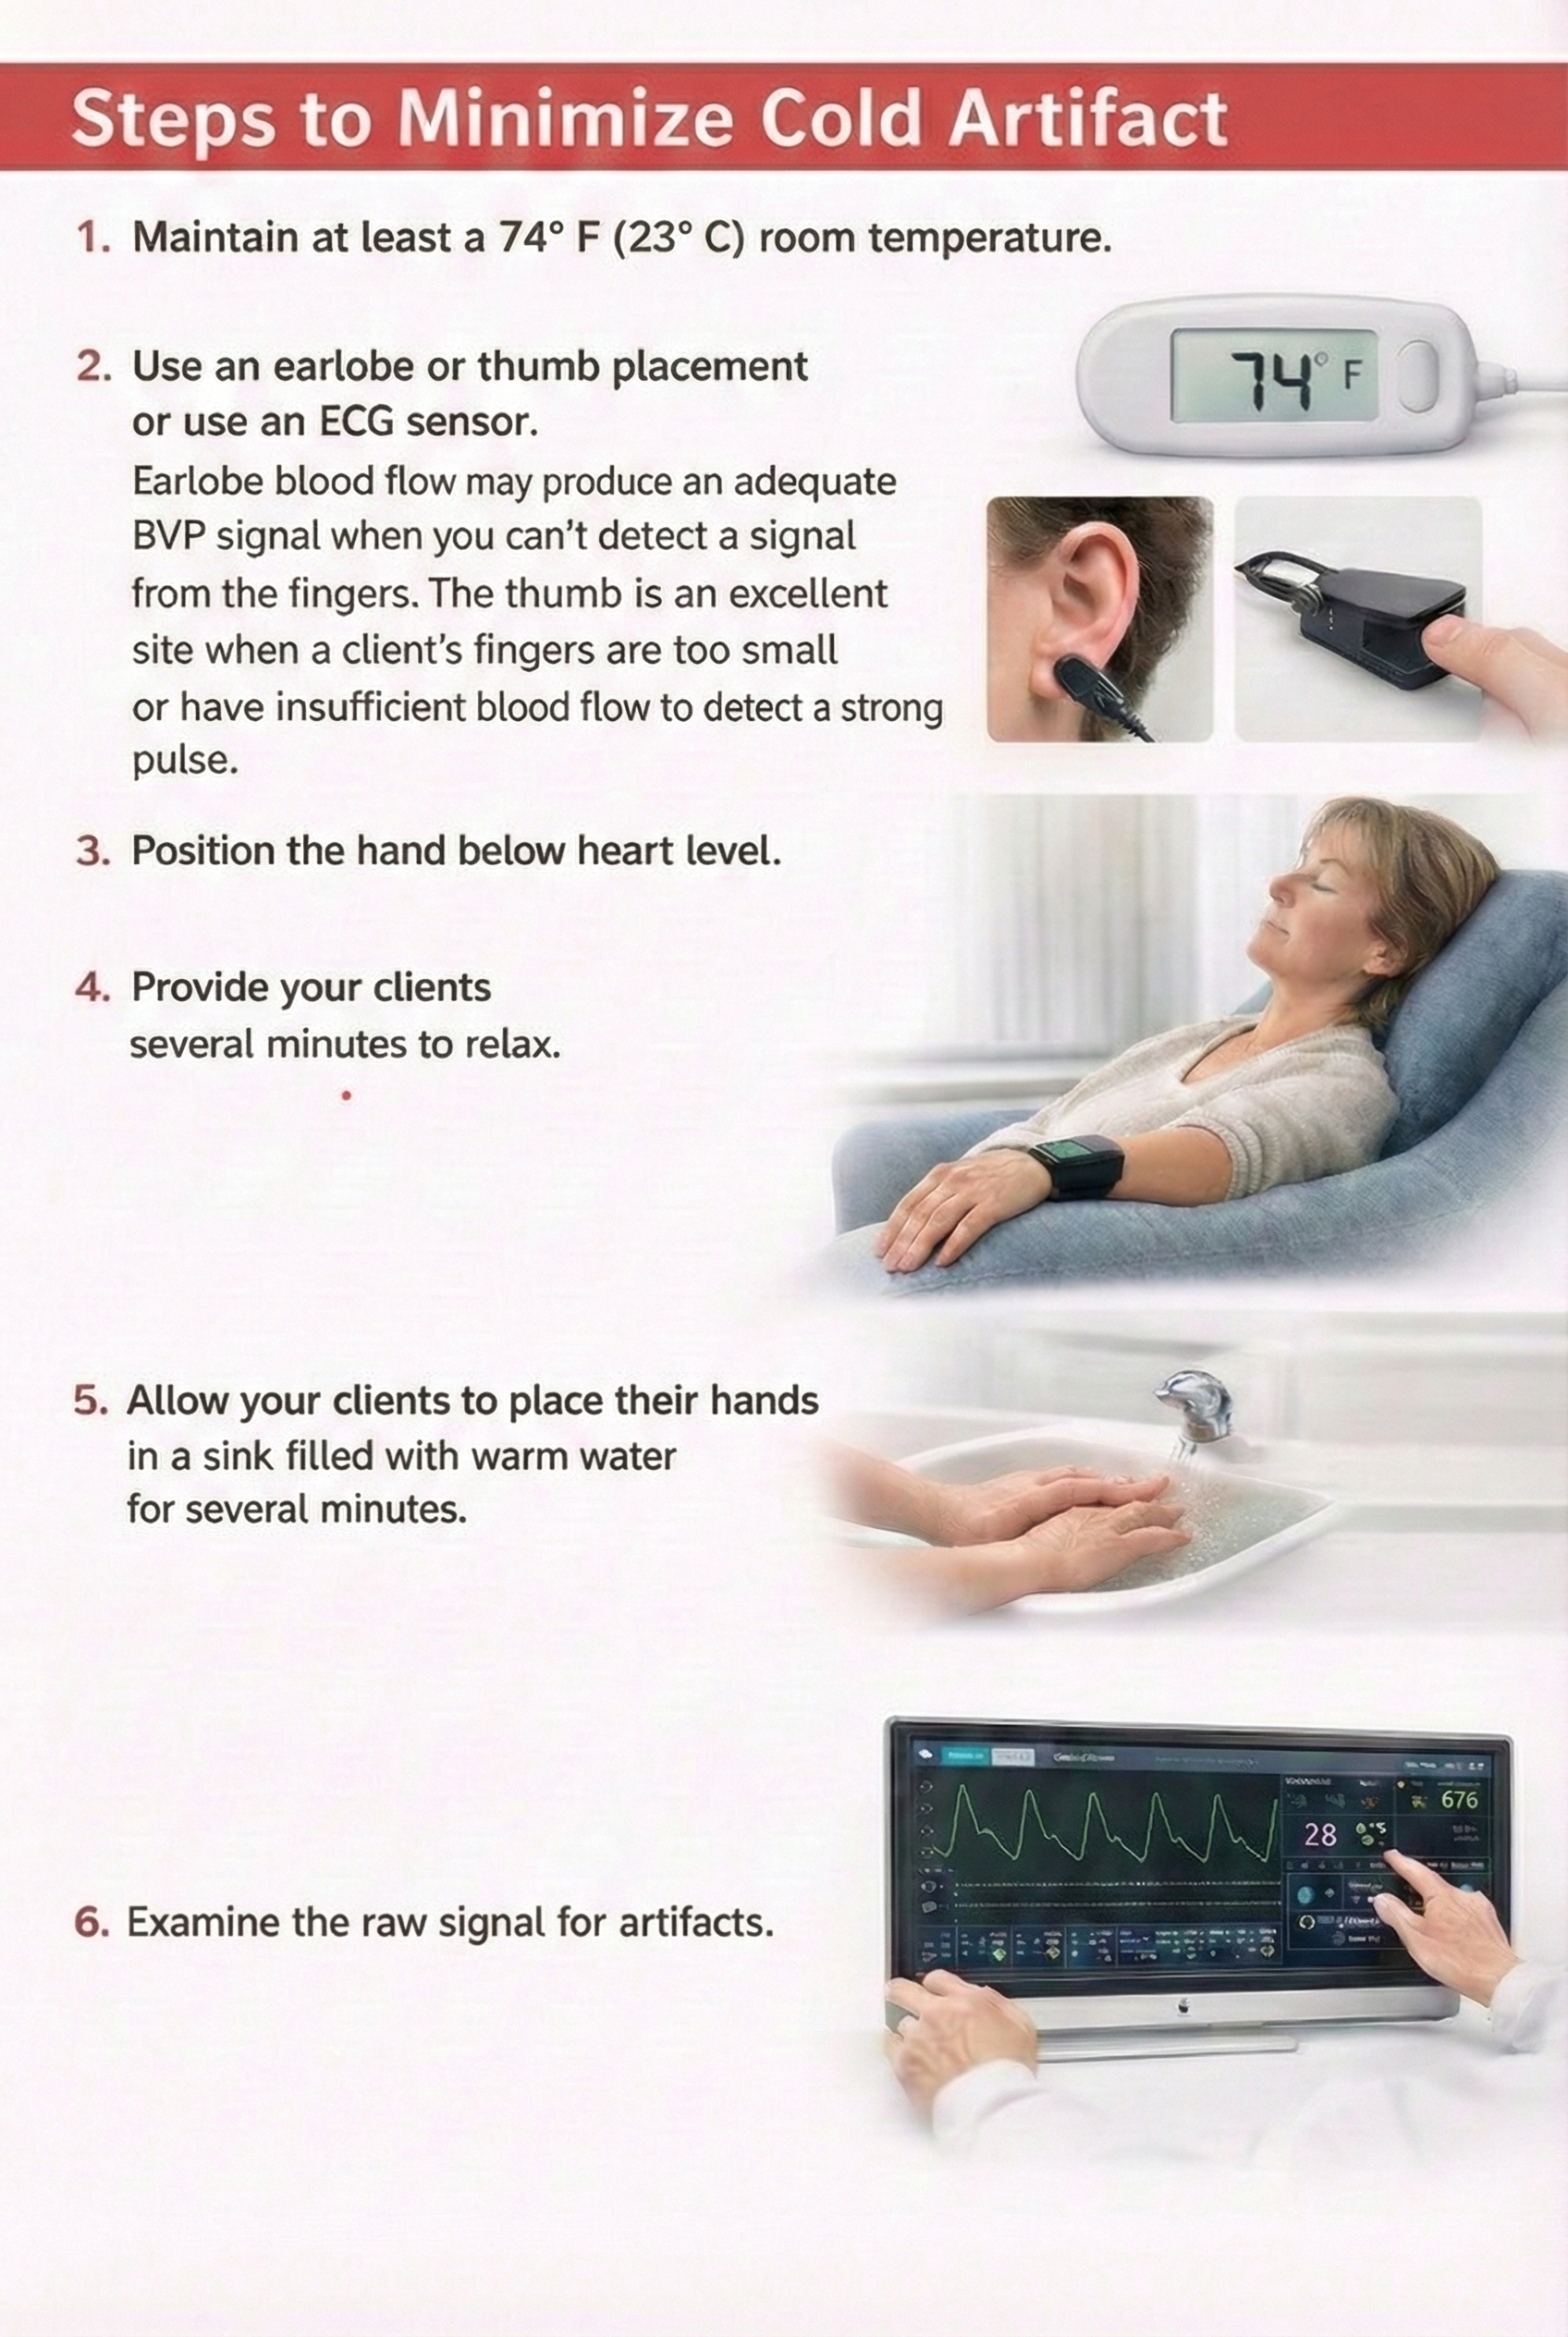
The ear is less prone to artifact than the finger due to less movement, stronger signal, and less risk of vasoconstriction due to temperature. Since the ear is closer to the heart than is the finger, there is less opportunity for the vascular tone rhythm to contaminate HRV frequency-domain measurements in the VLF, LF, and HF ranges (Lehrer, 2018b).
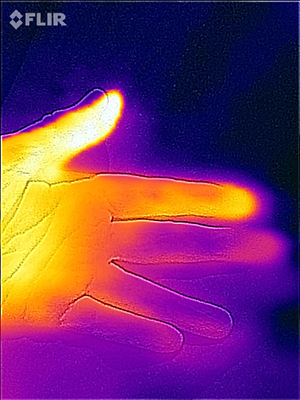
The thumb is an excellent site when a client's fingers are too small or have insufficient blood flow to detect a strong pulse (Peper, Shaffer, & Lin, 2010). In the Flir infrared image below, the thumb is brighter than adjacent digits because of its greater perfusion with blood.
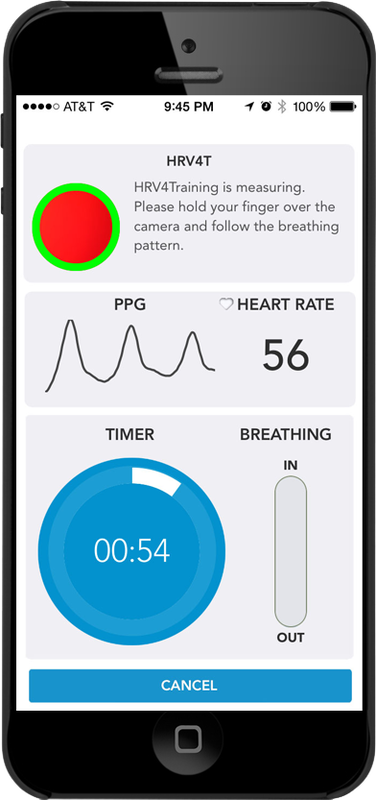
Smartphone cameras can now detect instantaneous heart rate by placing a finger over the camera (e.g., HRV4T).
When inspecting the raw blood volume pulse signal, a strong signal is a wave with a "sharp upswing and a longer downswing" (Garber, 1986). The peak should be slightly rounded. Measurement units are arbitrary and proportional to the sensor's voltage output. The sensor's DC output is boosted by an operational amplifier. The DC signal is then routed to an integrator for quantification.
Each heartbeat briefly increases blood volume in the arteries and capillary beds. The blood volume pulse signal can be used to calculate HR (beats per minute) by measuring the interbeat interval (the period between successive heartbeats). Divide the time interval between peaks by 60 seconds to calculate HR (Peper, Harvey, Lin, Tylova, & Moss, 2007).
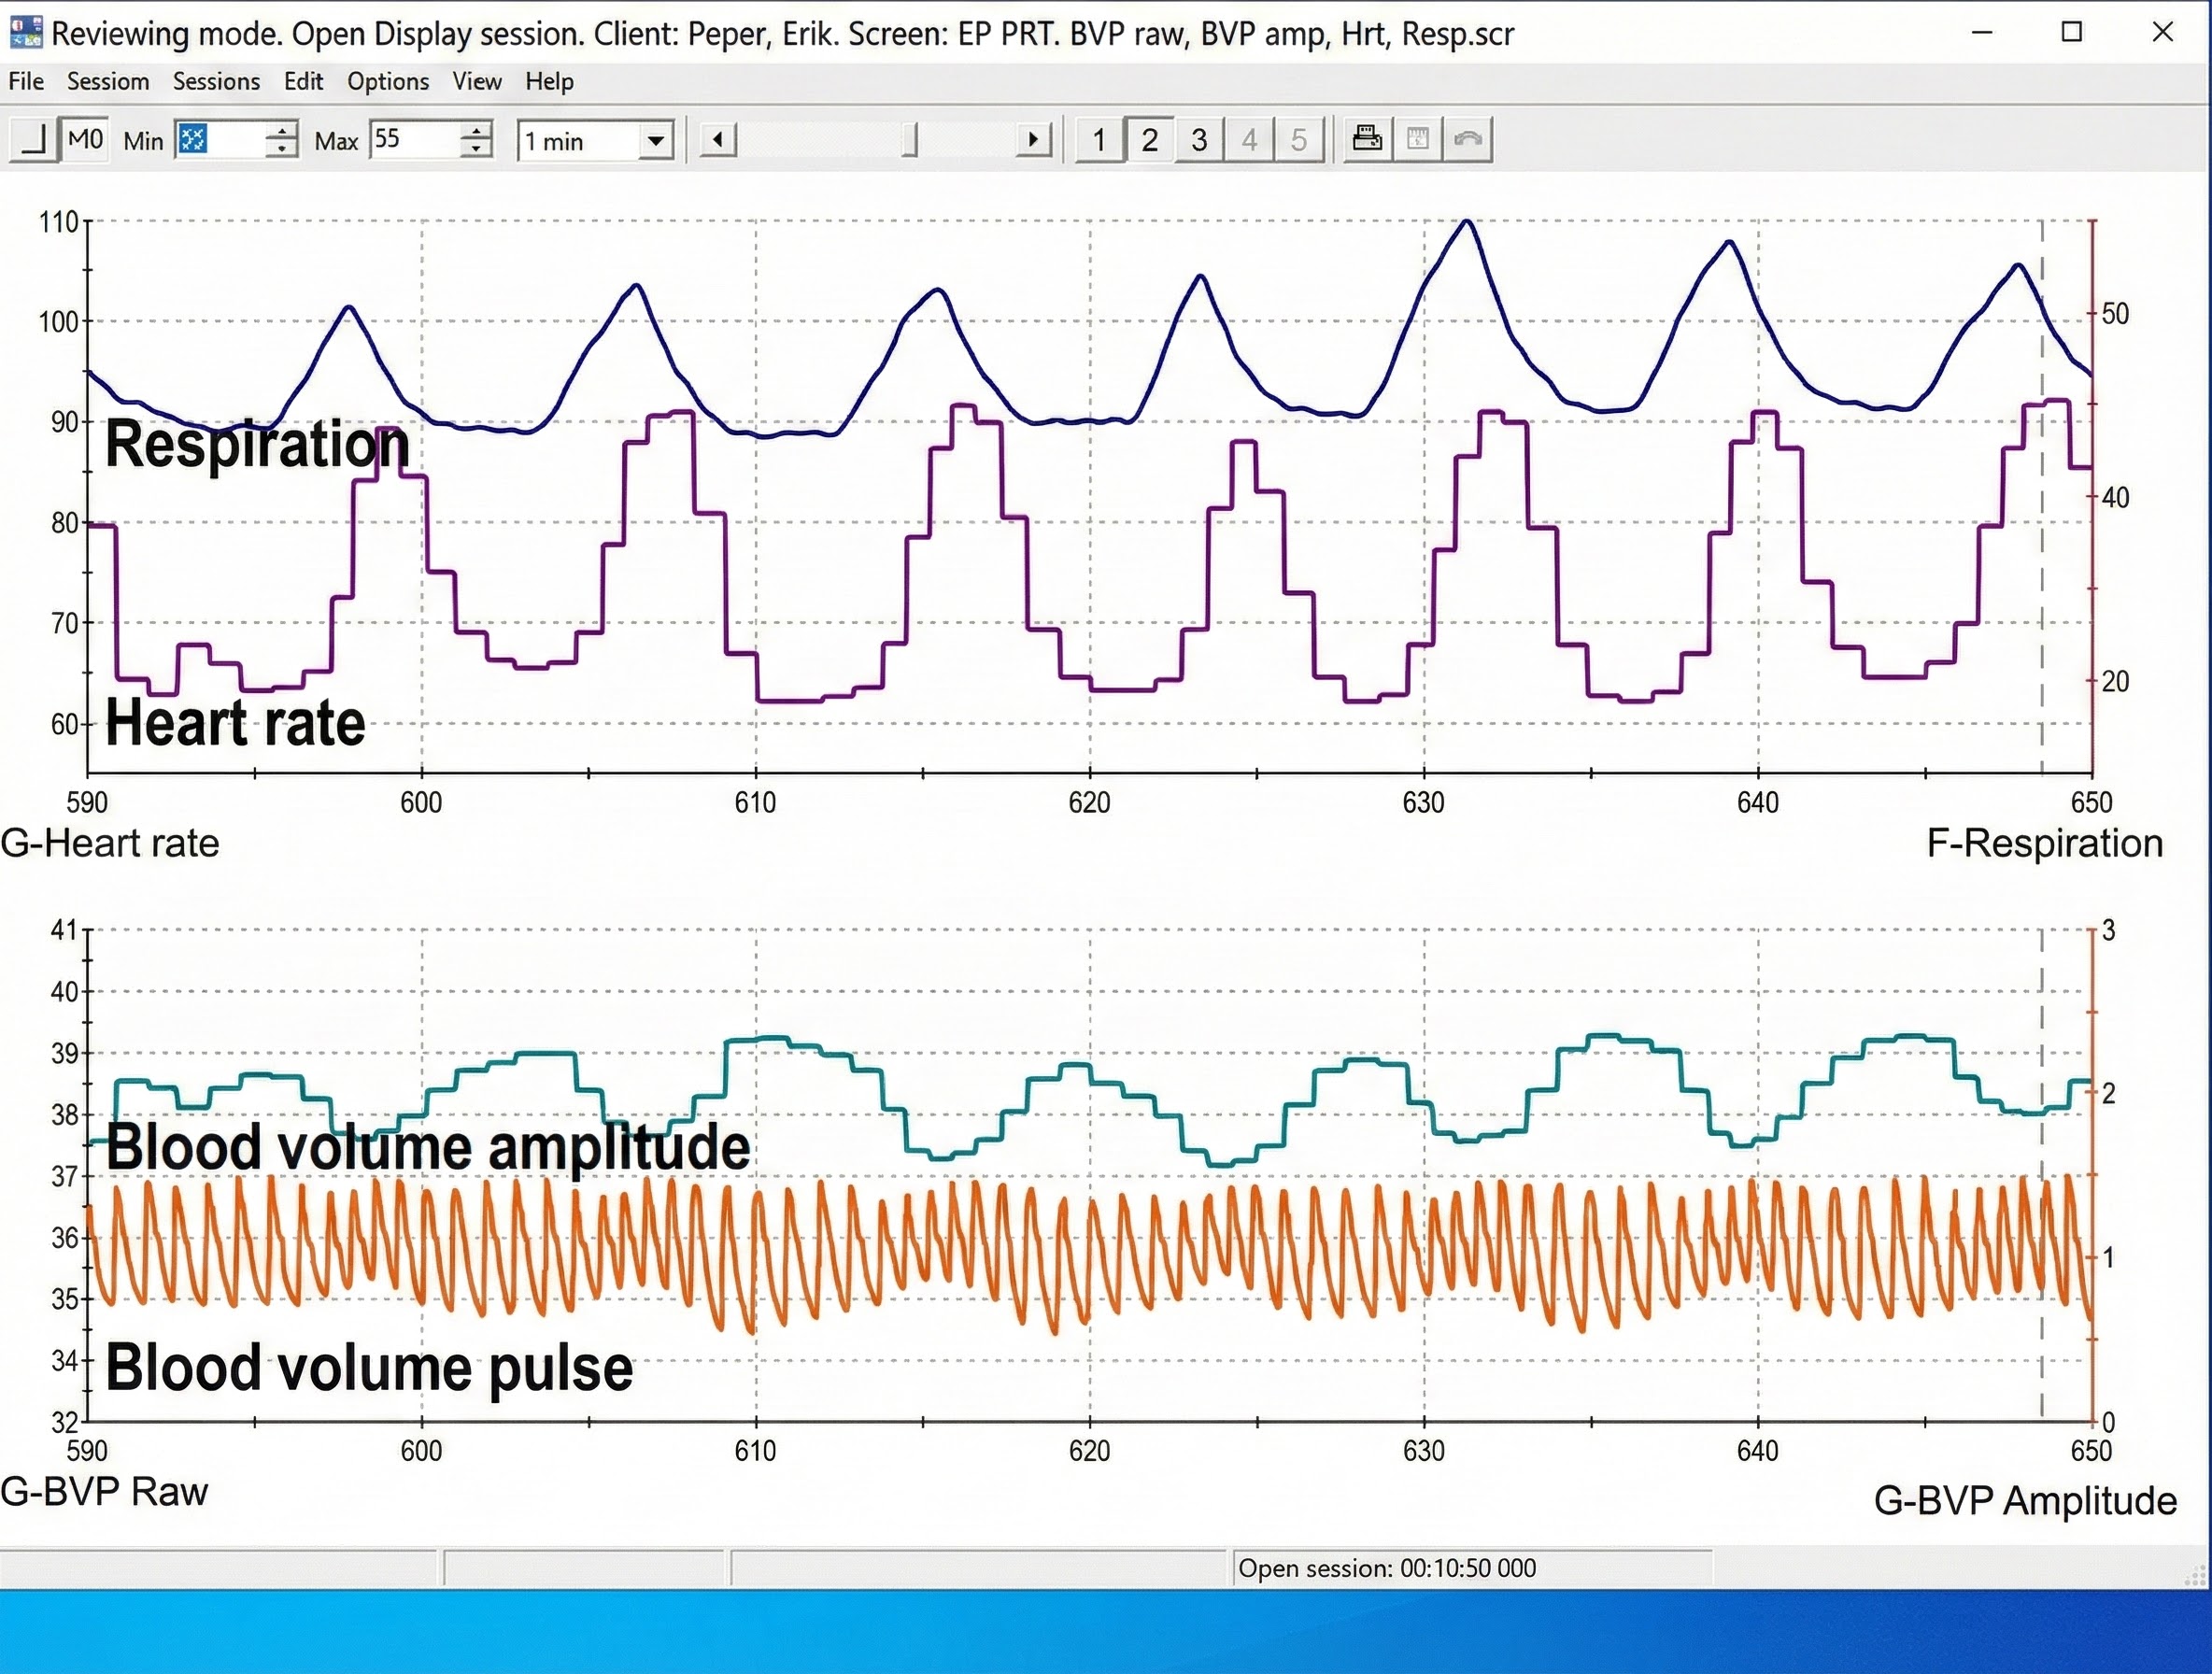
Clinicians may simultaneously monitor blood volume pulse, blood volume amplitude (relative volume of blood), HR, and respiration during training to increase HRV, as shown in the display below from Peper, Harvey, Lin, Tylova, and Moss (2007).
Limitations to Photoplethysmography
There are two main limitations to blood volume pulse. First, this blood flow index only describes blood volume under the sensor. The blood volume in another area can be vastly different than in another.
Second, blood volume pulse measurements are relative. Absolute values cannot be compared across different individuals as with hand temperature. However, values can be compared across a training session, and relative measures can be compared across individuals (Peper, Shaffer, & Lin, 2010).
The BVP and ECG methods may yield different HRV values with marked sympathetic activation. ECG values will be more accurate since they are not affected by vasoconstriction.
Advantages to Photoplethysmography
A photoplethysmograph can provide high-resolution feedback when temperature feedback shows minimal change. A PPG sensor is more sensitive to rapid blood volume changes. Blood volume pulse could quickly drop 50-60% in a patient who is a vascular responder (fingers cool when challenged by stressors). When a client plateaus (ceases to warm), a clinician could switch to blood volume pulse biofeedback to increase hand-warming if the monitored hand is not significantly vasoconstricted.
Skin Preparation
Unlike the ECG recording, minimal skin preparation is required since the PPG sensor detects infrared light instead of an electrical potential.
🎧 Mini-Lecture: BVP Skin Preparation
Ask your clients to wash their hands so that dirt won’t occlude the sensor’s transducer window (Shaffer & Combatalade, 2013).

For PPG sensors that pass infrared light through the finger, instruct clients to avoid dark fingernail polish, which will block light transmission.

Sensor Attachment
Photoplethysmograph (PPG) sensor attachment is critical since readings are sensitive to limb position, 50/60Hz artifact, ambient light, movement, and pressure. For finger placements, attach the PPG sensor using a Velcro ® band or Coban™ tape to the palmar side of a larger finger (or thumb) and confine the sensor to only one finger segment. Use the thumb when the fingers are small, or blood flow is compromised, such as when clients have cold hands (Peper, Shaffer, & Lin, 2010).
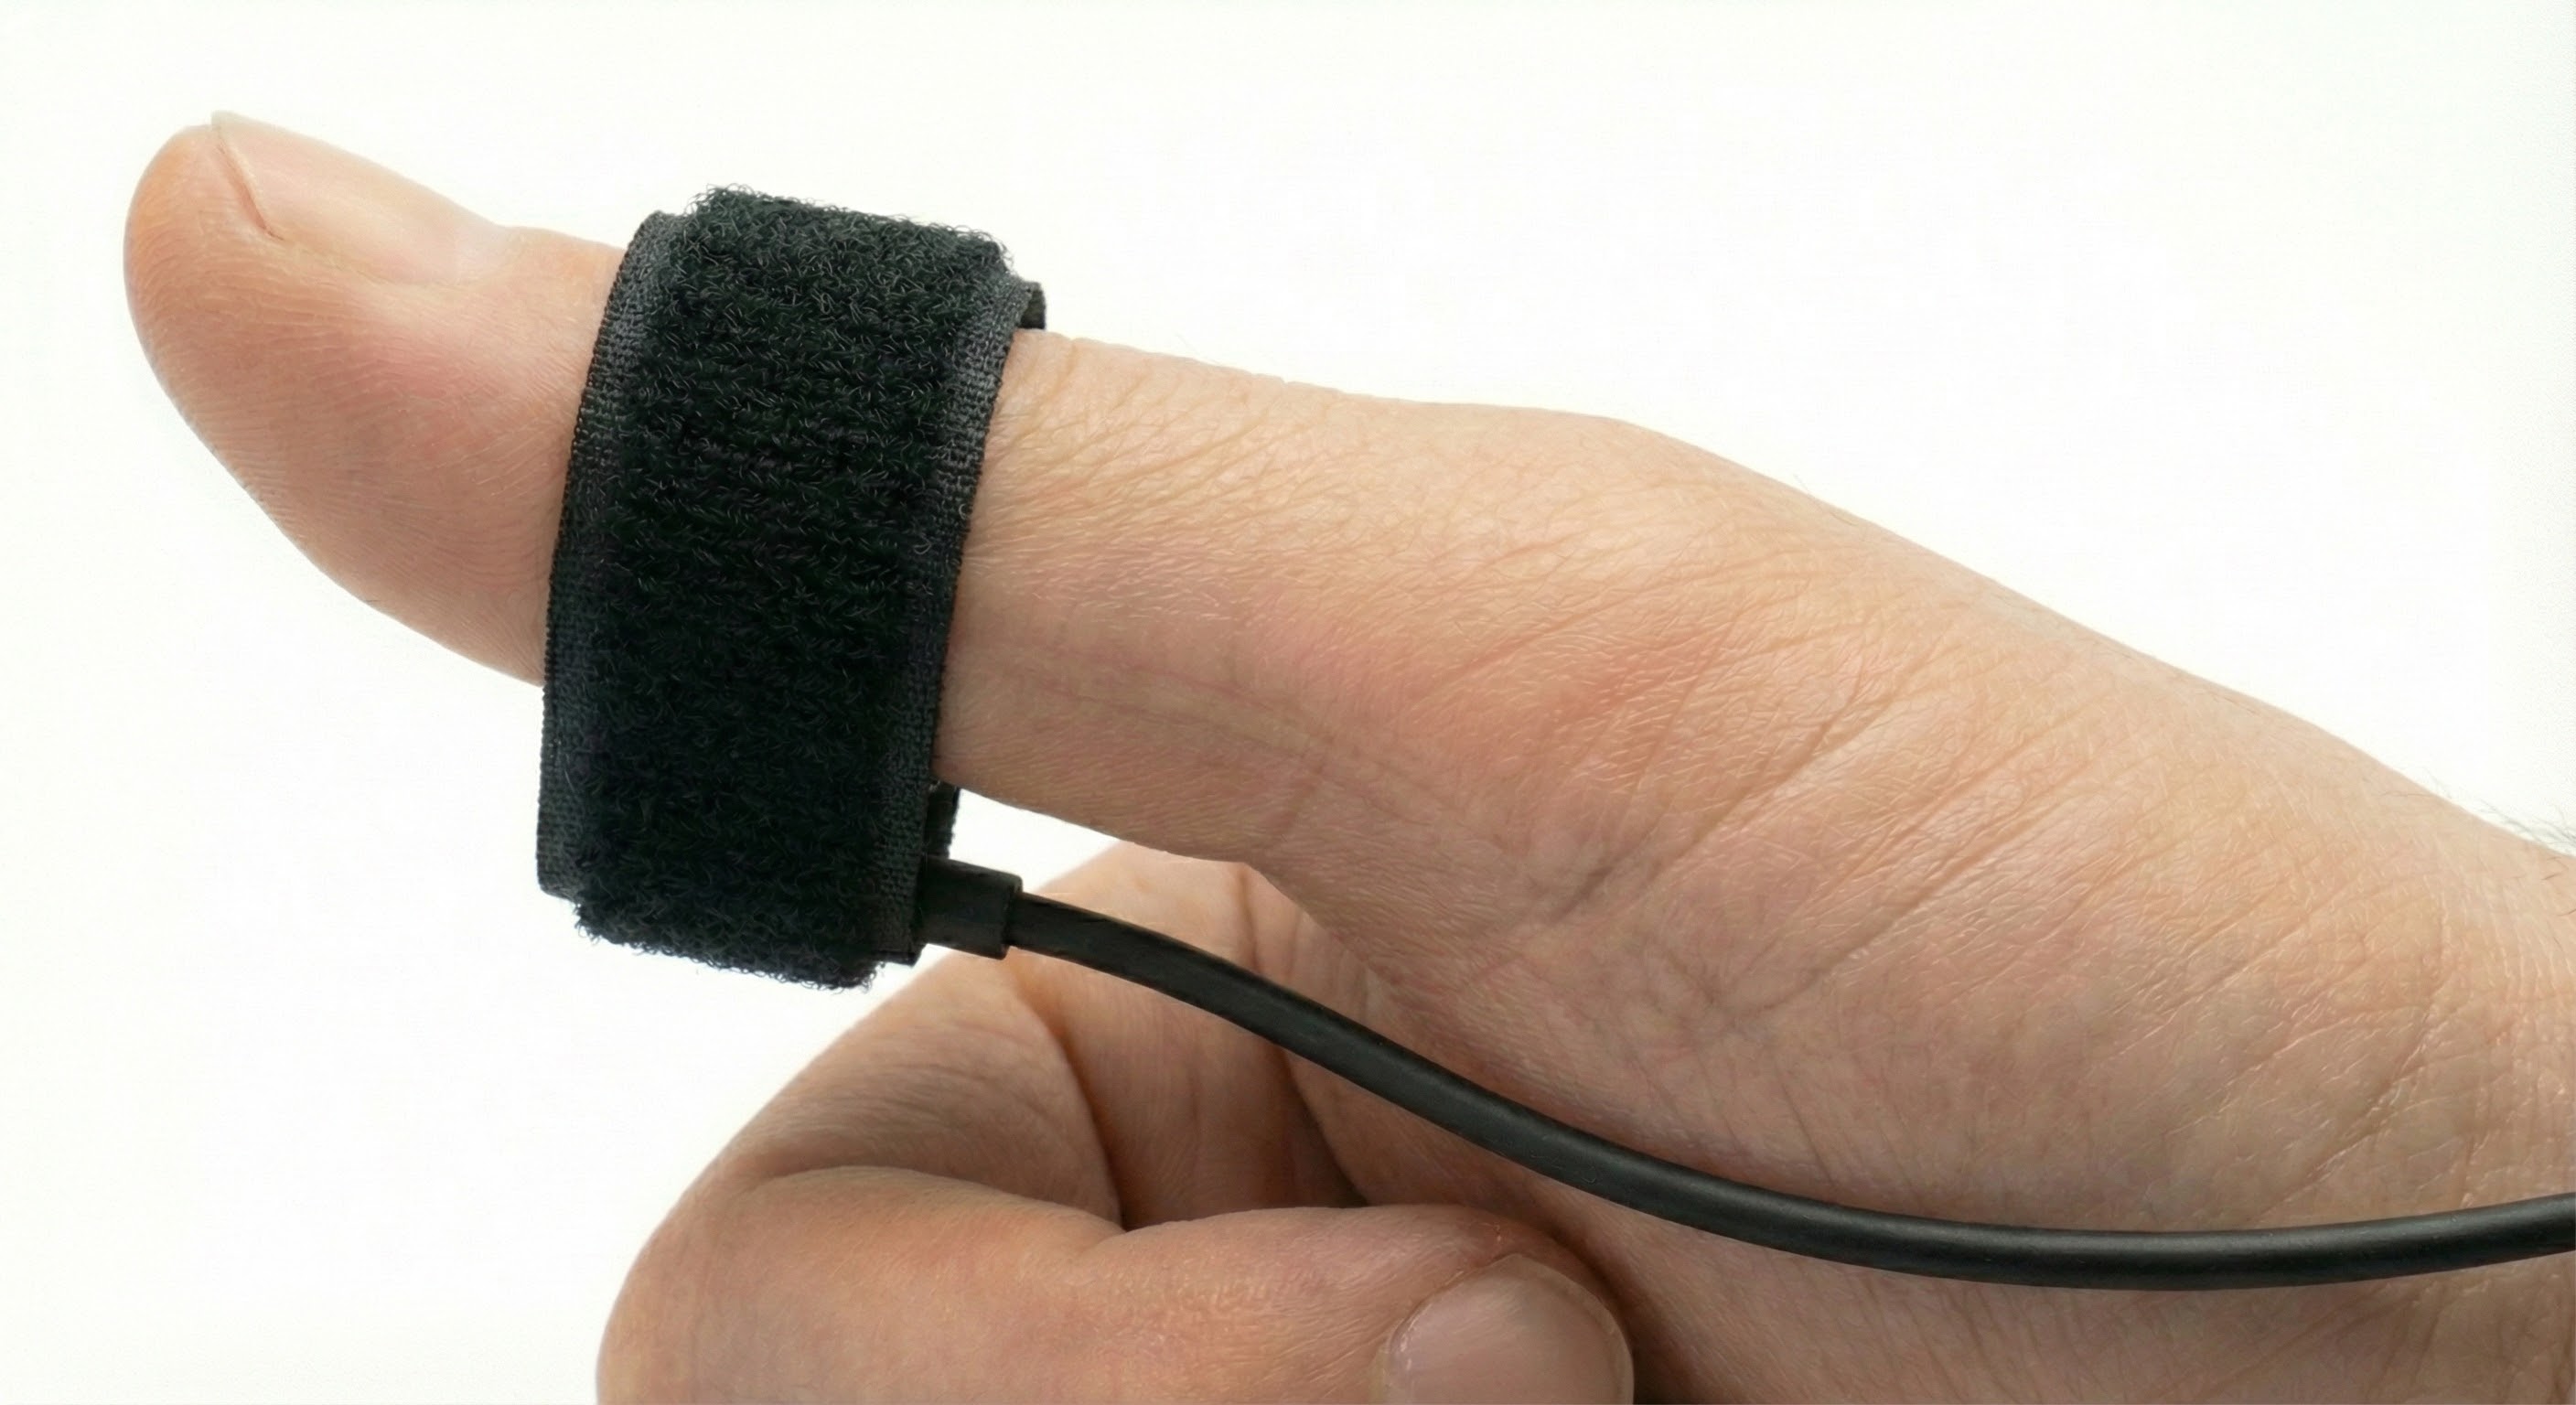
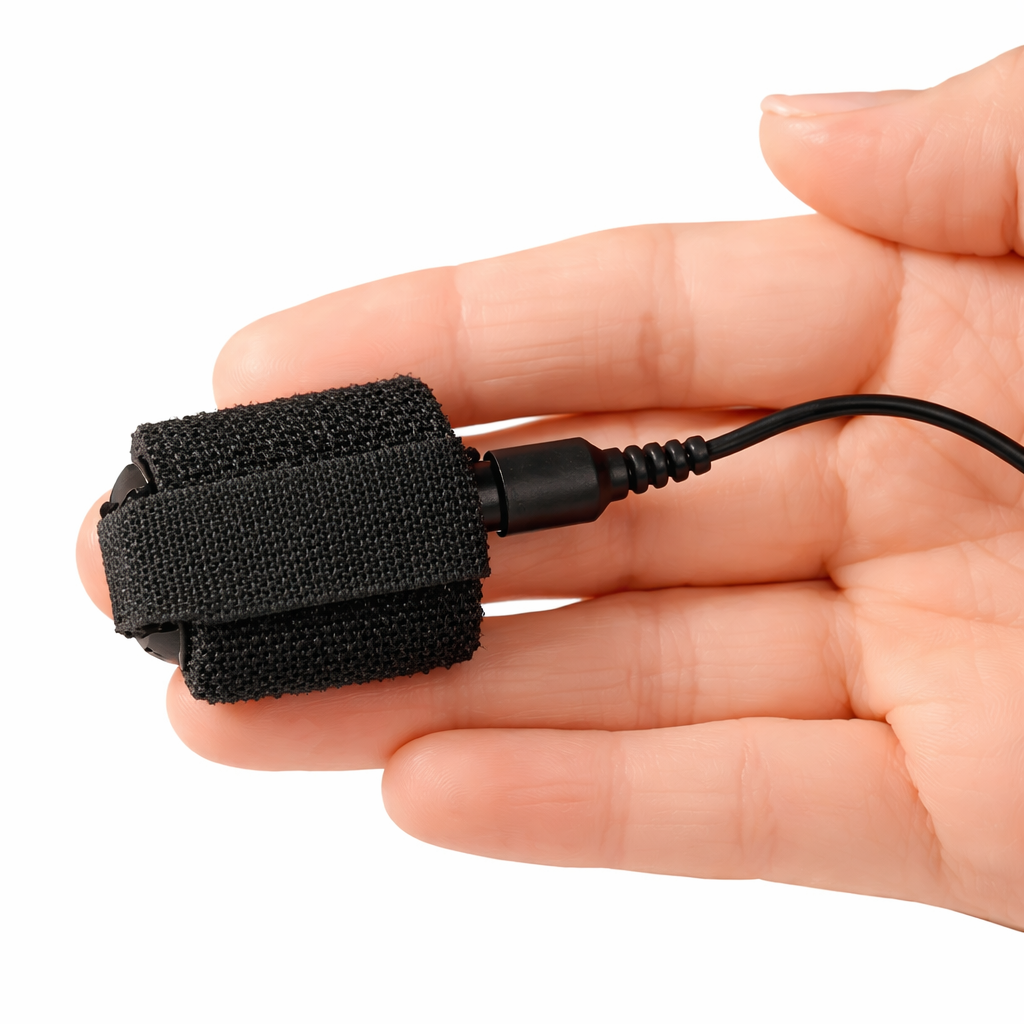
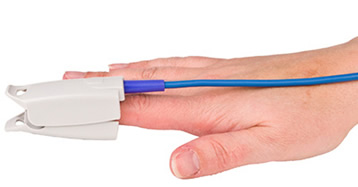
For temporal artery placement, lightly press your first or second finger to detect a pulse between the corner of the eye and eyebrow (near the hairline). When you display the raw signal, the best location will produce the highest amplitudes and cleanest signals. A MindMedia BVP sensor is shown below.
Limb Position
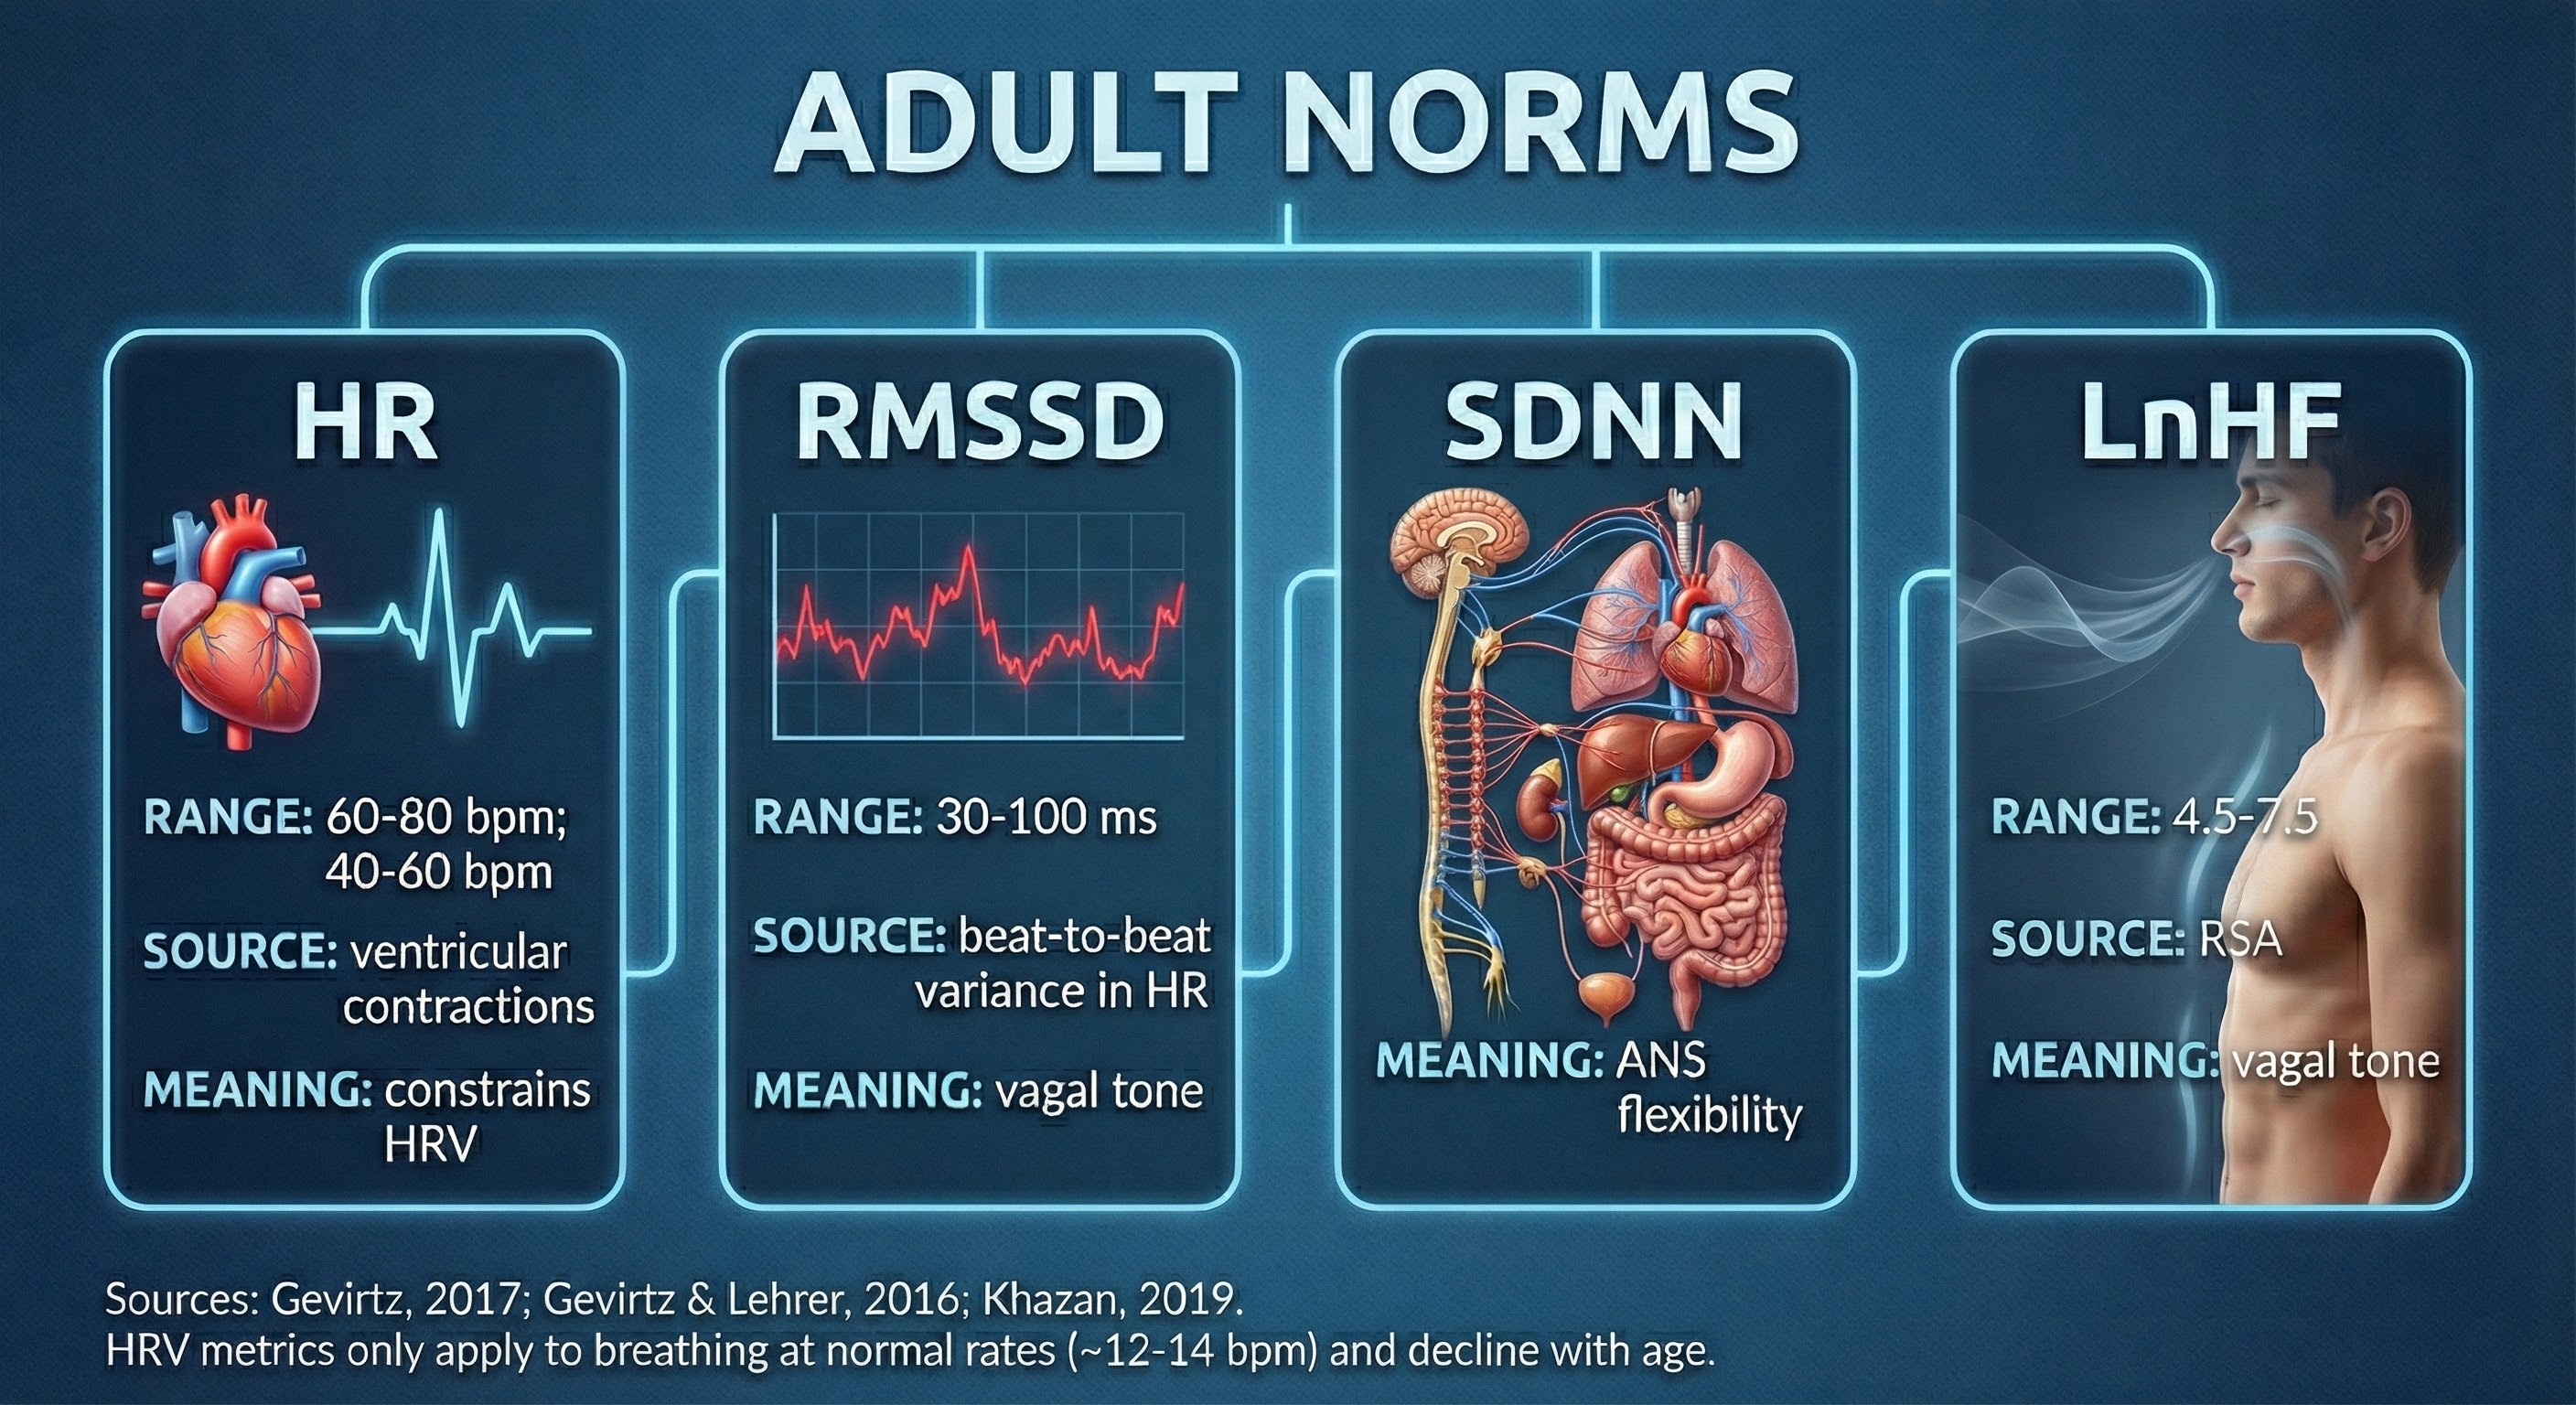
Sensor position relative to the heart strongly affects blood volume pulse. If the PPG sensor is placed on a limb below the heart, BVP signal amplitude increases. We can take advantage of this phenomenon when signal amplitudes are weak (Lehrer, 2018b). If the limb is placed above the heart, the signal amplitude decreases. These changes appear to reflect venous filling (Peper, Shaffer, & Lin, 2010).
BVP Artifacts
Artifacts are false values produced by the client's body (ectopic beats) and actions (movement), the environment (line current), and hardware limitations (light leakage).
Inspect the raw BVP signal for cardiac conduction, cold, light, line interference, movement, and pressure artifacts.

Use clean BVP recordings as a reference.
Short-Term HRV Values Are Proxies of 24-Hour Values
Recognize typical short-term (~ 5-minute) HR and HRV values to ensure that your readings make sense.
🎧 Mini-Lecture: Short-Term HRV Values Are Proxies
Short-term values are proxies of 24-hour values. Never compare the short-term values shown below with 24-hour norms. Twenty-four-hour values are typically greater and can predict morbidity and mortality, while most short-term values cannot.
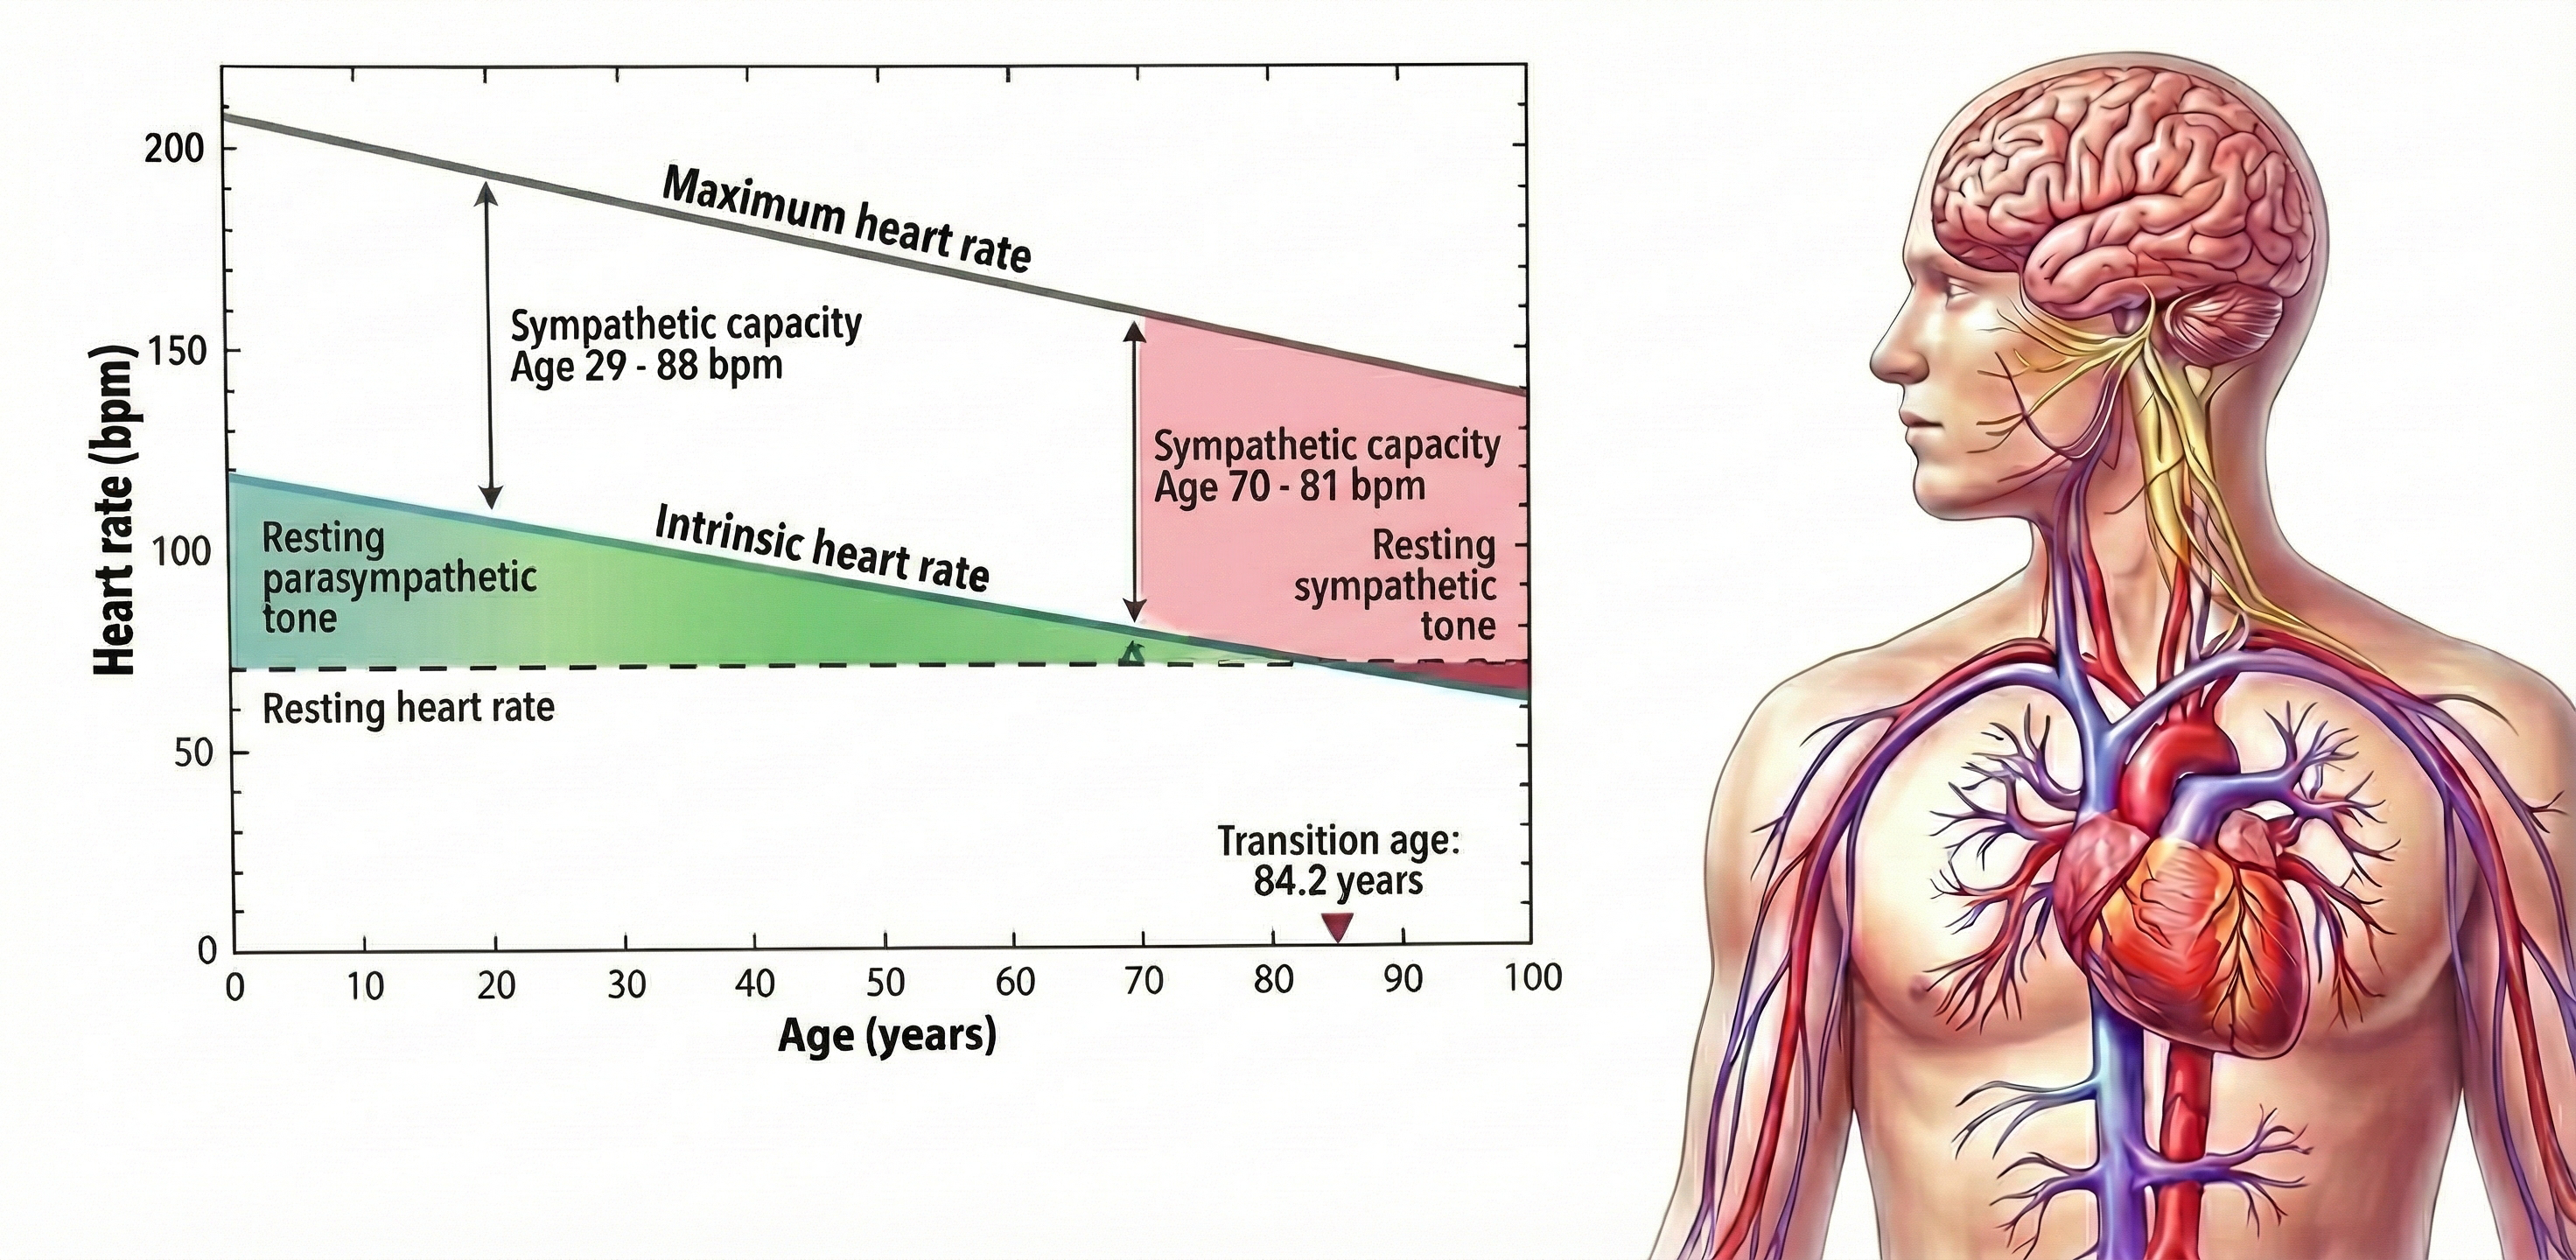
The intrinsic heart rate is higher than the resting heart rate until age 84.
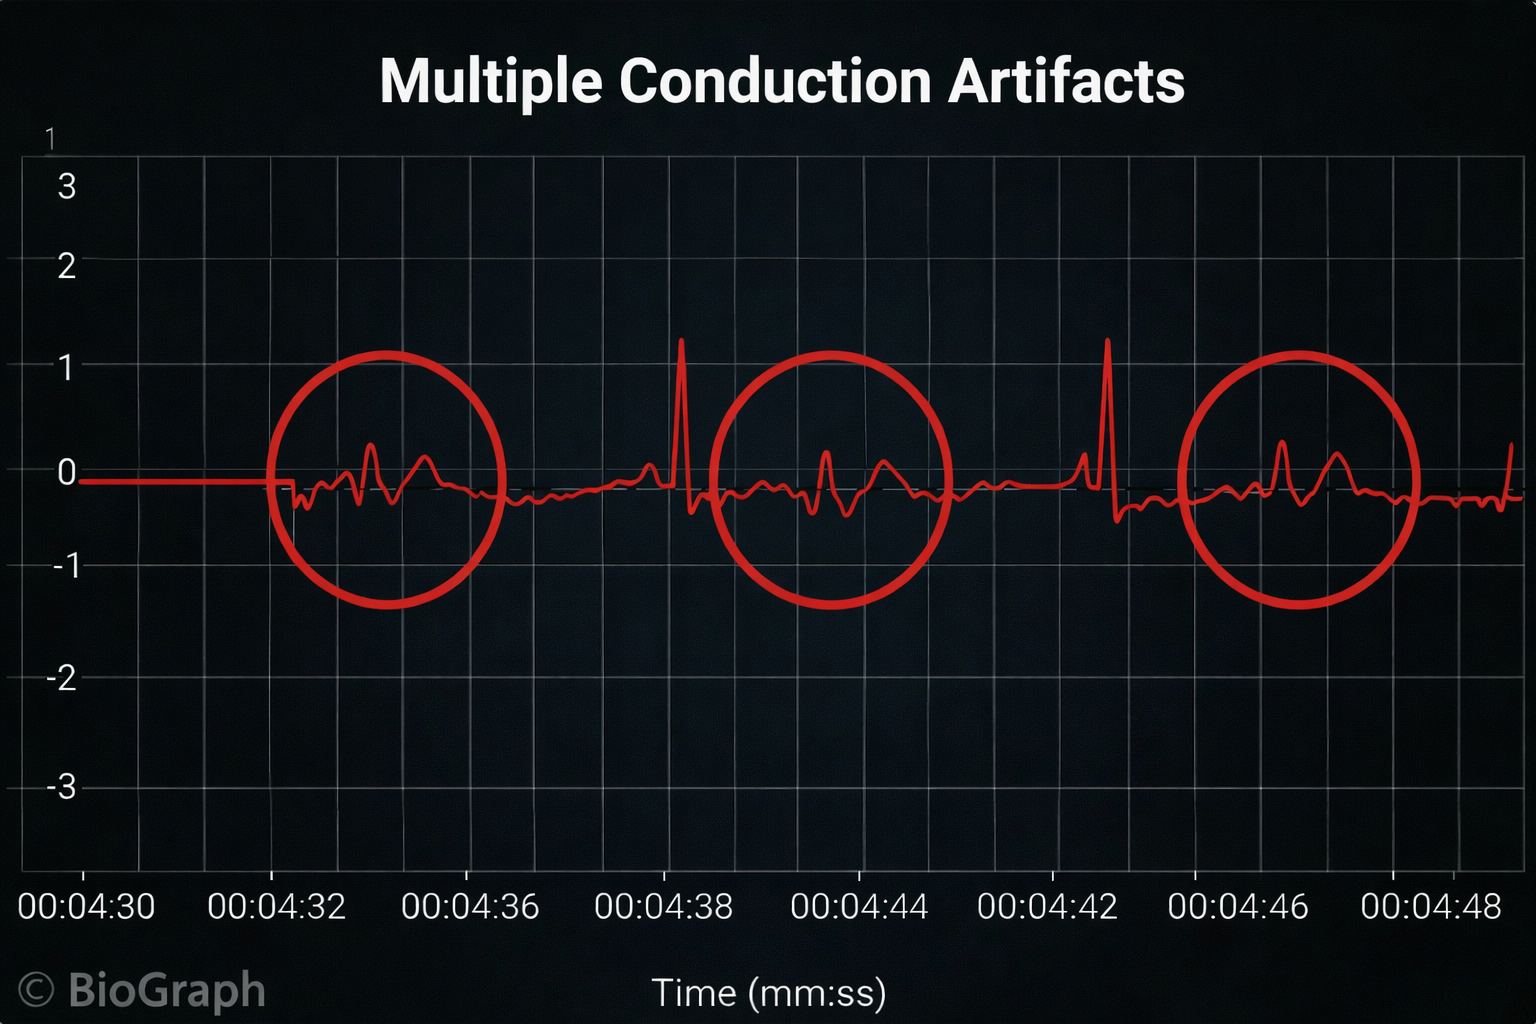
Cardiac Conduction Artifacts
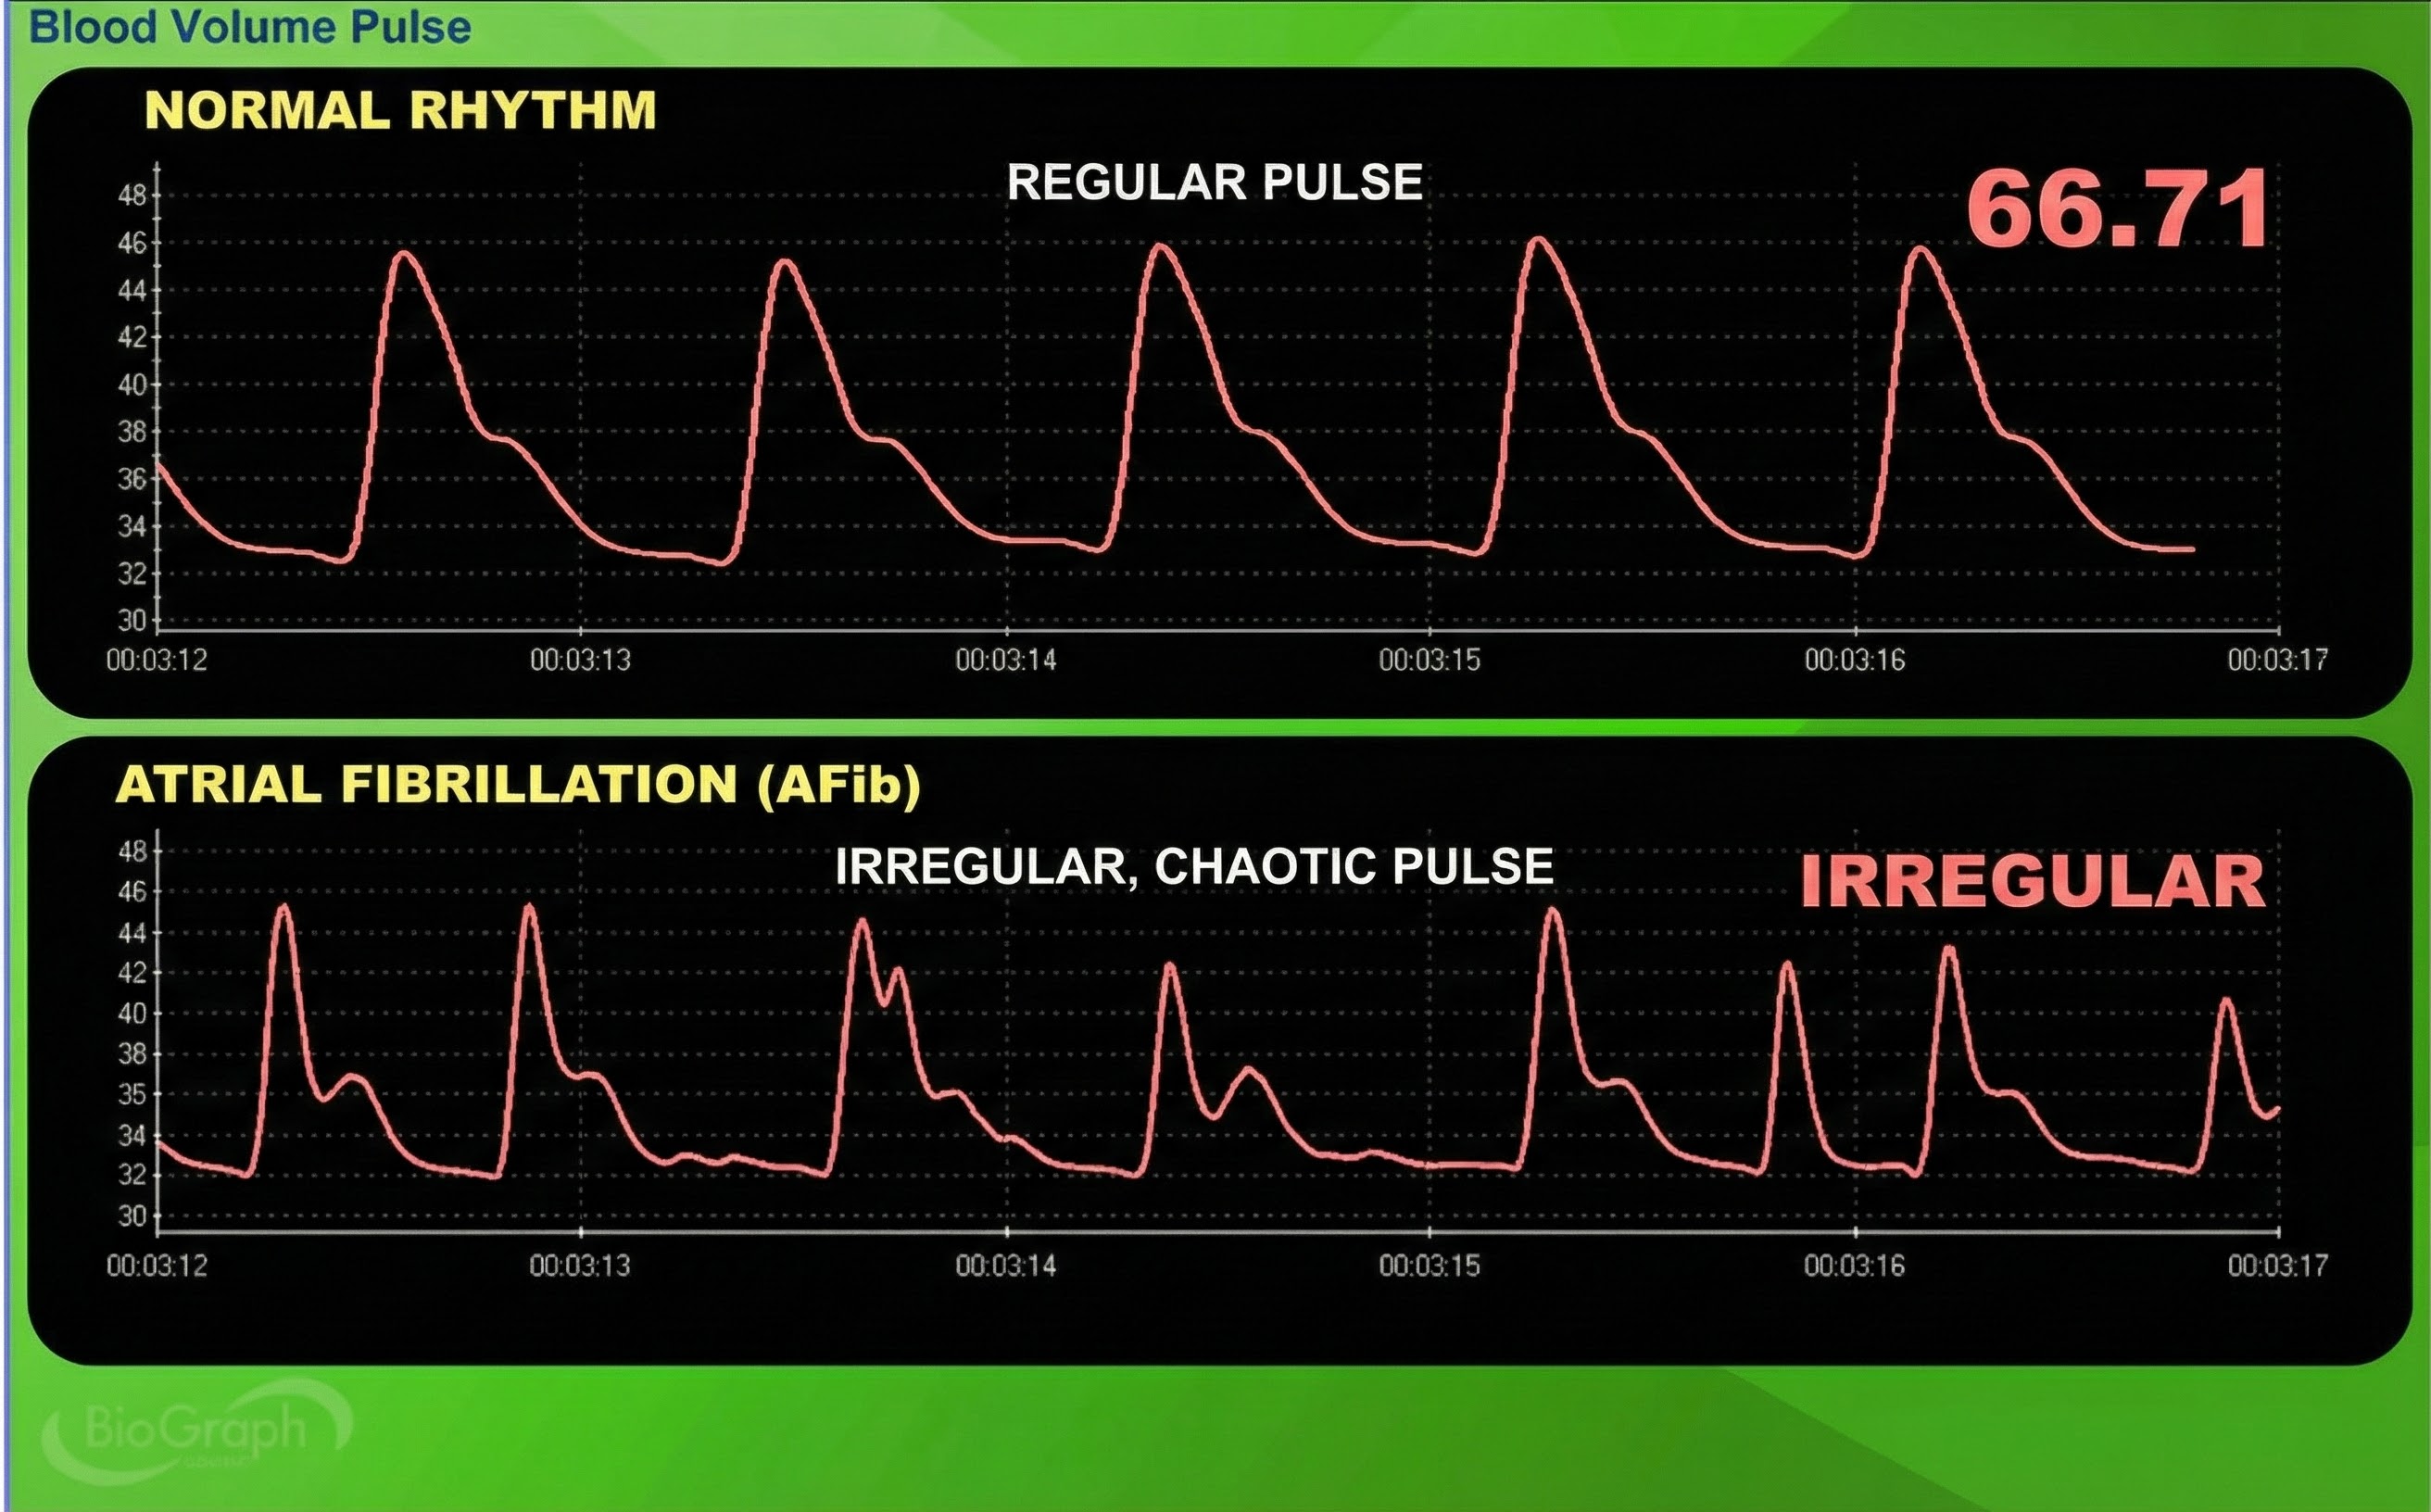
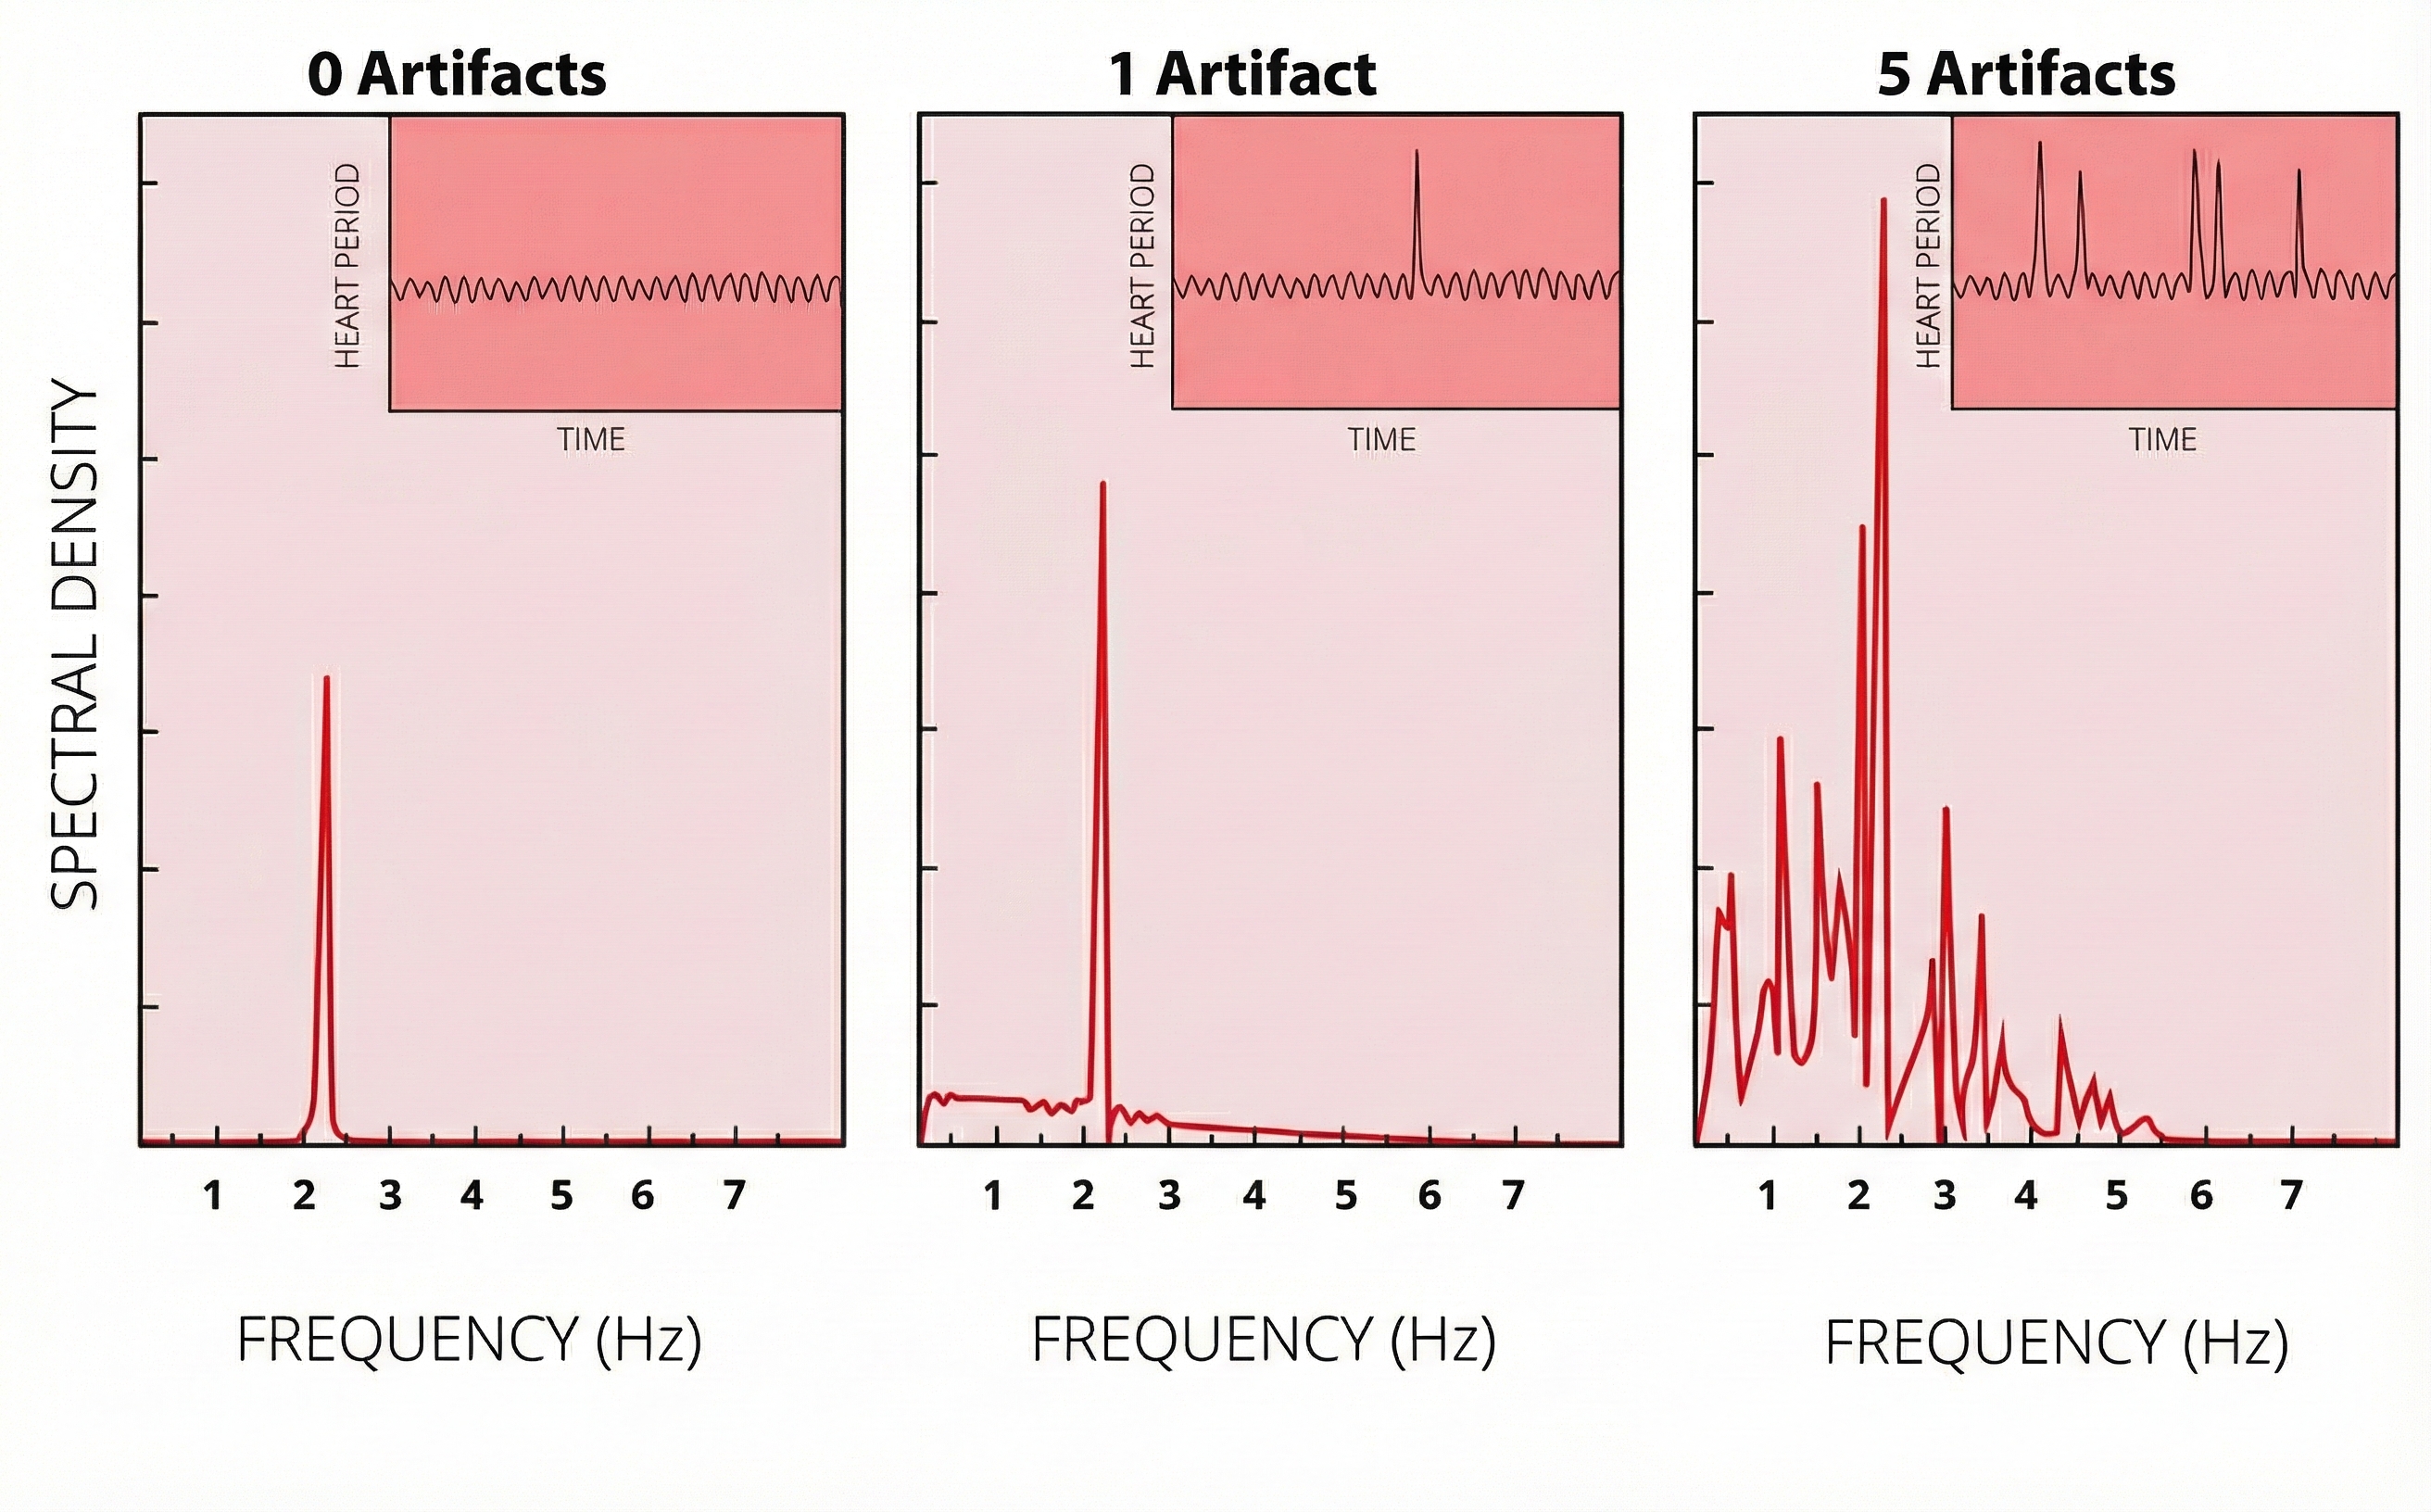
Cardiac conduction artifacts include atrial fibrillation, premature atrial contractions, and premature ventricular contractions.
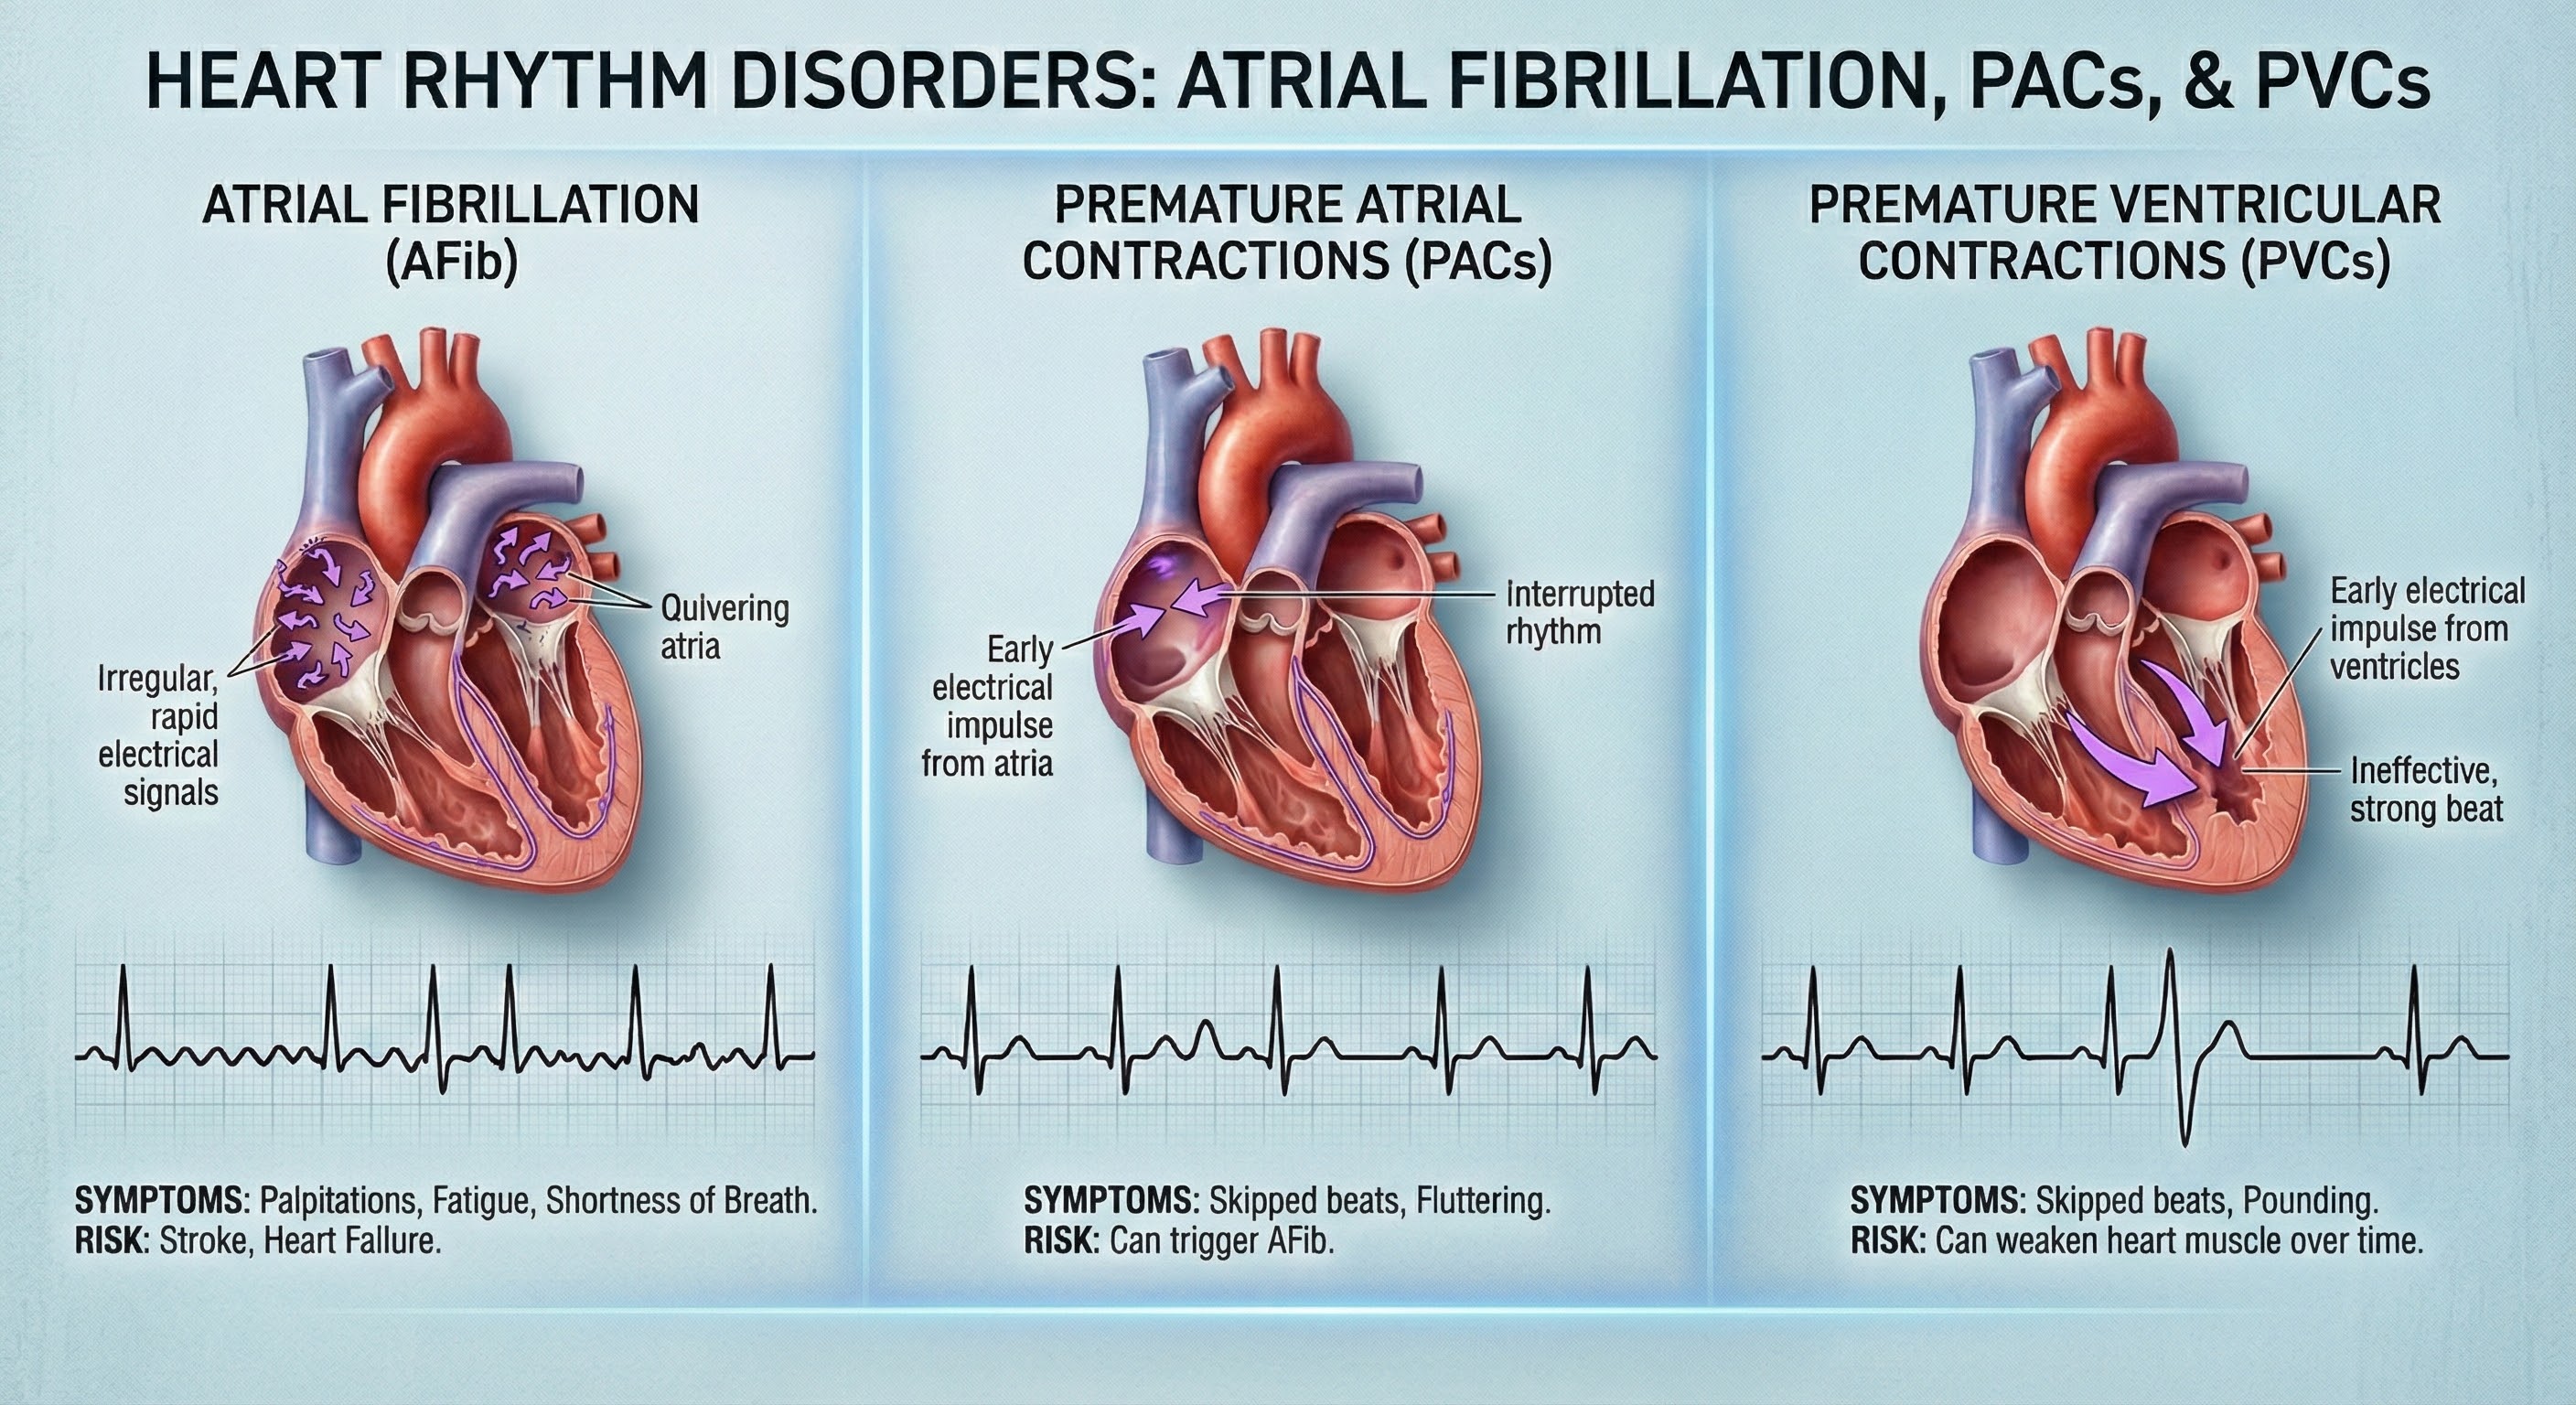
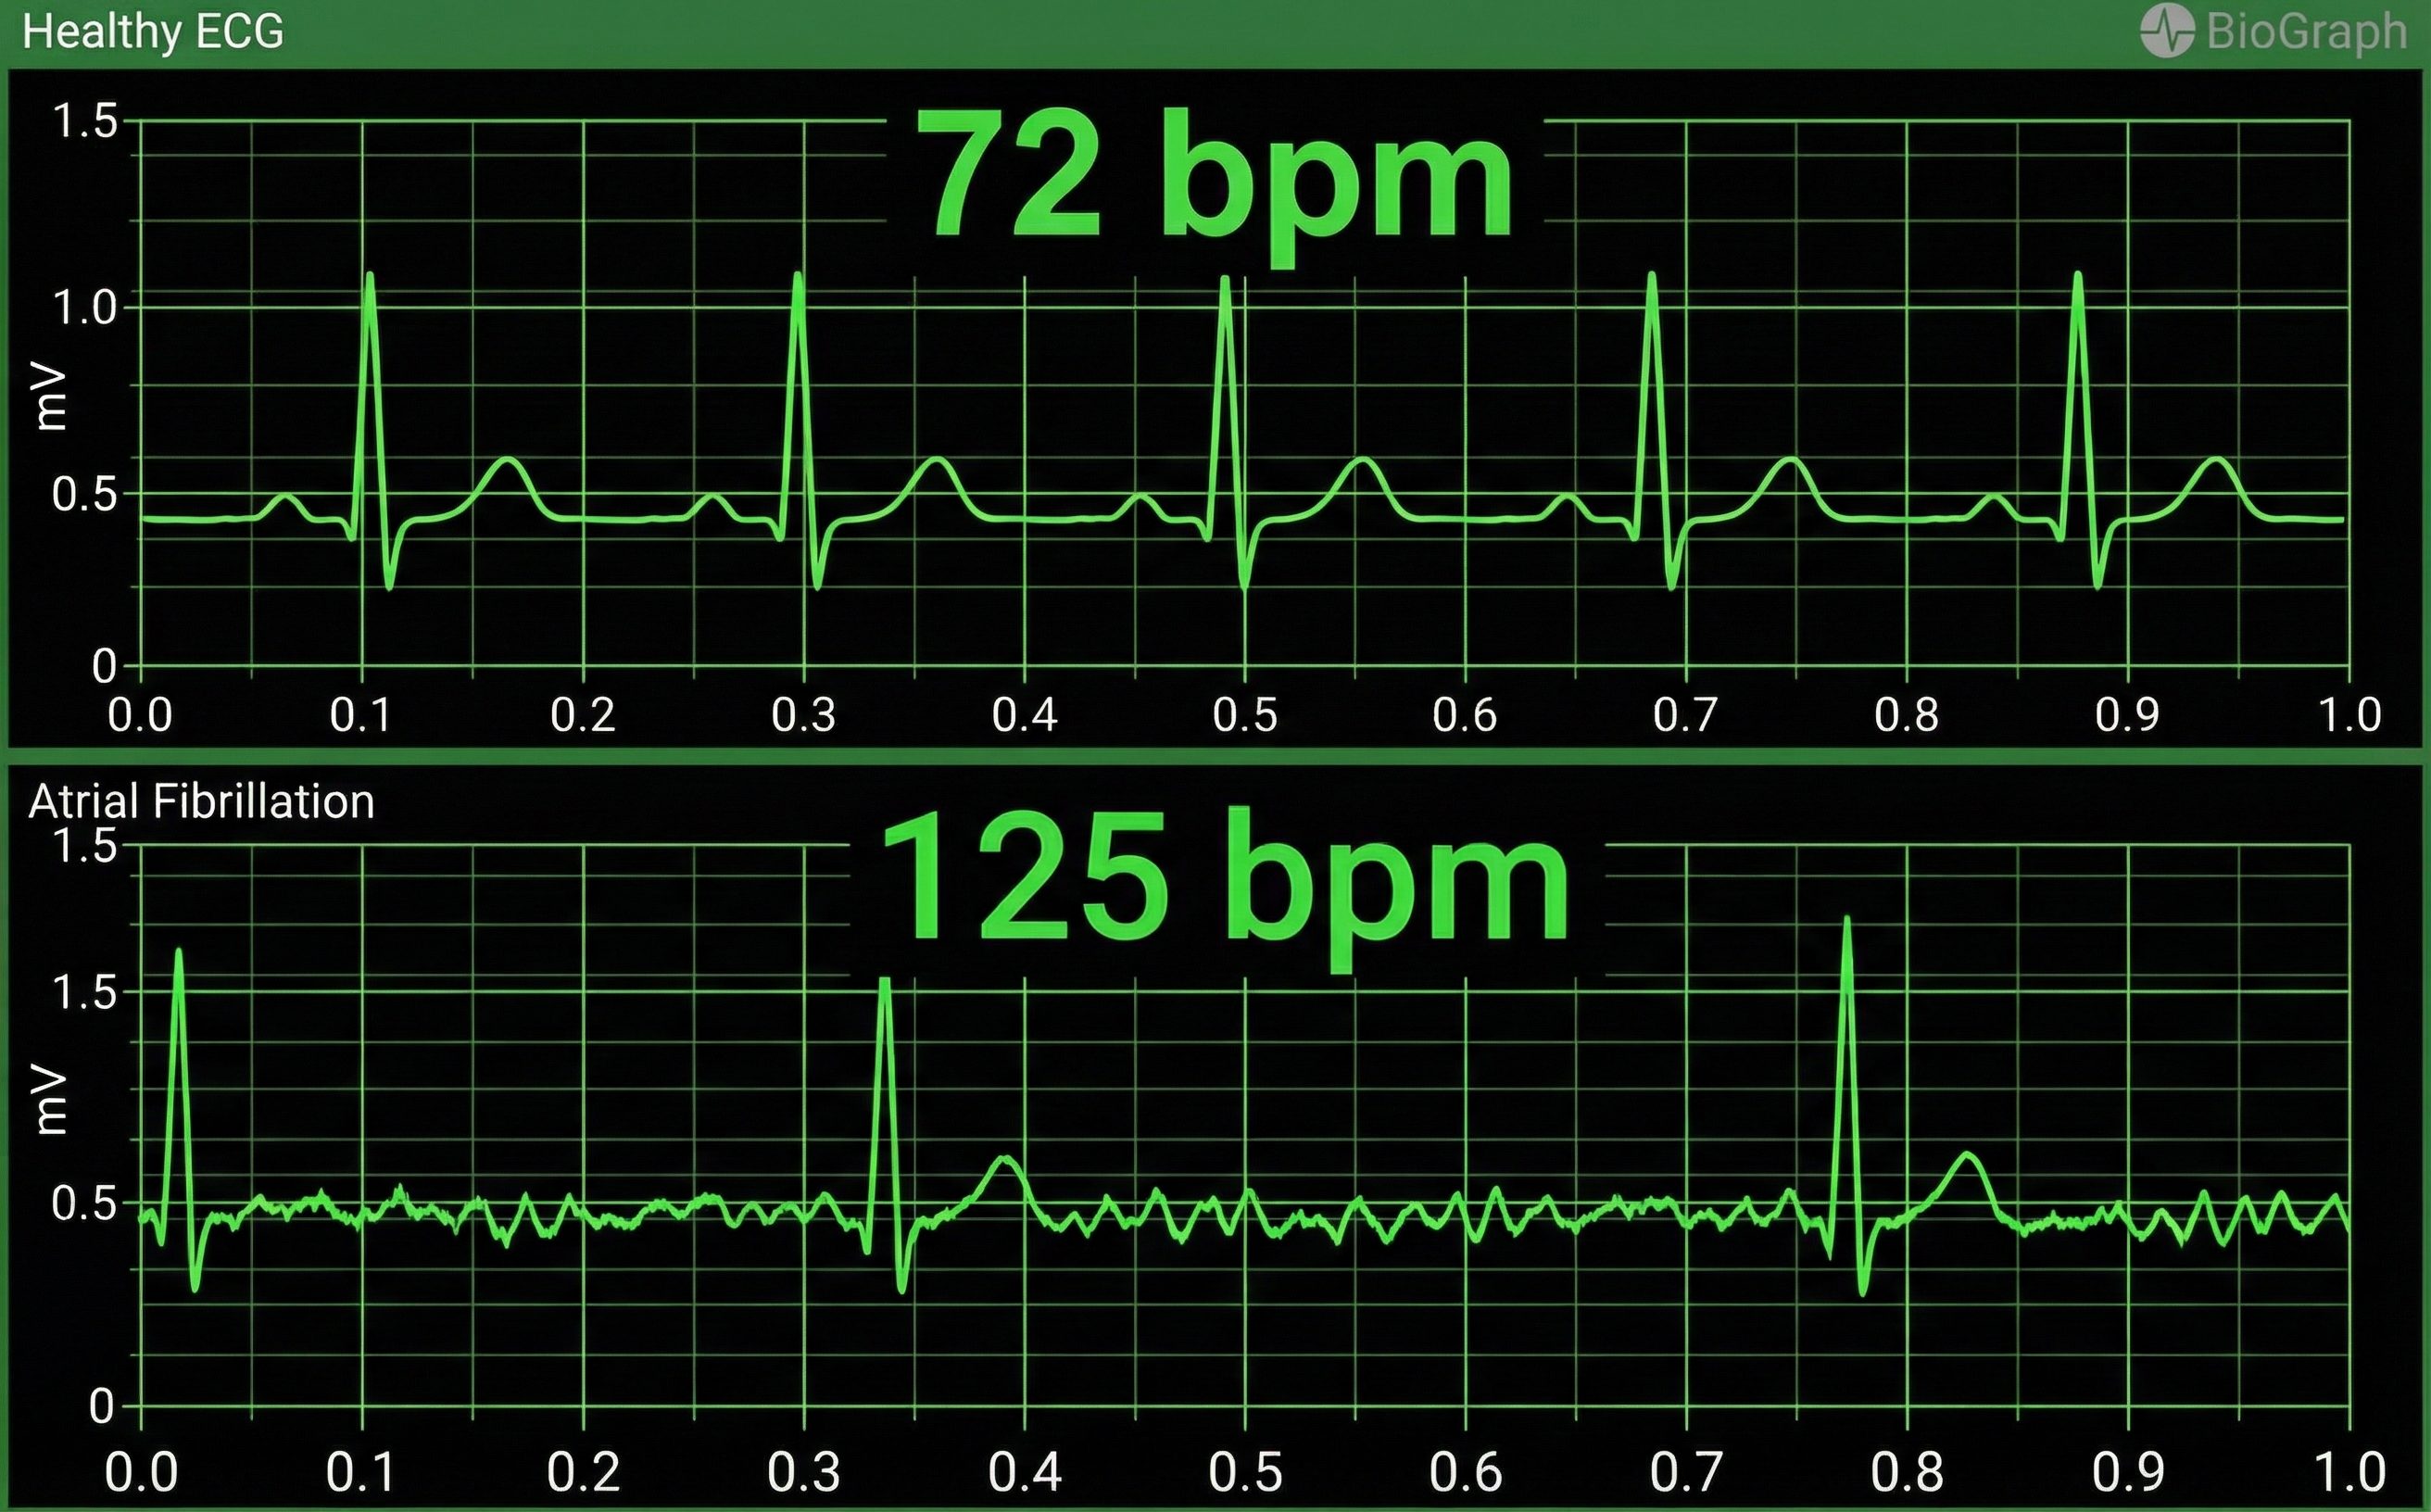
Atrial fibrillation is a form of supraventricular arrhythmia, with HRs reaching 160 beats per minute (Tortora & Derrickson, 2021).
Cardiac conduction is chaotic in clients who experience this disorder.
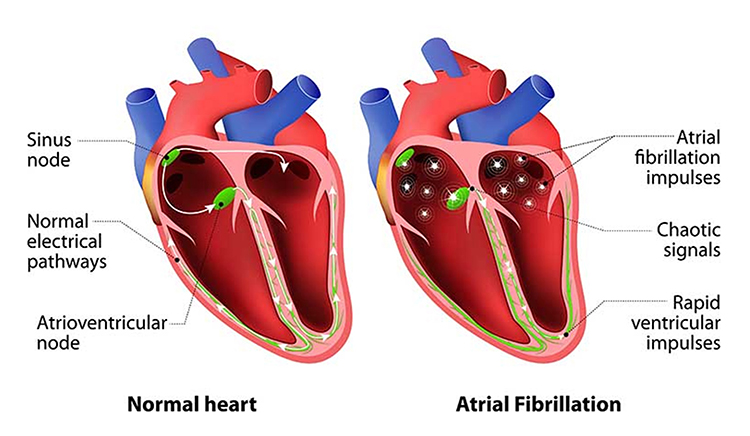
Atrial fibrillation appears chaotic.

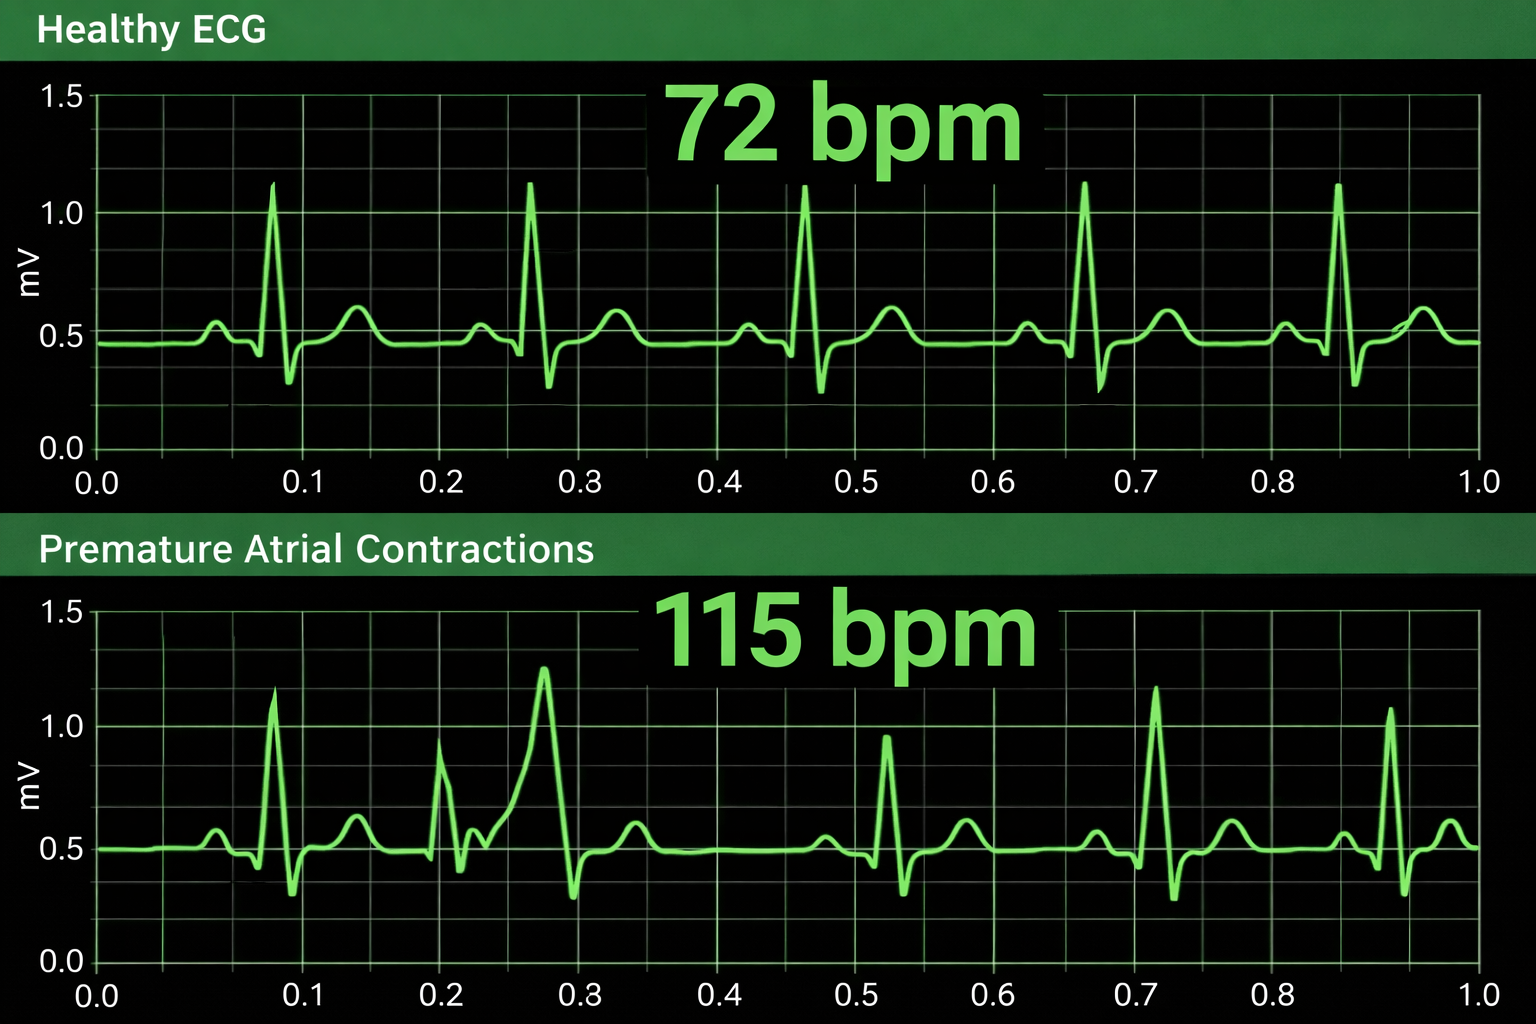
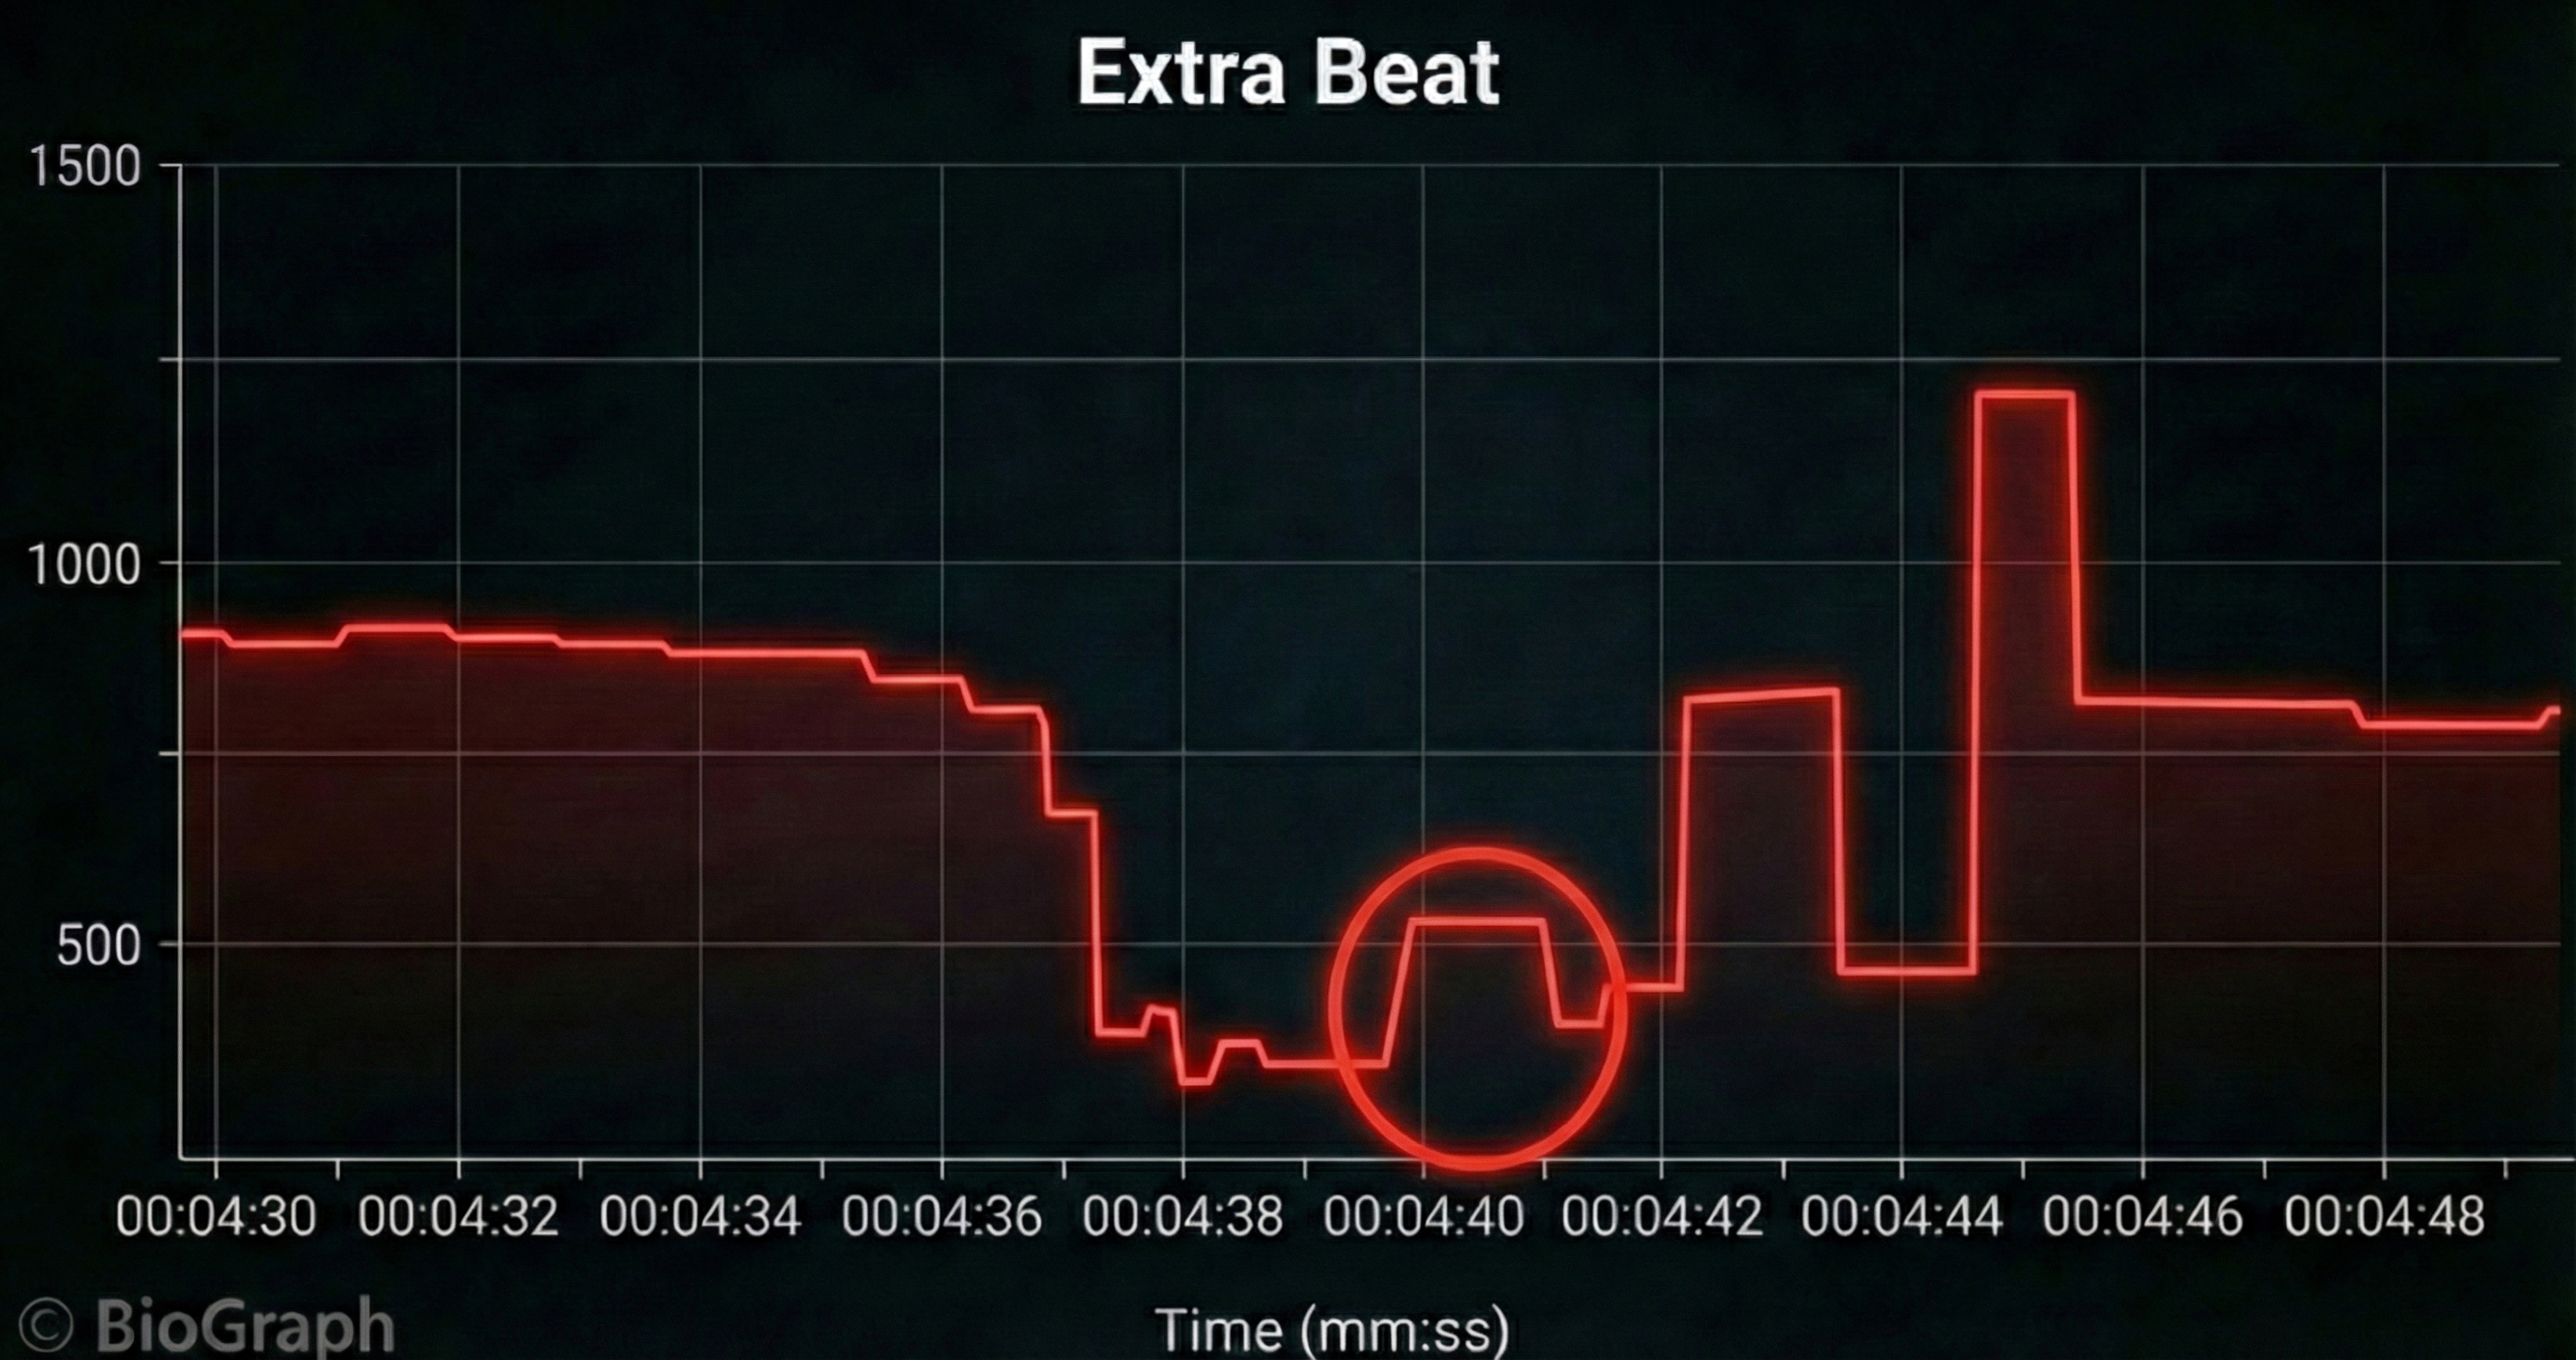
Premature atrial contractions (PACs) involve early atrial contraction and result in calculating extra beats (Lehrer, 2018b).
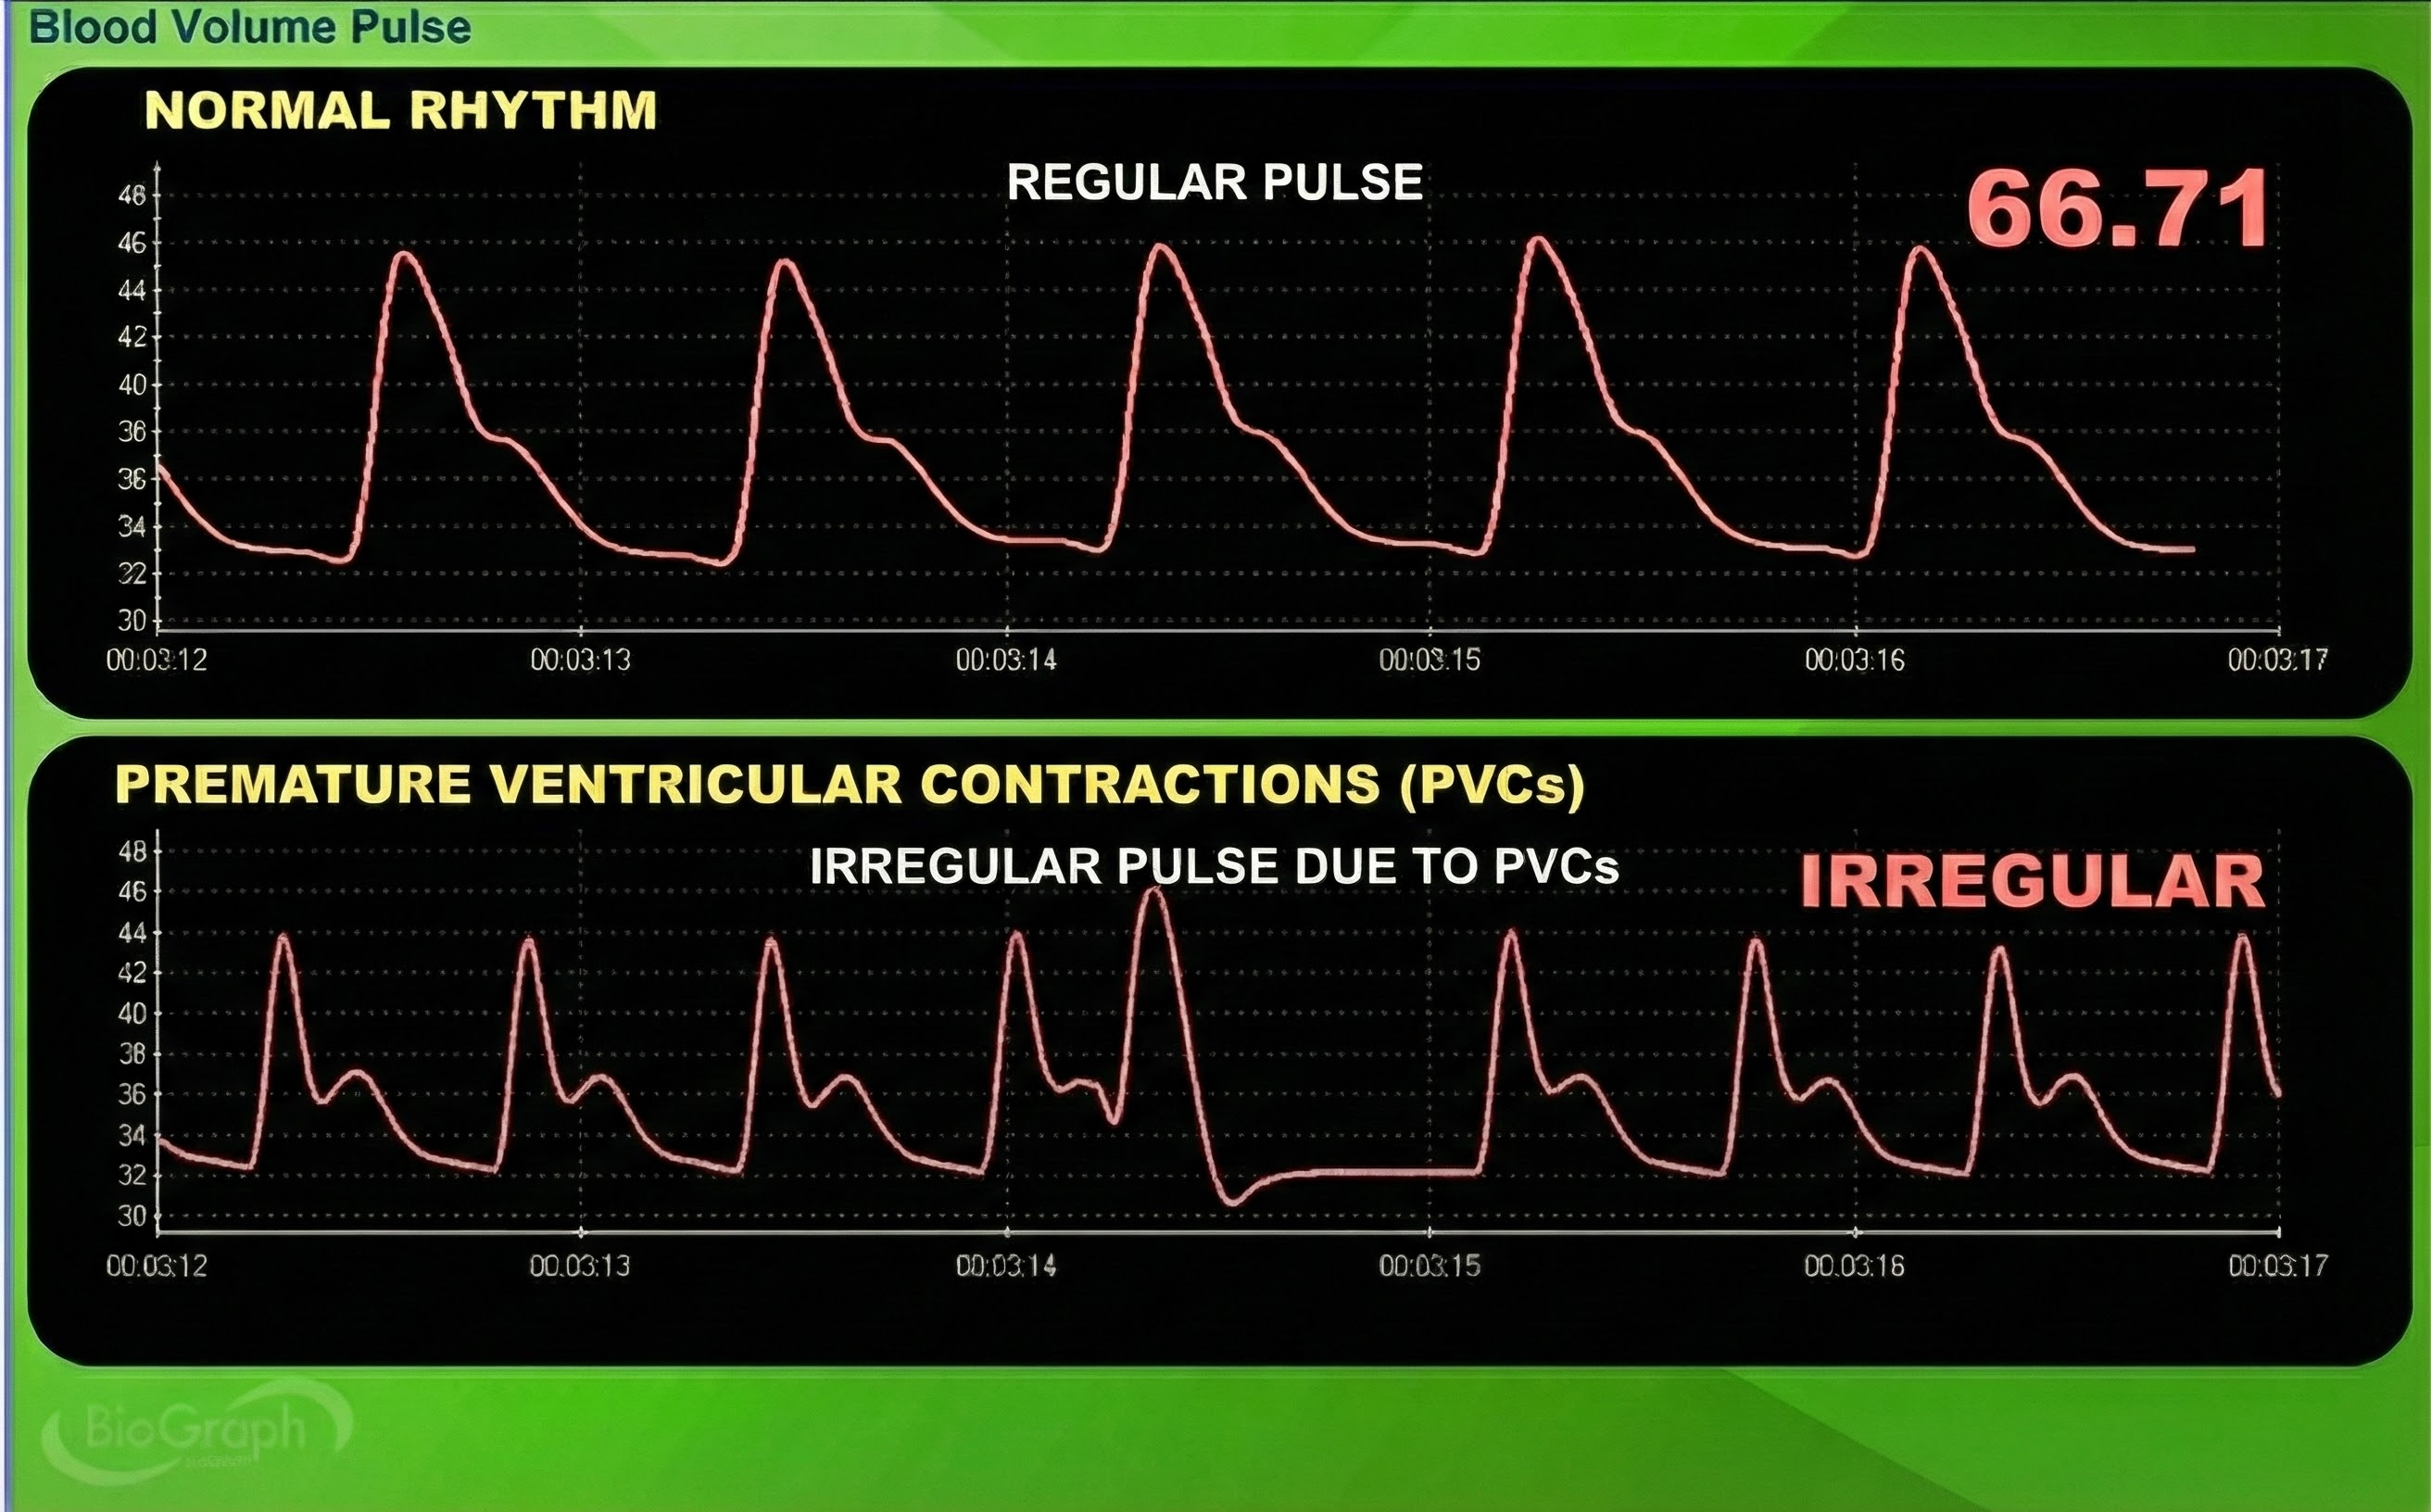
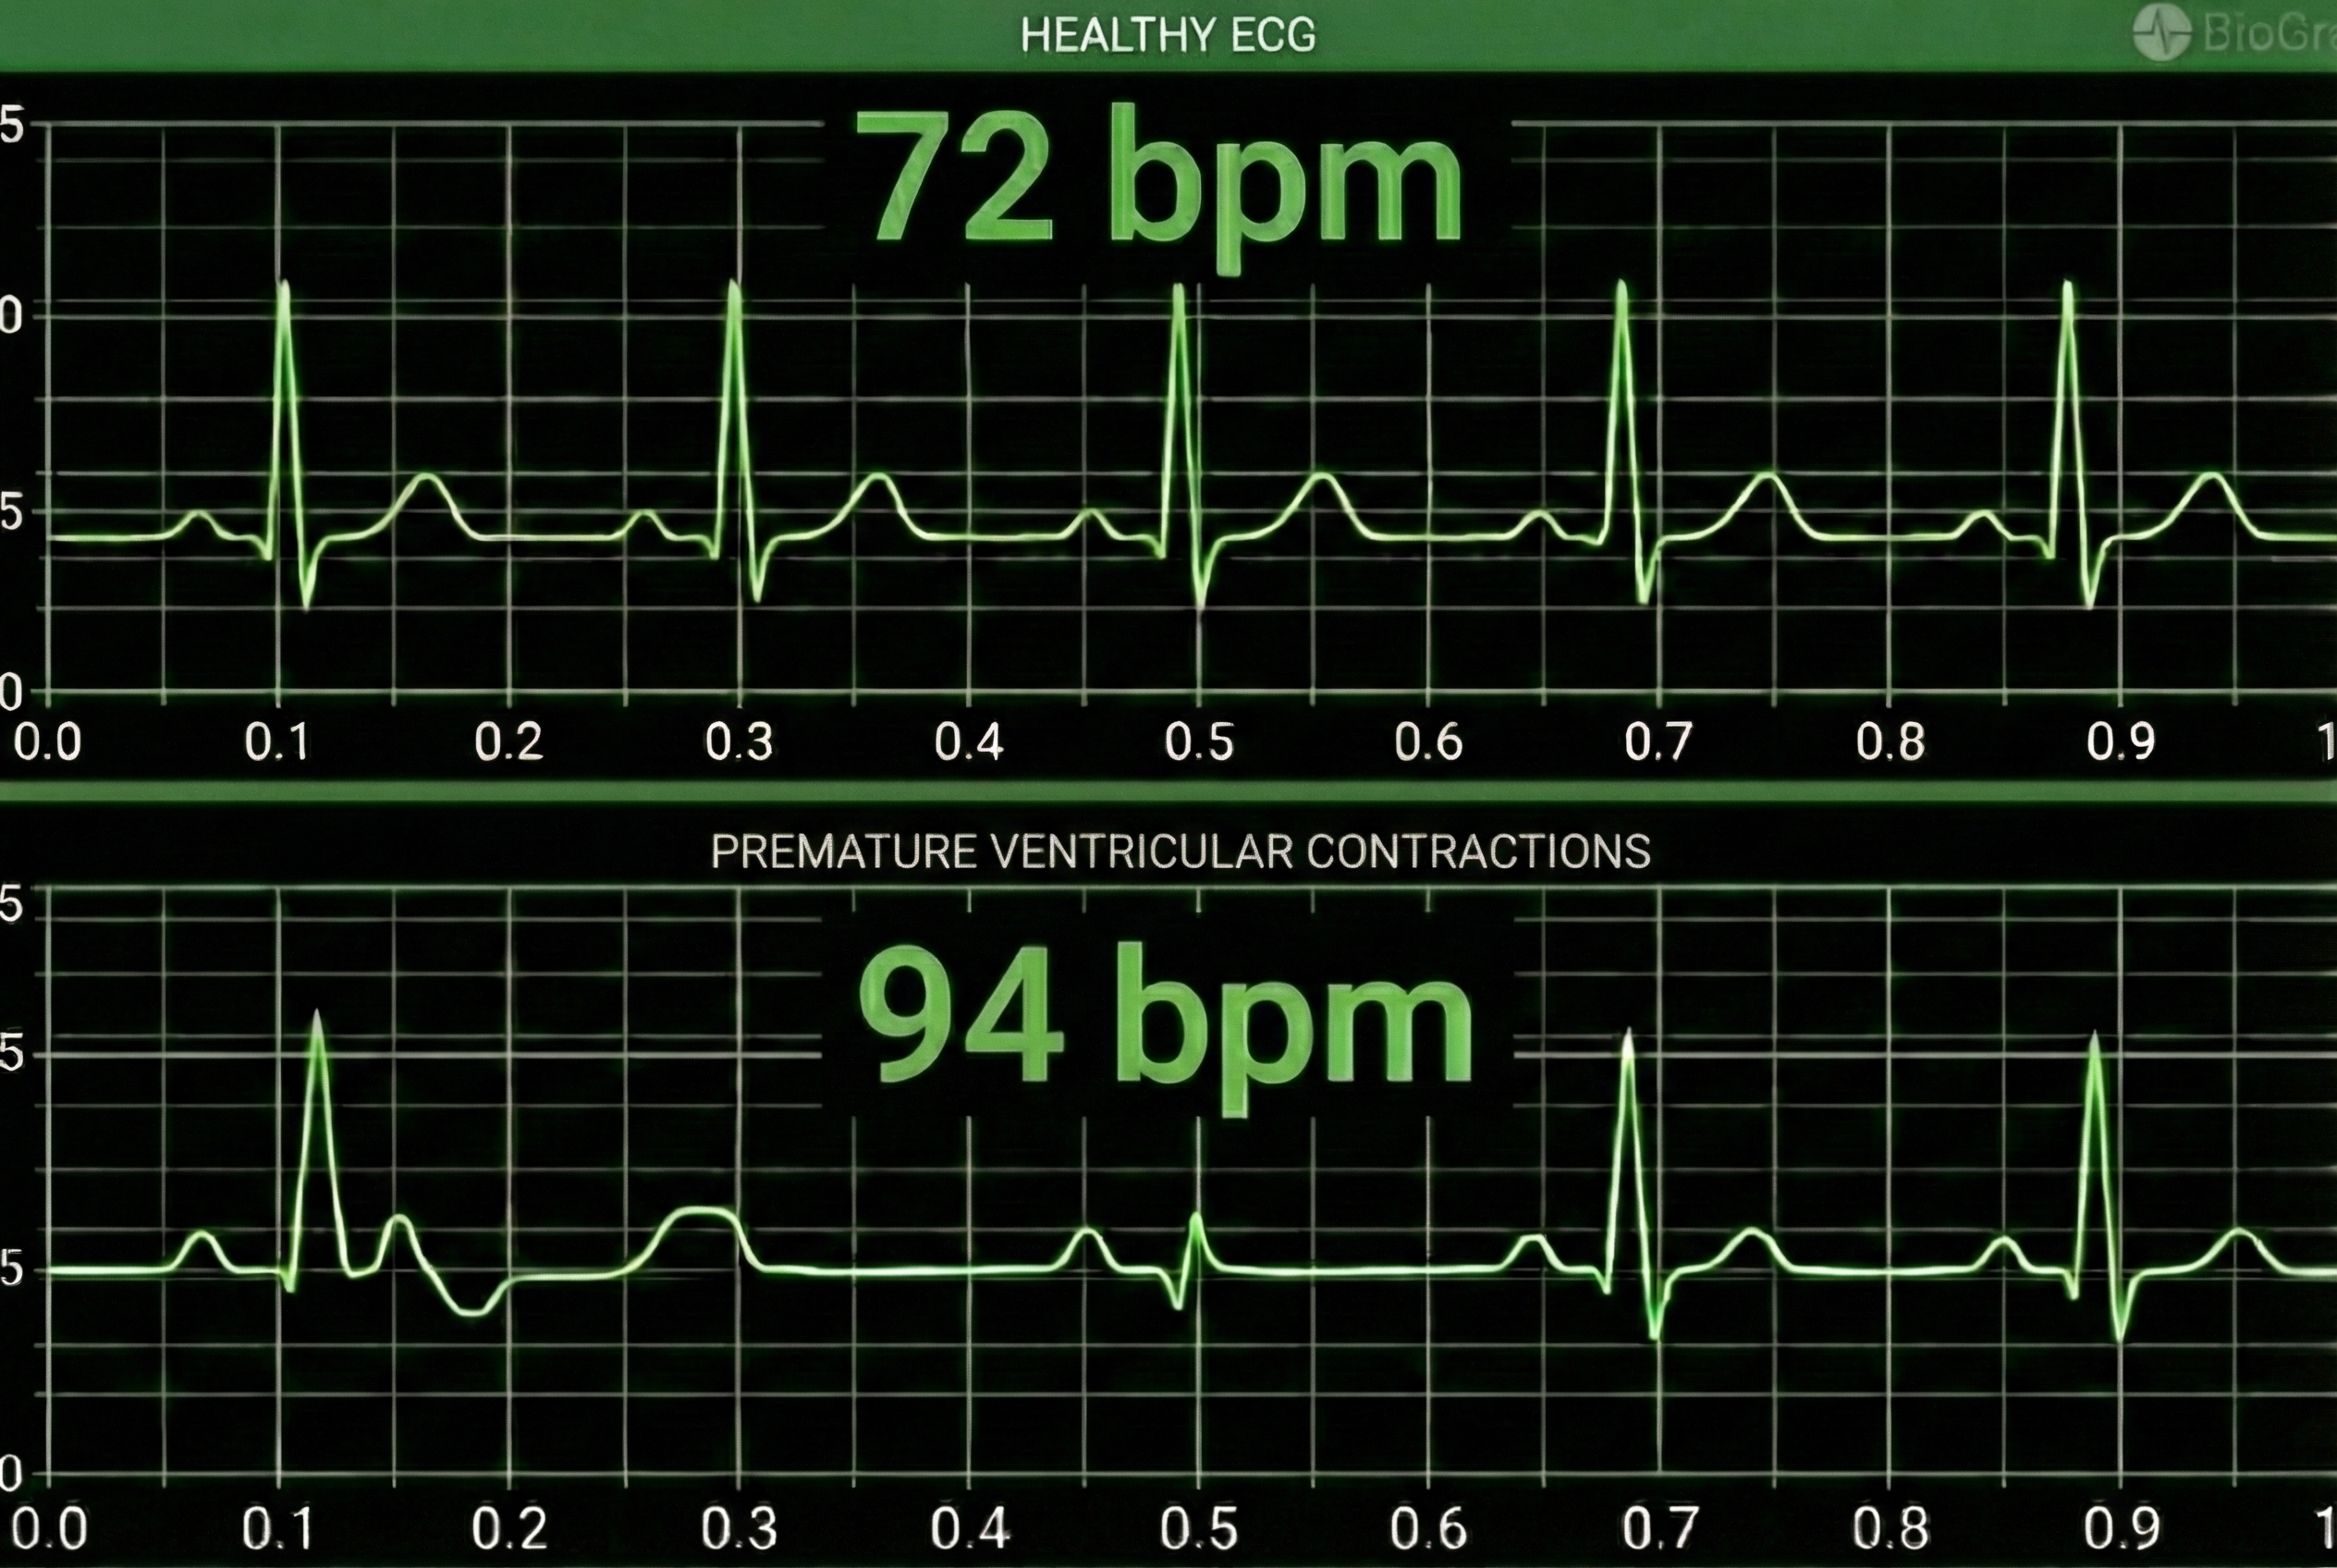
Premature ventricular contractions (PVCs) can result in an extra heartbeat followed by a full compensatory pause (Clinical ECG Interpretation, 2018). PVC artifacts are extra heartbeats that originate in the ventricles instead of the S-A node of the heart and can distort the BVP signal (Elgendi, 2012).
Clinical Tips to Minimize Cardiac Conduction Artifacts
Since atrial fibrillation, PAC, and PVC artifacts cannot be prevented, they must be eliminated by artifacting.
Cold Artifact
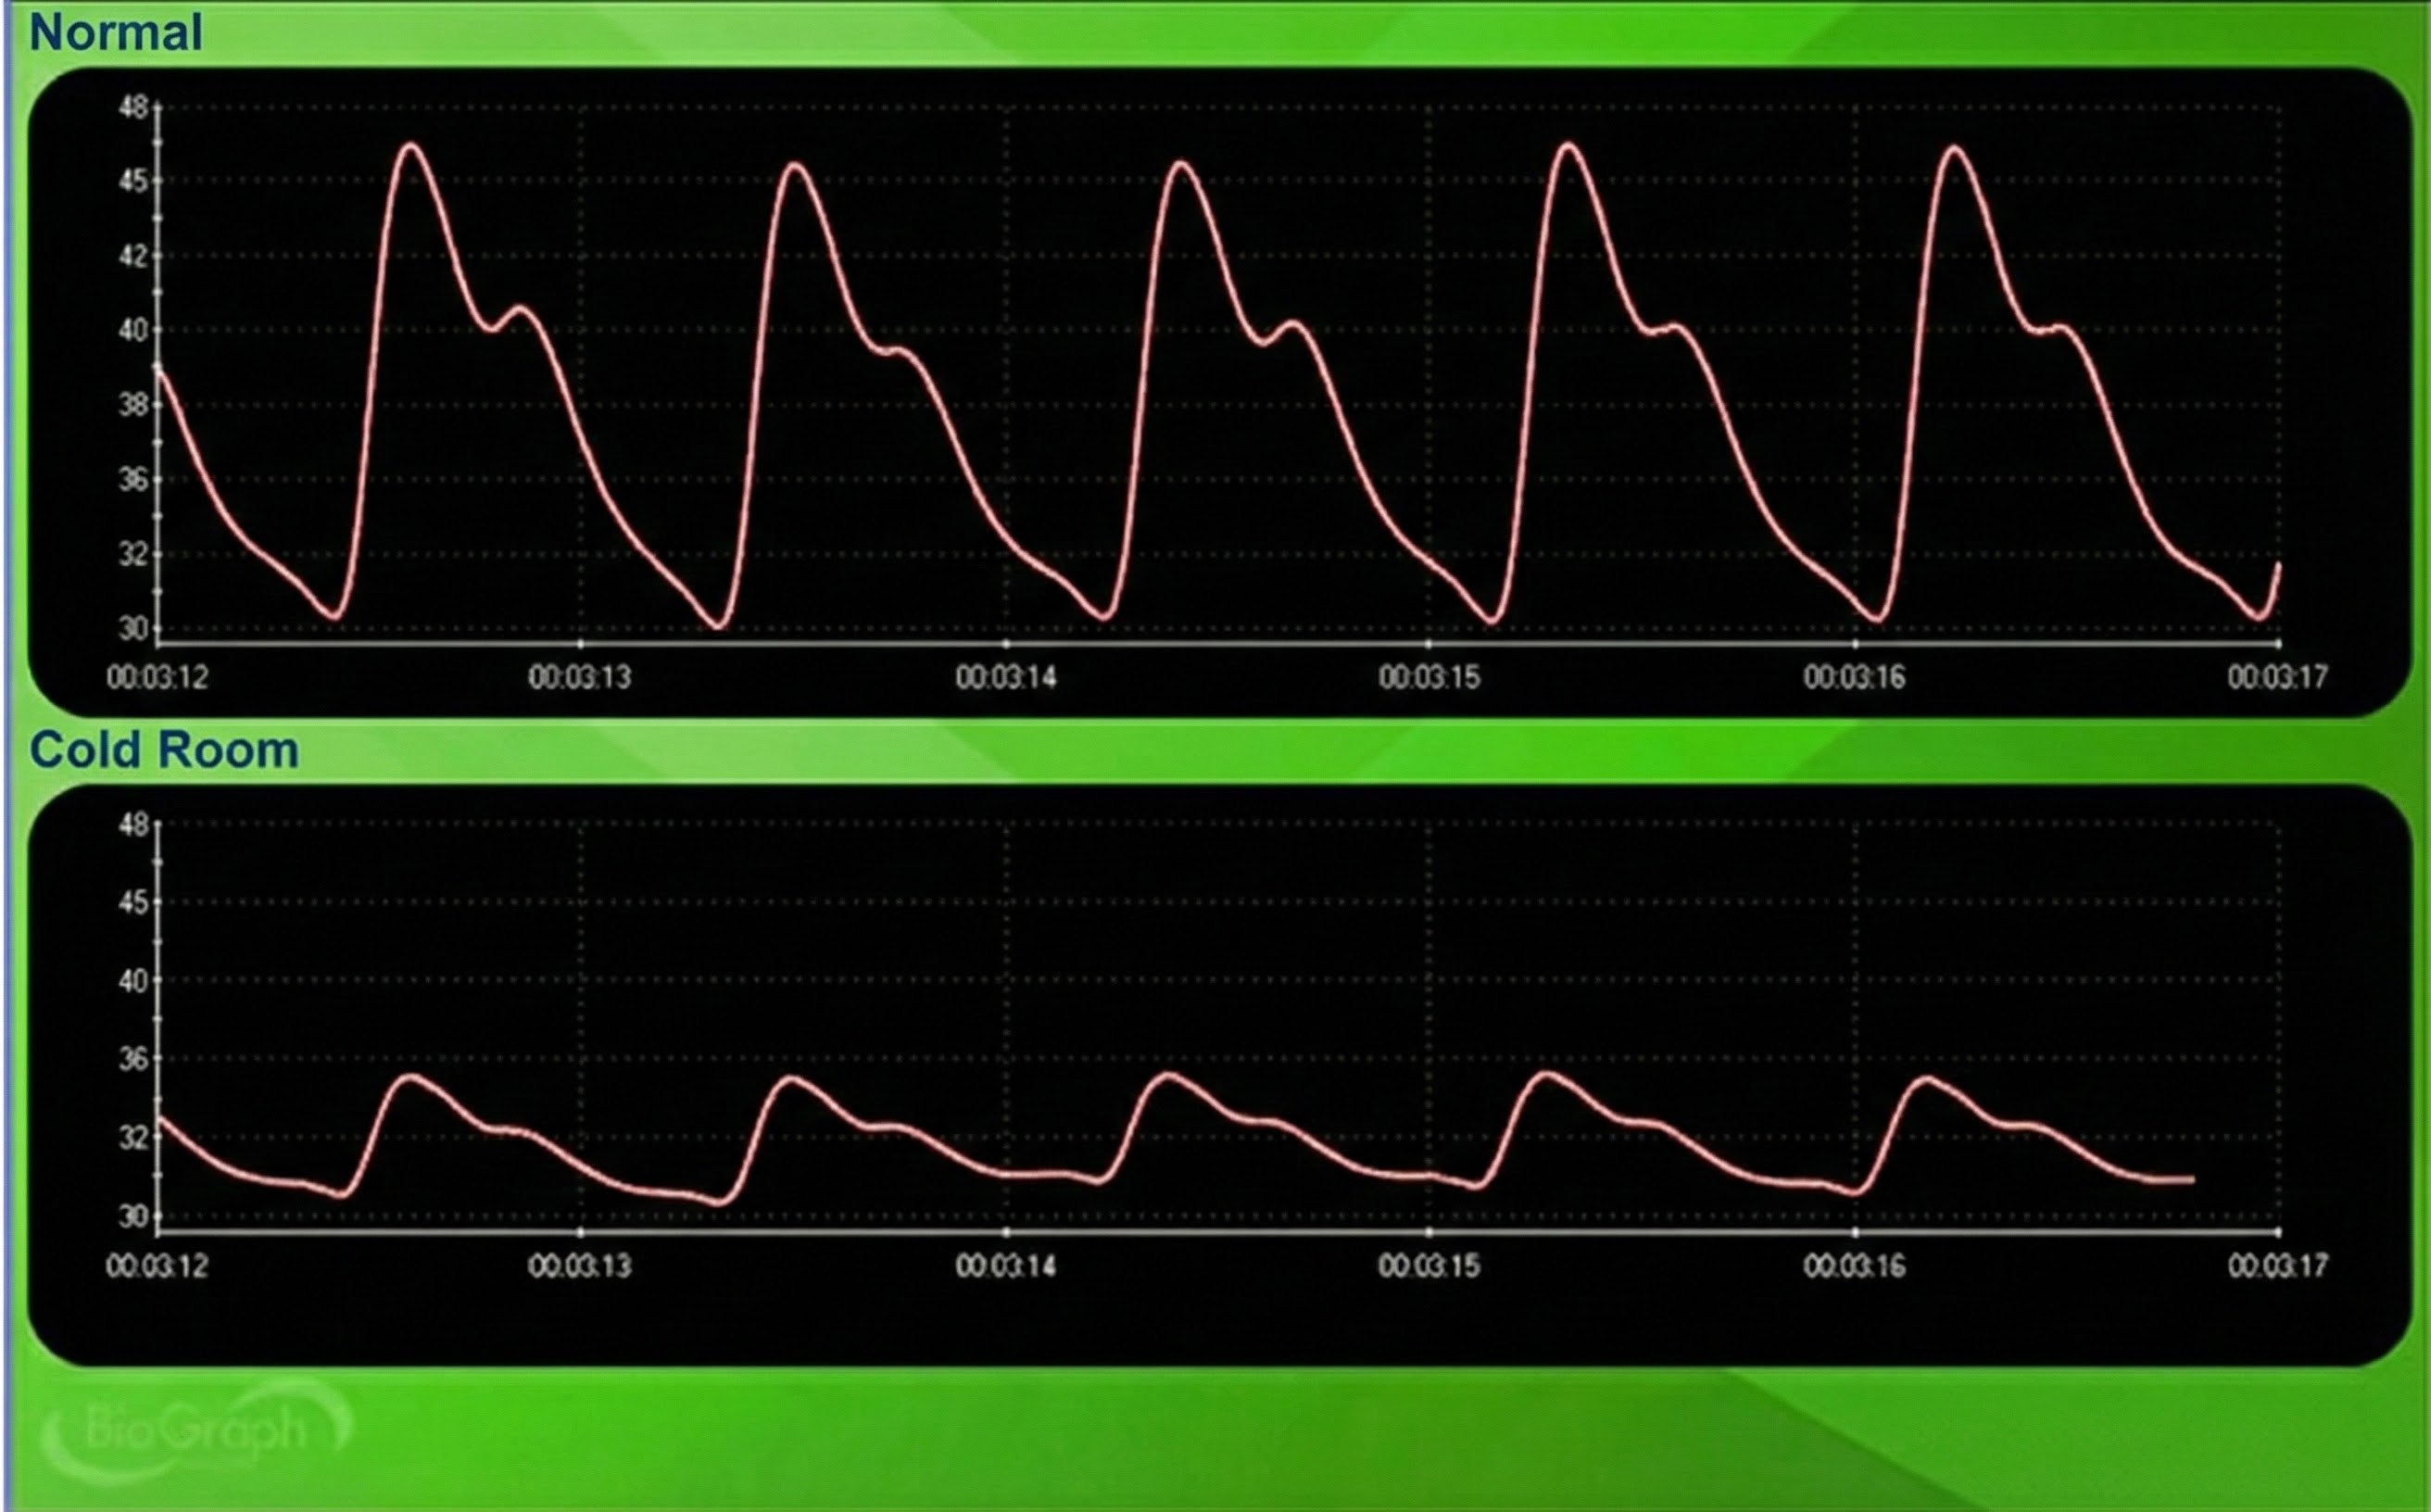
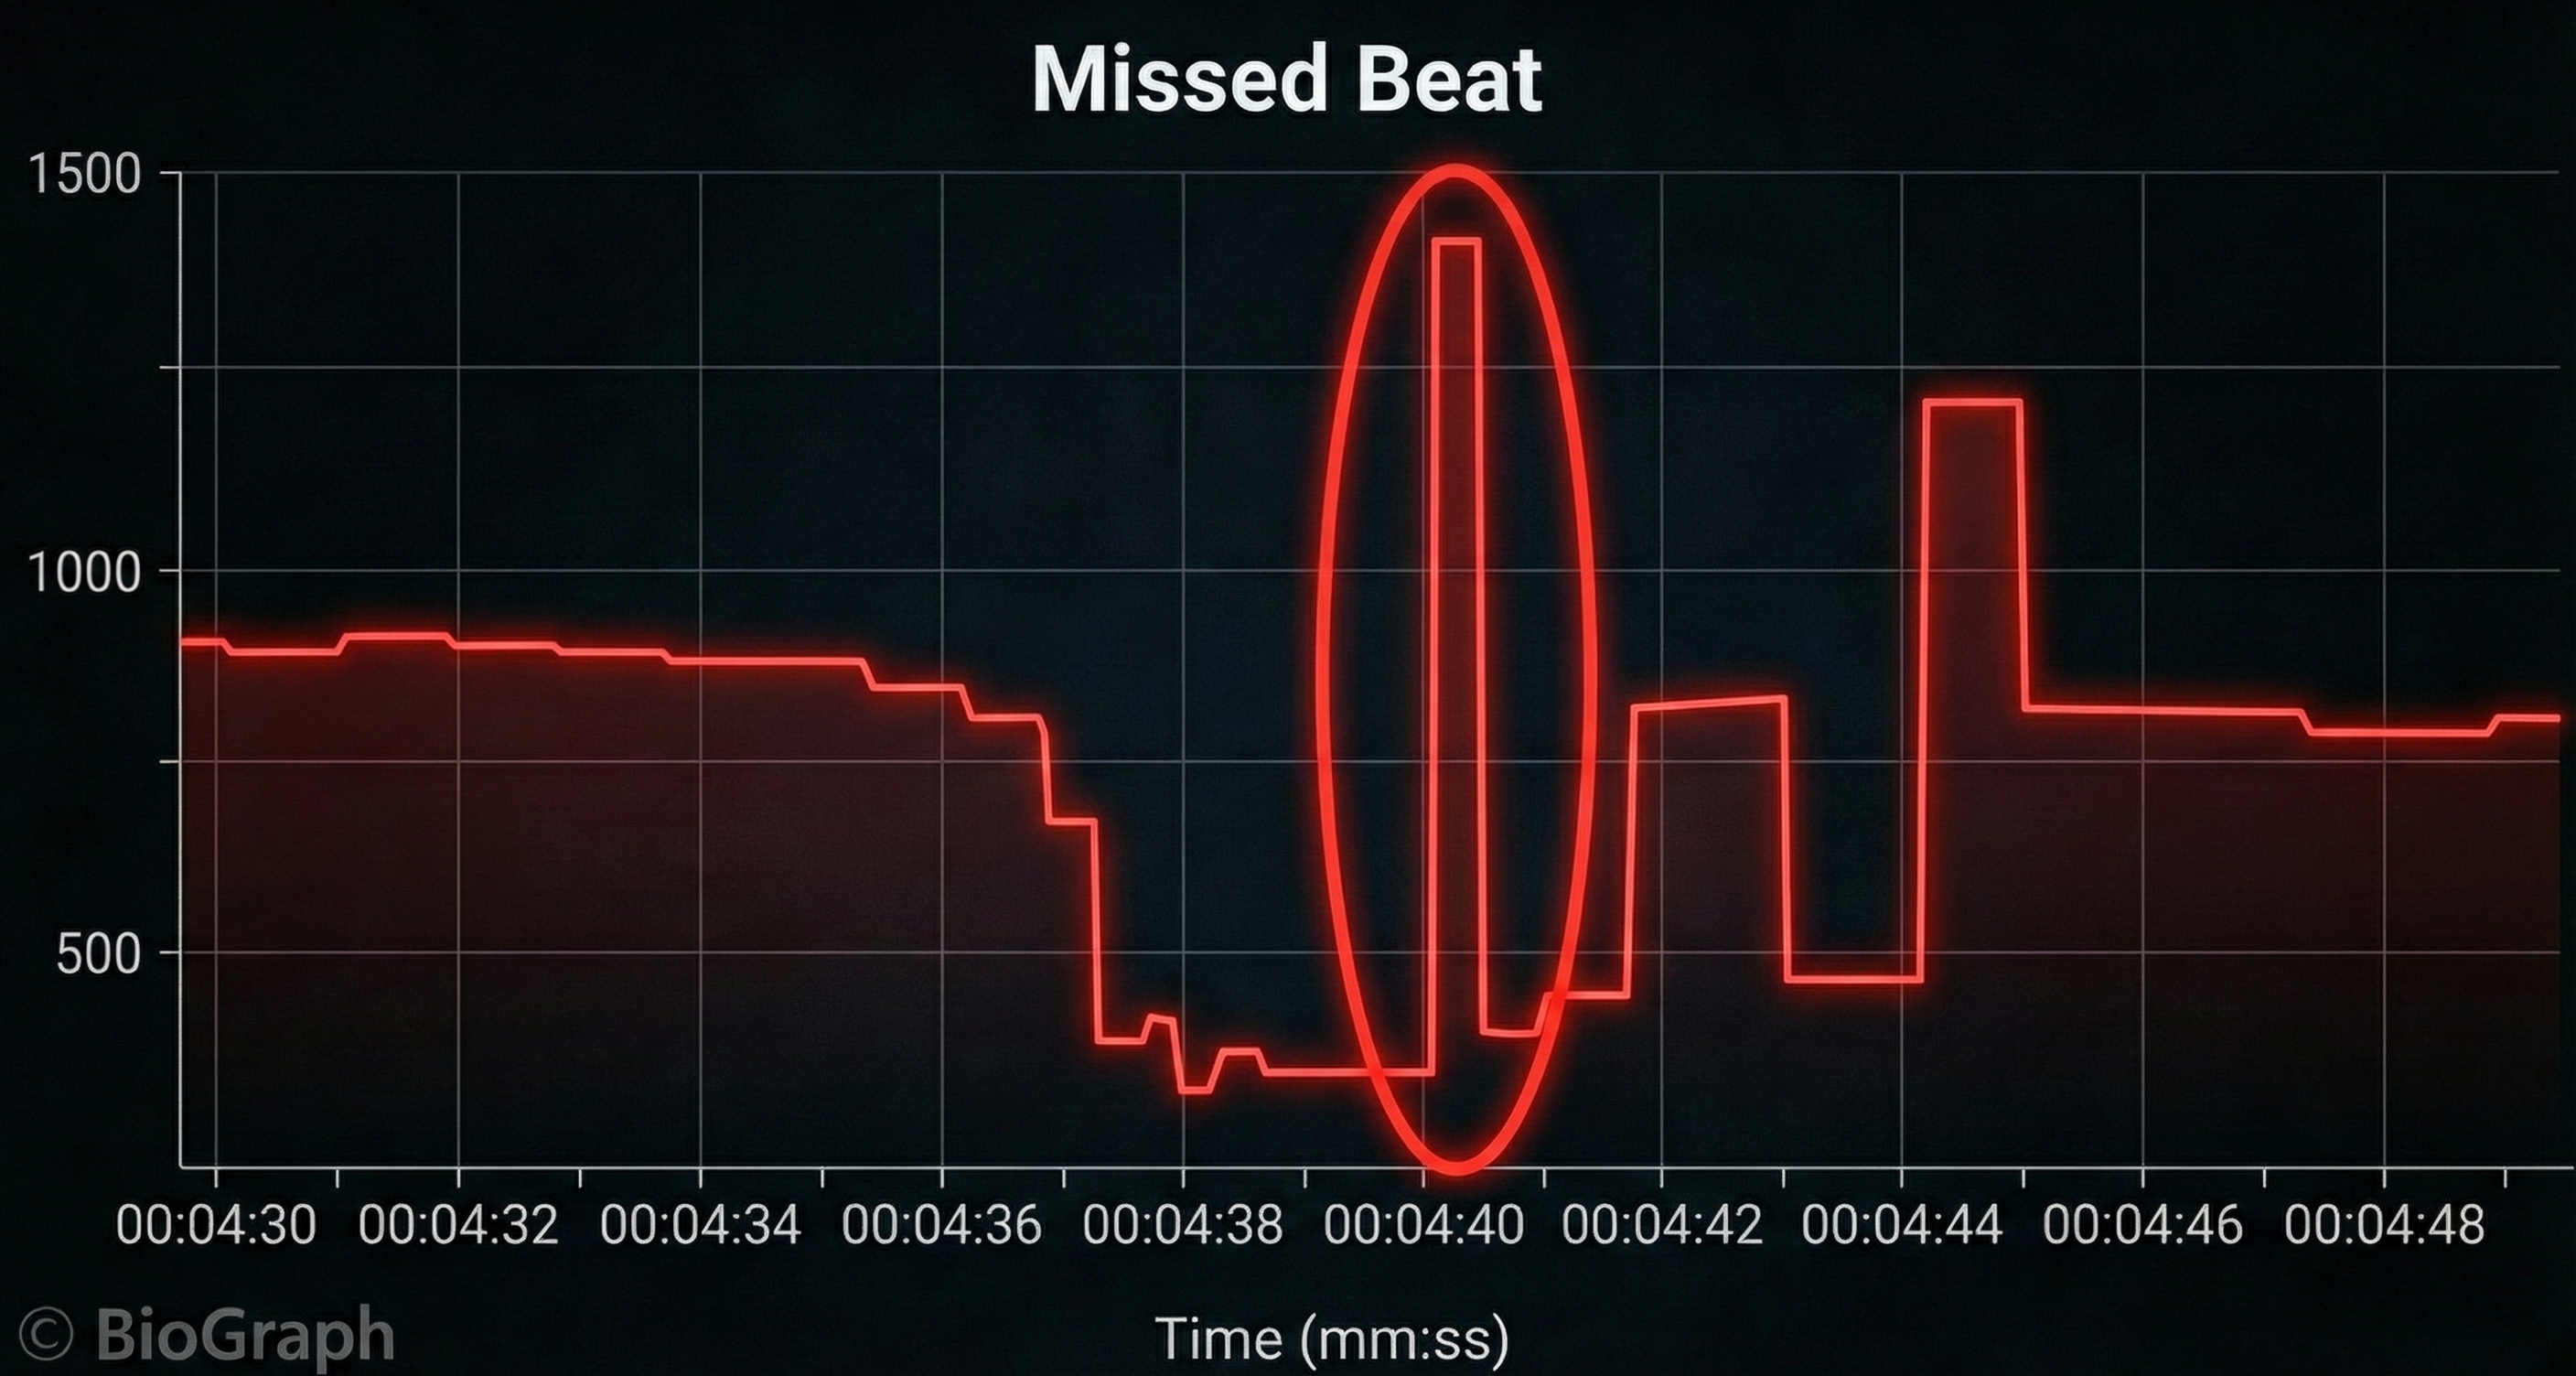
Cold artifact, produced by cold exposure or sympathetically-mediated vasoconstriction, can reduce or eliminate a pulse wave. Cold artifact may result in missed beats, resulting in artifactually-lengthened interbeat intervals (Shaffer & Combatalade, 2013).
🎧 Mini-Lecture: BVP Cold Artifact
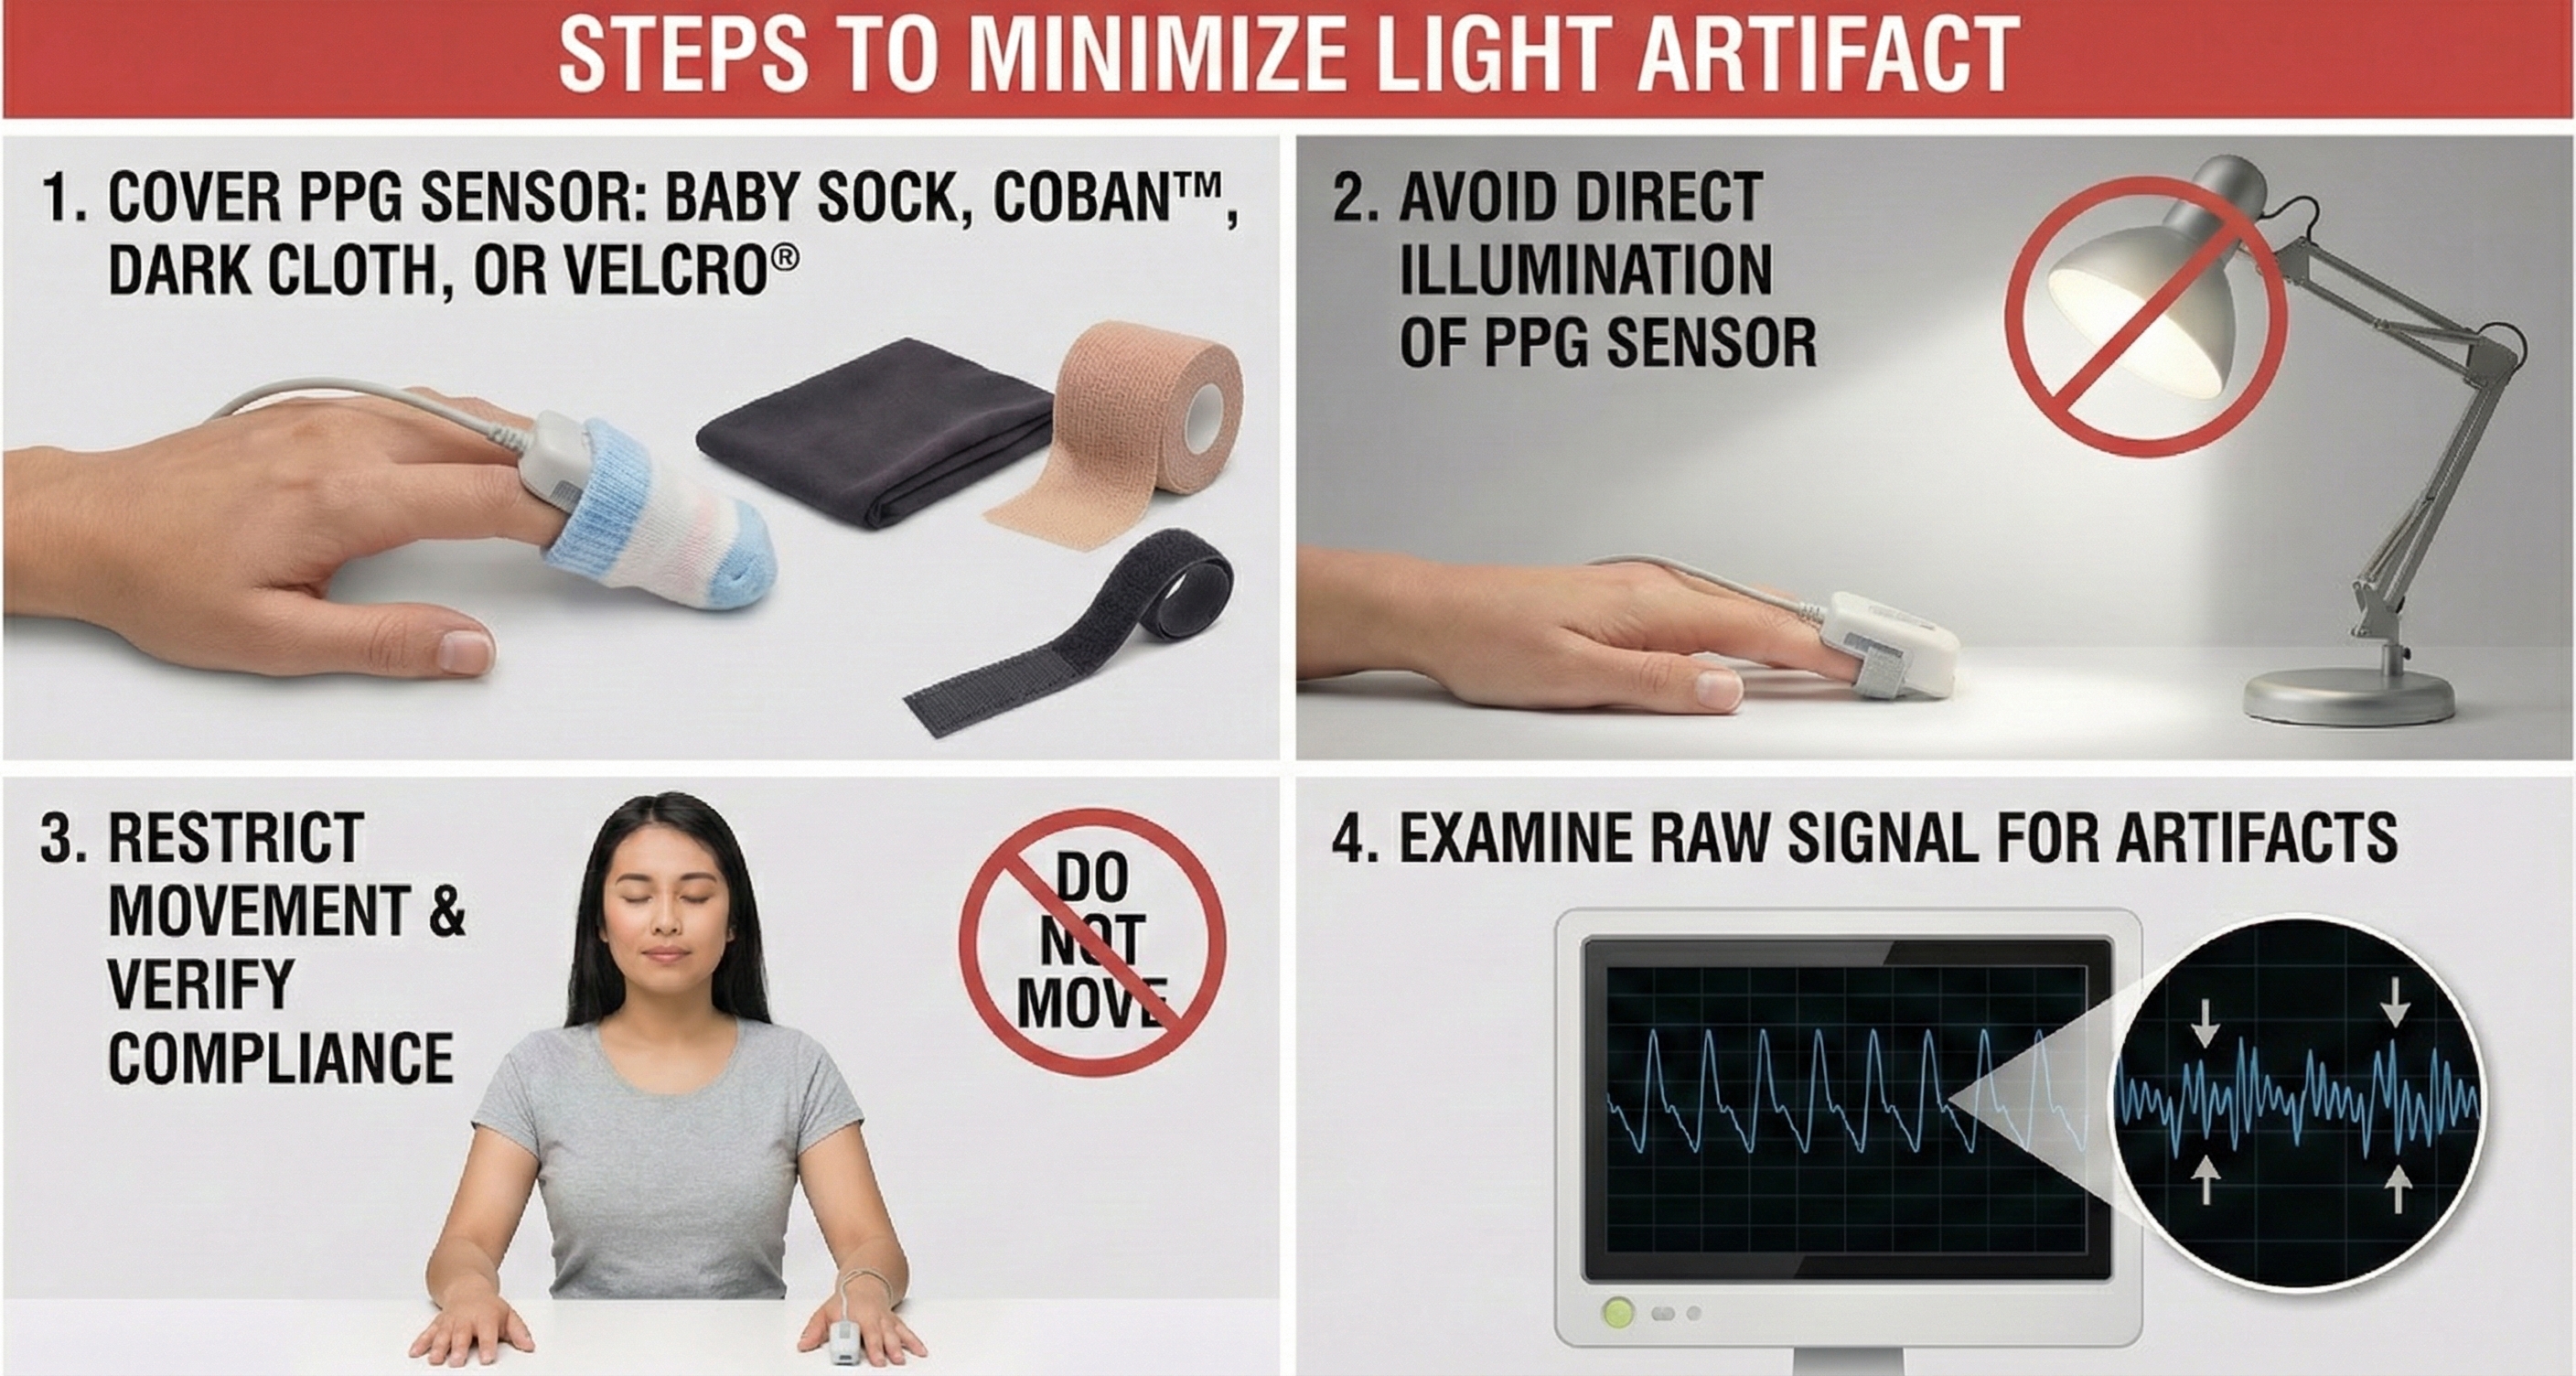
Light Artifact
Light artifact occurs when ambient light overloads a PPG sensor's photodetector producing large peak-to-trough differences (Cherif et al., 2016; Shaffer & Combatalade, 2013).
🎧 Mini-Lecture: BVP Light Artifact
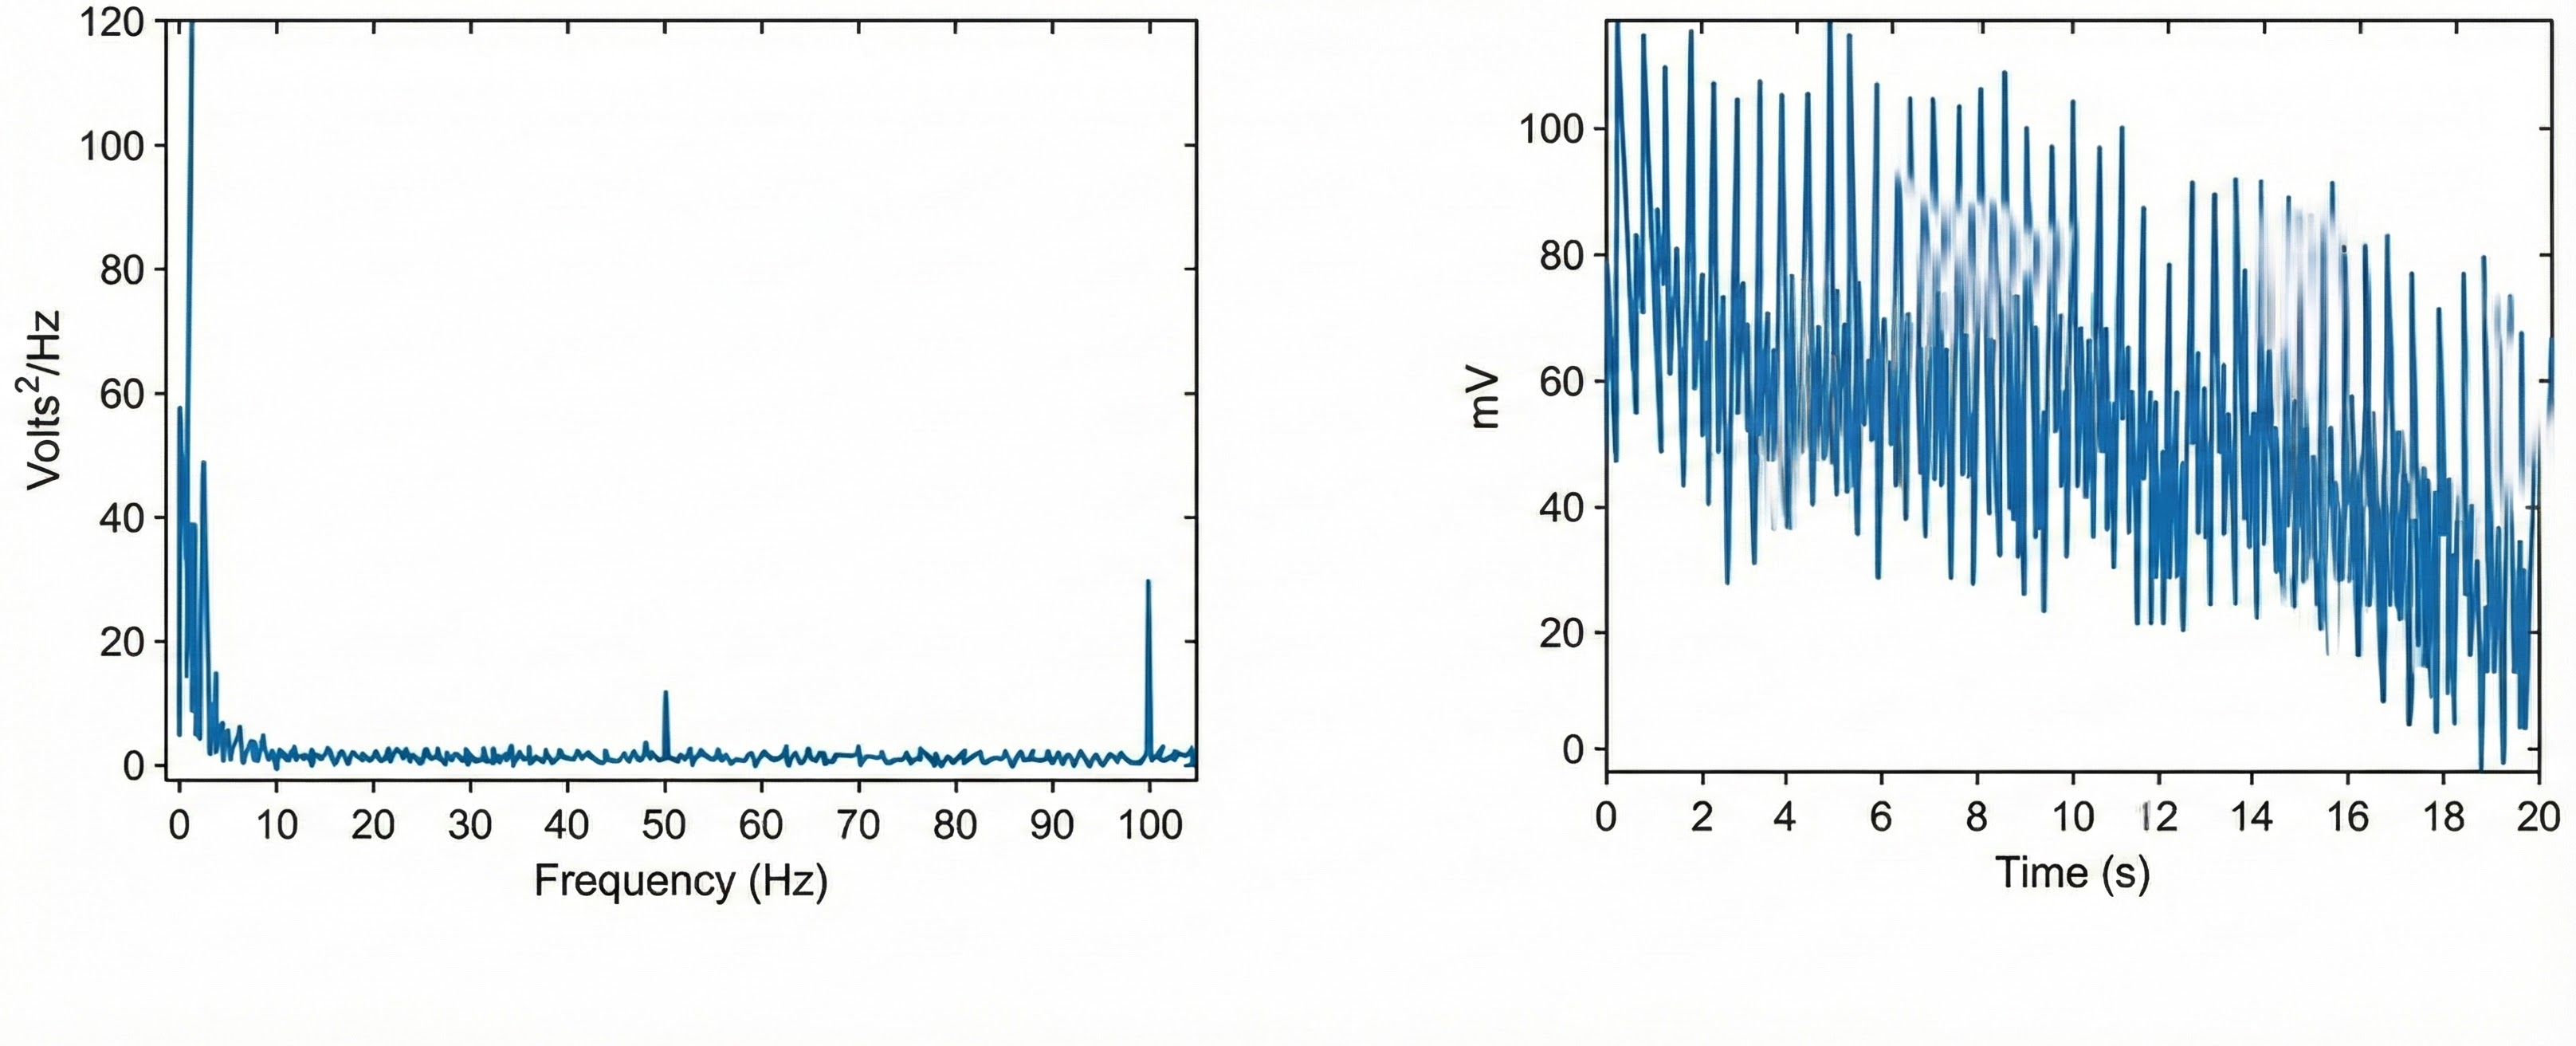
Line Interference (50/60 Hz) Artifact
Line interference artifact appears as ripples during downswings in the raw blood volume pulse signal (Elgendi, 2012; Shaffer & Combatalade, 2013).🎧 Mini-Lecture: BVP Line Interference Artifact
You won't see it if your data acquisition system filters out the high-frequency component of the raw BVP signal before displaying it. The graphic below from Elgendi shows a 50-Hz peak and 100-Hz harmonic (left) and contamination of the raw BVP signal (right).
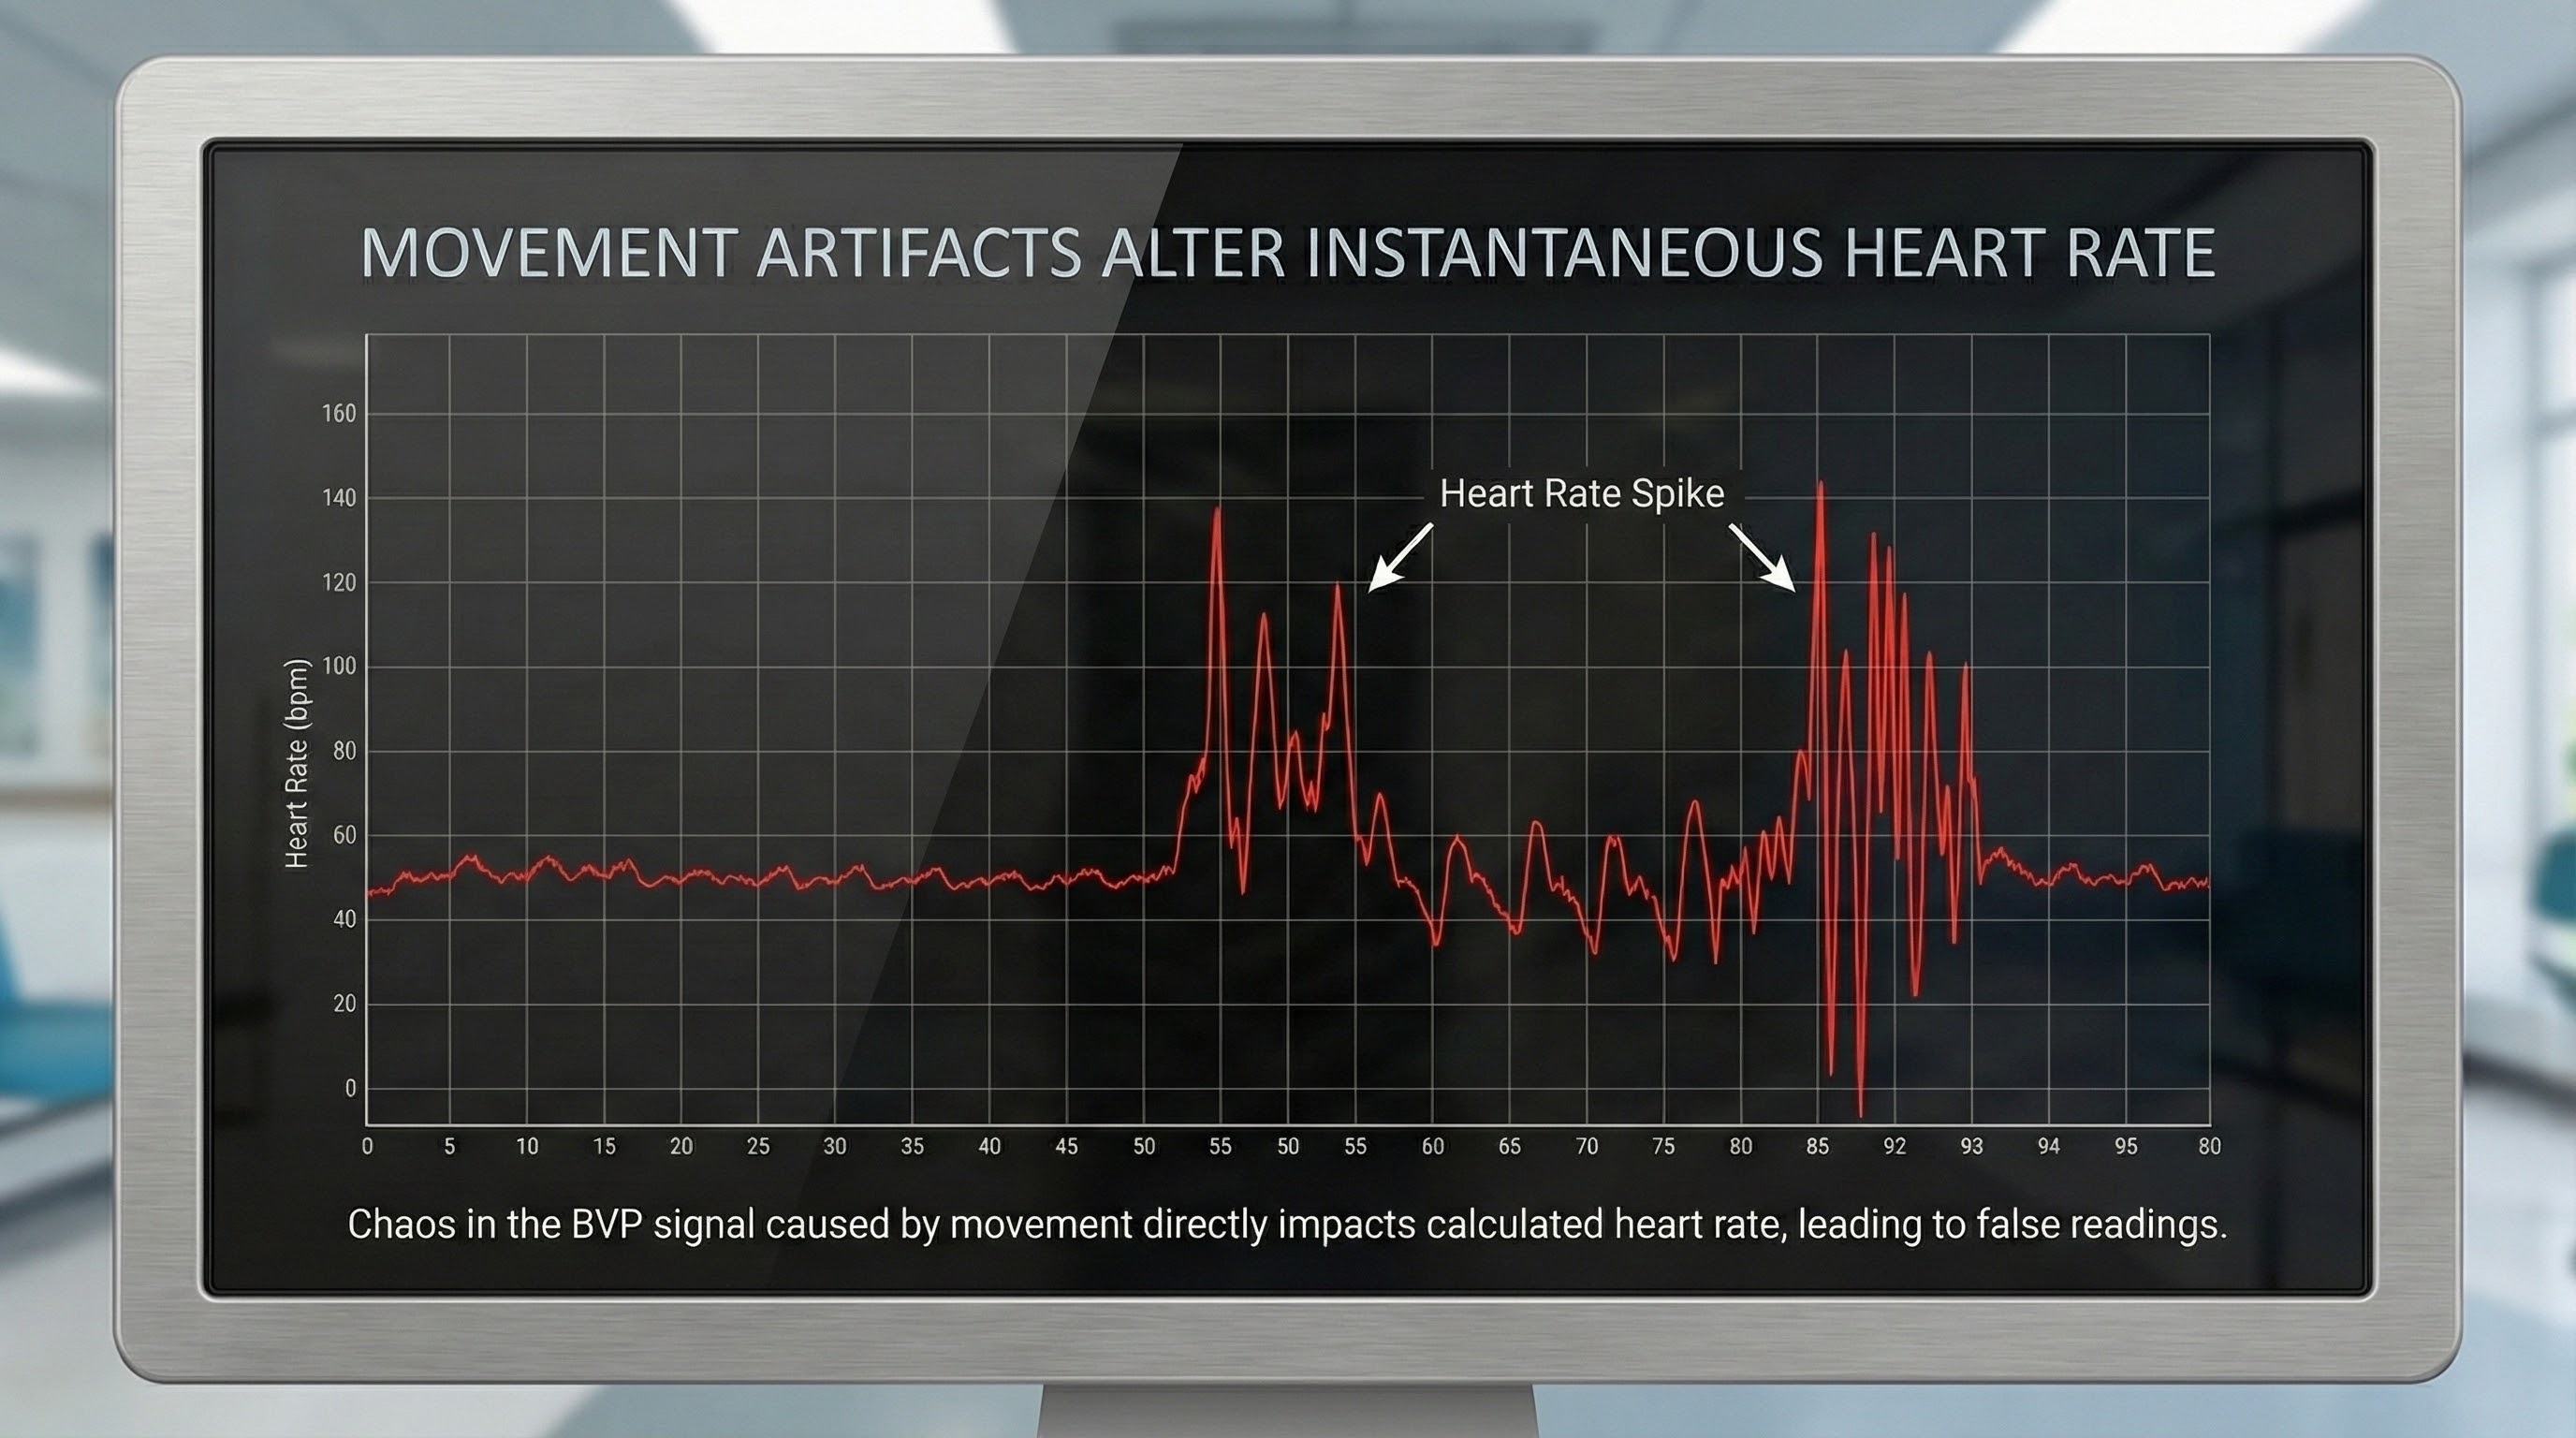
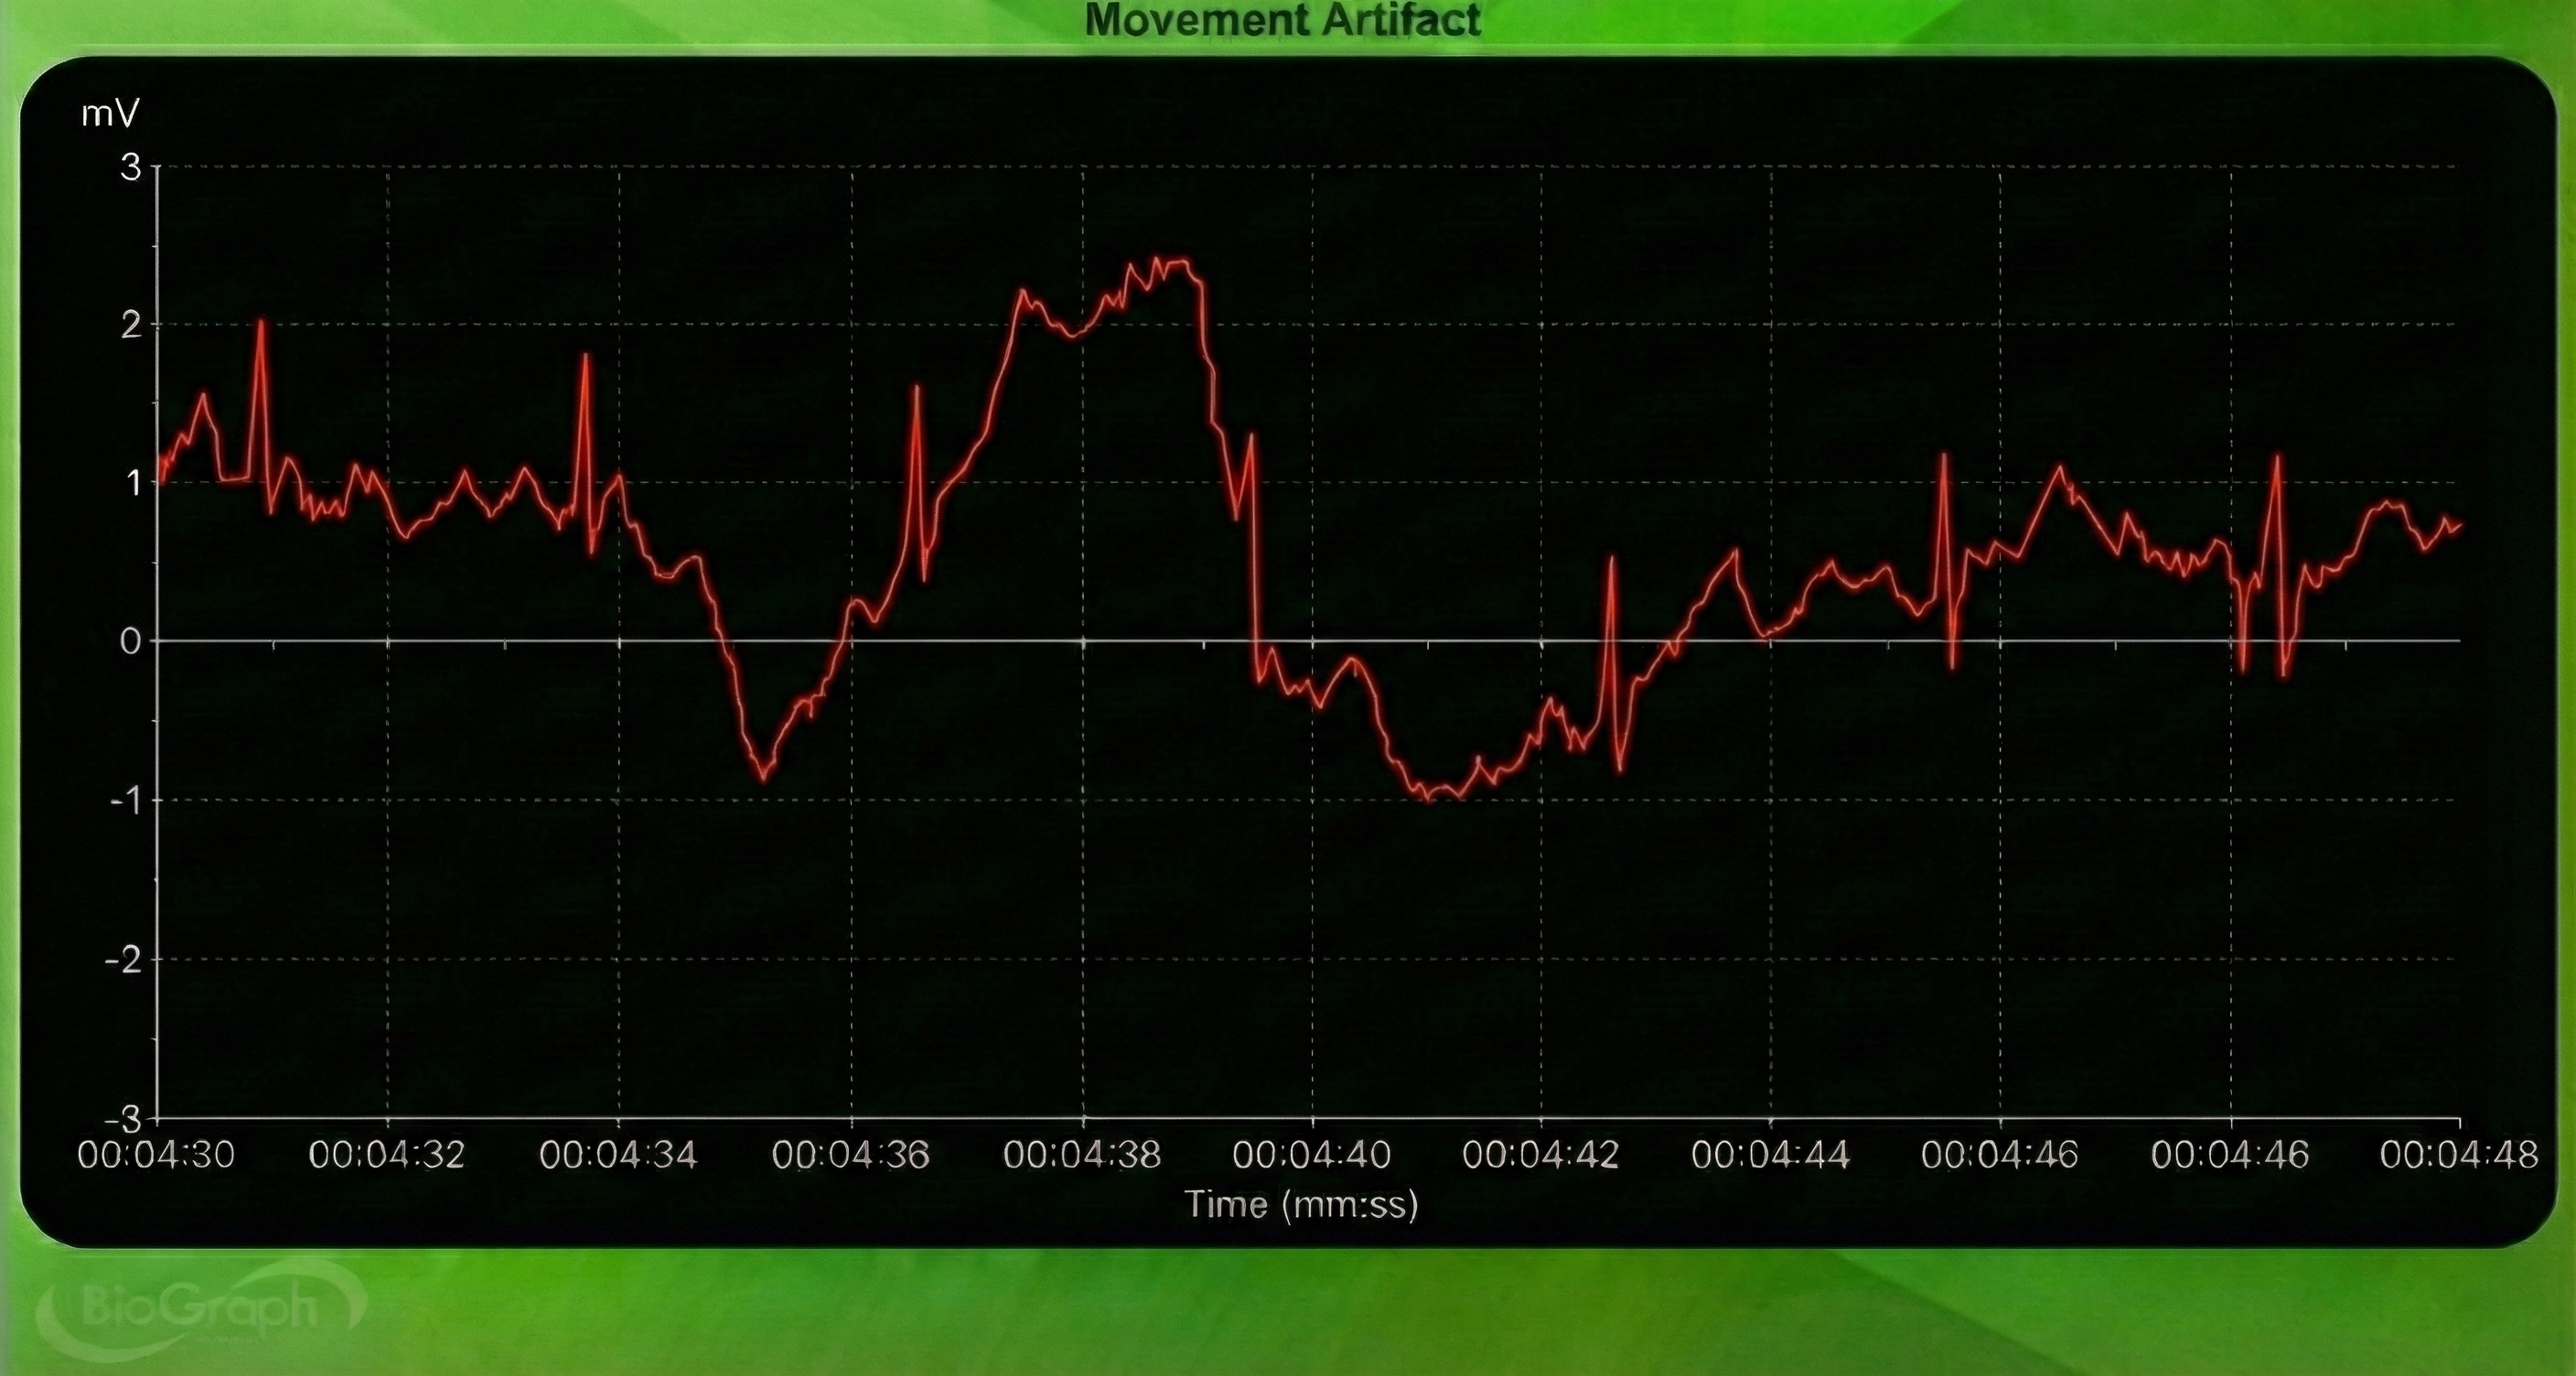
Movement Artifact
Sensor movement artifact is the leading cause of BVP signal distortion and can eliminate the signal or result in extra or missed beats (Elgendi, 2012; Shaffer & Combatalade, 2013).
🎧 Mini-Lecture: BVP Movement Artifact
Sensor movement can interfere with infrared light transmission by the PPG sensor or allow contamination by ambient light.

Movement artifacts are colored red in this graphic by Couceiro et al. (2014).
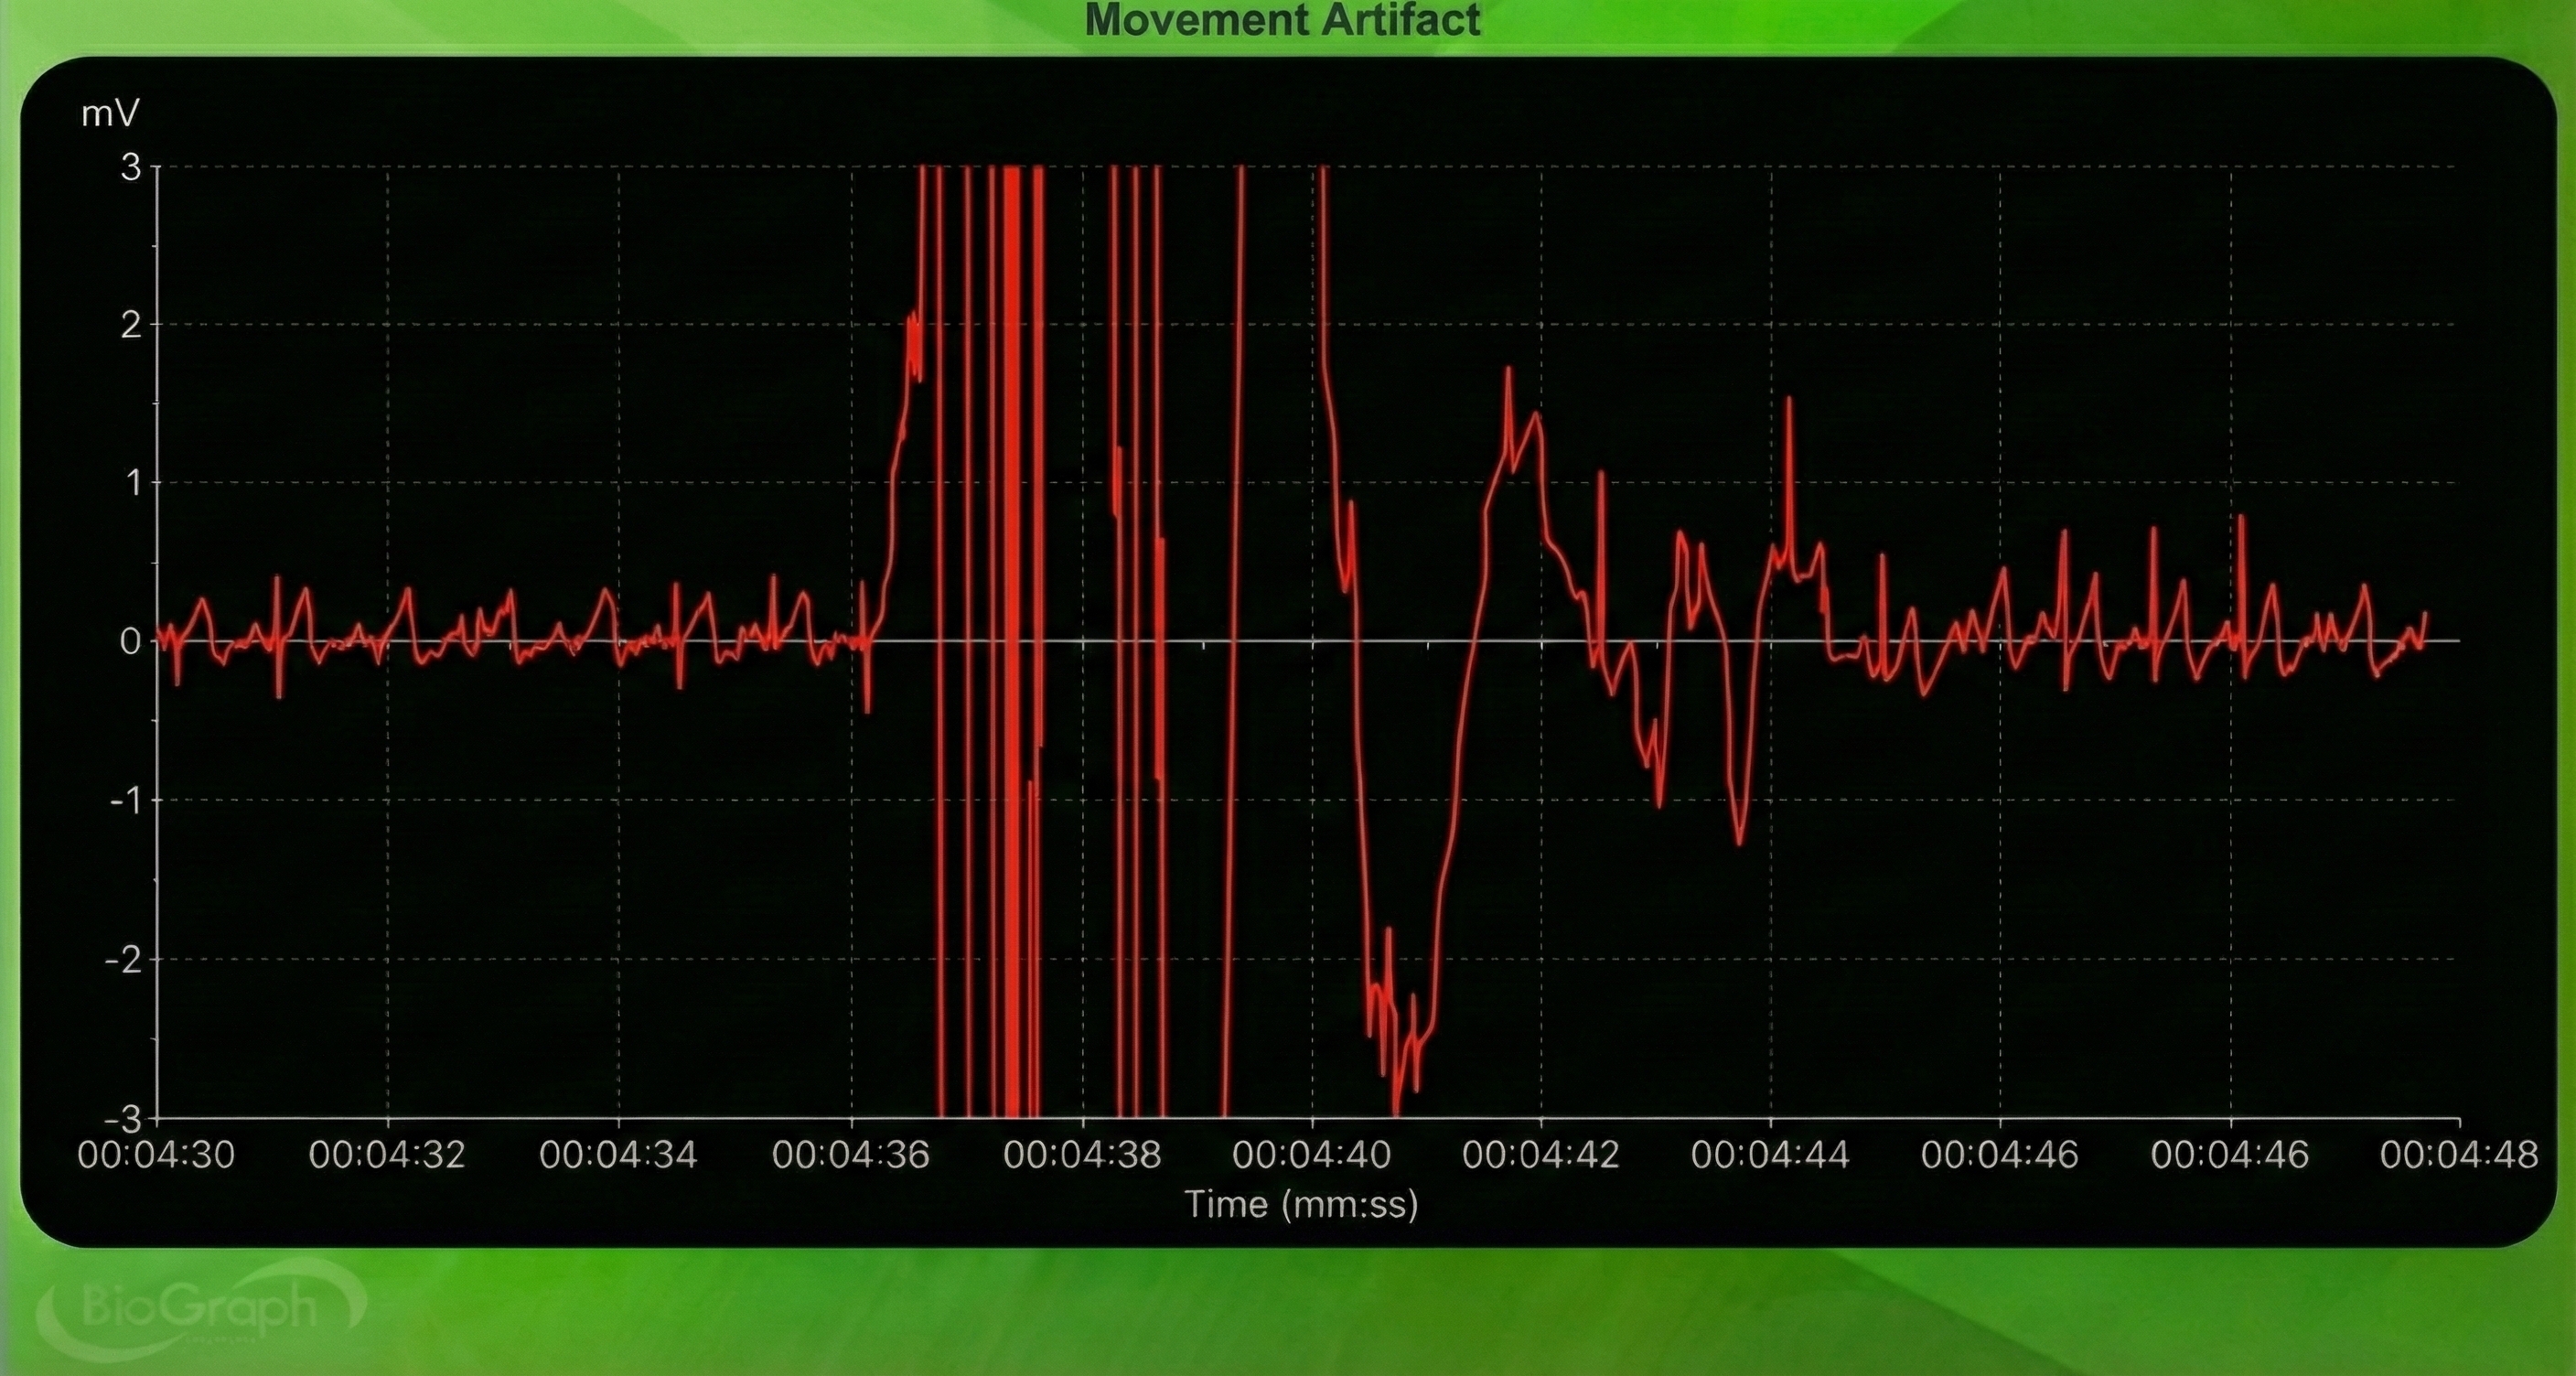
Inspection of the raw BVP can detect movement artifacts. Below is a BioGraph ® Infiniti BVP display of movement artifacts. Note the appearance of ripples and distortion in the shape of the waveform.
Movement artifacts can distort the BVP waveform in different ways.
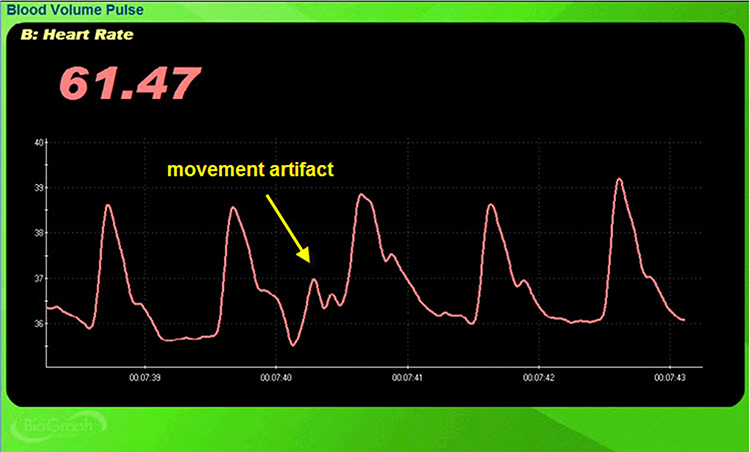
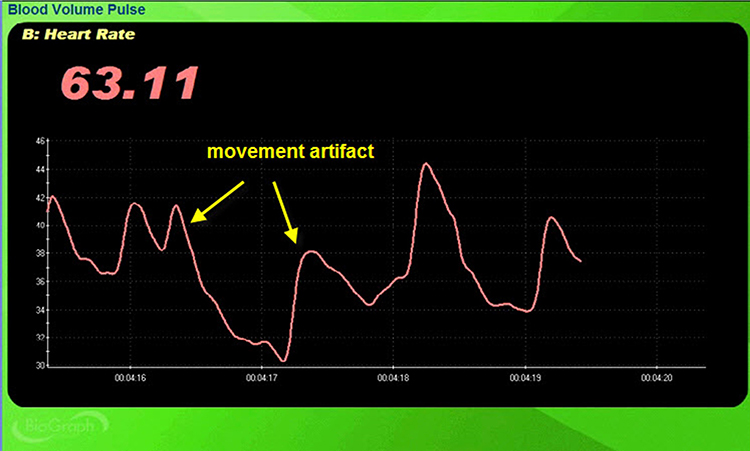
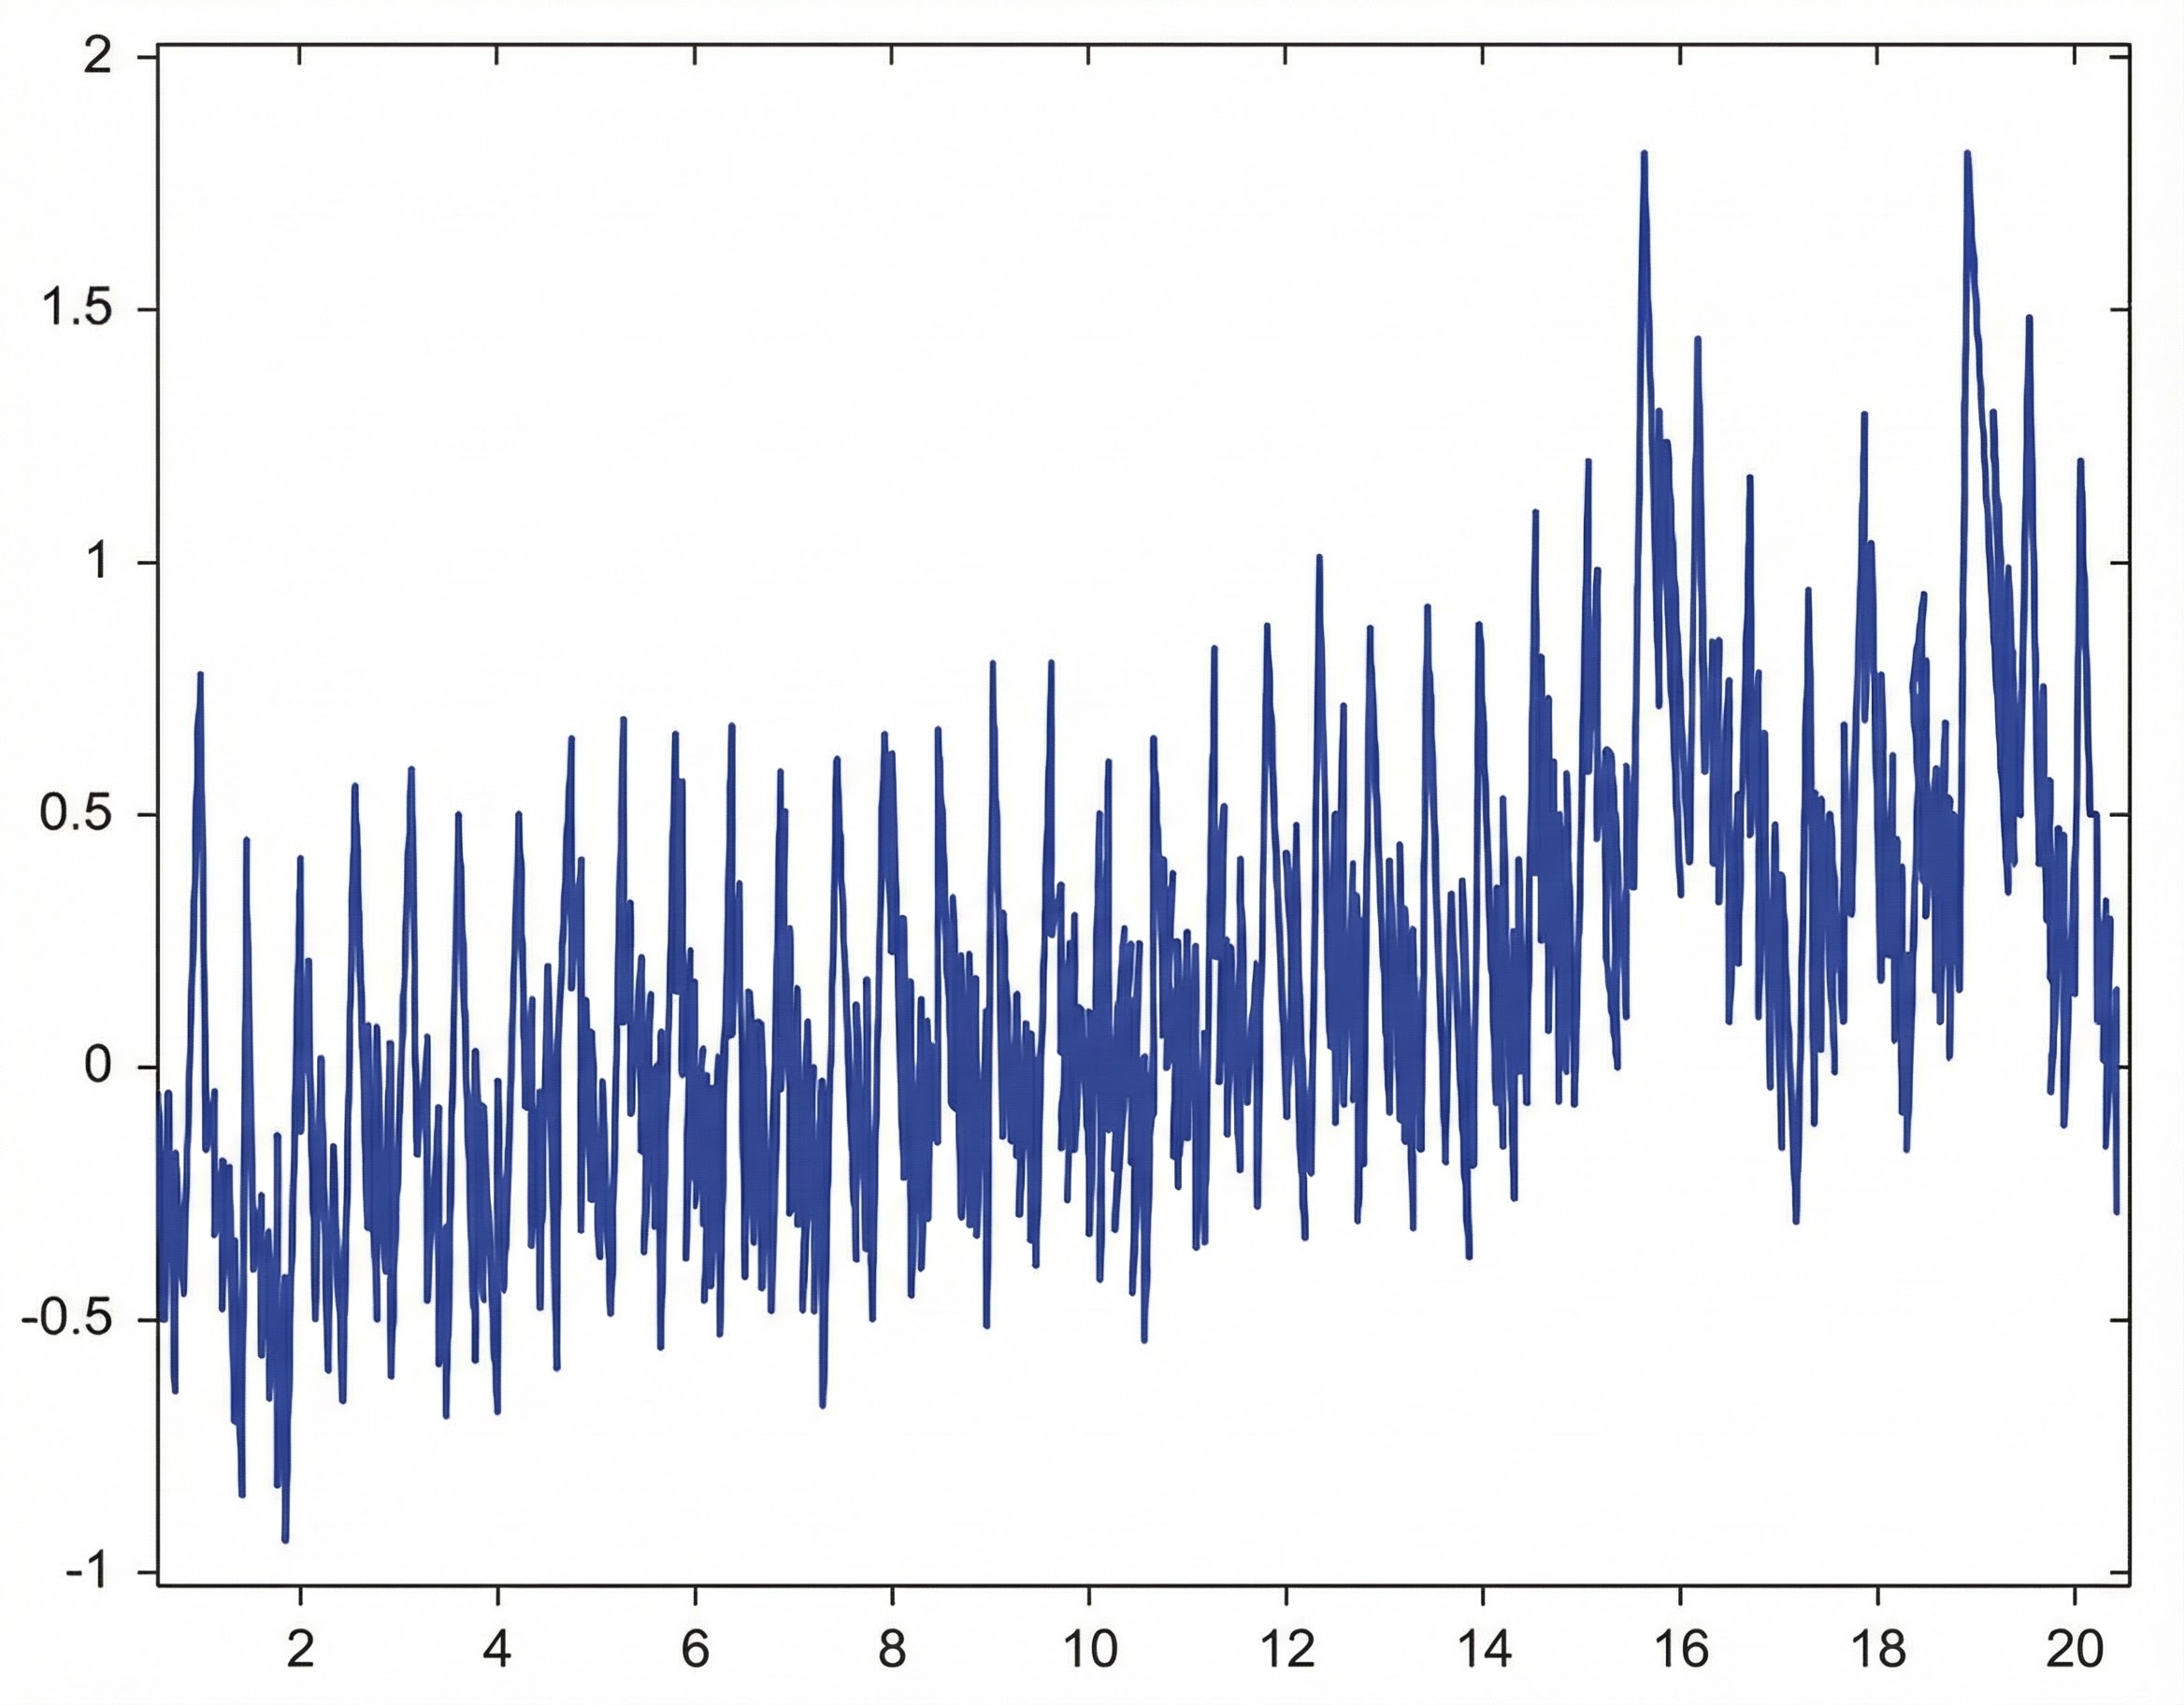
Standing and sitting can produce blood pressure-mediated upward and downward drifts. Arm movement above or below the heart can also generate drifts.
Repeated movements like finger tapping can create waveforms with ripples that resemble multiple notches.
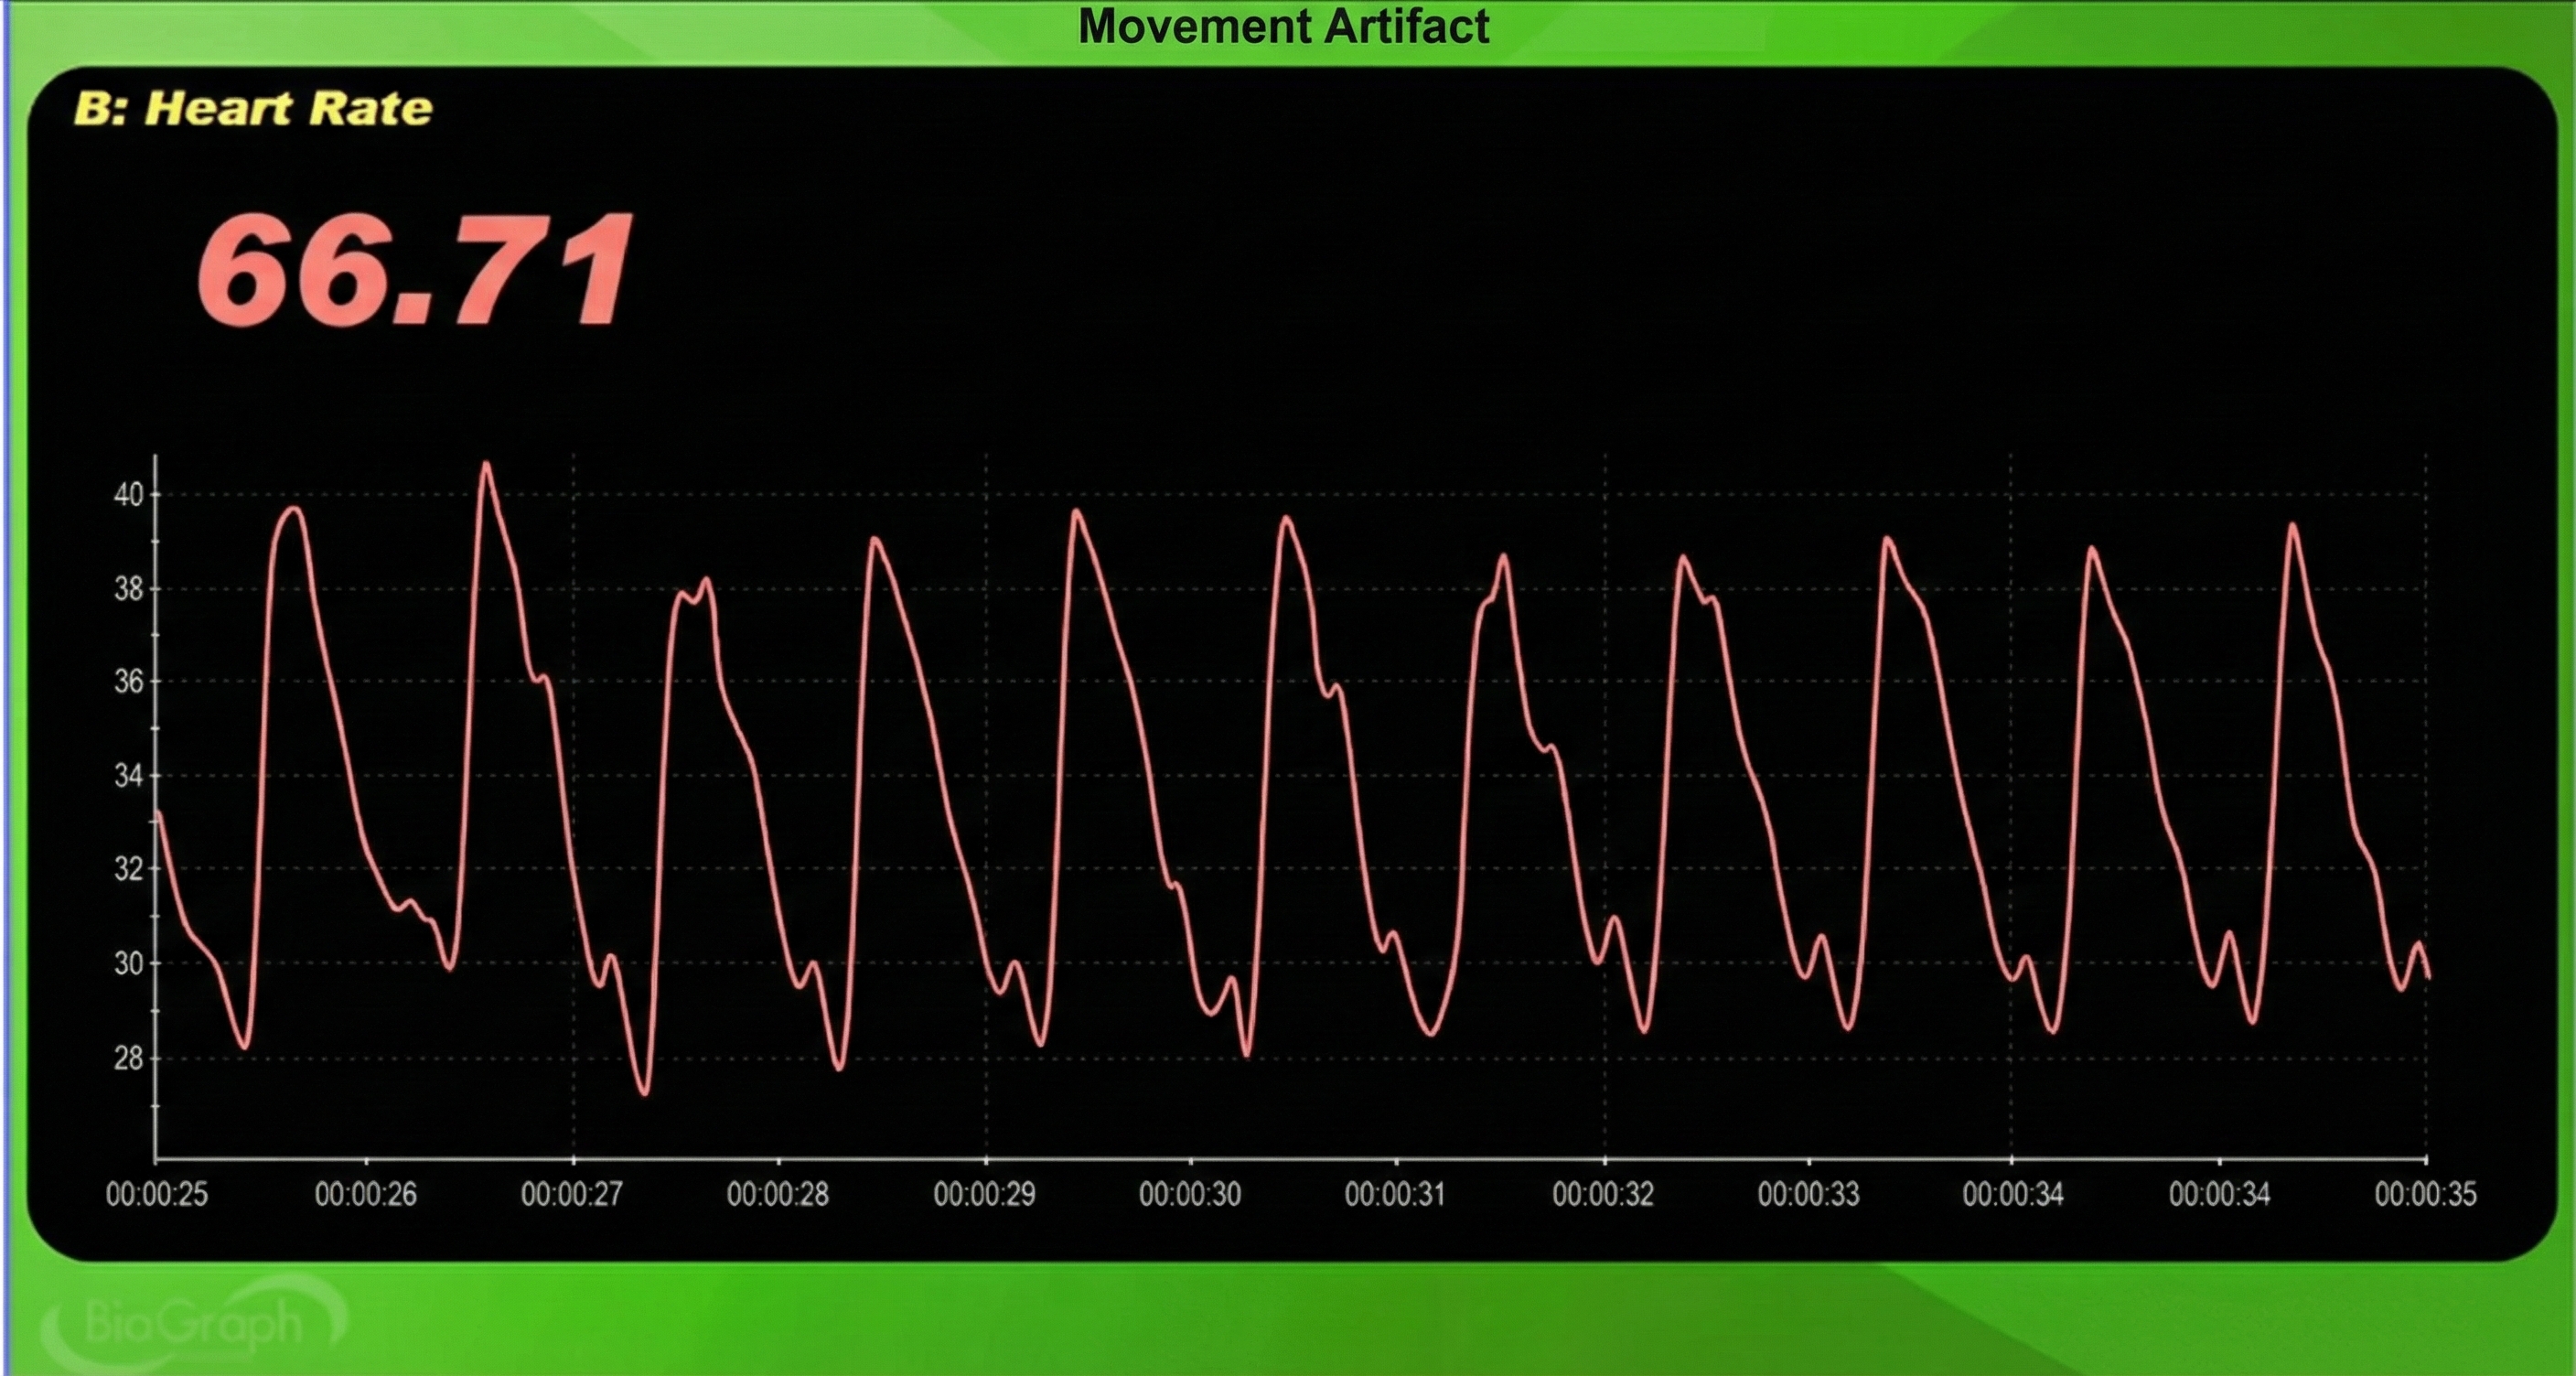
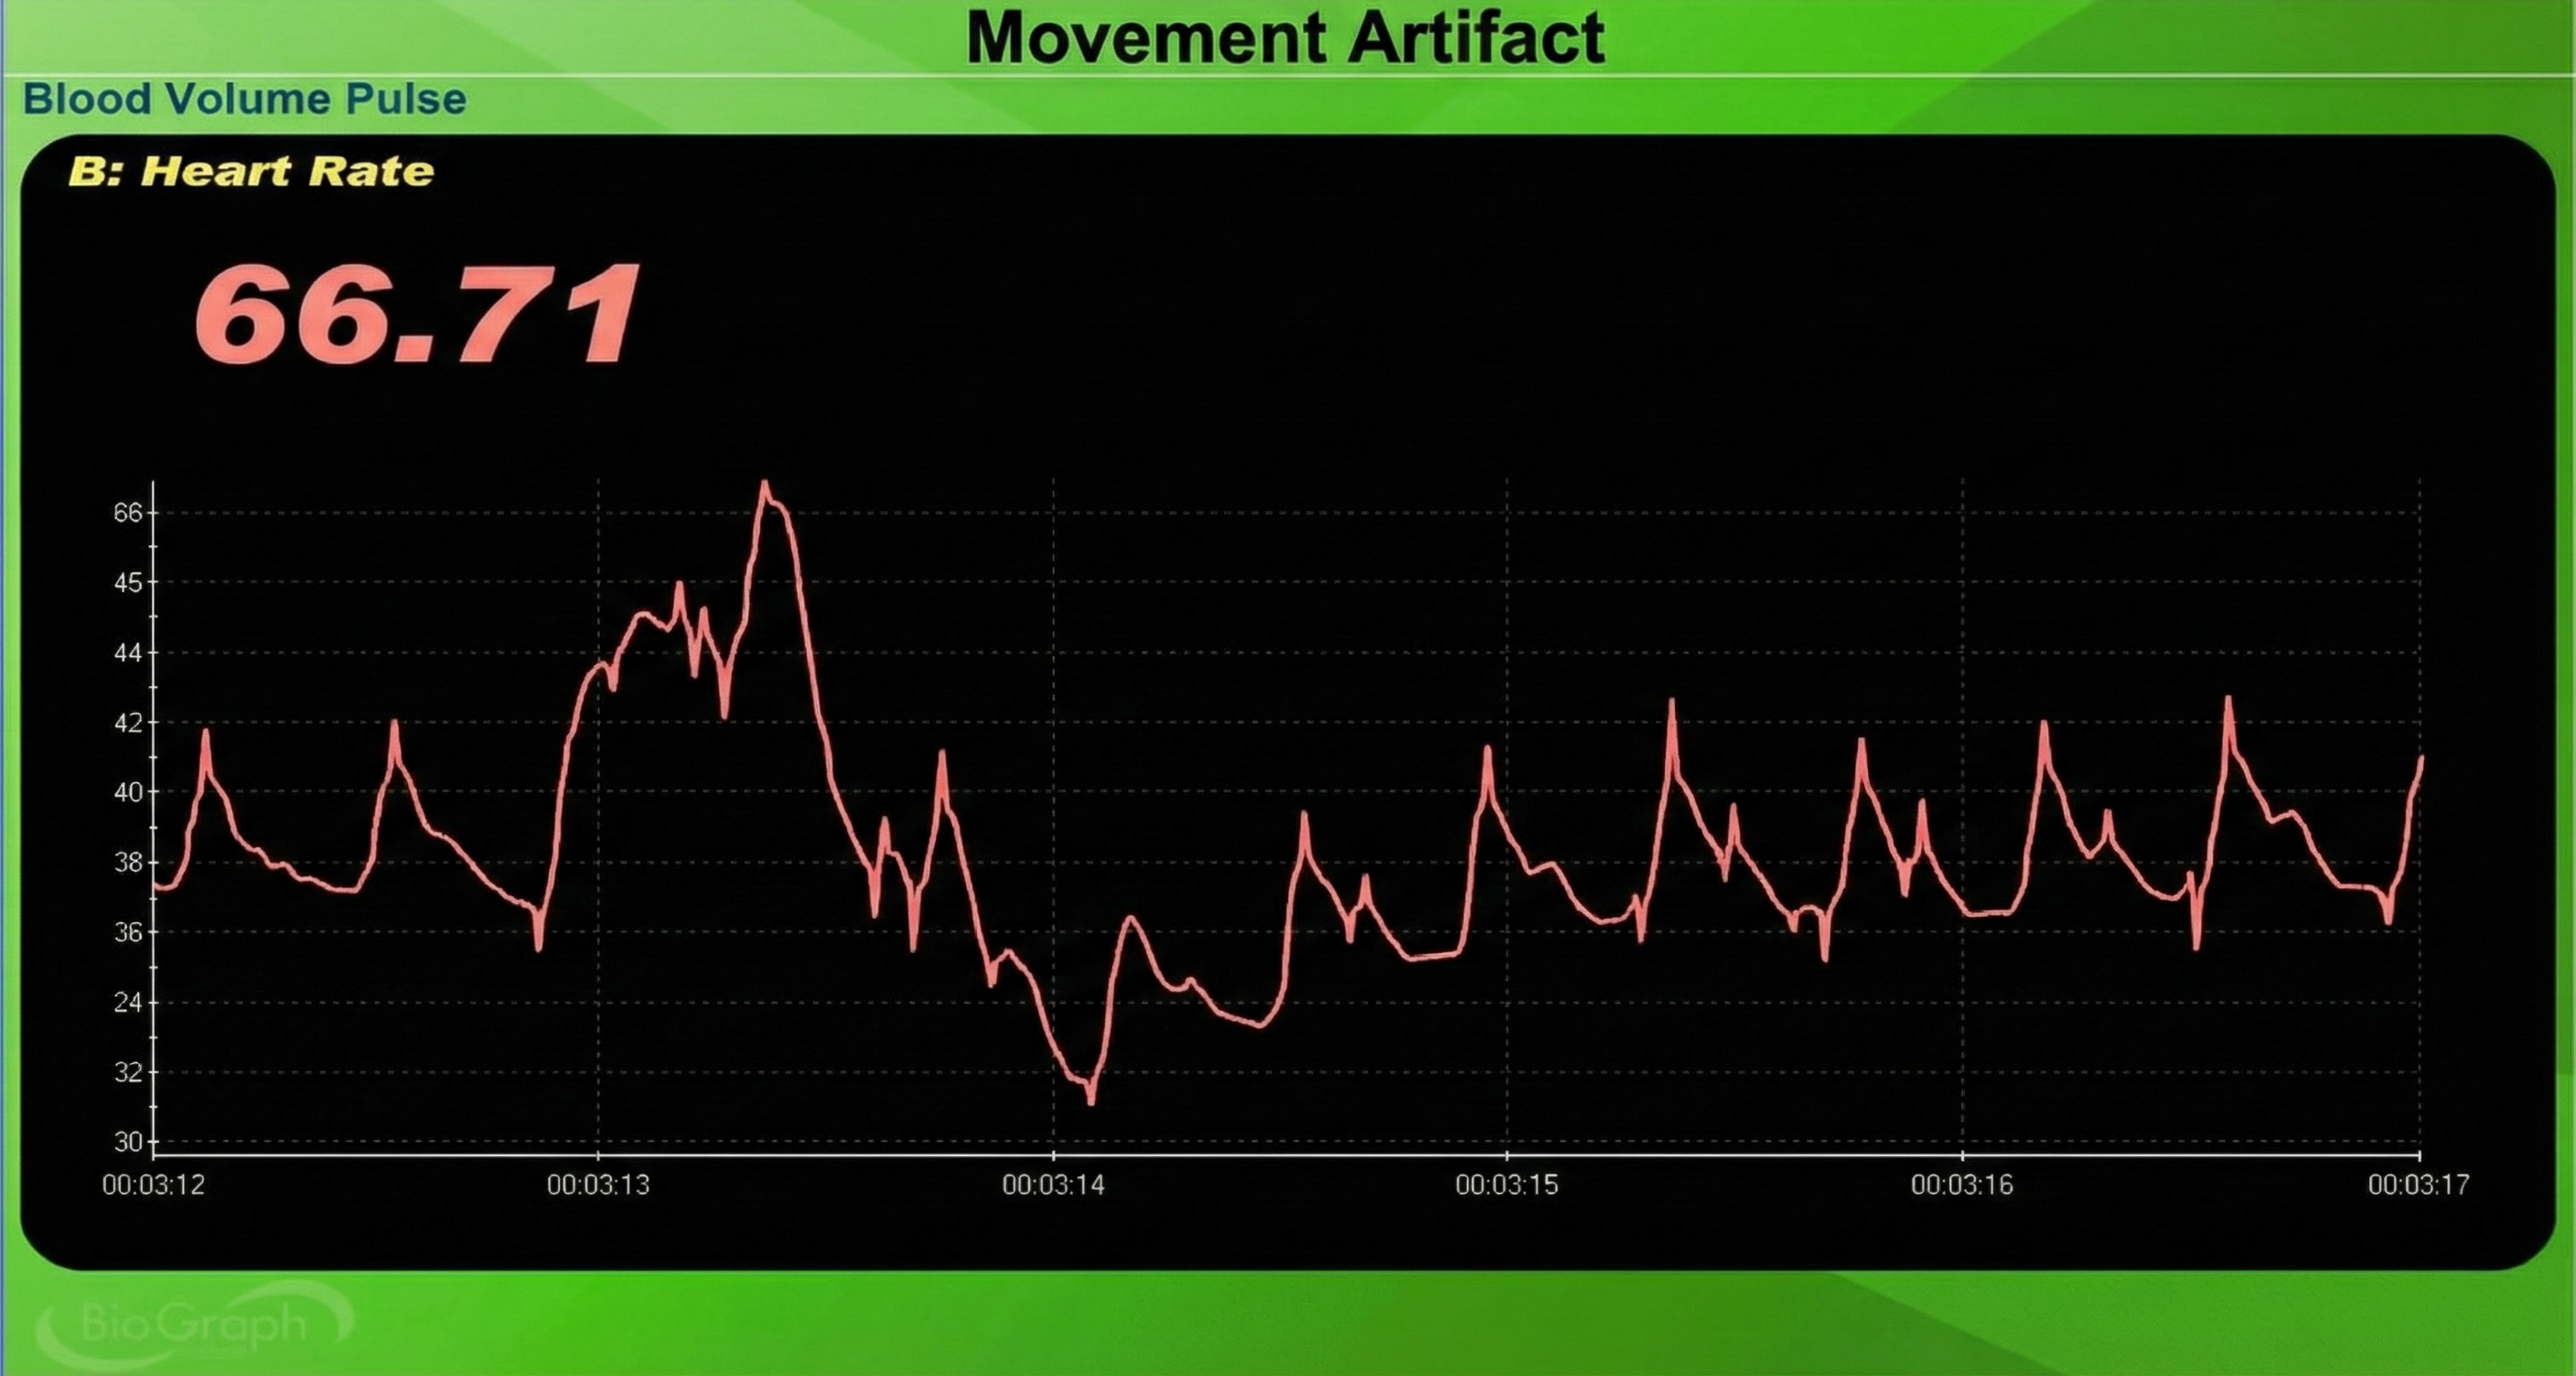
The display may show sudden changes in the raw BVP signal and HR.
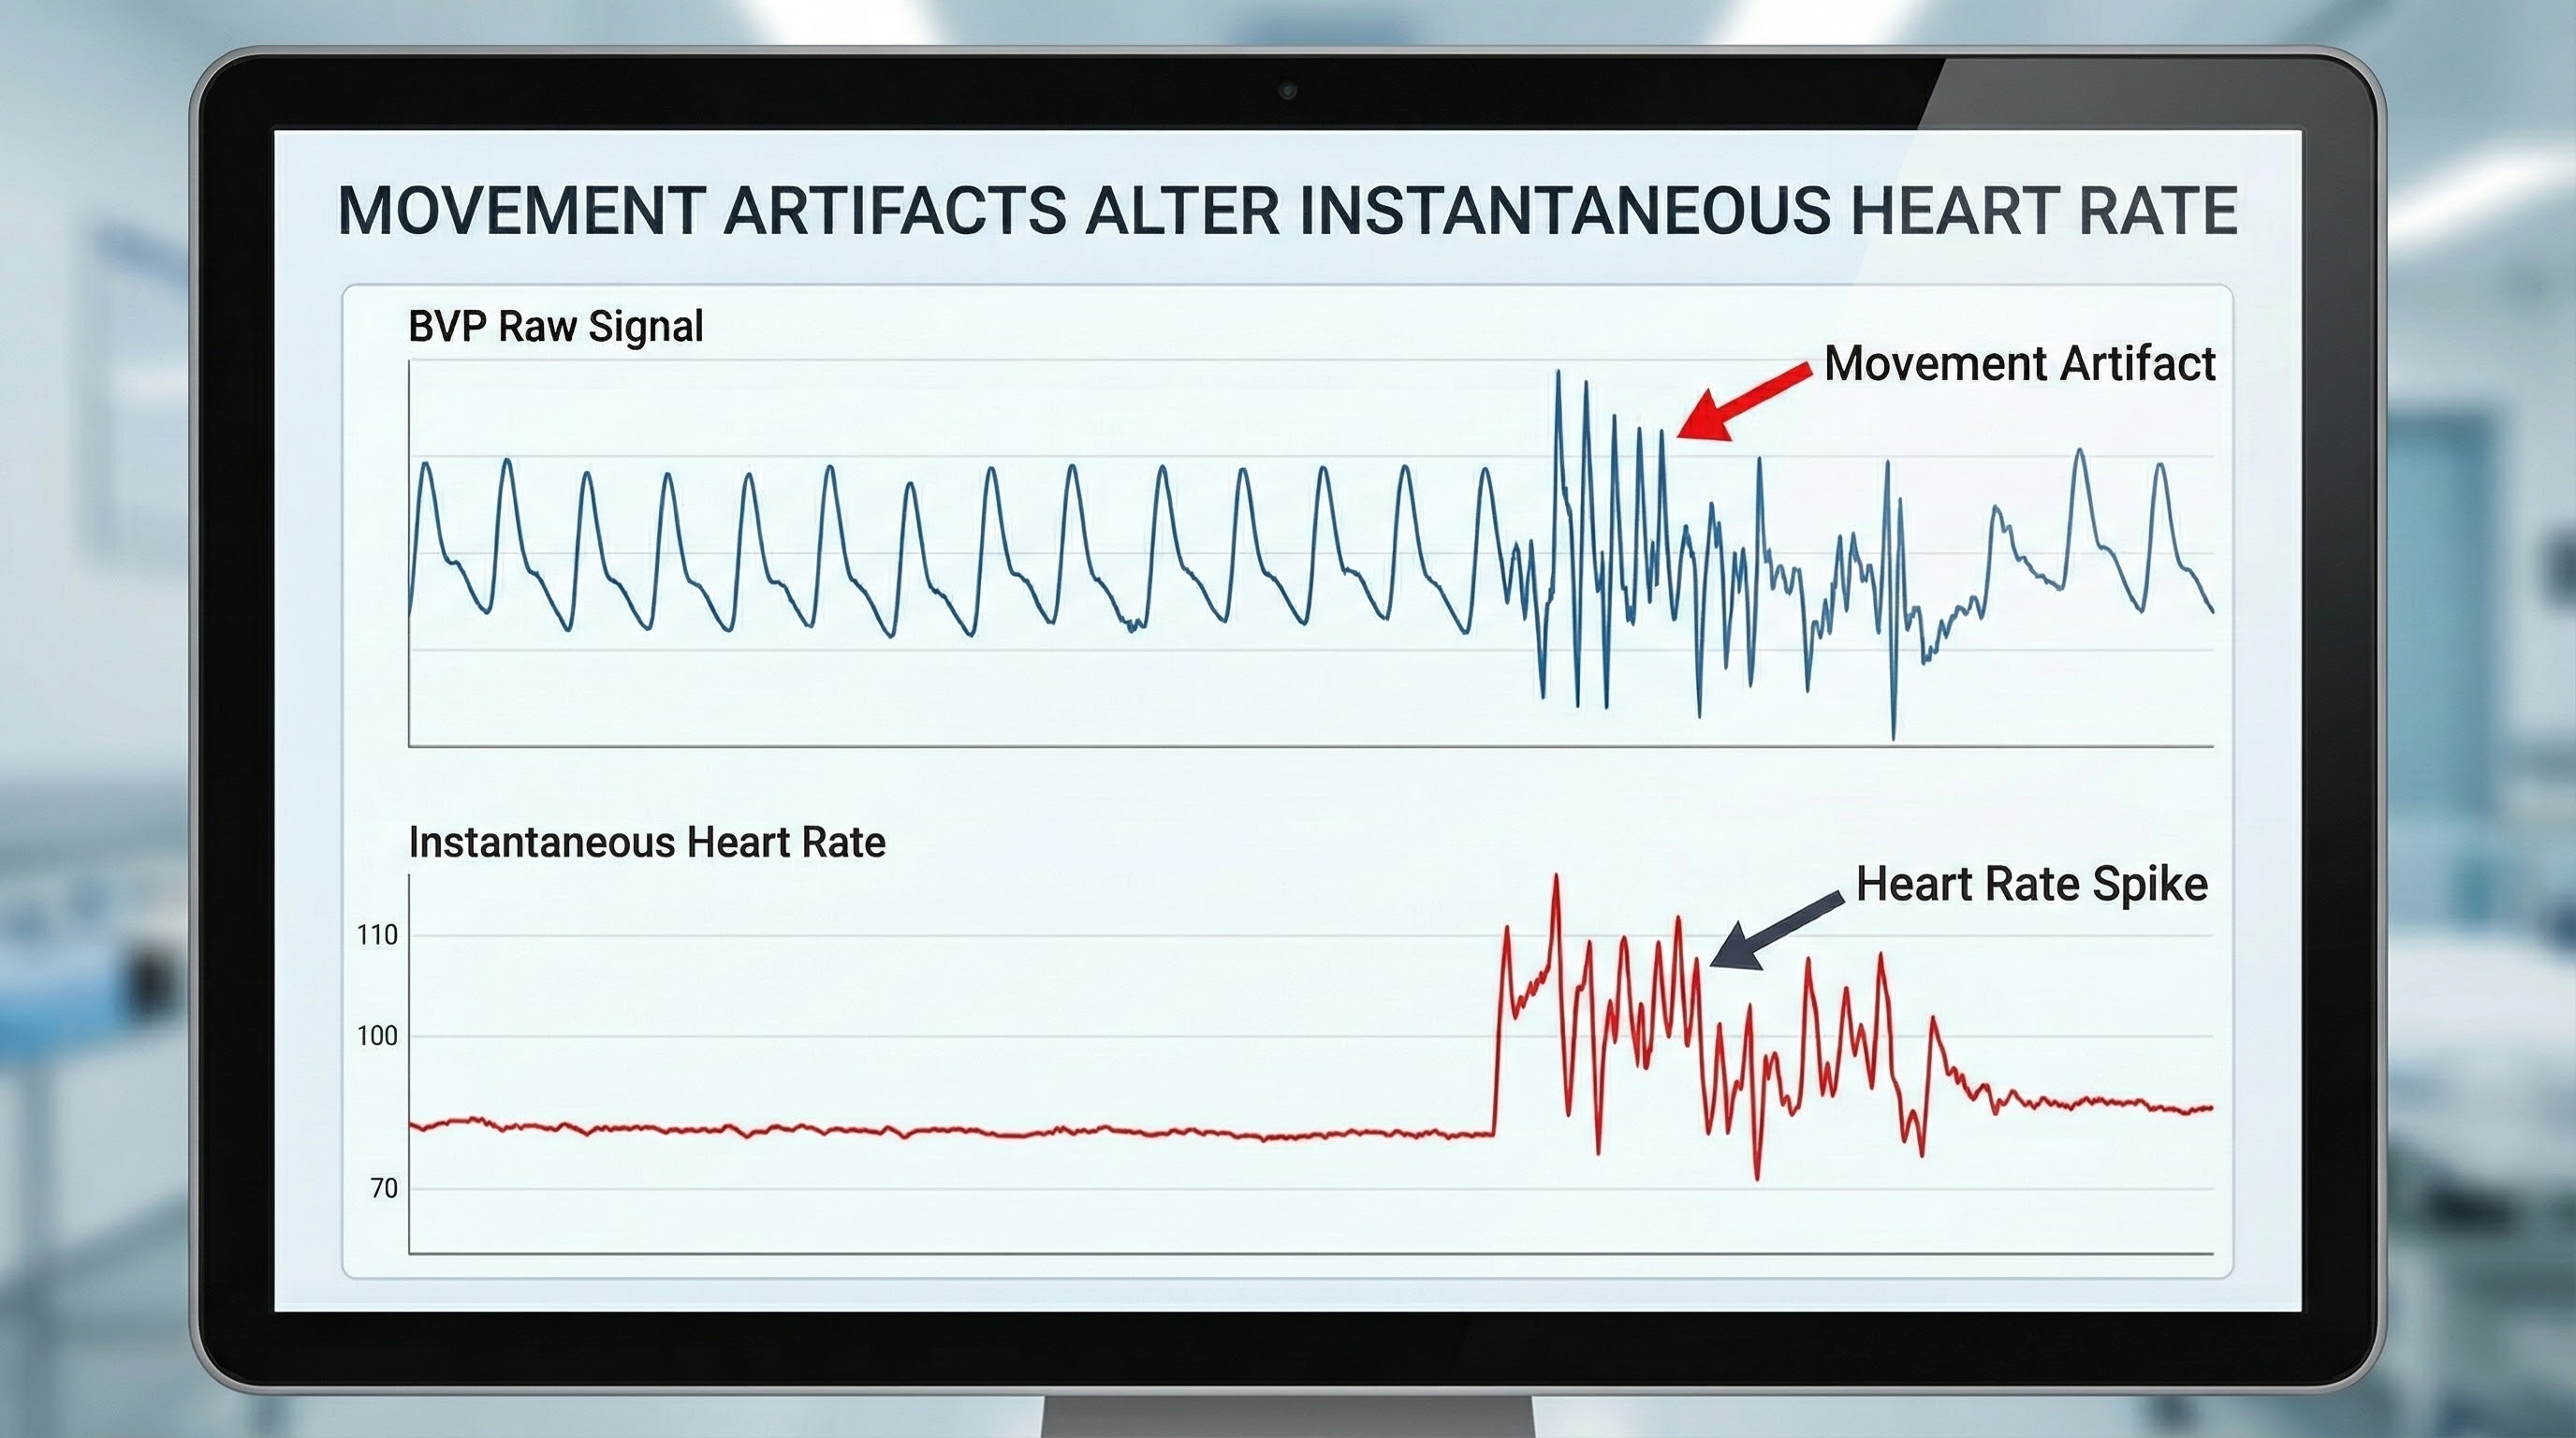
Below is a close-up view of sudden HR increases.
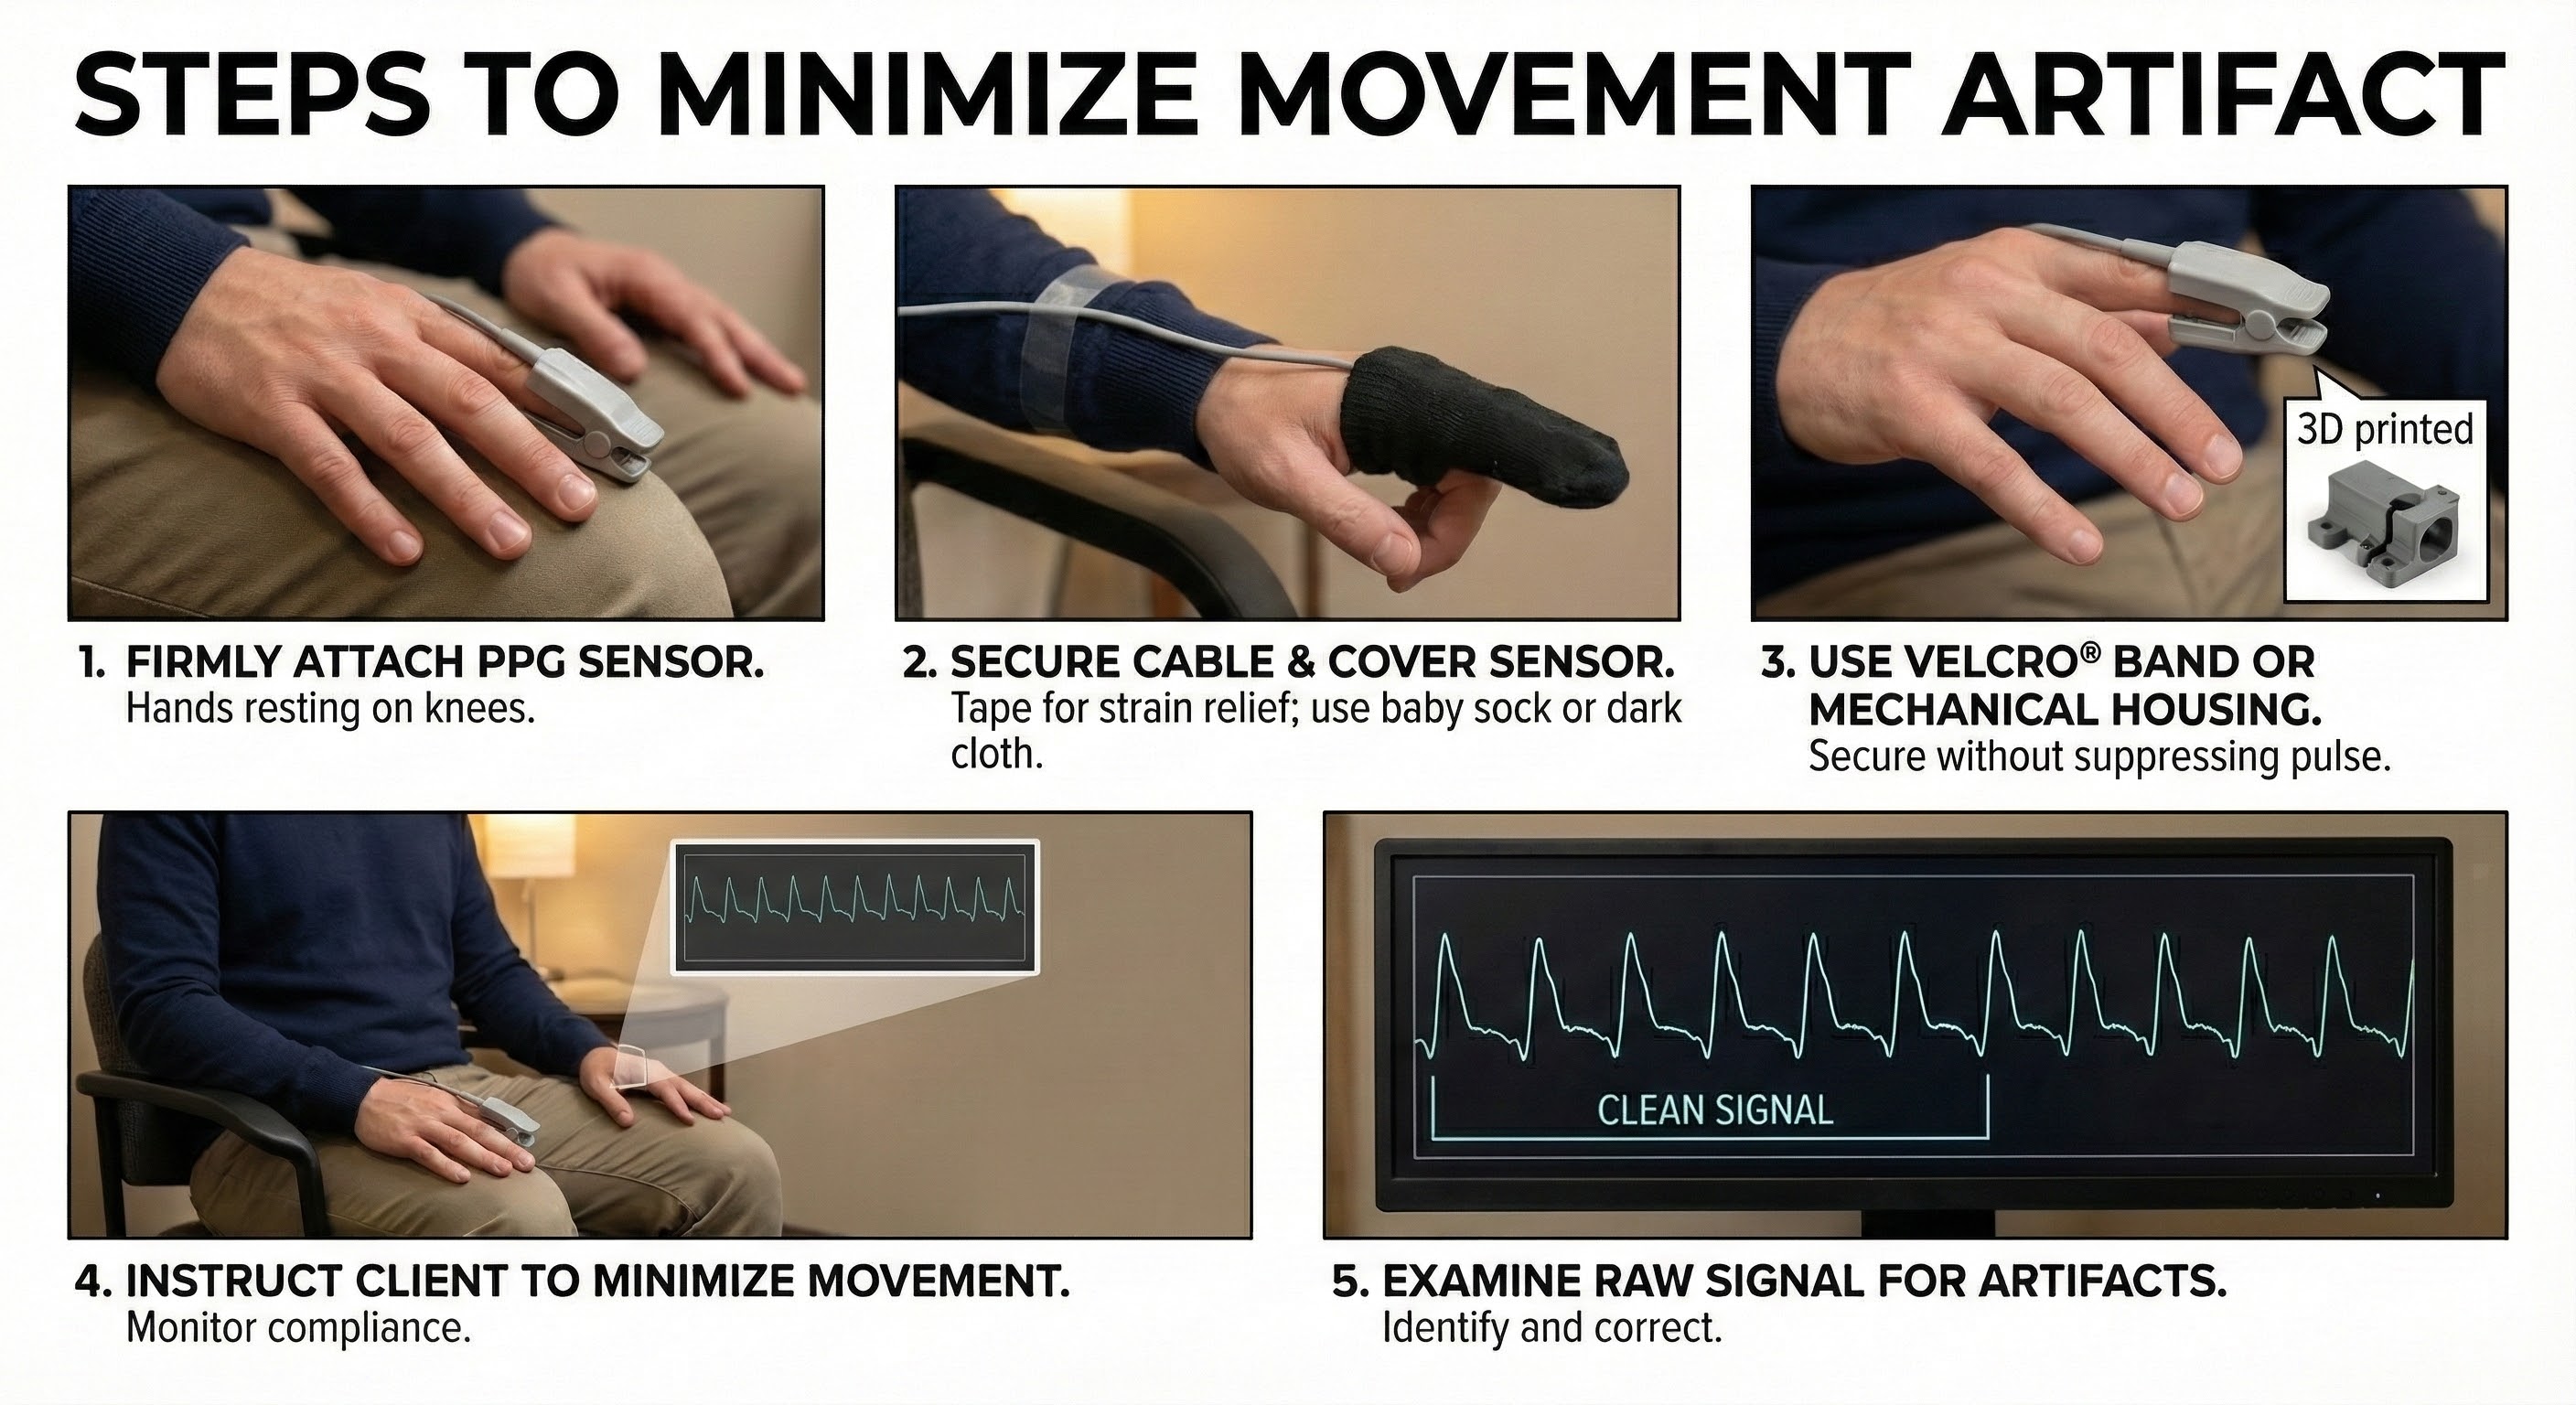
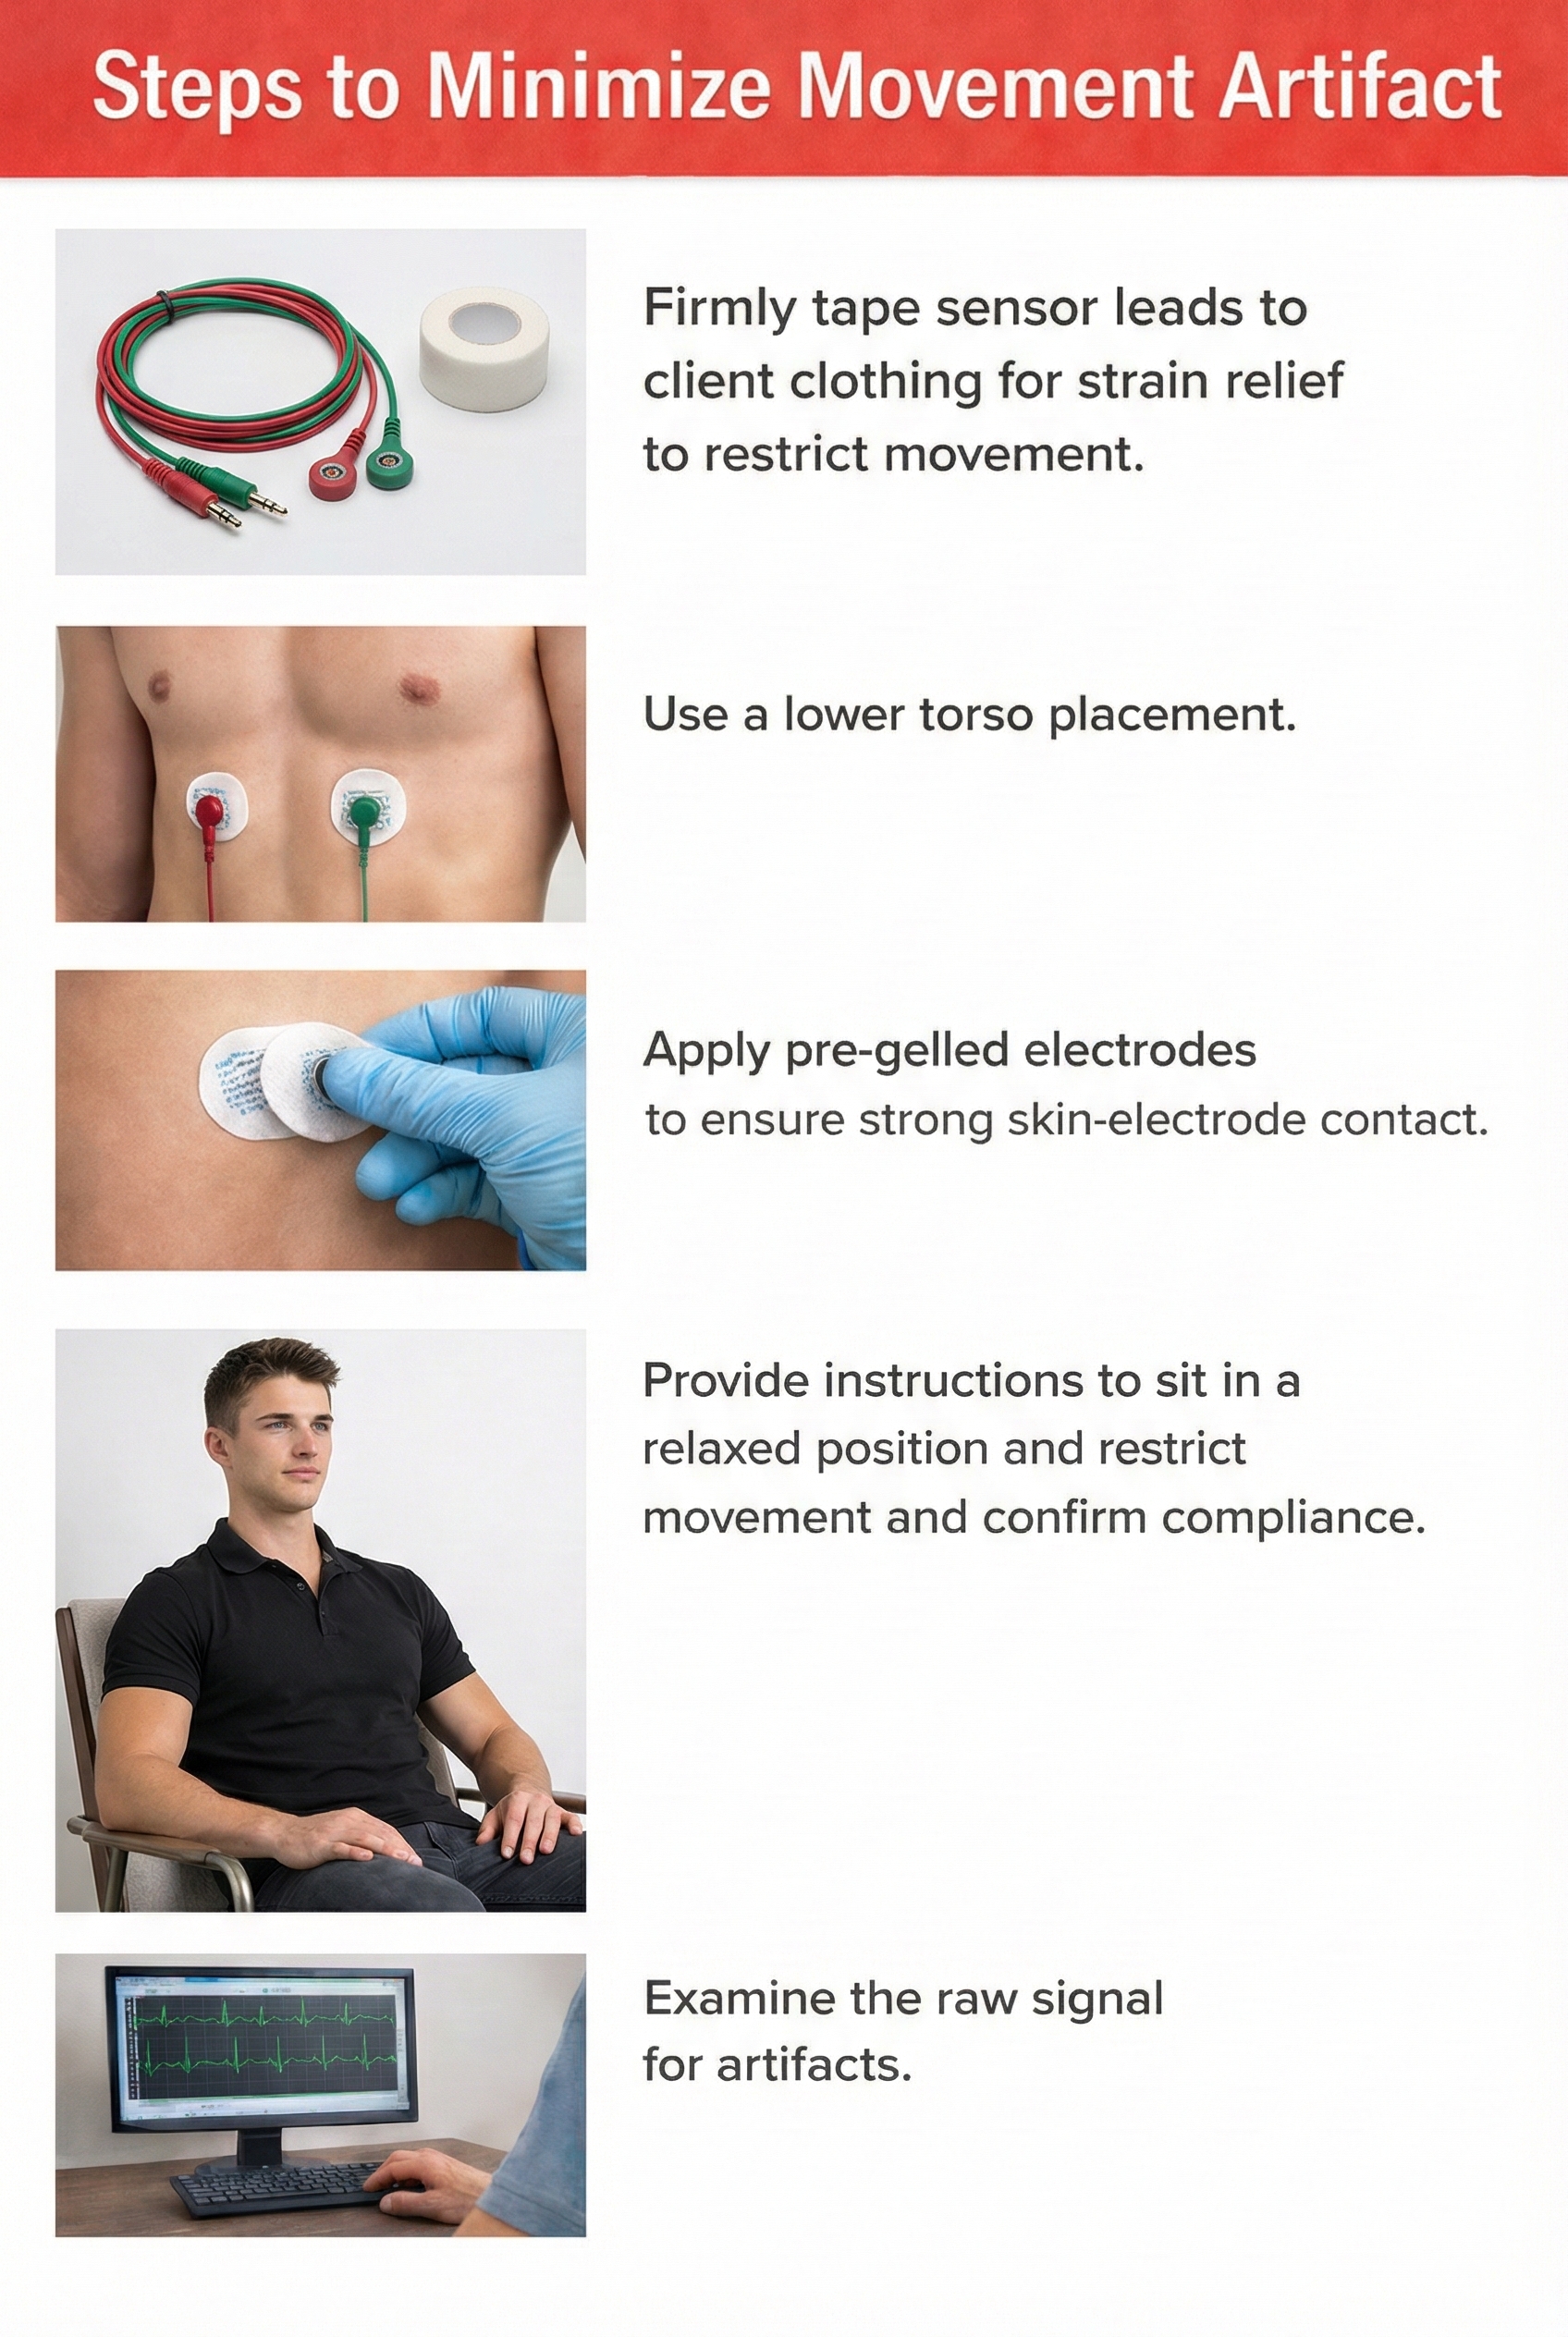
The sensor's stability is further reinforced using a Velcro band or mechanical housing, which must be applied carefully to secure the device without applying enough pressure to suppress the pulse. These physical setup measures are complemented by behavioral management, where the clinician explicitly instructs the client to remain still and monitors their compliance. The procedure concludes with a verification step in which the raw signal is examined visually to confirm the absence of artifacts before recording begins.
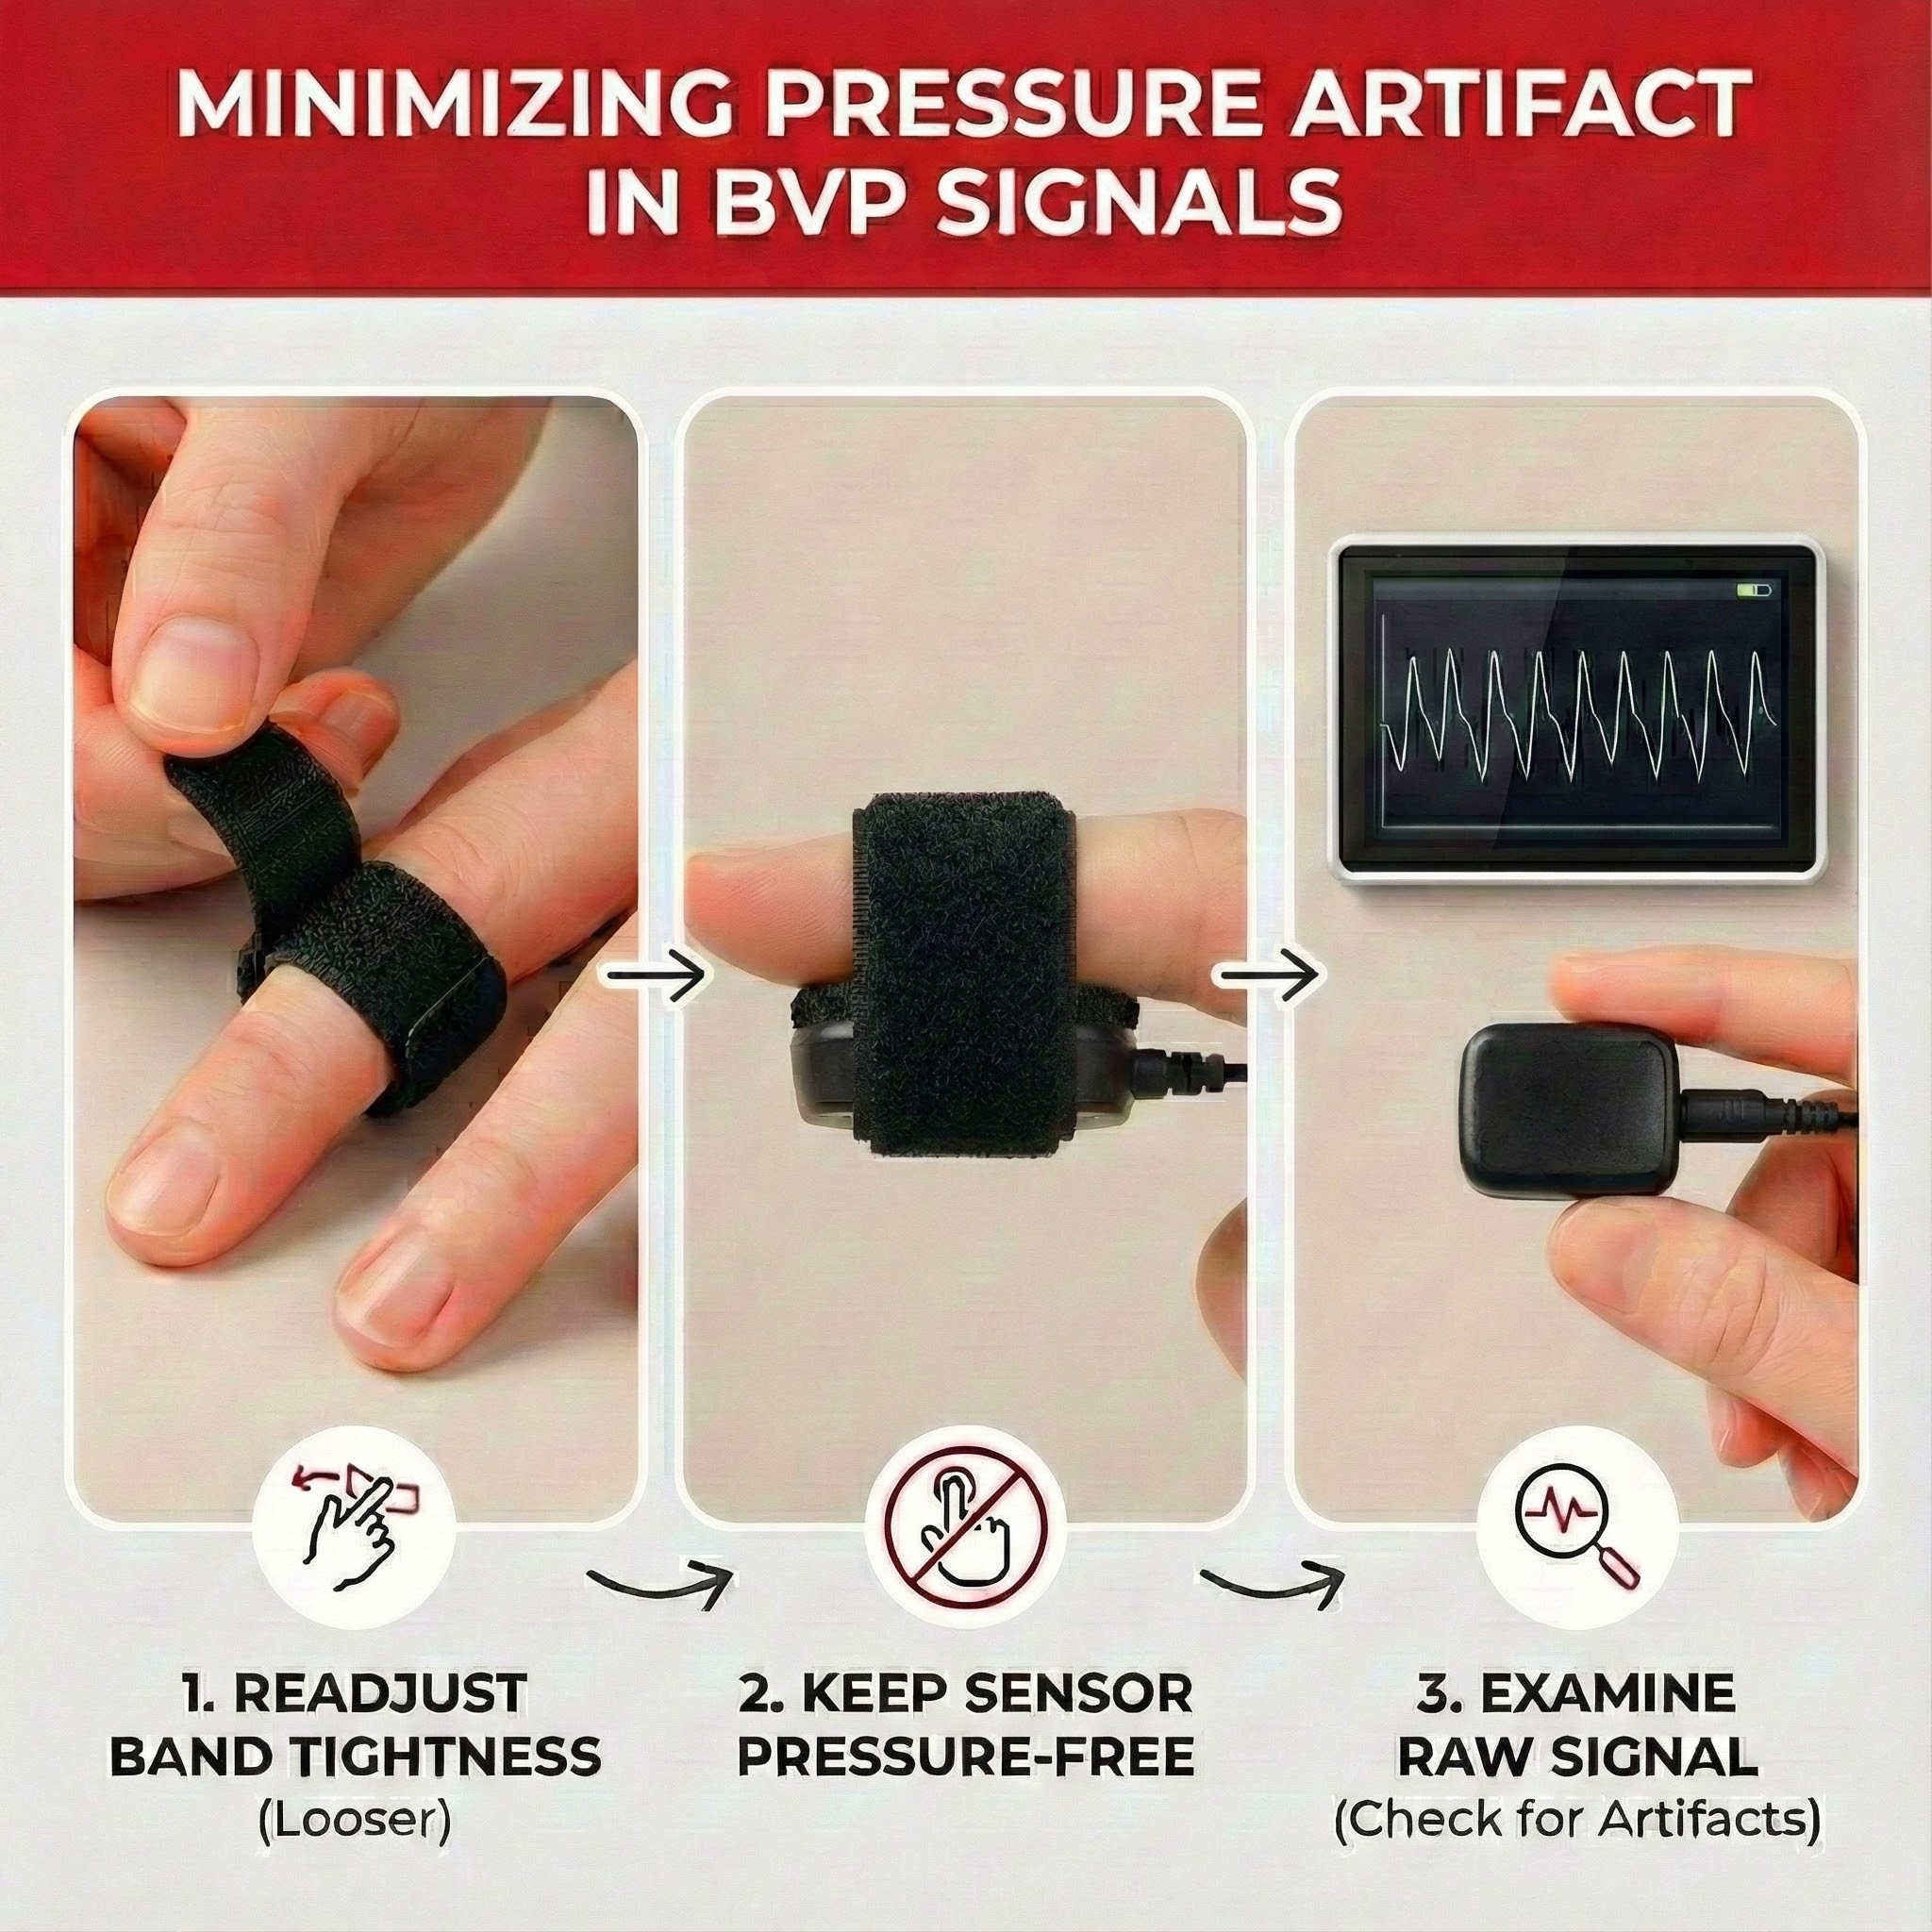
Pressure Artifact
Pressure artifact can be caused by wrapping a restraining band too tightly.
🎧 Mini-Lecture: BVP Pressure Artifact
Patients may report throbbing when a Velcro ® band is wrapped too tightly around a finger. Pressure can reduce raw signal amplitude, resulting in smaller BVP amplitude values or a flat line, and may prevent detecting the peak of the pressure wave. Missed beats can cause artifactually longer IBIs and slower HRs (Shaffer & Combatalade, 2013). 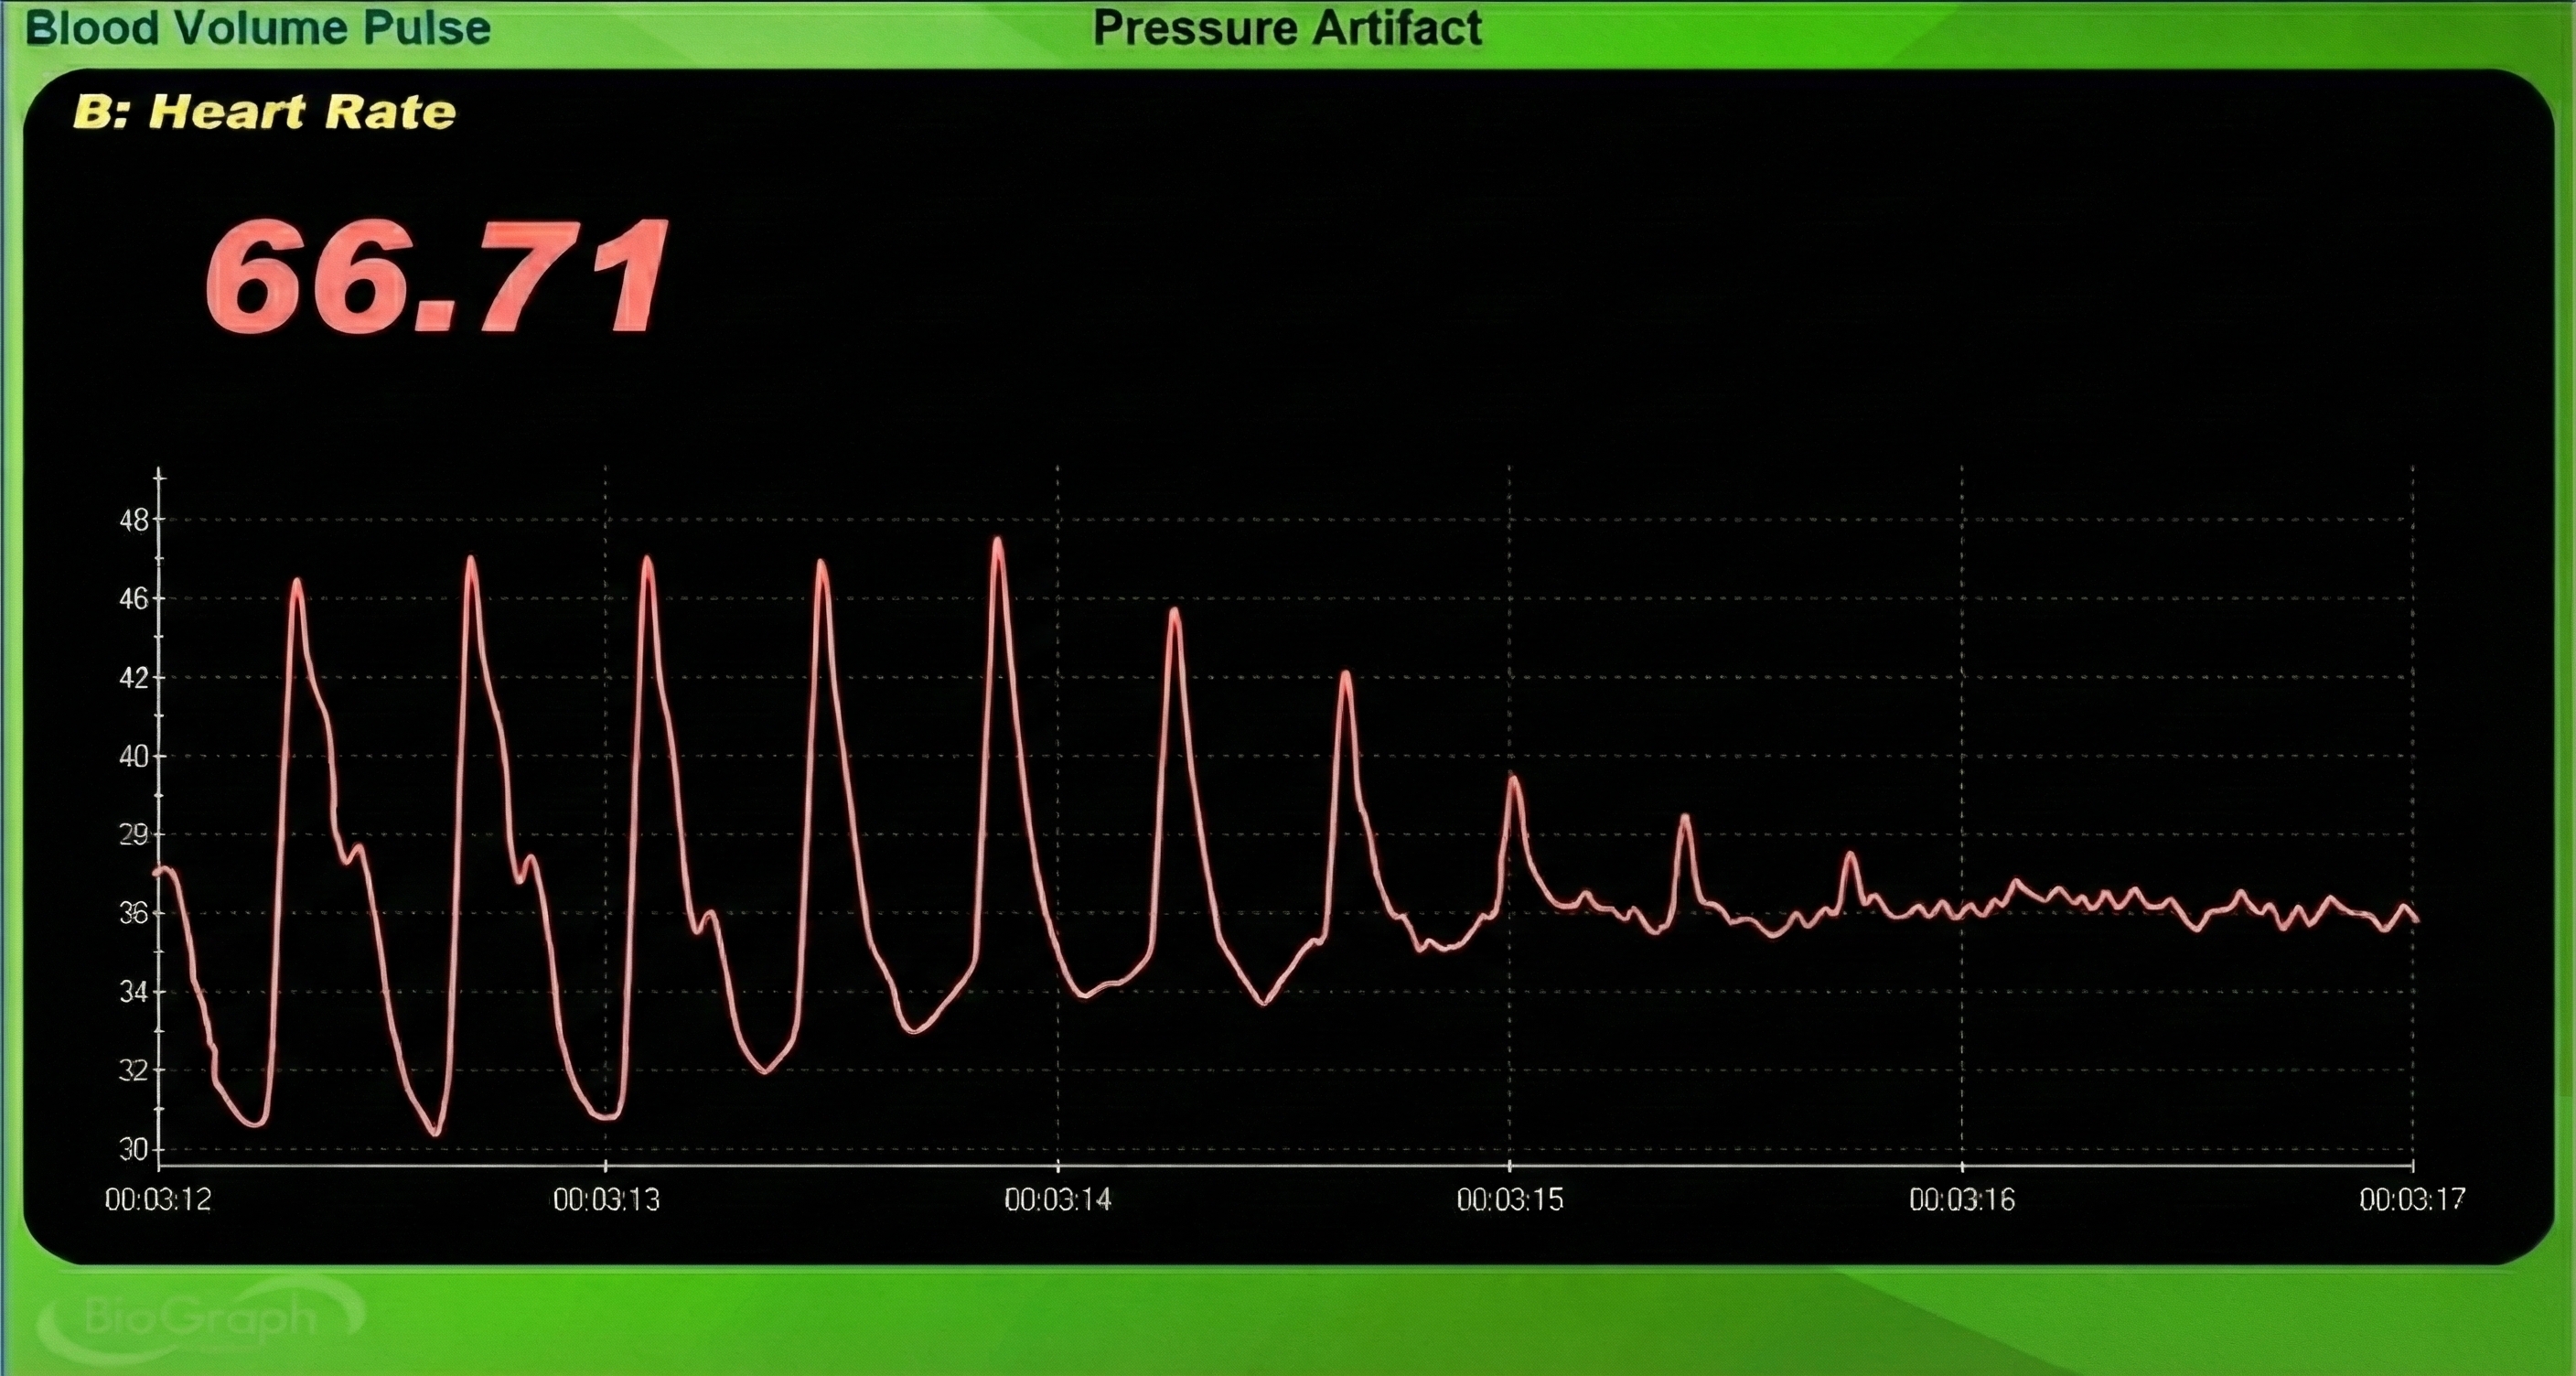
Excessive pressure can also be caused by resting too much weight (e.g., hand pressing sensor against a knee or table) on the PPG sensor. Pressure artifact reduces the amplitude of the raw signal resulting in smaller values (Peper, Shaffer, & Lin, 2010).
The graphic below from Elgendi (2012) shows multiple artifacts, including arrhythmia, EMG, low-amplitude, and movement, which can render an epoch unusable.
Tracking Test
You can determine whether the ECG or BVP signals respond to your client's breathing by observing whether their instantaneous HR speeds during inhalation and slows during exhalation.
🎧 Mini-Lecture: BVP Tracking Test
![]()
Normal Values
🎧 Listen to the Full Chapter Lecture Part 2
Normal resting HR values range from 60-80 beats per minute. Following a stressor, clinicians may measure elevations above baseline and the time required to recover to baseline values (Khazan, 2013, p. 46).
The photoplethysmograph detects blood volume pulse using infrared light transmitted through or reflected off tissue. BVP provides rapid phasic feedback about blood flow changes, complementing the slower tonic feedback from temperature biofeedback. PPG sensors can be placed on the finger, thumb, earlobe, or temporal artery, with the ear being less prone to artifact. Common BVP artifacts include cold artifact from vasoconstriction, light artifact from ambient light contamination, movement artifact from sensor displacement, and pressure artifact from overly tight bands. The tracking test confirms that heart rate appropriately speeds during inhalation and slows during exhalation. Short-term HRV values serve as proxies for 24-hour values but should never be compared directly with 24-hour norms.
Comprehension Questions: Photoplethysmography
- What is the difference between the transmission and reflection techniques for PPG measurement, and when might you choose one over the other?
- Why might the ear be a better PPG sensor site than the finger for HRV measurements?
- How does limb position relative to the heart affect BVP signal amplitude, and how can you use this clinically?
- Describe three types of BVP artifacts and explain strategies to minimize each one.
- When would you switch from PPG to ECG for heart rate variability measurement?
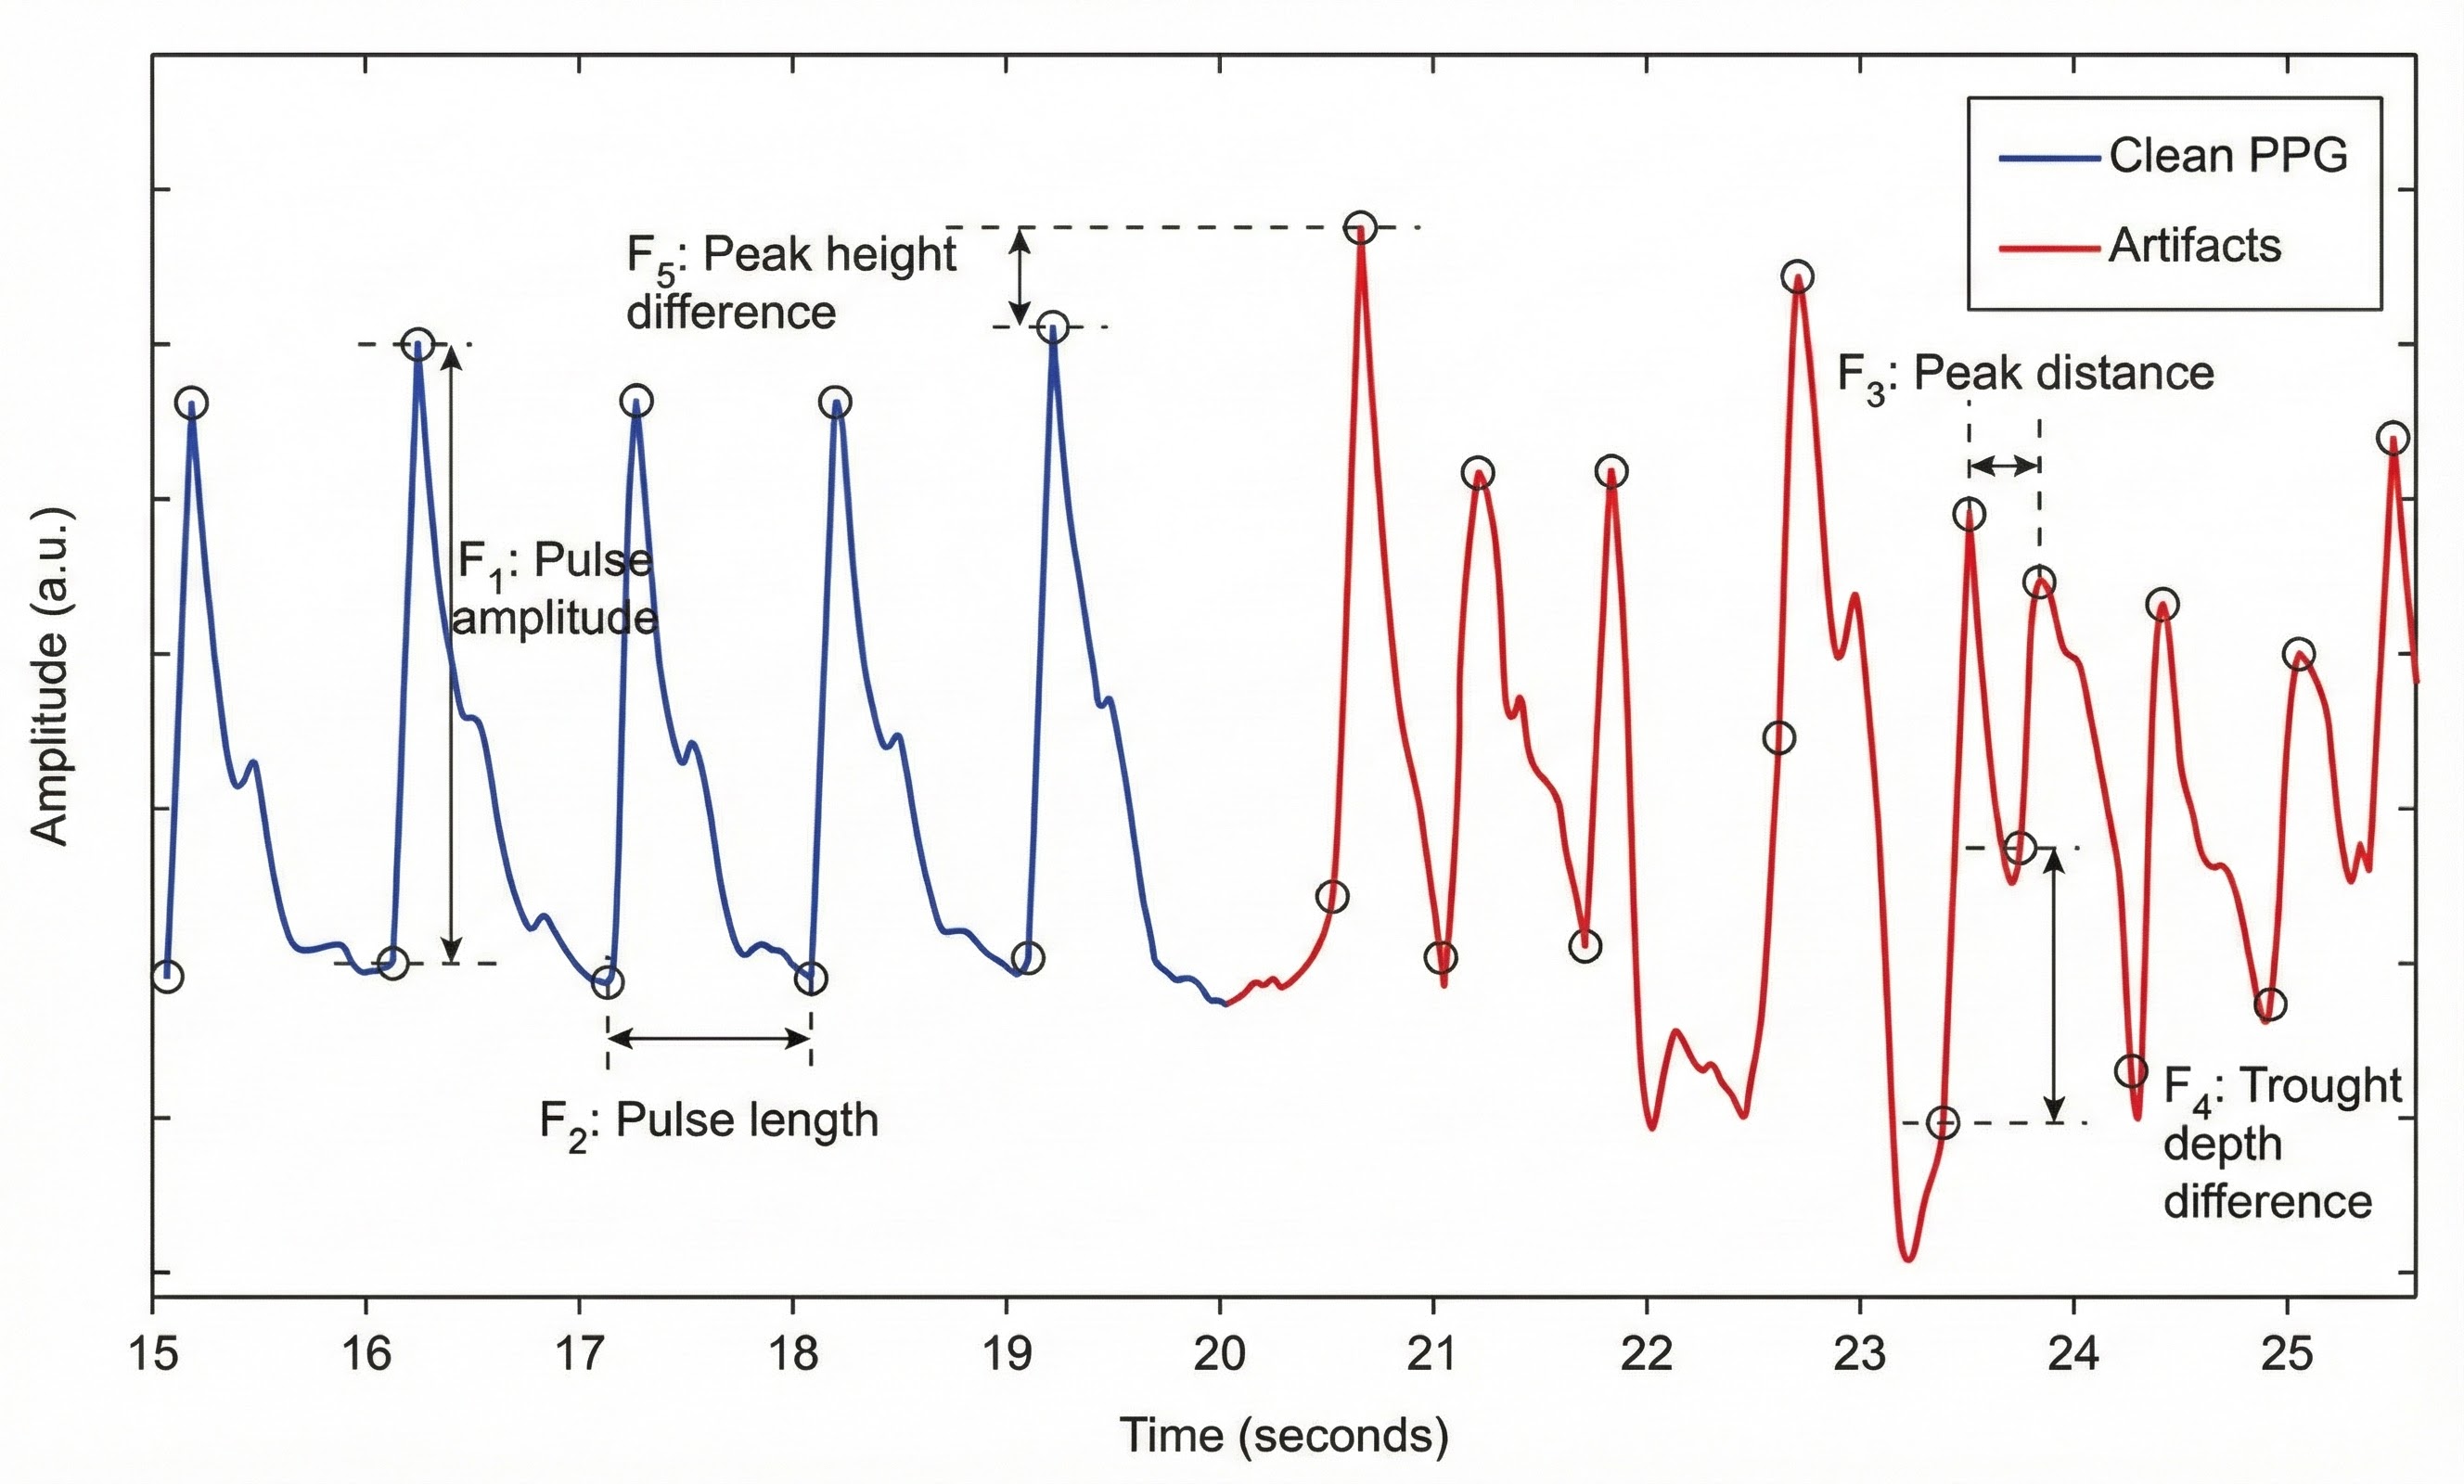
Pulse Amplitude Variability
Picture yourself watching a pulse waveform scroll across a biofeedback screen. You notice something curious: some heartbeats produce tall, robust waves while others generate shorter, more modest peaks. These beat-to-beat fluctuations in wave height represent pulse amplitude variability (PAV), a measure that captures something fundamentally different from heart rate variability (Yuda et al., 2020). Where HRV tracks the timing between beats, PAV reveals how much blood is actually reaching your fingertip with each cardiac contraction. This distinction carries real clinical significance because PAV reflects not just cardiac function but also the dynamic state of your peripheral blood vessels, telling us whether they are relaxed and open or tight and constricted (Mejía-Mejía et al., 2020; Pilz et al., 2024; Yuda et al., 2020). PAV opens a complementary window into autonomic regulation, showing how the nervous system orchestrates circulation, responds to stress, and shifts toward recovery throughout the day.
What Pulse Amplitude Variability Means
That familiar photoplethysmography tracing on your fingertip sensor or smartwatch is fundamentally a blood volume measurement: the sensor shines infrared light into tissue and detects how much light returns as blood pulses through the capillary bed (Yu et al., 2021). When the left ventricle ejects a large bolus of blood (high stroke volume) or when peripheral arterioles are dilated and welcoming, the resulting pulse wave swells to a tall peak at the fingertip. Conversely, when stroke volume drops or vessels clamp down, the pulse amplitude shrinks accordingly (Mejía-Mejía et al., 2020; Pilz et al., 2024).
The autonomic nervous system exerts powerful control over both factors, which means PAV carries rich information about vascular tone, blood pressure regulation, and the body's moment-to-moment stress responses (Draghici & Taylor, 2016; Yuda et al., 2020). Consider what happens during acute stress: sympathetic activation constricts peripheral vessels to shunt blood toward vital organs, often producing smaller, more erratic pulse waves at the fingernail bed even when heart rate has barely budged (Ishaque et al., 2021; Shaffer & Ginsberg, 2017). A clinician watching the raw waveform can literally see the vascular squeeze unfold in real time.
How PAV Is Detected and Used in Biofeedback
Clinicians typically derive PAV from the continuous pulse waveform captured by a contact PPG sensor clipped to the finger or earlobe. Newer approaches use camera-based photoplethysmography to detect the subtle flush and fade of skin color with each heartbeat, extracting pulse data from a video of the face without any physical sensor at all (Mejía-Mejía et al., 2020; Yu et al., 2021). Once the software identifies each pulse, it measures the peak-to-trough height and assembles these amplitudes into a time series that can be analyzed statistically or displayed as a rolling trend.
In HRV biofeedback protocols, clients breathe slowly at or near their personal resonance frequency, typically between 4.5 and 7 breaths per minute, to maximize heart rate oscillations and strengthen baroreflex sensitivity (Shaffer & Meehan, 2020; Shaffer & Ginsberg, 2017). Many biofeedback platforms display not only heart rate but also the raw pulse waveform, and something beautiful often emerges as the session progresses: the waveform becomes more uniform and begins to swell and recede in smooth, rhythmic cycles that mirror the breathing pattern (Fournié et al., 2021; Pruneti et al., 2023). Clients can literally watch their autonomic nervous system shift toward parasympathetic dominance, a visible confirmation that their relaxation efforts are producing genuine physiological change.
Strengths and Limitations for Health Monitoring
The great practical advantage of PAV is accessibility. Unlike electrocardiography, which requires electrode gel, skin preparation, and careful lead placement, PPG sensors are small, cheap, and comfortable enough to embed in consumer smartwatches and fitness bands that millions of people already wear (Mejía-Mejía et al., 2020; Singh et al., 2018). This democratization of physiological monitoring makes it feasible to track both pulse rate variability and amplitude around the clock, opening new possibilities for mobile health applications and longitudinal self-tracking (Faust et al., 2022; Ishaque et al., 2021).
The clinical promise is substantial: systematic reviews confirm that HRV biofeedback training can benefit patients with hypertension, asthma, depression, anxiety, chronic pain, and sleep disorders (Fournié et al., 2021; Shaffer & Meehan, 2020). As PAV metrics become integrated into these platforms, they may add valuable information about vascular health and stress reactivity that HRV alone cannot capture (Pilz et al., 2024). The technology does have significant limitations, however. Pulse signals are exquisitely sensitive to movement artifact, inconsistent sensor contact, variations in sampling rate, and algorithmic decisions about exactly which point on the waveform defines the "beat" (Hejjel & Béres, 2021; Quigley et al., 2024).
Beyond technical factors, physiological variables like posture, ambient temperature, and arterial stiffness can shift PAV in ways that do not map neatly onto changes in cardiac autonomic control (Mejía-Mejía et al., 2020; Yuda et al., 2020). Clinicians must interpret PAV data thoughtfully rather than assuming it mirrors HRV.
PAV, HRV, and Biofeedback: How They Fit Together
Heart rate variability derived from electrocardiogram R-R intervals remains the gold standard for assessing autonomic balance, with decades of research linking reduced HRV to cardiovascular mortality, impaired stress regulation, and diminished cognitive performance (Draghici & Taylor, 2016; Johnston et al., 2019; Shaffer & Ginsberg, 2017).
Pulse rate variability offers a convenient approximation of HRV by measuring the gaps between successive pulse peaks in the PPG signal (Mejía-Mejía et al., 2020). Yet neither PRV nor PAV is a perfect surrogate for HRV, and the discrepancies are physiologically meaningful.
The pulse wave at your fingertip is not a simple echo of the electrical signal at your heart; it has been shaped by electromechanical coupling (the delay between electrical activation and mechanical contraction), vascular compliance, and pulse transit time (the journey from aortic valve to peripheral sensor). These intervening steps can introduce variability into the pulse signal even when cardiac autonomic modulation is minimal (Mejía-Mejía et al., 2020; Yuda et al., 2020). Leading researchers now argue that PRV deserves recognition as a related but distinct biomarker that may encode information about mechanical and vascular dynamics beyond what HRV reveals (Mejía-Mejía et al., 2020; Sundas et al., 2025; Yuda et al., 2020).
For biofeedback practitioners and health researchers, the most powerful approach may be integrating all three metrics. By examining HRV, PRV, and PAV together, clinicians can move beyond asking simply whether the heart is well-regulated to understanding how the entire cardiovascular system, from cardiac output to peripheral vascular tone, responds to breathing exercises, stress challenges, and recovery periods. This multidimensional view opens possibilities for more precisely tailored interventions, whether the goal is optimizing athletic training loads, managing chronic illness, or helping students stay calm during high-stakes examinations (Addleman et al., 2024; Fournié et al., 2021; Pruneti et al., 2023).
Pulse amplitude variability (PAV) quantifies beat-to-beat changes in peripheral pulse wave height, revealing information about stroke volume, vascular tone, and autonomic regulation that complements traditional heart rate variability measures. PAV can be captured effortlessly from finger or wrist PPG sensors embedded in consumer wearables. Sympathetic stress responses constrict peripheral vessels and typically produce smaller, more variable pulse waves even before heart rate changes appreciably.
During successful HRV biofeedback, the pulse waveform often develops rhythmic amplitude oscillations synchronized with slow breathing, providing clients visible evidence of autonomic shift. Technical limitations include sensitivity to movement artifact, sensor placement, and algorithmic choices, while physiological confounds such as posture, temperature, and arterial stiffness can alter PAV independently of cardiac autonomic control. Integrating HRV, pulse rate variability, and PAV yields a richer cardiovascular portrait that can inform more individualized clinical and performance interventions.
Comprehension Questions: Pulse Amplitude Variability
- How does pulse amplitude variability differ from heart rate variability, and what additional physiological information does PAV provide?
- What factors influence pulse amplitude, and how does sympathetic activation typically affect the pulse wave during stress?
- Why might pulse rate variability and PAV not perfectly mirror HRV, and what additional steps in the cardiovascular system contribute to this difference?
- What are the advantages and limitations of using PPG-based PAV measurements for health monitoring?
- How might combining HRV, PRV, and PAV measurements improve biofeedback interventions compared to using HRV alone?
Heart Rate Variability
Clinicians use PPG or ECG sensors to detect interbeat intervals. PPG sensors use the peak of the pressure wave, and ECG sensors use the R-spike to determine when a heartbeat has occurred.
🎧 Mini-Lecture: ECG Sensor Overview
ECG/EKG Sensors
ECG sensors measure HR more accurately than PPG sensors, but their placement requires skin preparation, more time, and the use of disposable supplies and may involve the partial removal of clothing. The PPG method is more straightforward and achieves acceptable accuracy for clinical work, but it is especially vulnerable to movement artifact and vasoconstriction of the digits.
Sensor Placement
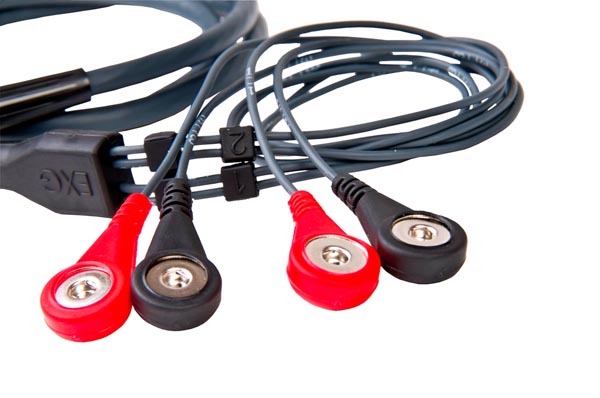
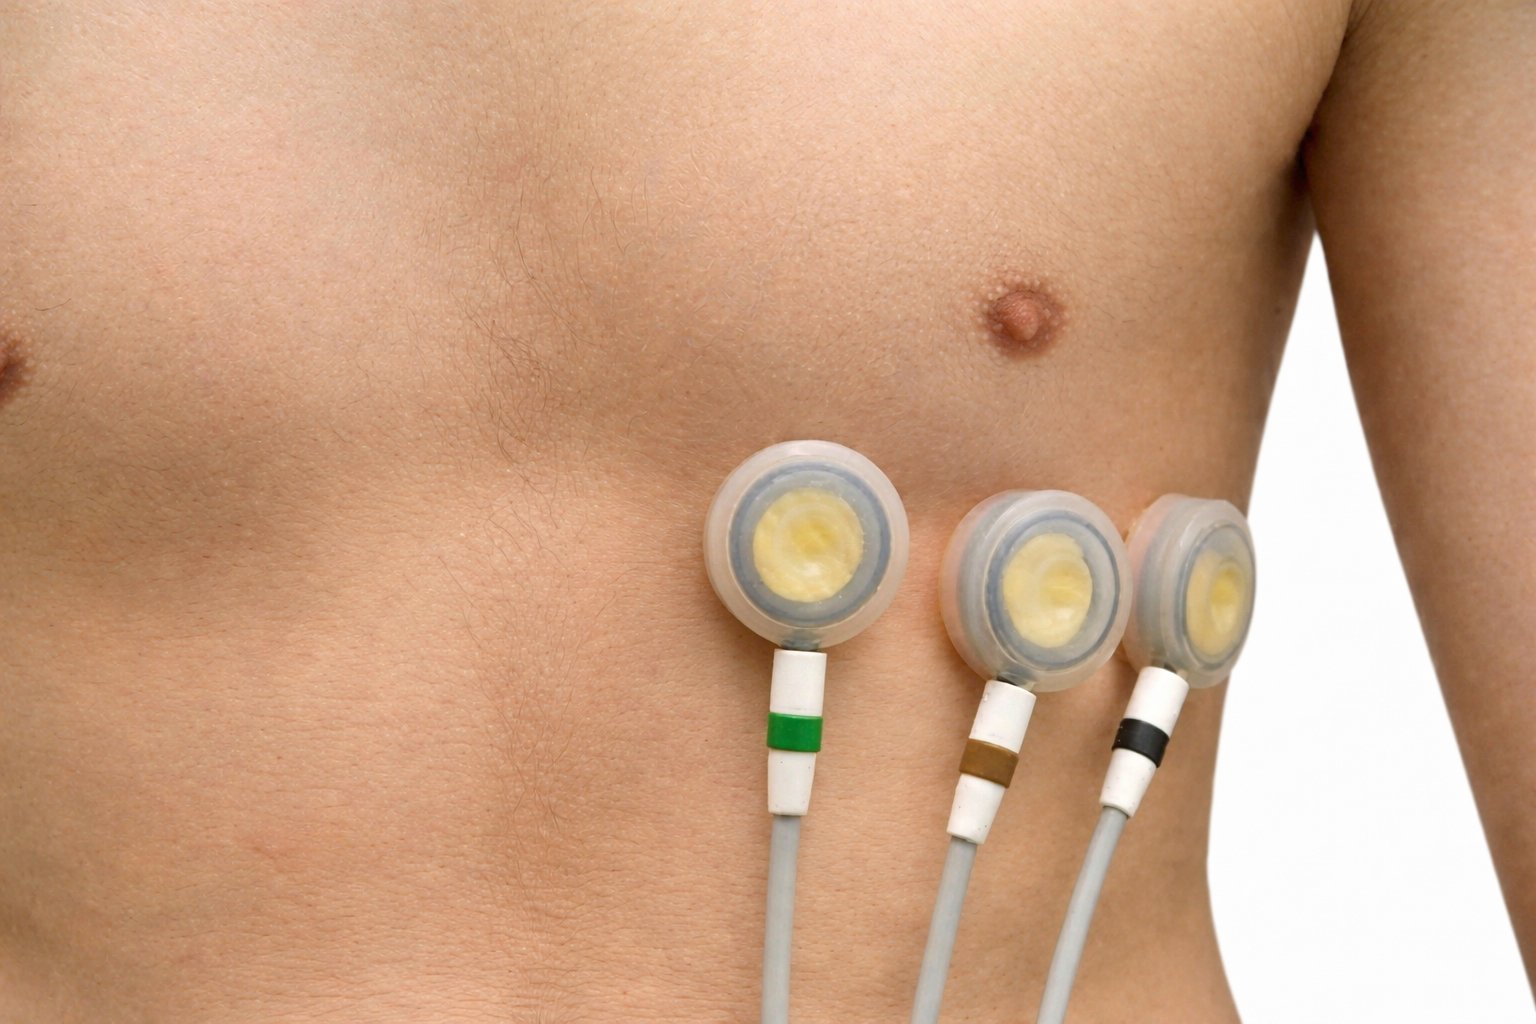
Three- or four-lead electrode assemblies are sufficient to record the ECG signal. There is no universal color-coding system for ECG electrodes (Lehrer, 2018b). ECG sensors can be identical to EMG sensors. Standard lead cables have snap buttons onto which the electrodes are affixed. A MindMedia EXG sensor is shown below.
Dry or gelled electrodes can be used. Pre-gelled disposable ECG electrodes save preparation time and reduce the risk of infection.
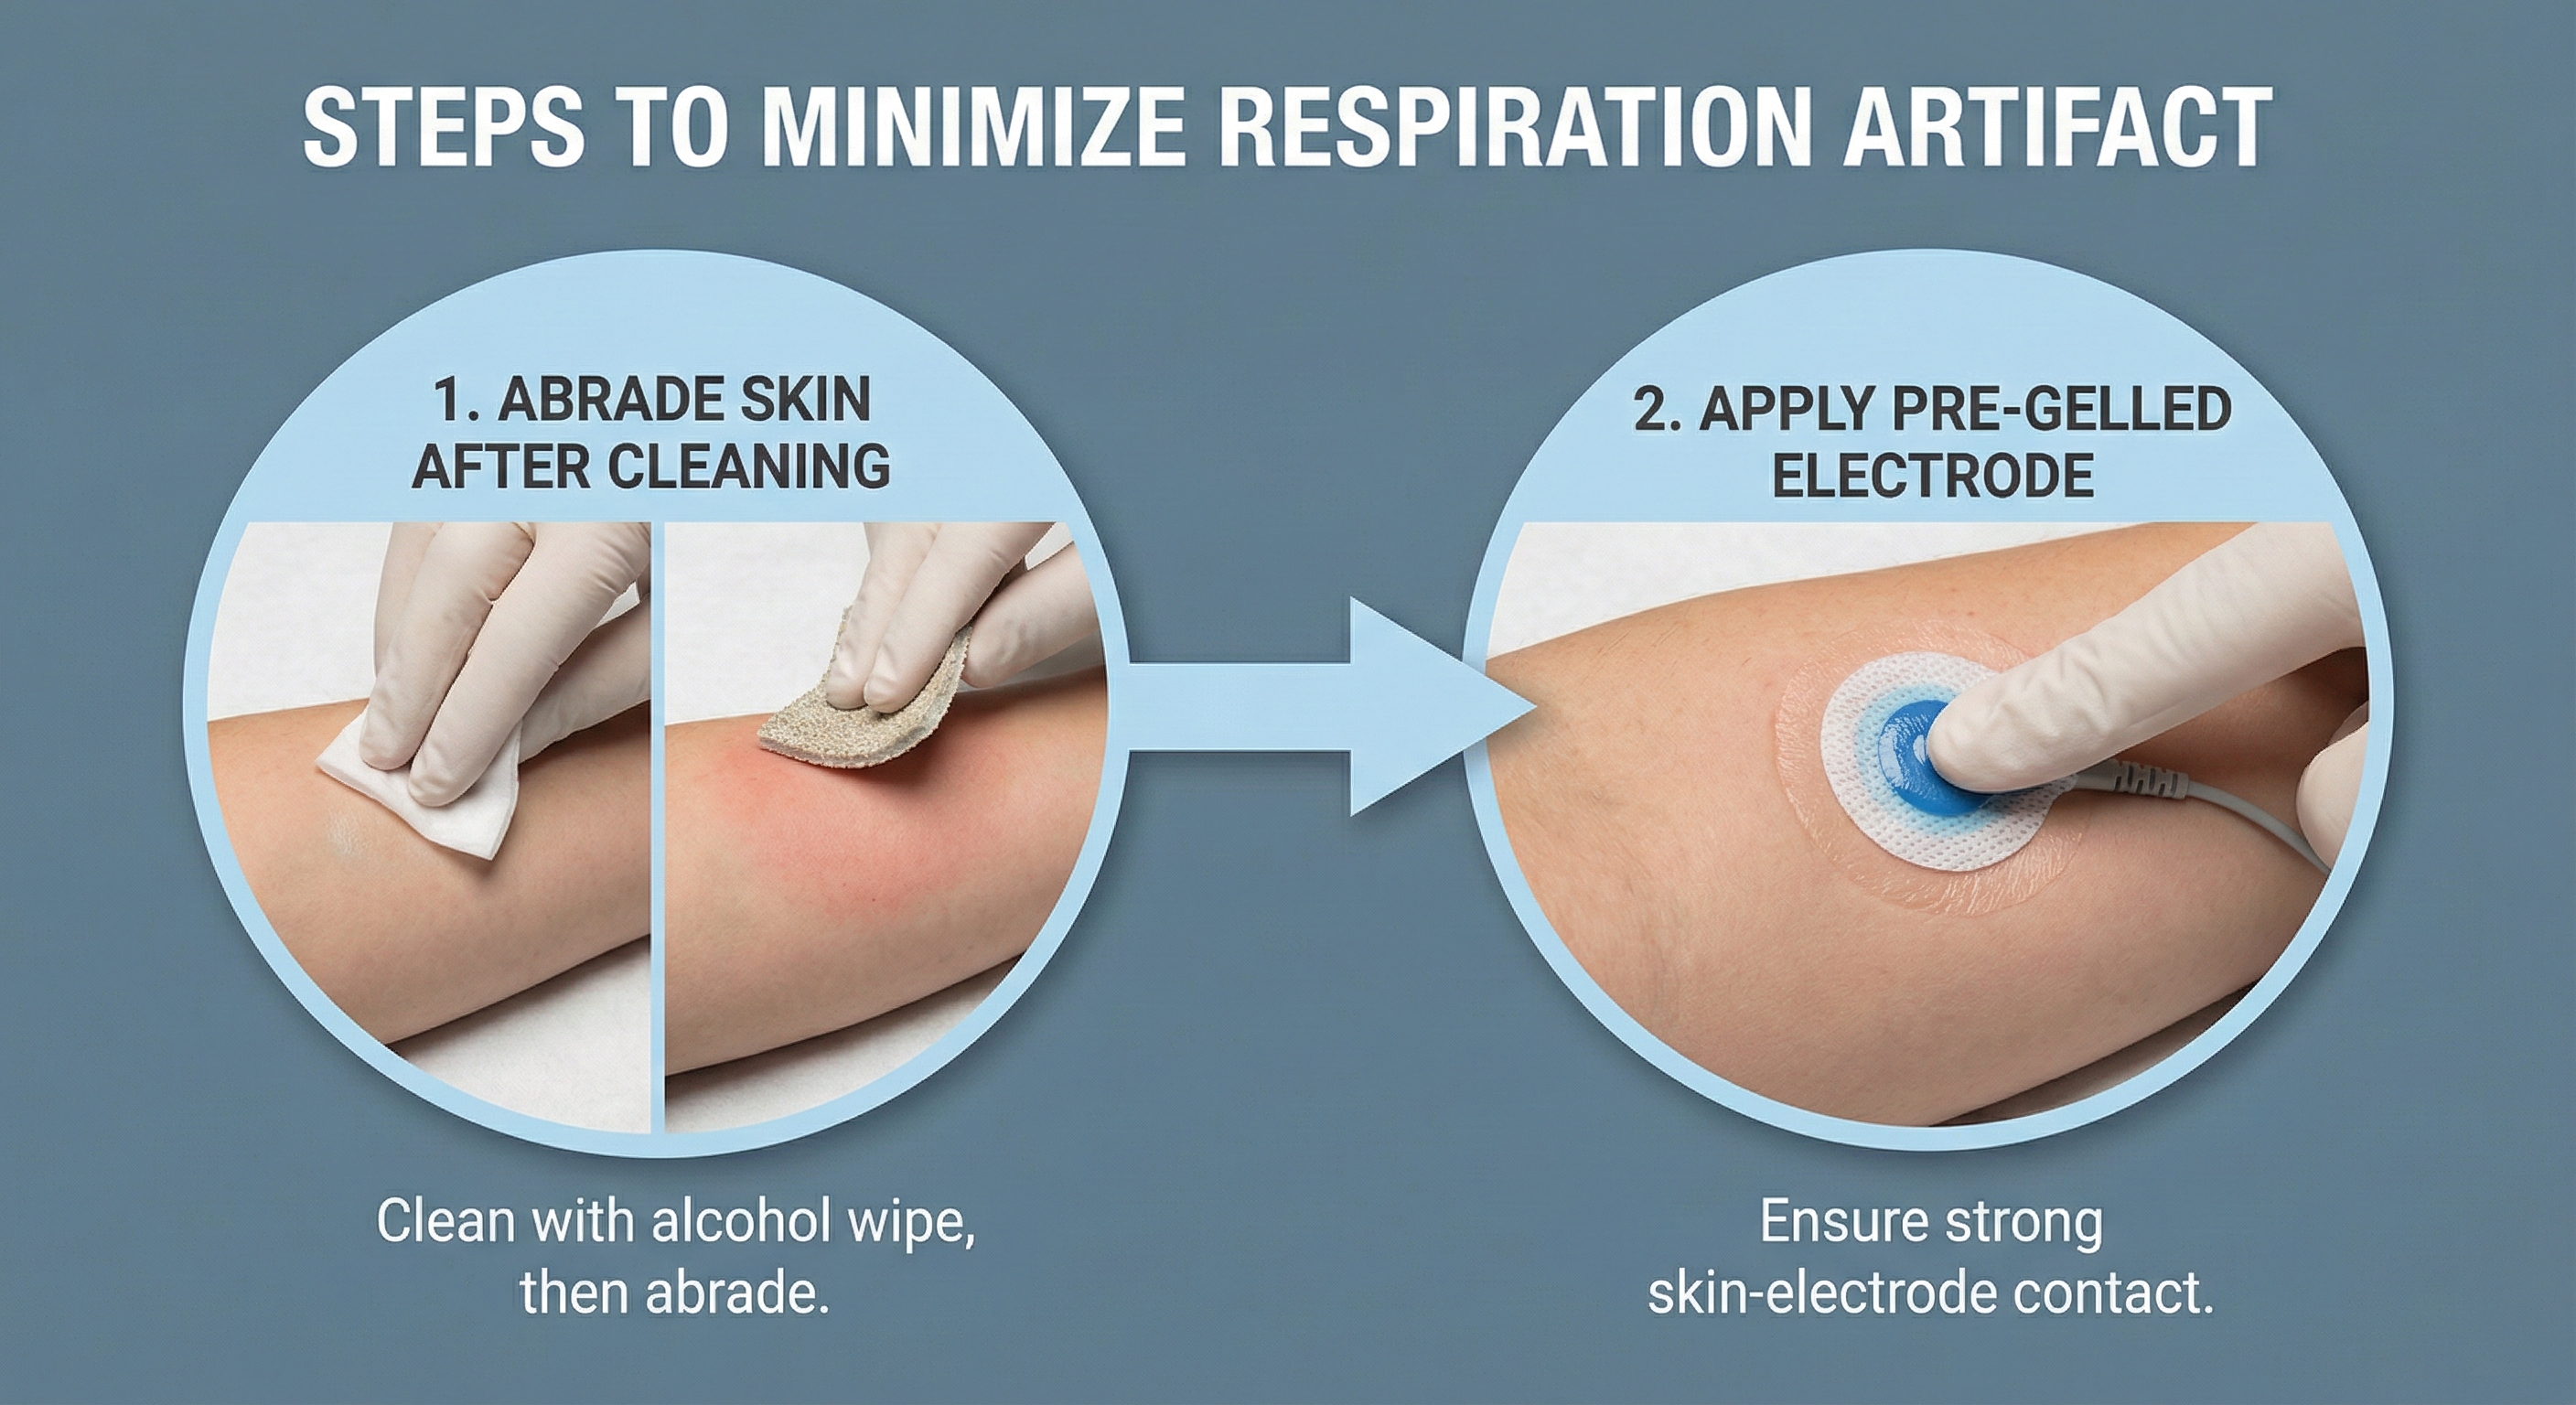
Skin Preparation
Prepare the skin by rubbing the area where the electrodes will be applied with an alcohol wipe. Cleaning the skin of oil and dirt helps reduce impedance, which is the opposition to AC flow. For men, you may need to shave the chest and abdomen if body hair prevents satisfactory electrode contact with the skin. The multi-lead configuration shown below is used for diagnostic ECGs and not HRV biofeedback. Adapted graphic © Bork/Shutterstock.com.
Placements
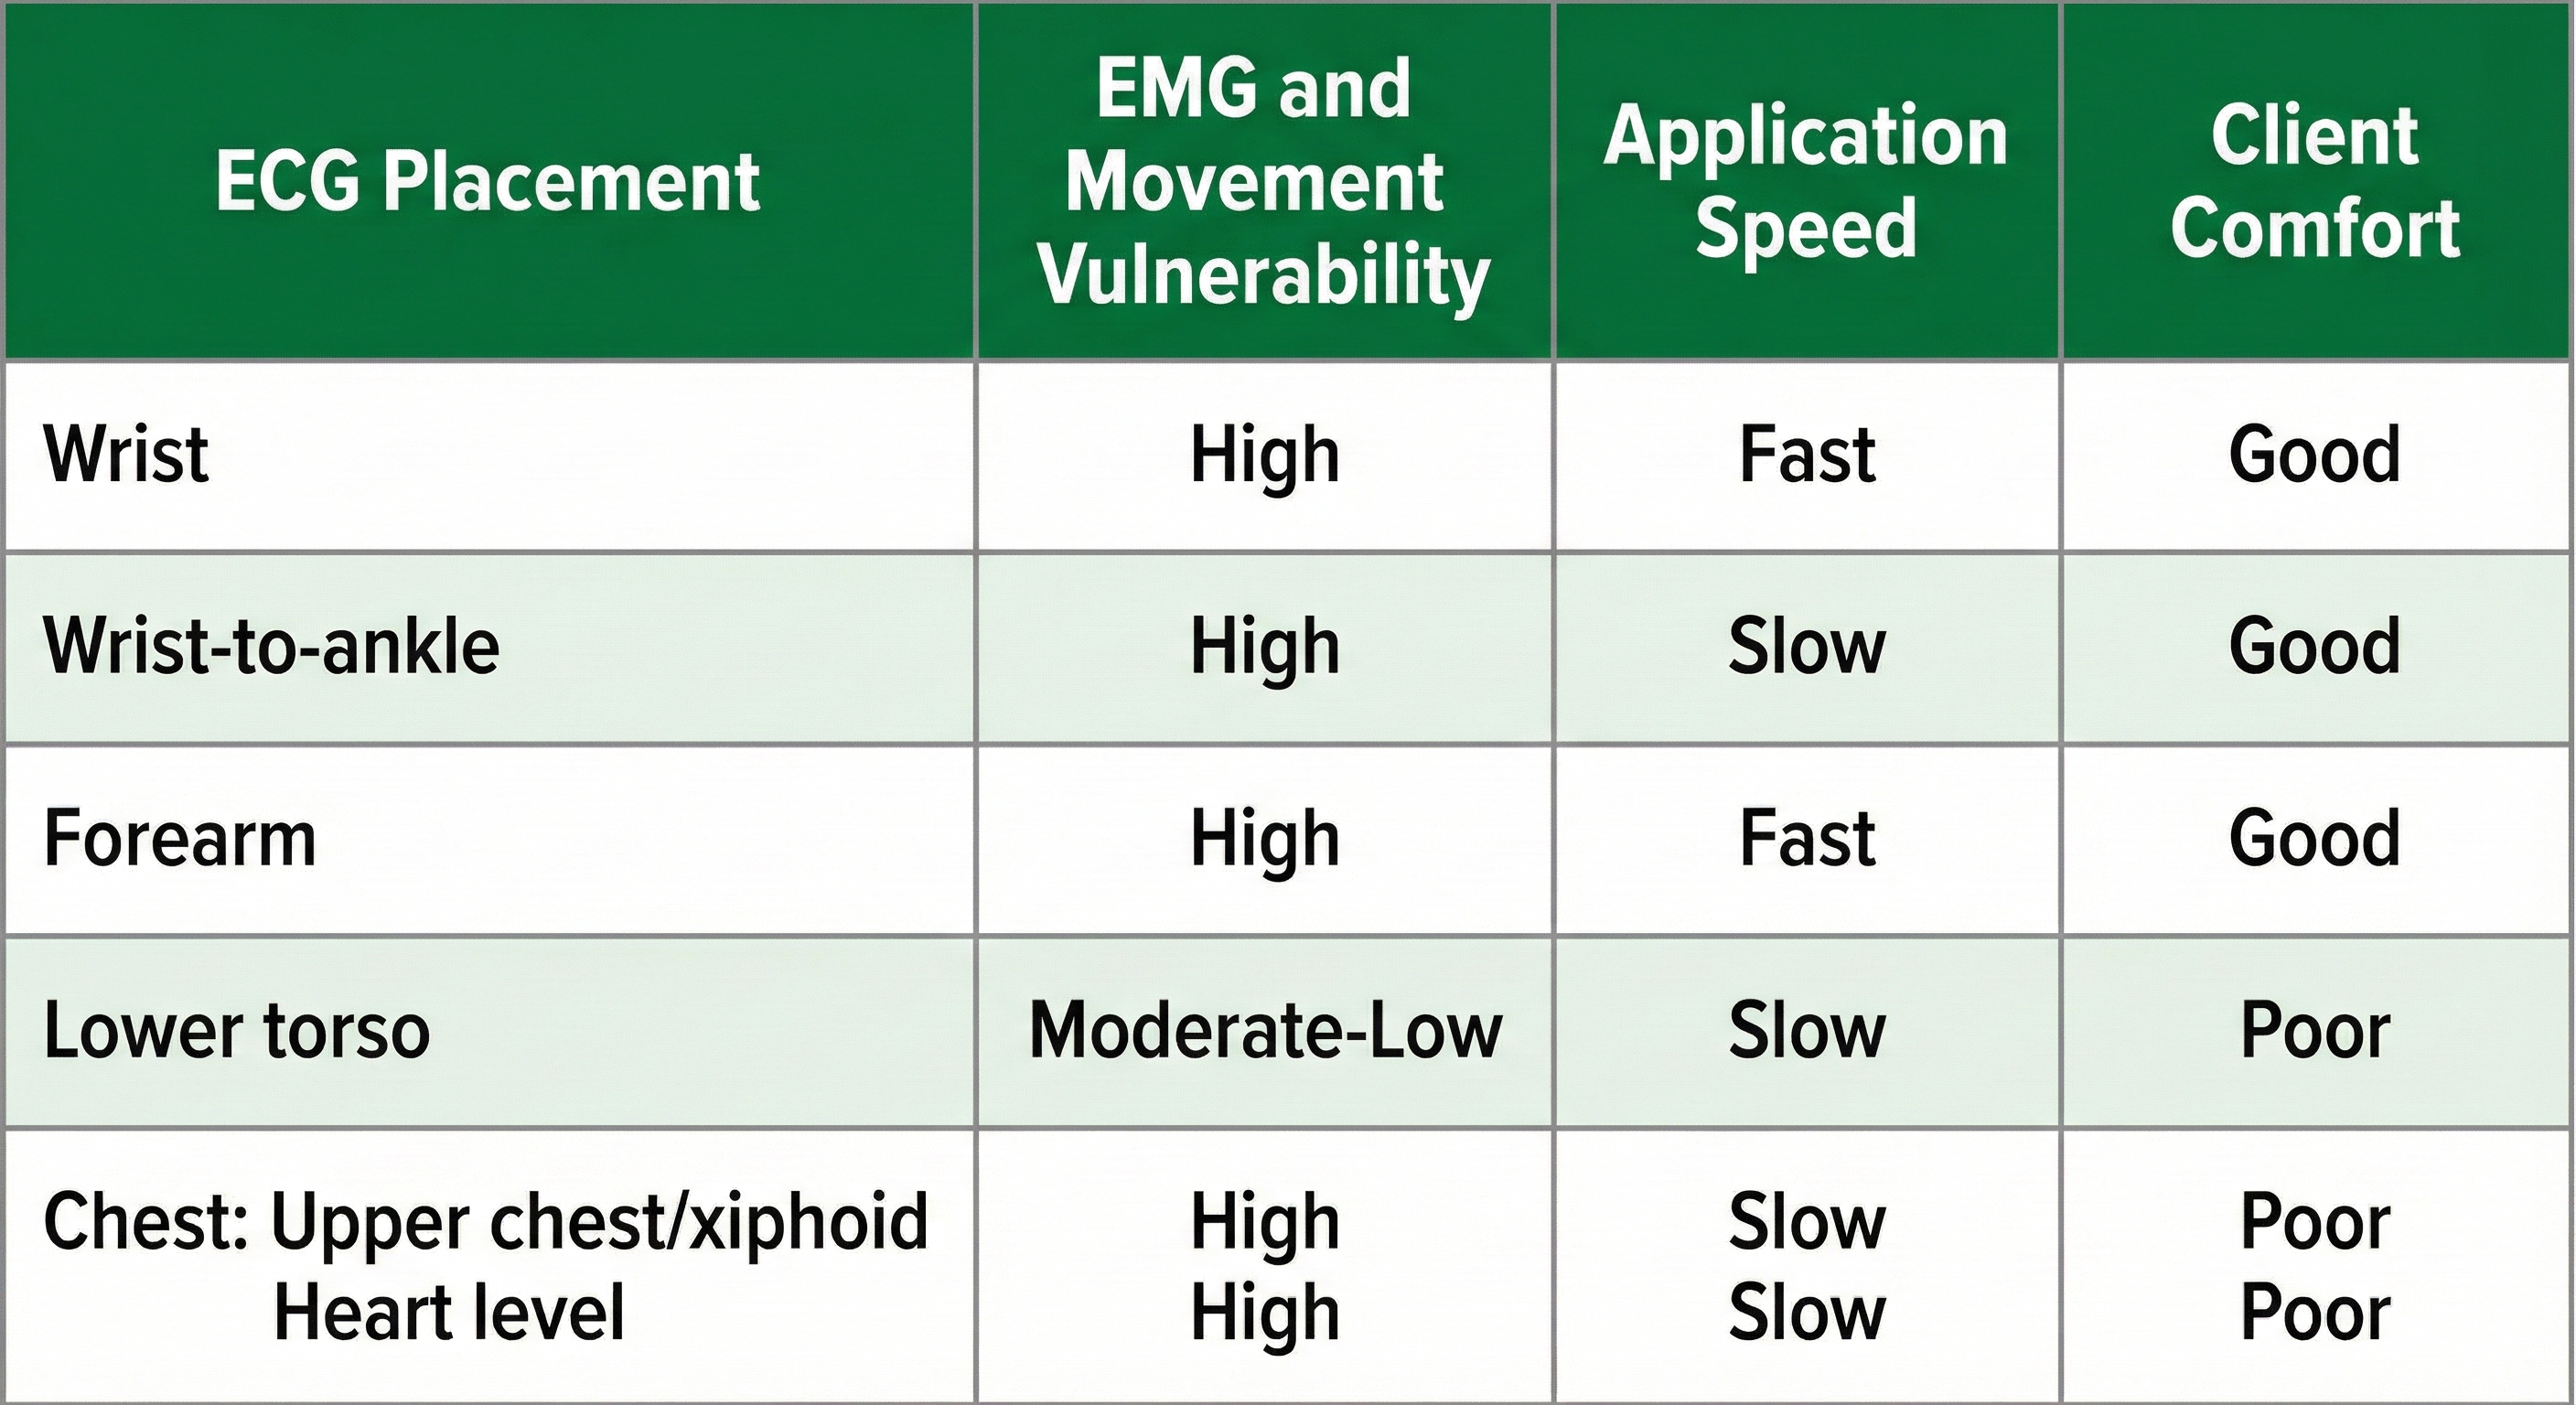
Six standard ECG electrode placements can be used. These include the wrist, wrist-to-ankle, forearm, lower torso, and chest (upper chest/xiphoid; heart level). These placements differ in vulnerability to skeletal muscle (EMG) or movement artifact, speed of application, and degree of client comfort.
🎧 Mini-Lecture: Six ECG Placements
Wrist Placement
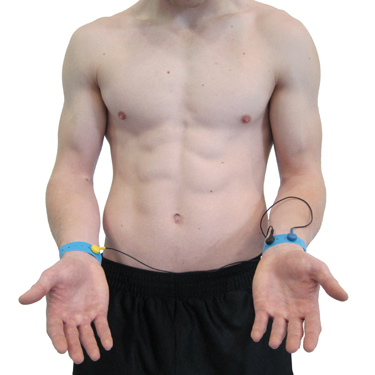
A wrist placement requires electrode straps instead of adhesive electrodes. One strap is used to attach an active electrode to the right wrist, the other to secure the reference and the second active electrode to the left wrist. While the easiest, most socially comfortable, and quickest ECG electrode placement is highly vulnerable to arm EMG artifact and movement artifact.
Wrist-to-Ankle Placement
Place the active (+) electrodes on the left wrist and ankle and the reference (-) electrode on the right wrist.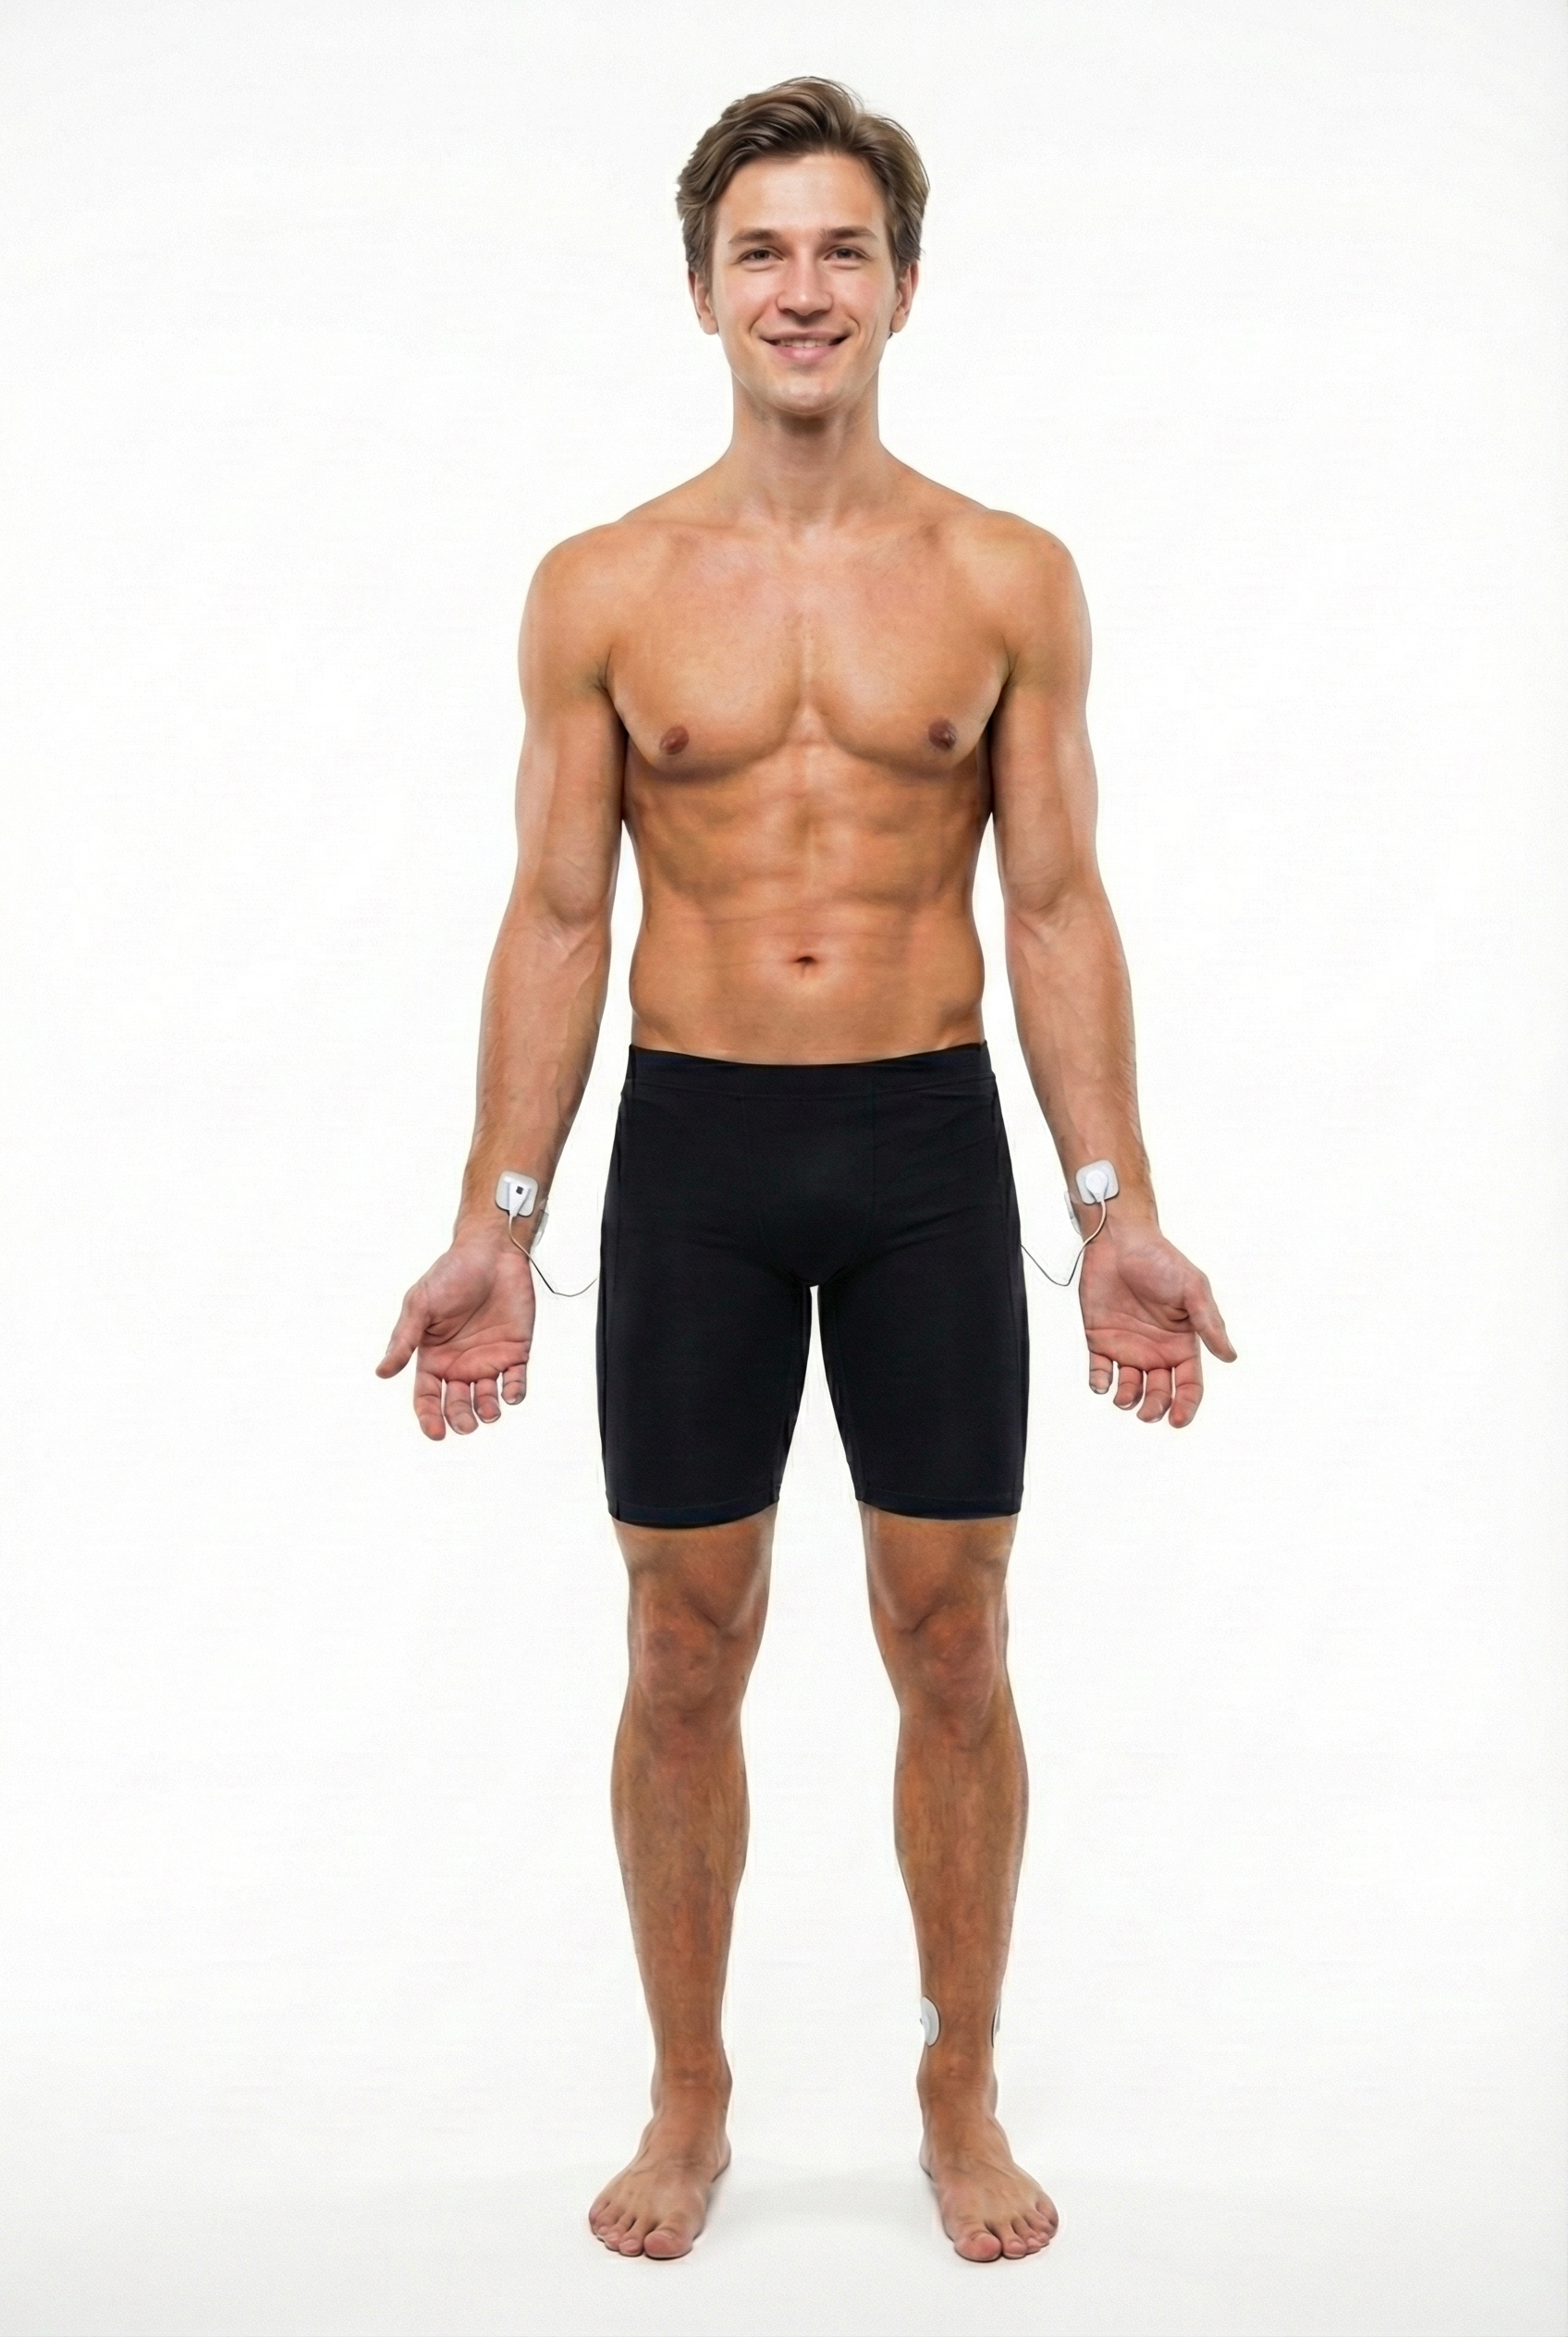
The right-arm-to-left-leg placement often accentuates the R-spike in individuals with large T-waves and is less invasive than chest or lower torso placements. This placement is more vulnerable to movement artifacts than the chest or lower torso placement (Lehrer, 2018). Graphic © Designua/Shutterstock.com.
Forearm Placement
A forearm placement locates an active electrode on the right forearm and the reference and second active electrodes on the left forearm. Select an area with minimal or no hair. This placement is more vulnerable to arm and chest EMG artifact and movement artifact contamination.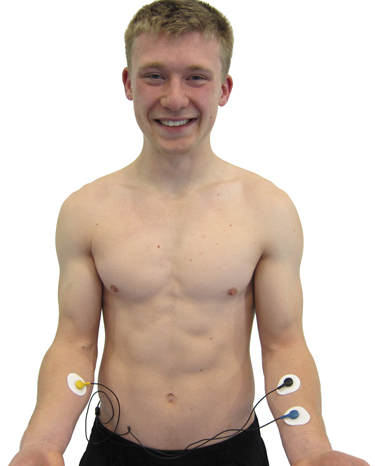
Lower Torso Placement
A lower torso placement suggested by Peper (2010) centers the reference electrode over the angle of the sternum and the active electrodes about 5 centimeters above the navel and 10 centimeters to the left and right of the midline. This placement provides an alternative for clients who are uncomfortable exposing their chests (they can lift their blouse or shirt) and is less vulnerable to arm EMG artifact and movement artifact.
.jpg)
Chest Placement
A chest placement locates active and reference electrodes over the right and left coracoid processes, respectively, and a second active electrode over the xiphoid process. This placement reduces the risk of arm muscle artifact but exposes the chest area, which can be uncomfortable for female clients (Shaffer & Combatalade, 2013).
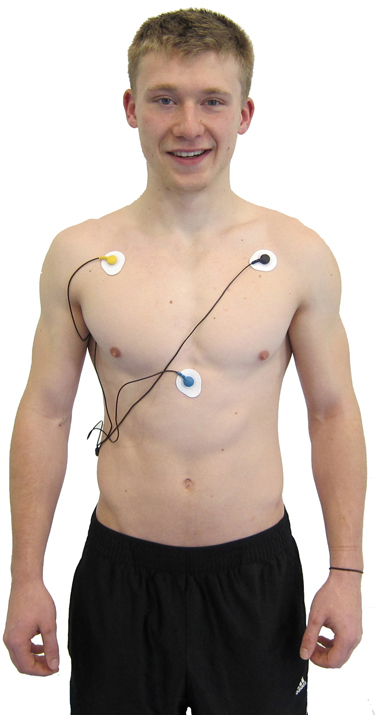
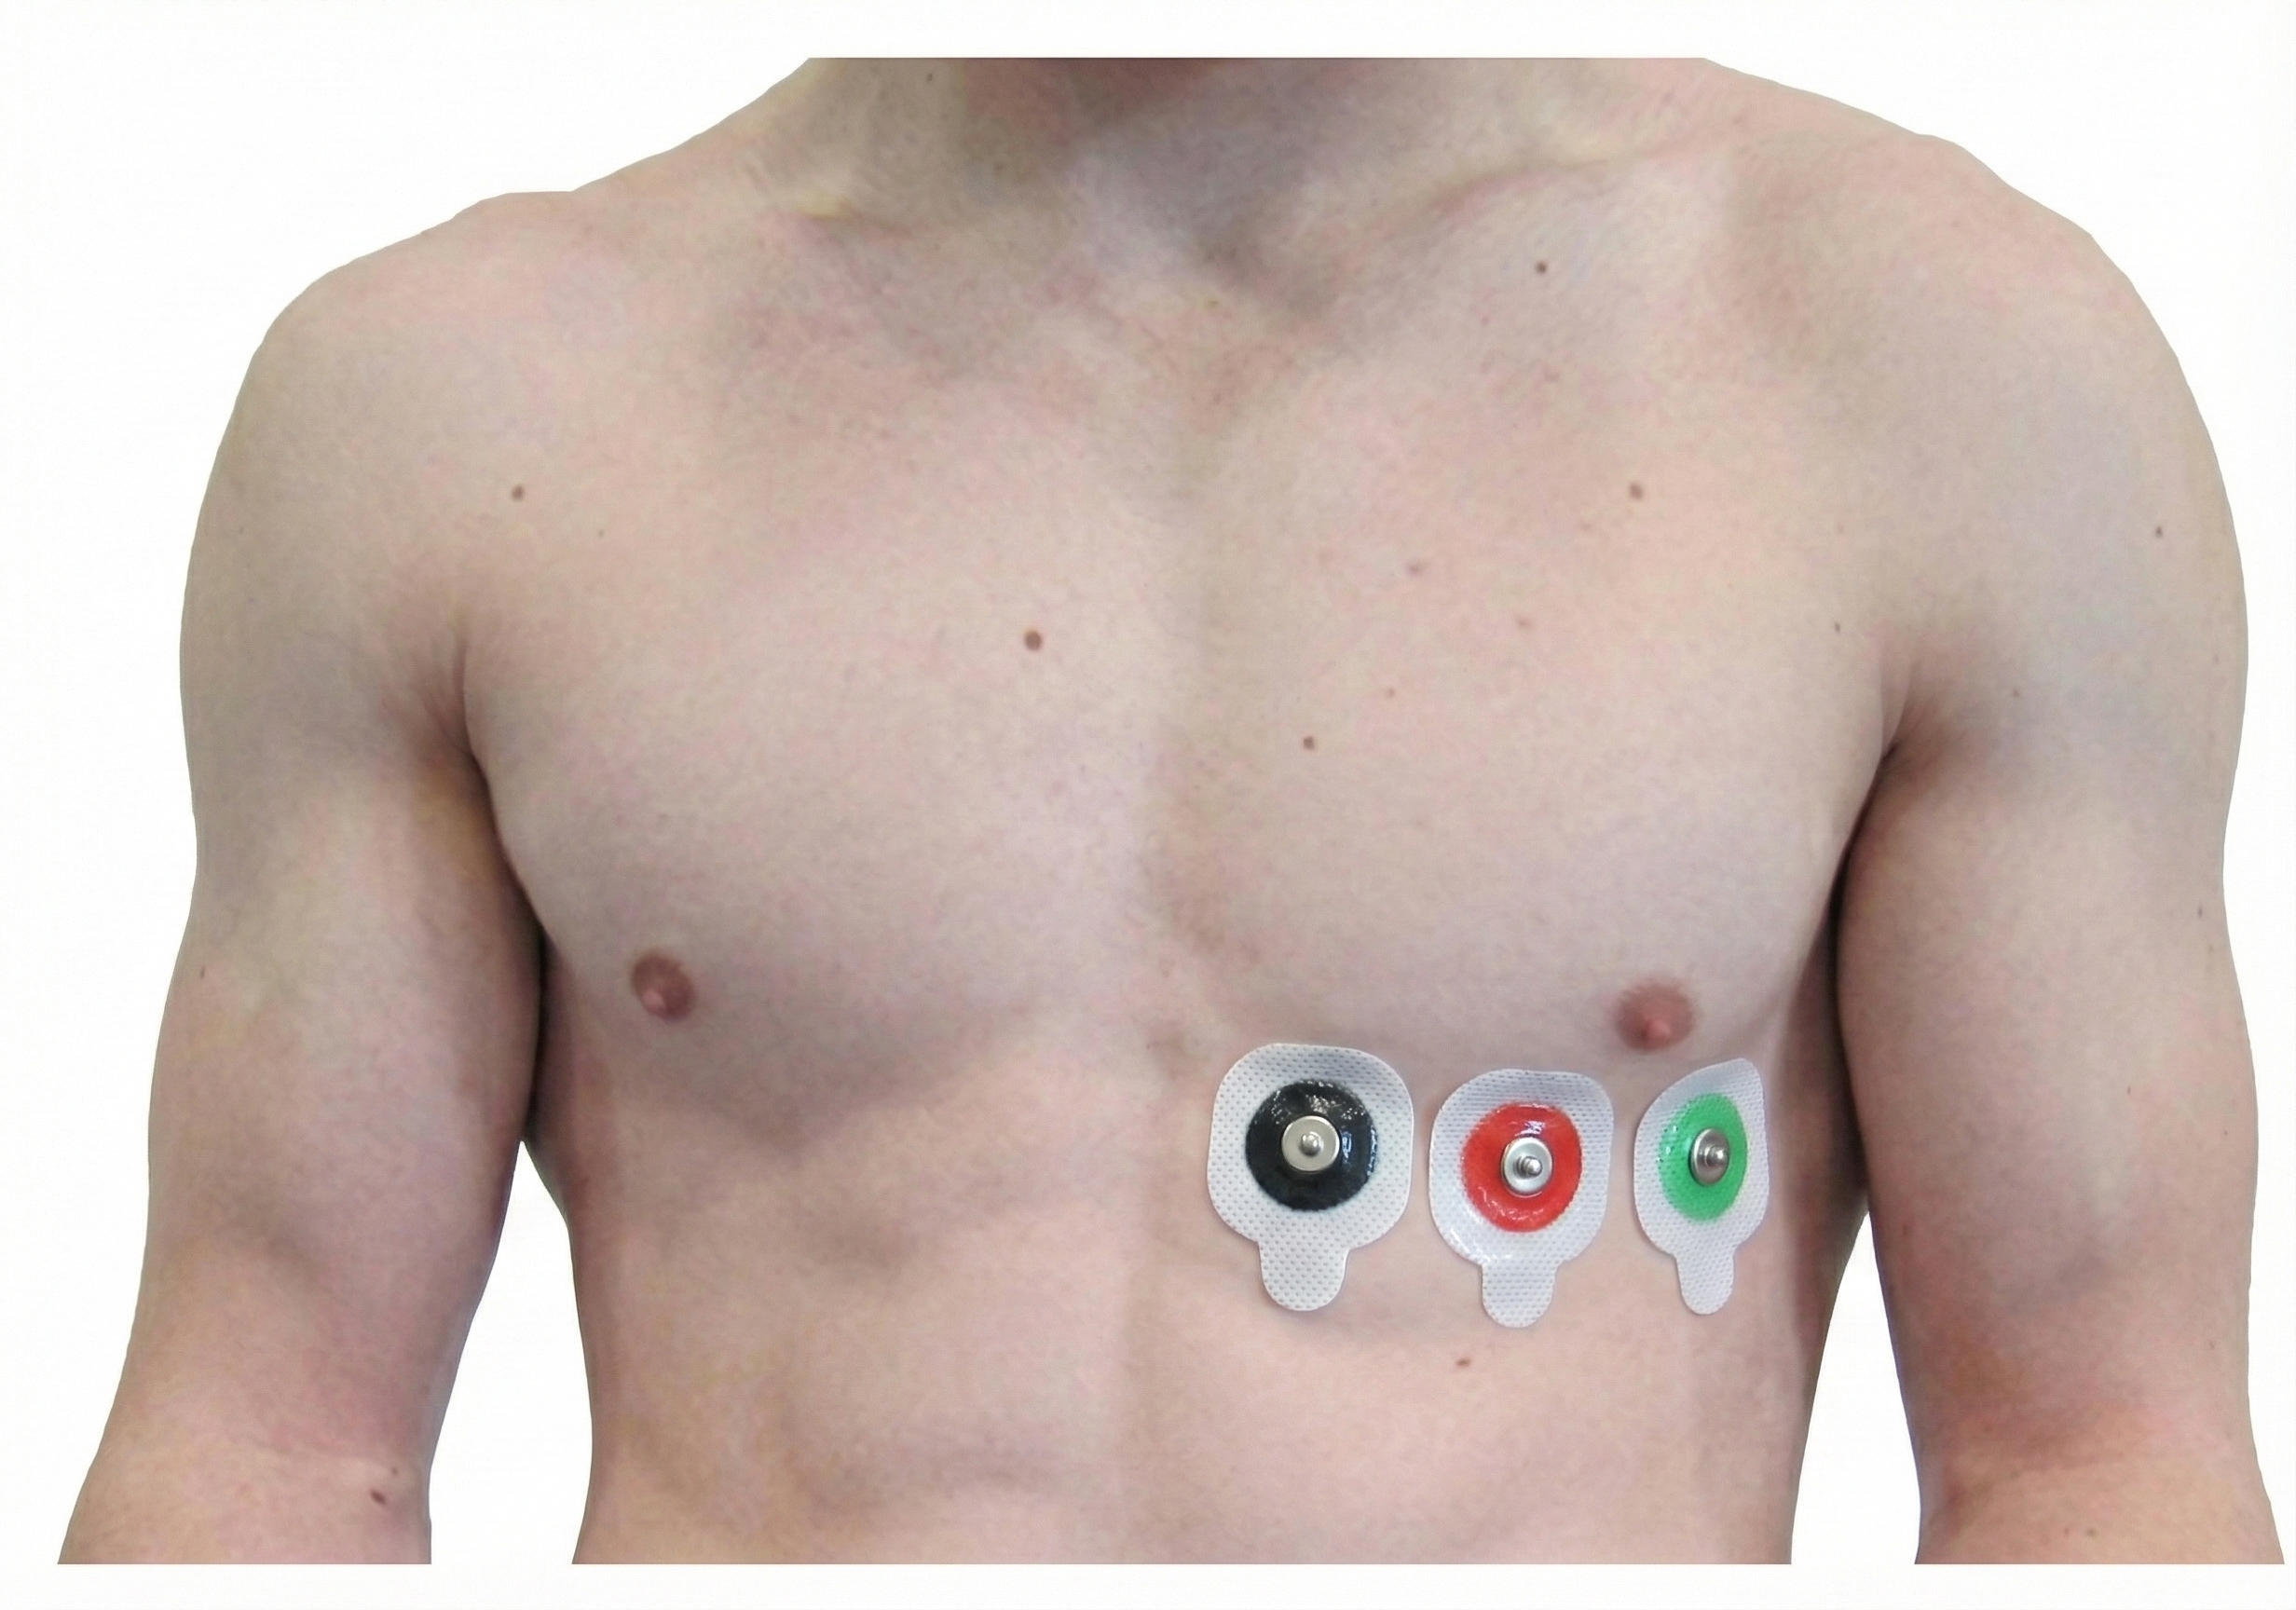
An alternative chest placement locates all three electrodes in a row at heart level. This sensor arrangement can detect the largest-amplitude R-spikes (Lehrer, 2018b).
Placement Summary
Wrist or forearm placements offer greater client comfort and quicker application speeds where EMG and movement artifacts don't contaminate your recordings. The lower torso placement may be best for research when these artifacts are present. Sensor placement on the upper chest and abdomen requires client/participant education and written informed consent.
ECG/EKG Artifacts
ECG recording is vulnerable to diverse artifacts. Missing or extra beats, 50/60Hz noise, EMG, respiration, movement, DC offset, electromagnetic (EMI), and electrode polarity produce the most important artifacts.
Missed and Extra Beats
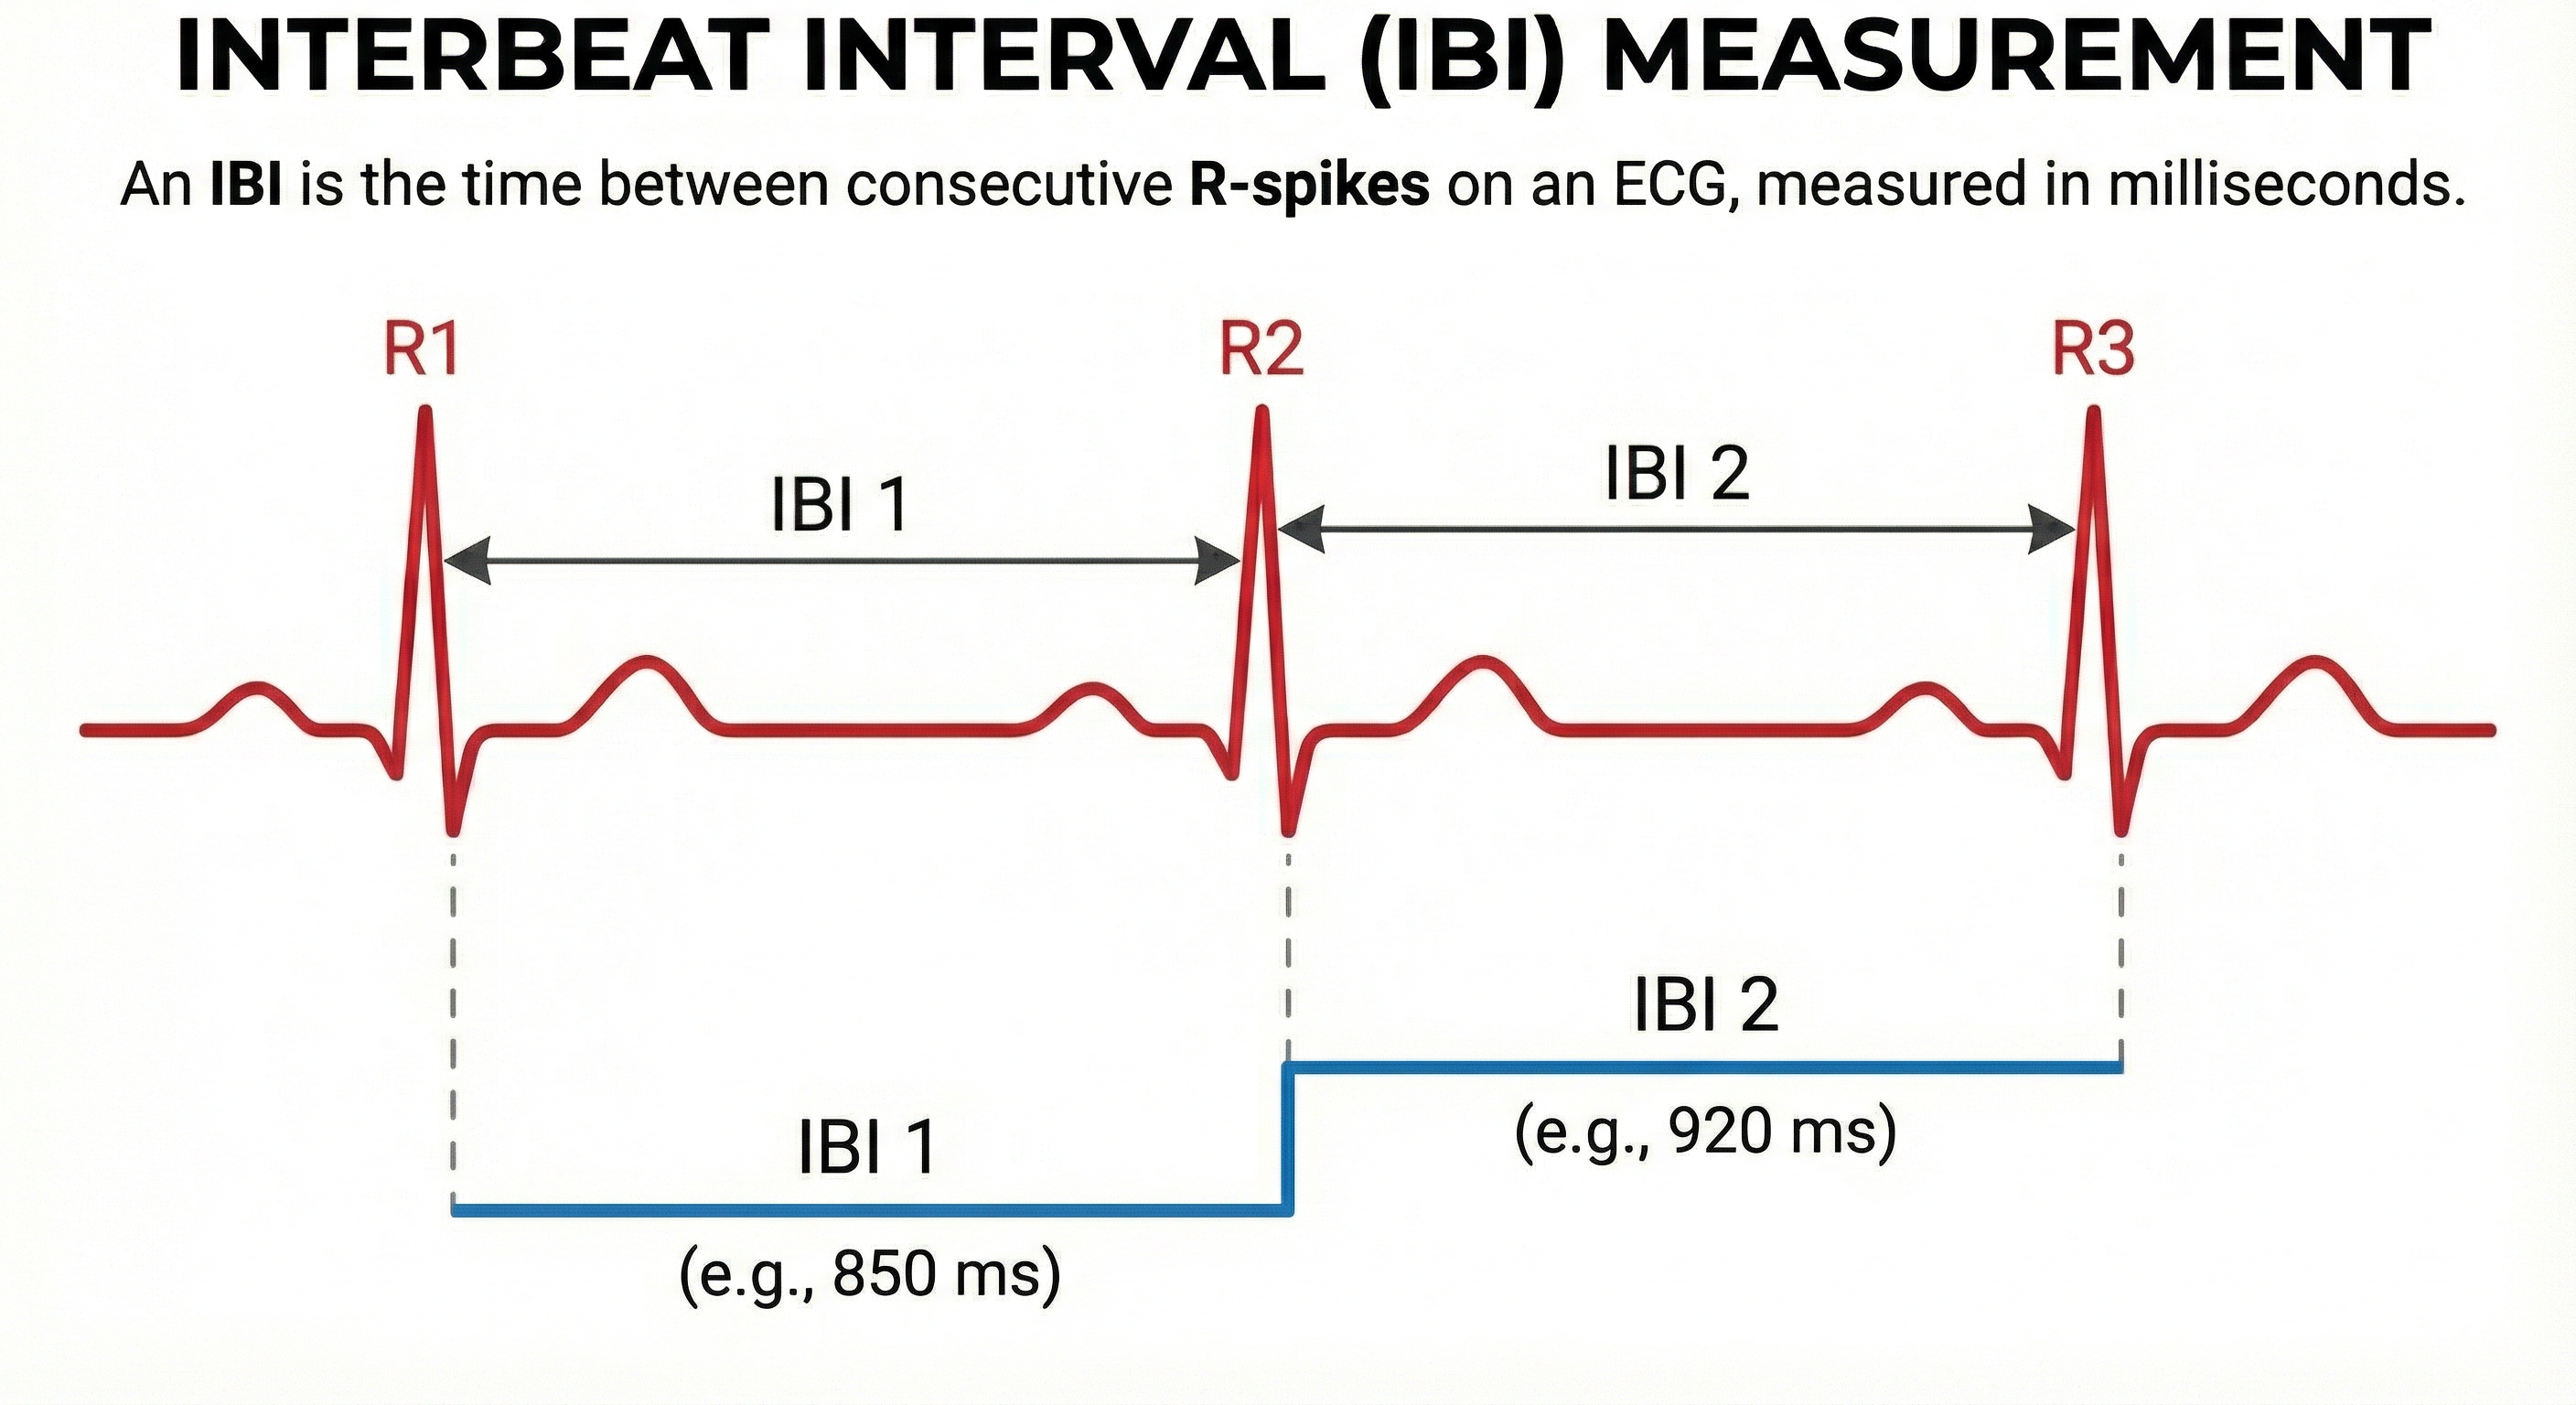
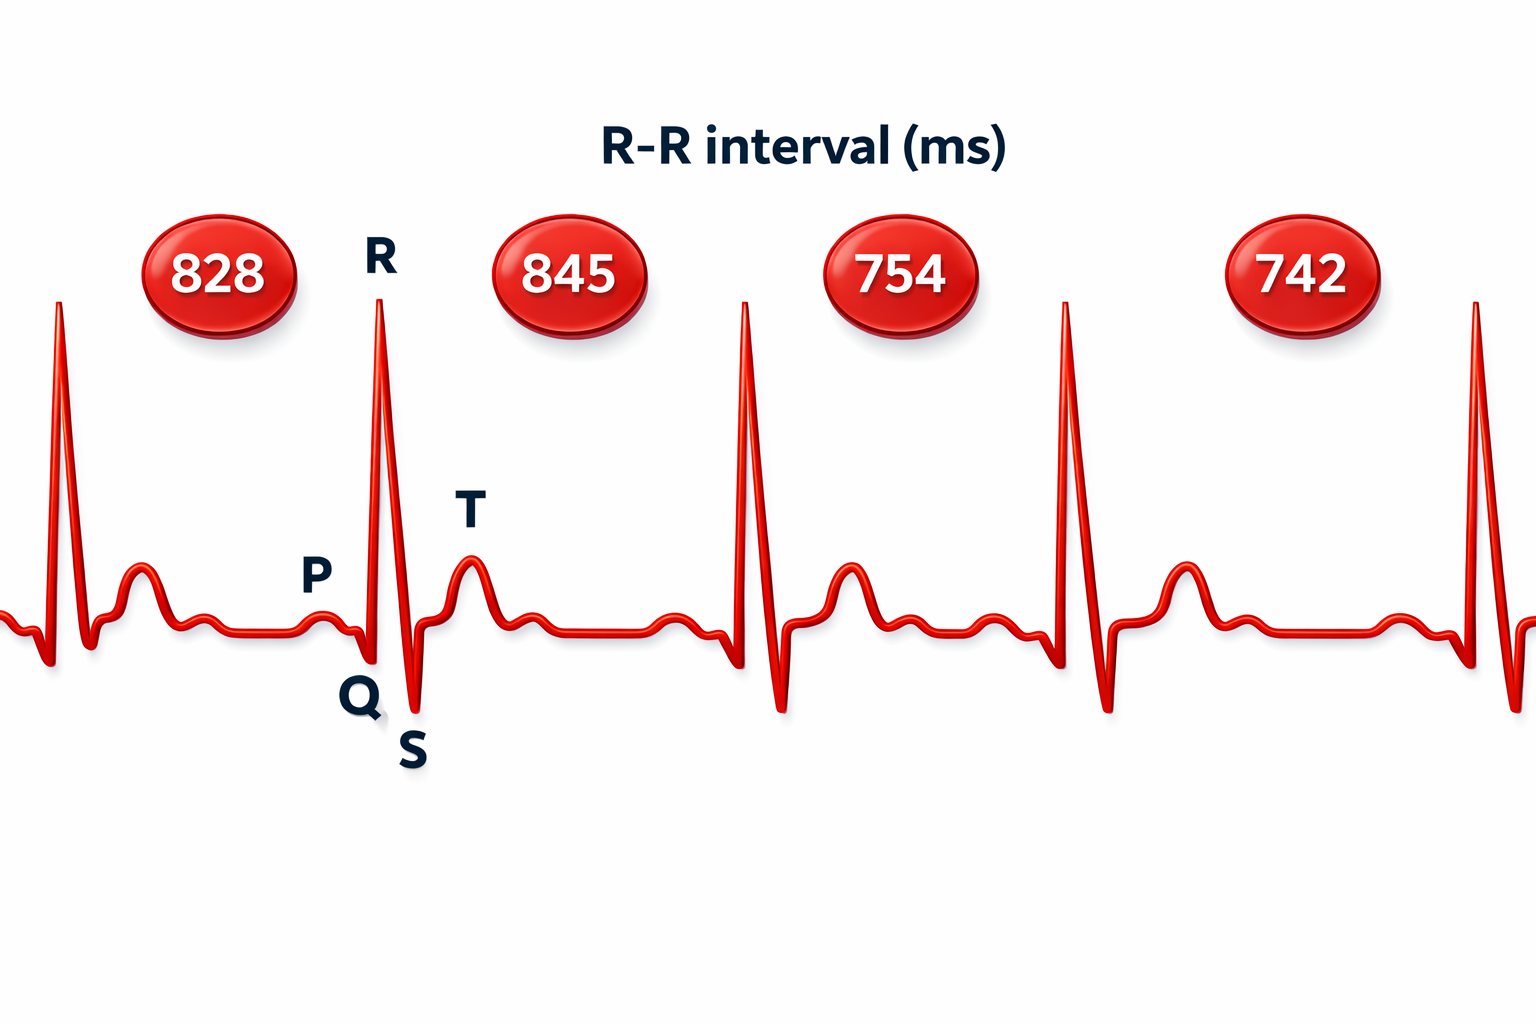
HRV software determines the interbeat interval (IBI) by detecting adjacent beats and measuring the time between R-spikes.
🎧 Mini-Lecture: Missed and Extra Beats
Graphic © arka38/Shutterstock.com.
After detecting the first beat, the software starts counting and calculates the first IBI in milliseconds. This process is repeated until the end of the epoch or data collection period. Graphic adapted from Dr. Richard Gevirtz.
IBI measurements are the basis of statistical calculations of time-domain (pNN50, RMSSD, and SDNN), frequency-domain (VLF, LF, and HF), and nonlinear measurements.
As with BVP, use clean ECG recordings as a reference.
HRV artifacts can be produced by physiological events like atrial fibrillation, premature atrial contractions (PACs) and premature ventricular contractions (PVCs).
Discard a segment when more than 5% of IBI values are corrupted. Depending on the frequency of conduction abnormalities, you may not be able to analyze a contaminated data record.
Conversely, when distortion causes the software to detect an extra beat, this produces an artifactually short interbeat interval (IBI). As emphasized earlier, missed and extra beats also affect PPG recording (Elgendi, 2012).
Inspect the raw ECG signal for line interference, EMG, movement, DC offset, electromagnetic interference, radiofrequency, and polarity artifacts.
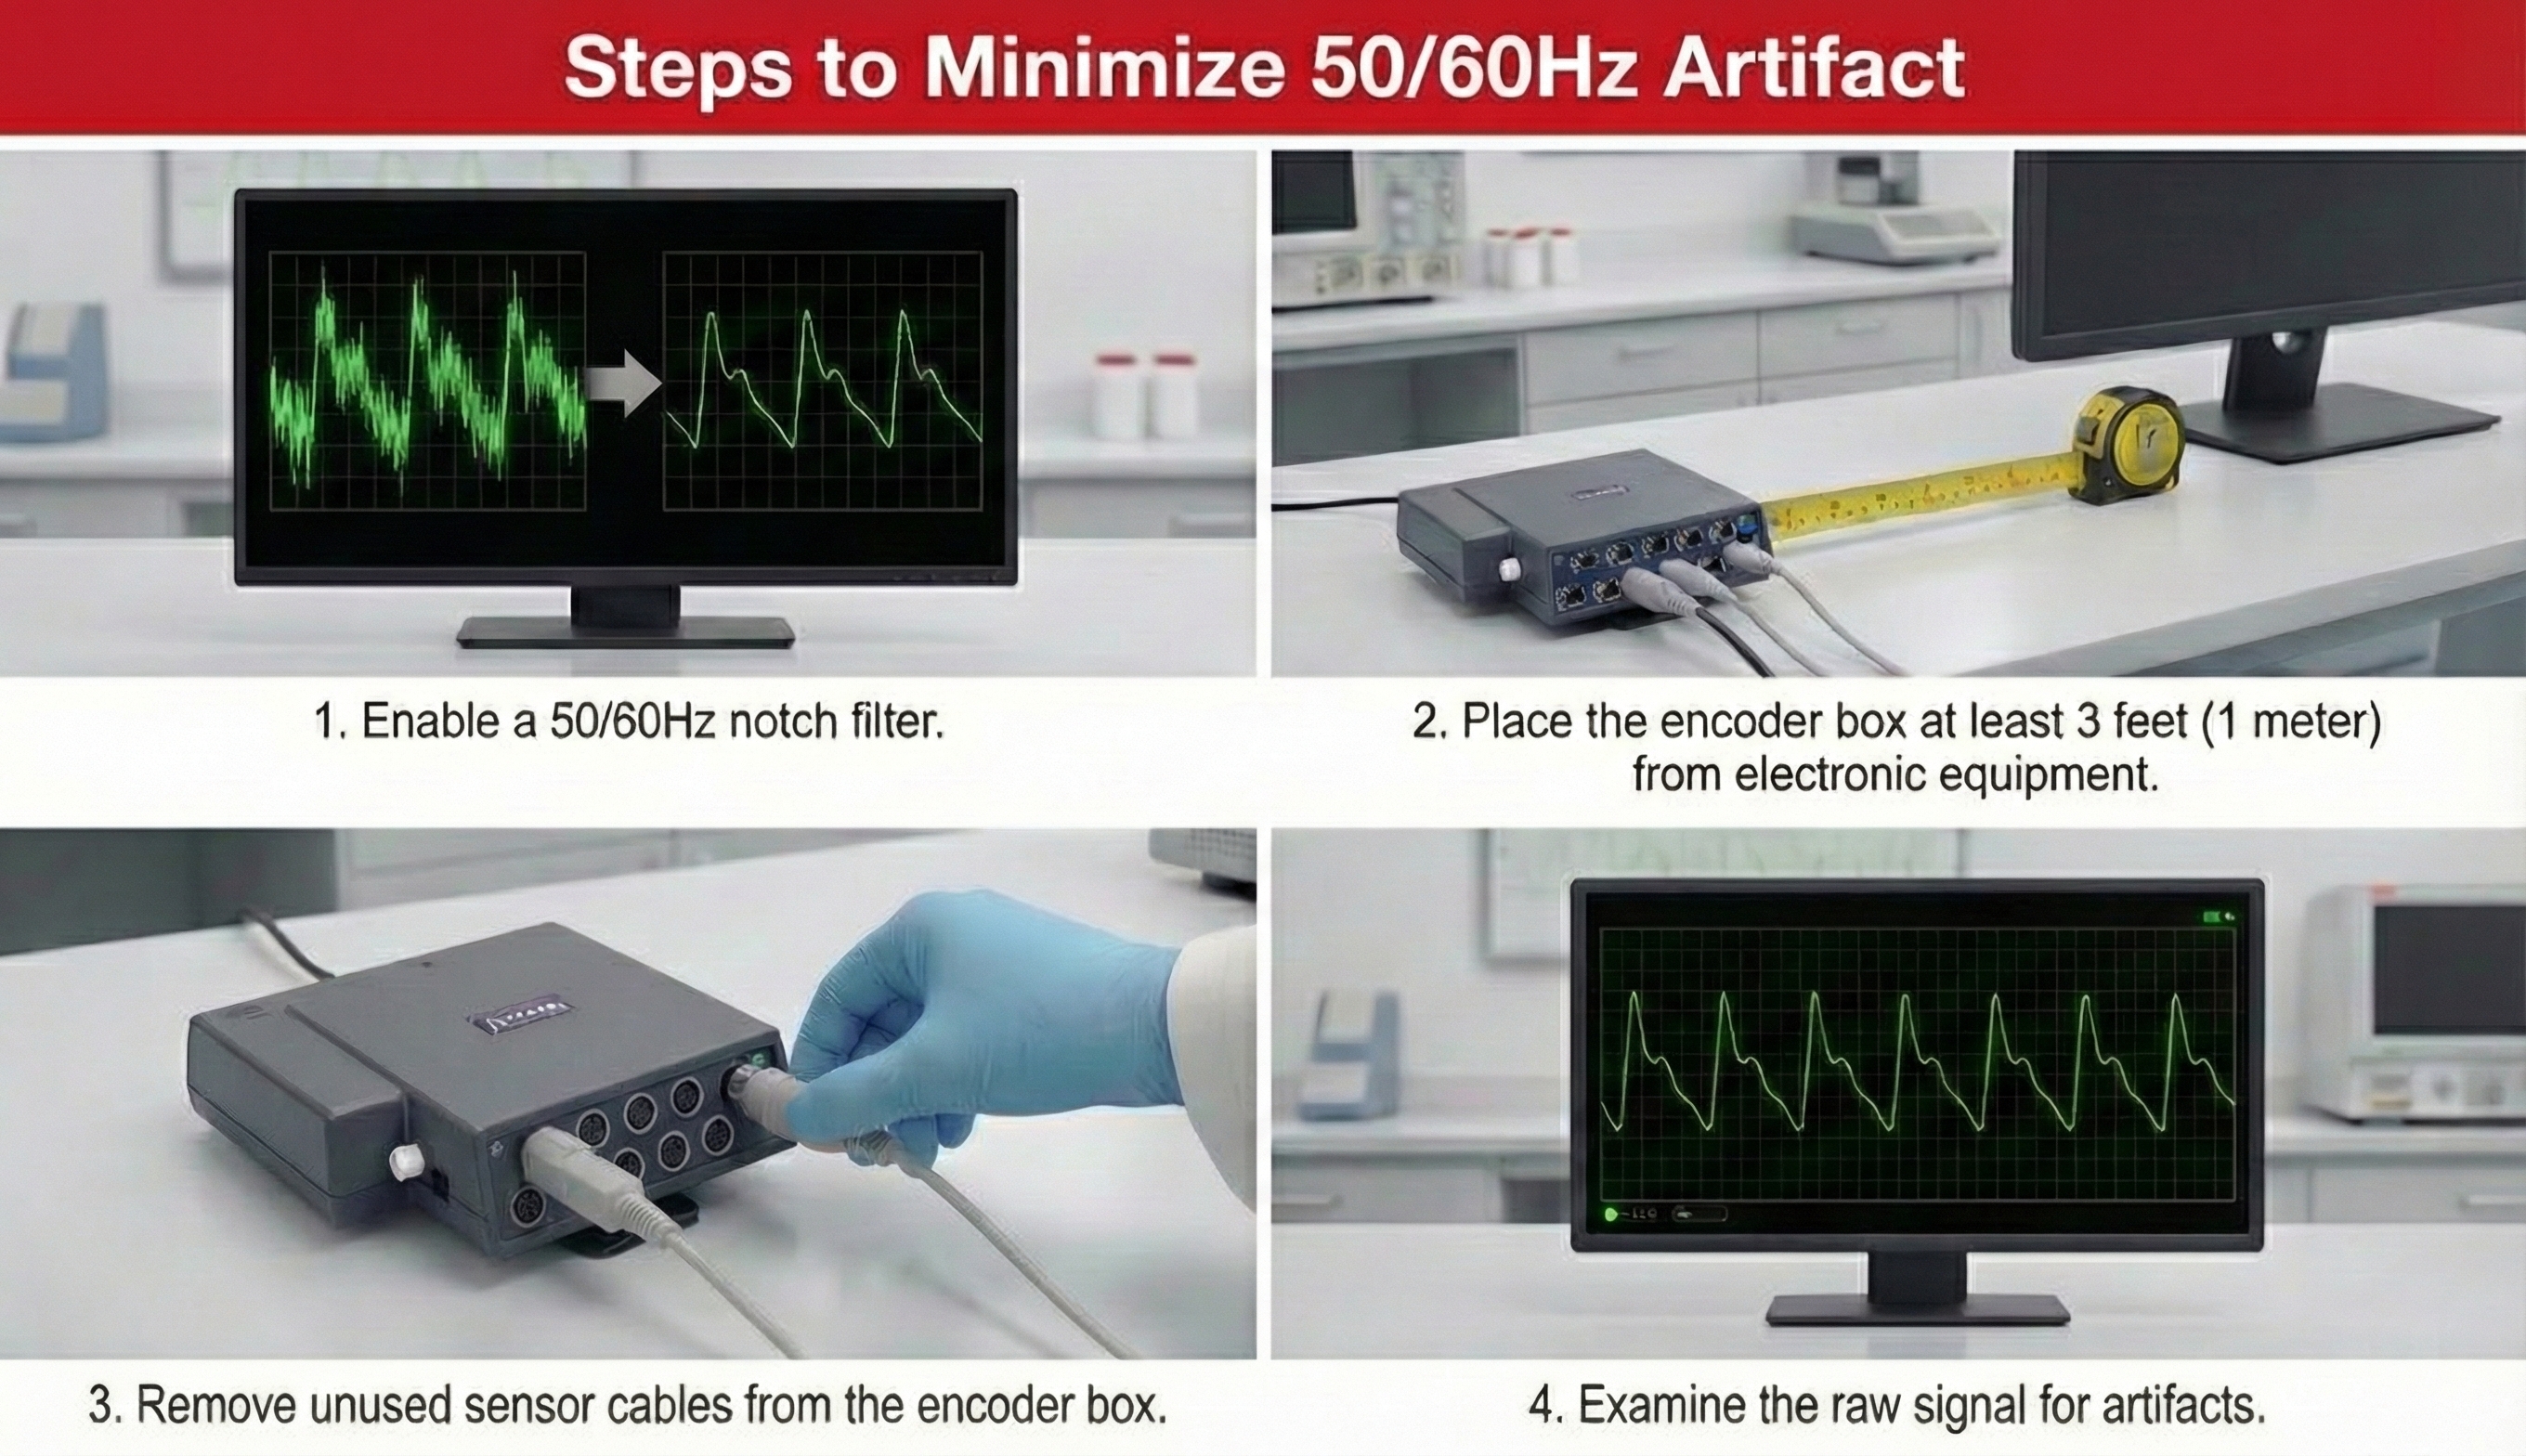
Line Interference (50/60 Hz) Artifact
Line interference artifact is the most frequent source of ECG signal contamination.🎧 Mini-Lecture: ECG Line Interference Artifact
Line interference doesn’t affect the BVP signal significantly because it is based on back-scattered or transmitted infrared light. Moreover, PPG sensors are designed to filter out 50/60 Hz activity. However, line interference does affect the ECG signal. Primary sources of this artifact include computers, computer monitors, fluorescent lights, and power outlets. The line interference artifact looks fuzzy because high-frequency fluctuations are superimposed on the signal (Shaffer & Combatalade, 2013).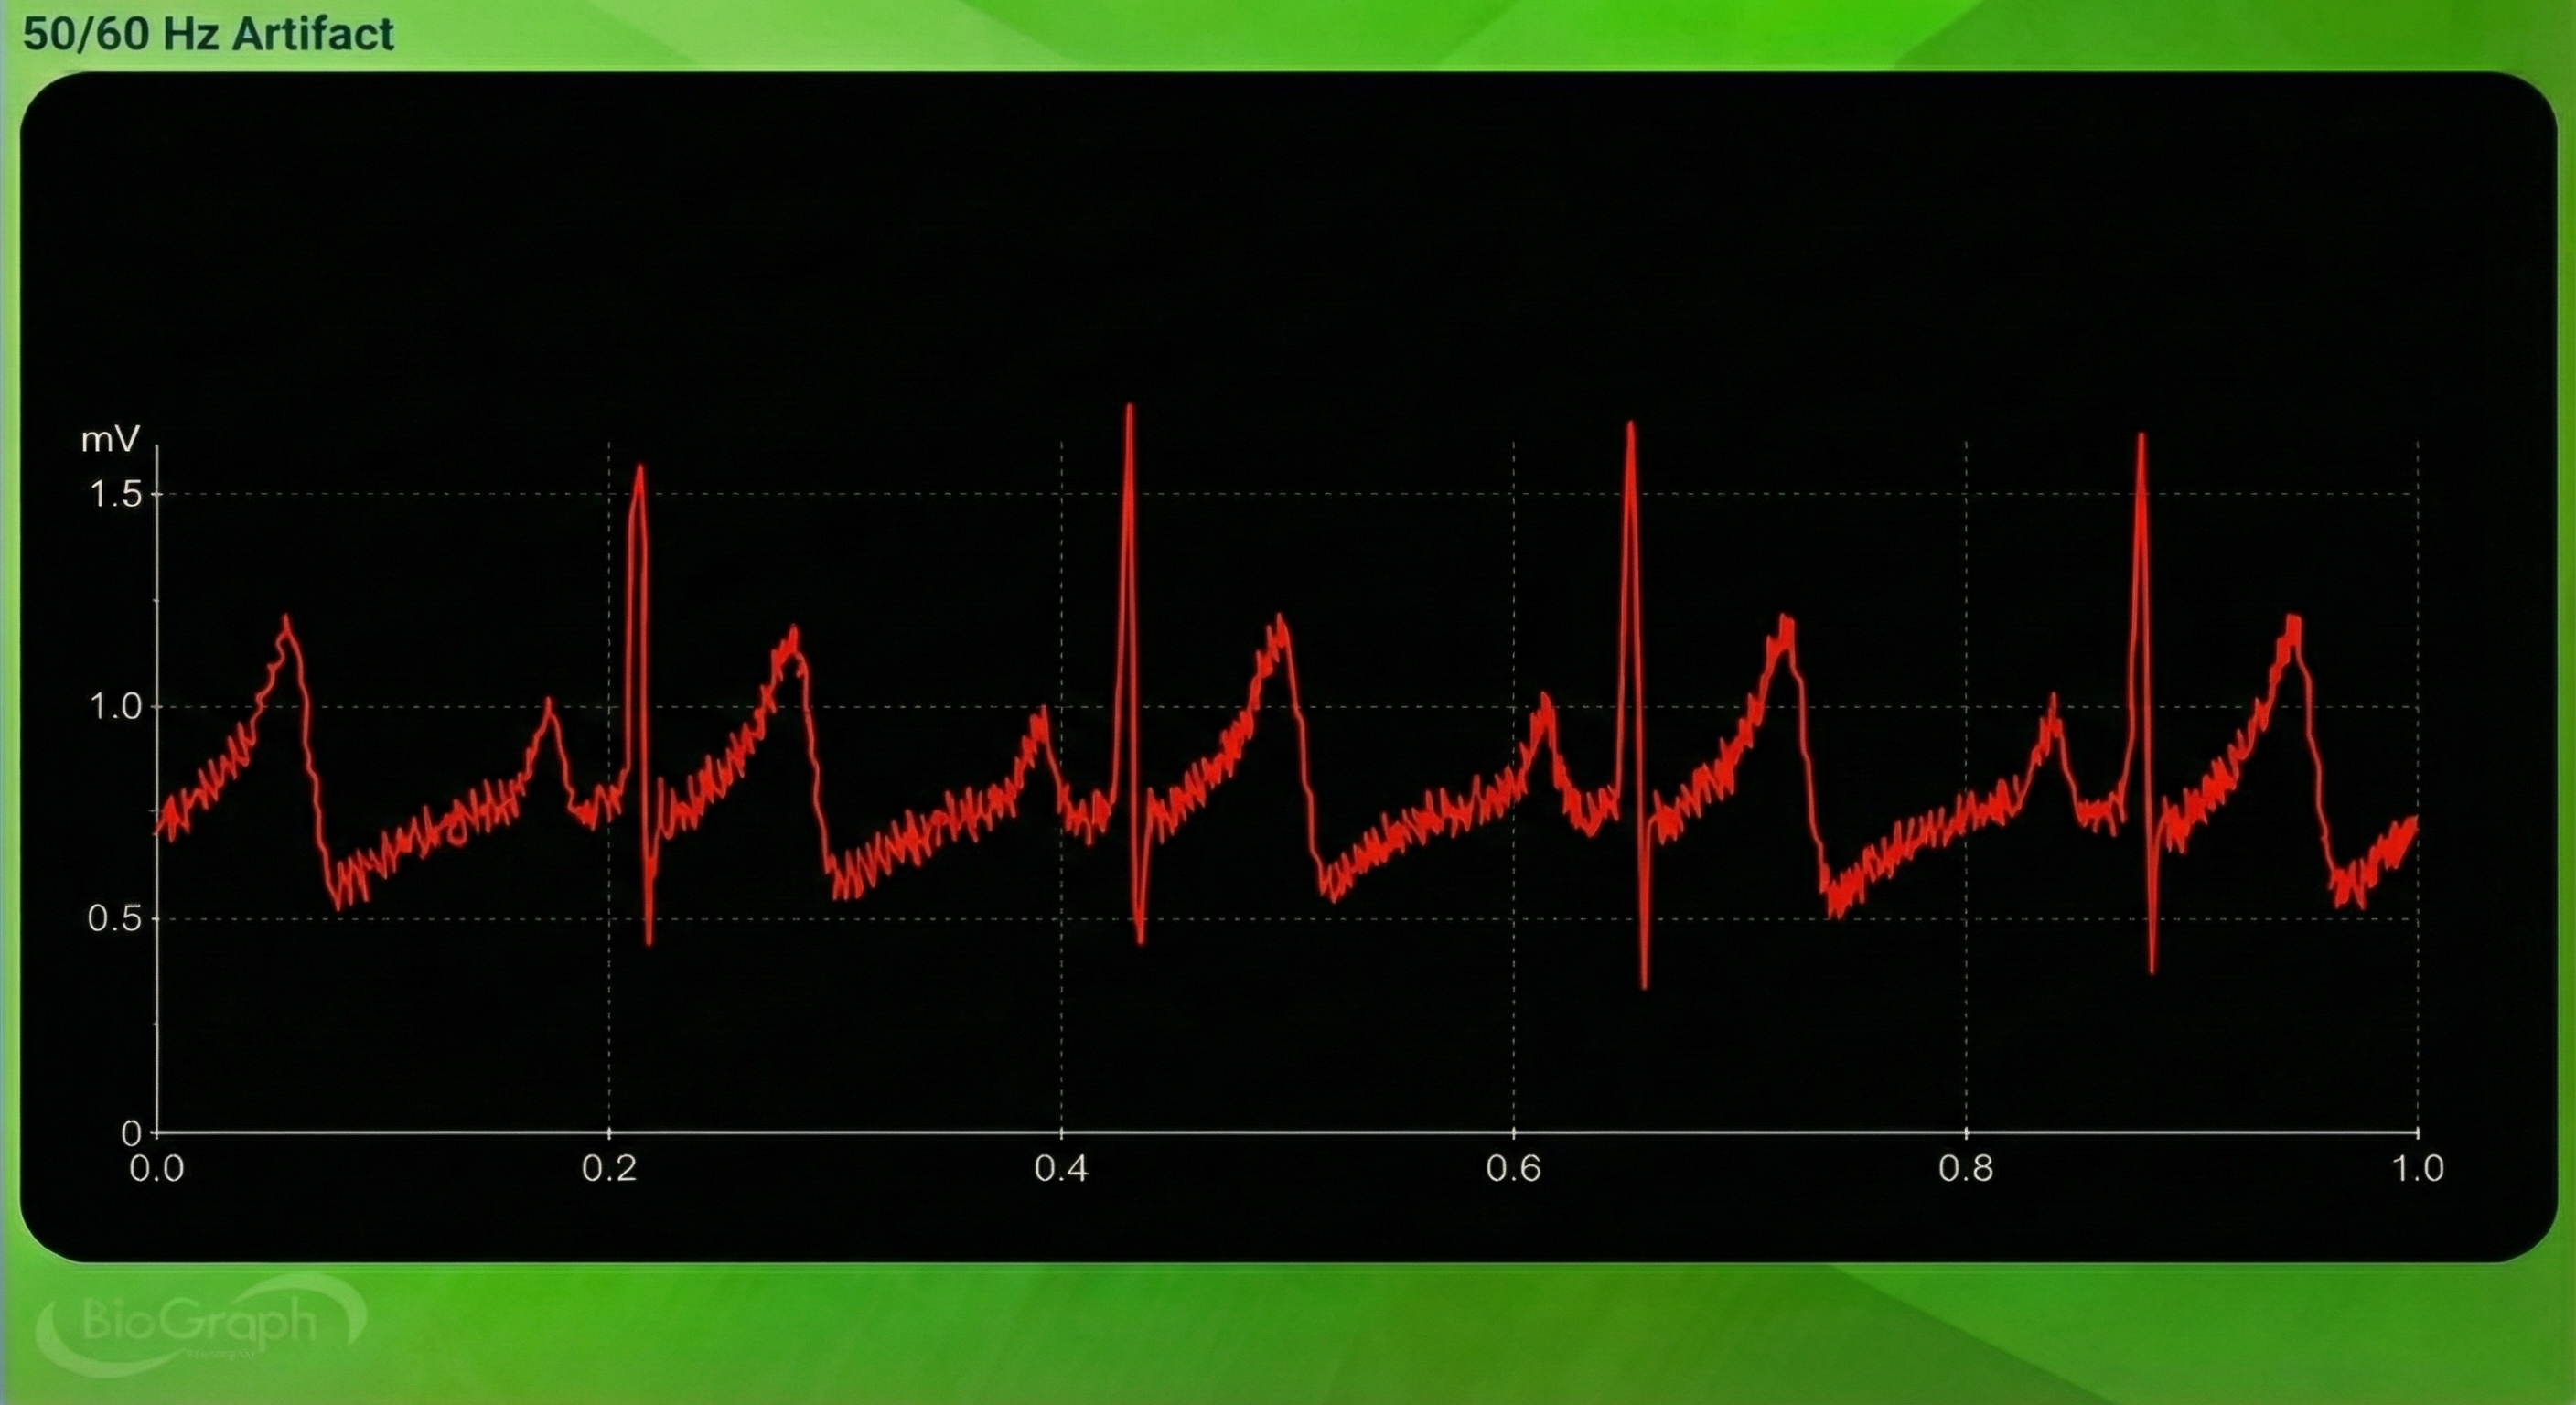
EMG Artifact
Frequencies generated by the depolarization of skeletal muscles overlap with the ECG spectrum and produce EMG artifacts.
🎧 Mini-Lecture: ECG EMG Artifact
The surface EMG ranges from 1-1,000 Hz (Stern, Ray, & Quigley, 2001), while the ECG extends from 0.1-1,000 Hz (Langner & Geselowitz, 1960). Muscle action potentials from large muscle groups travel to ECG sensors via the process of volume conduction (Shaffer & Neblett, 2010).
Contraction of muscles in the arm can cause the software to "see" many extra beats and calculate shorter IBIs (Shaffer & Combatalade, 2013).
While EMG artifact affects ECG recordings, it does not contaminate the BVP signal since we detect it using infrared light.
Movement Artifact
Client movement can pull the electrode cable so that the electrode partially (or completely) loses contact with the skin.
🎧 Mini-Lecture: ECG Movement Artifact
Movement artifact consists of high-amplitude signal fluctuations that cause the software to "see many extra beats and calculate shorter IBIs as with EMG artifact."
Below is a BioGraph ® Infiniti ECG display of movement artifact. The ECG (also called EKG) waveform abruptly shifts upward after the sixth heartbeat and then returns to normal.
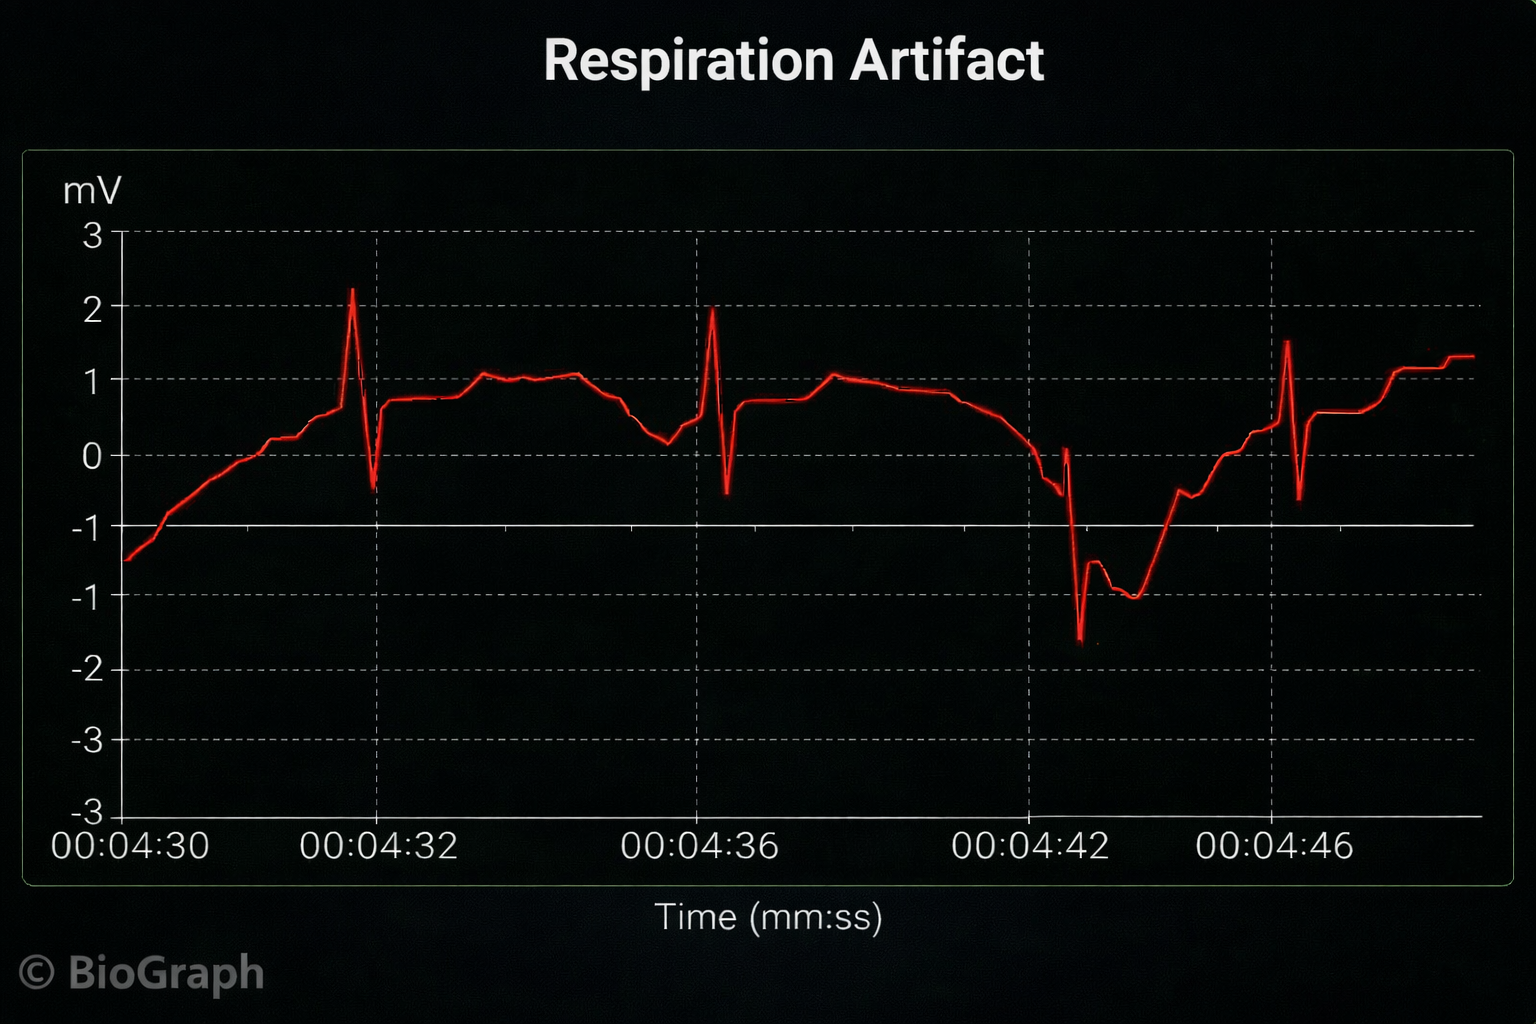
Respiration Artifact
Respiration artifacts can result from dried gel and inadequate skin preparation.
🎧 Mini-Lecture: ECG Respiration Artifact
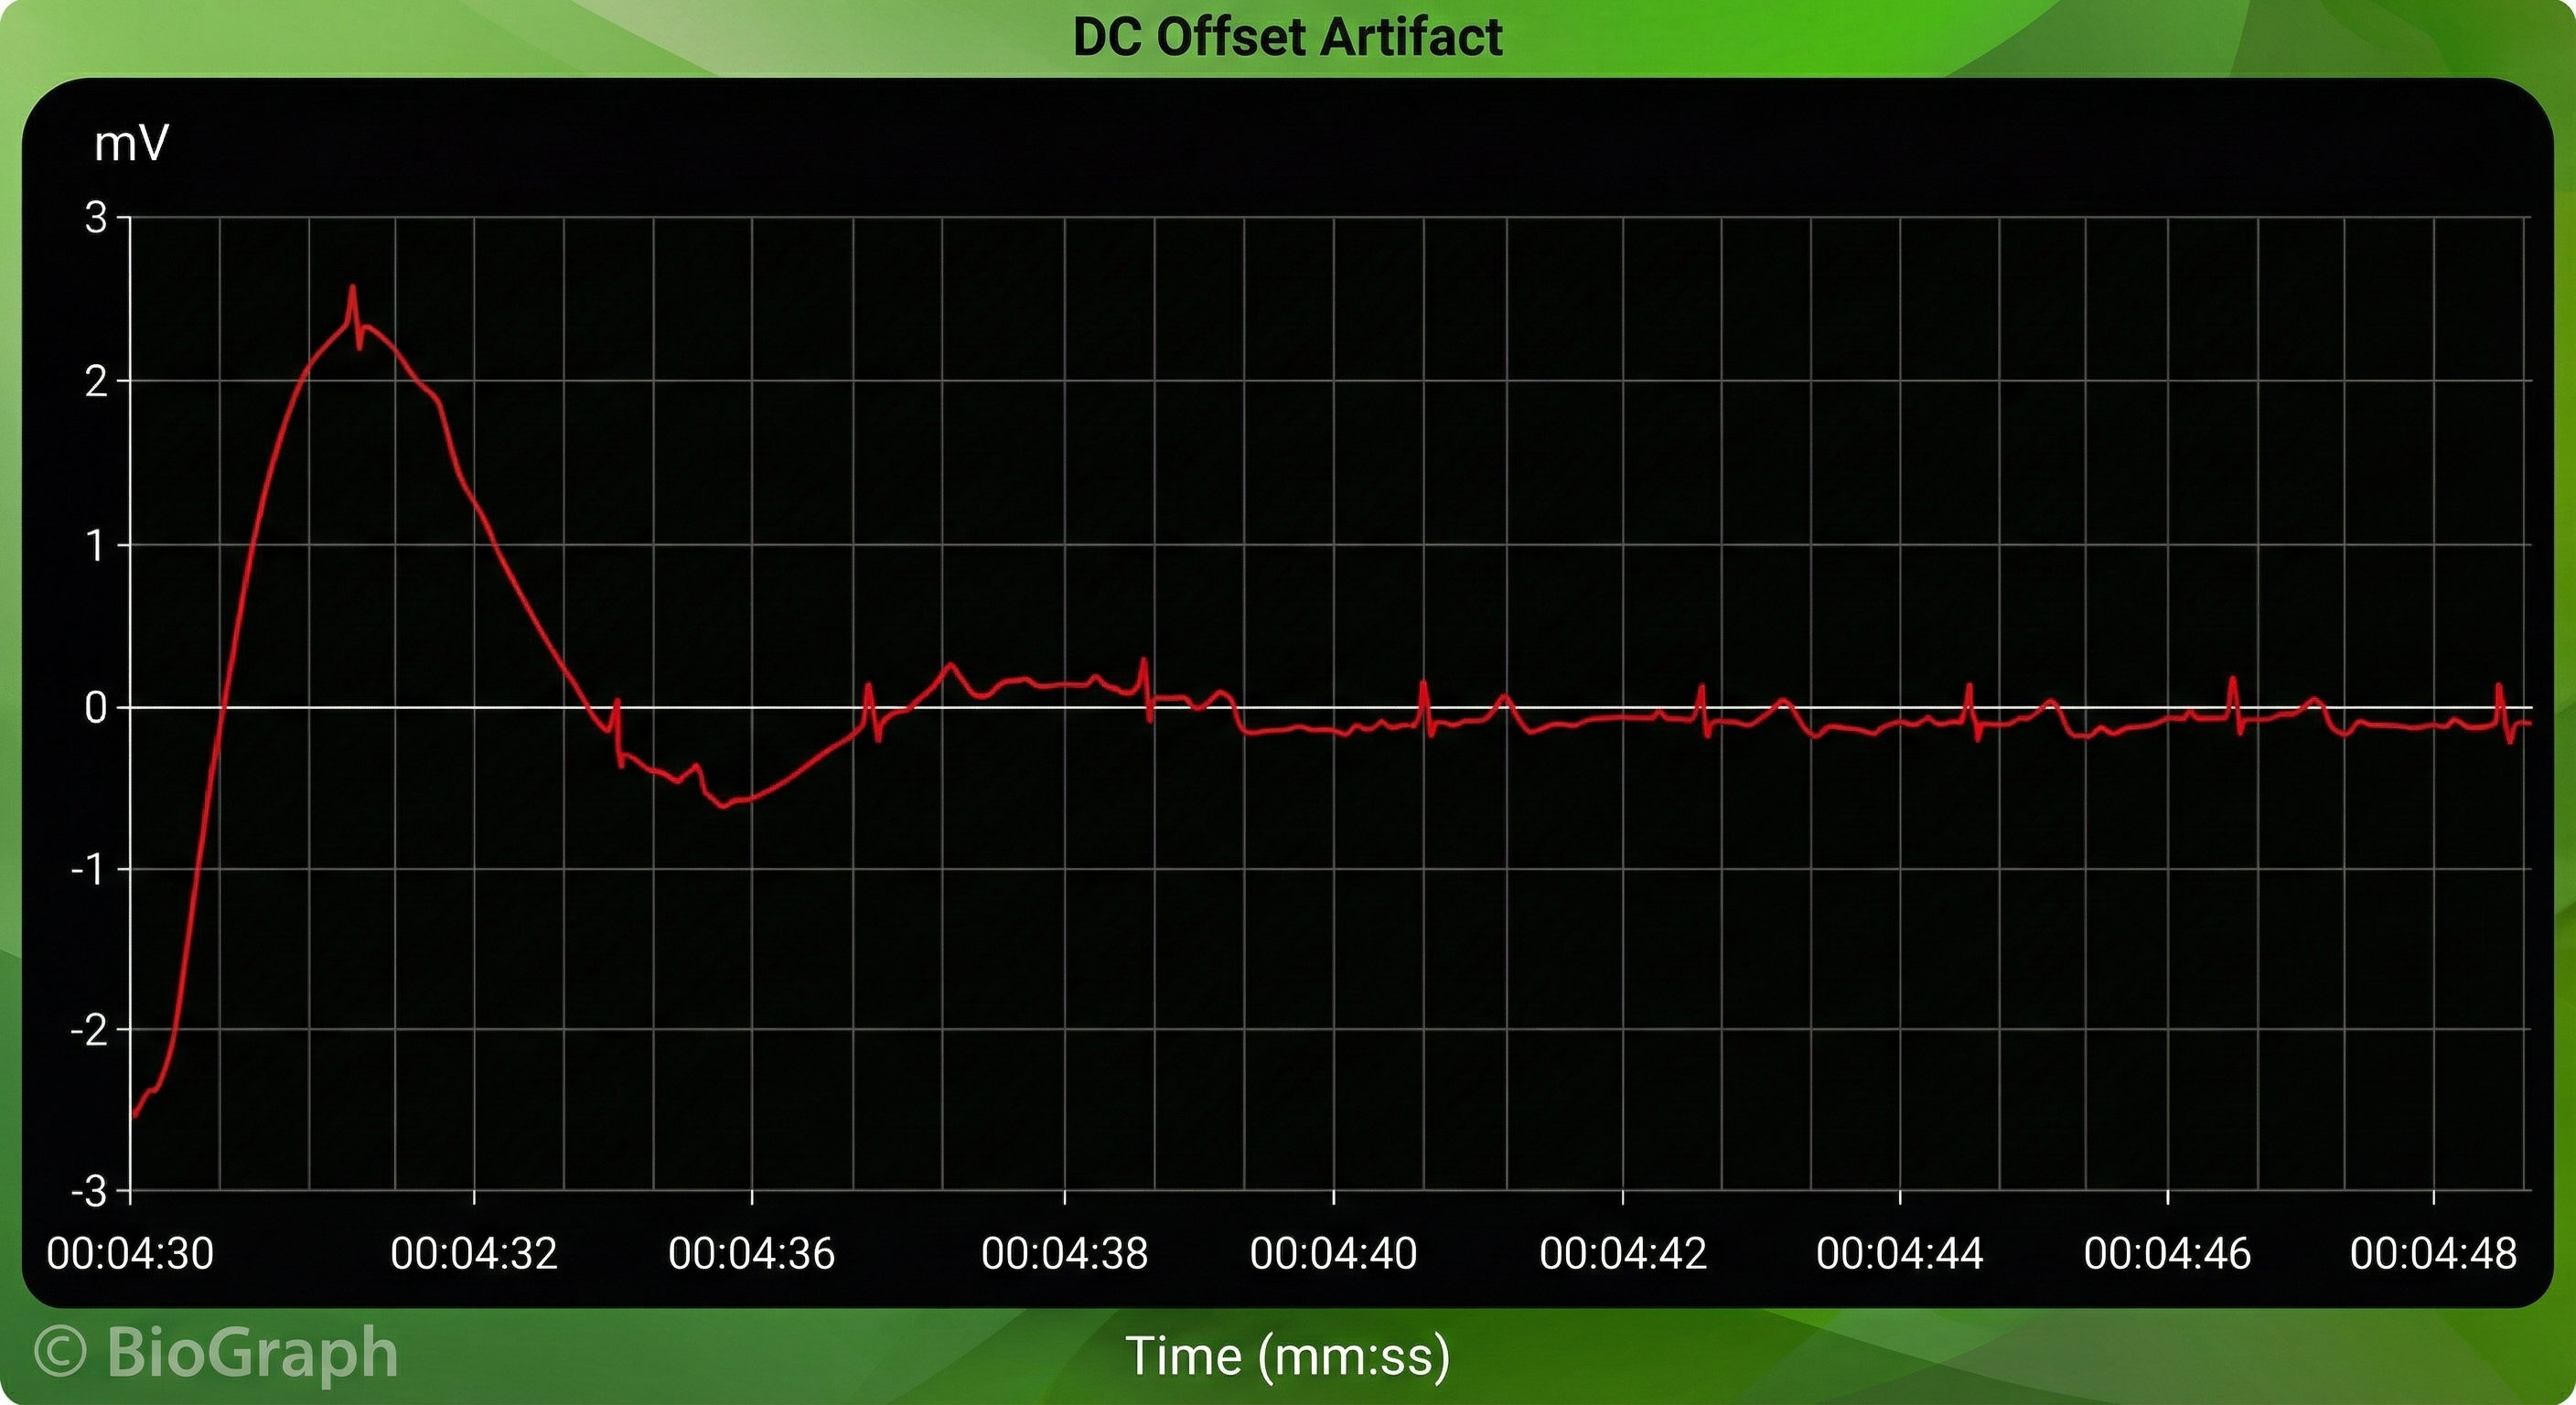
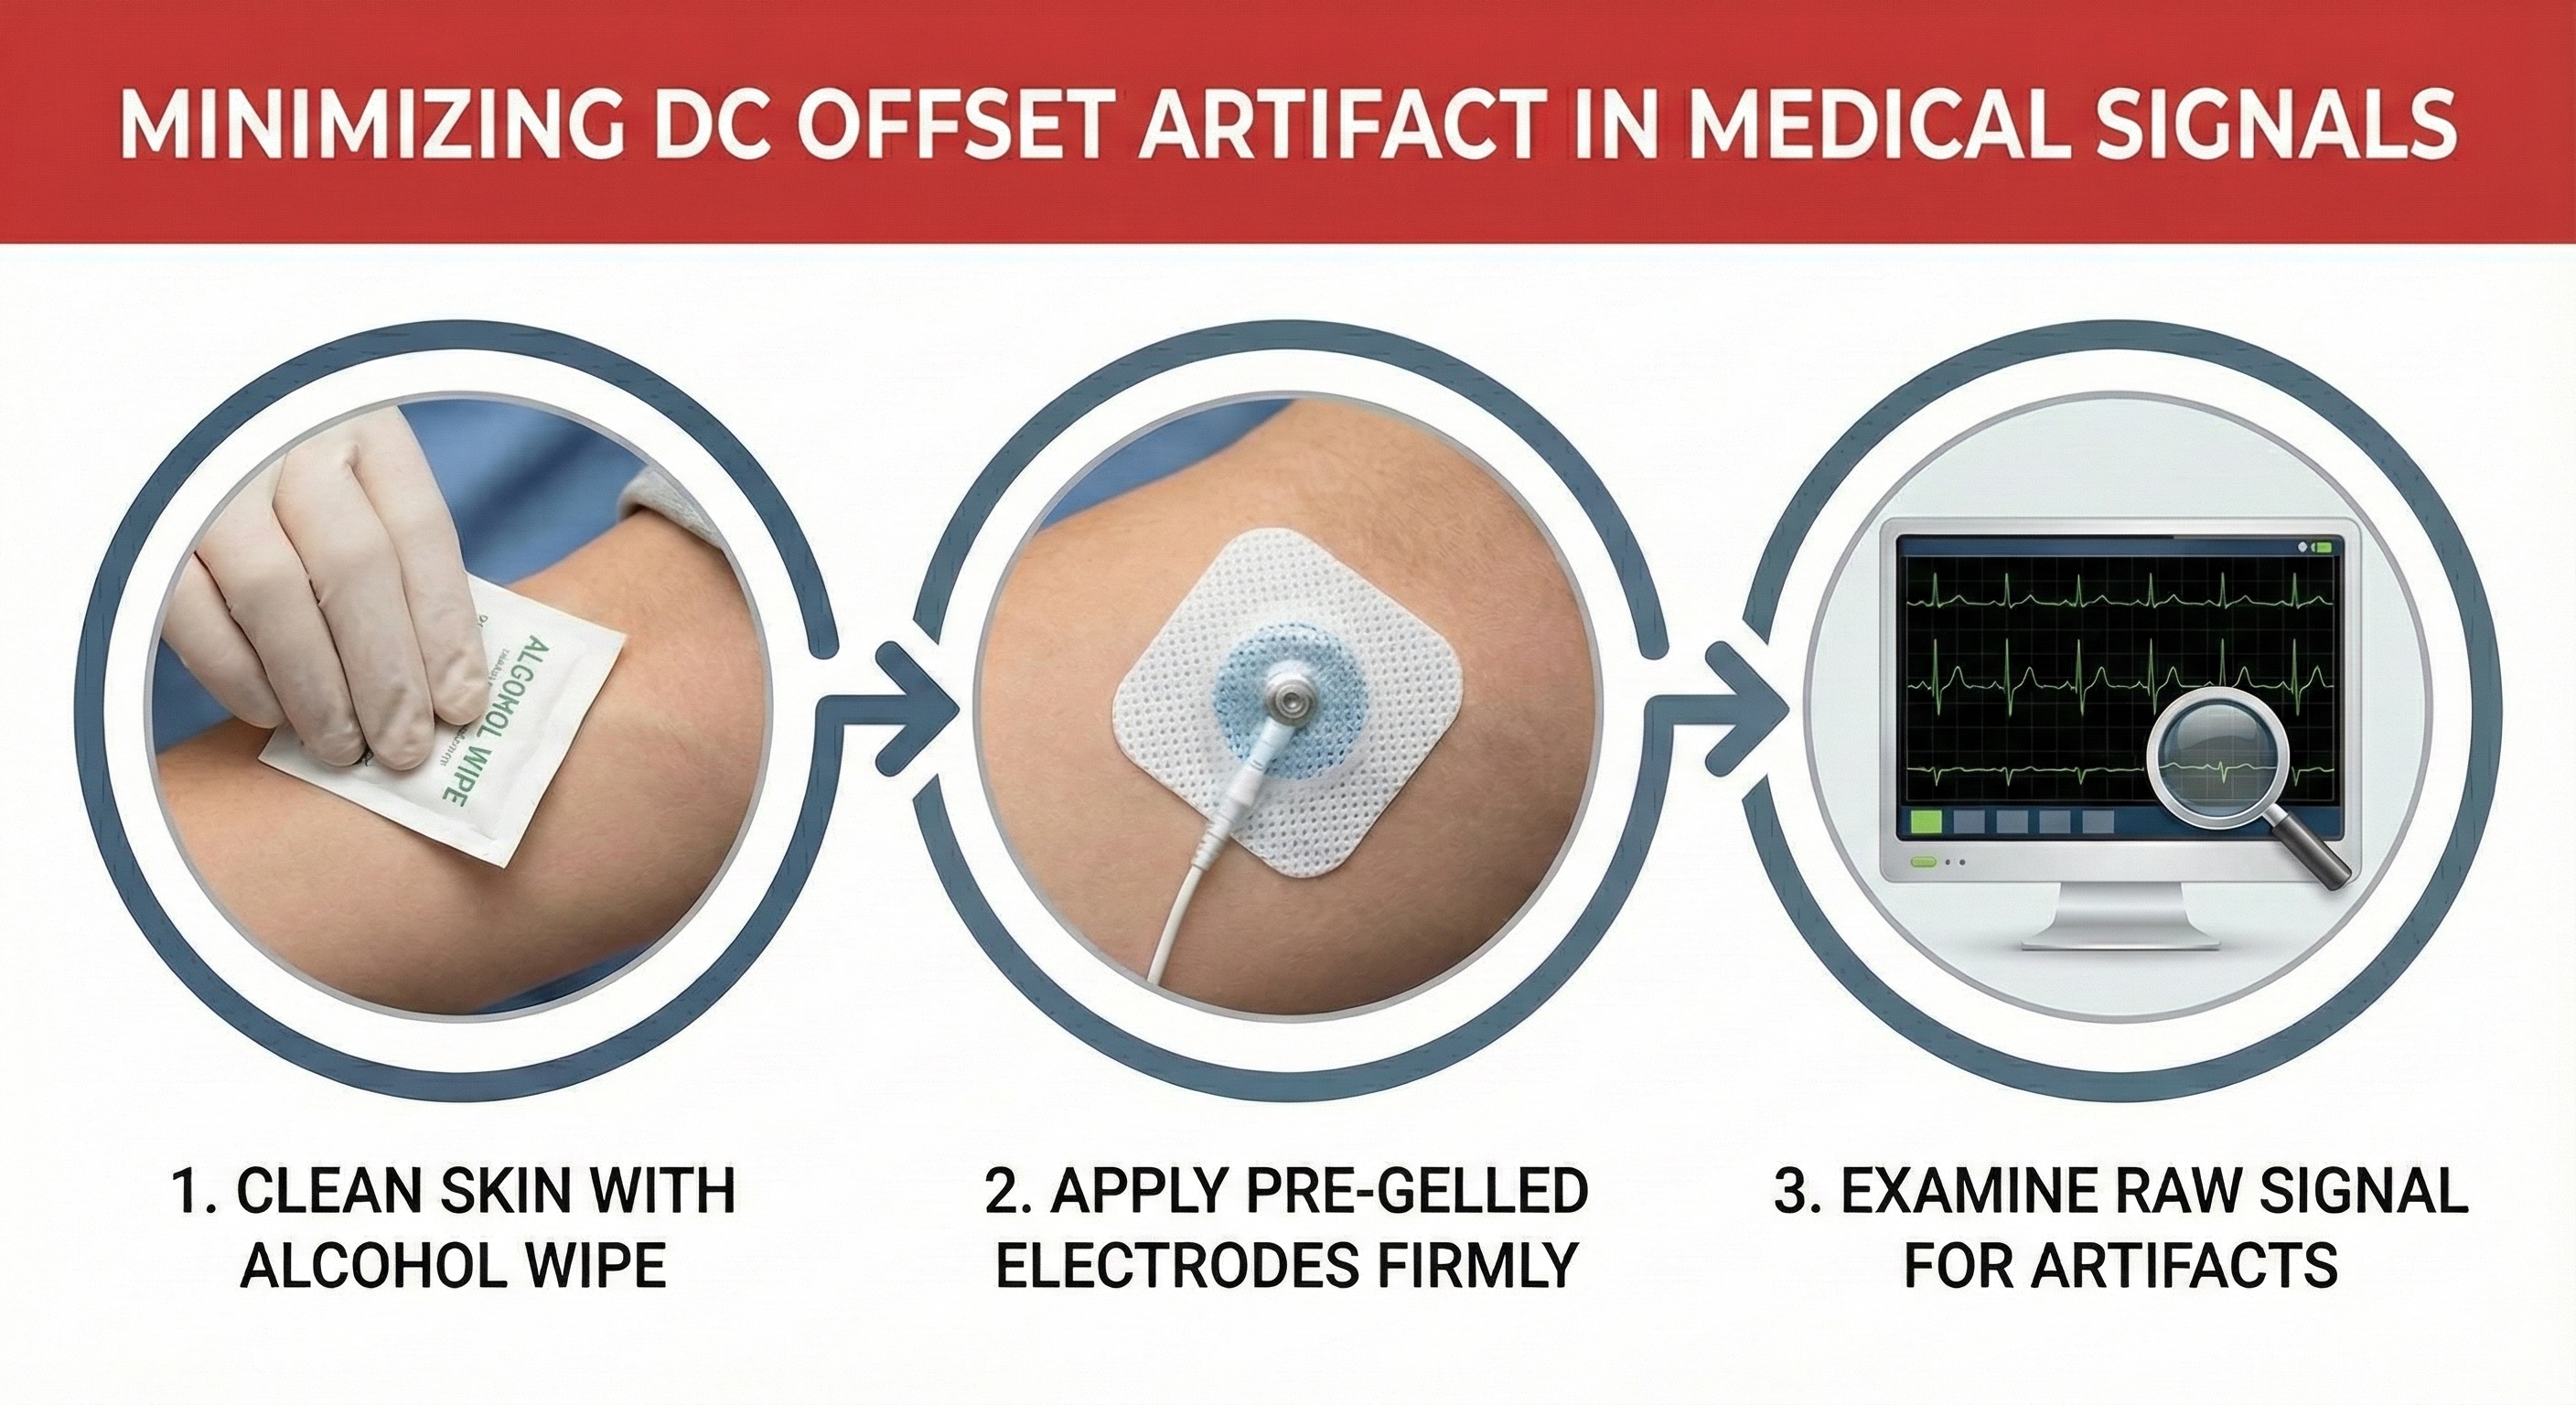
Direct Current (DC) Offset Artifact
DC offset artifact occurs when the skin-electrode impedances of the three ECG electrodes differ due to poor skin-electrode contact.
🎧 Mini-Lecture: ECG DC Offset Artifact
The ECG signal may drift up or down, causing extra or missed beats.
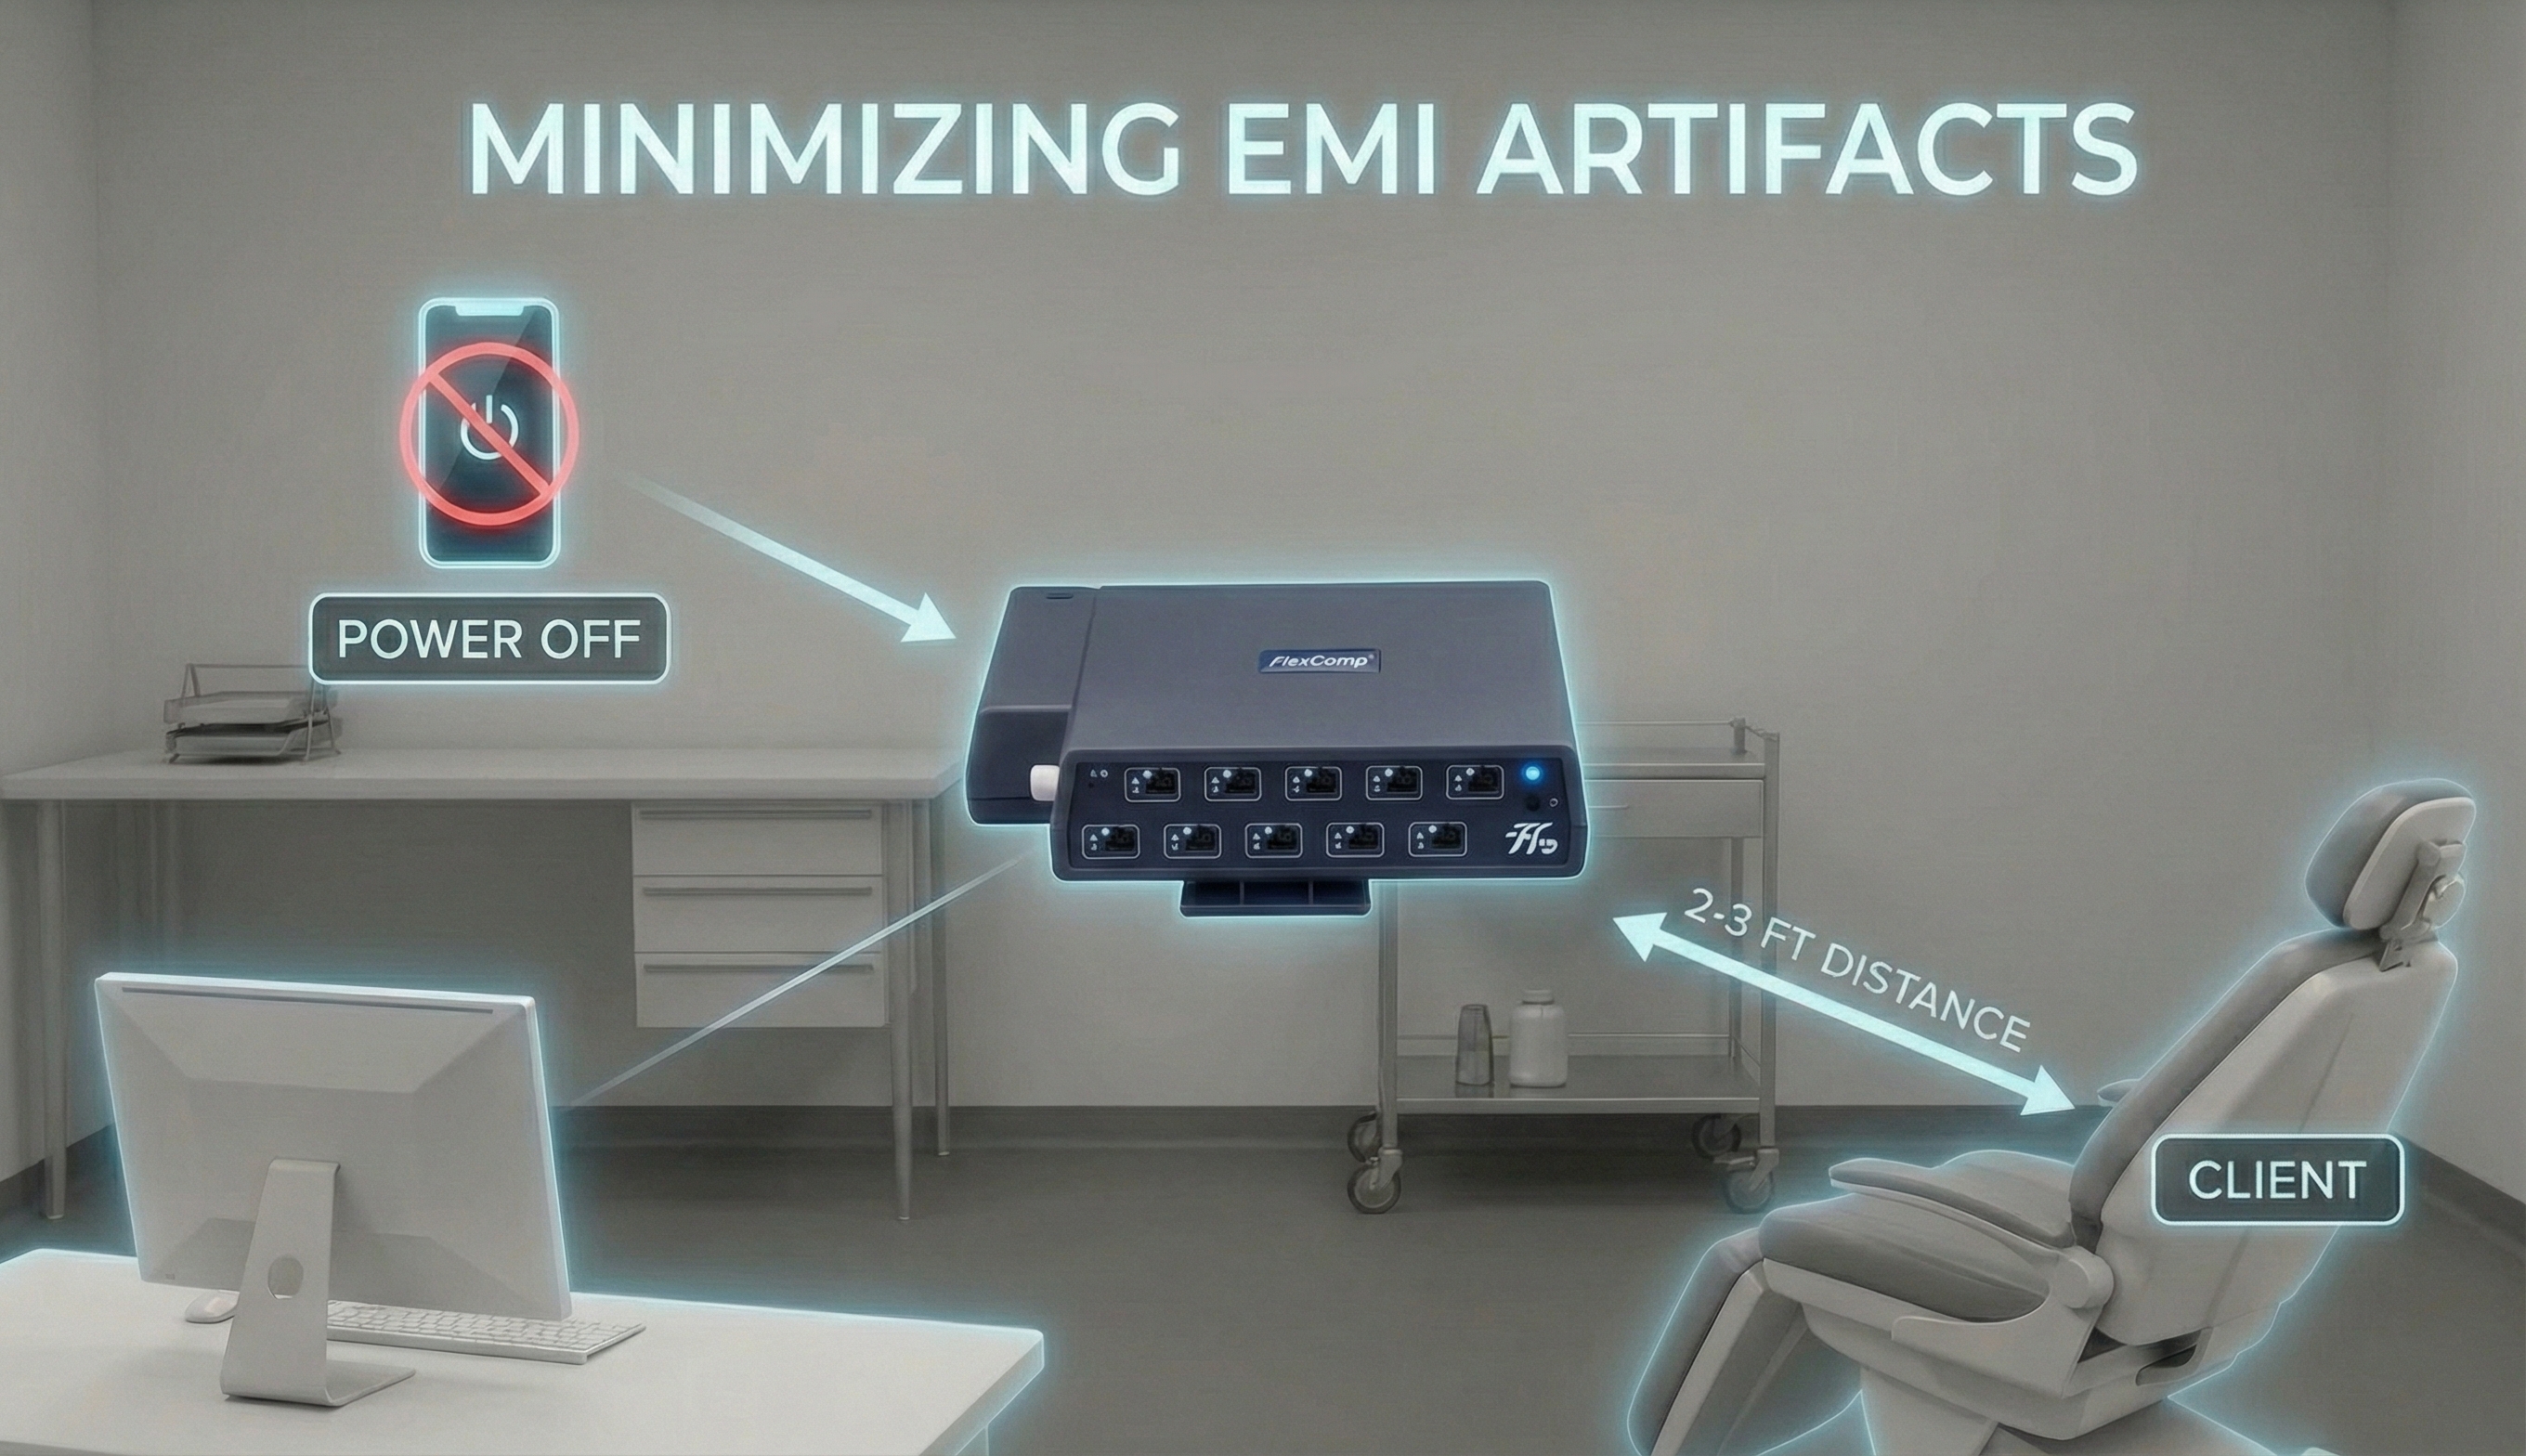
Electromagnetic Interference (EMI) Artifacts
Electromagnetic interference (EMI) artifacts are generated by cell phones when they are less than 6 ft (2 m) from ECG sensors or encoder boxes (Peper & Lin, 2010).
🎧 Mini-Lecture: ECG Electromagnetic Interference Artifacts
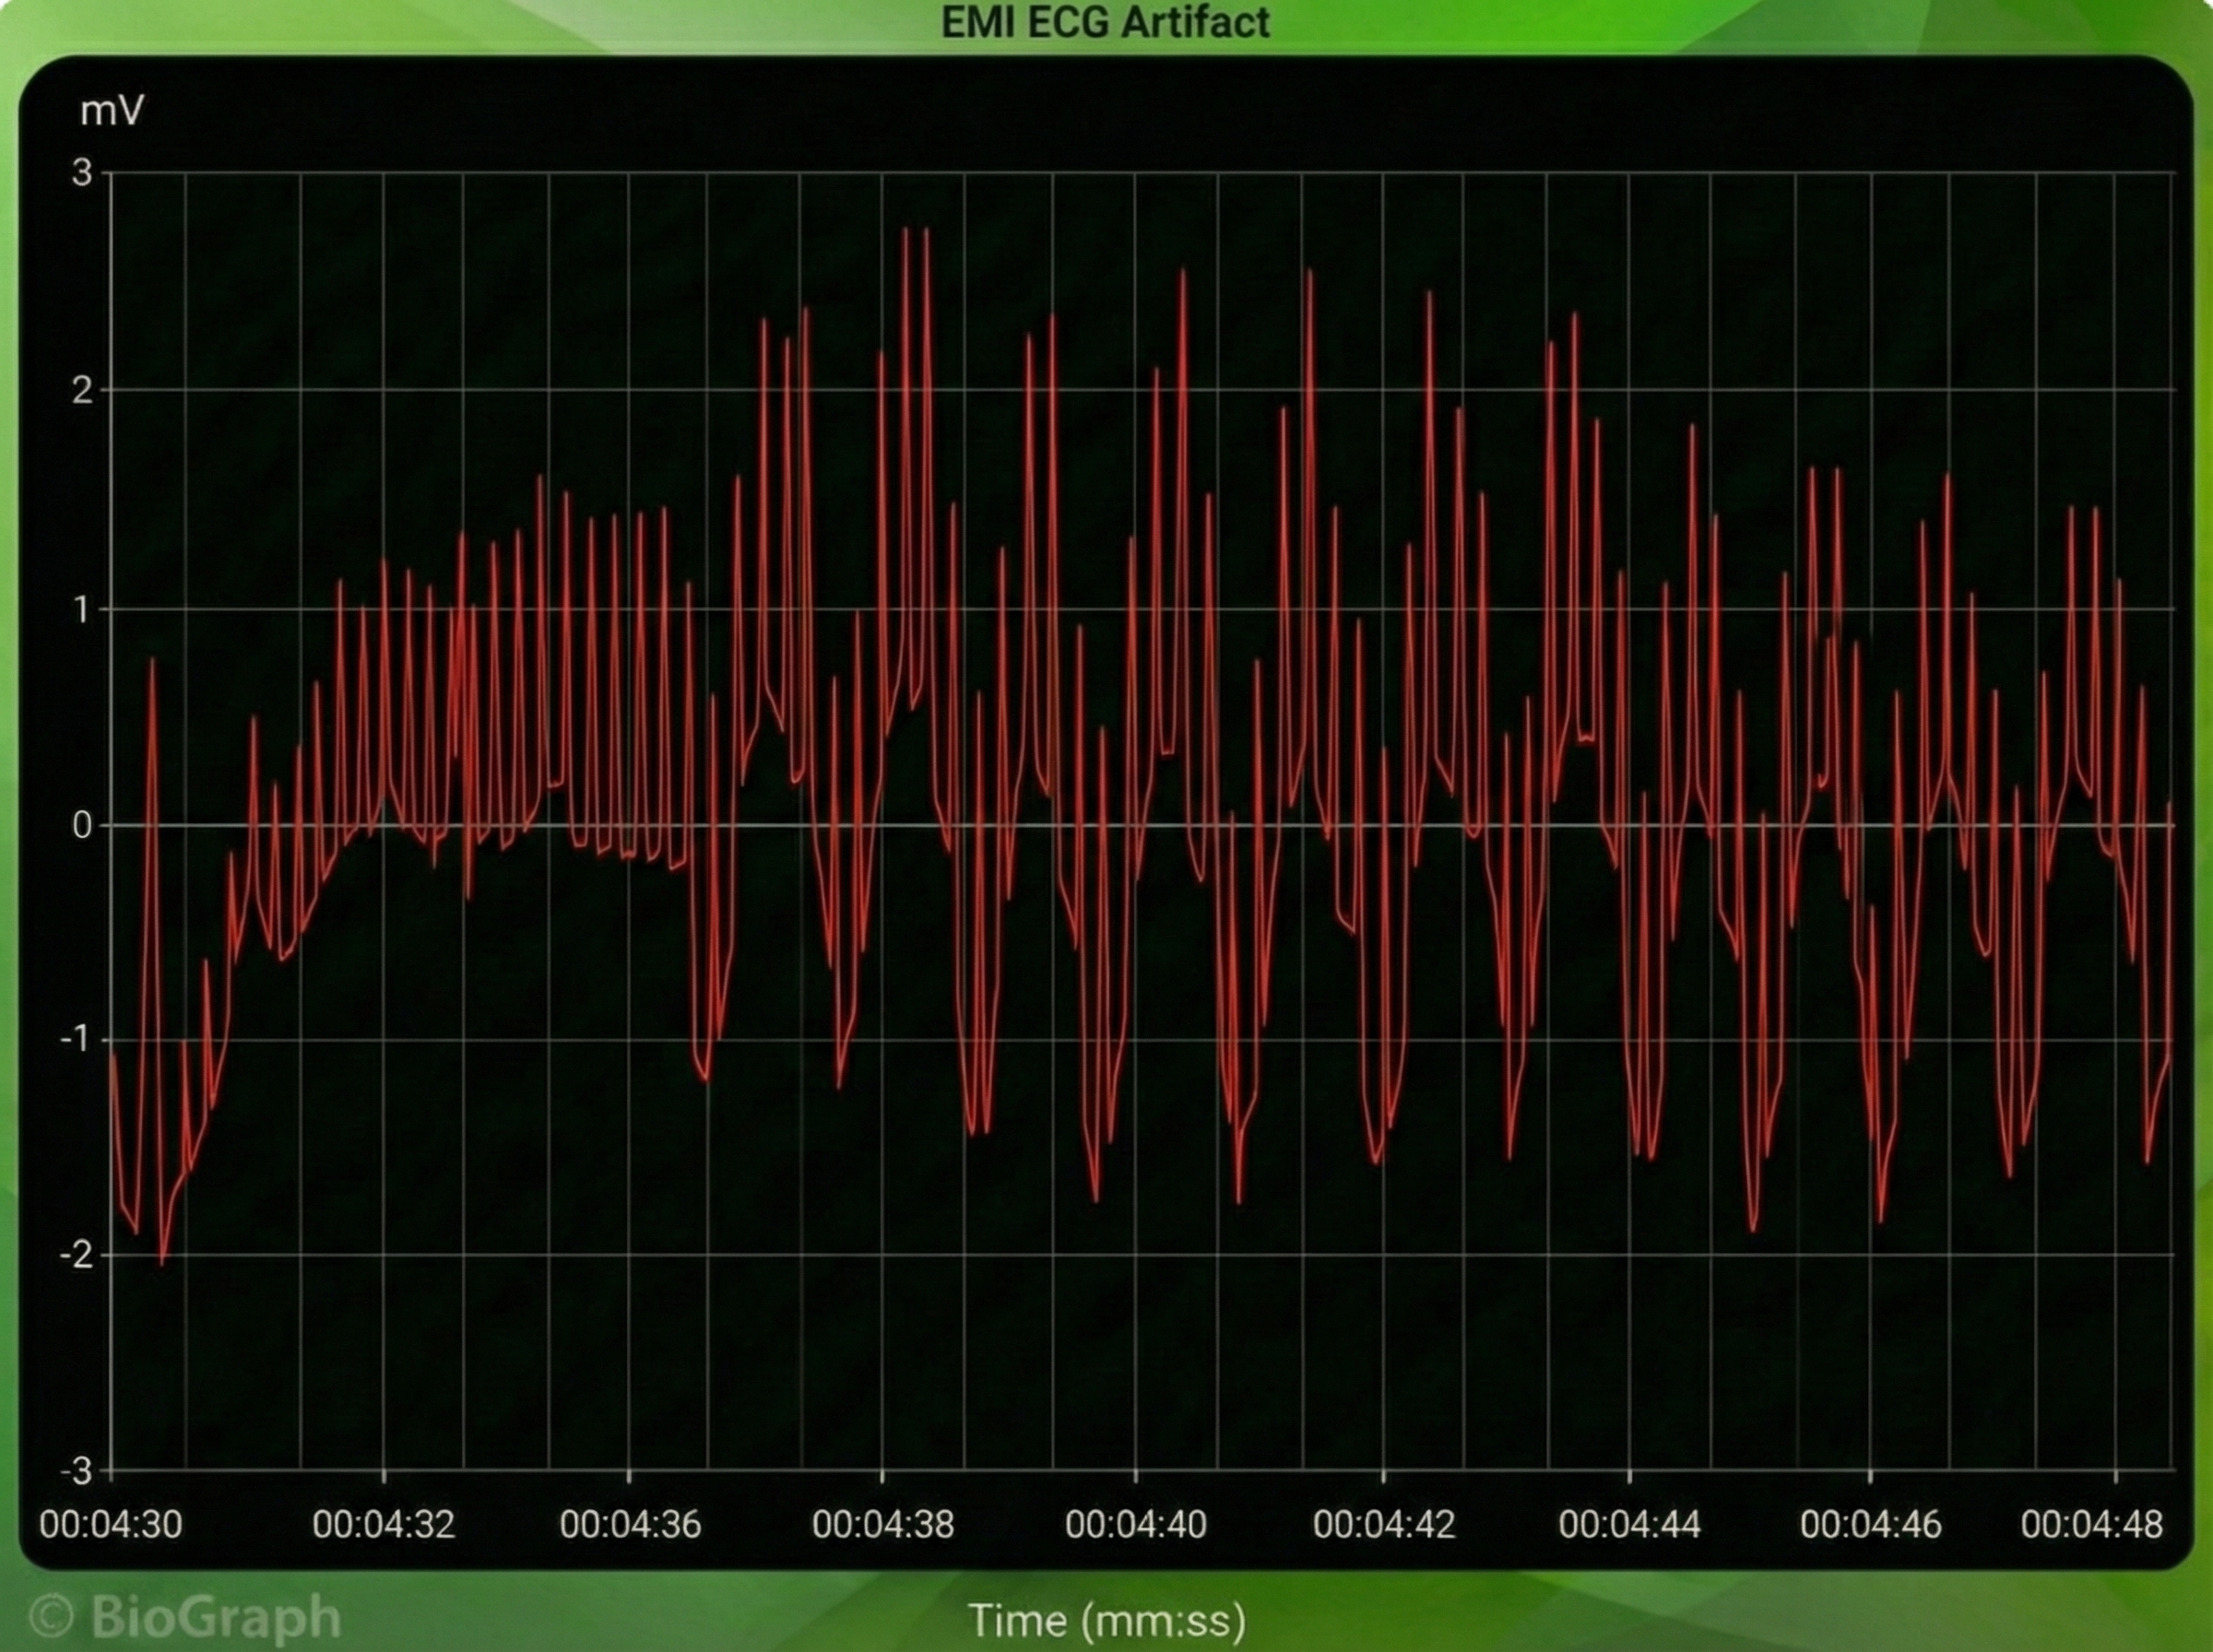
Computer monitors and television screens generate EMI artifacts. These are also called radiofrequency (RF) artifact. High-frequency energy expands outward from a monitor like a cone (Montgomery, 2004).
Also, watch out for audiovisual systems and high-voltage equipment like centrifuges, elevators, and x-ray machines (Lehrer, 2018b).
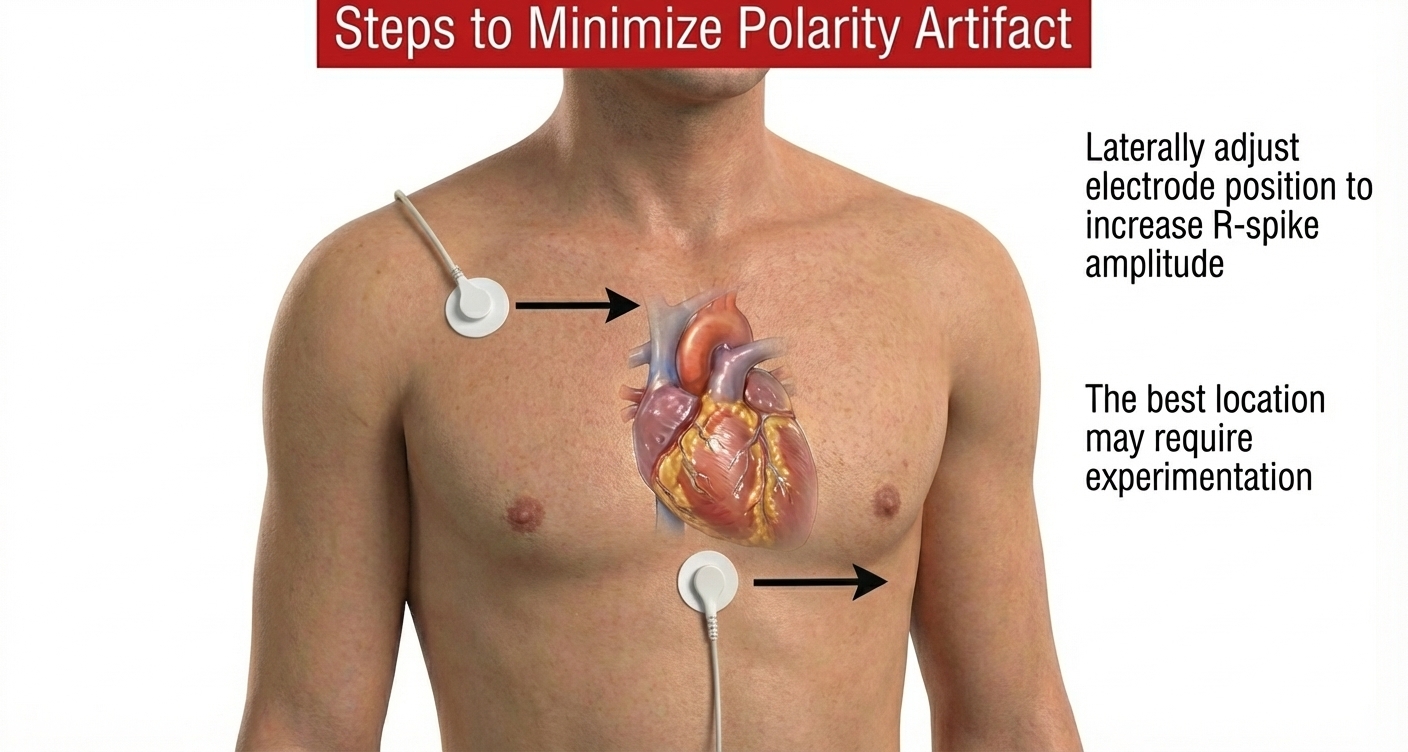
Polarity Artifact
Polarity artifact occurs when the active electrodes (yellow and blue for Thought Technology) are misaligned with respect to the heart's axis.
🎧 Mini-Lecture: ECG Polarity Artifact
A low-amplitude downward-oriented R-spike can cause the software to miss beats and lengthen the IBI.
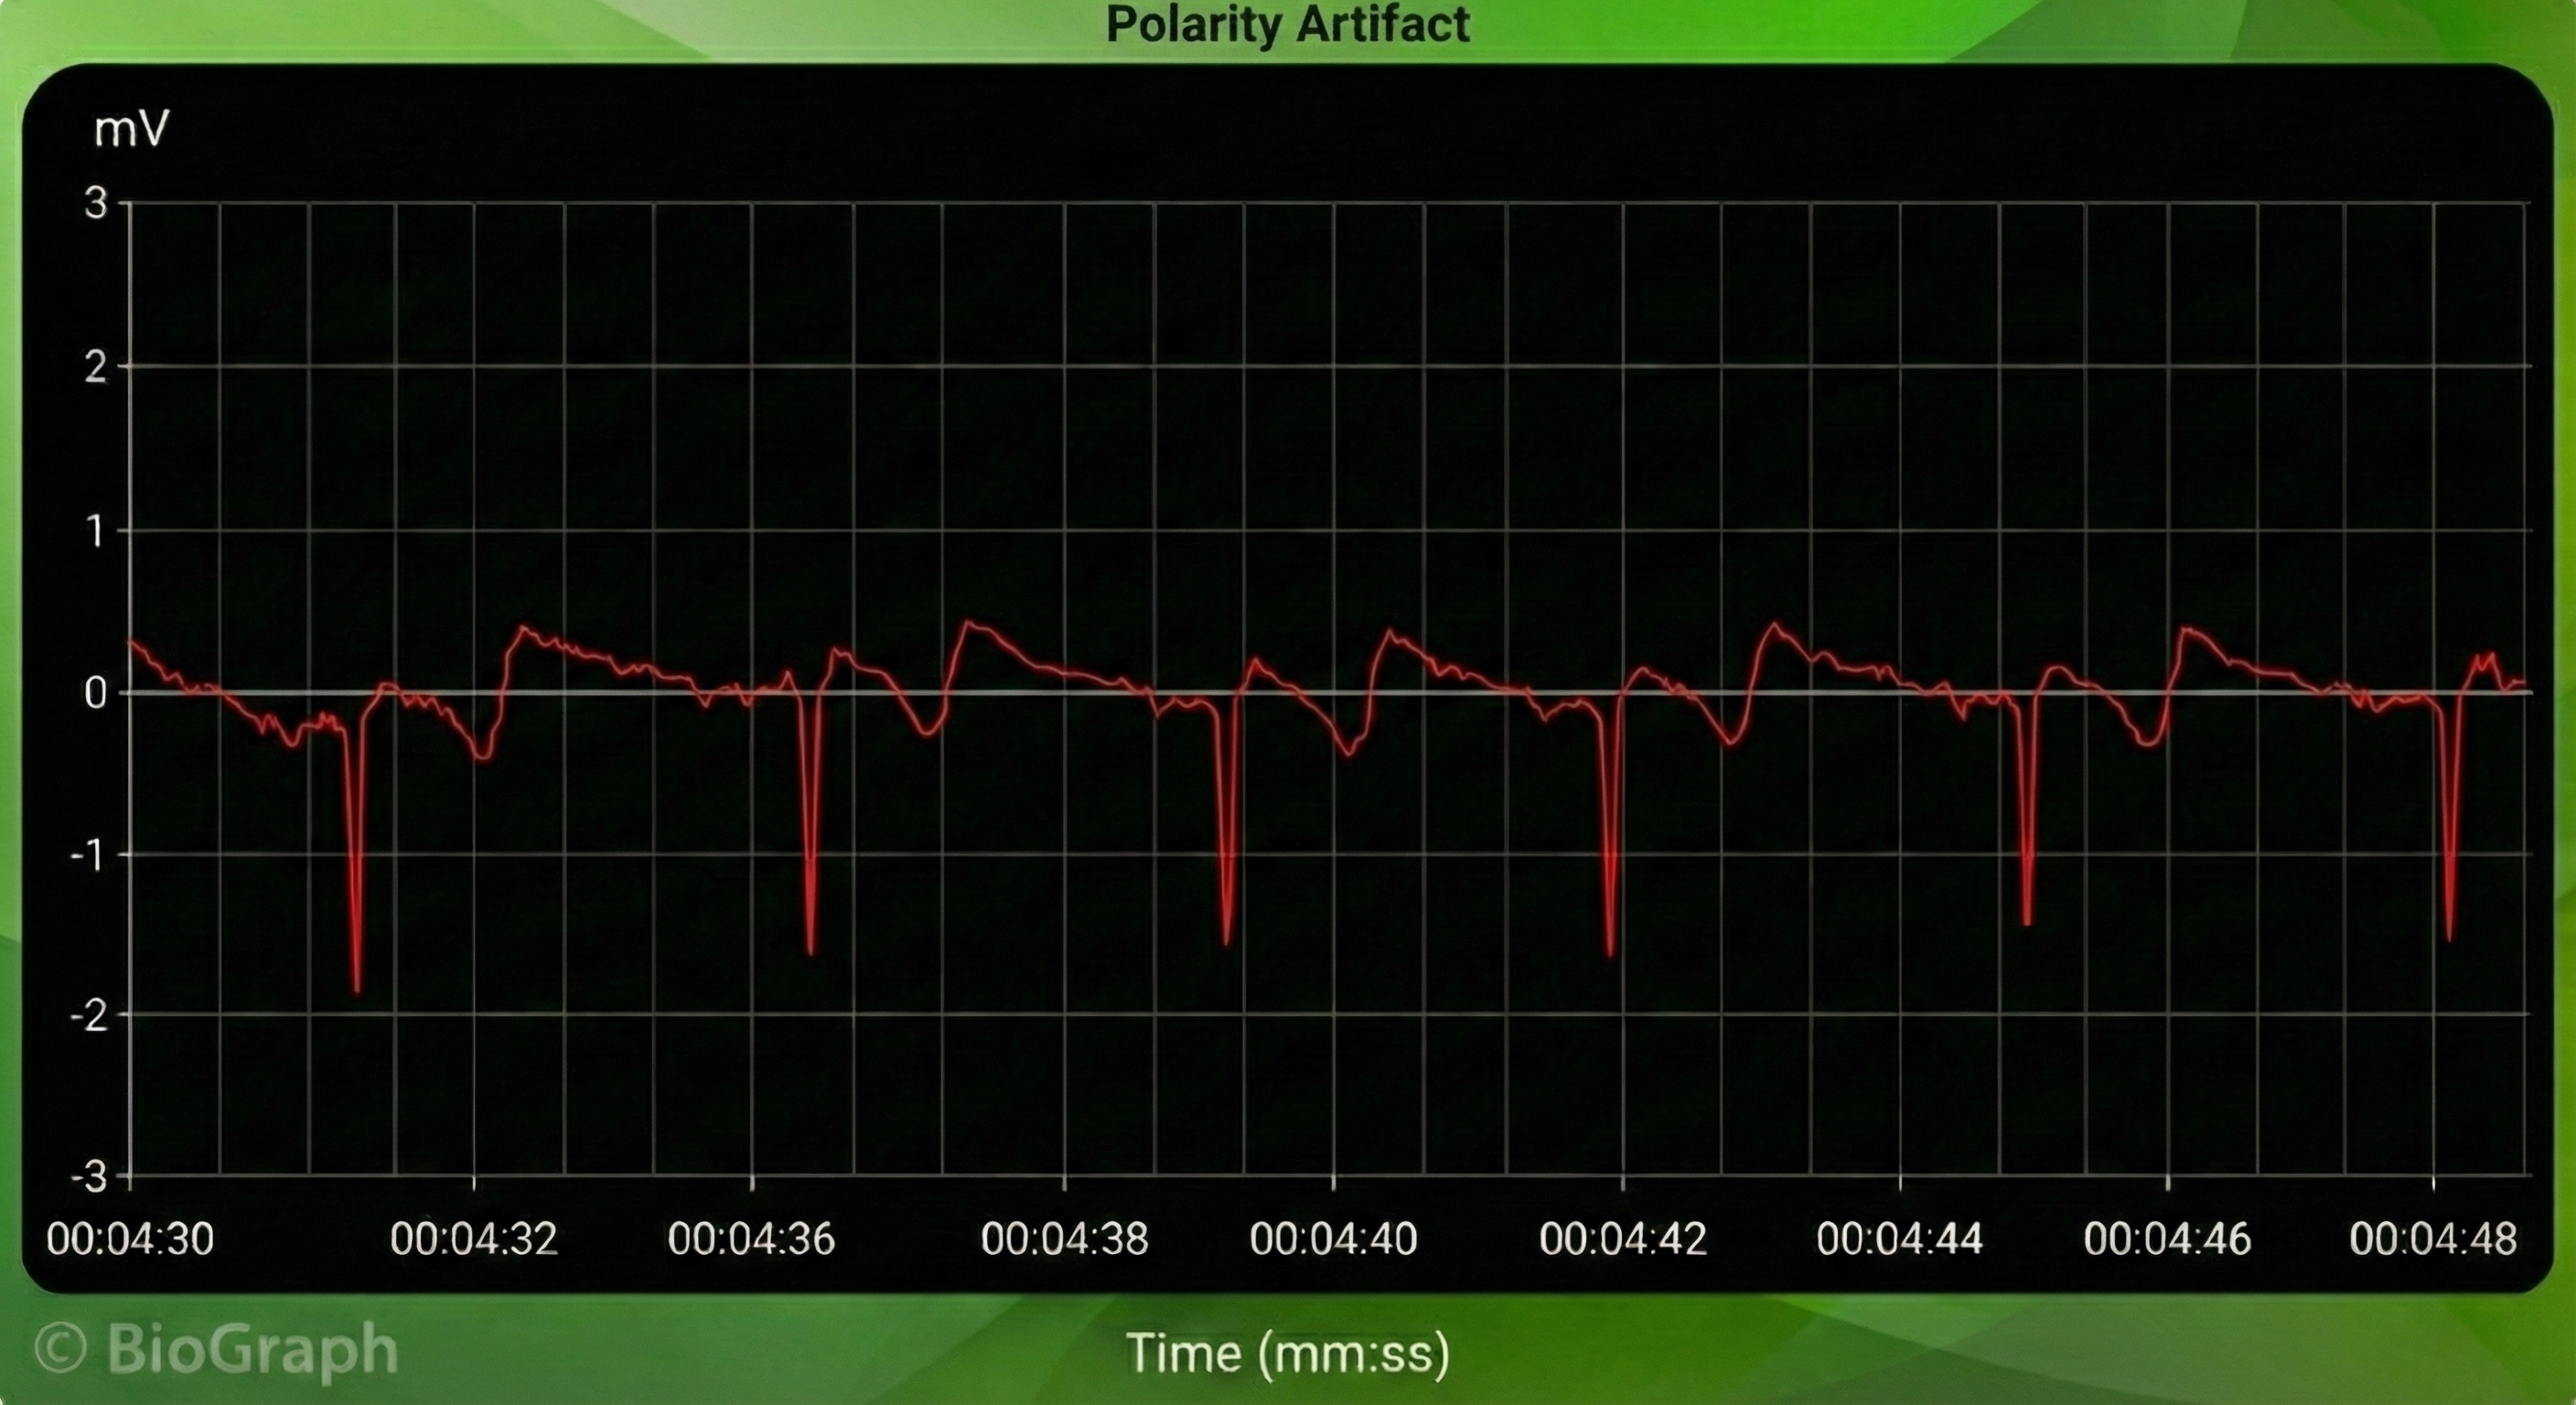
Software packages can automatically correct for polarity artifact (Lehrer, 2018b).
Tracking Test
Using a respirometer, you can determine whether the ECG signal responds to your client's breathing by observing whether instantaneous HR speeds during inhalation and slows during exhalation (gray line) (Nederend et al., 2016).
🎧 Mini-Lecture: ECG Tracking Test
![]()
The BioGraph Infiniti display below shows that instantaneous HR (pink) speeds and slows as the abdominal strain gauge (purple) rhythmically expands and contracts.
ECG and Respiration Demonstration
Dr. Inna Khazan demonstrates ECG and respiration recording, artifacts, and a tracking test.
ECG sensors measure heart rate more accurately than PPG sensors, particularly during vasoconstriction when PPG signals weaken. Six standard electrode placements offer different tradeoffs: wrist and forearm placements provide comfort and speed but are vulnerable to EMG and movement artifacts, while chest and lower torso placements reduce arm muscle contamination but require more preparation and may be less comfortable. Common ECG artifacts include line interference from 50/60 Hz sources, EMG artifact from skeletal muscle activity, movement artifact from electrode displacement, DC offset from impedance differences, and polarity artifact from reversed electrode placement. The tracking test confirms that instantaneous heart rate appropriately speeds during inhalation and slows during exhalation, validating proper sensor function and client responsiveness.
Comprehension Questions: ECG Recording
- What are the advantages and disadvantages of the wrist ECG placement compared to the lower torso placement?
- Why does EMG artifact affect ECG recordings but not BVP recordings?
- When should you discard an ECG recording segment rather than attempt to correct artifacts?
- How do you perform an ECG tracking test, and what should you observe to confirm proper function?
- What causes DC offset artifact, and how does it affect IBI calculations?
Heart Rate Variability Metrics
The BCIA Biofeedback Blueprint does not cover HRV metrics. We briefly cover them to provide more comprehensive coverage.
HRV normative values only apply when clients breathe at average rates. For example, measurements of high-frequency power are invalid when obtained during 6-bpm slow-paced breathing. This unit explains time- and frequency-domain metrics.
These metrics are derived from the time intervals between successive heartbeats called interbeat intervals (IBIs).
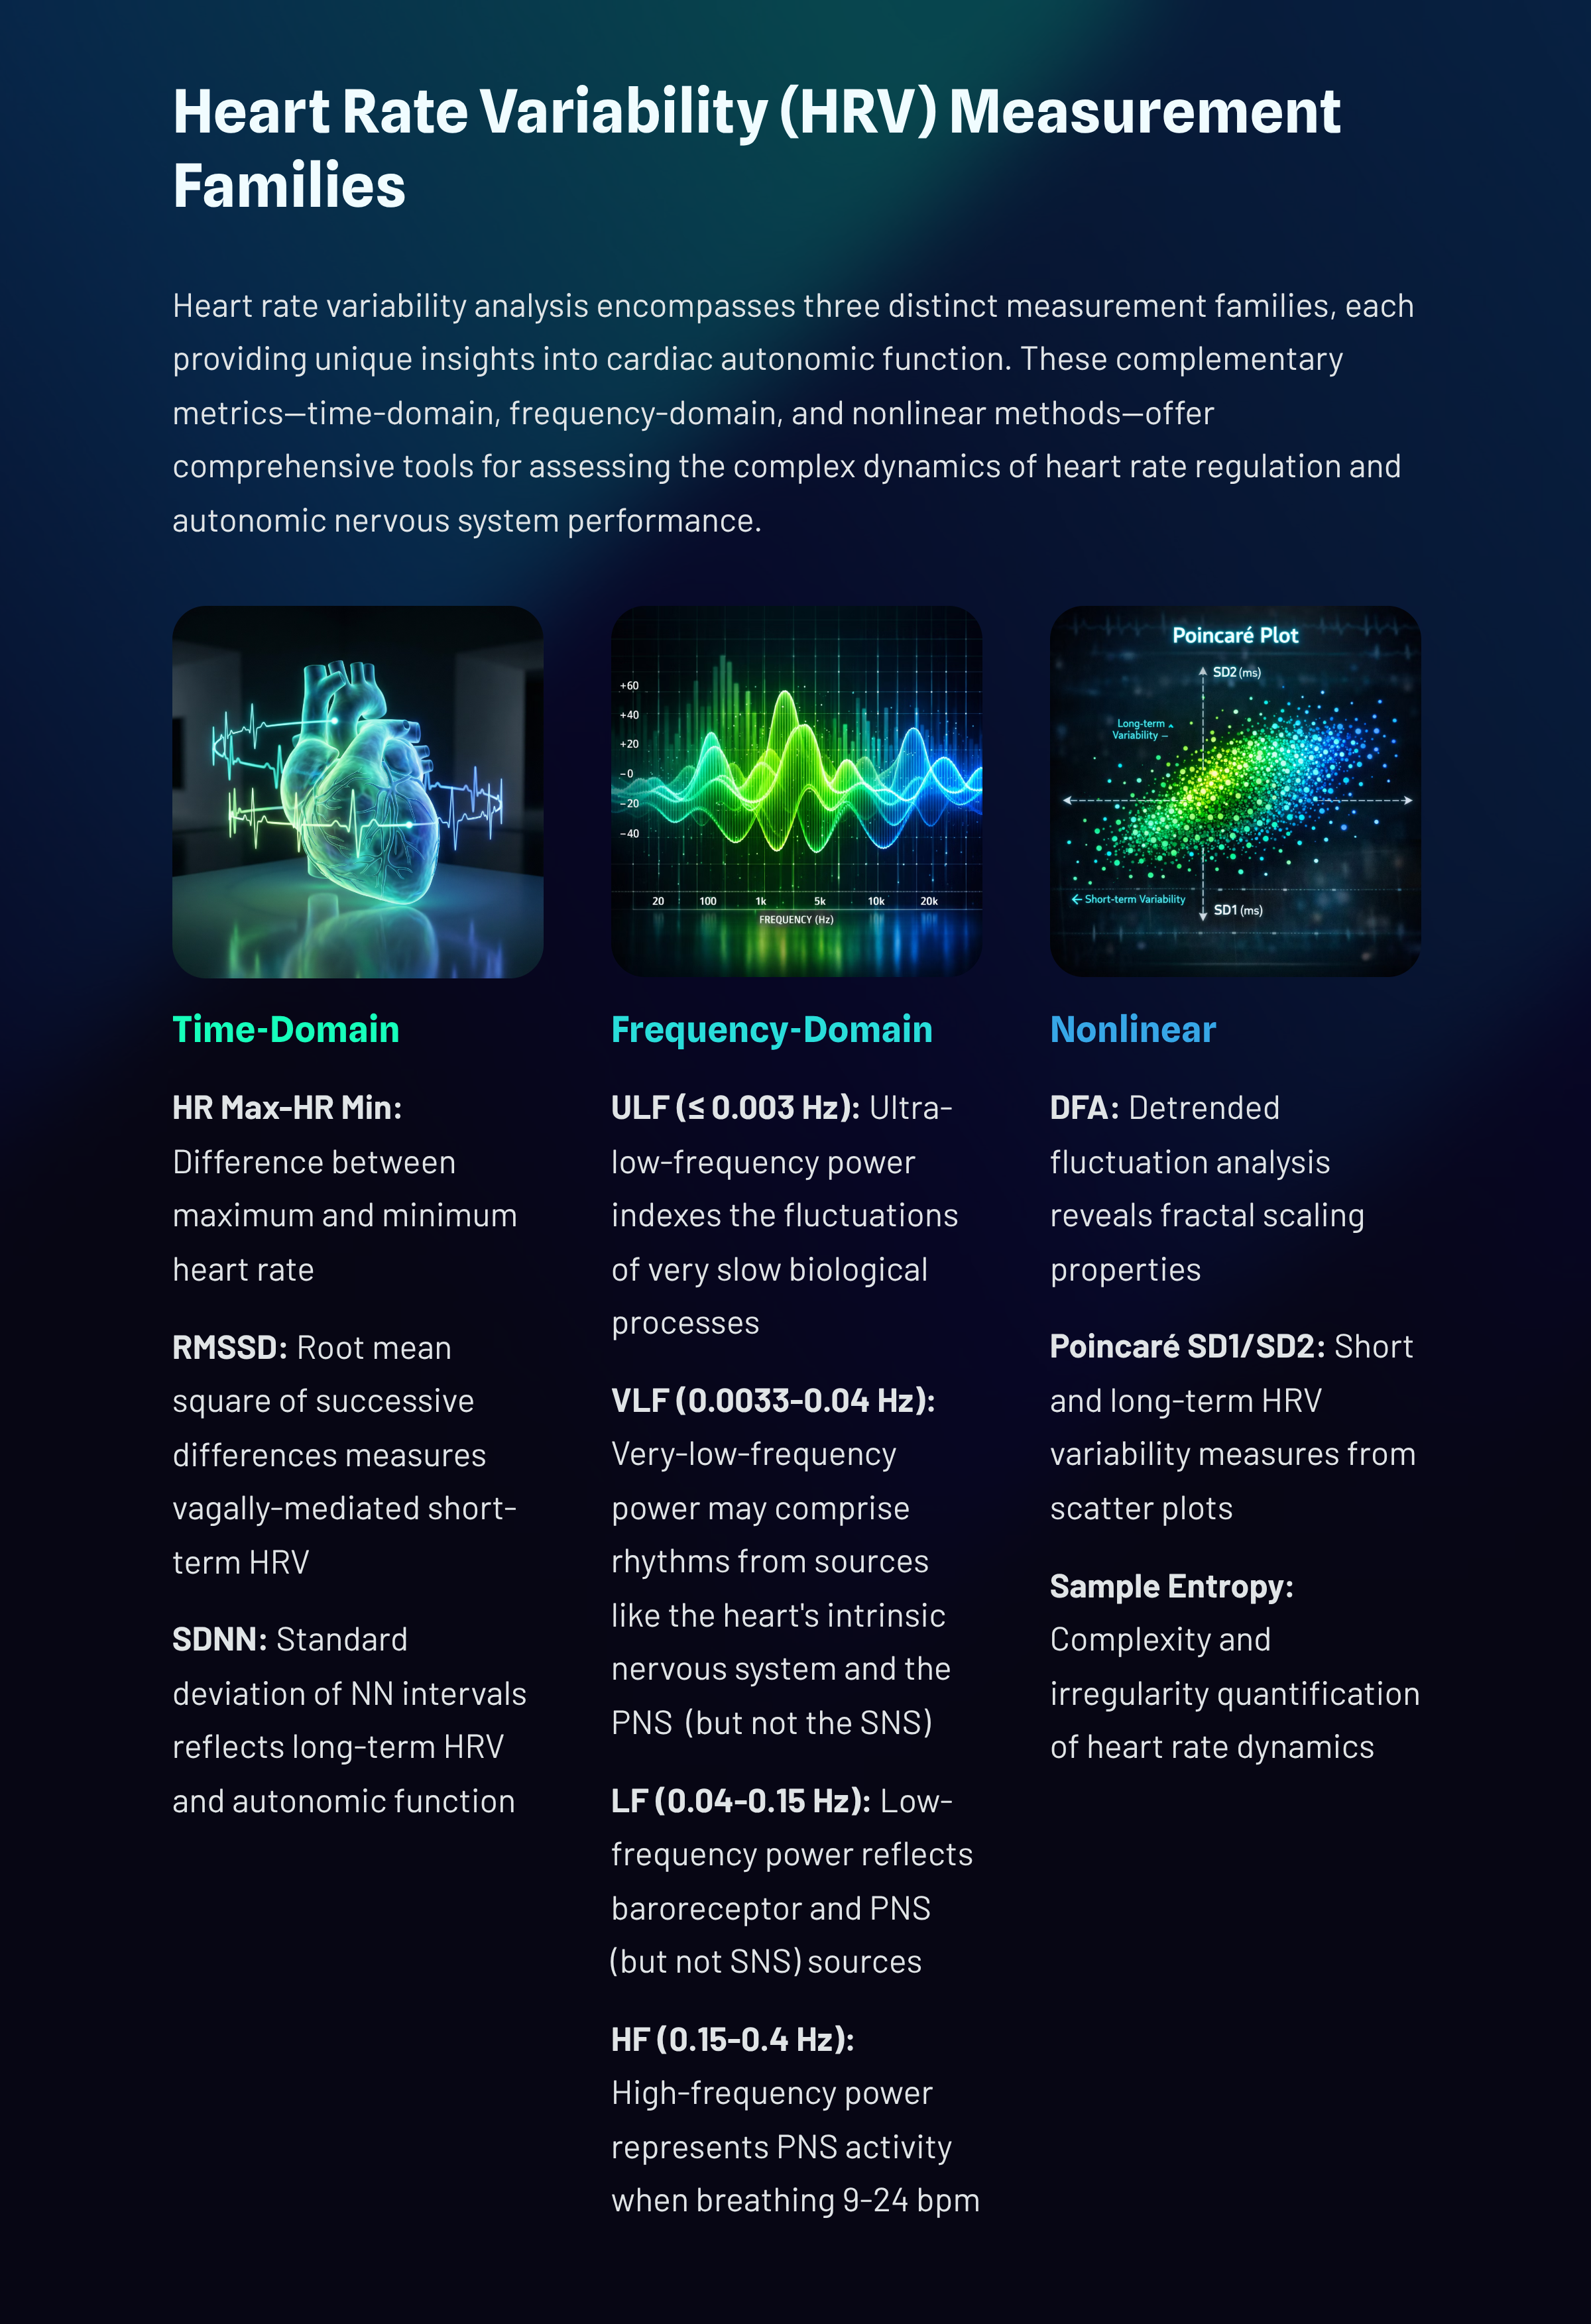
HRV Time-Domain Metrics
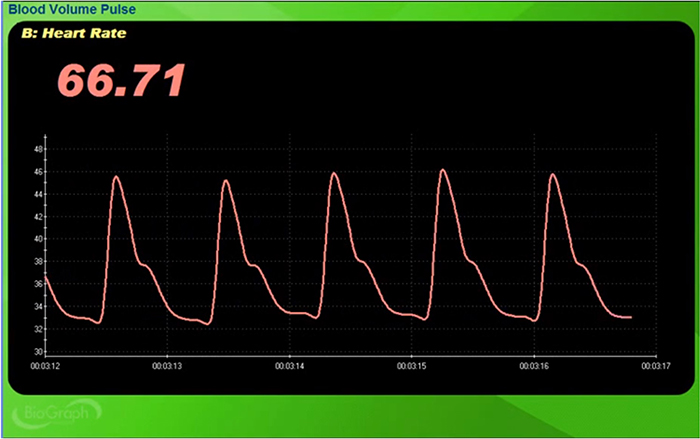
HRV time-domain indices quantify the amount of HRV observed during monitoring periods ranging from 60 seconds to 24 hours. Three widely-used metrics are the RMSSD, SDNN, and pNN50.
🎧 Mini-Lecture: HRV Time-Domain Metrics
RMSSD
The RMSSD is the root mean square of successive differences between normal heartbeats. The RMSSD reflects rapid beat-to-beat variance in HR and better estimates vagal activity than SDNN (Shaffer, McCraty, & Zerr, 2014). The RMSSD is conceptualized as vagally-mediated HRV (vmHRV; Jarczock et al., 2021). The RMSSD is the best overall short-term HRV because it is less affected by outliers and artifacts than SDNN (Gevirtz, 2020). A novel ratio of short-term RMSSD and C-reactive protein predicted survival in cancer patients and the general population (Jarczock et al., 2021). The minimum recording period is 5 minutes.
Many HRV apps (Apple Health, Elite HRV, Fitbit, Optimal HRV) use RMSSD or Ln RMSSD to measure HRV. Ln means the natural logarithm.
SDNN
The SDNN is the standard deviation of the IBIs of normal sinus beats. The SDNN measures how these intervals vary over time and is expressed in milliseconds. RSA is the primary source of the variation, especially with slow-paced breathing protocols (Shaffer, McCraty, & Zerr, 2014). The minimum recording period is 5 minutes.pNN50
The pNN50 is the percentage of adjacent NN intervals that differ by more than 50 milliseconds. The pNN50 is closely correlated with PNS activity (Umetani et al., 1998). It correlates with the RMSSD and HF power. The RMSSD typically provides a better assessment of RSA (especially in older subjects), and most researchers prefer it to the pNN50 (Otzenberger et al., 1998). The minimum recording period is 5 minutes.
HRV Frequency Domain Metrics
HRV frequency-domain measurements reveal the sources of physiological changes (Gevirtz, 2020).
🎧 Mini-Lecture: HRV Frequency-Domain Metrics
The processes that contribute to HRV operate at different speeds and generate different frequencies. Frequency-domain measurements quantify the absolute or relative HRV signal power within each of three frequency bands (very-low-frequency, low-frequency, and high-frequency).

We express absolute power in ms squared divided by cycles per second (ms2/Hz). Relative power is a frequency band’s percentage of total HRV power. We can express this in normal units (nu) by dividing the absolute power for a specific frequency band by the summed absolute power of the low-frequency (LF) and high-frequency (HF) bands.
While normal units allow us to compare the spectral distribution in two clients directly, they conceal the actual contributions of each frequency band to HRV (Gevirtz, 2020). Journals now prefer the natural logs of LF and HF power.
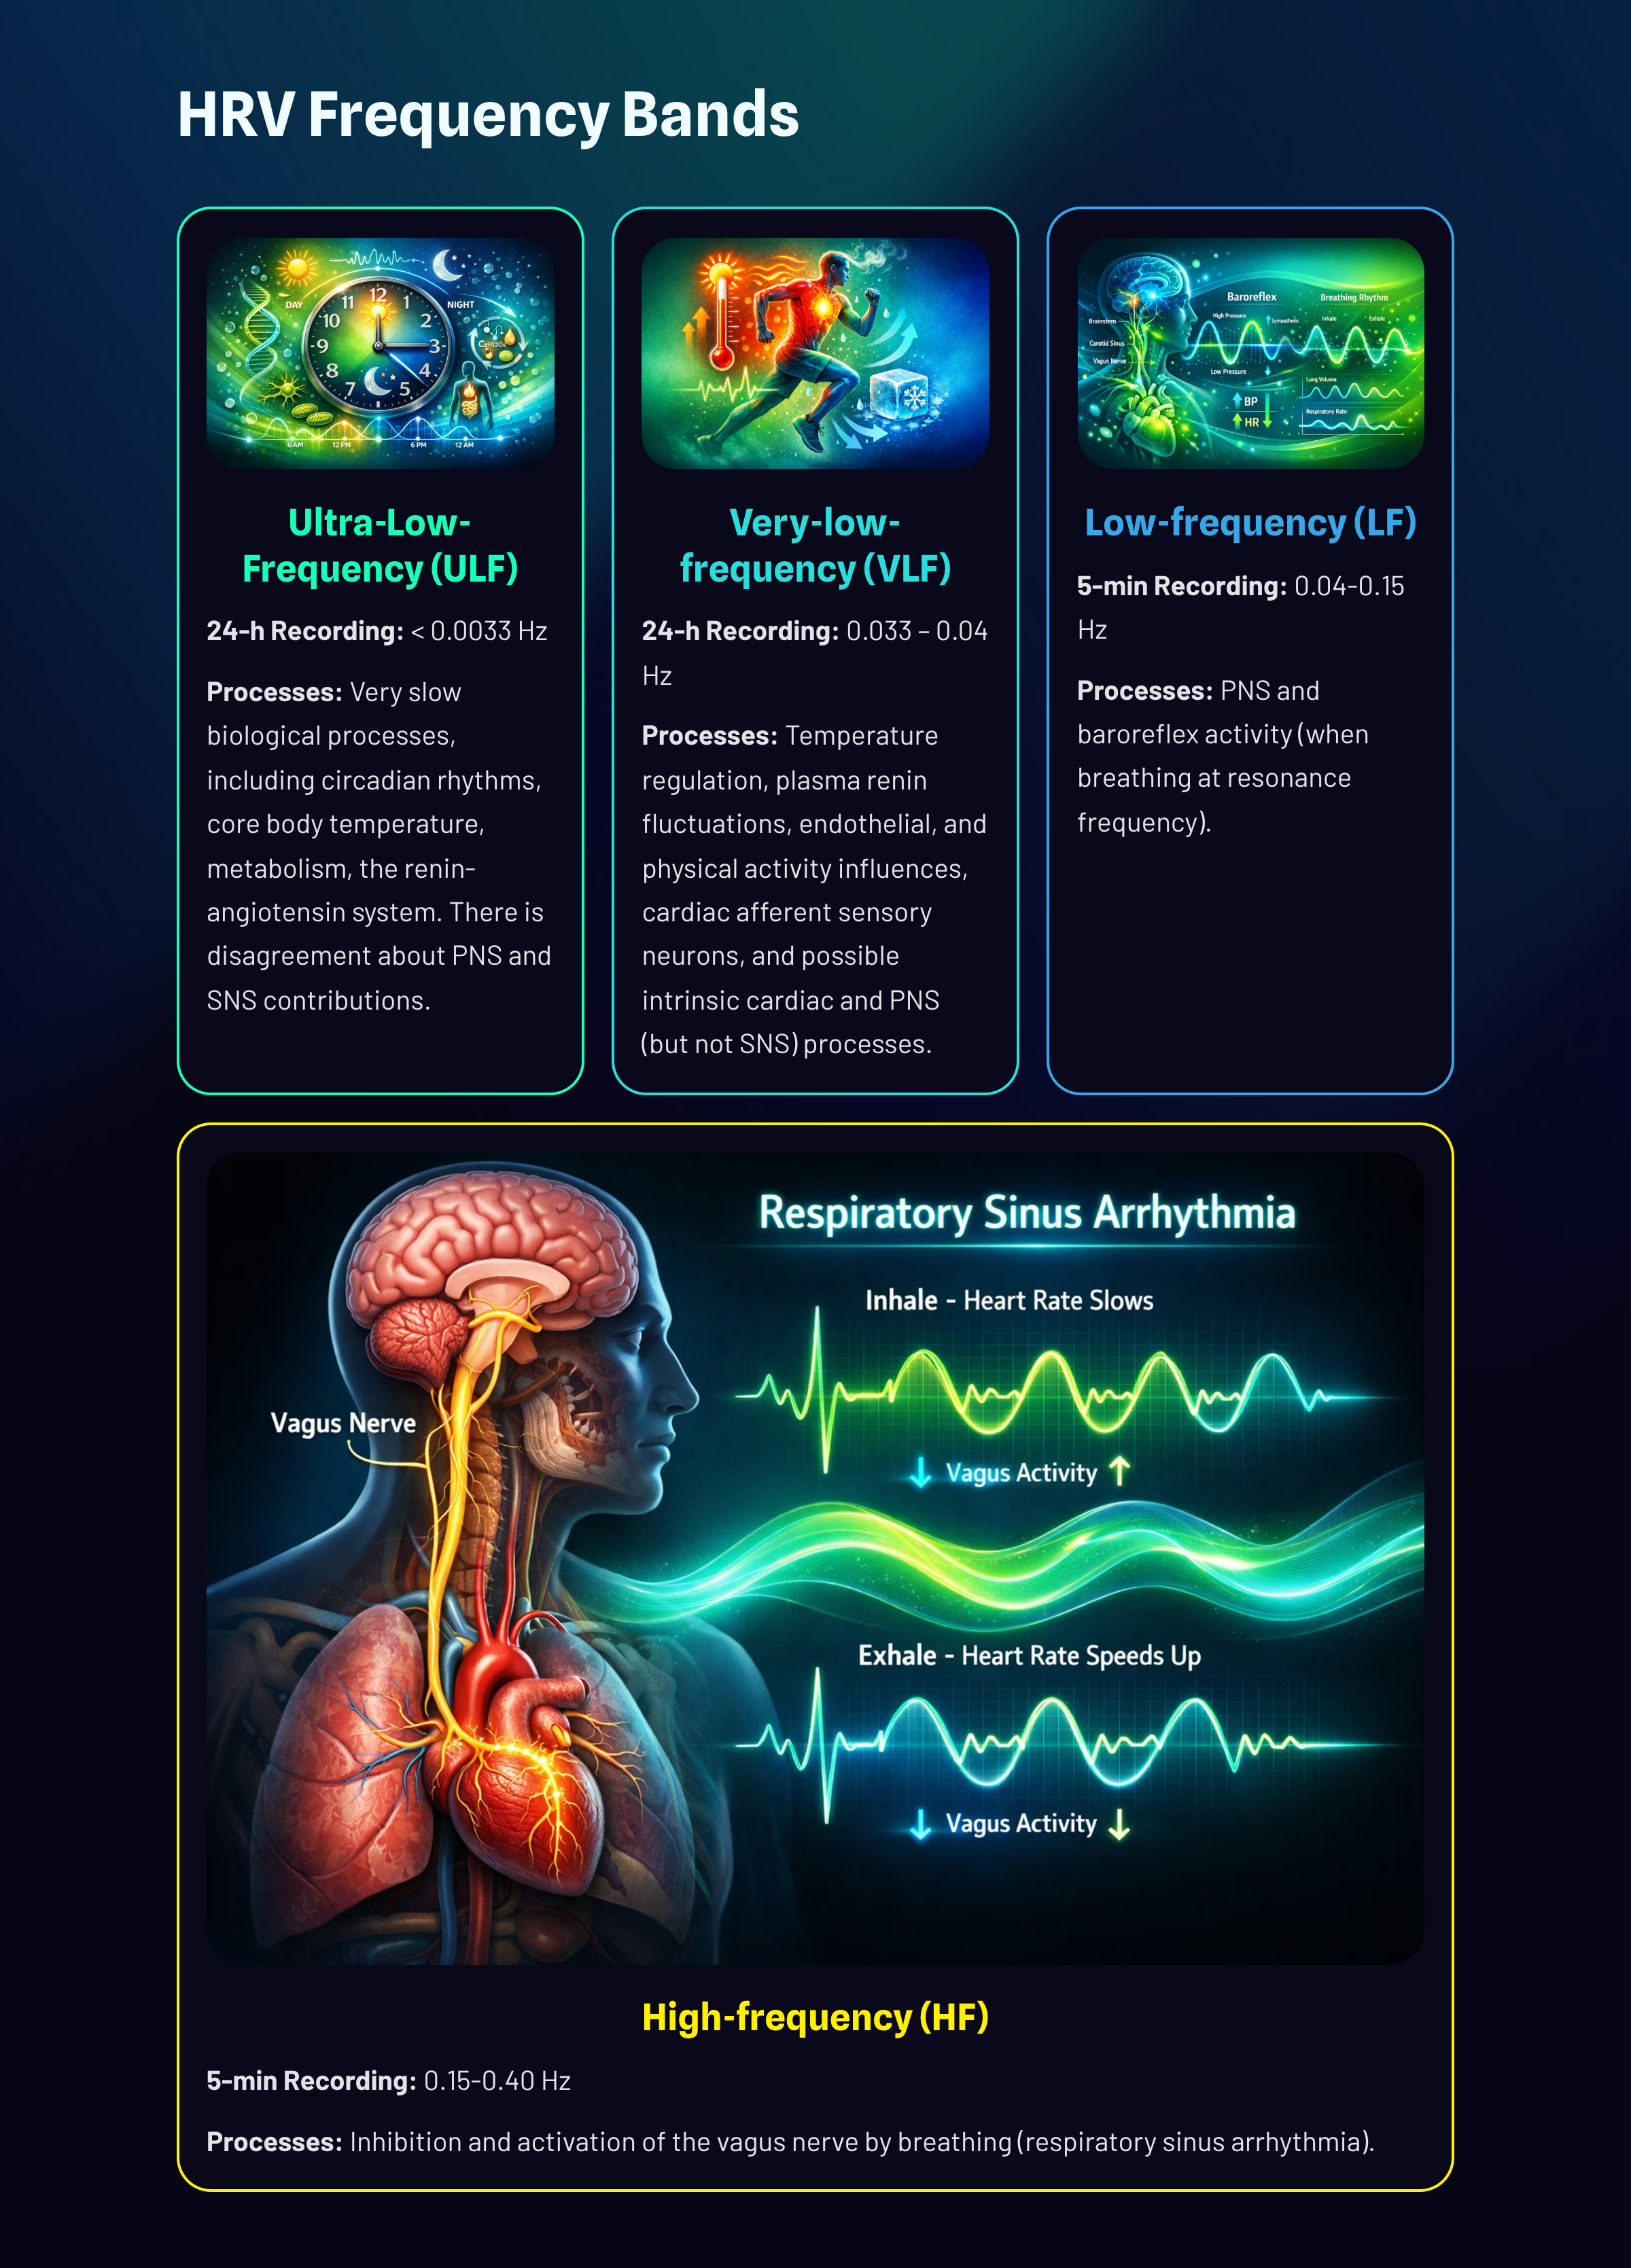
Very-Low-Frequency Band
The very-low-frequency (VLF) band (0.0033-0.04 Hz) requires a recording period of at least 5 minutes but may be best monitored over 24 hours (Task Force, 1996). There is uncertainty regarding the physiological mechanisms responsible for this band's activity (Kleiger et al., 2005).
In short-term recordings, VLF elevations may signal vagal withdrawal (parasympathetic suppression) due to chronic worry or excessive effort (Gevirtz, 2017). Due to its slow speed, it is not sympathetic. In the left FFT spectral plot, VLF power is colored gray.
Low-Frequency Band
The low-frequency (LF) band (0.04-0.15 Hz) is affected by breathing from ~3-9 bpm (Task Force, 1996). The baroreflex system's resonance falls within the LF band. Use LF band power to assess the success of HRVB while your client breathes from 4.5-7.5 bpm (Shaffer & Ginsberg, 2017). When LF band power increases, VLF- and HF-band power may decrease.A single high amplitude peak near 0.1 Hz indicates high coherence within the Institute of HeartMath model.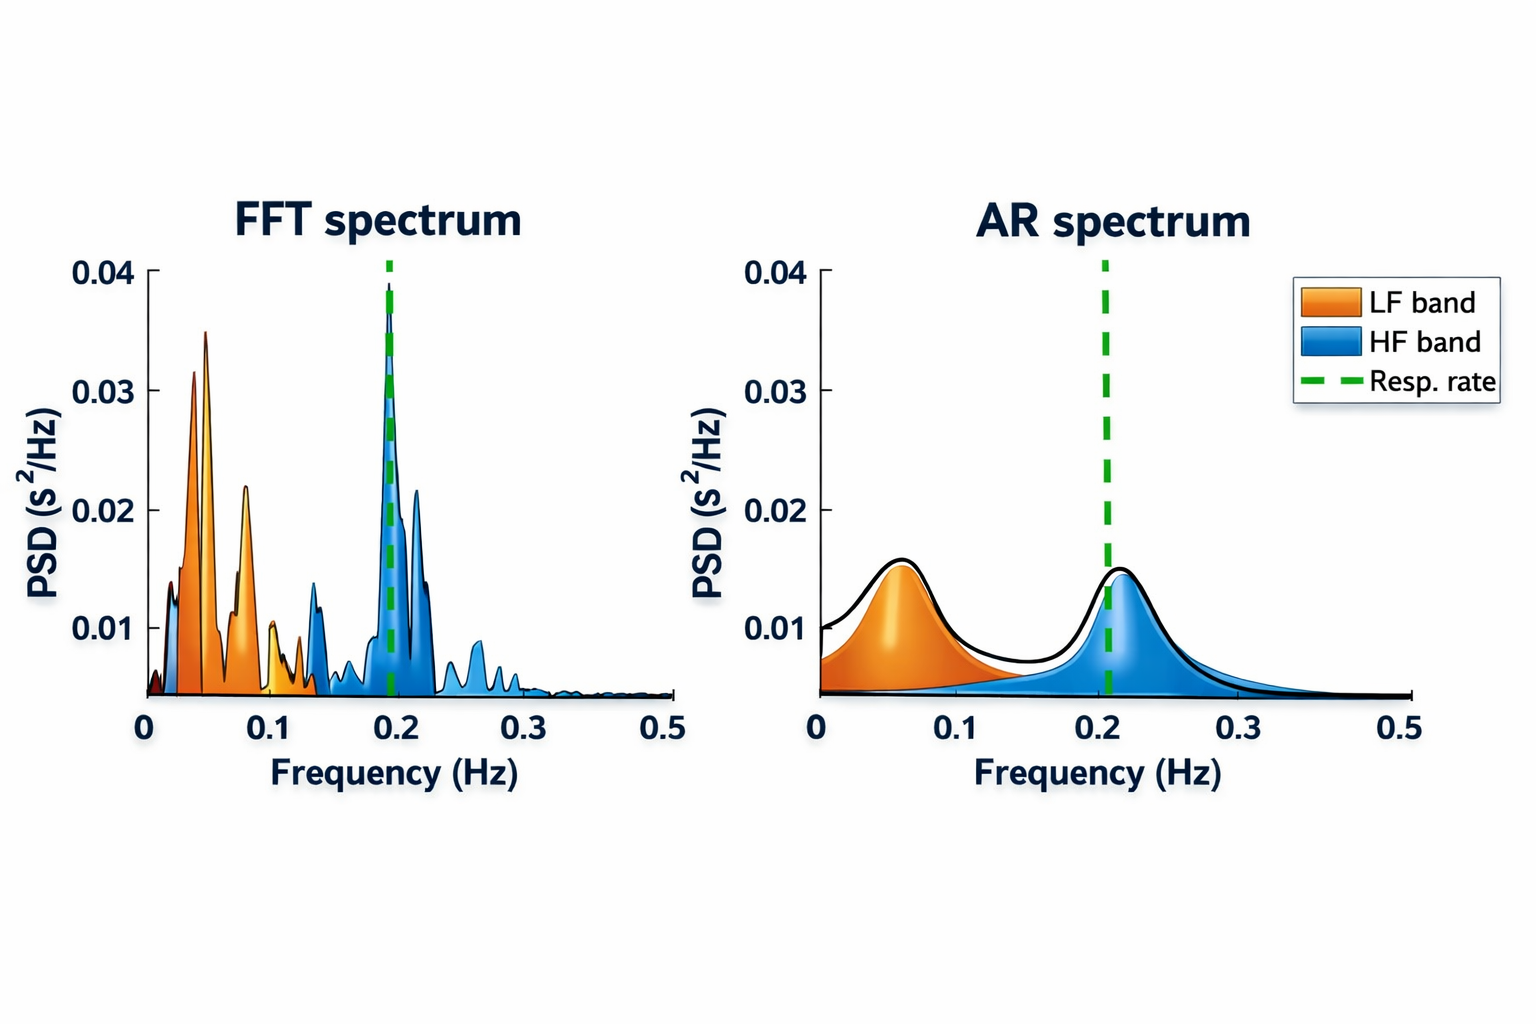
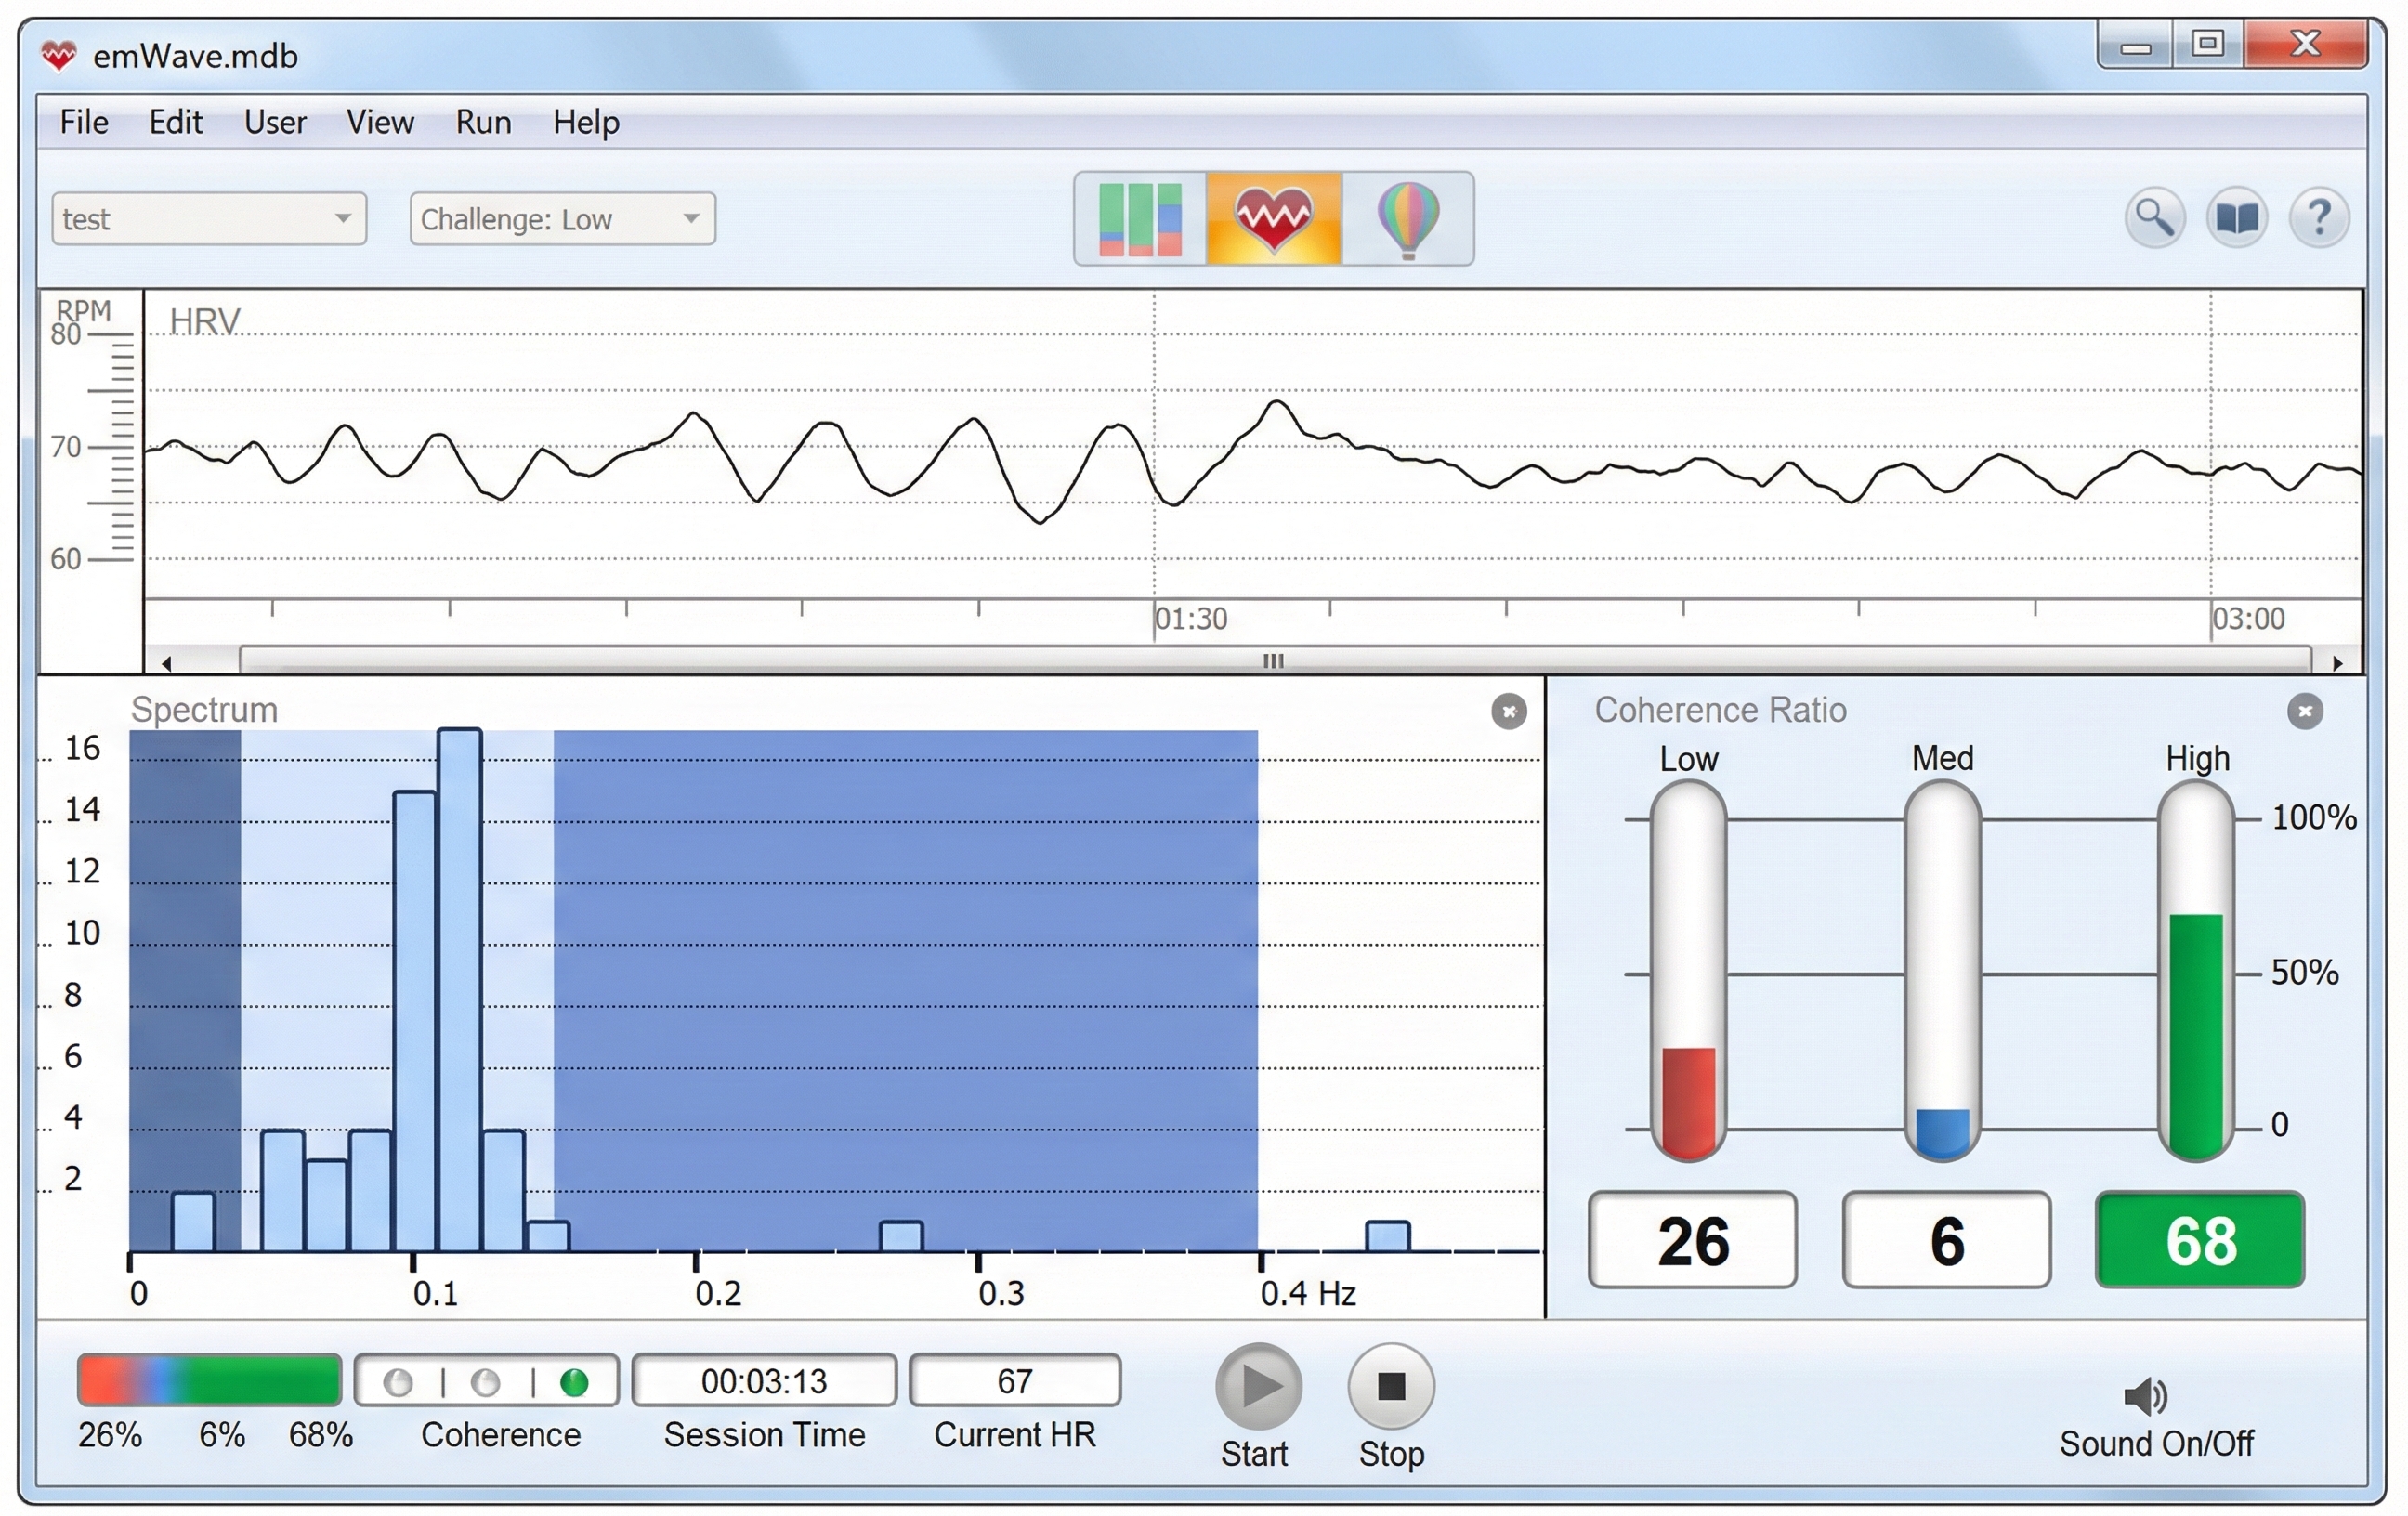
Coherence is a proprietary HeartMath term that means a "narrow, high-amplitude, easily visualized peak" from 0.09-0.14 Hz (Ginsberg, Berry, & Power, 2010, p. 54).
While there is disagreement regarding this band's activity sources, a sympathetic role during resting measurements appears unlikely (Hayano & Yuda, 2019). The PNS and blood pressure regulation may produce LF power via baroreceptors (Akselrod et al., 1981; Berntson, Quigley, & Lozano, 2007; Lehrer, 2007; Task Force, 1996) or by baroreflex activity alone (Goldstein et al., 2011). Breathing at rates below 8.5 breaths per minute, sighing, and taking deep breaths may contribute to LF activity via the vagus (Shaffer, McCraty, & Zerr, 2014).
High-Frequency (HF) Band
The high-frequency (HF) or respiratory band (0.15-0.40 Hz) is influenced by breathing from 9-24 bpm and requires a recording period of at least 1 minute. HF power is highly correlated with the pNN50 and RMSSD time-domain measures (Kleiger et al., 2005). The HF band reflects parasympathetic activity and is called the respiratory band because it corresponds to the respiratory cycle's HR variations.
Use HF band power and time-domain metrics like RMSSD to assess HRV biofeedback training success during resting baselines (Shaffer & Ginsberg, 2017).
Low-Frequency Training By Dr. Khazan
Dr. Inna Khazan demonstrates how slow-paced and normal breathing can change low- and high-frequency power © Association for Applied Psychophysiology and Biofeedback. You can enlarge the video by clicking on the bracket icon at the bottom right of the screen. When finished, click on the ESC key.
Heart rate variability metrics fall into two main categories: time-domain and frequency-domain measures. Time-domain metrics like RMSSD, SDNN, and pNN50 quantify overall HRV magnitude, with RMSSD being preferred for short-term recordings due to its resistance to outliers and artifacts. Frequency-domain metrics reveal the underlying sources of HRV: the VLF band (0.0033-0.04 Hz) may reflect vagal withdrawal in short-term recordings, the LF band (0.04-0.15 Hz) captures baroreflex activity and is the target for resonance frequency training, and the HF band (0.15-0.40 Hz) directly reflects respiratory sinus arrhythmia and parasympathetic activity. Coherence, a HeartMath term, describes a narrow high-amplitude peak near 0.1 Hz. Short-term HRV values serve as proxies for 24-hour values but should never be directly compared with 24-hour norms.
Comprehension Questions: HRV Metrics
- Why is RMSSD preferred over SDNN for short-term HRV assessment?
- What breathing rate range influences the low-frequency band, and why is this clinically relevant for HRV biofeedback training?
- Why should you not compare short-term HRV values with 24-hour norms?
- What is "coherence" in the HeartMath model, and what does it look like on a spectral display?
- What physiological processes are believed to contribute to very-low-frequency HRV power in short-term recordings?
Summary Tables
Summary of Cardiovascular Instrumentation
Drug Effects
Cutting Edge Topics in Cardiovascular Monitoring
Wearable HRV Technology Revolution
Consumer wearable devices have transformed cardiovascular monitoring from a clinical procedure into an everyday self-assessment tool. Devices like the Apple Watch, Oura Ring, Whoop strap, and Garmin smartwatches now provide continuous heart rate and HRV measurements throughout the day and night. These devices use photoplethysmography sensors similar to clinical equipment but miniaturized for wrist or finger placement. The accuracy of consumer devices has improved dramatically, with some studies showing correlation coefficients above 0.90 when compared to clinical-grade ECG measurements during rest. However, accuracy tends to decrease during exercise and in individuals with darker skin tones due to differences in light absorption. Clinicians should be aware that clients increasingly arrive with their own HRV data and may need guidance interpreting these measurements in relation to their training goals.
Artificial Intelligence in HRV Analysis
Machine learning algorithms are revolutionizing how we analyze and interpret HRV data. Traditional time-domain and frequency-domain analyses require artifact-free recordings and careful parameter selection. New AI-based approaches can automatically detect and correct artifacts, identify patterns across multiple recording sessions, and even predict health outcomes. Some systems can distinguish between cardiac arrhythmias and simple movement artifacts with greater than 95% accuracy. AI algorithms trained on large datasets are beginning to identify subtle HRV signatures associated with conditions like early-stage atrial fibrillation, sleep apnea, and autonomic neuropathy. For the biofeedback practitioner, these tools promise cleaner data and more meaningful session-to-session comparisons.
Remote Patient Monitoring and Telehealth Integration
The COVID-19 pandemic accelerated the adoption of remote cardiovascular monitoring for biofeedback applications. Clients can now perform HRV training at home using smartphone apps connected to Bluetooth-enabled sensors, with data automatically uploaded to secure cloud platforms for clinician review. Some platforms provide real-time coaching through the smartphone, adjusting breathing pace recommendations based on the client's current HRV patterns. Research suggests that remote HRV biofeedback can achieve outcomes comparable to in-person training for conditions like anxiety and hypertension, while dramatically improving accessibility for clients in rural areas or with mobility limitations. The integration of video conferencing allows clinicians to observe sensor placement and provide immediate feedback, addressing many traditional concerns about home-based training.
Vagal Tone and Immune Function
Emerging research highlights the connection between heart rate variability and immune function through the cholinergic anti-inflammatory pathway. Higher vagal tone, reflected in greater HRV, appears to modulate inflammatory responses throughout the body. Studies have shown that individuals with higher baseline HRV demonstrate lower levels of inflammatory markers like C-reactive protein and interleukin-6. This connection has implications for conditions ranging from autoimmune disorders to cancer recovery. Some researchers are now investigating whether HRV biofeedback training can serve as an adjunctive treatment to reduce inflammation and improve immune function. While this research is still in early stages, it suggests that cardiovascular biofeedback may have benefits extending far beyond stress management and autonomic regulation.
Ultra-Short HRV Recordings
Traditional HRV analysis requires a minimum 5-minute recording for time-domain metrics and even longer for reliable frequency-domain measurements. However, recent research has validated ultra-short recordings of 1-2 minutes or even 30 seconds for certain applications. The RMSSD metric appears particularly robust in shorter recordings, maintaining acceptable correlation with 5-minute values even at 60-second durations. This development has practical implications for clinical settings where time is limited and for wearable devices that take periodic spot checks rather than continuous recordings. Clinicians should understand the limitations of ultra-short recordings, particularly that frequency-domain analyses are not valid below certain recording durations, but can leverage these findings to make quicker assessments when full recordings are not feasible.
Acknowledgment
This unit draws heavily on graphics published in Didier Combatalade's Basics of Heart Rate Variability Applied to Psychophysiology, published by Thought Technology Ltd. Didier is the Director of Clinical Interface at Thought Technology Ltd and a gifted educator, writer, and generous colleague.

Glossary
absolute power: the magnitude of HRV within a frequency band measured in milliseconds squared divided by cycles per second (ms2/Hz).
arterial stiffness: reduced elasticity of artery walls that affects pulse wave transmission, blood pressure, and pulse amplitude variability.
atrial fibrillation: a form of supraventricular arrhythmia with a HR of up to 160 beats per minute.
baroreflex: a feedback system in which pressure sensors in the arteries detect changes in blood pressure and adjust heart rate and vessel tone to maintain cardiovascular stability.
bead thermistor: a temperature sensor that encases the thermistor in an epoxy bead.
blanketing effect: the artificial elevation of temperature readings caused by using multiple layers of tape over a thermistor, which traps heat.
blood volume: the tonic changes in the amount of blood in an arm, leg, or digit.
blood volume pulse (BVP): the phasic change in blood volume with each heartbeat. It is the vertical distance between the minimum value (trough) of one pulse wave and the maximum value (peak) of the next measured using a photoplethysmograph (PPG).
breathing harness: a respiration sensor that changes resistance to a current as it expands and contracts during the respiratory cycle.
camera-based photoplethysmography: a remote PPG method that uses a video camera to detect subtle color changes in the skin, typically the face, to measure pulse waves without physical contact.
cardiac conduction artifacts: an ECG artifact due to cardiac conduction abnormalities like atrial fibrillation, premature atrial contractions, and premature ventricular contractions.
coherence: a proprietary HeartMath term that means a narrow, high-amplitude, easily visualized peak from 0.09-0.14 Hz.
cold artifact: a BVP artifact produced by cold exposure or sympathetically-mediated vasoconstriction that reduces or eliminates the pulse wave.
DC offset artifact: an ECG artifact that lengthens the IBI when differences in skin-electrode impedance produce signal drift causing the software to miss beats.
electromagnetic interference (EMI) artifact: an ECG artifact generated when cell phones or computer monitors transmit an artifactual voltage.
electromechanical coupling: the process by which the heart's electrical activation triggers mechanical contraction, introducing a time delay between the ECG signal and the resulting pulse wave.
EMG artifact: an ECG artifact that shortens the IBI when signal contamination by the EMG causes the software to detect nonexistent beats.
epoch: a data collection period used for HRV analysis.
extra beats: an ECG artifact that shortens the IBI when signal distortion causes the software to detect nonexistent beats.
feedback thermometer: a temperature biofeedback device that passes a DC signal through a thermistor and back to a voltmeter.
frequency-domain measures: the calculation of the absolute or relative power of the HRV signal within four frequency bands.
heart rate (HR): the number of heartbeats per minute, also called stroke rate.
heart rate variability (HRV): the beat-to-beat changes in heart rate, including changes in the RR intervals between consecutive heartbeats.
high-frequency (HF) band: an ECG frequency range from 0.15-0.40 Hz that represents the inhibition and activation of the vagus nerve by breathing (respiratory sinus arrhythmia).
HR Max-HR Min: an index of HR variability that calculates the difference between the highest and lowest HRs during each respiratory cycle.
HRV triangular index: a geometric measure based on 24-hour recordings that divides the number of NN intervals by the number of NN intervals found within the modal 8-millisecond bin.
impedance: the opposition to AC flow.
interbeat interval (IBI): the time interval between the peaks of successive R-spikes (initial upward deflection in the QRS complex). The IBI is also called the NN (normal-to-normal) interval.
light artifact: a PPG artifact when light leakage increases BVP amplitude.
line interference artifact: ECG and PPG artifact when 50/60 Hz contamination of signals causes the software to detect nonexistent beats and shorten the IBI.
low-frequency (LF) band: an ECG frequency range of 0.04-0.15 Hz that may represent the influence of PNS, SNS, and baroreflex activity (when breathing at resonance frequency).
low-pass filter: an electronic device that selects frequencies below a cutoff frequency like 1 Hz in a feedback thermometer.
missed beats: BVP and ECG artifact that lengthens the IBI when signal distortion causes the software to overlook a beat and use the next good beat.
movement artifact: ECG and PPG artifact that shortens the IBI when signal distortion from movement causes the software to detect nonexistent beats.
negative temperature coefficient: the resistance to a DC declines as temperature rises.
NN50: the number of adjacent NN intervals that differ from each other by more than 50 milliseconds.
normal units: the division of the absolute power for a specific frequency band by the summed absolute power of the low frequency (LF) and high frequency (HF) bands.
operational amplifier: a high-gain DC amplifier that uses external feedback to add, subtract, or average thermistor signals.
photoelectric transducer: a phototransistor that detects infrared light transmitted by a PPG sensor and converts it into a positive DC signal.
photoplethysmographic sensor: a photoelectric transducer that transmits and detects infrared light that passes through or is reflected off tissue to measure brief changes in blood volume and detect the pulse wave.
plateau: in temperature biofeedback, lack of change in skin temperature.
pNN50: the percentage of adjacent NN intervals that differ from each other by more than 50 milliseconds.
polarity artifact: an ECG artifact when reversed electrode placement inverts the direction of the R-spike and causes the software to miss beats and lengthen the IBI.
premature atrial contraction (PAC): abnormally-shaped P-waves that result in calculating extra beats and distorting the BVP and ECG signals.
premature ventricular contraction (PVC): extra heartbeats that originate in the ventricles instead of the S-A node of the heart and can distort the BVP and ECG signals.
pressure artifact: a BVP artifact caused by excessive pressure on the PPG sensor from tight restraining bands or resting weight on the sensor, which reduces signal amplitude and may cause missed beats.
pulse amplitude variability (PAV): beat-to-beat variation in the height of the peripheral pulse wave, influenced by stroke volume, arterial stiffness, and vascular tone.
pulse rate variability (PRV): beat-to-beat variation in the time intervals between PPG pulse waves, related to but not identical to heart rate variability.
pulse transit time (PTT): the time required for the arterial pressure wave generated by the heart to travel from the heart to a peripheral site, affected by arterial stiffness and blood pressure.
reference electrode: a ground (sometimes black) ECG electrode that may be placed on the left upper chest, below the palmar aspect of the left elbow, or above the palmar aspect of the left wrist.
reflection technique: a PPG method where the light source and photodetector are placed on the same side of the tissue.
relative power: the percentage of total HRV.
resolution: degree of detail in a biofeedback display (0.1 millivolts) or the number of voltage levels that an A/D converter can discriminate (16 bits or discrimination among 65,536 voltage levels).
resonance frequency: the breathing rate at which the cardiovascular and respiratory systems interact to produce the largest, most coherent heart rate oscillations, often around 4.5-7 breaths per minute in adults.
respiration artifact: an ocean-wave-like distortion of the ECG due to dried gel and inadequate skin preparation.
RMSSD: the square root of the mean squared difference of adjacent NN intervals.
SDANN: the standard deviation of the average 5-minute NN intervals that estimates HR changes produced by cycles longer than 5 minutes.
SDNN: the standard deviation of the interbeat interval measured in milliseconds.
SDNN index: the average of 5-minute standard deviations of NN intervals across 24 hours that measures the contribution of rhythms briefer than 5 minutes to HRV.
SDRR: the standard deviation of the interbeat interval for all sinus beats measured in milliseconds.
stem effect: the distortion of temperature measurements by ambient temperature when the first 3-5 inches of a thermistor are not secured against the skin.
stroke volume: the amount of blood ejected by the left ventricle with each heartbeat, an important determinant of pulse amplitude.
thermal lag: the time lag between the change in arteriole diameter and a feedback thermometer's display of the new temperature.
thermistor: a temperature-sensitive resistor.
thermography: infrared imaging used to identify temperature patterns across body regions.
time constant: the period required for a thermistor to reach 63.2% of a final temperature value.
time-domain measurements: HRV indices that quantify the variability in interbeat interval measurements (IBI).
tracking tests: checks of whether the biofeedback display mirrors client behavior. BVP amplitude and instantaneous heart rate detected by BVP and ECG sensors should speed and slow as clients inhale and exhale. Temperature should increase as you blow warm air over a thermistor bead.
transmission technique: a PPG method where the light source and photodetector are placed on opposite sides of a digit.
ultra-low-frequency (ULF) band: an ECG frequency range below 0.0033 Hz represents very slow-acting biological processes and is too gradual to train using conventional biofeedback.
vascular responder: a response pattern where BVP and skin temperature may significantly decrease in response to a stressor.
vascular tone: the degree of constriction or dilation in blood vessel walls, largely regulated by the autonomic nervous system and affecting blood pressure and pulse amplitude.
very-low-frequency (VLF): an ECG frequency range of 0.003-0.04 Hz that may represent temperature regulation, gastric, plasma renin fluctuations, endothelial and physical activity influences, and possible PNS and SNS contributions.
web dorsum: a temperature monitoring site on the back of the hand between the thumb and index finger.
Test Yourself
Click on the ClassMarker logo to take 10-question tests over this unit without an exam password.

REVIEW FLASHCARDS ON QUIZLET
Click on the Quizlet logo to review our chapter flashcards.

Visit the BioSource Software Website
BioSource Software offers Human Physiology, which satisfies BCIA's Human Anatomy and Physiology requirement, and Biofeedback100, which provides extensive multiple-choice testing over BCIA's Biofeedback Blueprint.

Essential Skills
Blood volume pulse1. Explain the blood volume pulse signal and biofeedback to a client.
2. Explain PPG sensor attachment to a client and obtain permission to monitor her.
3. Explain how to select a placement site and demonstrate how to attach a PPG sensor to minimize light and movement artifacts.
4. Perform a tracking test by asking your client to raise the monitored hand above the heart and lower it.
5. Identify common artifacts in the raw PPG signal, especially movement, and explain how to control them and remove them from the raw data.
6. Explain the significant measures of HRV, including HR Max - HR Min, pNN50, SDNN, and SDRR.
7. Explain why we train clients to increase power in the low-frequency band of the ECG and how breathing at 5-7 breaths per minute helps them accomplish this.
8. Demonstrate how to instruct a client to utilize a feedback display.
9. Describe strategies to help clients increase their HRV.
10. Demonstrate an HRV biofeedback training session, including record keeping, goal setting, site selection, baseline measurement, display and threshold setting, coaching, and debriefing at the end of the session.
11. Demonstrate how to select and assign a practice assignment based on training session results.
12. Evaluate and summarize client/patient progress during a training session.
Heart rate1. Explain the ECG signal and biofeedback to a client.
2. Explain ECG sensor attachment to a client and obtain permission to monitor her.
3. Explain how to select a placement site and demonstrate how to attach ECG sensors to minimize movement artifacts.
4. Demonstrate skin preparation.
5. Perform a tracking test by asking your client to inhale slowly and then exhale as you watch the change in heart rate.
6. Identify movement artifact in the raw ECG signal and explain how to control movement and remove it from the raw data.
7. Explain the significant measures of HRV, including HR Max - HR Min, pNN50, SDNN, and SDRR.
8. Explain why we train clients to increase power in the low-frequency band of the ECG and how breathing at 5-7 breaths per minute helps them accomplish this.
9. Demonstrate how to instruct a client to utilize a feedback display.
10. Describe strategies to help clients increase their HRV.
11. Demonstrate an HRV biofeedback training session, including record keeping, goal setting, site selection, baseline measurement, display and threshold setting, coaching, and debriefing at the end of the session.
12. Demonstrate how to select and assign a practice assignment based on training session results.
13. Evaluate and summarize client progress during a training session.
Temperature1. Explain the temperature signal and biofeedback to a client.
2. Explain thermistor attachment to a client and obtain permission to monitor her.
3. Explain how to select a placement site and demonstrate how to attach a thermistor to minimize blanketing, movement, and stem artifacts.
4. Perform a tracking test by asking your client to blow on the thermistor bead.
5. Identify common artifacts in the raw temperature signal, including draft and movement, and explain how to control them and remove them from the raw data.
6. Demonstrate how to instruct a client to utilize a feedback display.
7. Describe strategies to help clients with cold hands who warm very slowly or cool when they attempt to warm their hands.
8. Demonstrate a temperature biofeedback training session, including record keeping, goal setting, site selection, whether to record bilaterally or unilaterally, baseline measurement, display, threshold setting, coaching, and debriefing at the end of the session.
9. Demonstrate how to select and assign a practice assignment based on training session results.
10. Evaluate and summarize client progress during a training session.
Assignment
Now that you have completed this unit, explain when blood volume pulse feedback could complement temperature biofeedback and why. What is an advantage of a wrist ECG sensor placement over a chest placement in clinical practice?
References
Addleman, J. S., Lackey, N. S., DeBlauw, J. A., & Hajduczok, A. G. (2024). Heart rate variability applications in strength and conditioning: A narrative review. Journal of Functional Morphology and Kinesiology, 9(3), 107. https://doi.org/10.3390/jfmk9030107
Aldini, M. (2016). Issues in heart rate variability (HRV) analysis: Motion artifacts & ectopic beats. Blog post: https://www.hrv4training.com/blog/issues-in-heart-rate-variability-hrv-analysis-motion-artifacts-ectopic-beats
Andreassi, J. L. (2000). Psychophysiology: Human behavior and physiological response. Lawrence Erlbaum and Associates, Inc.
Barton, D., Sprau, D. J., Turner, J. N., & Hobbs, K. (2010). Antidepressant medication use and breast cancer risk: A case-control study. Pharmacoepidemiology and Drug Safety, 19(2), 118-126. https://doi.org/10.1002/pds.1880
Benarroch E. E. (2012). Endogenous opioid systems: Current concepts and clinical correlations. Neurology, 79(8), 807–814. https://doi.org/10.1212/WNL.0b013e3182662098
Berntson, G. G., Bigger, J. T., Jr., Eckberg, D. L., Grossman, P., Kaufmann, P. G., Malik, M., Nagaraja, H. N., Porges, S. W., Saul, J. P., Stone, P. H., & Van Der Molen, M. W. (1997). Heart rate variability: Origins, methods, and interpretive caveats. Psychophysiology, 34, 623-648. https://doi.org/10.1111/j.1469-8986.1997.tb02140.x
Berntson, G. G., Quigley, K. S., & Lozano, D. (2007). Cardiovascular psychophysiology. In J. T. Cacioppo, L. G. Tassinary, & G. G. Berntson (Eds.). Handbook of psychophysiology (3rd ed.). Cambridge University Press.
Berntson, G. G., & Stowell, J. R. (1998). ECG artifacts and heart period variability: Don’t miss a beat! Psychophysiology, 35, 127-132. https://doi.org/10.1111/1469-8986.3510127
Billman, G. E. (2002). The effects of omega-3 polyunsaturated fatty acids on cardiac rhythm: A critical reassessment. Pharmacology & Therapeutics, 94(1), 71-88. https://doi.org/10.1016/S0163-7258(02)00187-2
Chen, A., & Ashburn, M. A. (2015). Cardiac effects of opioid therapy. Pain Medicine, 16 Suppl 1, S27–S31. https://doi.org/10.1111/pme.12915
Cherif, S., Pastor, D., Nguyen, Q.-T., & L’Her, E. (2016). Detection of artifacts on photoplethysmography signals using random distortion testing. 38th Annual International Conference of the IEEE Engineering in Medicine and Biology Society (EMBC). https://doi.org/10.1109/EMBC.2016.7592148
Clinical EEG Interpretation (2018). Premature ventricular contractions (premature ventricular complex, premature ventricular beats. https://ecgwaves.com/premature-ventricular-contractions-complex-beats-ecg/
Combatalade, D. (2010). Basics of heart rate variability applied to psychophysiology. Thought Technology Ltd.
Combatalade, D. (2013). CardioPro Infiniti: HRV analysis module for BioGraph Infiniti. Thought Technology Ltd.
Curigliano, G., Cardinale, D., Suter, T., Plataniotis, G., de Azambuja, E., Sandri, M. T., ... & Stragliotto, S. (2016). Cardiovascular toxicity induced by chemotherapy, targeted agents and radiotherapy: ESMO Clinical Practice Guidelines. Annals of Oncology, 27(suppl_5), v166-v181. https://doi.org/10.1093/annonc/mdw235
DeGiorgio, C. M., Miller, P., Meymandi, S., Chin, A., Epps, J., Gordon, S., Gombein, J., & Harper, R. M. (2010). RMSSD, a measure of vagus-mediated heart rate variability, is associated with risk factors for SUDEP: The SUDEP-7 Inventory. Epilepsy Behav, 19(1), 78-81. https://doi.org/10.1016/j.yebeh.2010.06.011
DeVon, H. A., Piano, M. R., Rosenfeld, A. G., & Hoppensteadt, D. A. (2008). The association of pain with protein inflammatory biomarkers: A review of the literature. Nursing Research, 57(5), 301-319. https://doi.org/10.1097/01.NNR.0000313495.53514.74
Draghici, A. E., & Taylor, J. A. (2016). The physiological basis and measurement of heart rate variability in humans. Journal of Physiological Anthropology, 35, 22. https://doi.org/10.1186/s40101-016-0113-7
Elgendi, M. (2012). On the analysis of fingertip photoplethysmogram signals. Current Cardiology Reviews, 8, 14-25. https://doi.org/10.2174/157340312801215782
Faust, O., Hong, W., Loh, H. W., Xu, S., Tan, R. S., Chakraborty, S., Barua, P. D., Molinari, F., & Acharya, U. R. (2022). Heart rate variability for medical decision support systems: A review. Computers in Biology and Medicine, 144, 105330. https://doi.org/10.1016/j.compbiomed.2022.105330
Fuller, J., Wally, C., Westermann-Long, A., Korenfeld, D., & Carrell, D. (2011). Resonance frequency measurements are reliable [Abstract]. Applied Psychophysiology and Biofeedback, 36(3), 219. https://doi.org/10.1007/s10484-011-9168-8
Fournié, C., Chouchou, F., Dalleau, G., Caderby, T., Cabrera, Q., & Verkindt, C. (2021). Heart rate variability biofeedback in chronic disease management: A systematic review. Complementary Therapies in Medicine, 60, 102738. https://doi.org/10.1016/j.ctim.2021.102738
Gevirtz, R. N. (2011). Cardio-respiratory psychophysiology: Gateway to mind-body medicine. BFE conference workshop.
Gevirtz, R. (2018). Personal communication about artifacting.
Gevirtz, R. N. (2020). The myths and misconceptions of heart rate variability: HRV in biofeedback training. AAPB Annual Meeting.
Ginsberg, J. P., Berry, M. E., & Powell, D. A. (2010). Cardiac coherence and posttraumatic stress disorder in combat veterans. Alternative Therapies, 16(4), 52-60.
Glass, P. S., Gan, T. J., Howell, S., & Ginsberg, B. (1997). Drug interactions: Volatile anesthetics and opioids. Journal of Clinical Anesthesia, 9(6 Suppl), 18S–22S. https://doi.org/10.1016/s0952-8180(97)00122-0
Goadsby, P. J., Reuter, U., Hallström, Y., Broessner, G., Bonner, J. H., Zhang, F., ... & Picard, H. (2017). A controlled trial of erenumab for episodic migraine. New England Journal of Medicine, 377(22), 2123-2132. https://doi.org/10.1056/NEJMoa1705848
Gorman, J. M., Korotzer, A., & Su, G. (2000). Efficacy comparison of escitalopram and citalopram in the treatment of major depressive disorder: Pooled analysis of placebo-controlled trials. CNS Spectrums, 5(2), 40-44. https://doi.org/10.1017/S1092852900008044
Hagedorn, D. (2014). Infection risk mitigation for biofeedback providers. Biofeedback, 42(3), 93-95. https://doi.org/10.5298/1081-5937-42.3.06
Hammerness, P., McCarthy, K., Mancuso, E., Gendron, C., & Geller, D. (2003). Psychopharmacological treatment of ADHD and comorbid anxiety: A retrospective chart review of 191 preadolescents and adolescents. CNS Spectrums, 8(10), 727-733. https://doi.org/10.1017/S1092852900019260
Havakuk, O., Rezkalla, S. H., & Kloner, R. A. (2017). The cardiovascular effects of cocaine. Journal of the American College of Cardiology, 70(1), 101–113. https://doi.org/10.1016/j.jacc.2017.05.014
Haverkamp, W., & Breithardt, G. (1984). The effects of flecainide on electrophysiological properties of the heart: Experimental data and clinical implications. European Heart Journal, 5(Supplement A), 35-43. https://doi.org/10.1093/eurheartj/5.suppl_A.35
Hejjel, L., & Béres, S. (2021). Comment on "Pulse rate variability in cardiovascular health: A review on its applications and relationship with heart rate variability." Physiological Measurement, 42(3), 038001. https://doi.org/10.1088/1361-6579/abf050
Ishaque, S., Khan, N., & Krishnan, S. (2021). Trends in heart-rate variability signal analysis. Frontiers in Digital Health, 3, 639444. https://doi.org/10.3389/fdgth.2021.639444
Johnston, B. W., Barrett-Jolley, R., Krige, A., & Welters, I. D. (2019). Heart rate variability: Measurement and emerging use in critical care medicine. Journal of the Intensive Care Society, 20(3), 224-230. https://doi.org/10.1177/1751143719832181
Jones, R. T. (2002). Cardiovascular system effects of marijuana. Journal of Clinical Pharmacology, 42(S1), 58S–63S. https://doi.org/10.1002/j.1552-4604.2002.tb06004.x
Kabins, A., Goedde, J., & Shaffer, F. (2009). A reevaluation of the web dorsum for monitoring hand temperature [Abstract]. Applied Psychophysiology and Biofeedback, 34(1), 69-70.
Kaplan S. A. (2005). Alpha-blocker therapy: Current update. Reviews in Urology, 7 Suppl 8(Suppl 8), S34–S42. PMID: 16985889
Katzung, B. G., & Trevor, A. J. (2020). Basic and clinical pharmacology (15th ed.). McGraw-Hill Professional.
Khazan, I. (2013). The clinical handbook of biofeedback: A step-by-step guide for training and practice with mindfulness. John Wiley & Sons, Ltd.
Kleiger, R. E., Miller, J. P., Bigger, J. T., Moss, A. J., & the Multicenter Post-Infarction Research Group (1987). Decreased heart rate variability and its association with increased mortality after acute myocardial infarction. American Journal of Cardiology, 59(4), 256-262. https://doi.org/10.1016/0002-9149(87)90795-8
Kuusela, K. (2013). Methodological aspects of heart rate variability analysis. In M. V. Kamath, M. A. Watanabe, & A. R. M. Upton (Eds.). Heart rate variability (HRV) signal analysis. CRC Press.
Lago, J. A., Kosten, T. R., Nestler, E. J., Goldberg, S. R., & Stine, S. M. (2008). Bupropion treatment in veterans with posttraumatic stress disorder: An open study. Journal of Clinical Psychopharmacology, 28(5), 518-519. https://doi.org/10.1097/JCP.0b013e318184a9ac
Langner, P. H. Jr., & Geselowitz, D. B. (1960). Characteristics of the frequency spectrum in the normal electrocardiogram and in subjects following myocardial infarction. Circ Res, 8, 577-584. https://doi.org/10.1161/01.RES.8.3.577
Lehrer, P. (2018a). Heart rate, interbeat interval, and the electrocardiogram (shared presentation).
Lehrer, P. (2018b). Personal communication about artifacting.
Lehrer, P. M. (2007). Biofeedback training to increase heart rate variability. In P. M. Lehrer, R. M. Woolfolk, & W. E. Sime (Eds.). Principles and practice of stress management (3rd ed.). The Guilford Press.
Lehrer, P. M. (2012). Personal communication.
Lehrer, P. M., Vaschillo, E., & Vaschillo, B. (2000). Resonant frequency biofeedback training to increase cardiac variability: Rationale and manual for training. Applied Psychophysiology and Biofeedback, 25(3),
177-191. https://doi.org/10.1023/a:1009554825745
Lyon, A. R., Yousaf, N., Battisti, N. M. L., Moslehi, J., & Larkin, J. (2018). Immune checkpoint inhibitors and cardiovascular toxicity. The Lancet Oncology, 19(9), e447-e458. https://doi.org/10.1016/S1470-2045(18)30457-1
Mejía-Mejía, E., May, J. M., Torres, R., & Kyriacou, P. A. (2020). Pulse rate variability in cardiovascular health: A review on its applications and relationship with heart rate variability. Physiological Measurement, 41(7), 07TR01. https://doi.org/10.1088/1361-6579/ab936d
Mohanraj, R., & Brodie, M. J. (2006). Diagnosing refractory epilepsy: Response to sequential treatment schedules. European Journal of Neurology, 13(3), 277-282. https://doi.org/10.1111/j.1468-1331.2006.01197.x
Montgomery, D. (2004). Introduction of biofeedback. Module 3: Psychophysiological recording. A. Crider & D. D. Montgomery (Eds.). Association for Applied Psychophysiology and Biofeedback.
Moss, D. (2004). Heart rate variability (HRV) biofeedback. Psychophysiology Today, 1, 4-11.
Mozaffarian, D., Longstreth, W. T., Lemaitre, R. N., Manolio, T. A., Kuller, L. H., Burke, G. L., ... & Siscovick, D. S. (2005). Fish consumption and stroke risk in elderly individuals: The cardiovascular health study. Archives of Internal Medicine, 165(2), 200-206. https://doi.org/10.1001/archinte.165.2.200
Mukherjee, D., Nissen, S. E., & Topol, E. J. (2001). Risk of cardiovascular events associated with selective COX-2 inhibitors. JAMA, 286(8), 954-959. https://doi.org/10.1001/jama.286.8.954
Nederend, I., Jongbloed, M. R. M., de Geus, E. J. C., Blom, N. A., & ten Harkel, A. D. J. (2016). Postnatal cardiac autonomic nervous control in pediatric congenital heart disease. J Cardiovasc Dev Dis, 3(2) 16. https://doi.org/10.3390/jcdd3020016
Niederhoffer, N., & Szabo, B. (1999). Effect of the cannabinoid receptor agonist WIN55212-2 on sympathetic cardiovascular regulation. British Journal of Pharmacology, 126(2). https://doi.org/10.1038/sj.bjp.0702337
Nunan, D., Sandercock, G. R. H., & Brodie, D. A. (2010). A quantitative systematic review of normal values for short-term heart rate variability in healthy adults. Pacing and Clinical Electrophysiology, 33(11), 1407-1417. https://doi.org/10.1111/j.1540-8159.2010.02841.x
Otzenberger, H., Gronfier, C., Simon, C., Charloux, A., Ehrhart, J., Piquard, F., & Brandenberger, G. (1998). Dynamic heart rate variability: A tool for exploring sympathovagal balance continuously during sleep in men. American Journal of Physiology, 275(3), H946-H950. https://doi.org/10.1152/ajpheart.1998.275.3.H946
Ozdemir, V., Naranjo, C. A., Herrmann, N., Reed, K., Sellers, E. M., & Kalow, W. (2006). Paroxetine potentiates the central nervous system side effects of perphenazine: Contribution of cytochrome P4502D6 inhibition in vivo. Clinical Pharmacology & Therapeutics, 60(6), 571-579. https://doi.org/10.1016/S0009-9236(96)90217-3
Peek, C. J. (2016). A primer of traditional biofeedback instrumentation. In M. S. Schwartz, & F. Andrasik (Eds.). (2016). Biofeedback: A practitioner's guide (4th ed.). The Guilford Press.
Peper, E. (2010). Personal communication.
Peper, E., Harvey, R., Lin, I., Tylova, H., & Moss, D. (2007). Is there more to blood volume pulse than heart rate variability, respiratory sinus arrhythmia, and cardio-respiratory synchrony? Biofeedback, 35(2), 54-61.
Peper, E., & Olesen, E. (1985). Portable infrared thermometer: Advantages for temperature measurements. Health Care Instrumentation, 1(1), 38-40.
Peper, E., Shaffer, F., & Lin, I-M. (2010). Garbage In; Garbage out: Identify blood volume pulse (BVP) artifacts before analyzing and interpreting BVP, blood volume pulse amplitude, and heart rate. Biofeedback, 38(1), 19-23. https://doi.org/10.1007/s10484-011-9168-8
Piano, M. R. (2017). Alcohol's effects on the cardiovascular system. Alcohol Research: Current Reviews, 38(2), 219-241. https://www.ncbi.nlm.nih.gov/pmc/articles/PMC5513687/
Pilz, N., Heinz, V., Ax, T., Fesseler, L., Patzak, A., & Bothe, T. (2024). Pulse wave velocity: Methodology, clinical applications, and interplay with heart rate variability. Reviews in Cardiovascular Medicine, 25(7), 230. https://doi.org/10.31083/j.rcm2507230
Pruneti, C., Ferrari, S., & Guidotti, S. (2023). A narrative review of heart rate variability as a good index of psychophysical health in athletes and in biofeedback training. Journal of Clinical Sport Psychology, 17(2), 134-154. https://doi.org/10.1123/jcsp.2022-0054
Puddey, I. B., Rakic, V., Dimmitt, S. B., & Beilin, L. J. (1999). Influence of pattern of drinking on cardiovascular disease and cardiovascular risk factors--A review. Addiction, 94(5), 649–663. https://doi.org/10.1046/j.1360-0443.1999.9456493.x
Quigley, K. S., Gianaros, P. J., Norman, G. J., Jennings, J. R., Berntson, G. G., & de Geus, E. J. C. (2024). Publication guidelines for human heart rate and heart rate variability studies in psychophysiology - Part 1: Physiological underpinnings and foundations of measurement. Psychophysiology, 61(6), e14469. https://doi.org/10.1111/psyp.14469
Rauh, V. A., Garfinkel, R., Perera, F. P., Andrews, H. F., Hoepner, L., Barr, D. B., ... & Whyatt, R. M. (2006). Impact of prenatal chlorpyrifos exposure on neurodevelopment in the first 3 years of life among inner-city children. Pediatrics, 118(6), e1845-e1859. https://doi.org/10.1542/peds.2006-0338Reiter, R. J., Tan, D. X., & Galano, A. (2017). Melatonin reduces lipid peroxidation and membrane viscosity. Frontiers in Physiology, 5, 377. https://doi.org/10.3389/fphys.2014.00377
Roehrborn, C. G. (2006). Alfuzosin 10 mg once daily prevents overall clinical progression of benign prostatic hyperplasia but not acute urinary retention: Results of a 2-year placebo-controlled study. BJU International, 97(4), 734-741. https://doi.org/10.1111/j.1464-410X.2006.06036.x
Salo, R., Nordahl, T. E., Buonocore, M. H., Natsuaki, Y., Waters, C., Moore, C. D., ... & Leamon, M. H. (2011). Cognitive control and white matter callosal microstructure in methamphetamine-dependent subjects: A diffusion tensor imaging study. Biological Psychiatry, 69(1), 59-66. https://doi.org/10.1016/j.biopsych.2010.08.023
Salpeter, S. R., Ormiston, T. M., & Salpeter, E. E. (2004). Meta-analysis: Respiratory tolerance to regular beta2-agonist use in patients with asthma. Annals of Internal Medicine, 140(10), 802-813. https://doi.org/10.7326/0003-4819-140-10-200405180-00012
Shaffer, F., & Combatalade, D. C. (2013). Don't add or miss a beat: A guide to cleaner heart rate variability recordings. Biofeedback, 41(3), 121-130. https://doi.org/10.5298/1081-5937-41.3.04
Shaffer, F., Jacobsmeyer, S., Giddings, L., Sasfai, S., Luebbering, B., and Schlereth, M. (2003). Validation of an infrared temperature scanning procedure for the hands. Proceedings of the 34th annual Association for Applied Psychophysiology and Biofeedback convention, Jacksonville,Florida.
Shaffer, F., & Moss, D. (2006). Biofeedback. In Y. Chun-Su, E. J. Bieber, & B. Bauer (Eds.). Textbook of complementary and alternative medicine (2nd ed.). Informa Healthcare.
Shaffer, F., & Ginsberg, J. P. (2017). An overview of heart rate variability metrics and norms. Frontiers in Public Health, 5, 258. https://doi.org/10.3389/fpubh.2017.00258
Shaffer, F., & Meehan, Z. M. (2020). A practical guide to resonance frequency assessment for heart rate variability biofeedback. Frontiers in Neuroscience, 14, 570400. https://doi.org/10.3389/fnins.2020.570400
Singh, N., Moneghetti, K. J., Christle, J. W., Hadley, D., Plews, D., & Froelicher, V. (2018). Heart rate variability: An old metric with new meaning in the era of using mHealth technologies for health and exercise training guidance. Part one: Physiology and methods. Arrhythmia & Electrophysiology Review, 7(3), 193-198. https://doi.org/10.15420/aer.2018.27.2
Stern, R. M., Ray, W. J., & Quigley, K. S. (2001). Psychophysiological recording (2nd ed.). Oxford University Press.
Sundas, A., Contreras, I., Navarro-Otano, J., Soler, J., Beneyto, A., & Vehi, J. (2025). Heart rate variability over the decades: A scoping review. PeerJ, 13, e17468. https://doi.org/10.7717/peerj.17468
Tarvainen, M. P., & Niskanen, J.-P. (2017). Kubios HRV version 3.0 user's guide. The University of Finland.
Task Force of the European Society of Cardiology and the North American Society of Pacing and Electrophysiology (1996). Heart rate variability: Standards of measurement, physiological interpretation, and clinical use. Circulation, 93, 1043-1065. https://doi.org/10.1161/01.CIR.93.5.1043
Tortora, G. J., & Derrickson, B. H. (2021). Principles of anatomy and physiology (16th ed.). John Wiley & Sons, Inc.
Umetani, K., Singer, D. H., McCraty, R., & Atkinson, M. (1998). Twenty-four hour time domain heart rate variability and heart rate: Relations to age and gender over nine decades. Journal of the American College of Cardiology, 31(2), 593-601. https://doi.org/10.1016/s0735-1097(97)00554-8
Vongpatanasin, W., Taylor, J. A., Victor, R. G., & Toto, R. D. (1999). Effects of cocaine on heart rate variability in healthy subjects. The American Journal of Cardiology, 83(8), 1262-1264. https://doi.org/10.1016/S0002-9149(99)00057-2
Vybiral, T., Bryg, R. J., Maddens, M. E., Bhasin, S. S., Cronin, S., Boden, W. E., & Lehmann, M. H. (1990). Effects of transdermal scopolamine on heart rate variability in normal subjects. The American Journal of Cardiology, 65(9), 604–608. https://doi.org/10.1016/0002-9149(90)91038-8
Wang, C., Zhang, M., Sun, S., Li, Z., Han, Y., & Zhang, J. (2017). Long-term effects of clozapine on sleep in patients with schizophrenia: A 4-week polysomnography study. Psychiatry Research, 256, 281-286. https://doi.org/10.1016/j.psychres.2017.06.068
Yoda, T., Crawshaw, L. I., Nakamura, M., Saito, K., Konishi, A., Nagashima, K., Uchida, S., & Kanosue, K. (2005). Effects of alcohol on thermoregulation during mild heat exposure in humans. Alcohol, 36(3), 195–200. https://doi.org/10.1016/j.alcohol.2005.09.002
Yu, S., Kim, S. E., Kim, N. H., Suh, K. S., & Lee, E. (2021). Pulse rate variability analysis using remote photoplethysmography signals. Sensors, 21(17), 5709. https://doi.org/10.3390/s21175709
Yuda, E., Shibata, M., Ogata, Y., Ueda, N., Yambe, T., Yoshizawa, M., & Hayano, J. (2020). Pulse rate variability: A new biomarker, not a surrogate for heart rate variability. Journal of Physiological Anthropology, 39, 20. https://doi.org/10.1186/s40101-020-00227-3
Zerr, C., Kane, A., Vodopest, T., Allen, J., Fabbri, M., Williams, C., Cangelosi, A., Hannan, J., Owen, D., Cary, B., Fluty, L., & Shaffer, F. (2015). Are blanketing and stem artifacts real? [Abstract]. Applied Psychophysiology and Biofeedback, 40(2), 134-135. https://doi.org/10.1007/s10484-015-9282-0