
Respiration Hardware
What You Will Learn
This chapter guides you through the essential tools for monitoring and training healthy breathing patterns. You will discover how a respirometer transforms the simple act of breathing into measurable data, enabling you to identify dysfunctional patterns like thoracic dominance or reverse breathing. You will learn why surface EMG monitoring of accessory muscles reveals the hidden effort behind labored breathing, and how capnometry can catch overbreathing before symptoms emerge. The chapter also explores pulse oximetry and its important limitations, particularly the racial bias in measurements that every clinician should understand. By the end, you will be equipped to select the right combination of instruments for comprehensive breathing assessment and training.
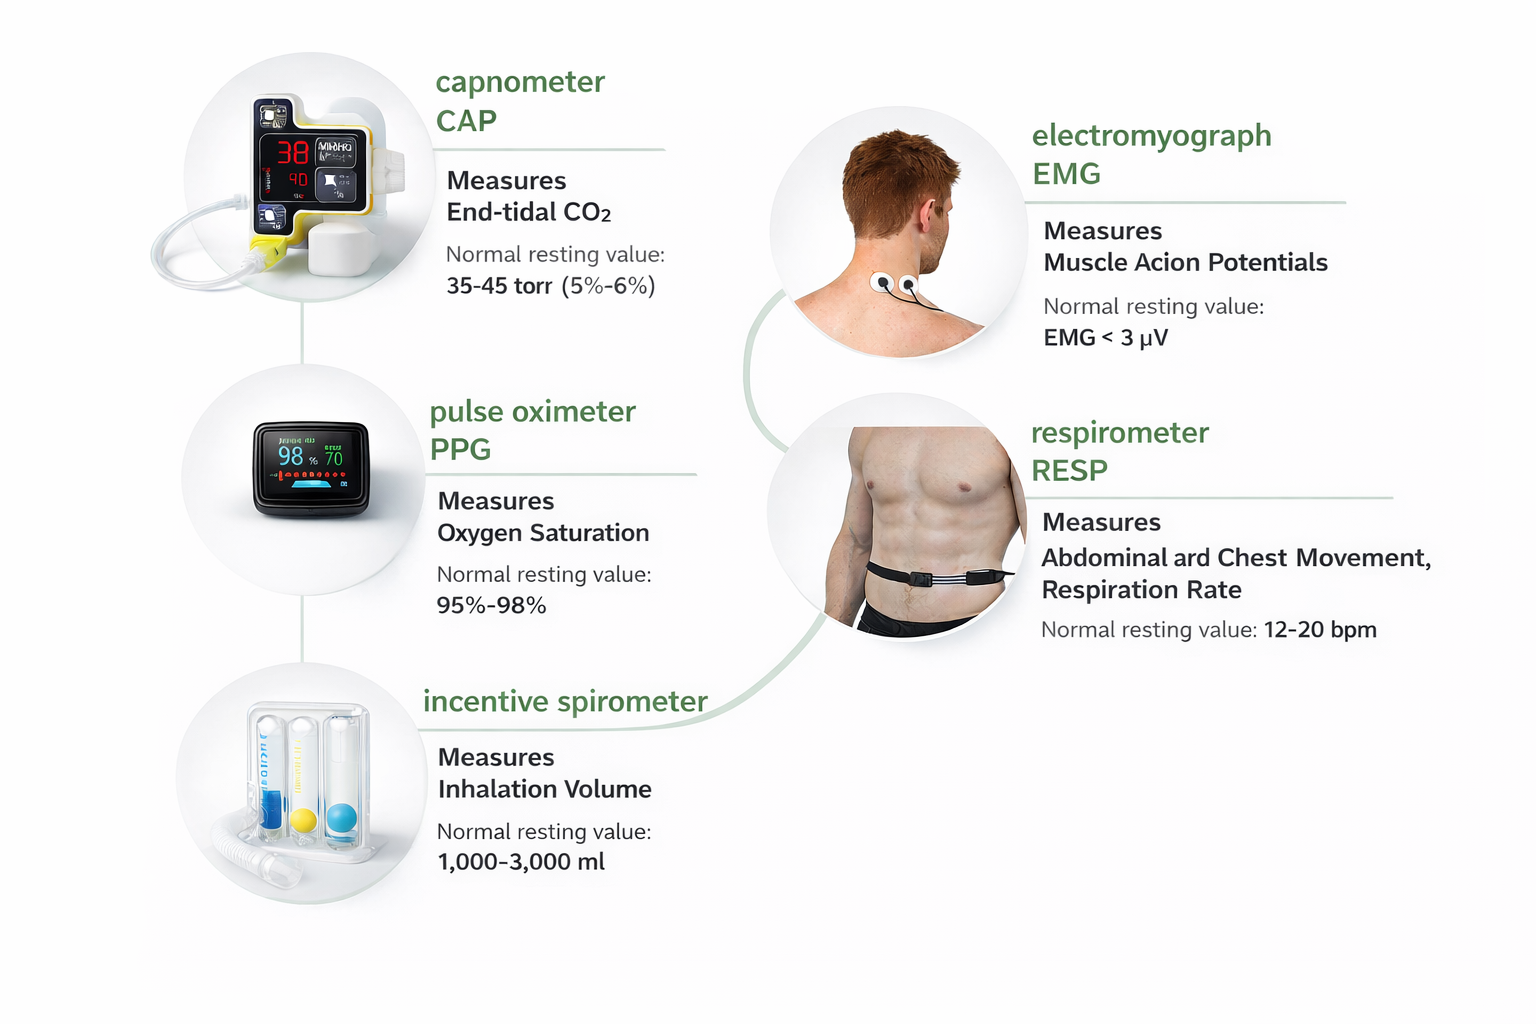
Slow-paced breathing is a frequent component of biofeedback-assisted relaxation training (BART) and interventions designed to increase heart rate variability. Clinicians primarily use a respirometer and electromyograph in breathing assessment and training. A respirometer is a flexible respiratory sensor placed around the abdomen or chest that measures respiration rate and pattern. An electromyograph measures the electrical activity that causes accessory muscles to contract during dysfunctional breathing.
The capnometer, oximeter, and incentive inspirometer provide complementary information. A capnometer measures end-tidal CO2. An oximeter monitors oxygen saturation from a digit or earlobe. Finally, an incentive inspirometer calculates the volume of air inhaled in a single breath.
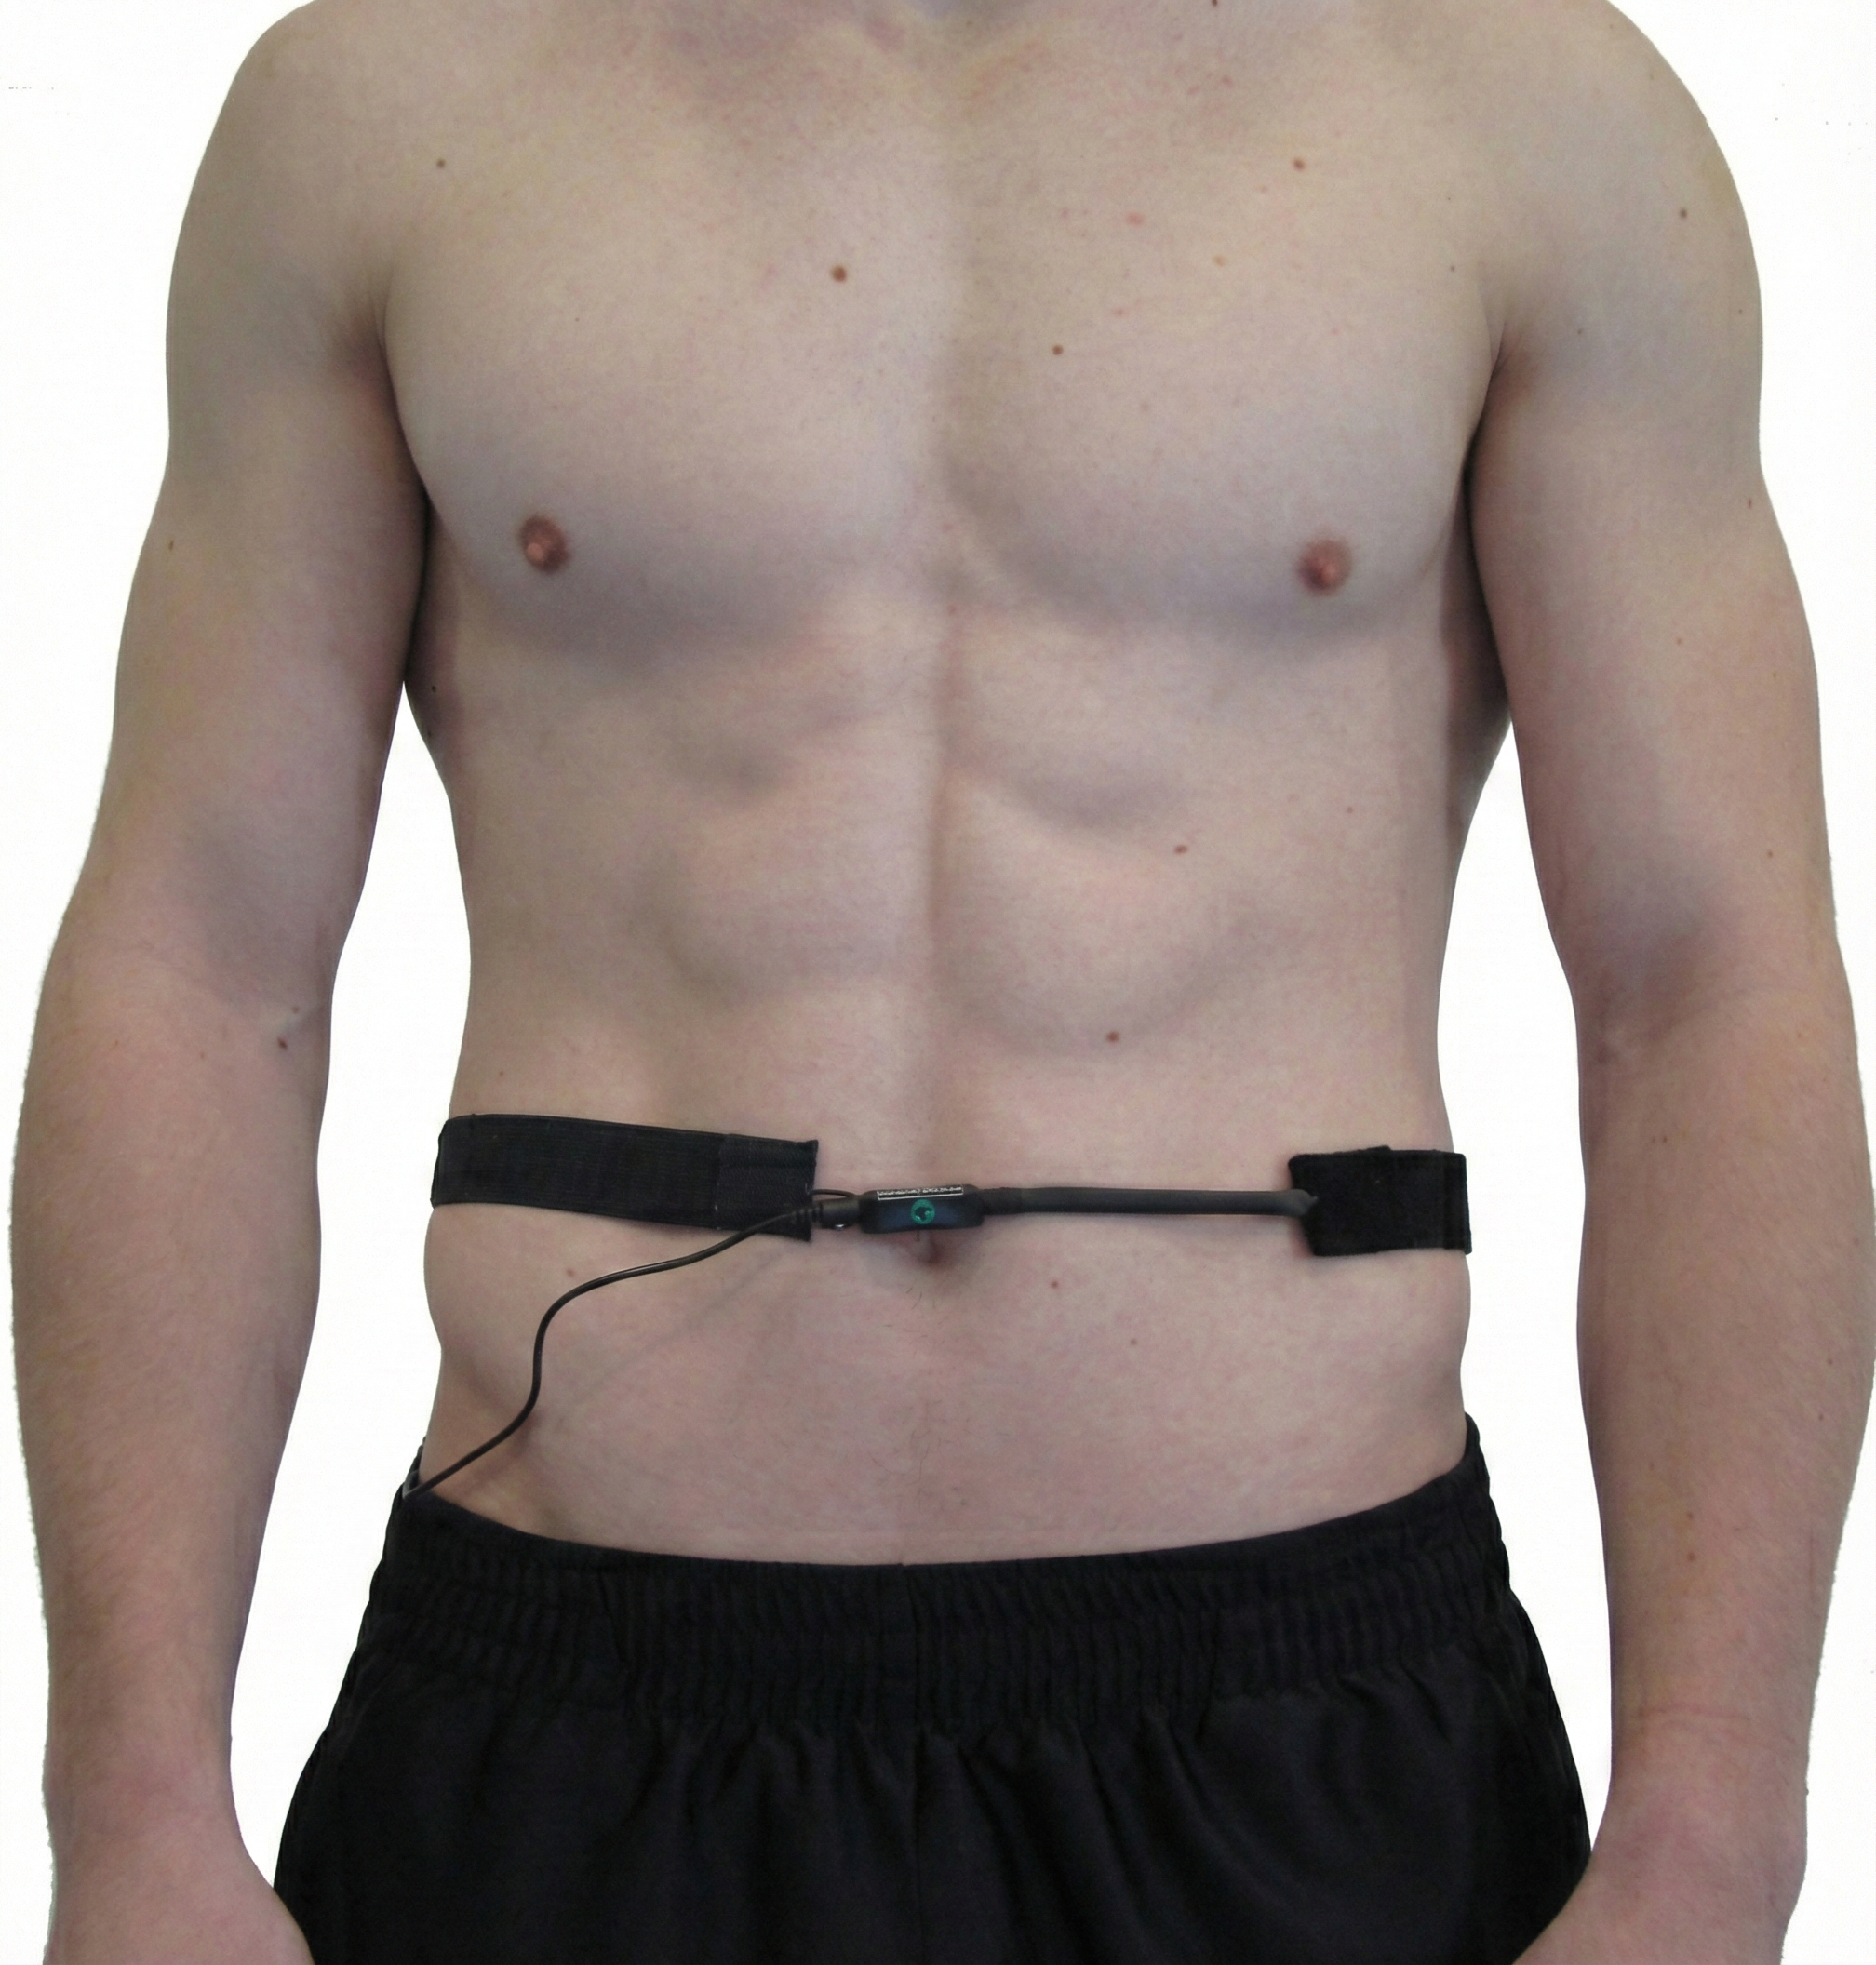
Comprehensive breathing monitoring might include scalene SEMG, exhalation temperature from the nostril, a chest respirometer, heart rate, and end-tidal CO2 (Gilbert, 2019).
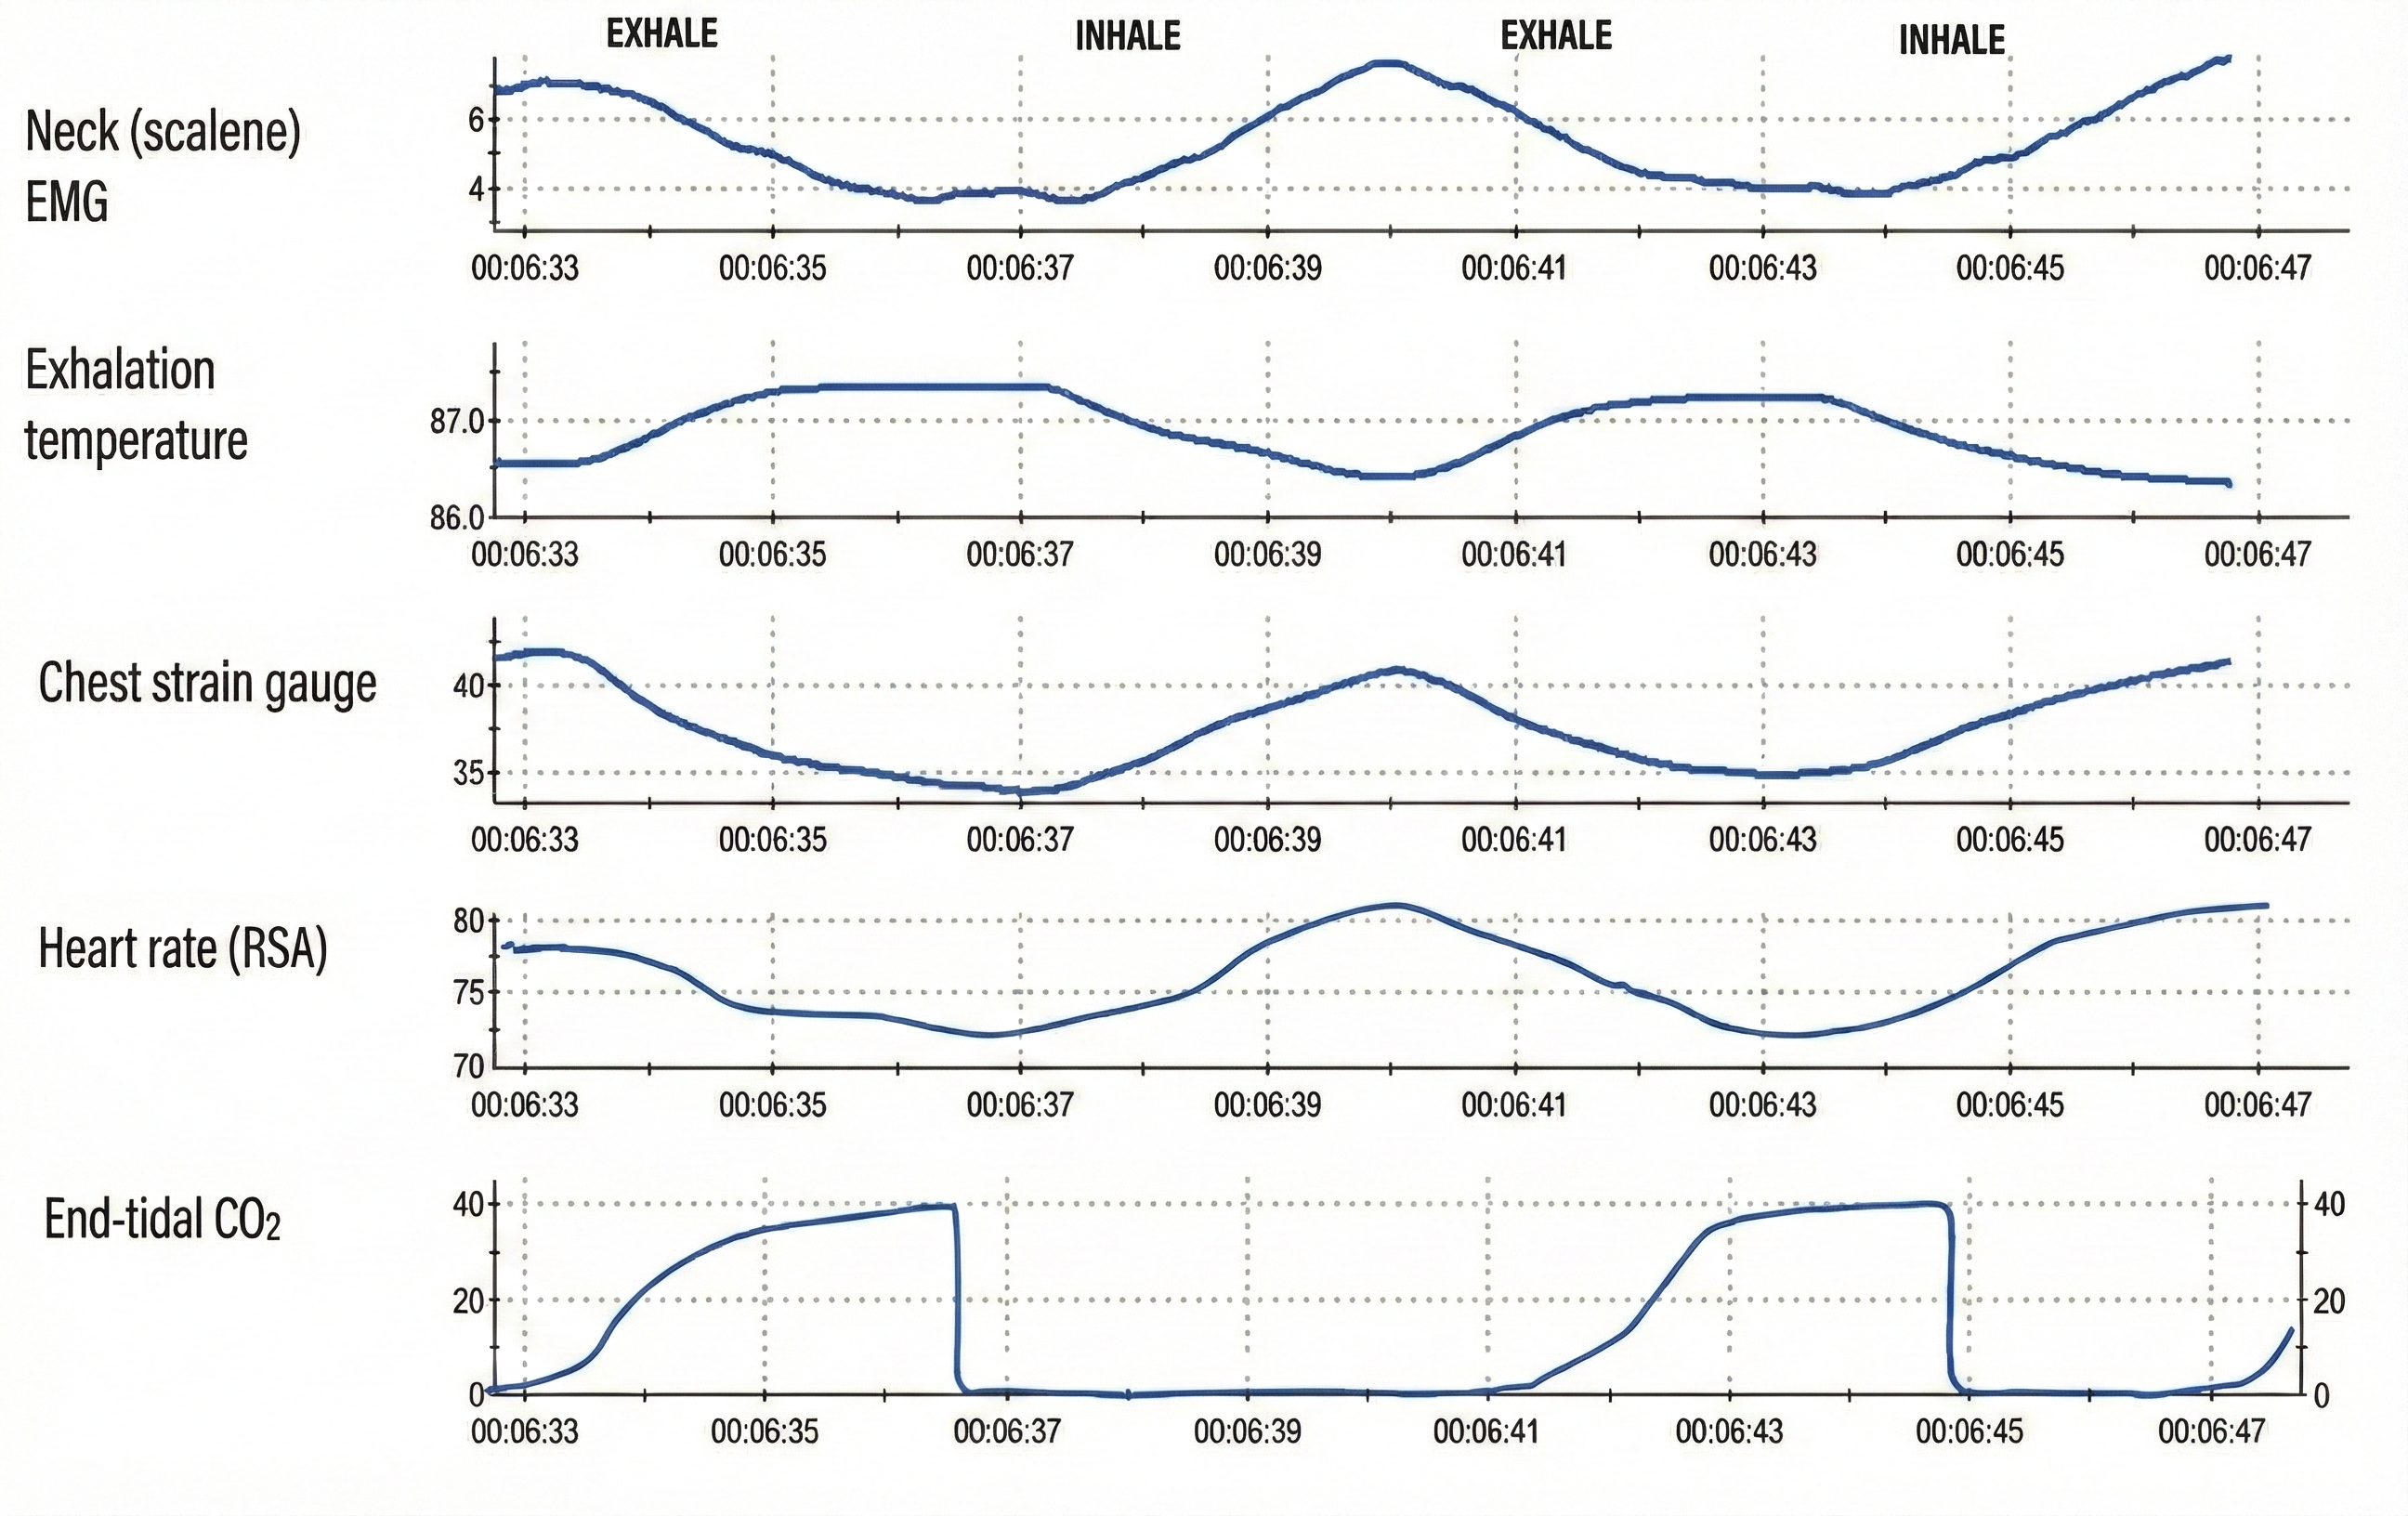
Note that a thermistor can detect the 2°-5° F temperature shift from inhalation to exhalation when positioned in a nostril's airstream in a 70°-75° F room (Gilbert, 2019).
BCIA Blueprint Coverage
This unit addresses Descriptions of the most commonly employed biofeedback modalities: Respiration, ECG and heart rate (III-A), and Structure and function of the autonomic nervous system (V-A).
This unit covers the Respirometer, Surface Electromyograph, Capnometer, Oximeter, Incentive Inspirometer, Normal Values, and Drug Effects.
🎧 Listen to the Full Chapter Lecture
The Respirometer: Your Window into Breathing Patterns
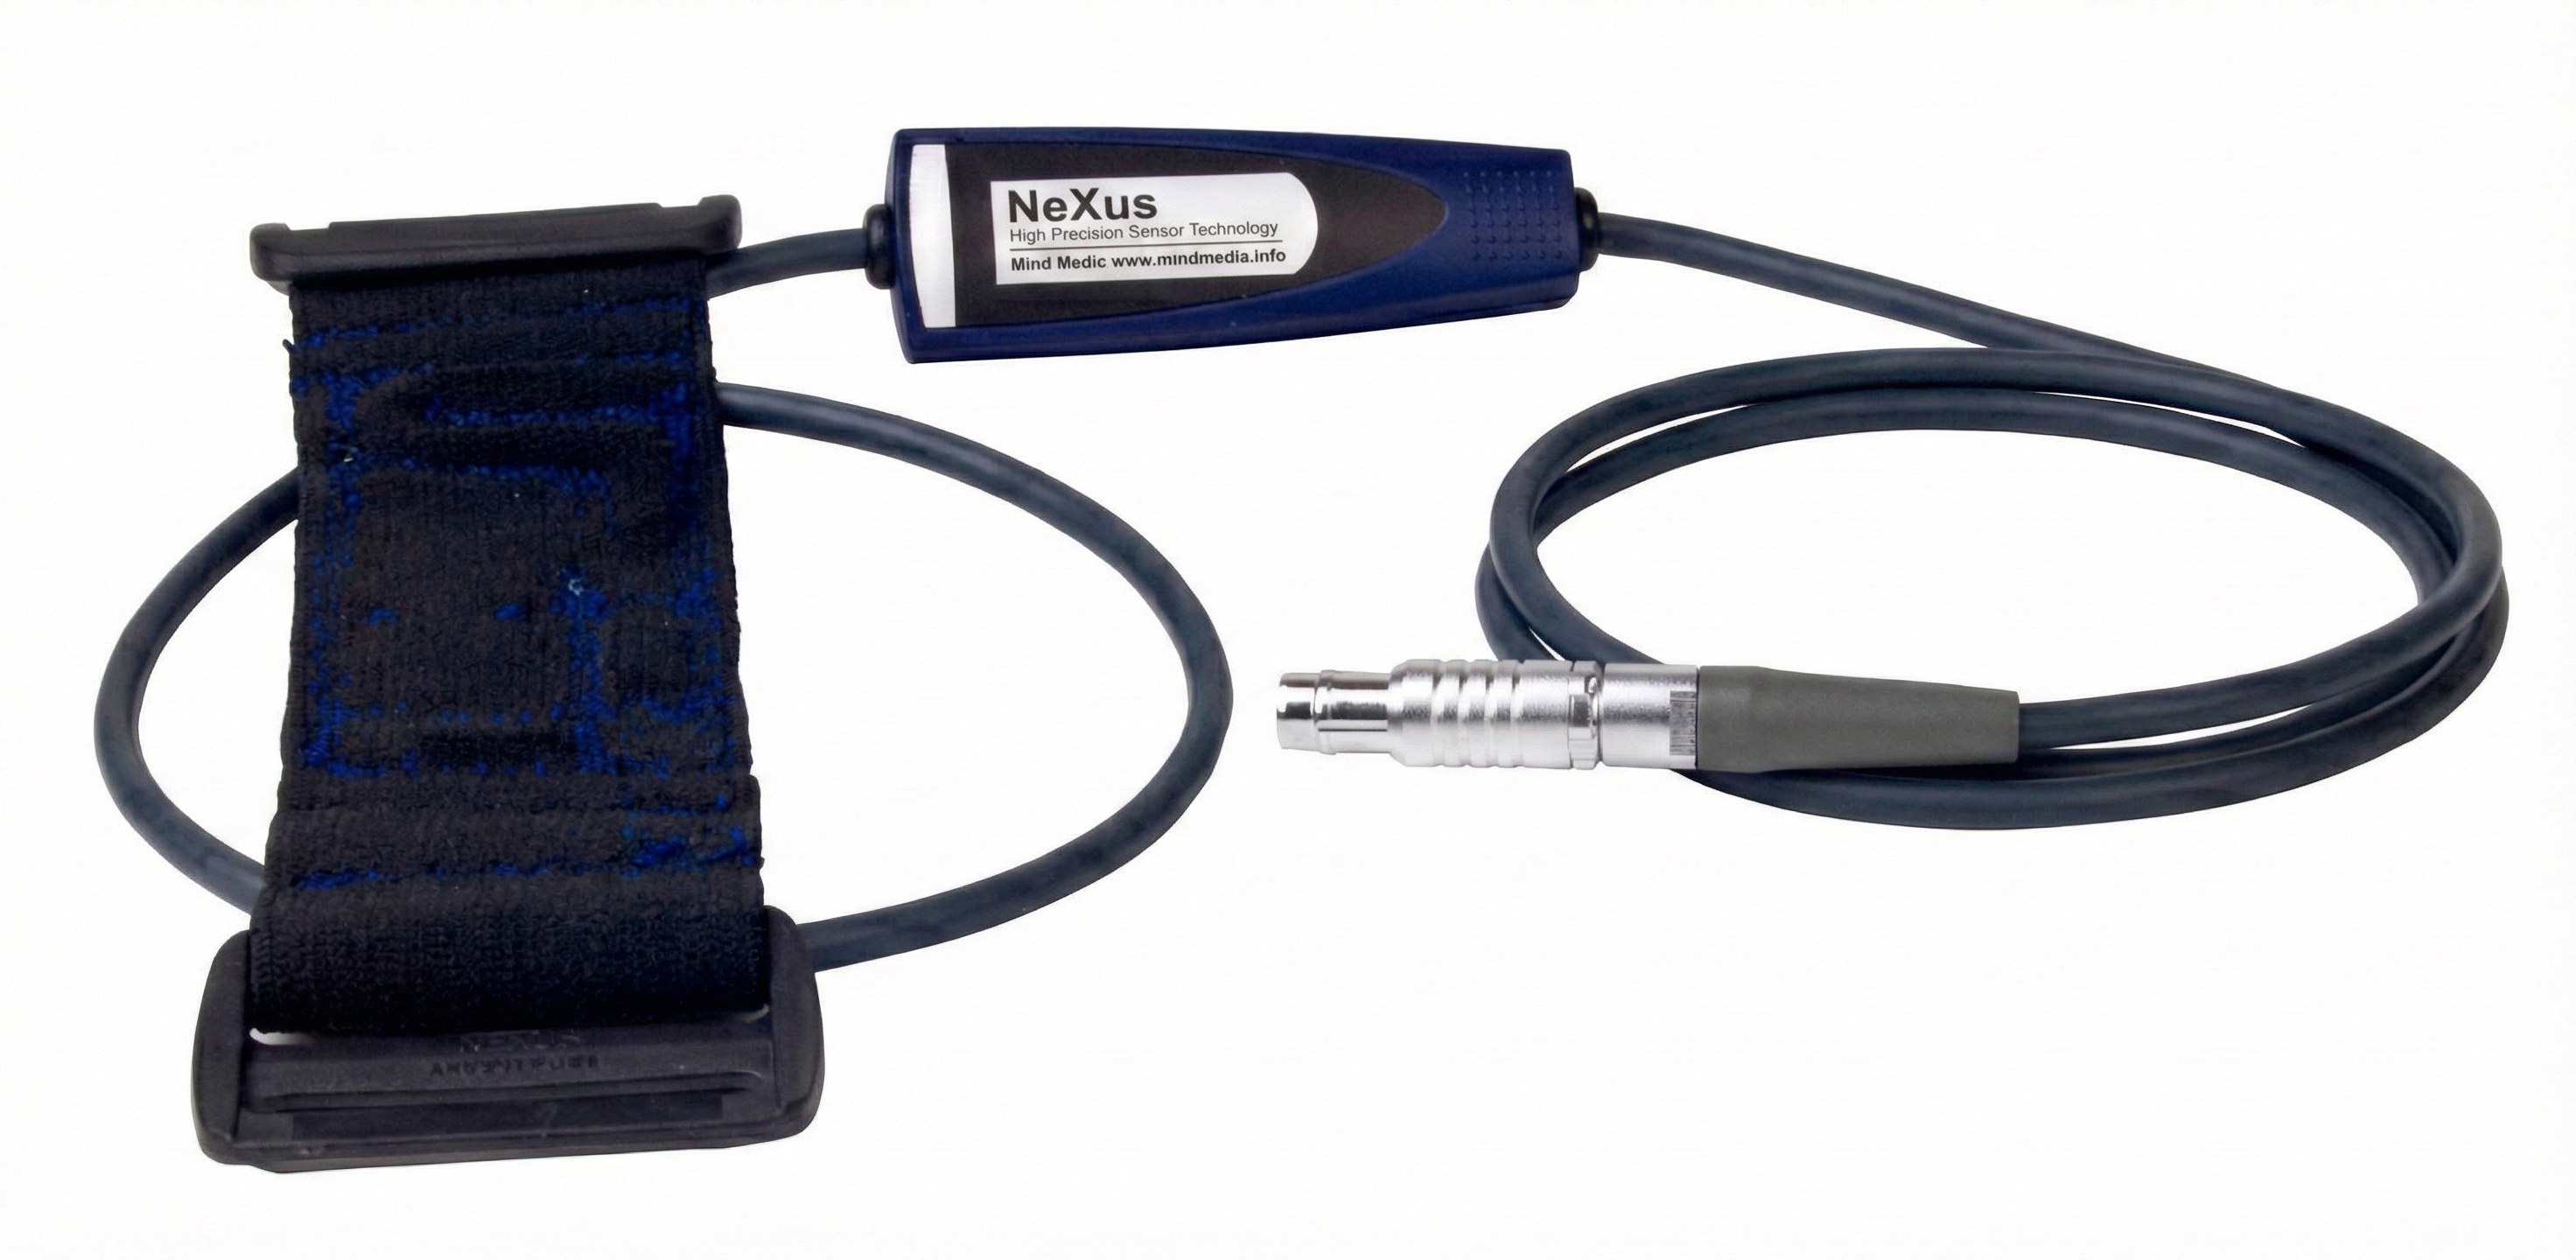
A respirometer is a flexible sensor band, placed around the chest, abdomen, or both, that monitors respiration rate, depth, inhalation-to-exhalation ratio, inhalation and exhalation slopes, pauses, smoothness, and effort (Gilbert, 2019). Think of it as a sophisticated measuring tape that translates the mechanical expansion and contraction of your client's torso into electrical signals your biofeedback software can display and analyze.
Using Respirometers to Measure Abdominal or Thoracic Dominance
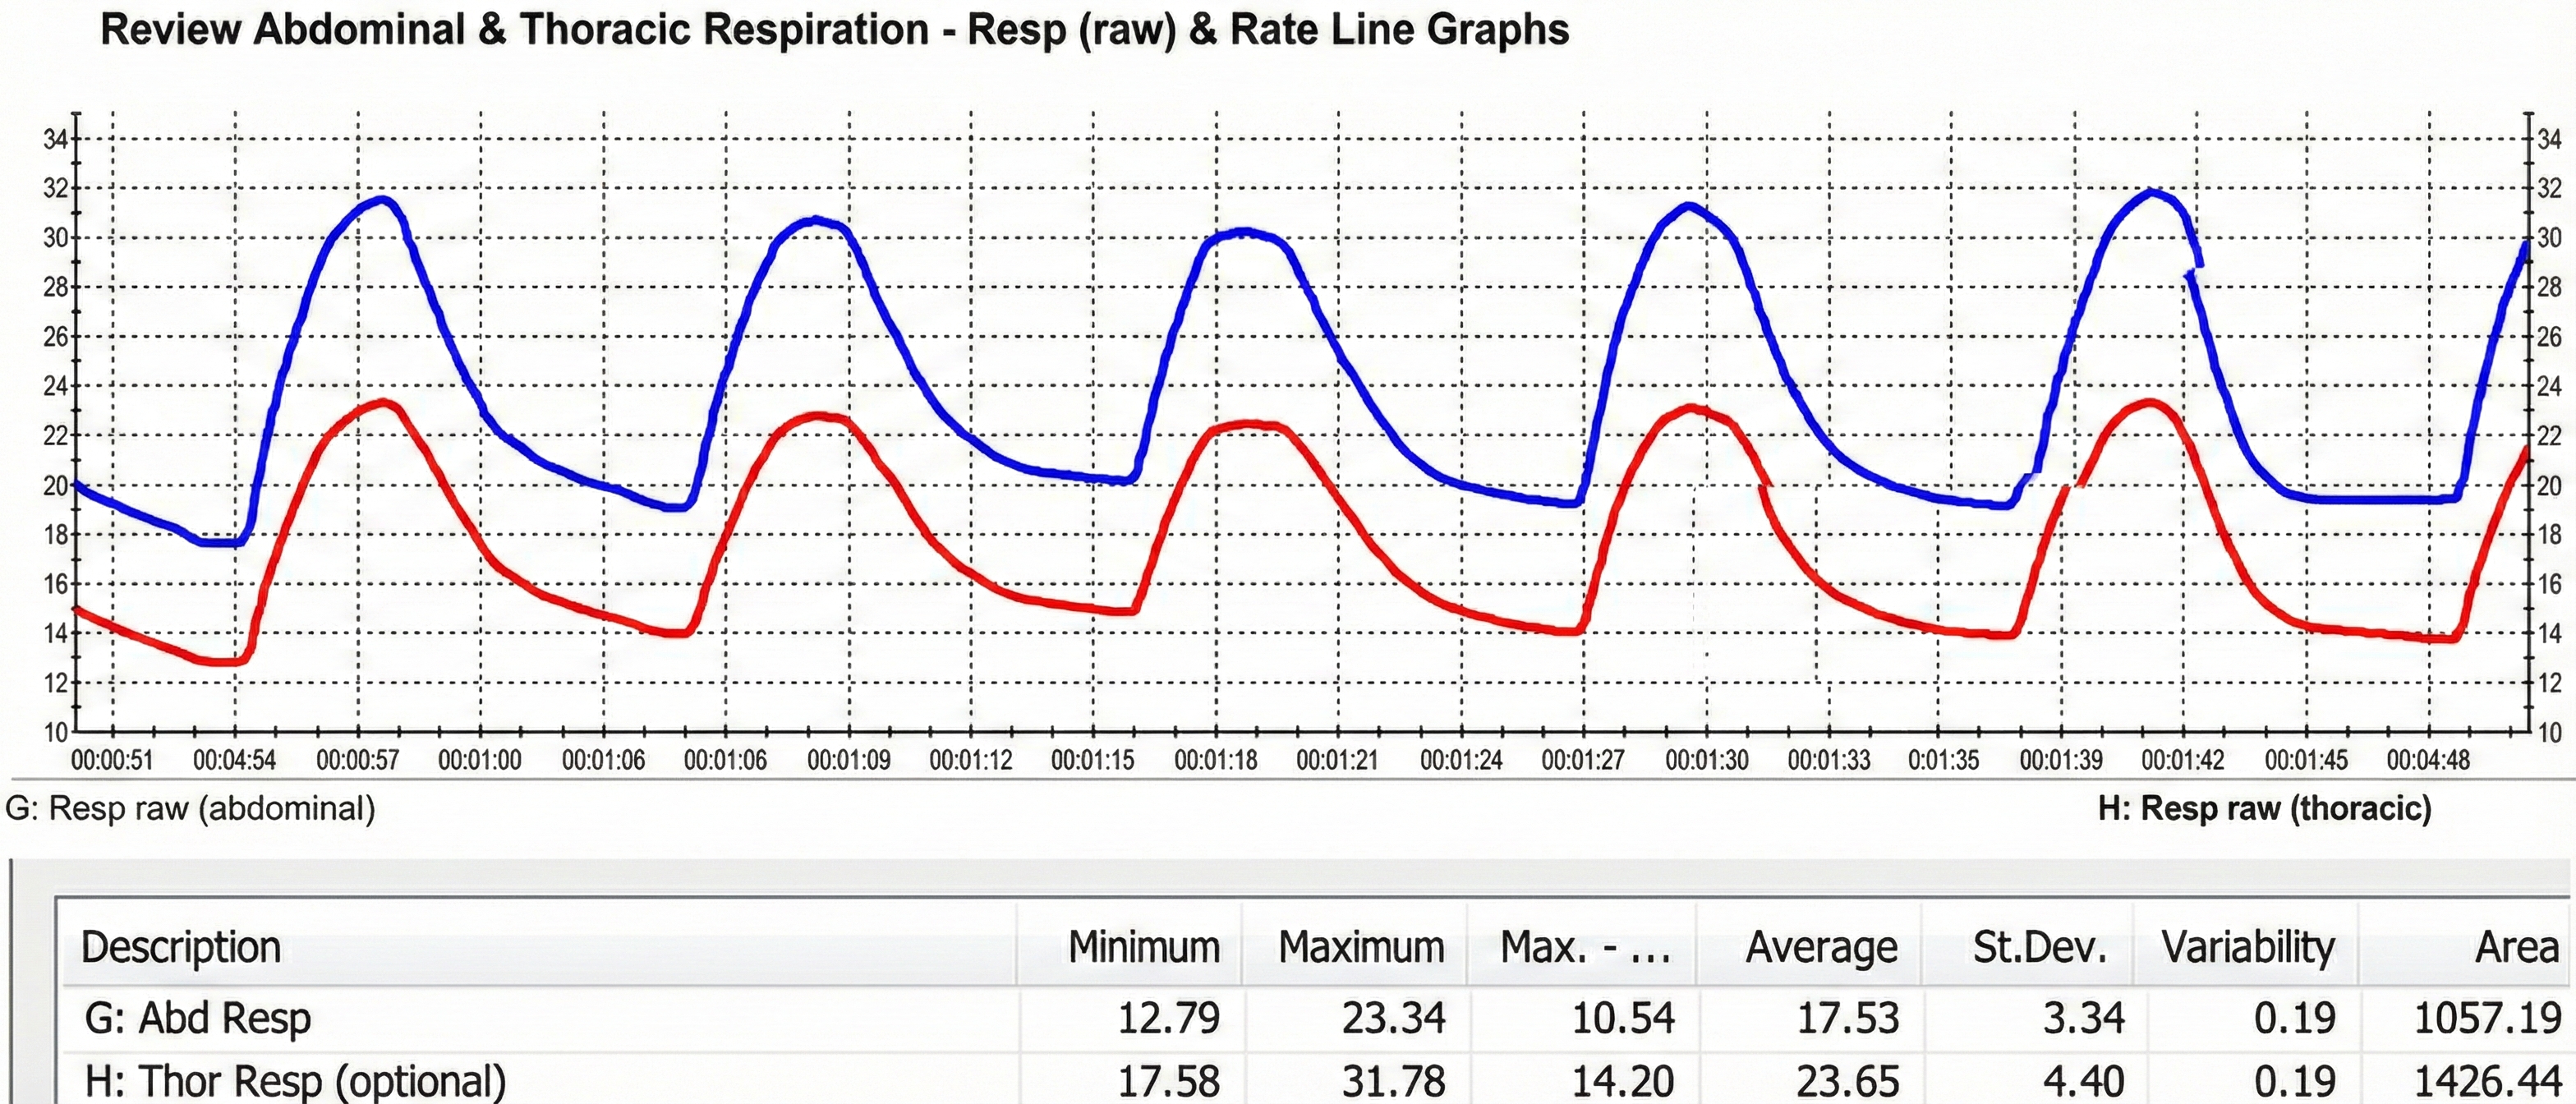
When respirometers placed around the chest and abdomen share equal sensitivity to stretch, we can calculate the ratio of their standard deviations to determine whether a client is breathing abdominally or thoracically (Peper et al., 2016). Clinicians may prefer two respirometers when training clients to shift from thoracic to abdominal breathing (Gilbert, 2019).
Consider Maria, a 35-year-old marketing executive who came to your practice complaining of chronic neck tension and frequent headaches. When you place respirometers around both her chest and abdomen, you notice the thoracic channel shows much larger excursions than the abdominal channel, with a ratio of 0.68. This pattern, combined with visible shoulder elevation during each breath, confirms your suspicion: Maria is a chronic thoracic breather. Training her to shift toward abdominal dominance, with a goal ratio above 1.0, becomes a primary focus of her treatment plan.
Identifying Dysfunctional Breathing with a Respirometer
A respirometer can help identify and retrain dysfunctional breathing behaviors like apnea, clavicular breathing, gasping, reverse breathing, sighing, and thoracic breathing (Peper et al., 2016). Each of these patterns leaves a characteristic signature in the respiratory waveform. Apnea appears as flat-line periods, sighing shows up as sudden large excursions, and reverse breathing reveals itself when the abdominal and thoracic channels move in opposite directions.
Measuring HR Max - HR Min and Resonance Frequency
In heart rate variability (HRV) biofeedback, a respirometer enables us to measure HRV and determine a client's resonance frequency. Since a respirometer monitors the respiratory waveform, the software can calculate when each breathing cycle starts and stops. This allows us to measure the HRV time-domain metric HR Max - HR Min, the mean difference between the highest and lowest heart rates during each respiratory cycle.
A respirometer is also indispensable in determining a client's resonance frequency, which is the rate that best stimulates their cardiovascular system (Shaffer & Meehan, 2020). Most adults find their resonance frequency between 4.5 and 7 breaths per minute, but individual variation is substantial, which is precisely why measurement matters.
How Respirometers Work
Current is run through a respirometer, resistance changes as the band stretches, and the output voltage is proportional to length changes. The amplified voltage is displayed in relative units of stretch (RUS) from 0-100 (Peper et al., 2016; Shaffer & Combatalade, 2013).
We can only compare two waveforms when their respirometers share a similar range (e.g., 3 units of signal change per 5 mm of stretch) and are displayed using the same lower and upper values on the vertical axis. Peper et al. (2016) provide a detailed description of sensor calibration.
Clinicians should be cautious when comparing measurements across sessions using the same abdominal and thoracic sensors. Since peak values depend on the exact placement of the band, the constrictiveness and thickness of the clothing under the band, and band tension, reliability can be very low (Shaffer & Combatalade, 2013).
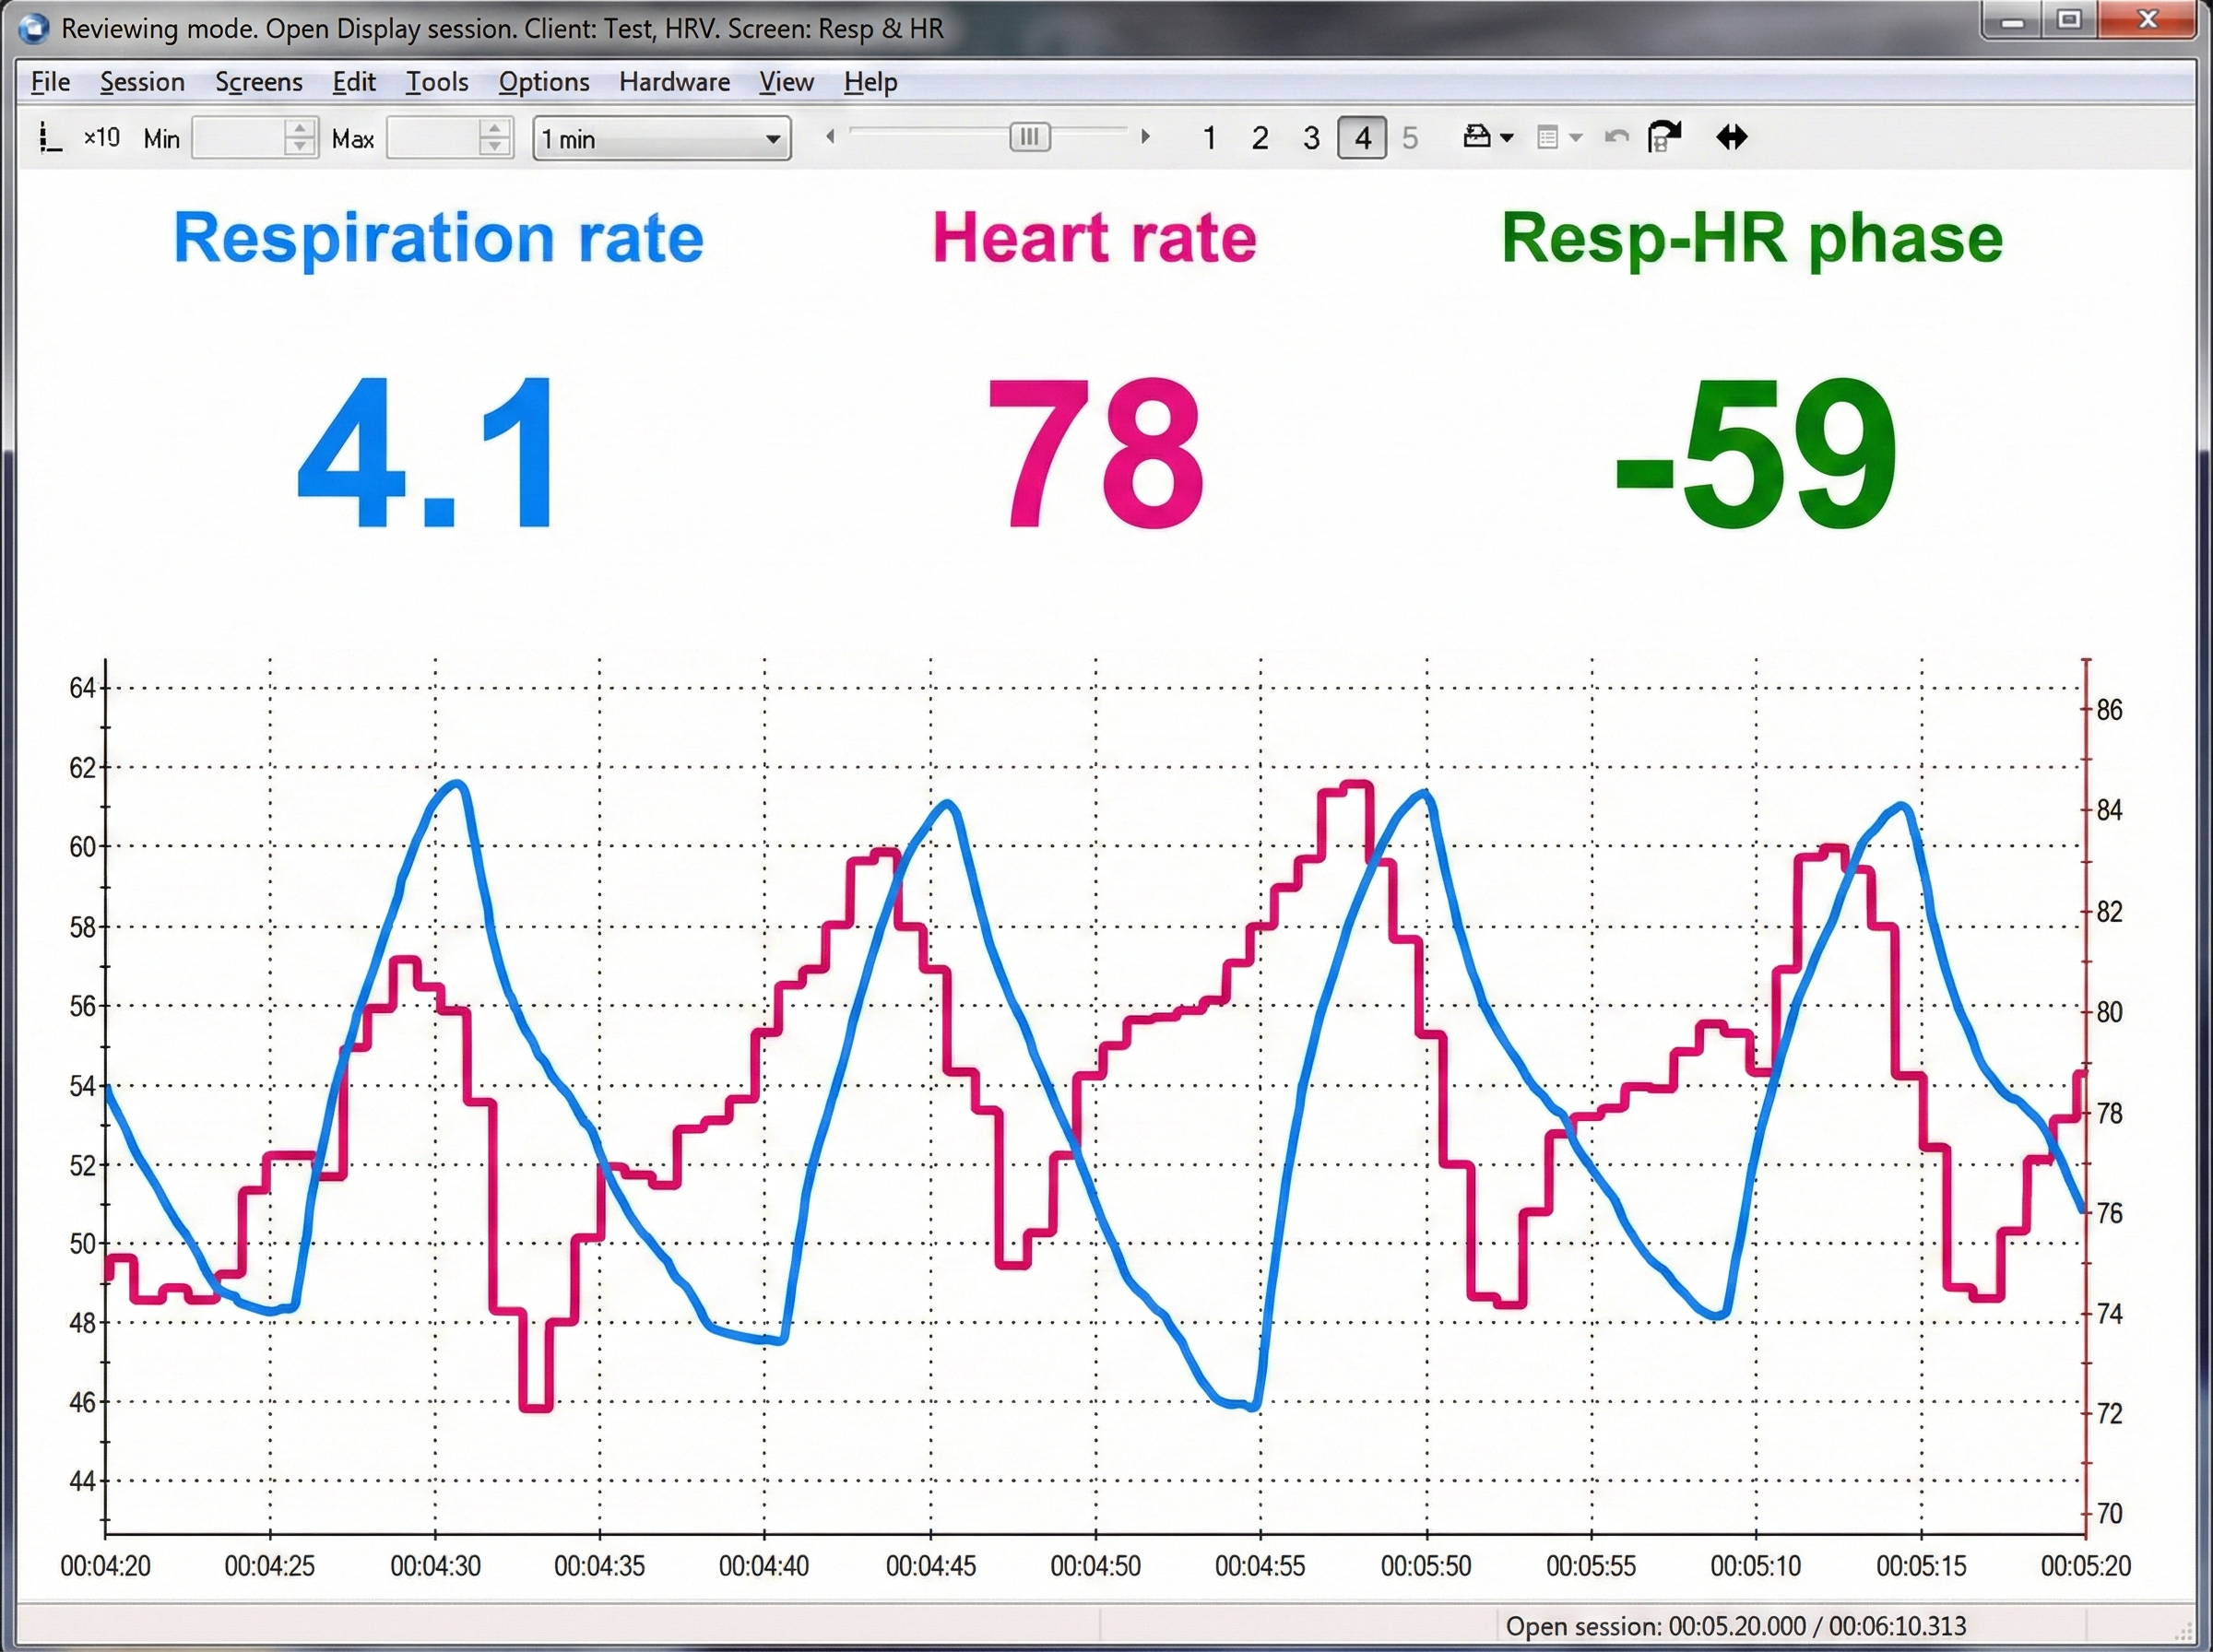
Below is a BioGraph ® Infiniti display of abdominal movement. Note the slow rhythmic breathing pattern.
Sensor Placement: Getting It Right
Since constrictive clothing can impede abdominal and chest expansion, clinicians should instruct clients to avoid wearing a "tight belt, slimming underwear, constrictive pants, or a very tight bra" (MacHose & Peper, 1991; Peper et al., 2016). This conversation can feel awkward, but it is essential for accurate measurement. Consider providing clients with a pre-session checklist that includes clothing recommendations.
Avoiding Respirometer Artifacts
Avoid thick clothing (e.g., sweaters) because it can compromise accuracy and promote upward or downward slippage. Tape or pin the respirometer to your client's clothing to prevent slippage artifacts (Gilbert, 2019).
Since belly contours vary greatly, place the abdominal respirometer above the navel within a horizontal zone that expands during inhalation (Gilbert, 2019).
To ensure adequate sensor responsiveness, ask your client to exhale completely and then slightly tighten the sensor band during the post-expiratory pause. Avoid tightness extremes. A respirometer that is too tight can curtail spontaneous breathing, while one that is too loose can overlook small abdominal or chest excursions (Gilbert, 2019).
When the respiratory sensor is poorly attached and loosens or comes off during the middle of an inhalation, this can result in signal clipping and sharply change the signal's offset on the screen (Shaffer & Combatalade, 2013).
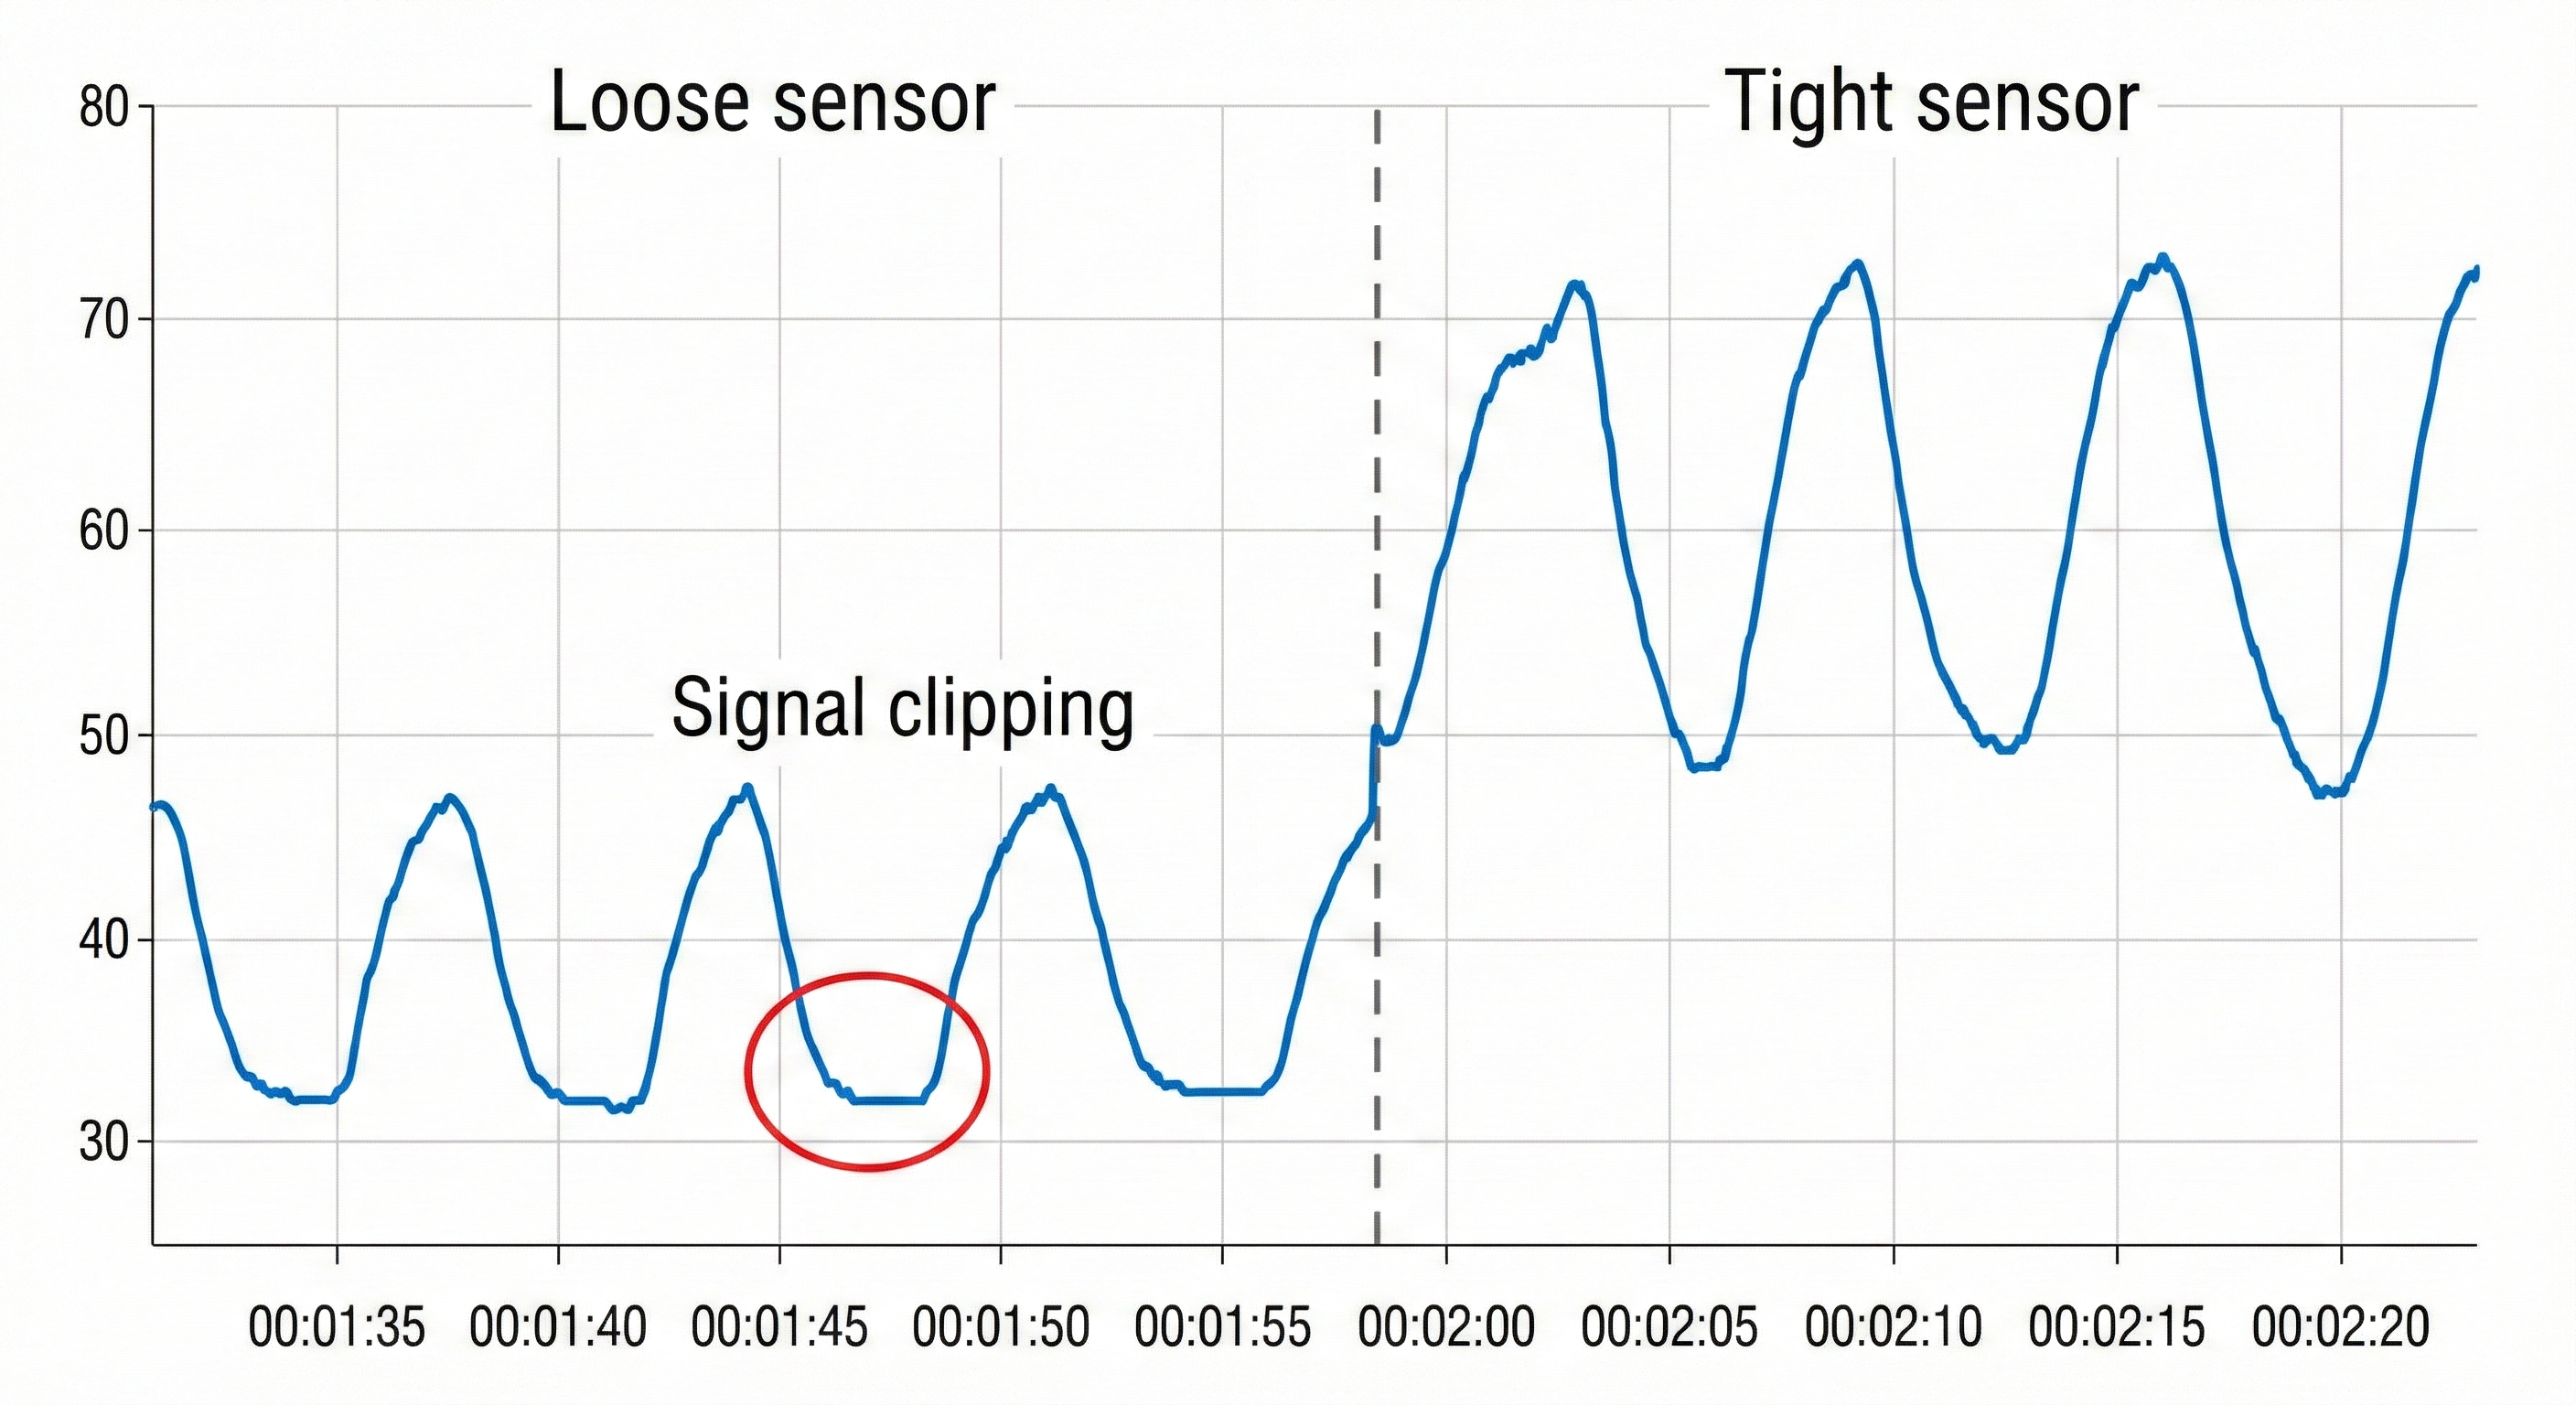
You want to see a sinusoidal signal pattern with sufficient amplitude to detect the peaks and valleys.
Understanding the Limitations of Respirometer Displays
Review the raw respirometer waveforms for responsiveness to abdominal and thoracic excursion, dysfunctional breathing behaviors, and smoothness. Here is a sobering realization: numeric displays of abdominal movement and respiration rate may look correct, while end-tidal CO2 and HRV are reduced by excessive effort (Shaffer et al., 1998). In other words, a client can appear to breathe at the "correct" rate while still breathing dysfunctionally. This is why multimodal assessment matters.
The Tracking Test: Verifying Your Setup
By performing a tracking test, you can determine whether a respirometer display mirrors your client's abdominal movement. Instruct your client to inhale and then exhale, and check whether the abdominal waveform mirrors stomach movement.
If you question the accuracy of respiration rate measurements, visually count the number of abdominal or chest excursions over one minute.
Below is a BioGraph ® Infiniti display of an abdominal respiratory band tracking test.
Normal Values for Respiration Rate
Typical resting adult respiration rates are between 12-20 bpm (Saatchi et al., 2025). Following a stressor, clinicians may measure elevations above baseline and the time required to recover to baseline values (Khazan, 2013, p. 46).
The respirometer is your primary tool for visualizing breathing patterns. When properly calibrated and positioned, it reveals rate, depth, rhythm, and effort. Two-channel recordings allow you to calculate abdominal-to-thoracic ratios and identify dysfunctional patterns. Always verify your setup with a tracking test and remember that numeric displays can mask problems that only the raw waveform reveals.
Check Your Understanding
- Why might a respirometer show "normal" respiration rate values while end-tidal CO2 remains low?
- What does an abdominal-to-thoracic ratio below 1.0 indicate about a client's breathing pattern?
- How would you explain the importance of clothing choices to a client before a respiratory biofeedback session?
- What are three types of artifacts that can compromise respirometer accuracy, and how can you prevent each?
- Why is the tracking test an essential first step before beginning respiratory training?
Surface EMG: Detecting Hidden Breathing Effort
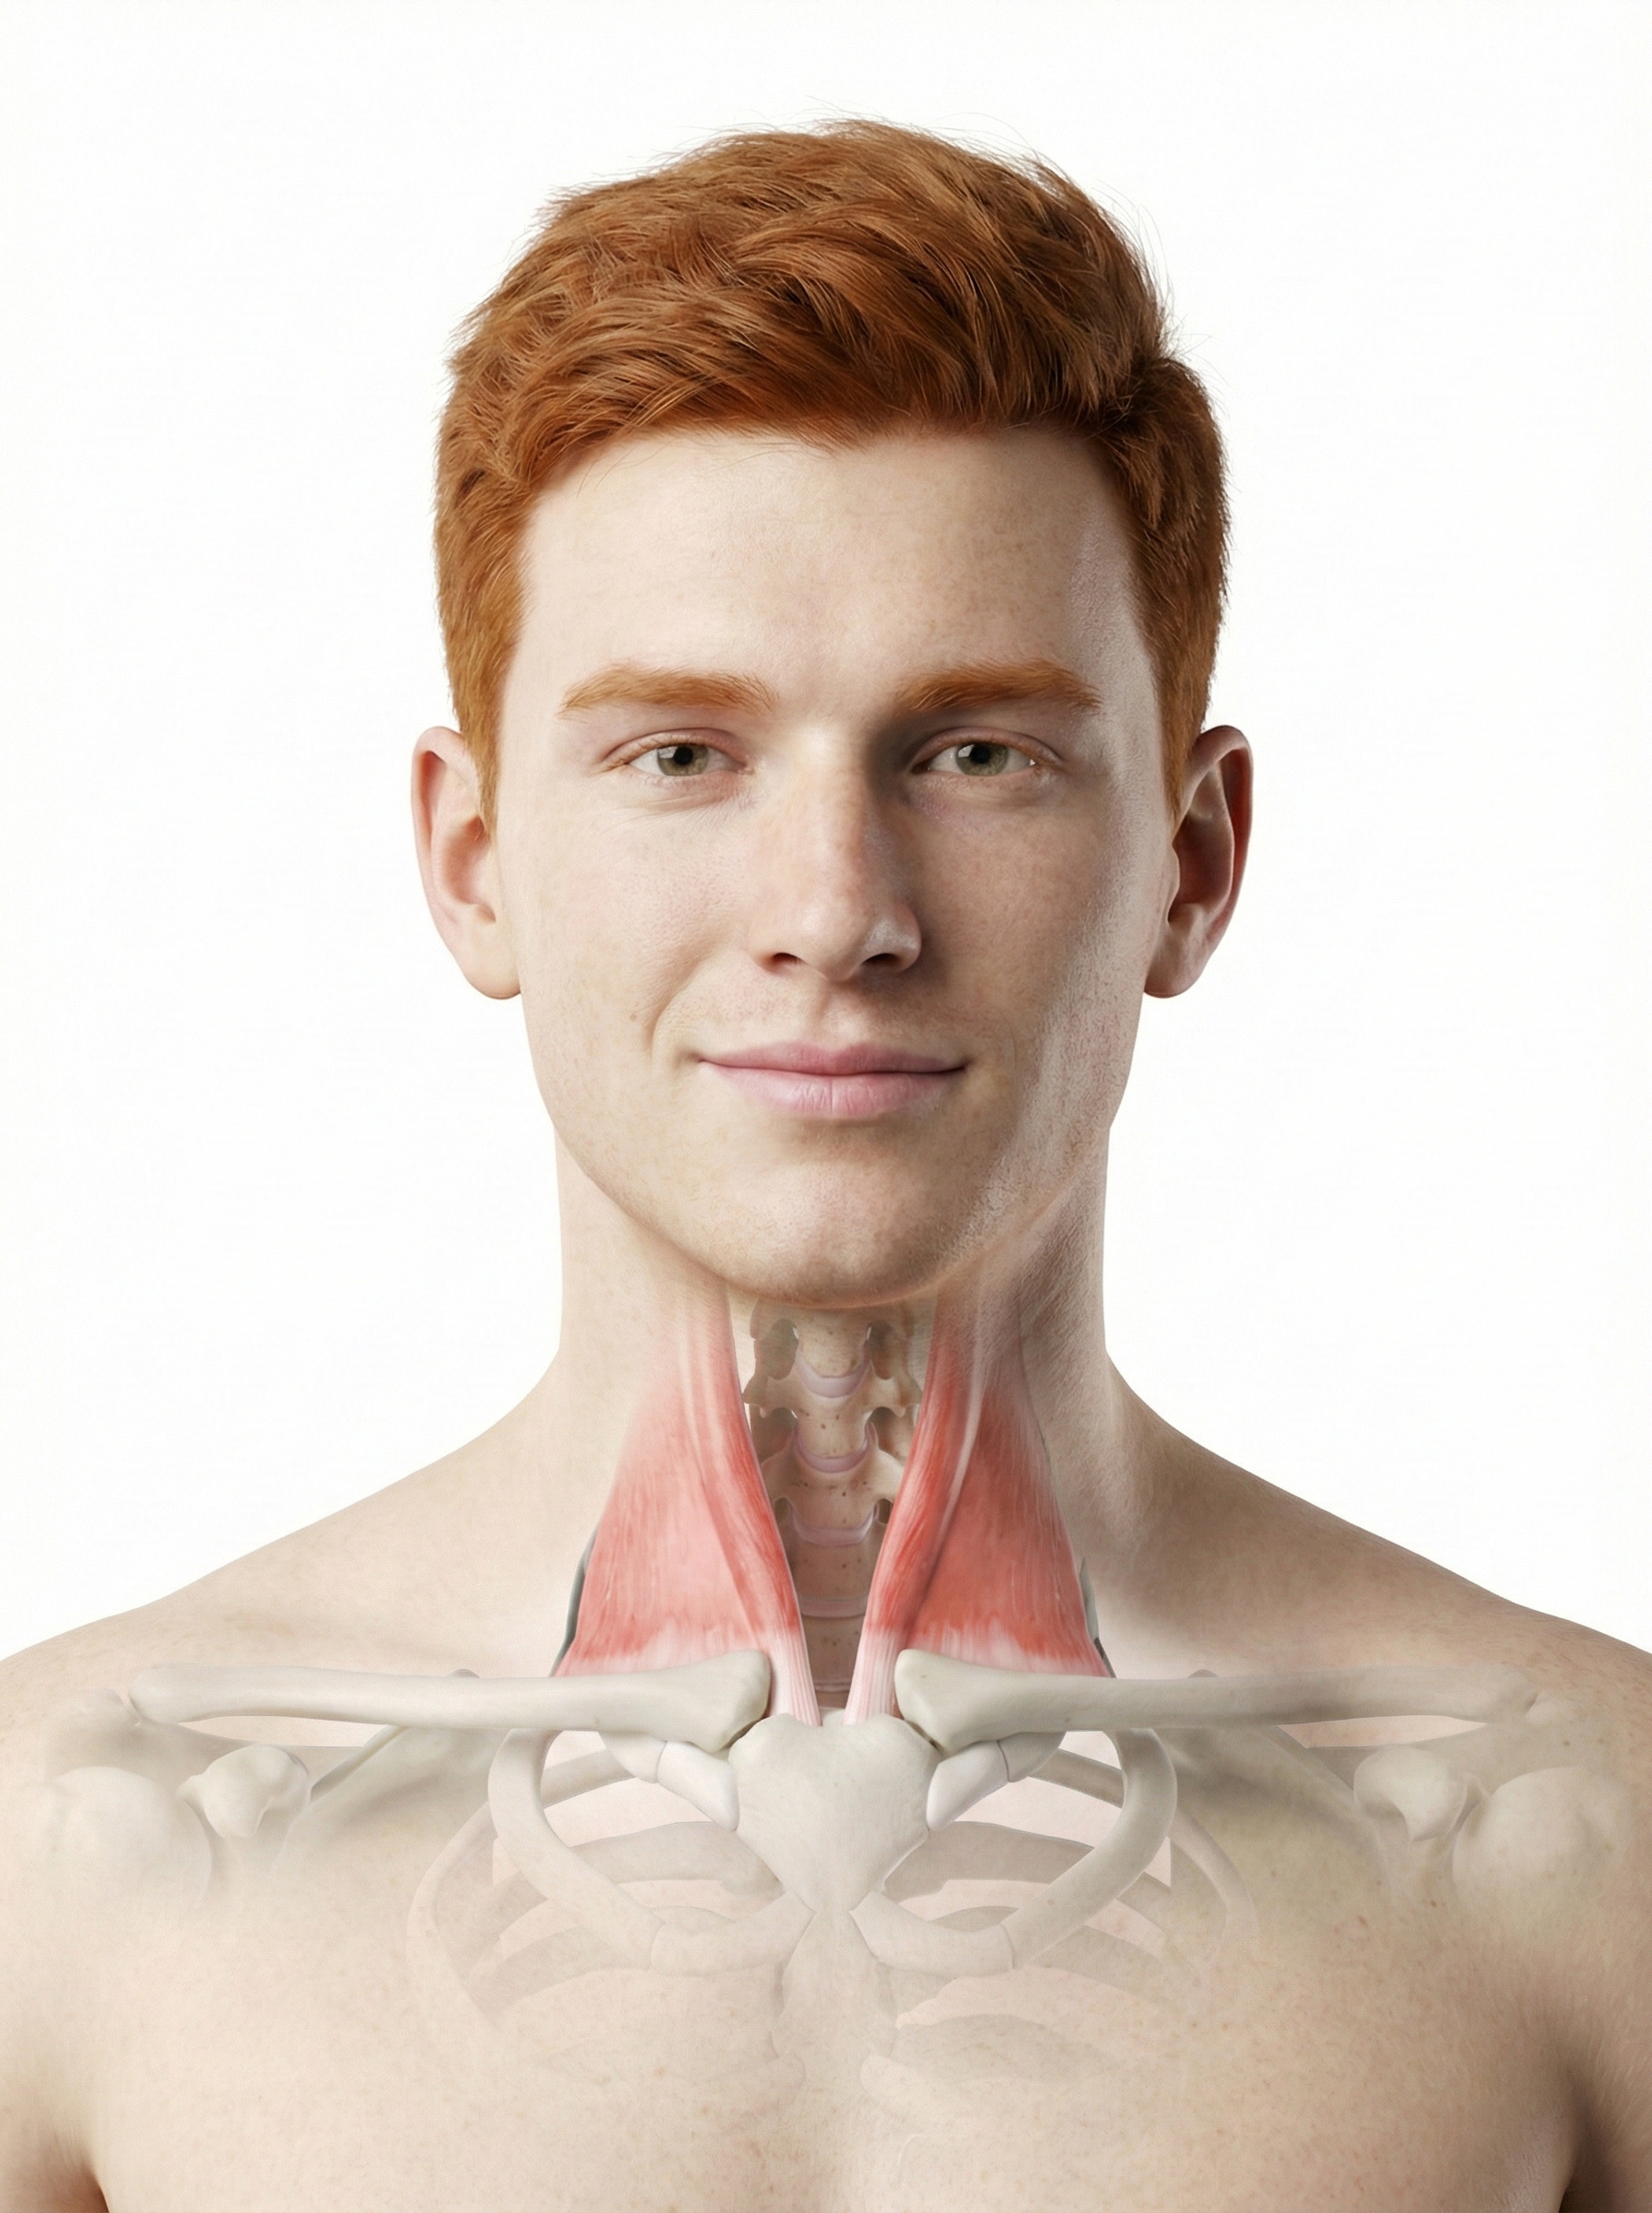
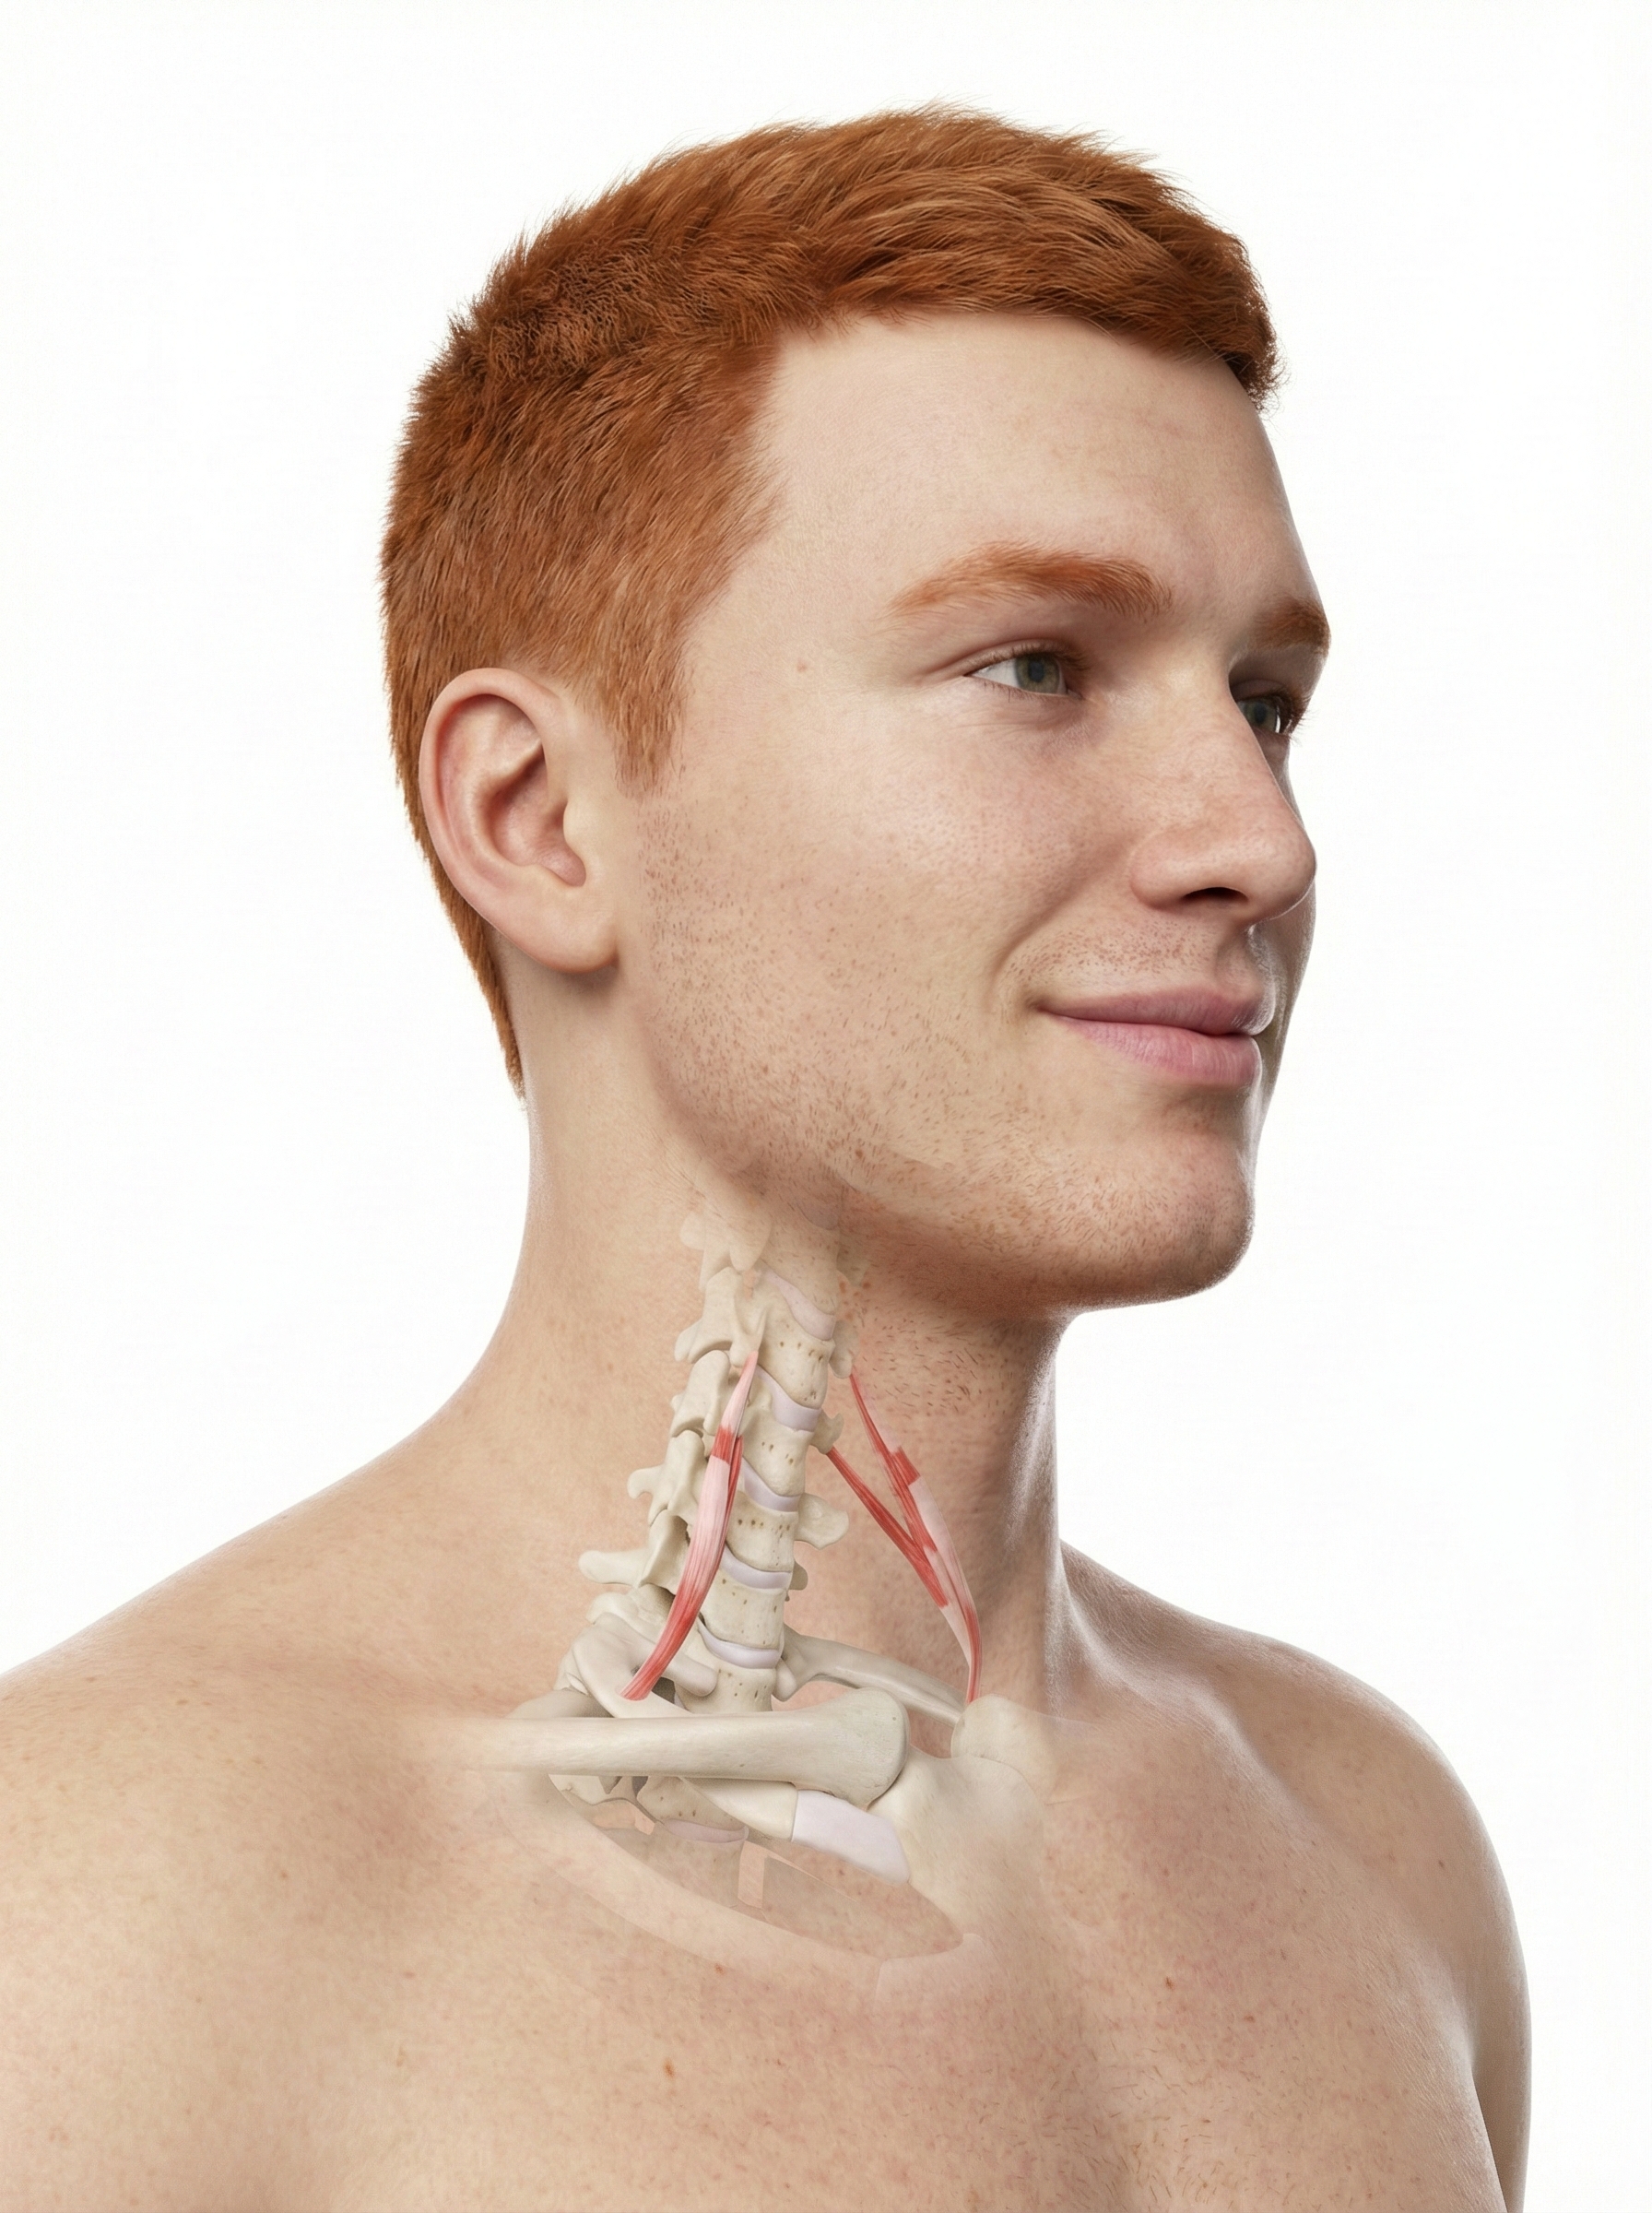
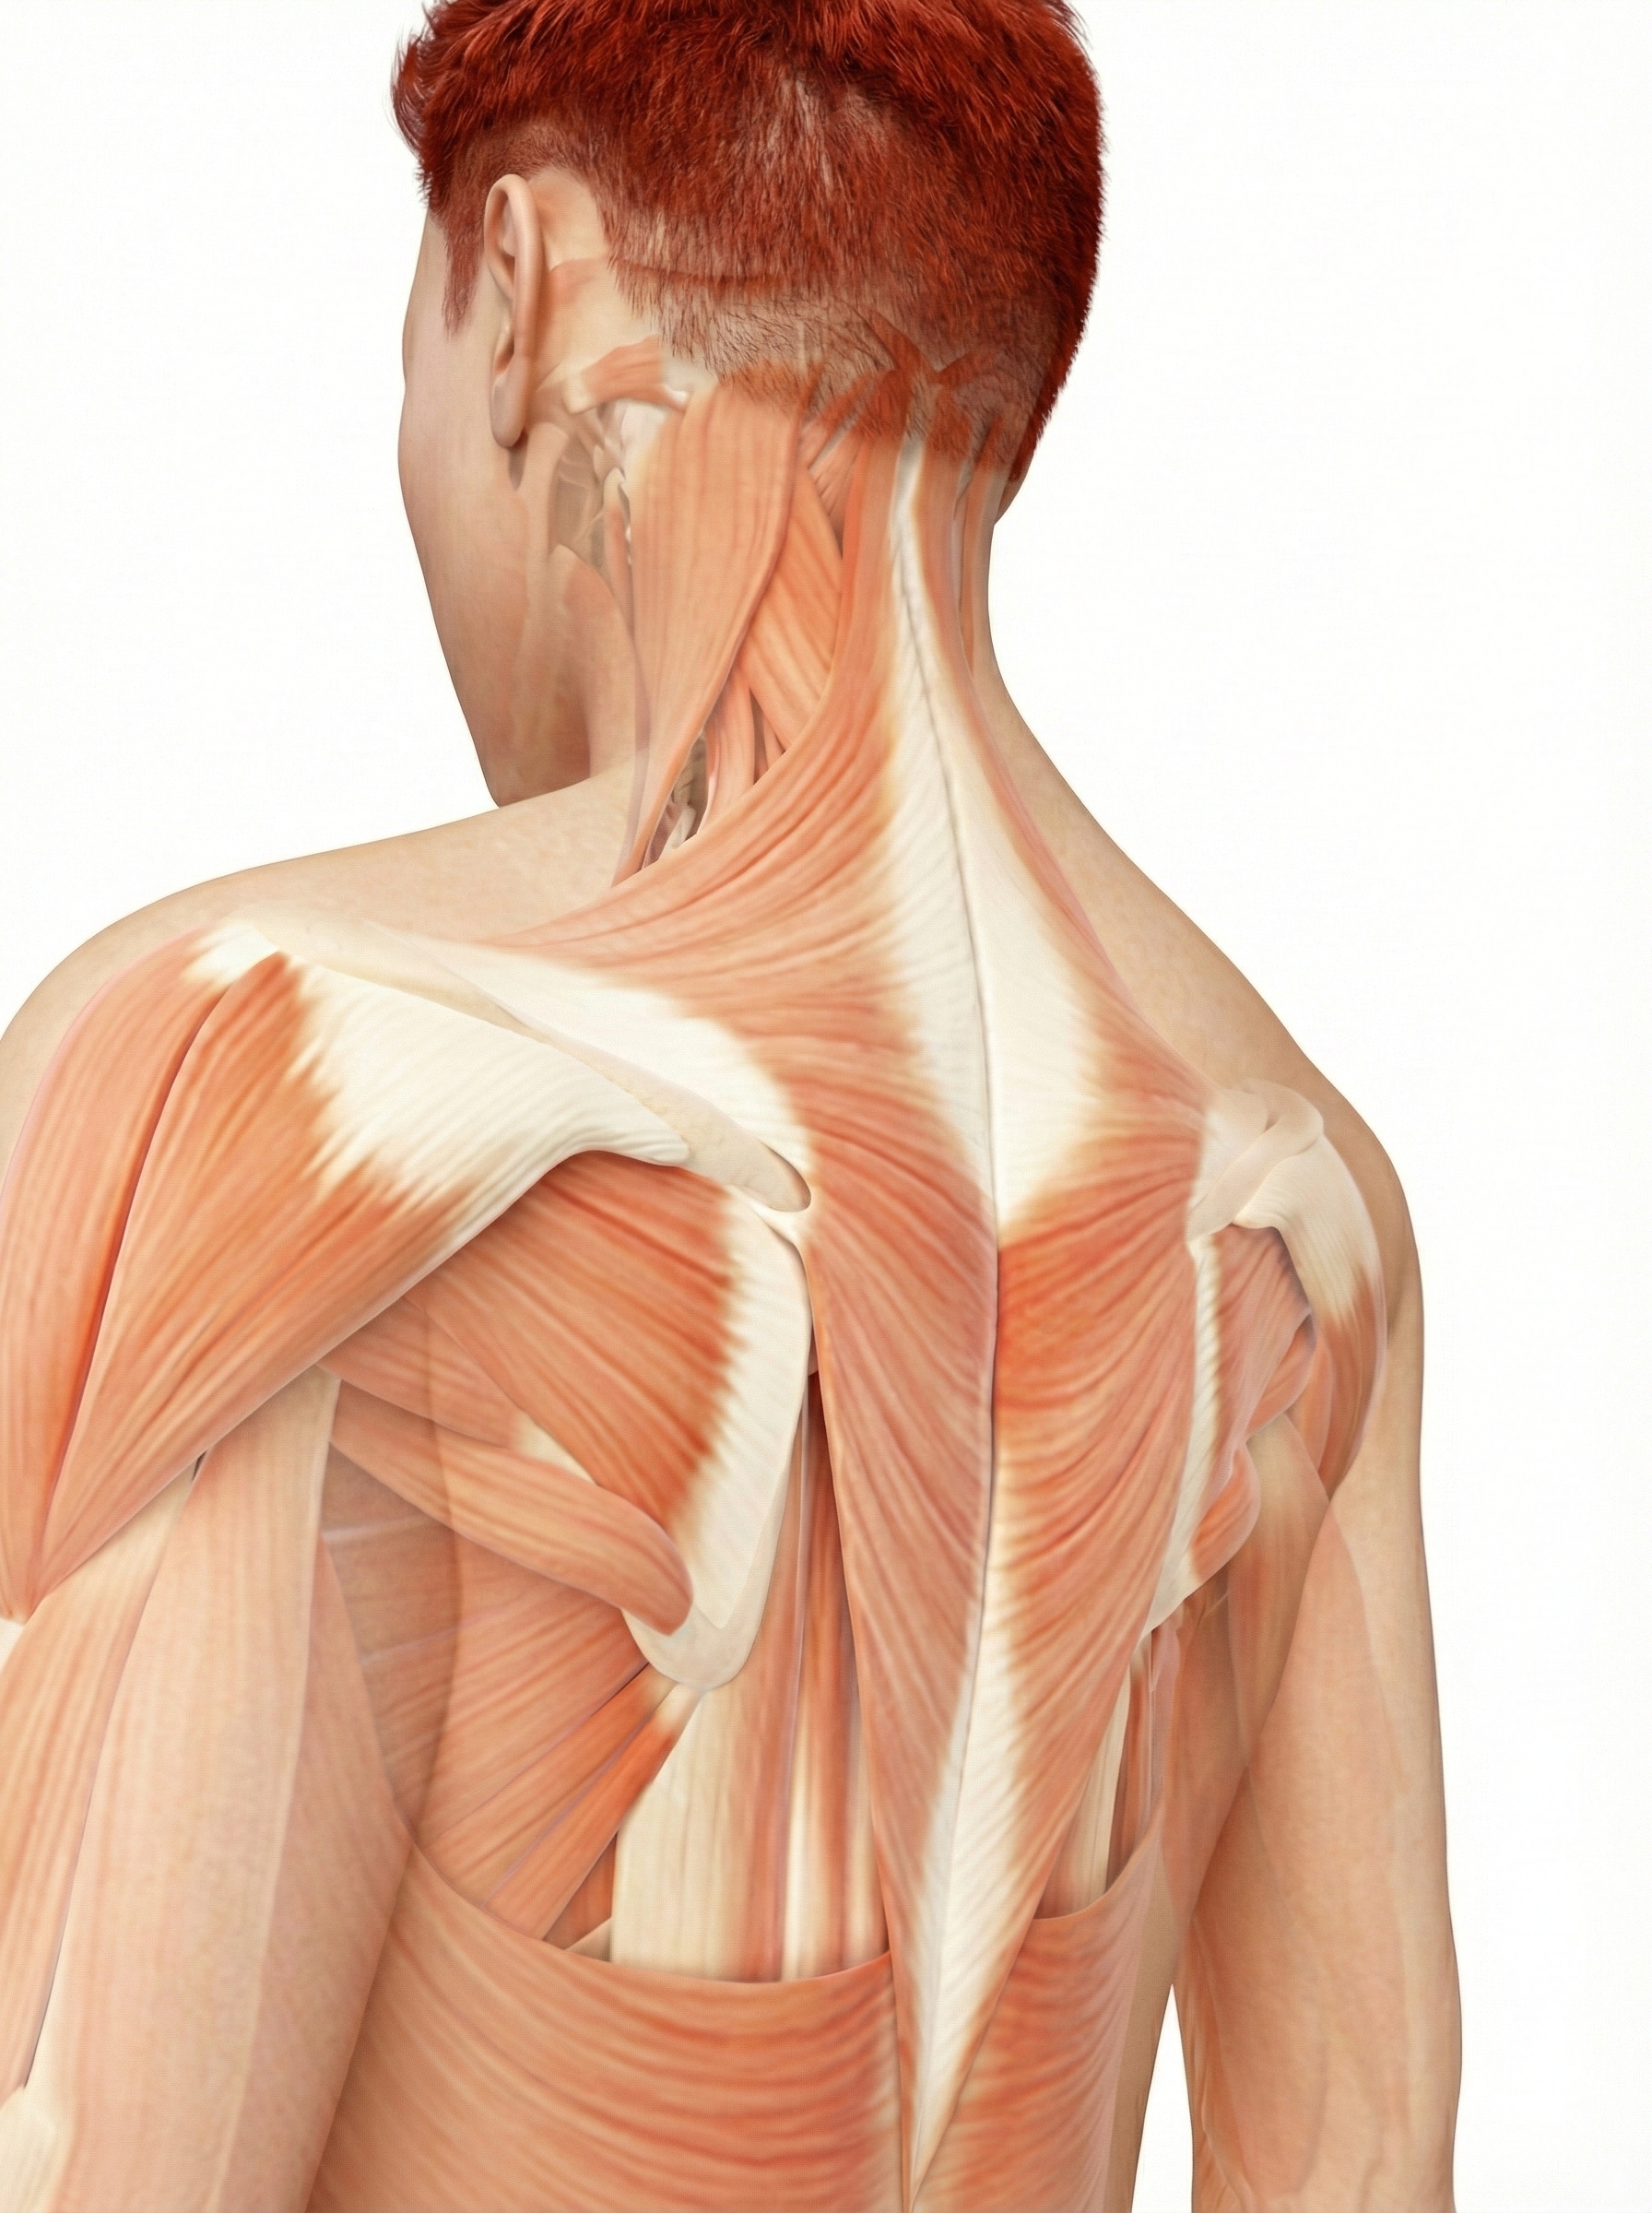
Clinicians use the surface EMG (SEMG) to monitor accessory breathing muscles, including the sternocleidomastoid, scalenes, pectoralis major and minor, serratus anterior, and latissimus dorsi, that may be recruited during overbreathing. When these muscles activate during quiet breathing, it signals that your client is working harder than necessary to breathe, a pattern that contributes to fatigue, neck pain, and anxiety.
 |
 |
 |
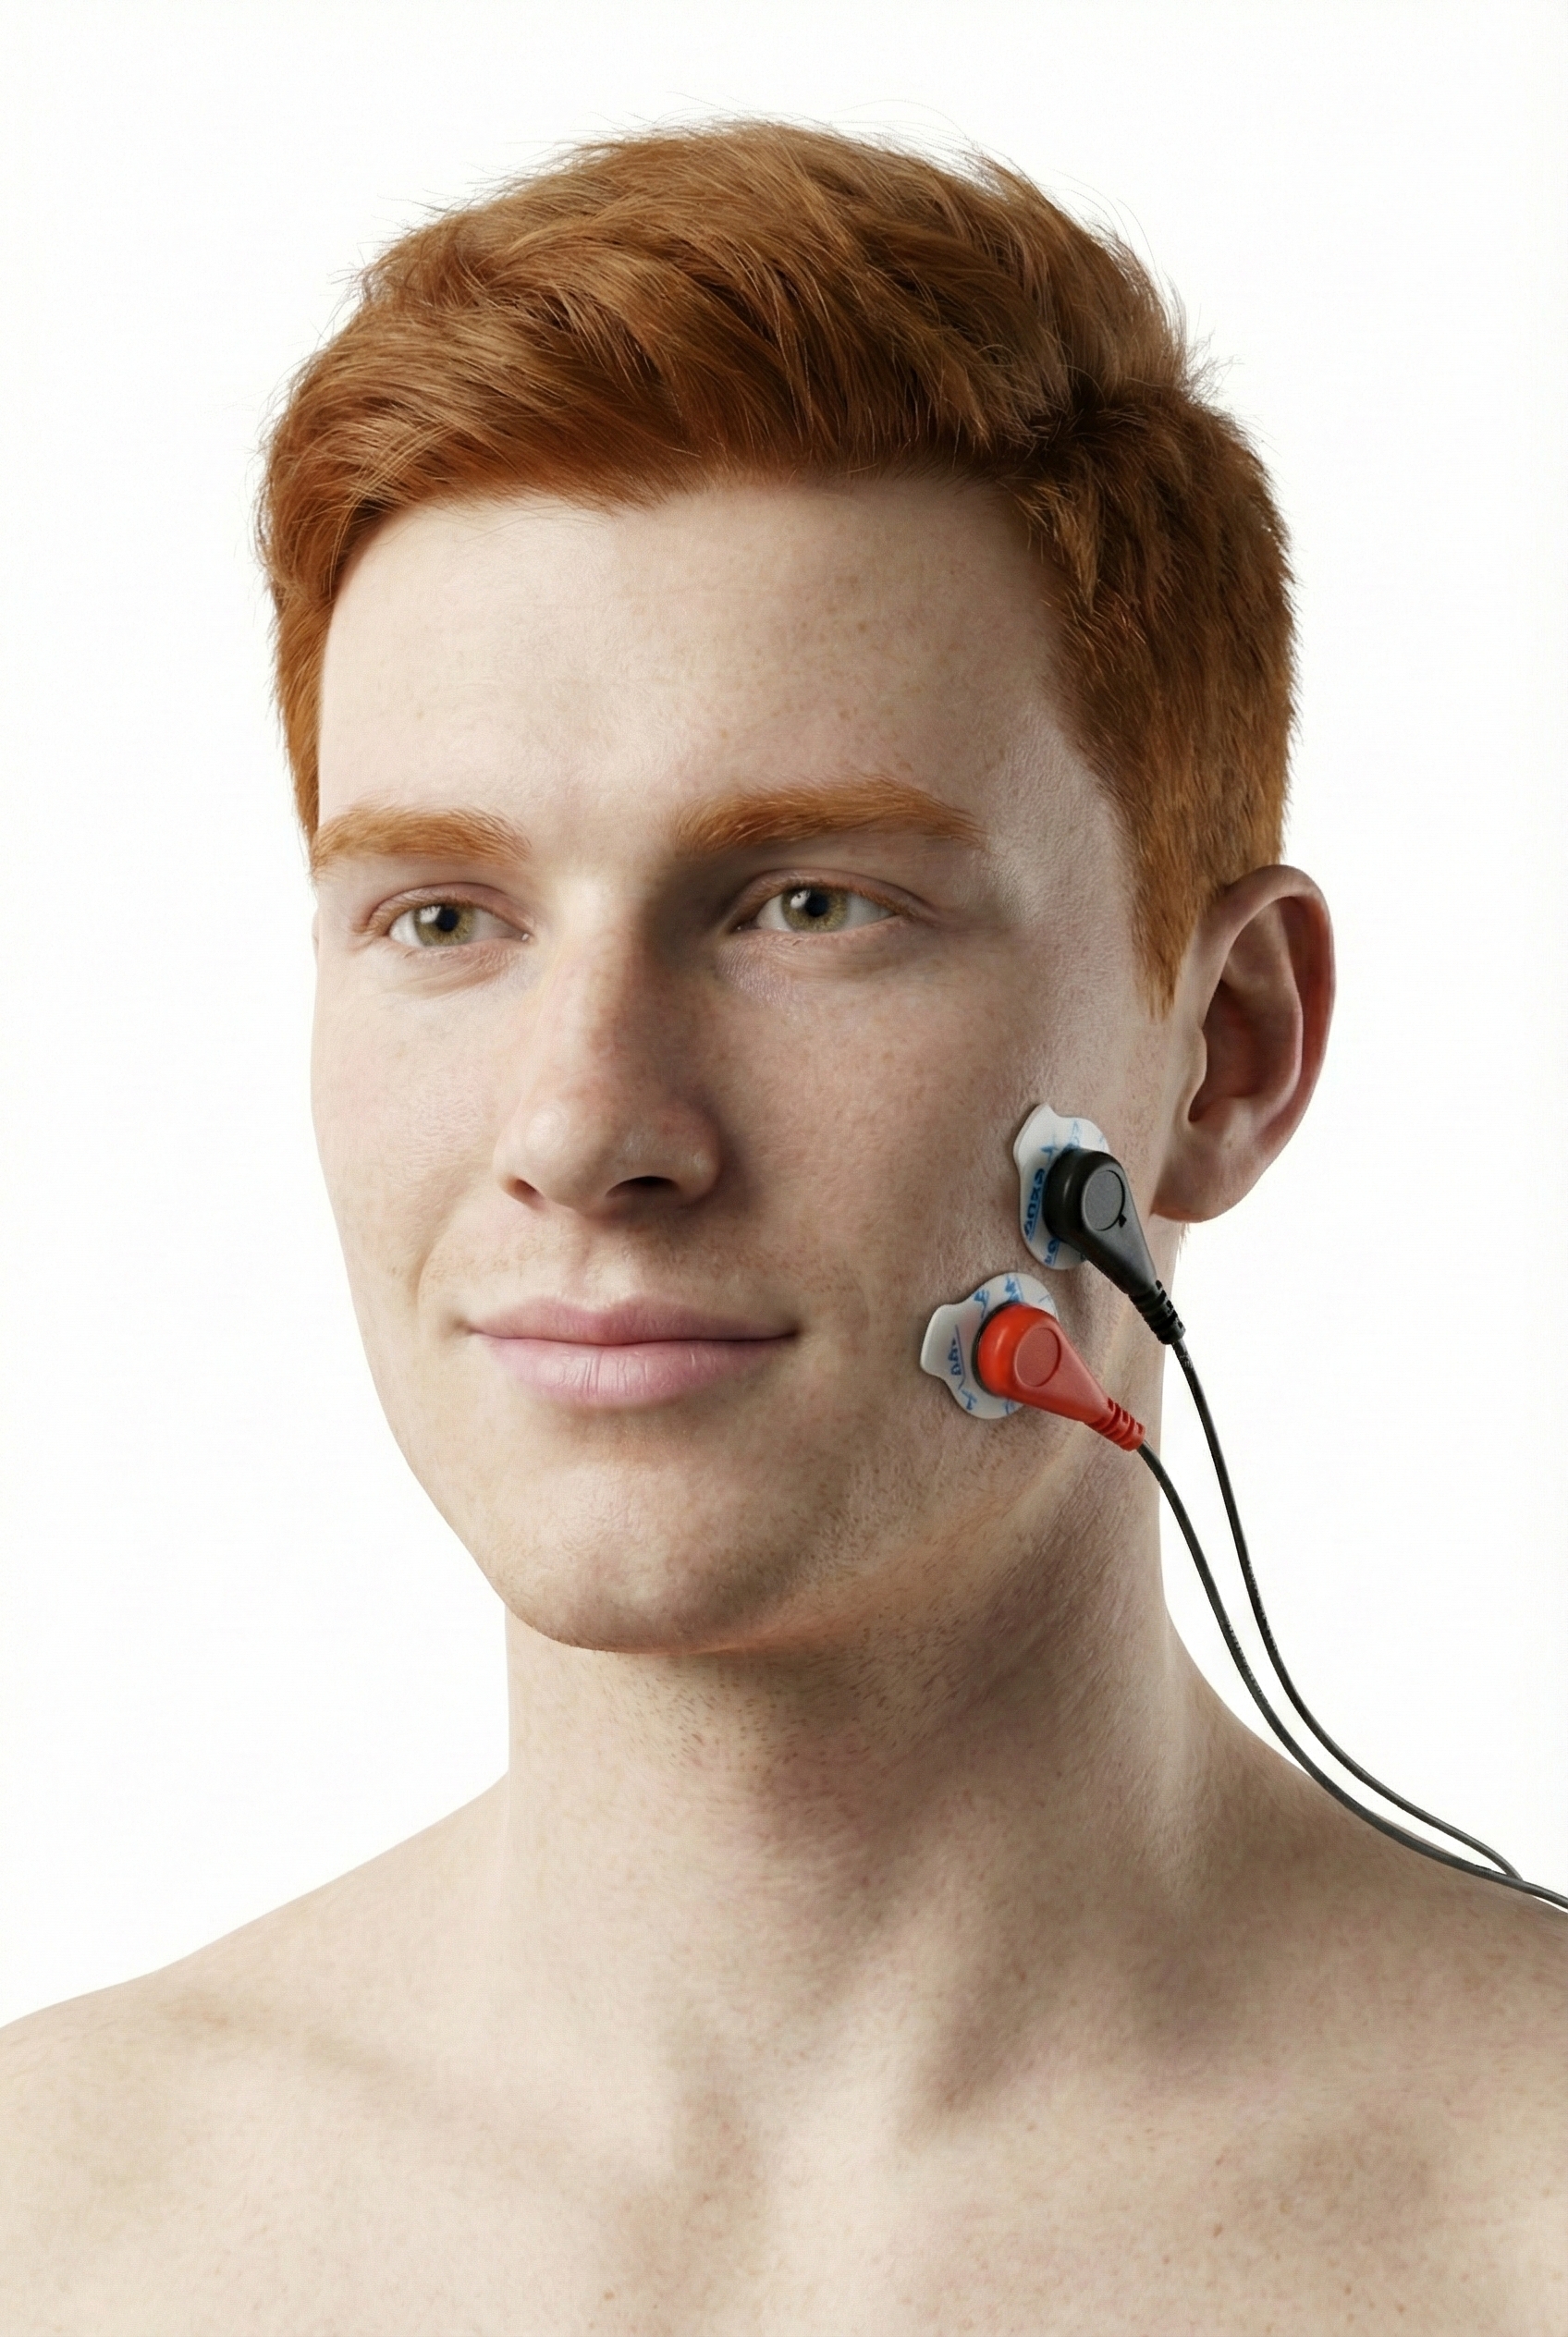
Trapezius and facial muscle placements using Mind Media EXG sensors are shown below. Active sensors are red and black, and the reference is white.
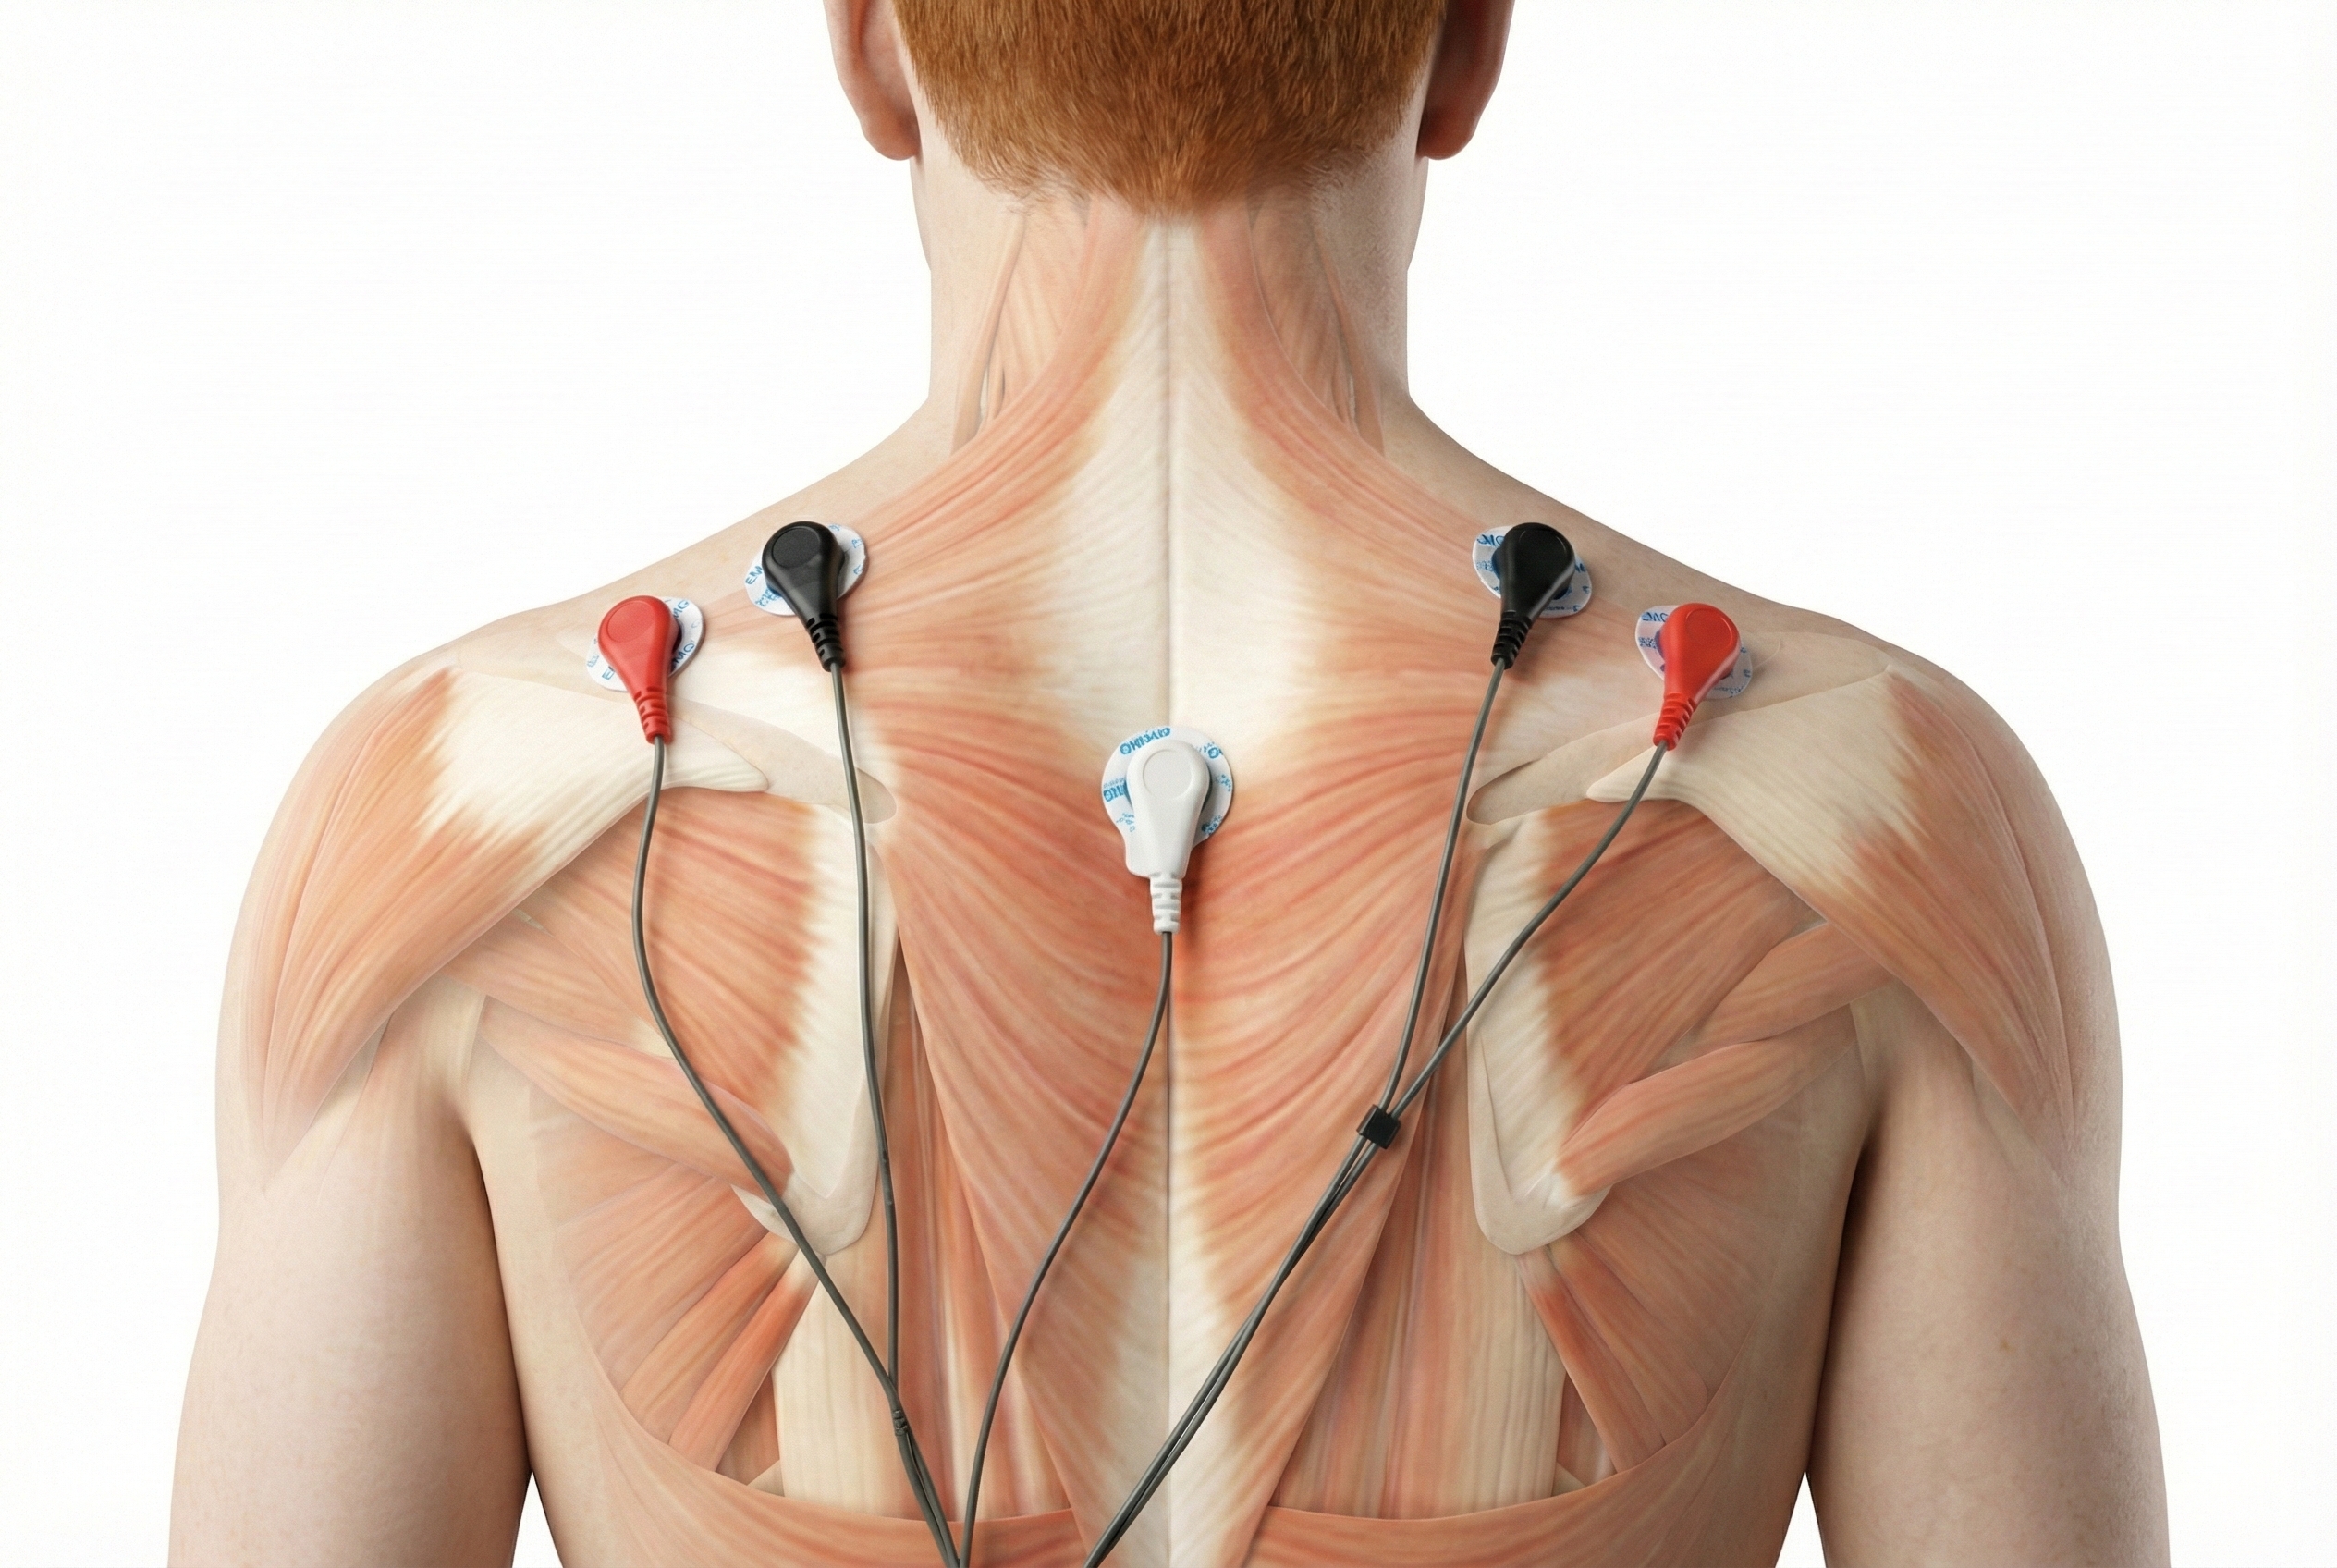
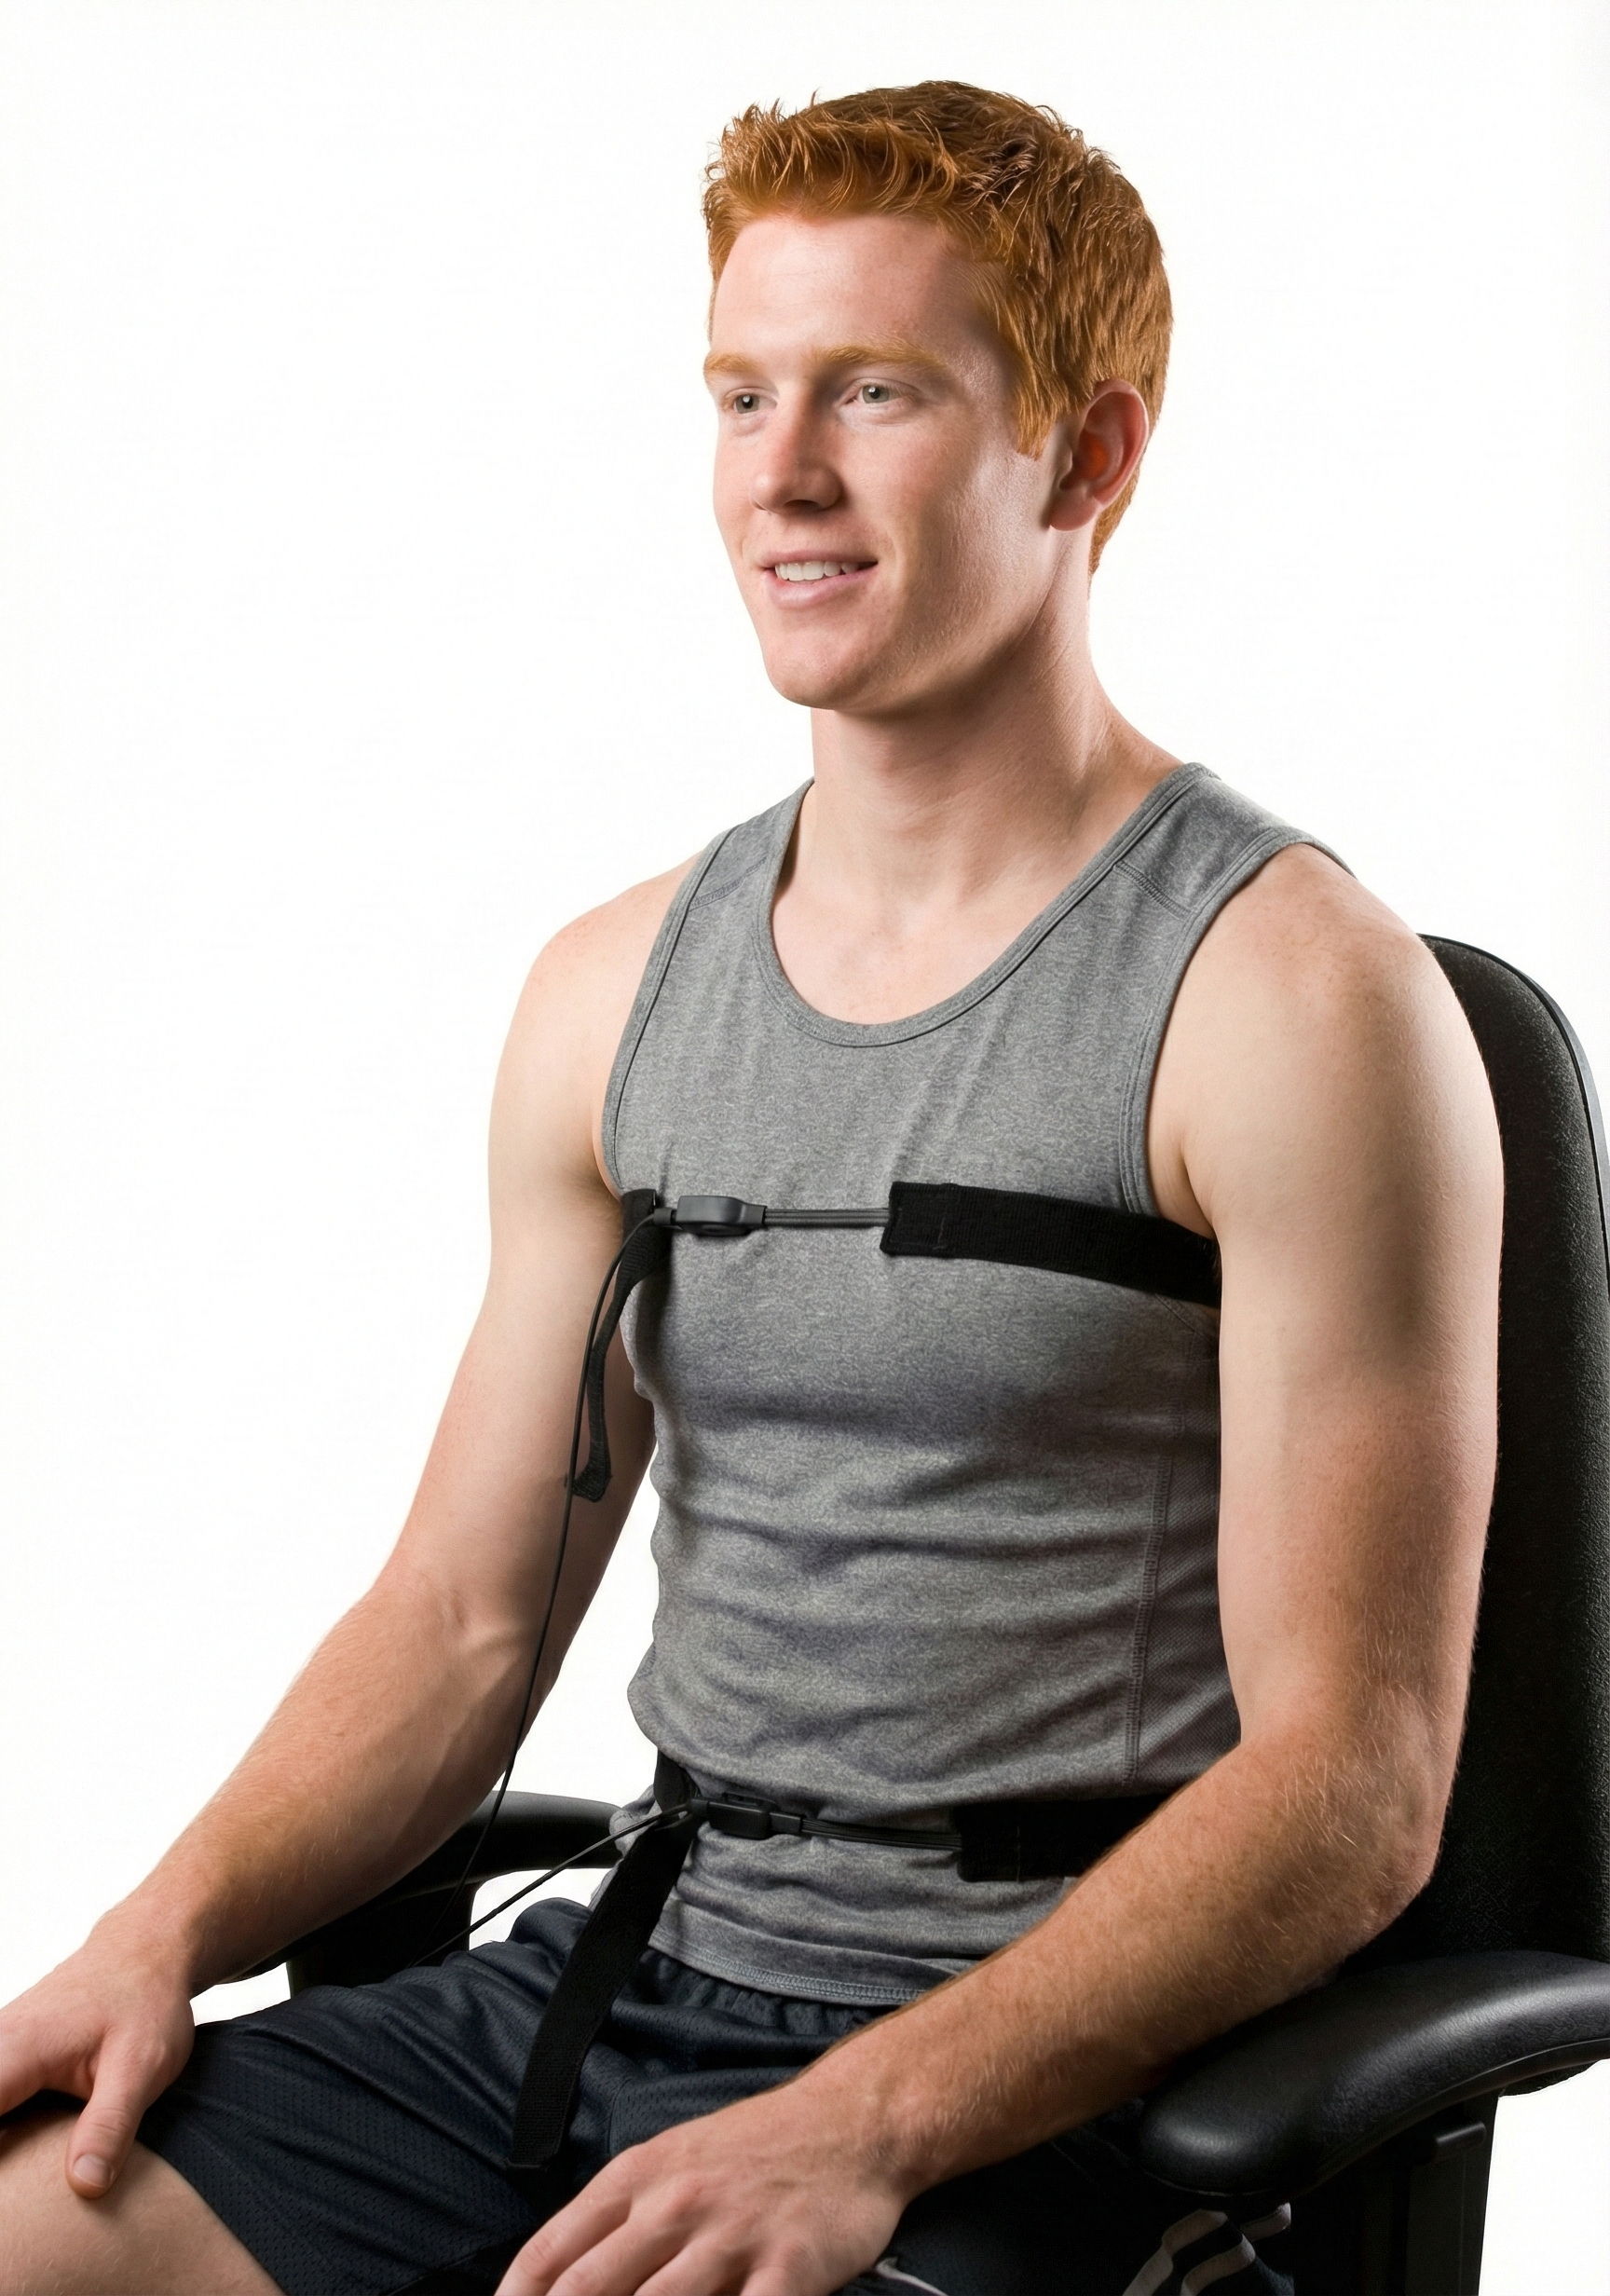
The photograph below depicts an SEMG placement to monitor the trapezius (yellow sensor) and scalene (blue sensor). The reference (black sensor) is located over the spine. As you can see, the color codes for active and reference electrodes differ across manufacturers.
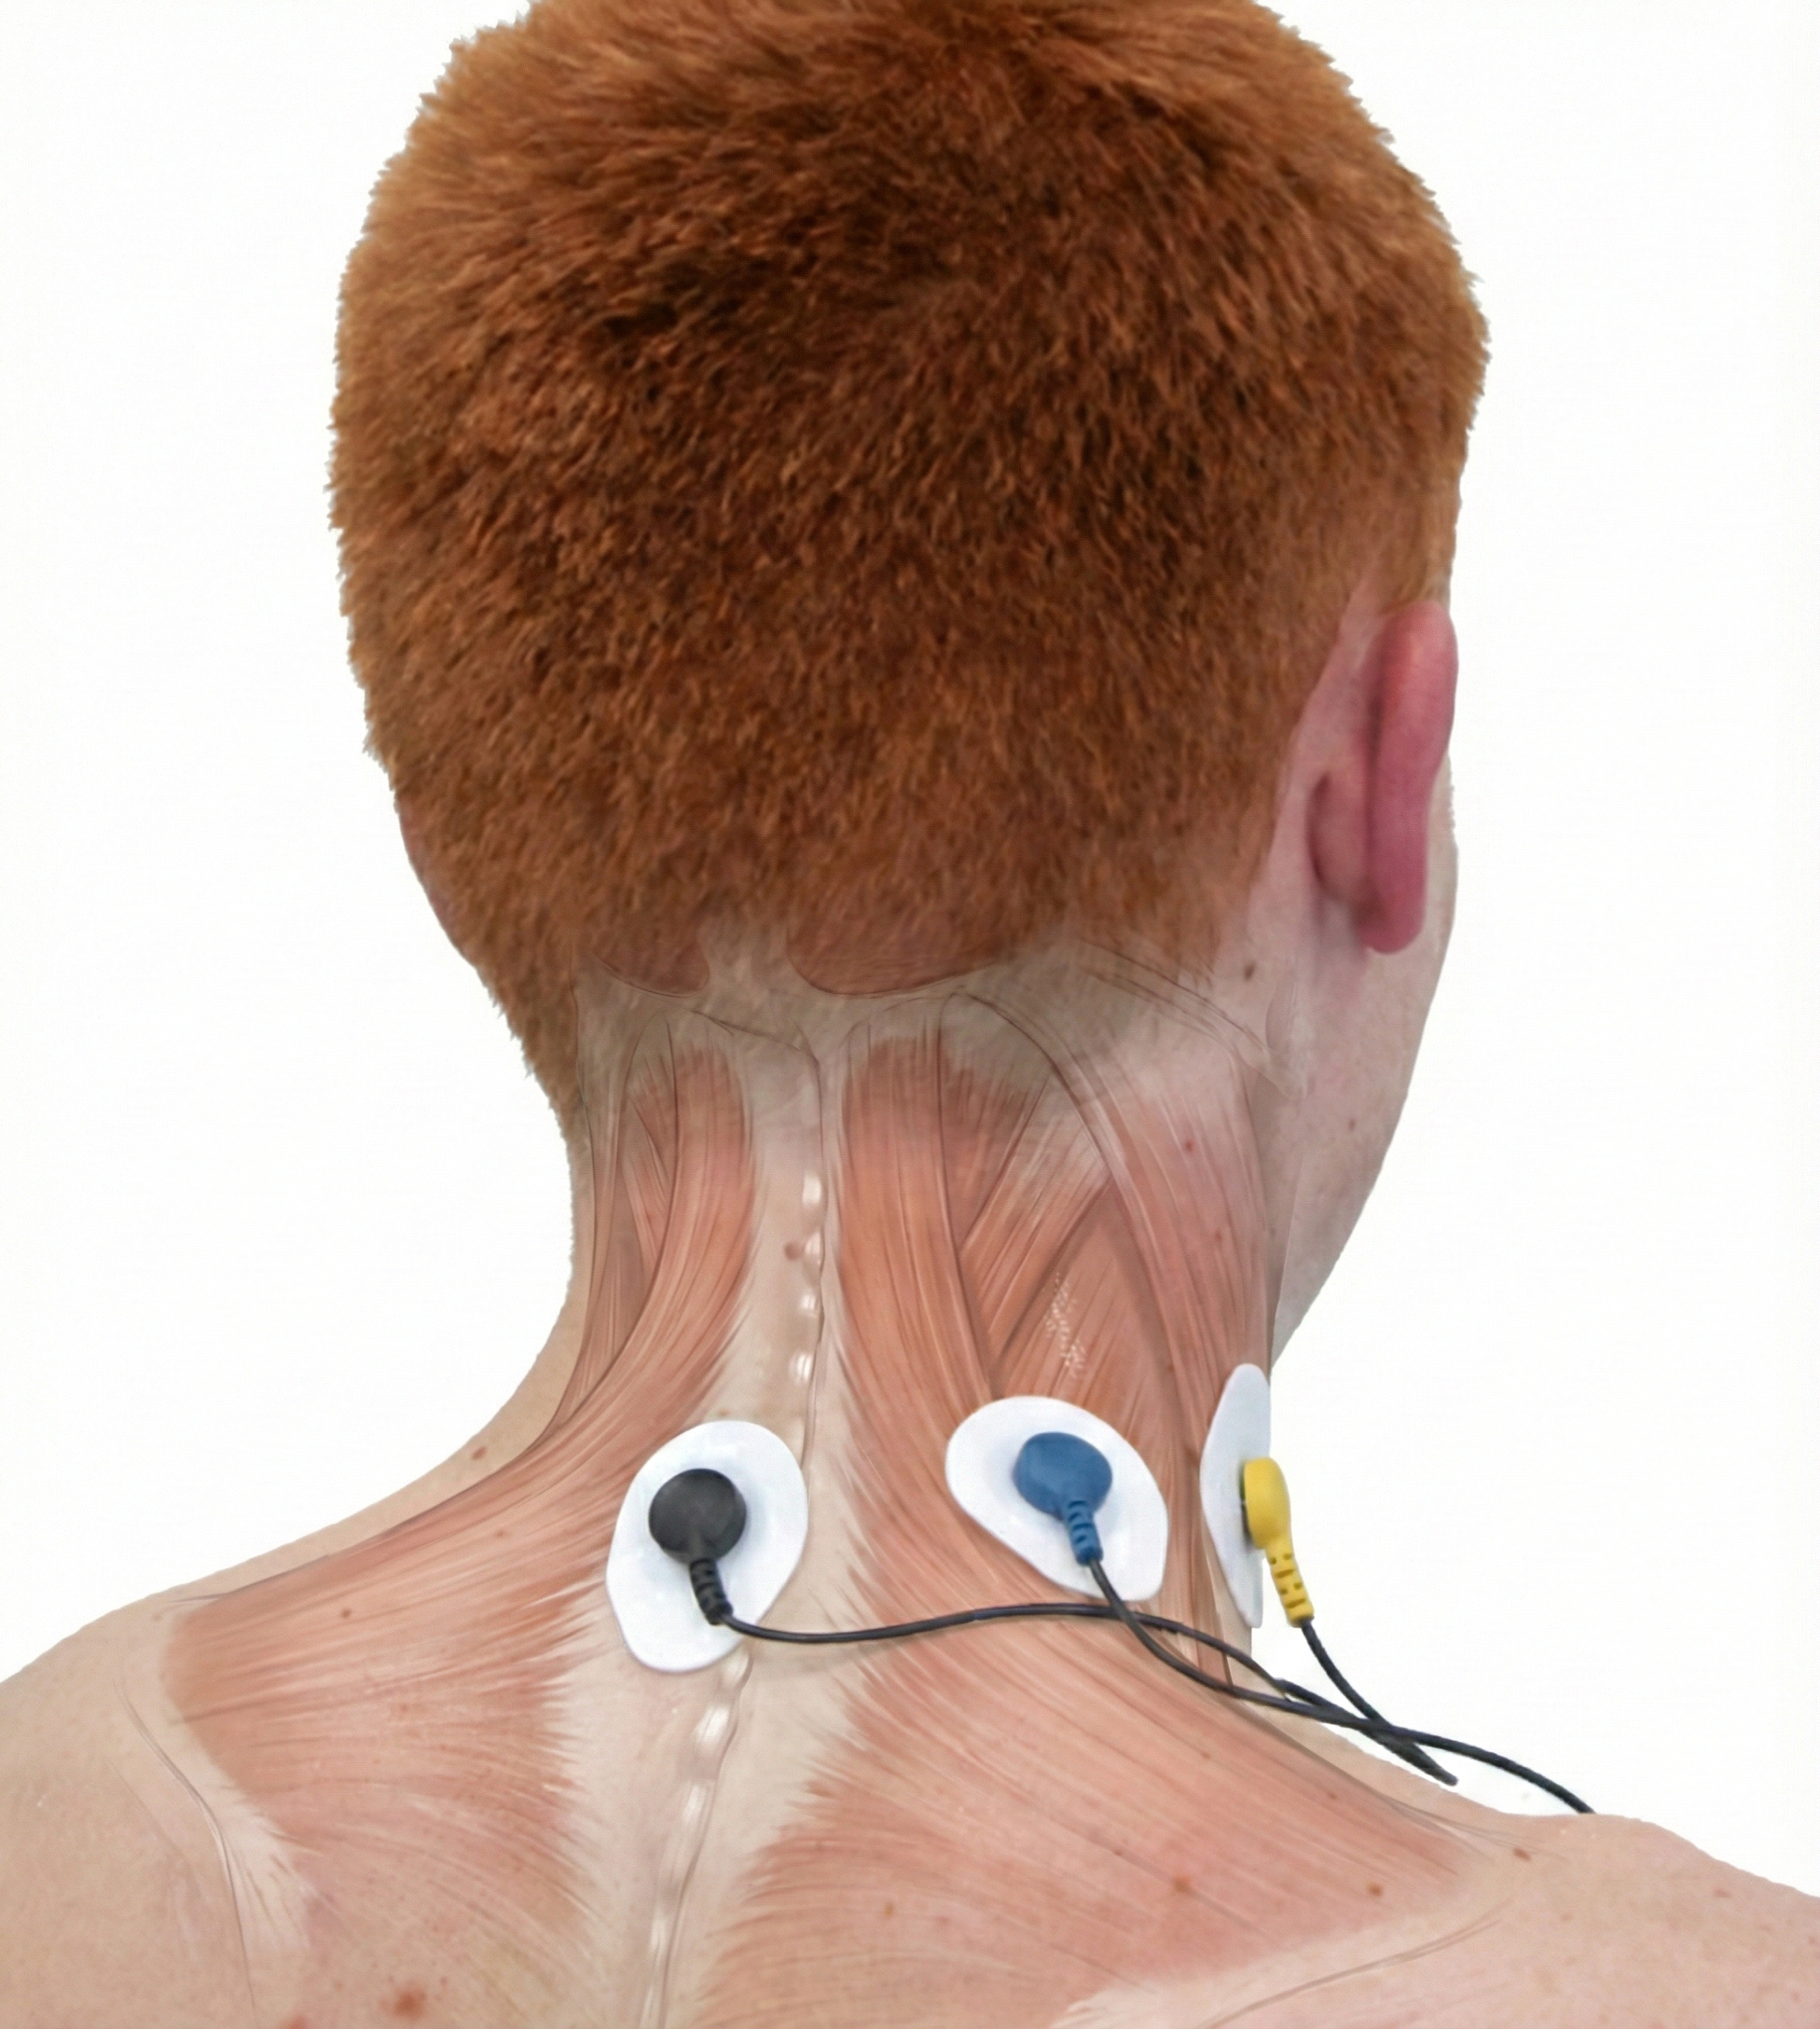
James, a 42-year-old software developer, reported persistent neck and shoulder tension despite regular massage therapy. During your assessment, you placed SEMG sensors over his upper trapezius and scalene muscles while monitoring his breathing. What you discovered was revealing: every time James inhaled, his trapezius activity spiked to 8-12 microvolts, well above the 2-3 microvolts you would expect during effortless breathing. James was essentially doing "mini-shrugs" with every breath, hundreds of times per day. Once he saw this pattern on the screen, he understood why massage provided only temporary relief. The real issue was his breathing mechanics.
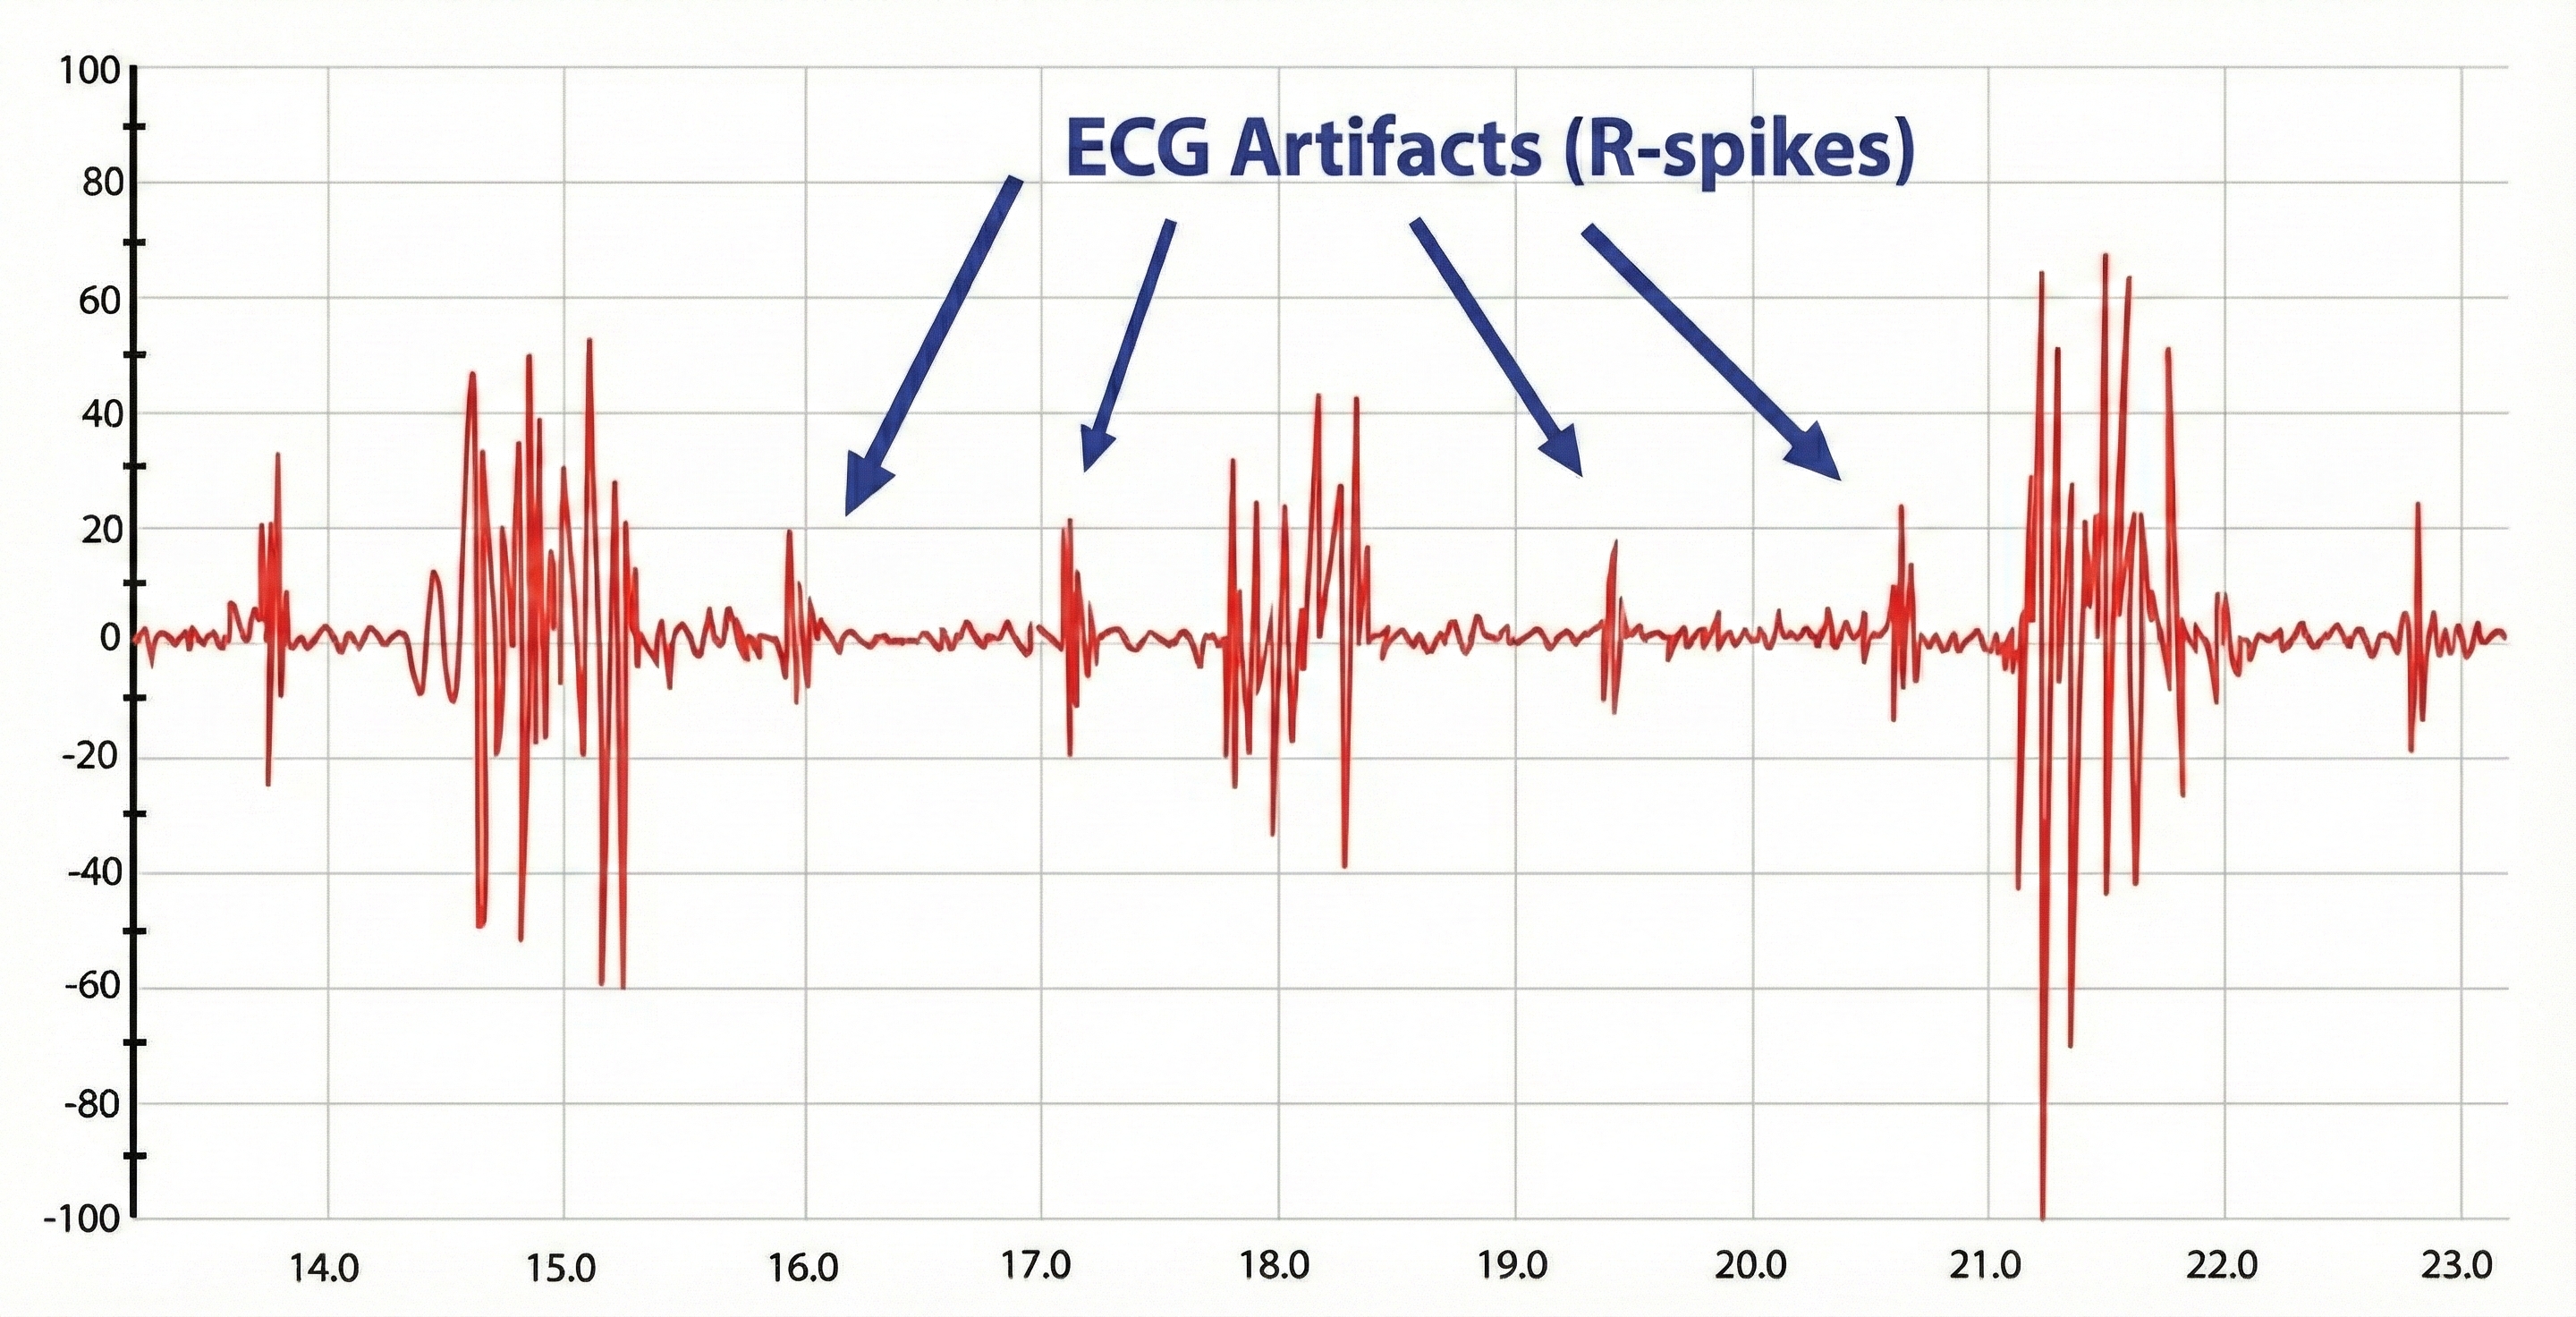
ECG Artifact in SEMG Recordings
Evaluate the raw signal for ECG artifact, which may be superimposed on the SEMG signal. You can minimize the risk of this artifact by using a narrower bandpass and closer electrode spacing.
The BioGraph ® Infiniti screen below provides respiratory and SEMG biofeedback to teach rhythmic breathing while maintaining relaxed accessory muscles. Note the overuse of accessory muscles during clavicular breathing.
Surface EMG reveals the muscular effort behind breathing that respirometry alone cannot detect. Monitoring accessory muscles like the trapezius and scalenes helps identify clients who are working too hard to breathe, even when their rate and rhythm appear normal. Watch for ECG artifact in your recordings and use appropriate filtering to maintain signal clarity.
Check Your Understanding
- What does elevated trapezius or scalene activity during quiet breathing indicate about a client's respiratory pattern?
- How can you distinguish ECG artifact from genuine muscle activity in an SEMG recording?
- Why is combining respirometry with SEMG more informative than using either modality alone?
- What technical adjustments can minimize ECG artifact in chest and neck SEMG recordings?
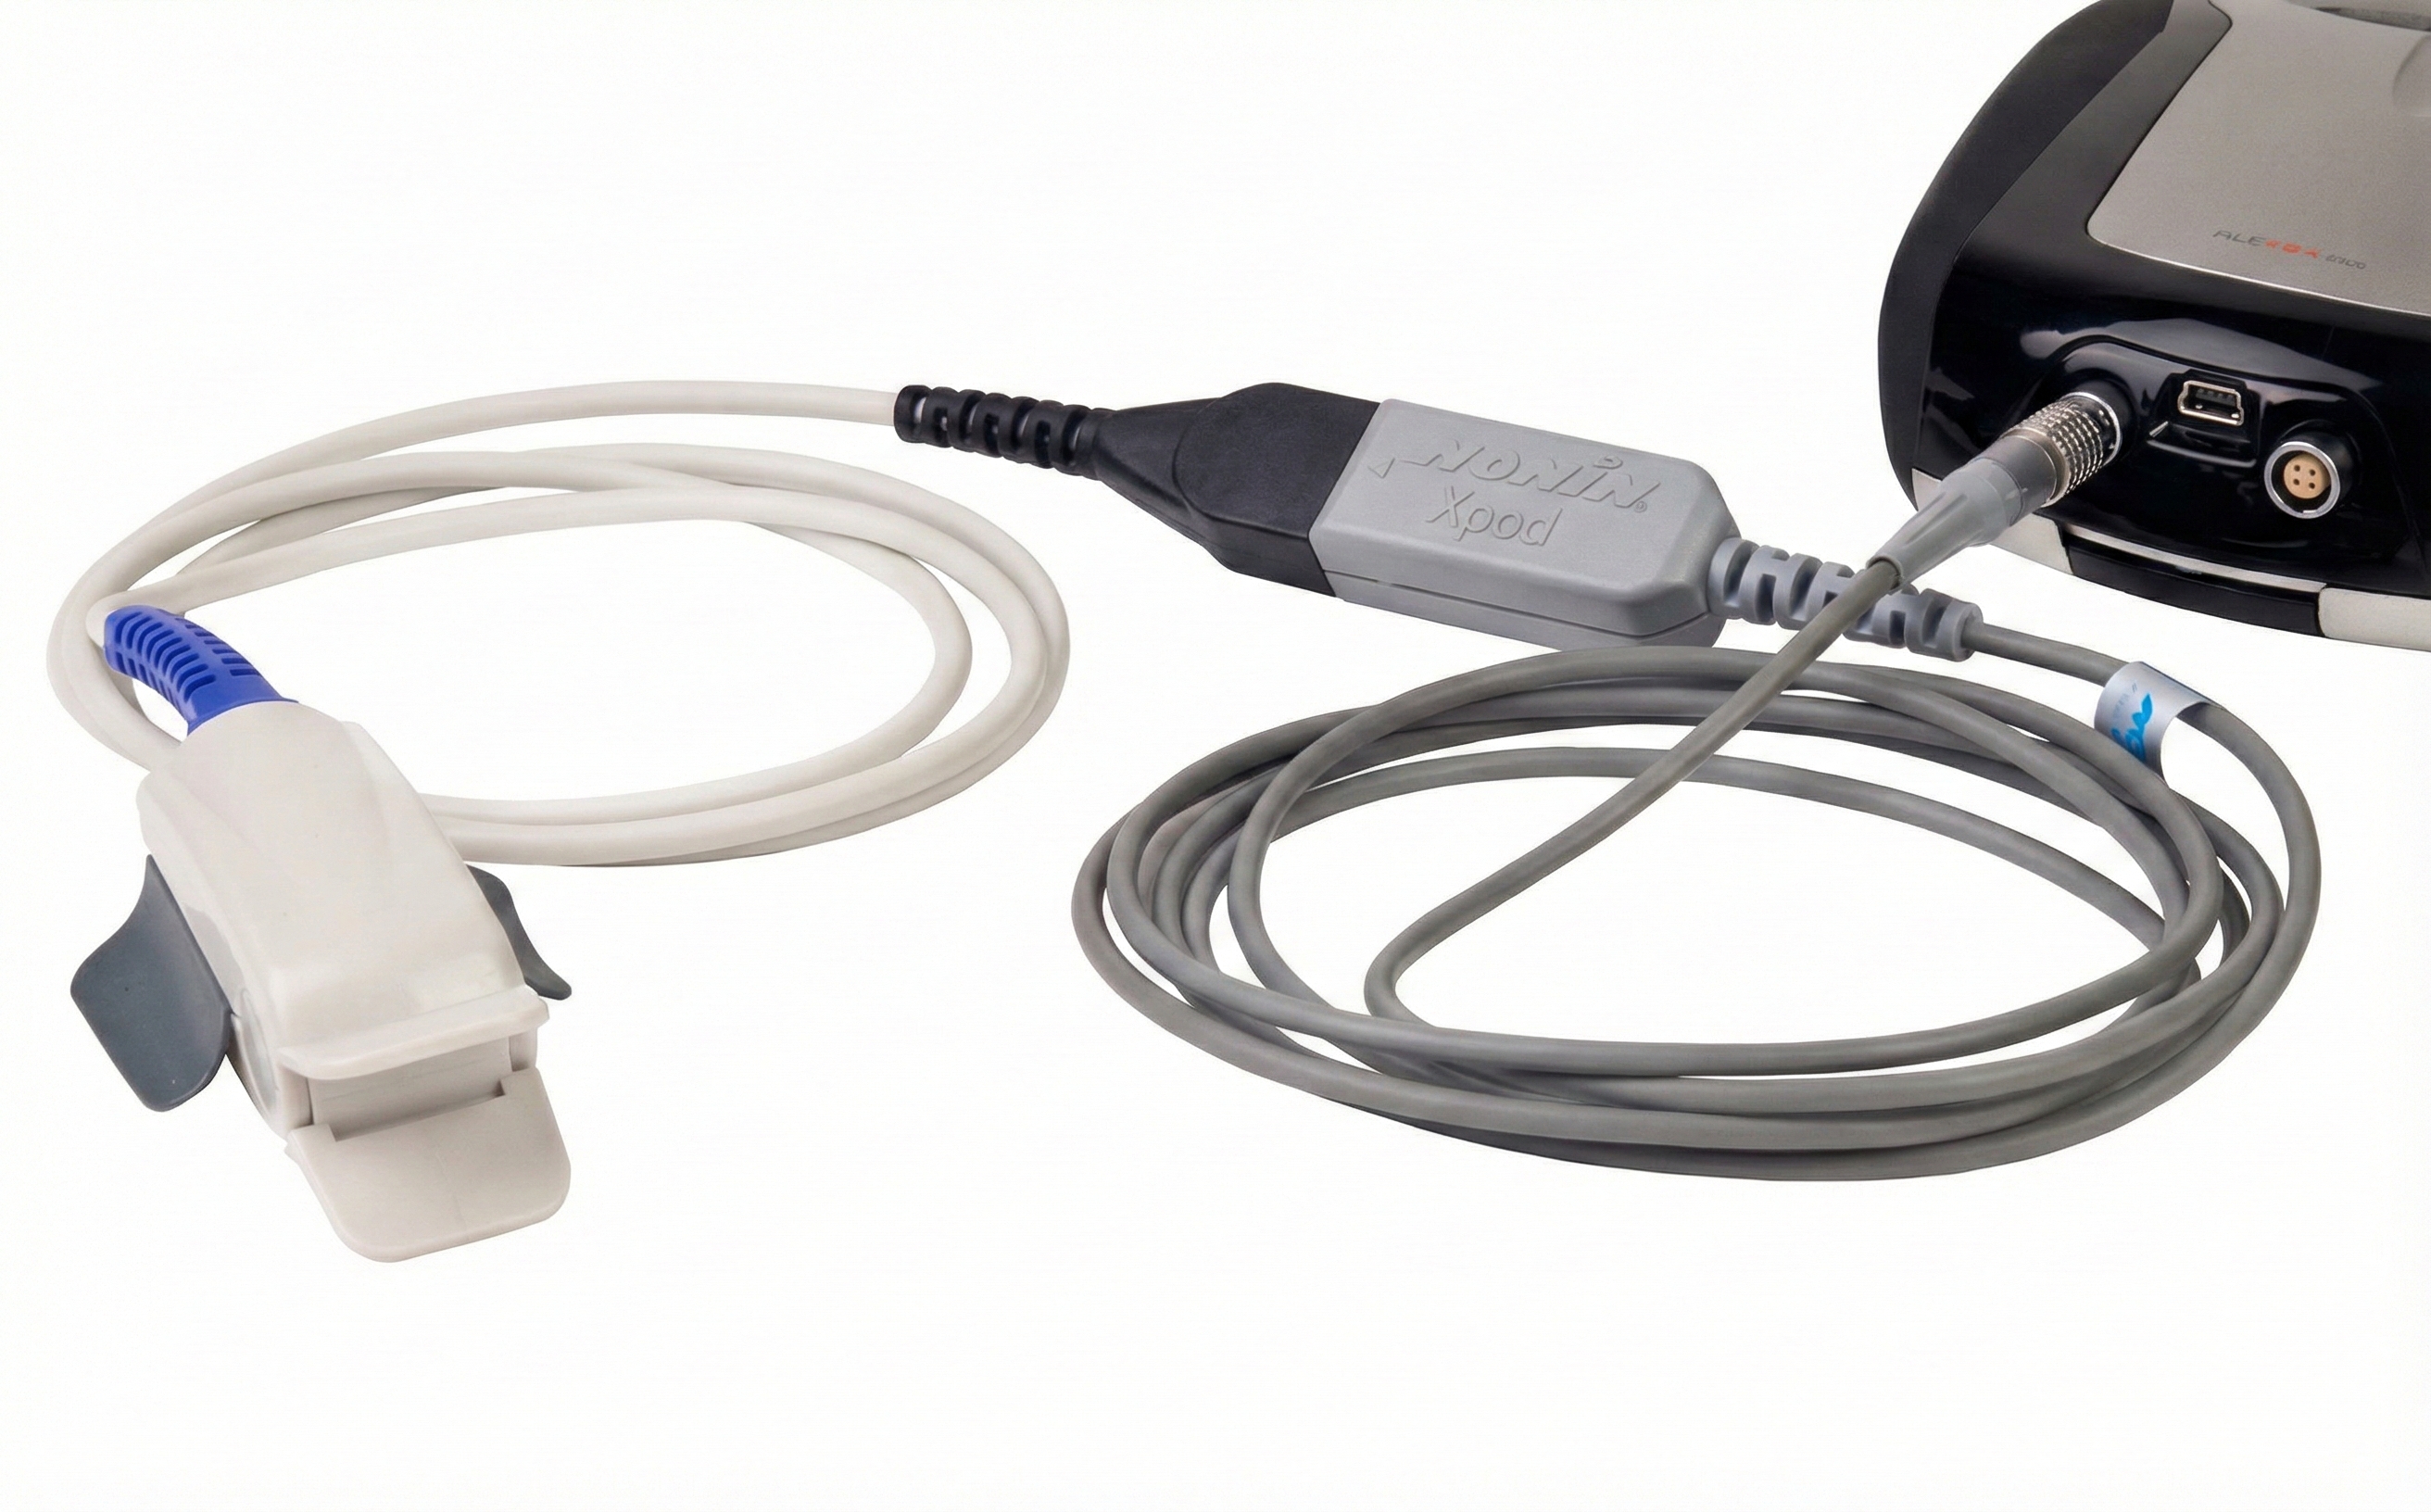
Oximetry: Measuring Blood Oxygen Saturation
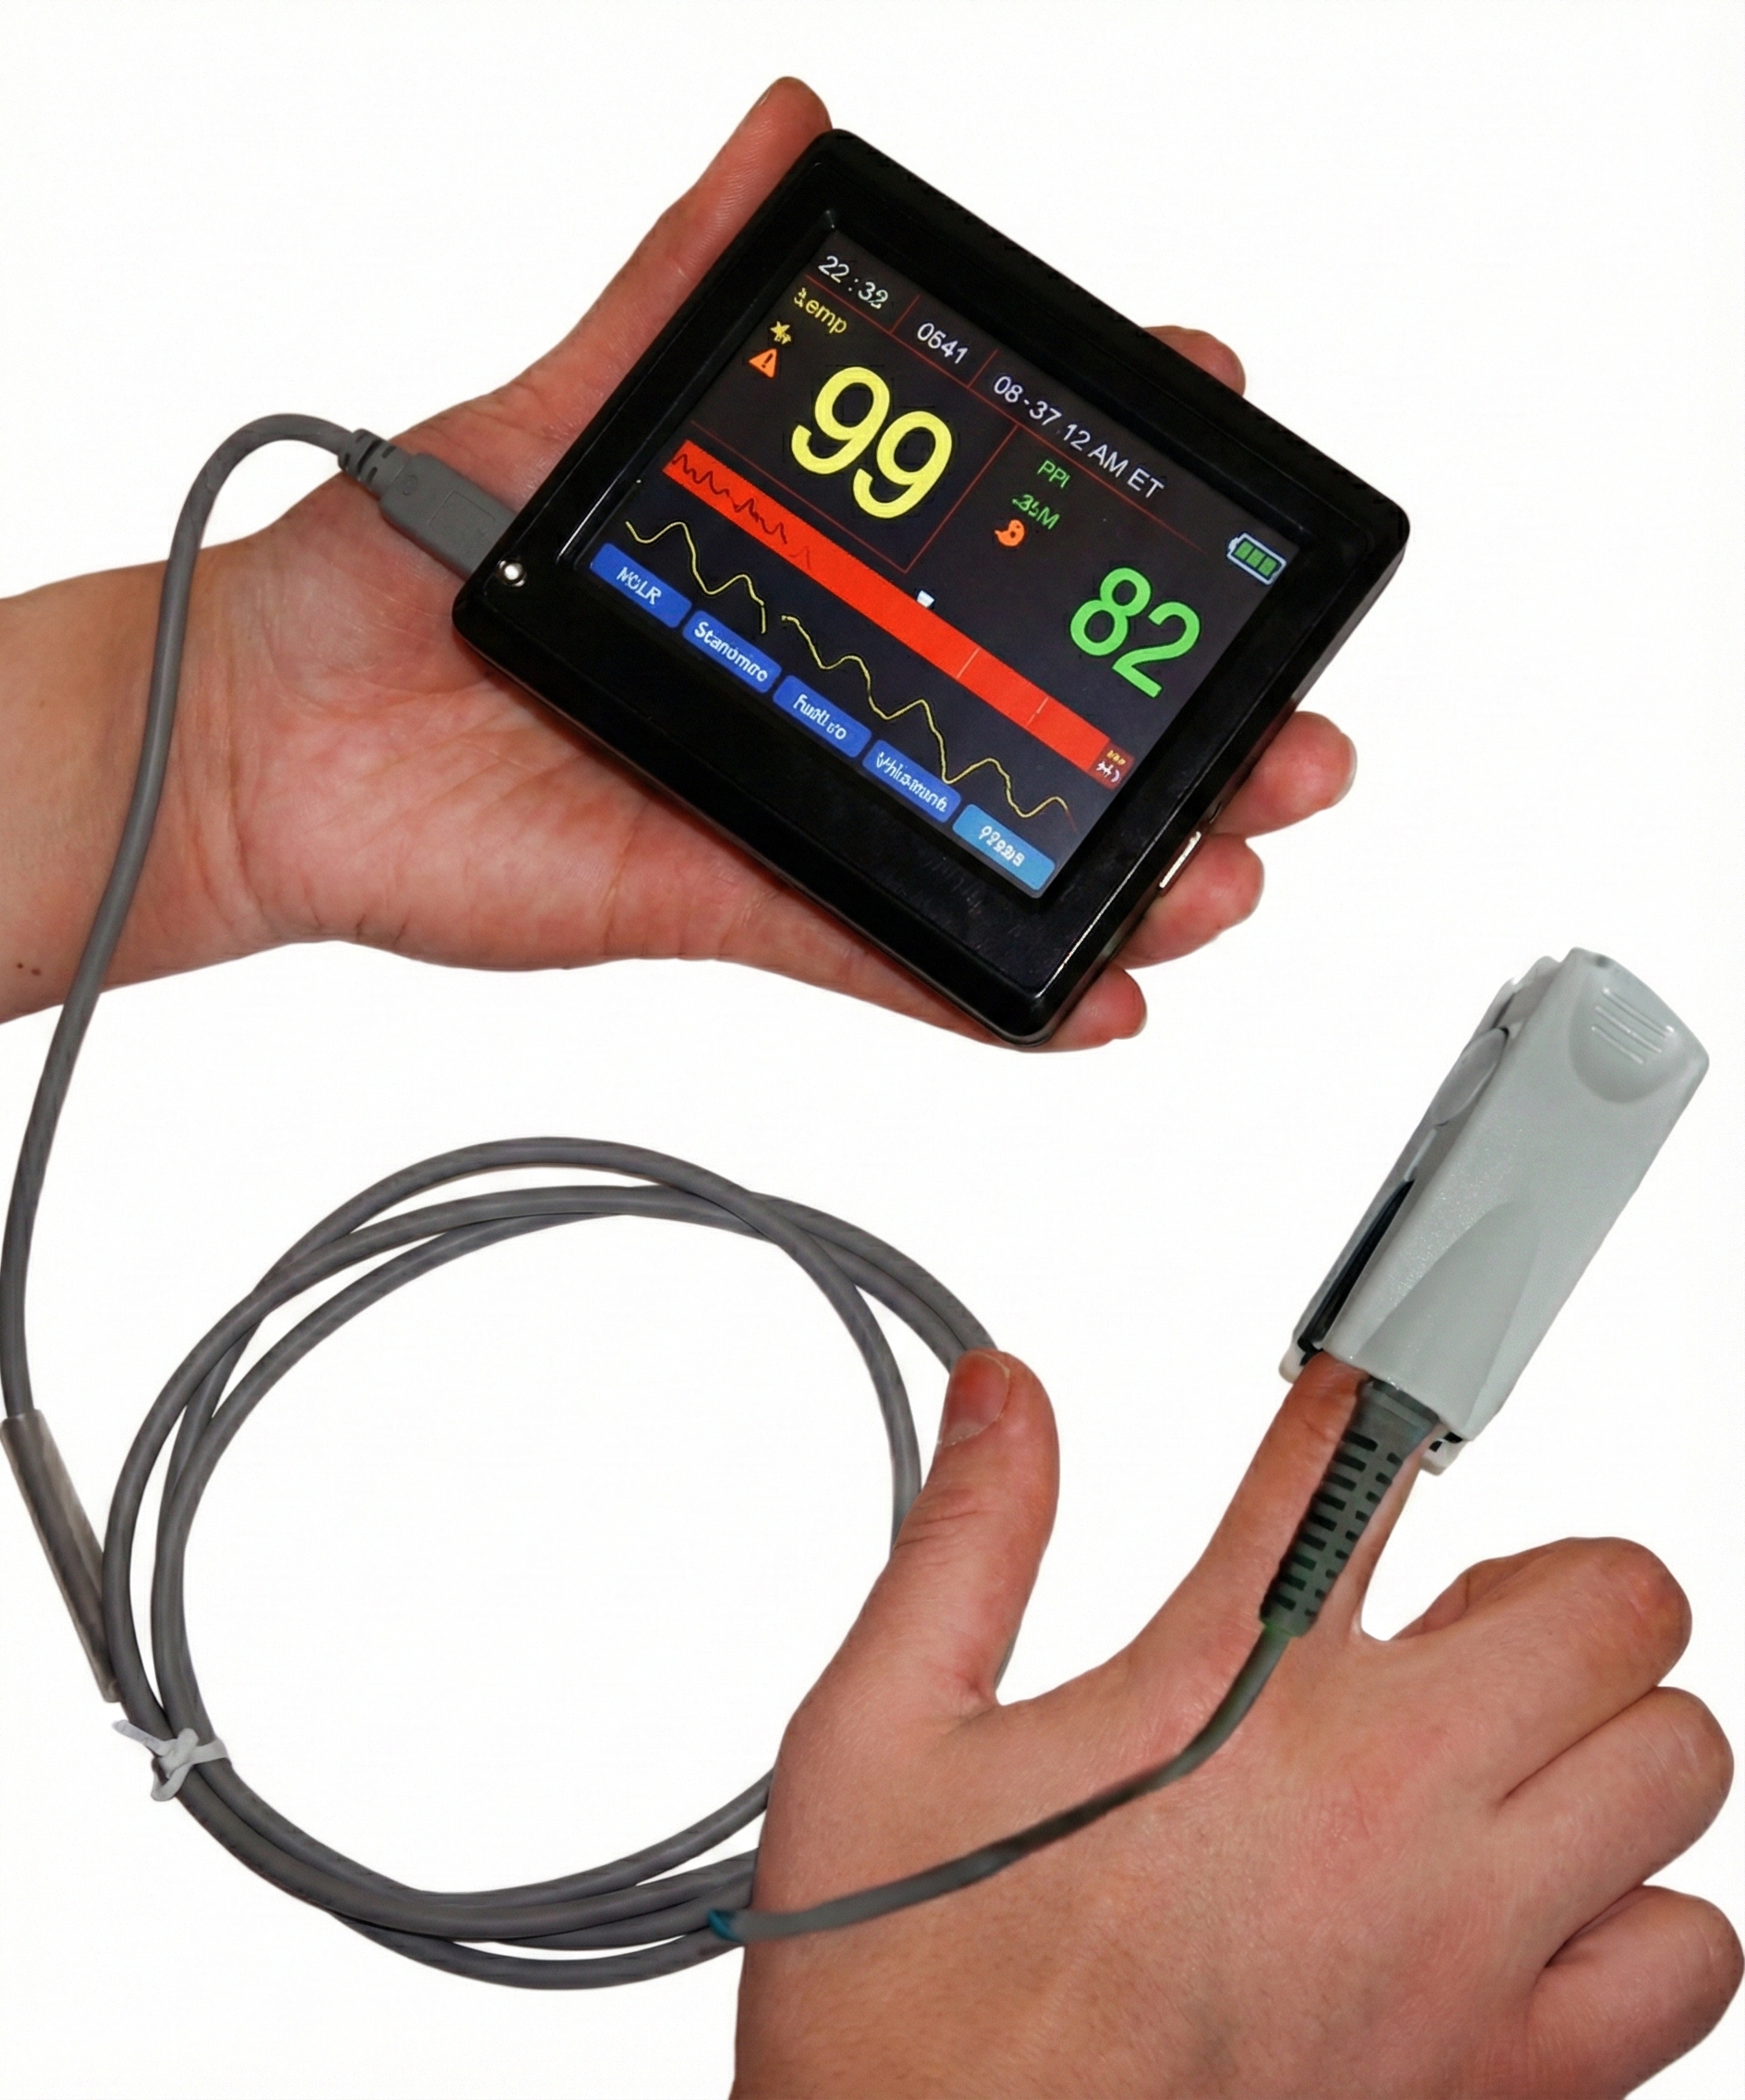
A pulse oximeter utilizes a photoplethysmograph (PPG) sensor to measure blood oxygen saturation from a finger or earlobe. Oximeters compare the ratio of red and blue wavelengths in the blood to measure hemoglobin oxygen transport. During hyperventilation or overbreathing, oxygen saturation (PaO2) may approach 100%. PaO2 values over 98% signal that less O2 and nitric oxide are available for body tissues (Gilbert, 2019).
Oximetry can reassure clients anxious about suffocating that they are receiving sufficient oxygen. Oximetry can also detect abnormally low saturation (≤ 85%) due to compromised circulation or emphysema (Gilbert, 2019).
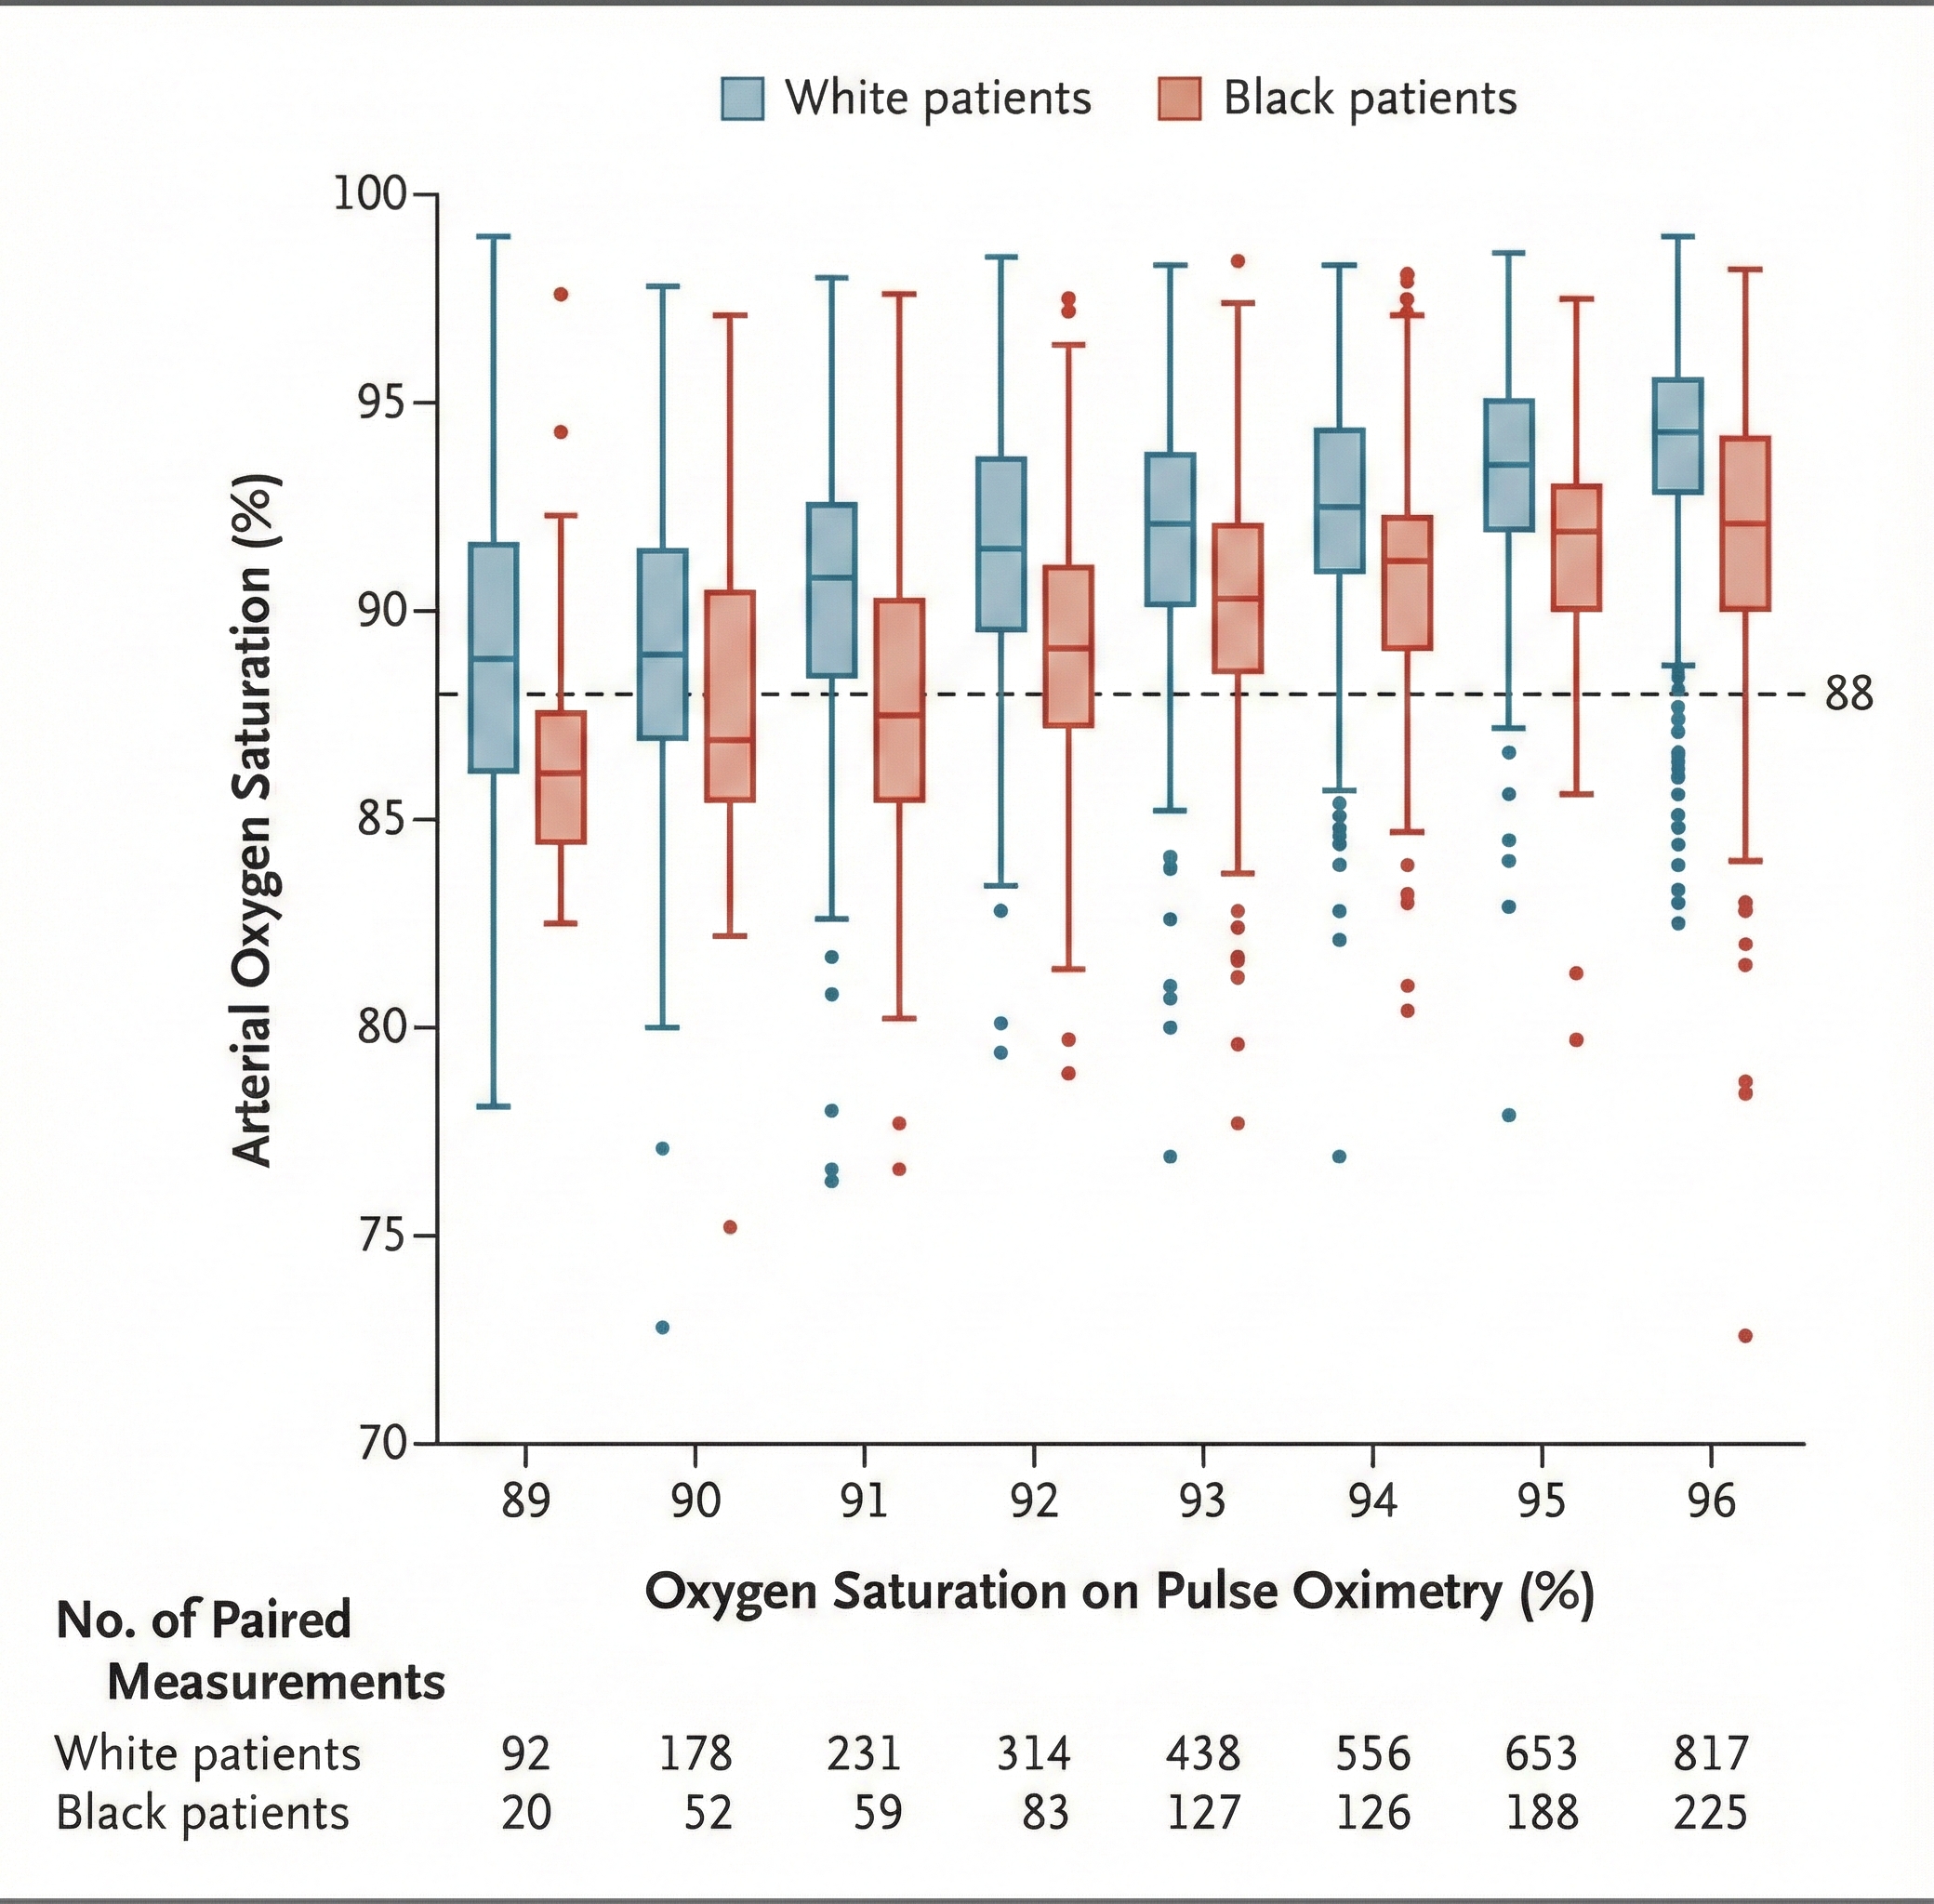
Racial Bias in Pulse Oximetry: A Critical Concern
Physicians use oximetry to identify patients who need supplemental oxygen. Since this technology was developed using a racially non-diverse population, it should not be surprising that occult hypoxemia (undetected blood oxygen levels below 88%) was three times more likely in Black than White patients in two large cohorts.

The COVID-19 pandemic exacerbated this problem since this racial bias may increase Black patients' risk of hypoxemia and denial of supplemental oxygen. These findings imply that oximetry measurements exaggerate Black arterial oxygen saturation. Researchers should develop race-appropriate norms and address racial bias in other technology used in diagnosis and decision-making (Sjoding et al., 2020).
Oximetry Artifacts
Finger vasoconstriction due to cold exposure or sympathetic activation can prevent accurate measurement. Review the unit on Cardiovascular Instrumentation for possible solutions. Excessive variability in the time between heartbeats can also compromise oximeter measurements due to irregular pulse pressure (Gilbert, 2019).
Normal Values for Oxygen Saturation
A range of 95%-98% is ideal. Levels below 90% may indicate dysfunctional breathing or life-threatening medical conditions like emphysema (Gilbert, 2012).
Pulse oximetry provides valuable information about blood oxygen levels and can reassure anxious clients. However, clinicians must be aware of the significant racial bias in oximeter readings, which can underestimate hypoxemia in Black patients by approximately 3 percentage points. Cold fingers and irregular heart rhythms can also compromise accuracy.
Check Your Understanding
- Why might a pulse oximeter reading of 100% actually indicate a problem rather than optimal oxygenation?
- How does racial bias in pulse oximetry affect clinical decision-making, and what should clinicians do about it?
- What physiological factors can cause inaccurate pulse oximetry readings?
- When would oximetry be particularly useful for reassuring an anxious client during breathing training?
Capnometry: The Gold Standard for Detecting Overbreathing
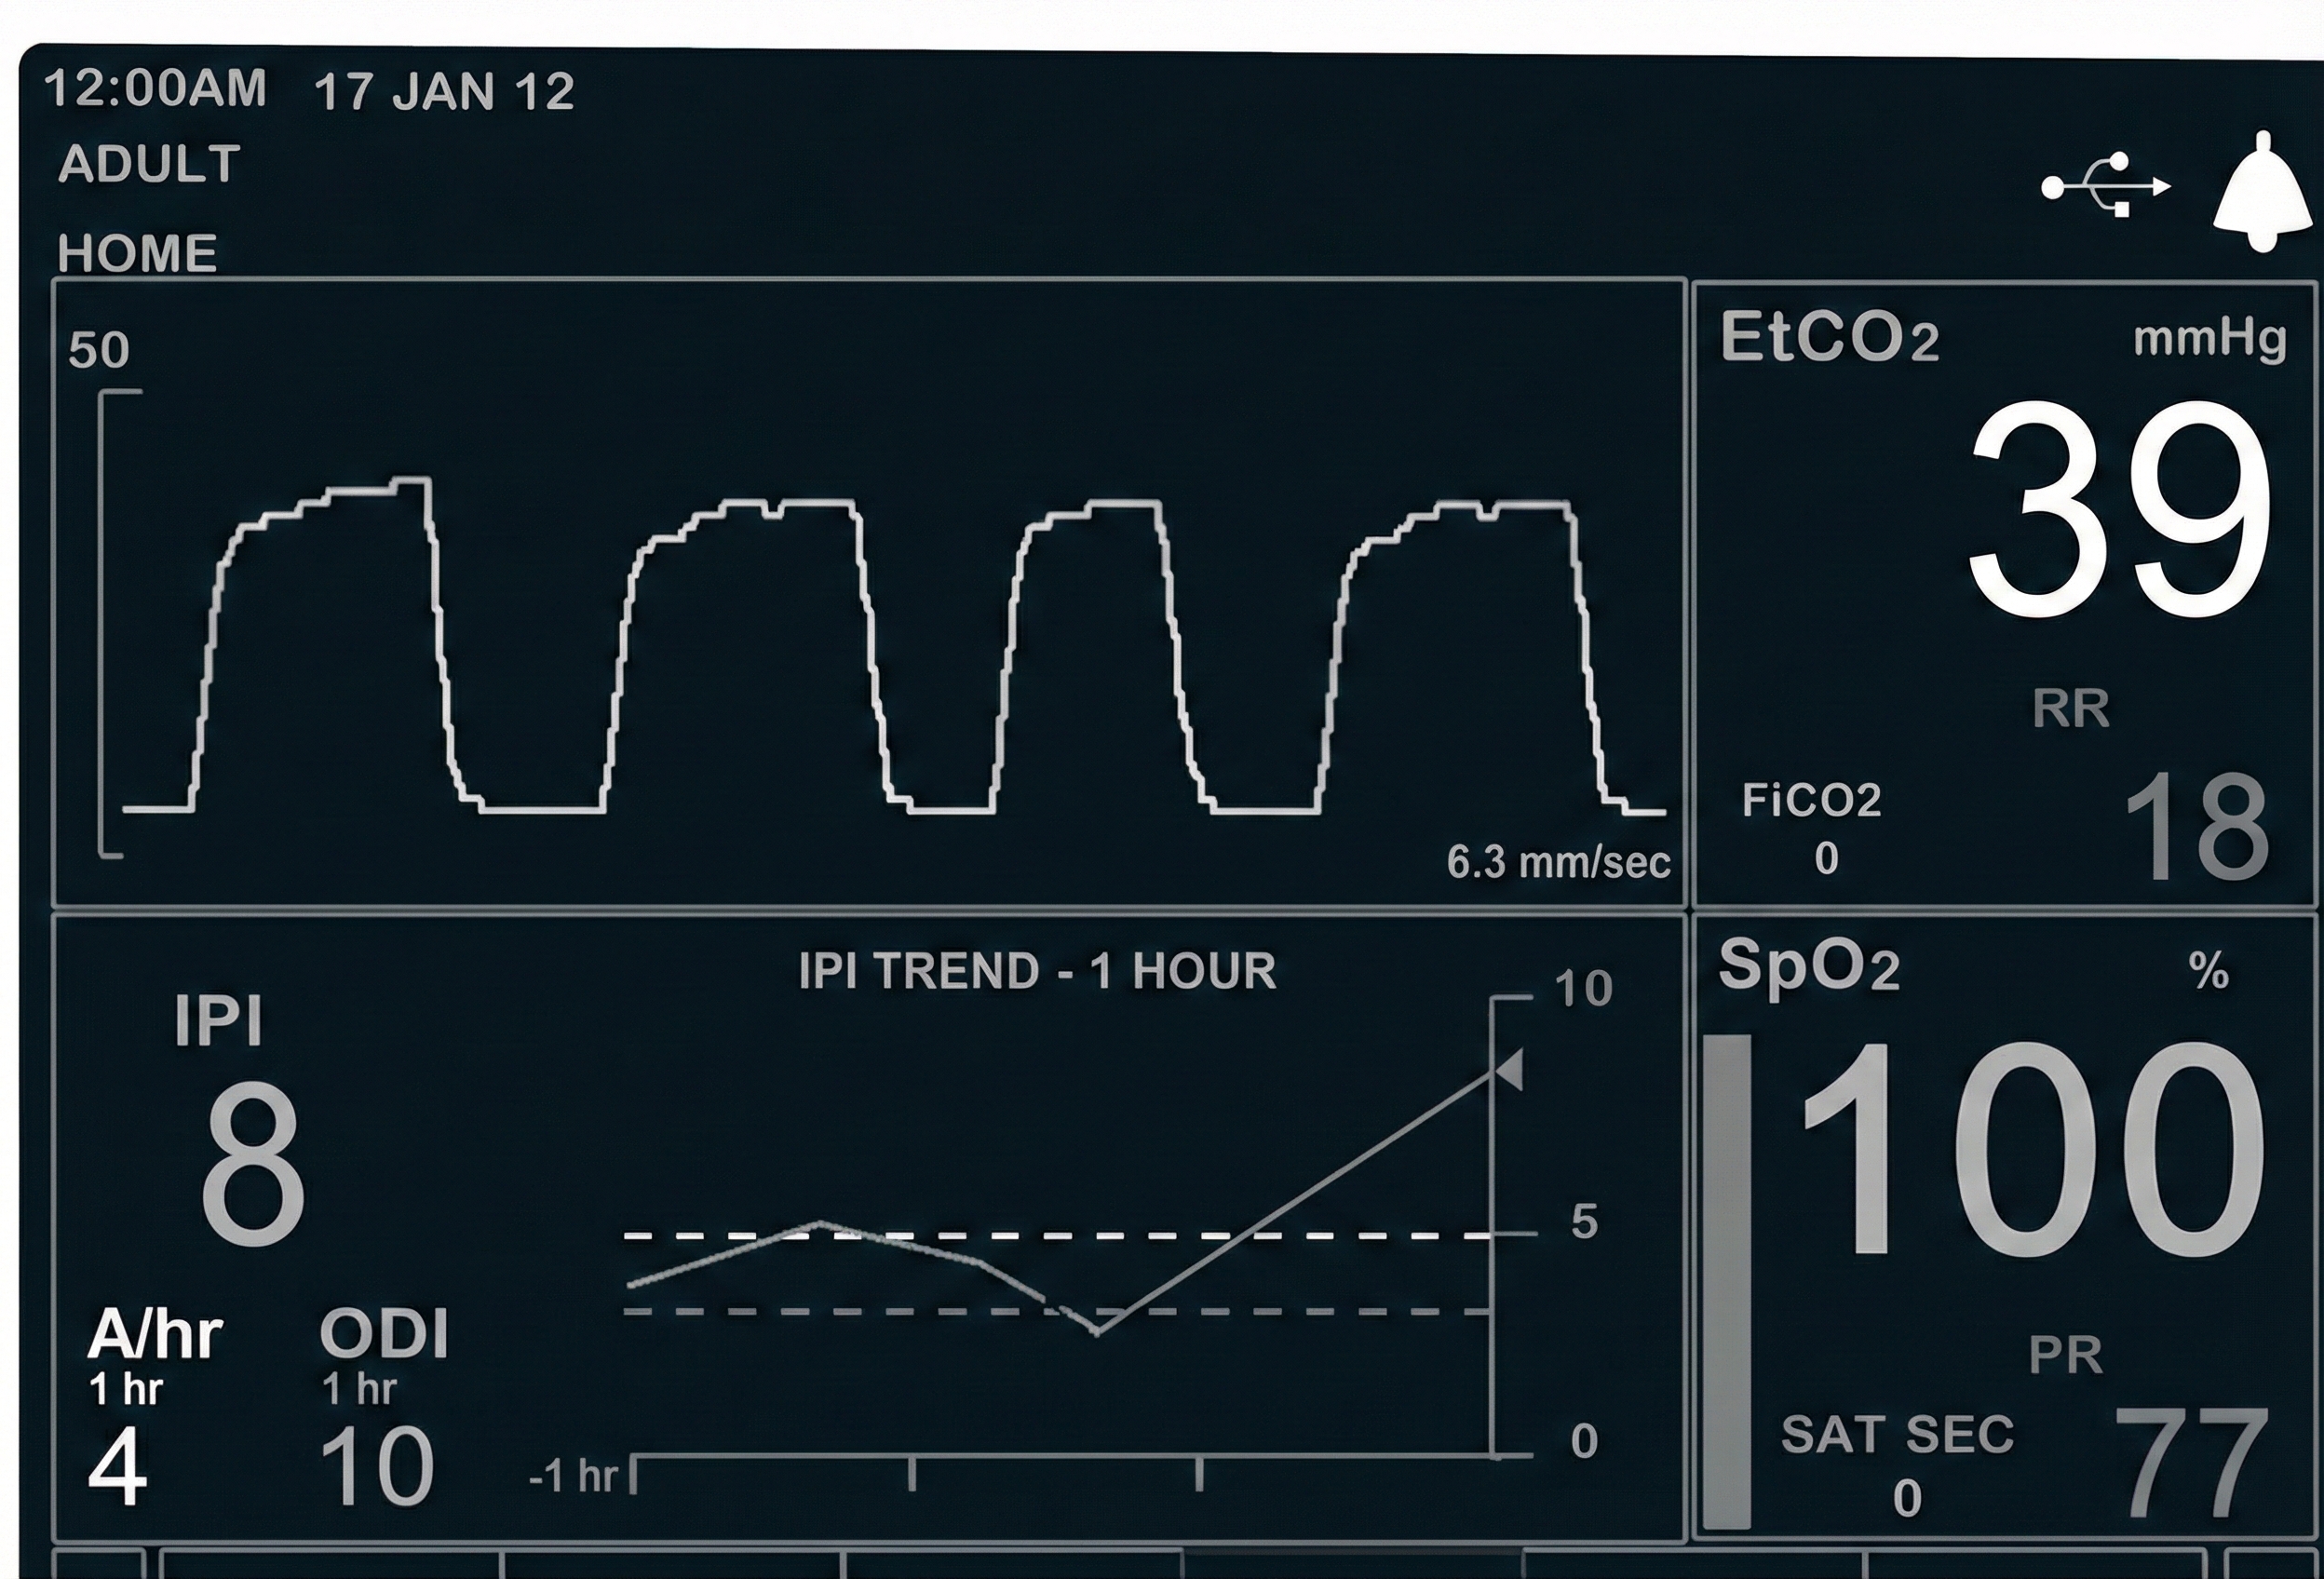
A capnometer monitors end-tidal CO2, the percentage of CO2 in exhaled air at the end of exhalation.
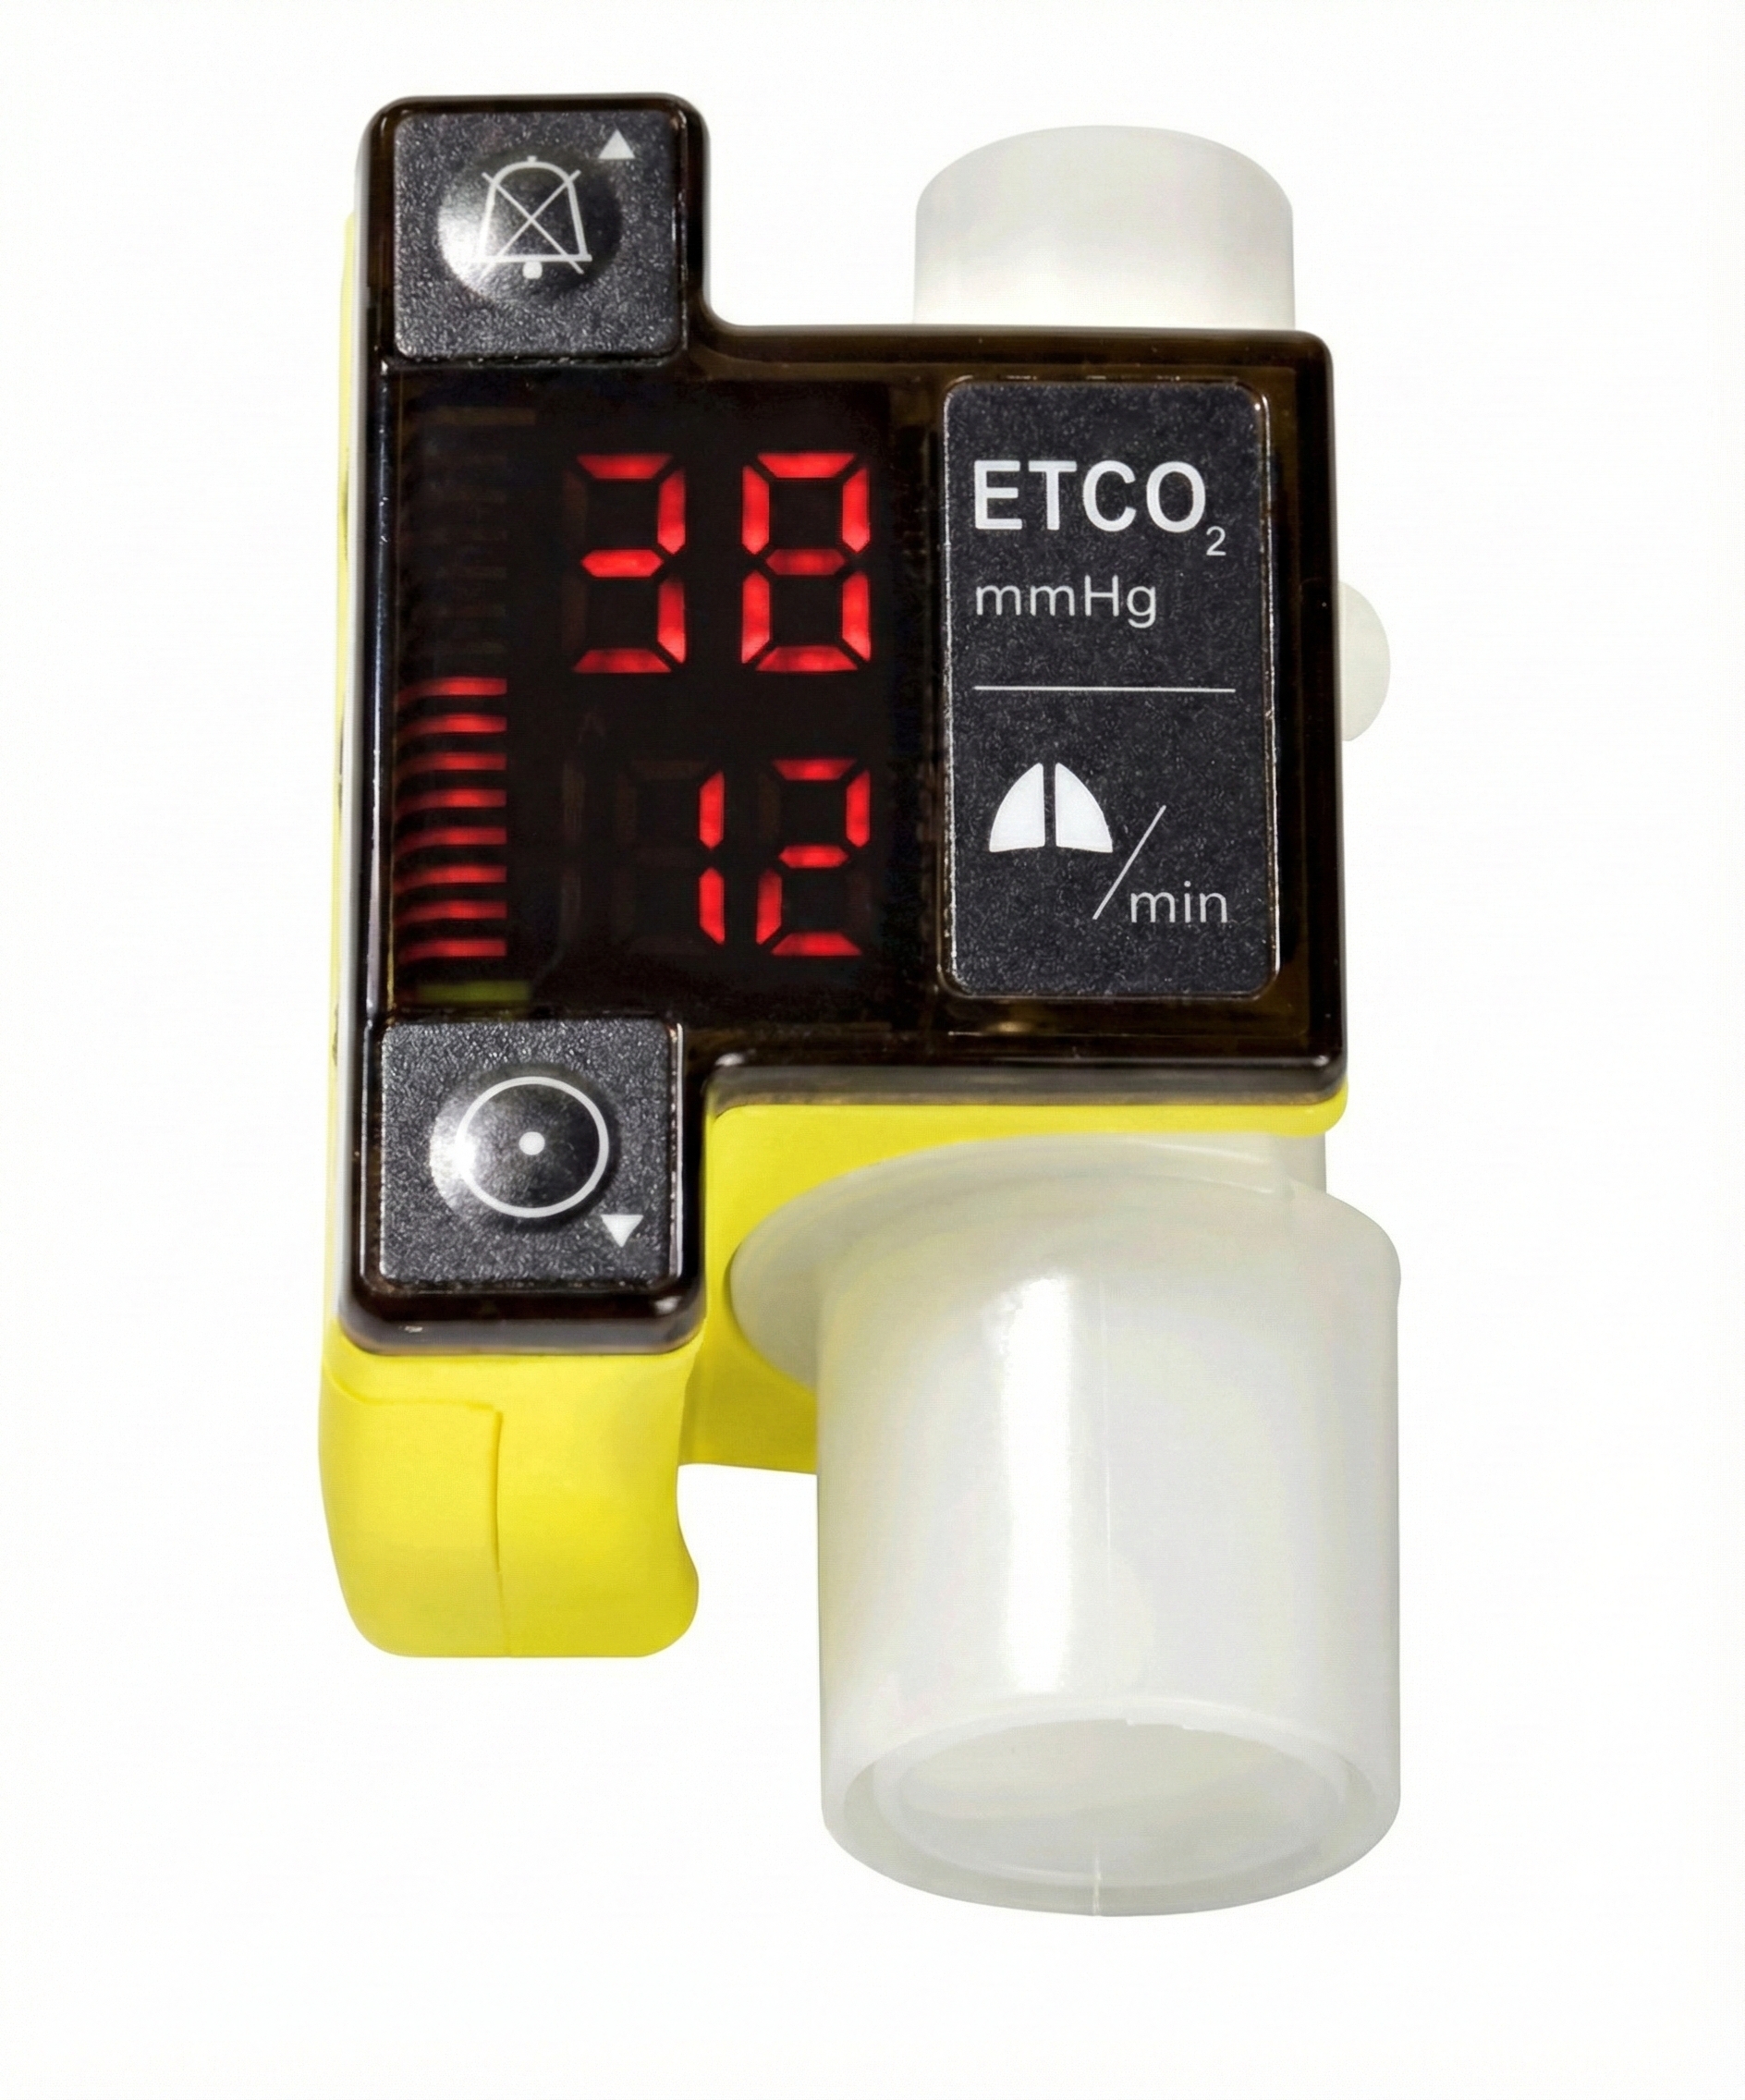
A capnometer draws exhaled air into its gas composition analysis unit to calculate the percentage of CO2 in each sample.
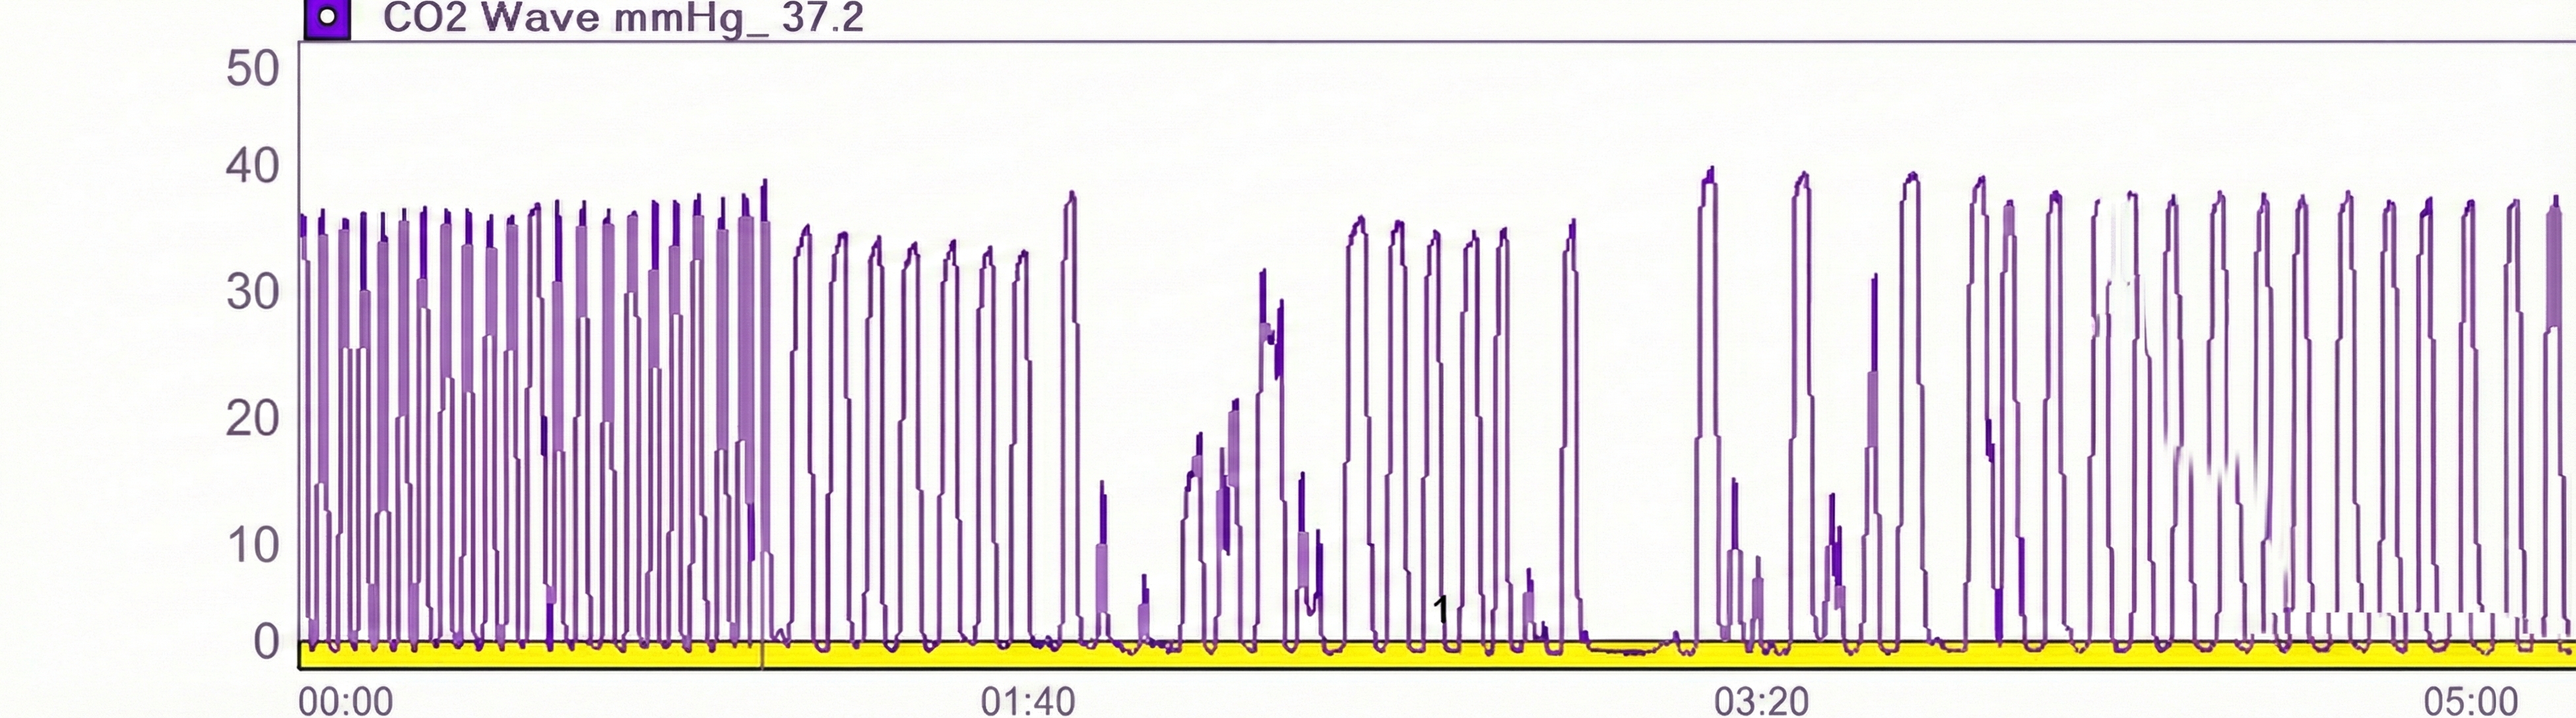
Capnometer Artifacts
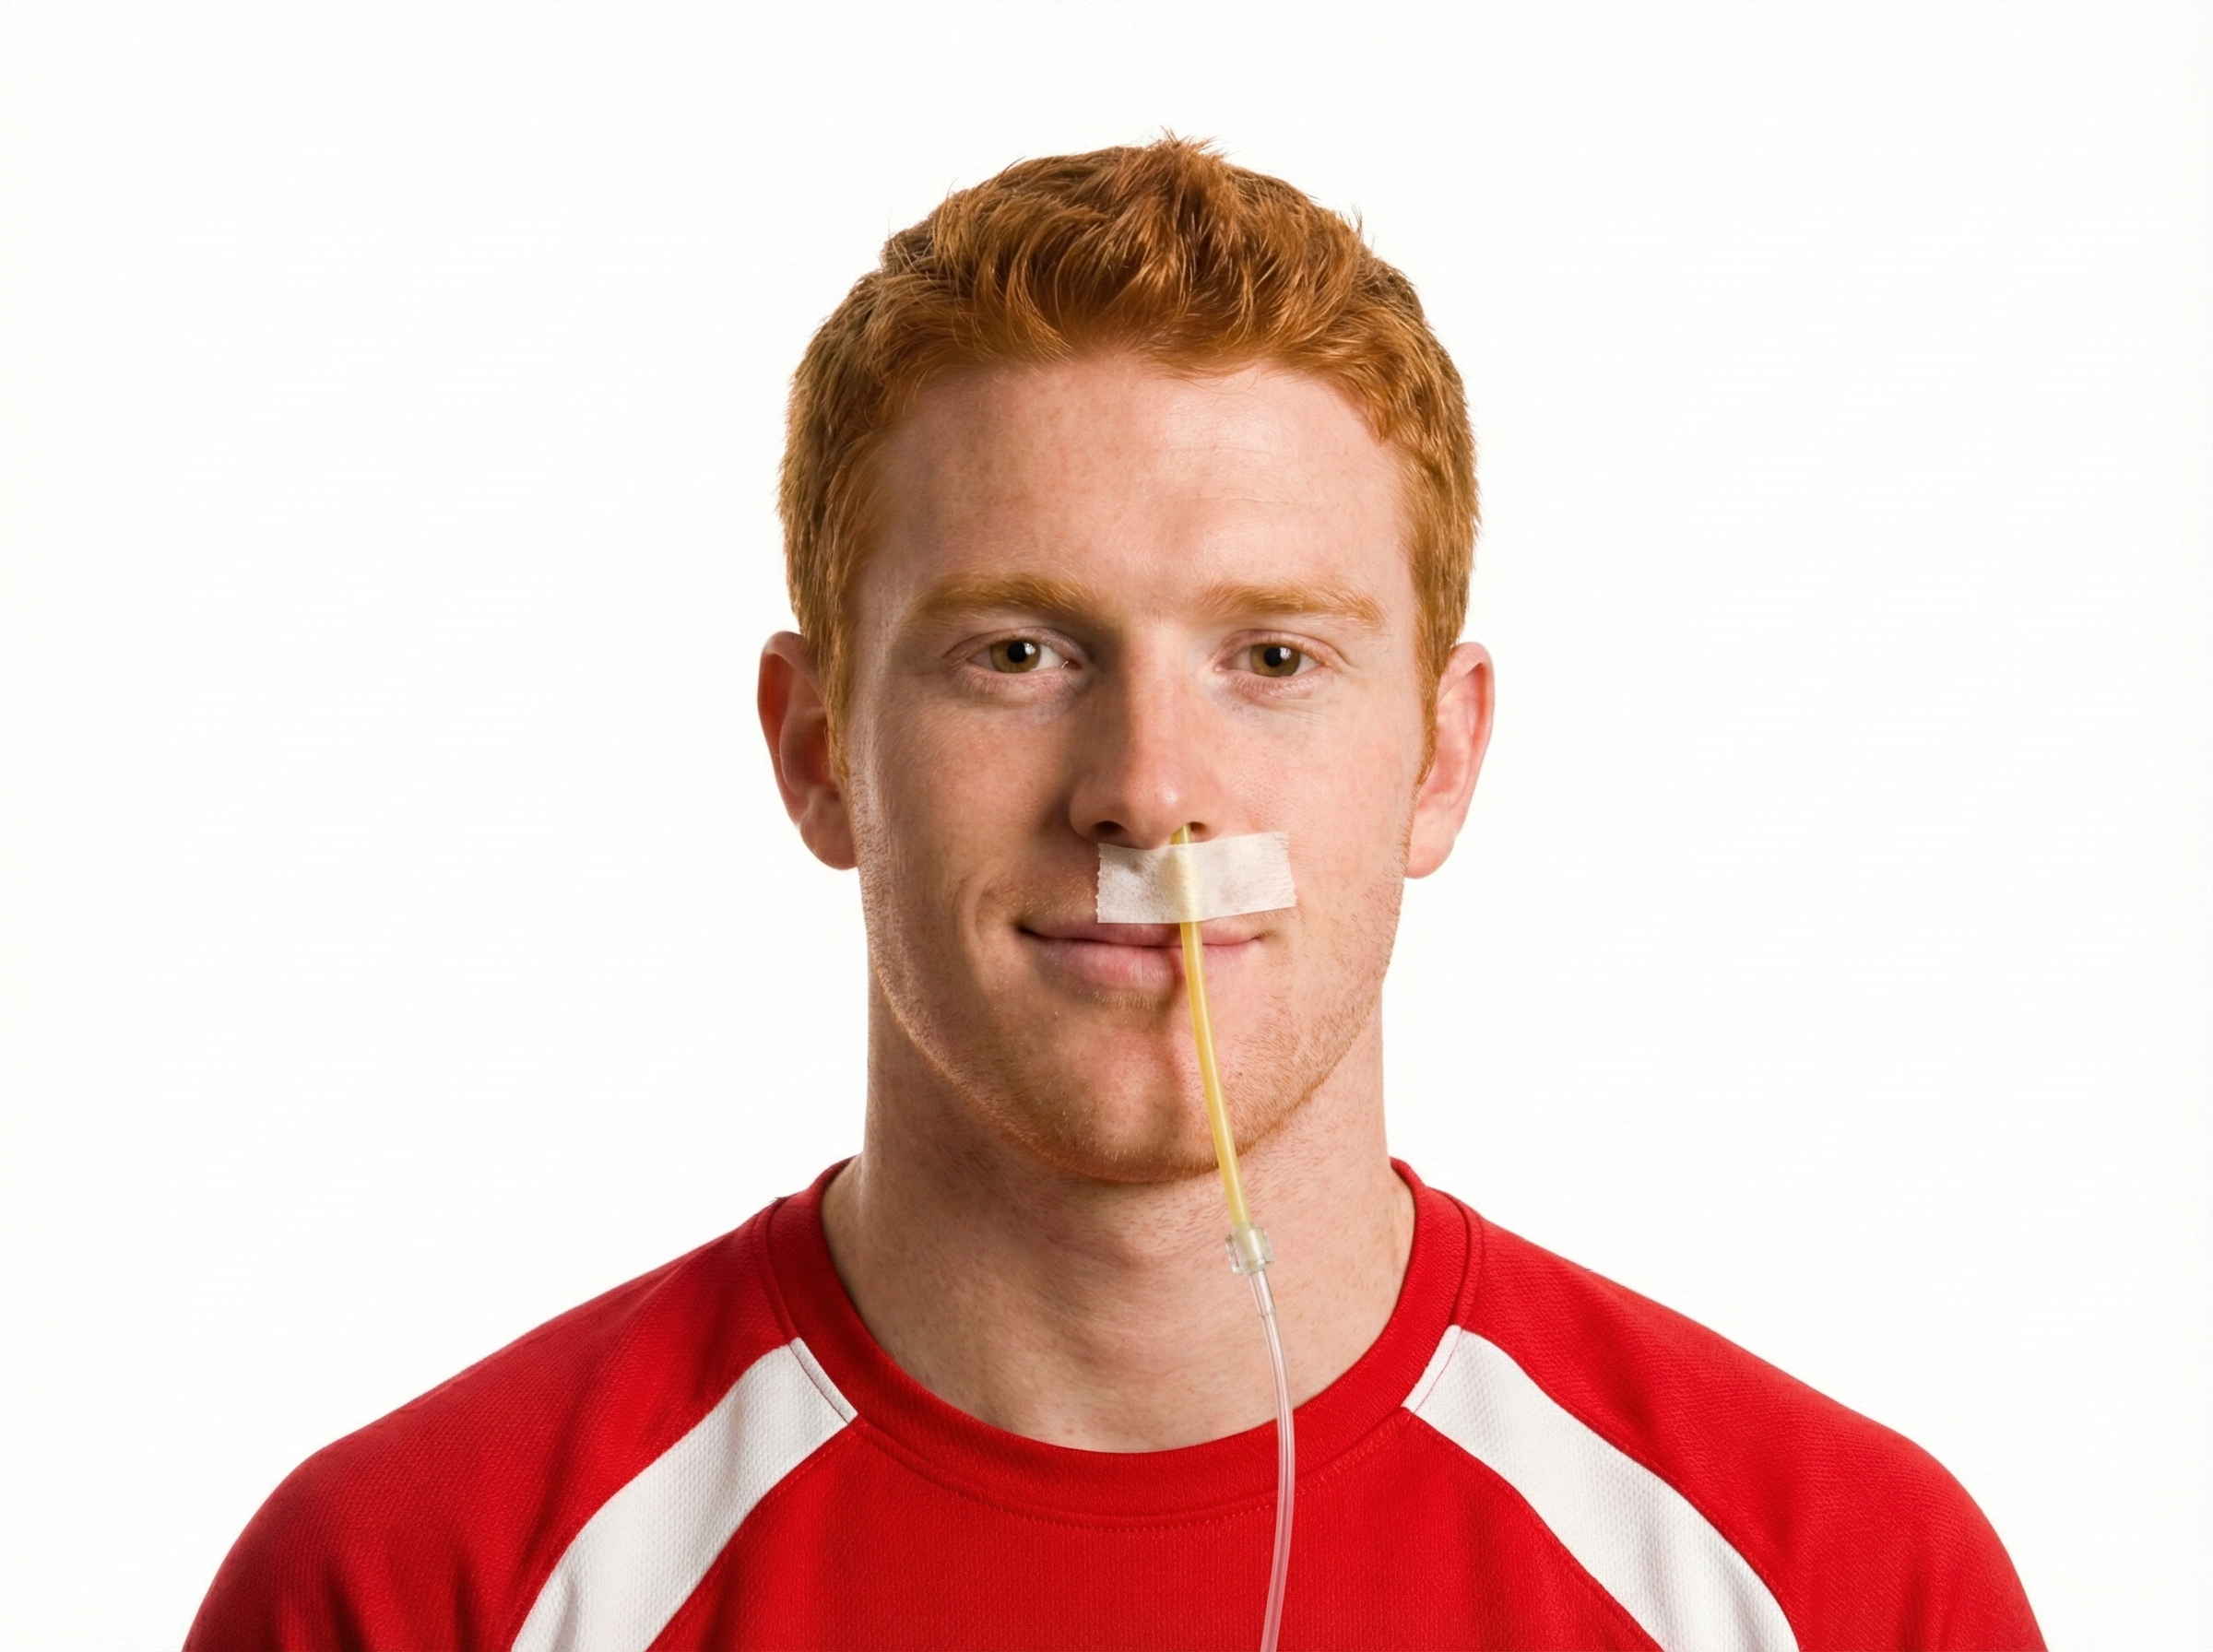
Check the raw waveform for false readings due to nasal cannula obstruction or withdrawal from the nostril, or a shift to mouth breathing.
When using a nasal cannula, a capnometer requires exhalation through the nose to collect a valid sample (Gilbert, 2019).
The Tracking Test for Capnometry
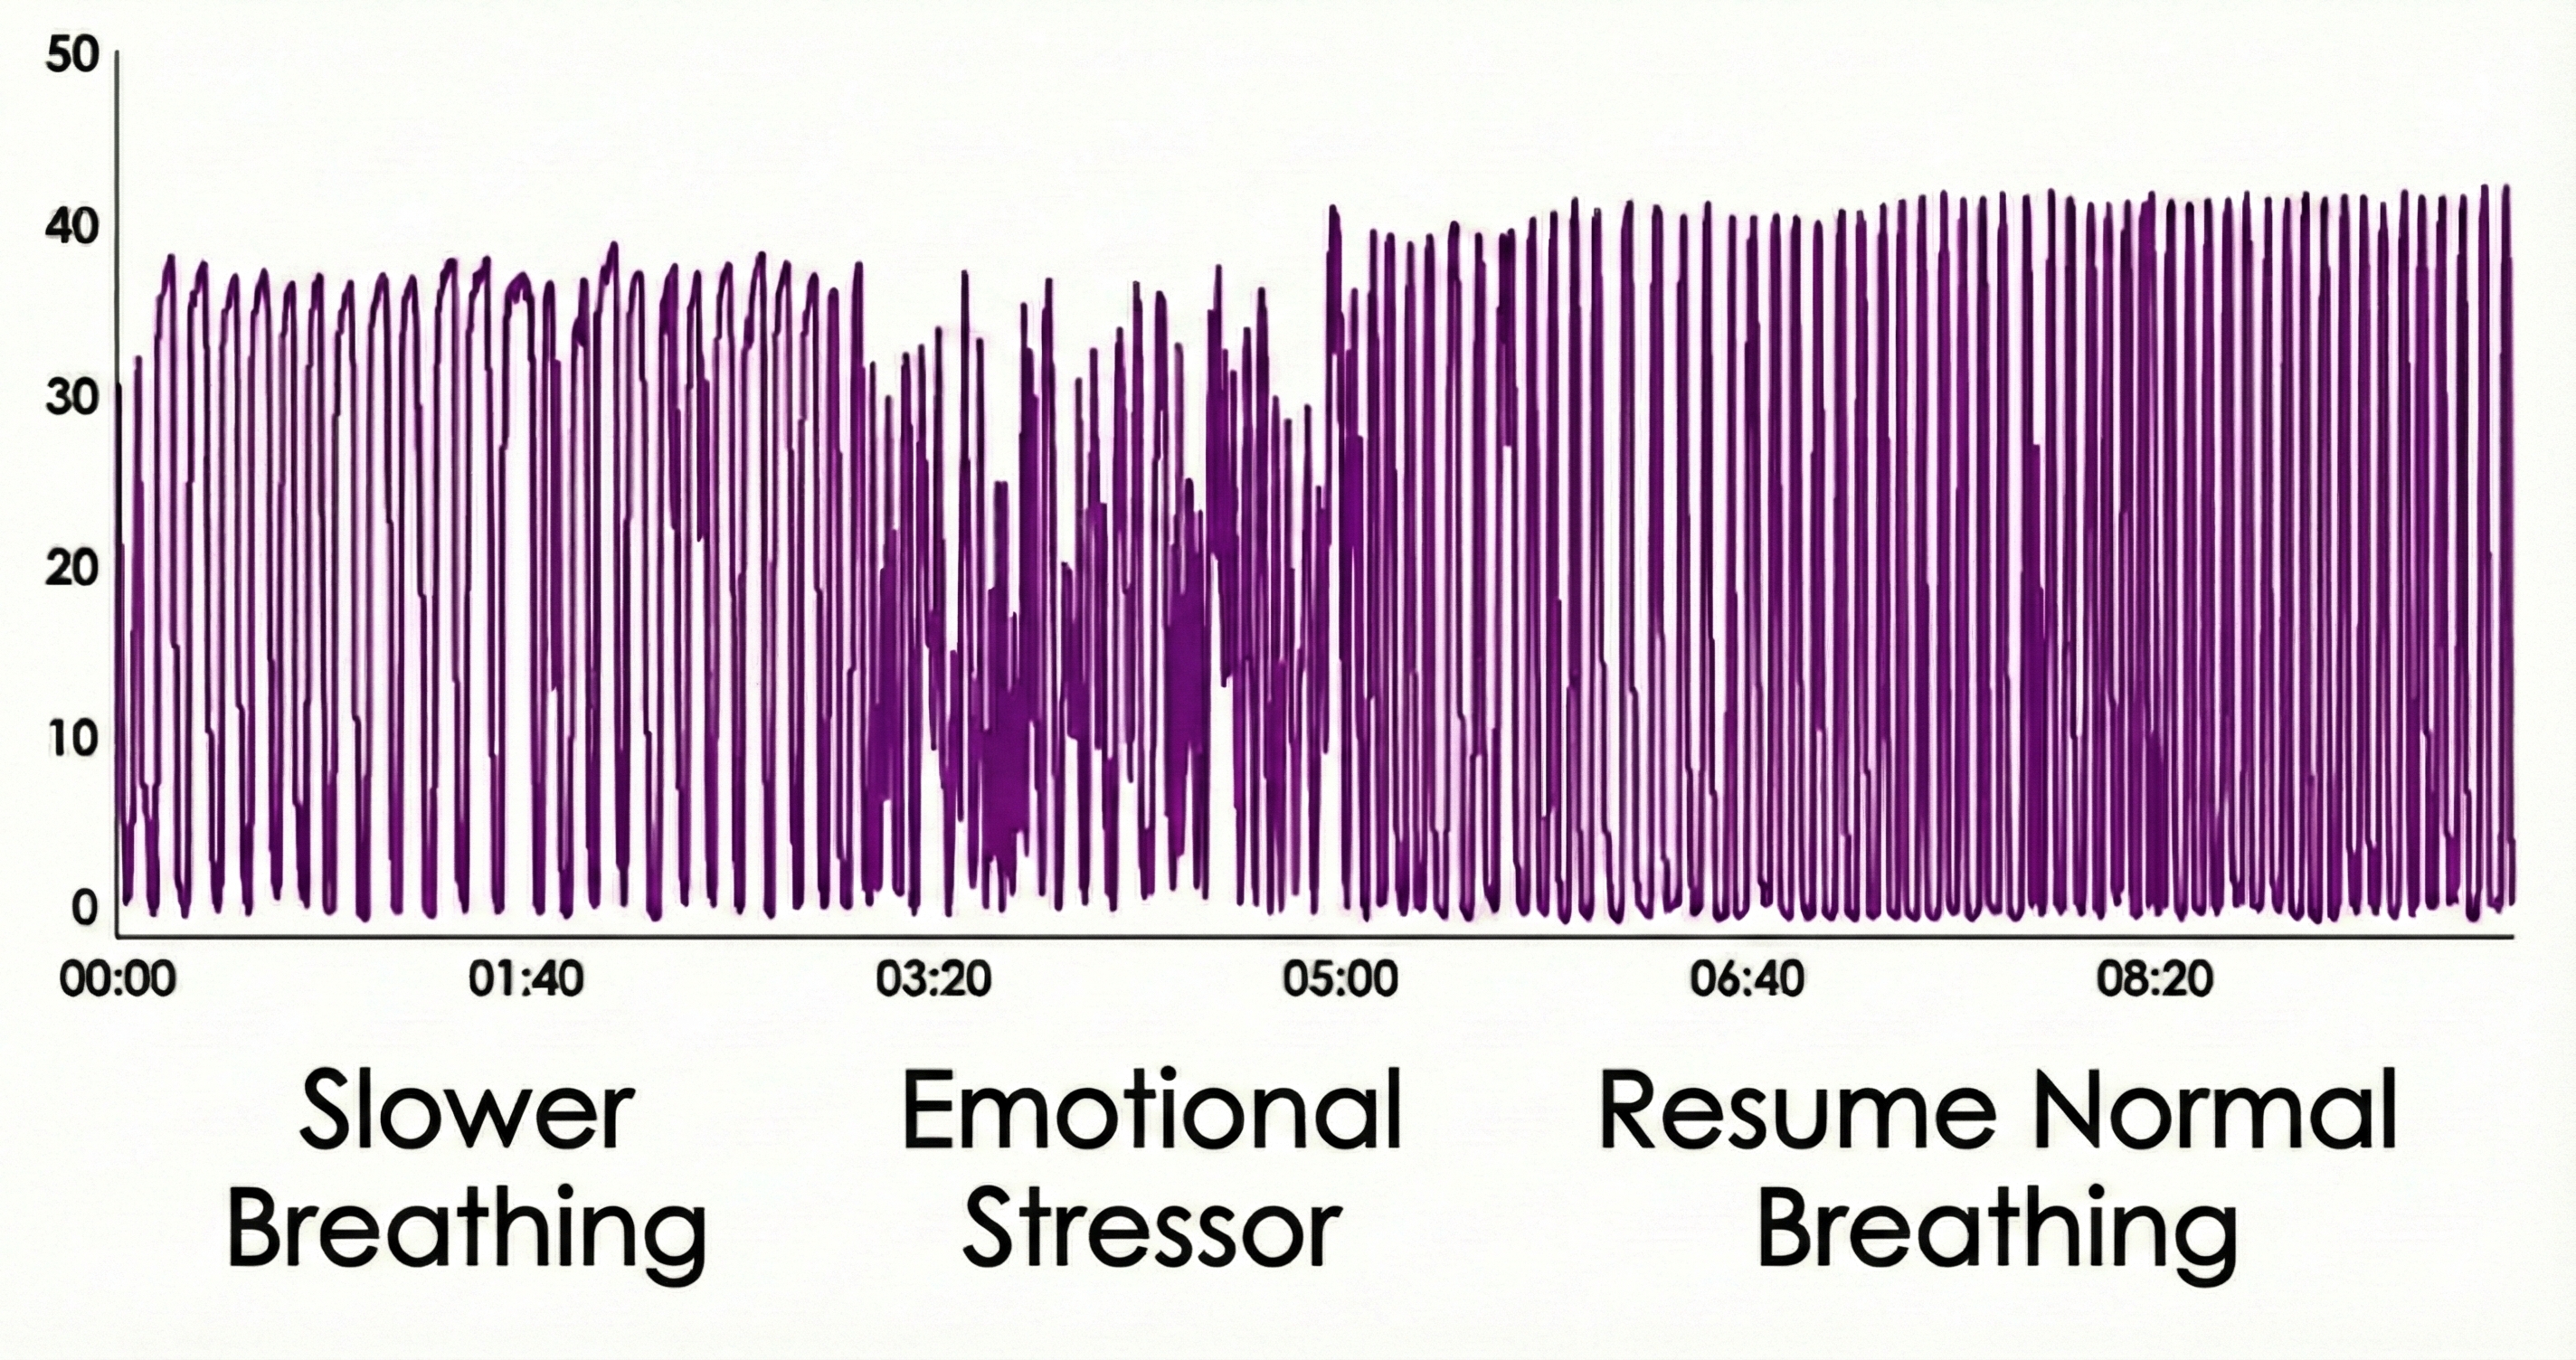
Using math or a mild emotional stressor, you can determine whether a capnometer display mirrors your client's respiratory activity. This maneuver can markedly decrease end-tidal CO2.
Normal Values for End-Tidal CO2
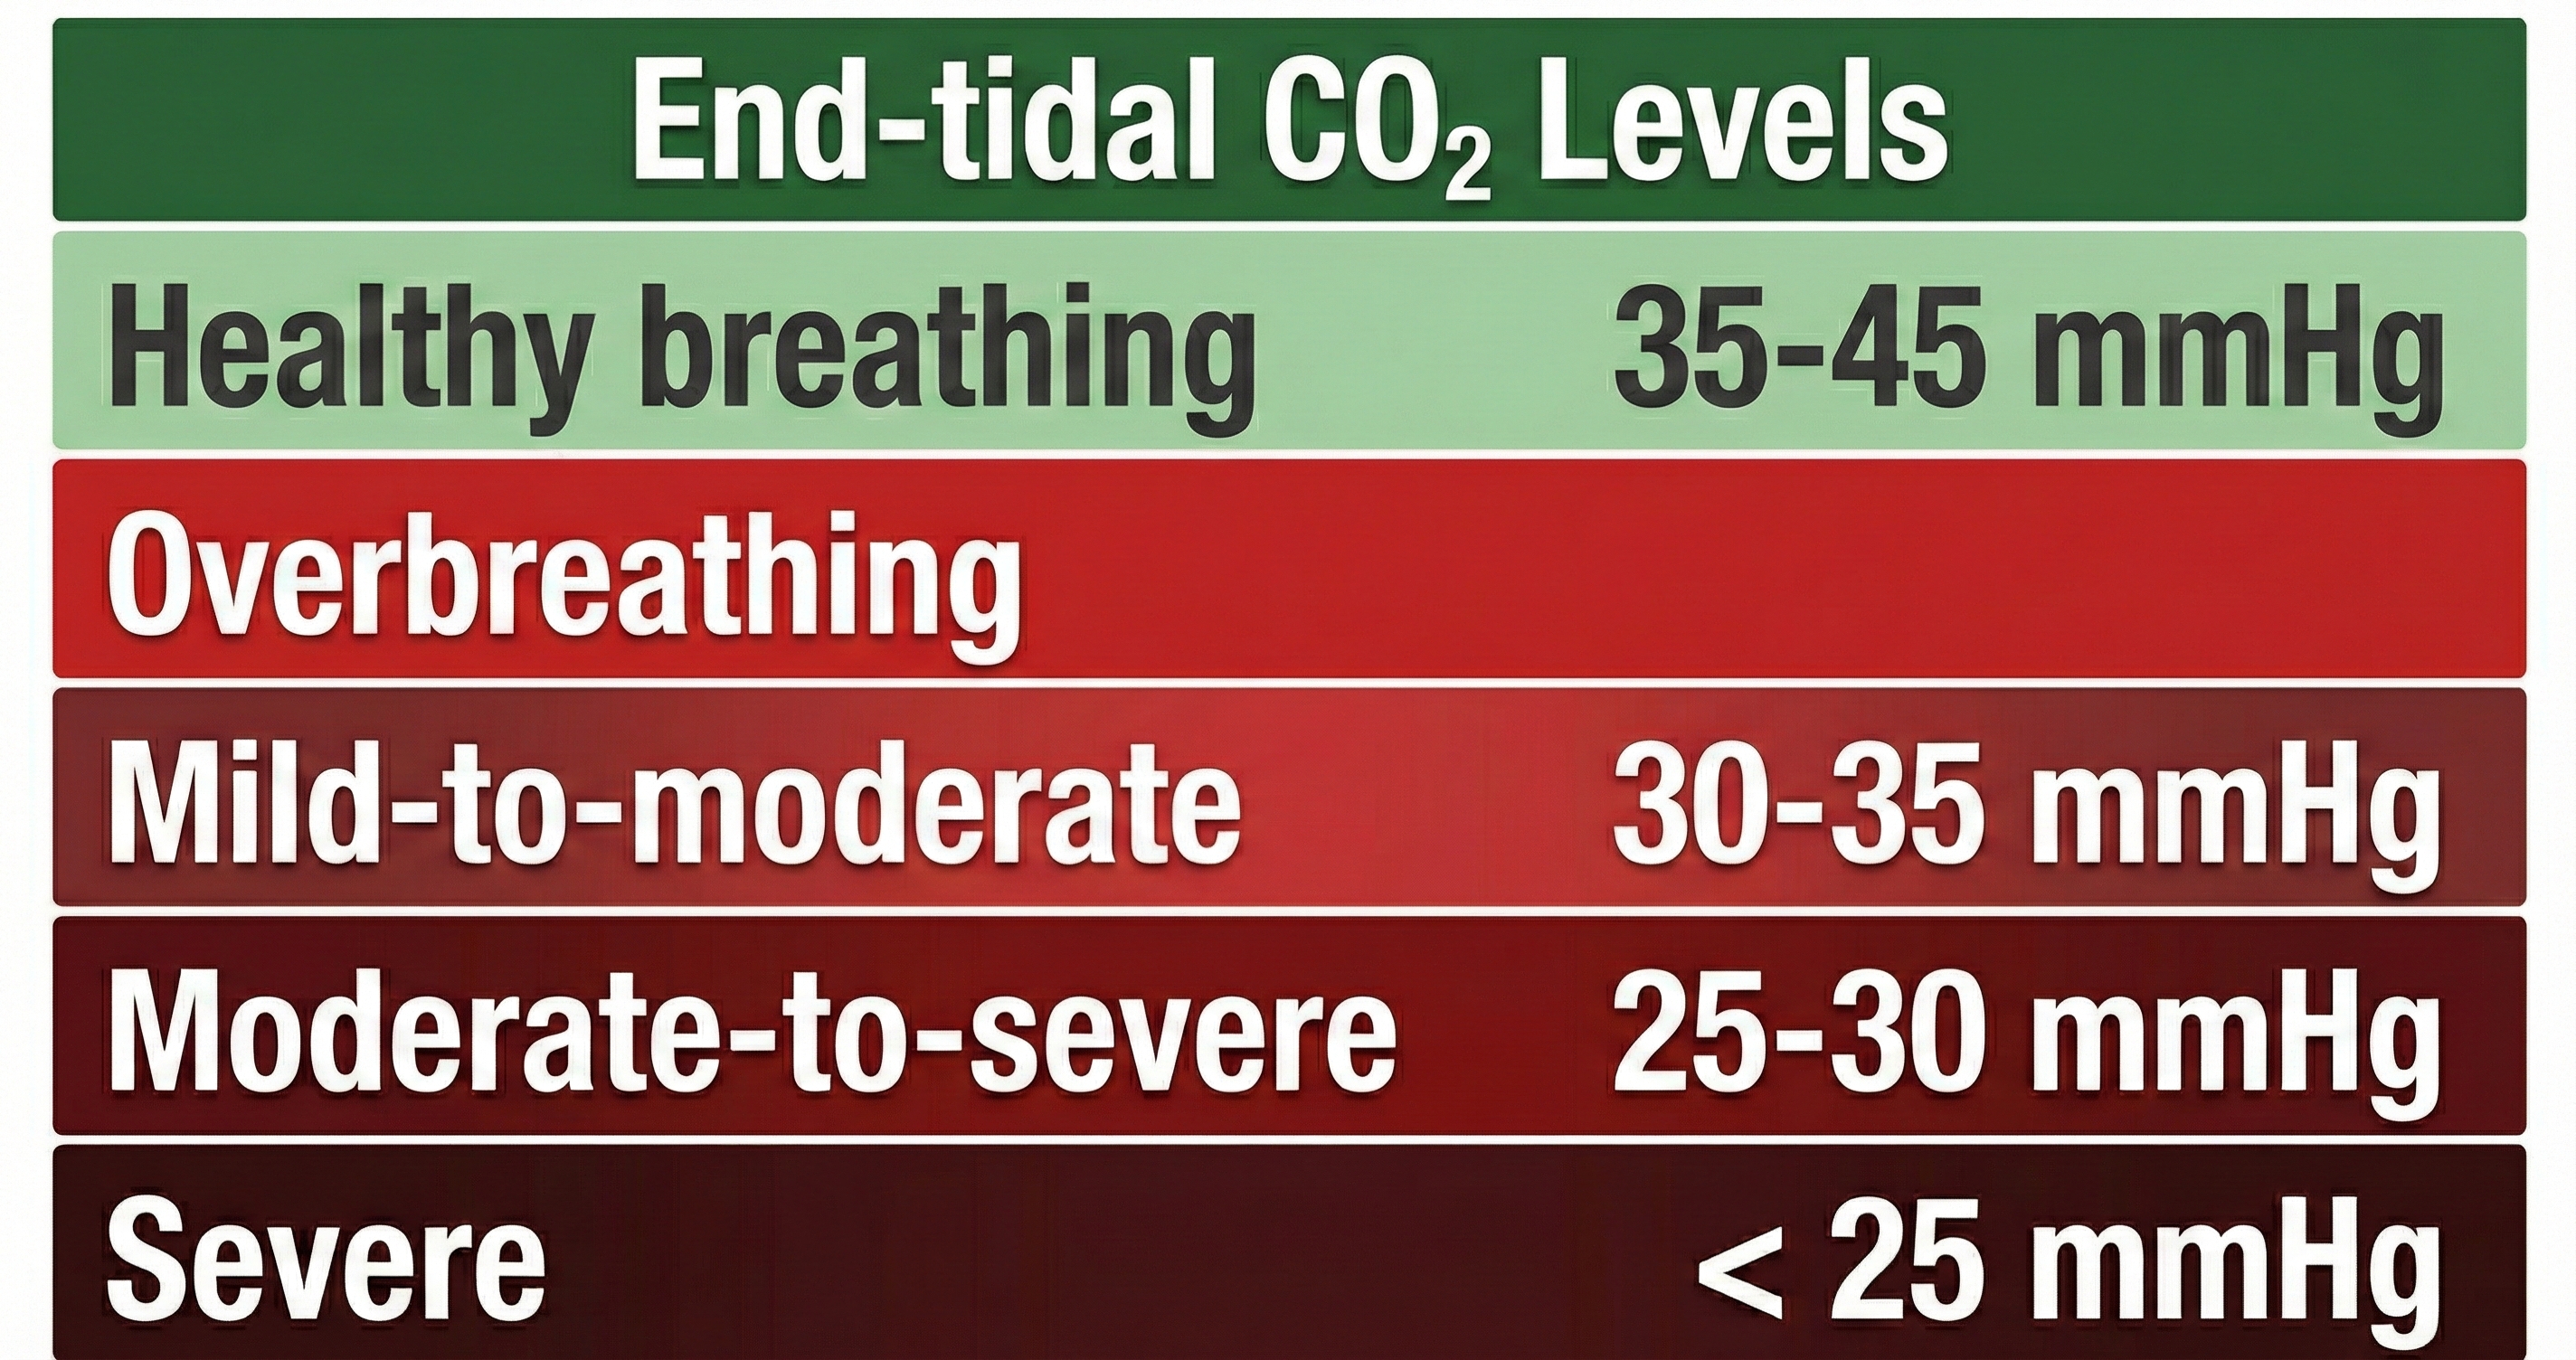
A reading of 36 mmHg corresponds to about 5% CO2 in exhaled air. Resting end-tidal CO2 values between 35-45 mmHg are normal, 30-35 mmHg indicate mild-to-moderate overbreathing, 25-30 mmHg show moderate-to-severe overbreathing, and below 25 mmHg signal severe overbreathing (Khazan, 2013, pp. 46, 80).
Sarah, a 28-year-old graduate student, came to your office with complaints of dizziness, tingling in her hands, and difficulty concentrating during exams. Her respirometer showed a normal rate of 14 breaths per minute with smooth waveforms. However, when you added capnometry to your assessment, you discovered her end-tidal CO2 was only 28 mmHg, well into the moderate-to-severe overbreathing range. Sarah was taking quick, shallow breaths that looked rhythmic on the respirometer but were washing too much CO2 out of her bloodstream. Without capnometry, this pattern would have been invisible.
Capnometry provides the most direct measure of overbreathing by tracking end-tidal CO2. While respirometry shows the mechanics of breathing and SEMG reveals muscular effort, capnometry answers the critical question: is your client maintaining healthy CO2 levels? Values below 35 mmHg indicate overbreathing that may cause symptoms even when rate and rhythm appear normal.
Check Your Understanding
- Why is capnometry sometimes called the "gold standard" for detecting overbreathing?
- What end-tidal CO2 value would indicate moderate-to-severe overbreathing?
- How does mouth breathing affect capnometry accuracy when using a nasal cannula?
- Why might a client show normal respirometer values while their capnometer reveals overbreathing?
- What is the clinical significance of an emotional stressor causing a sudden drop in end-tidal CO2?
Incentive Inspirometer: Training Deeper Breaths
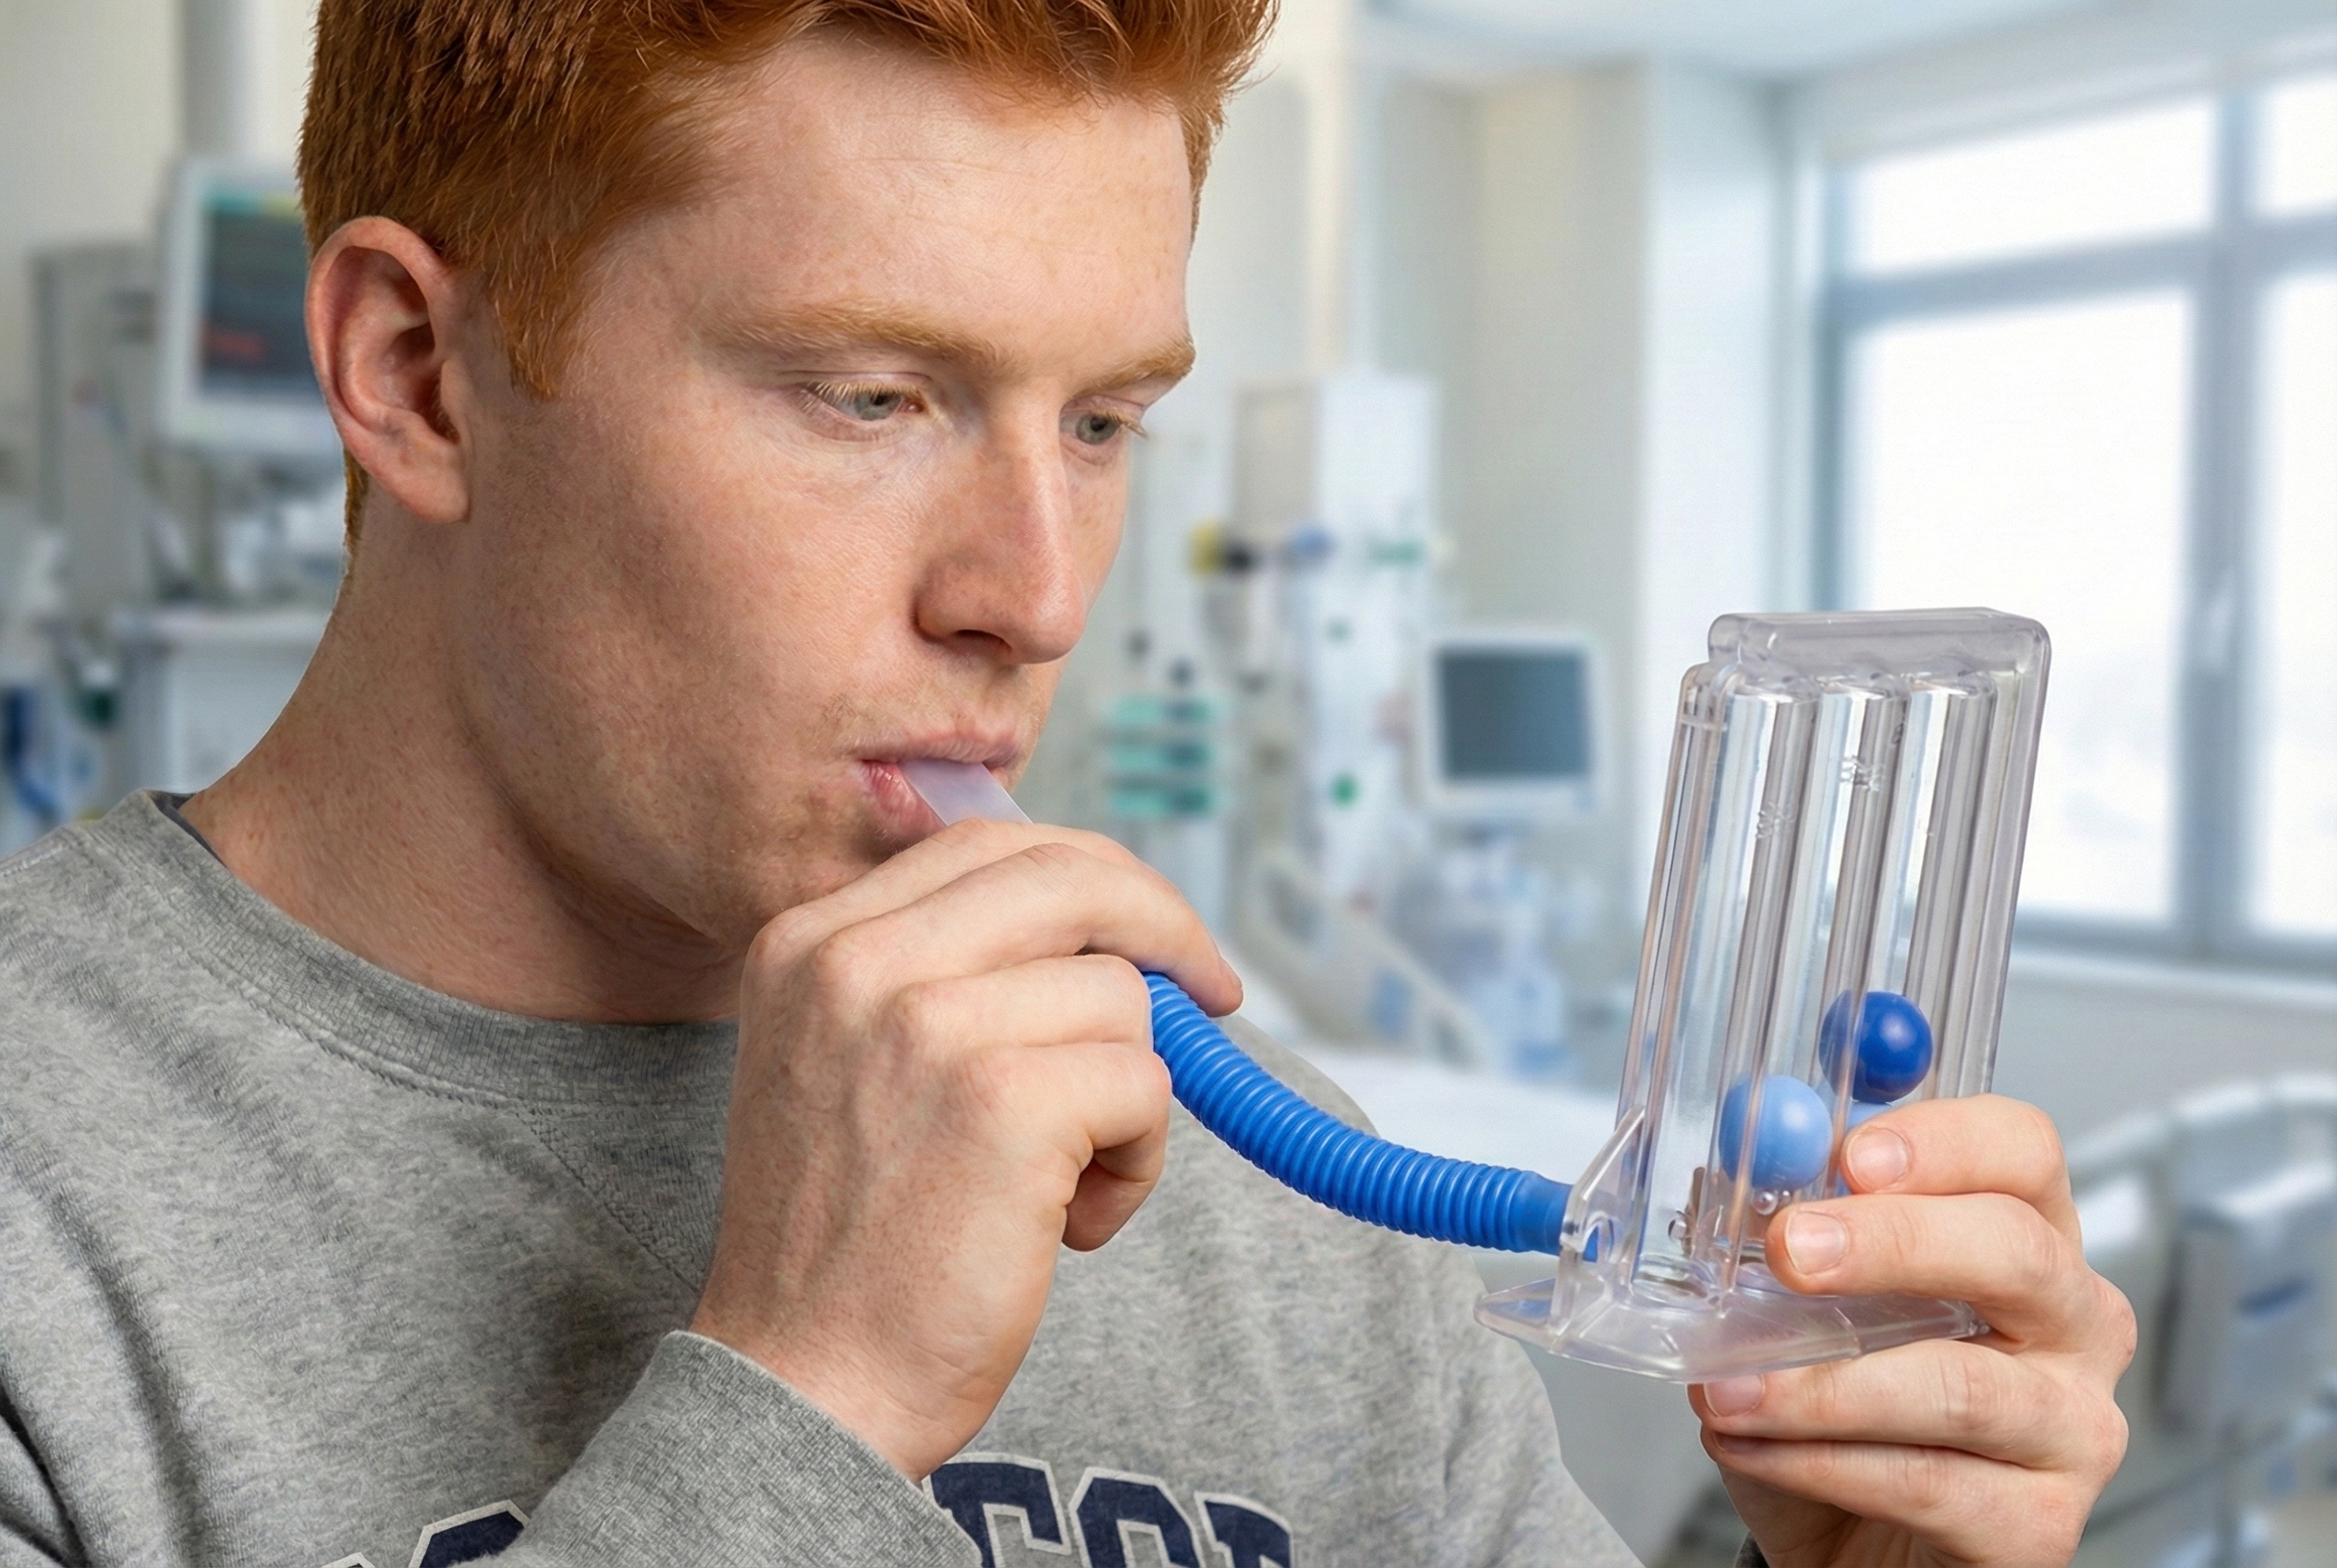
An incentive inspirometer consists of a calibrated cylinder with a piston that moves upward as the patient inhales and indicates the volume of air inhaled in a single breath (the incentive).
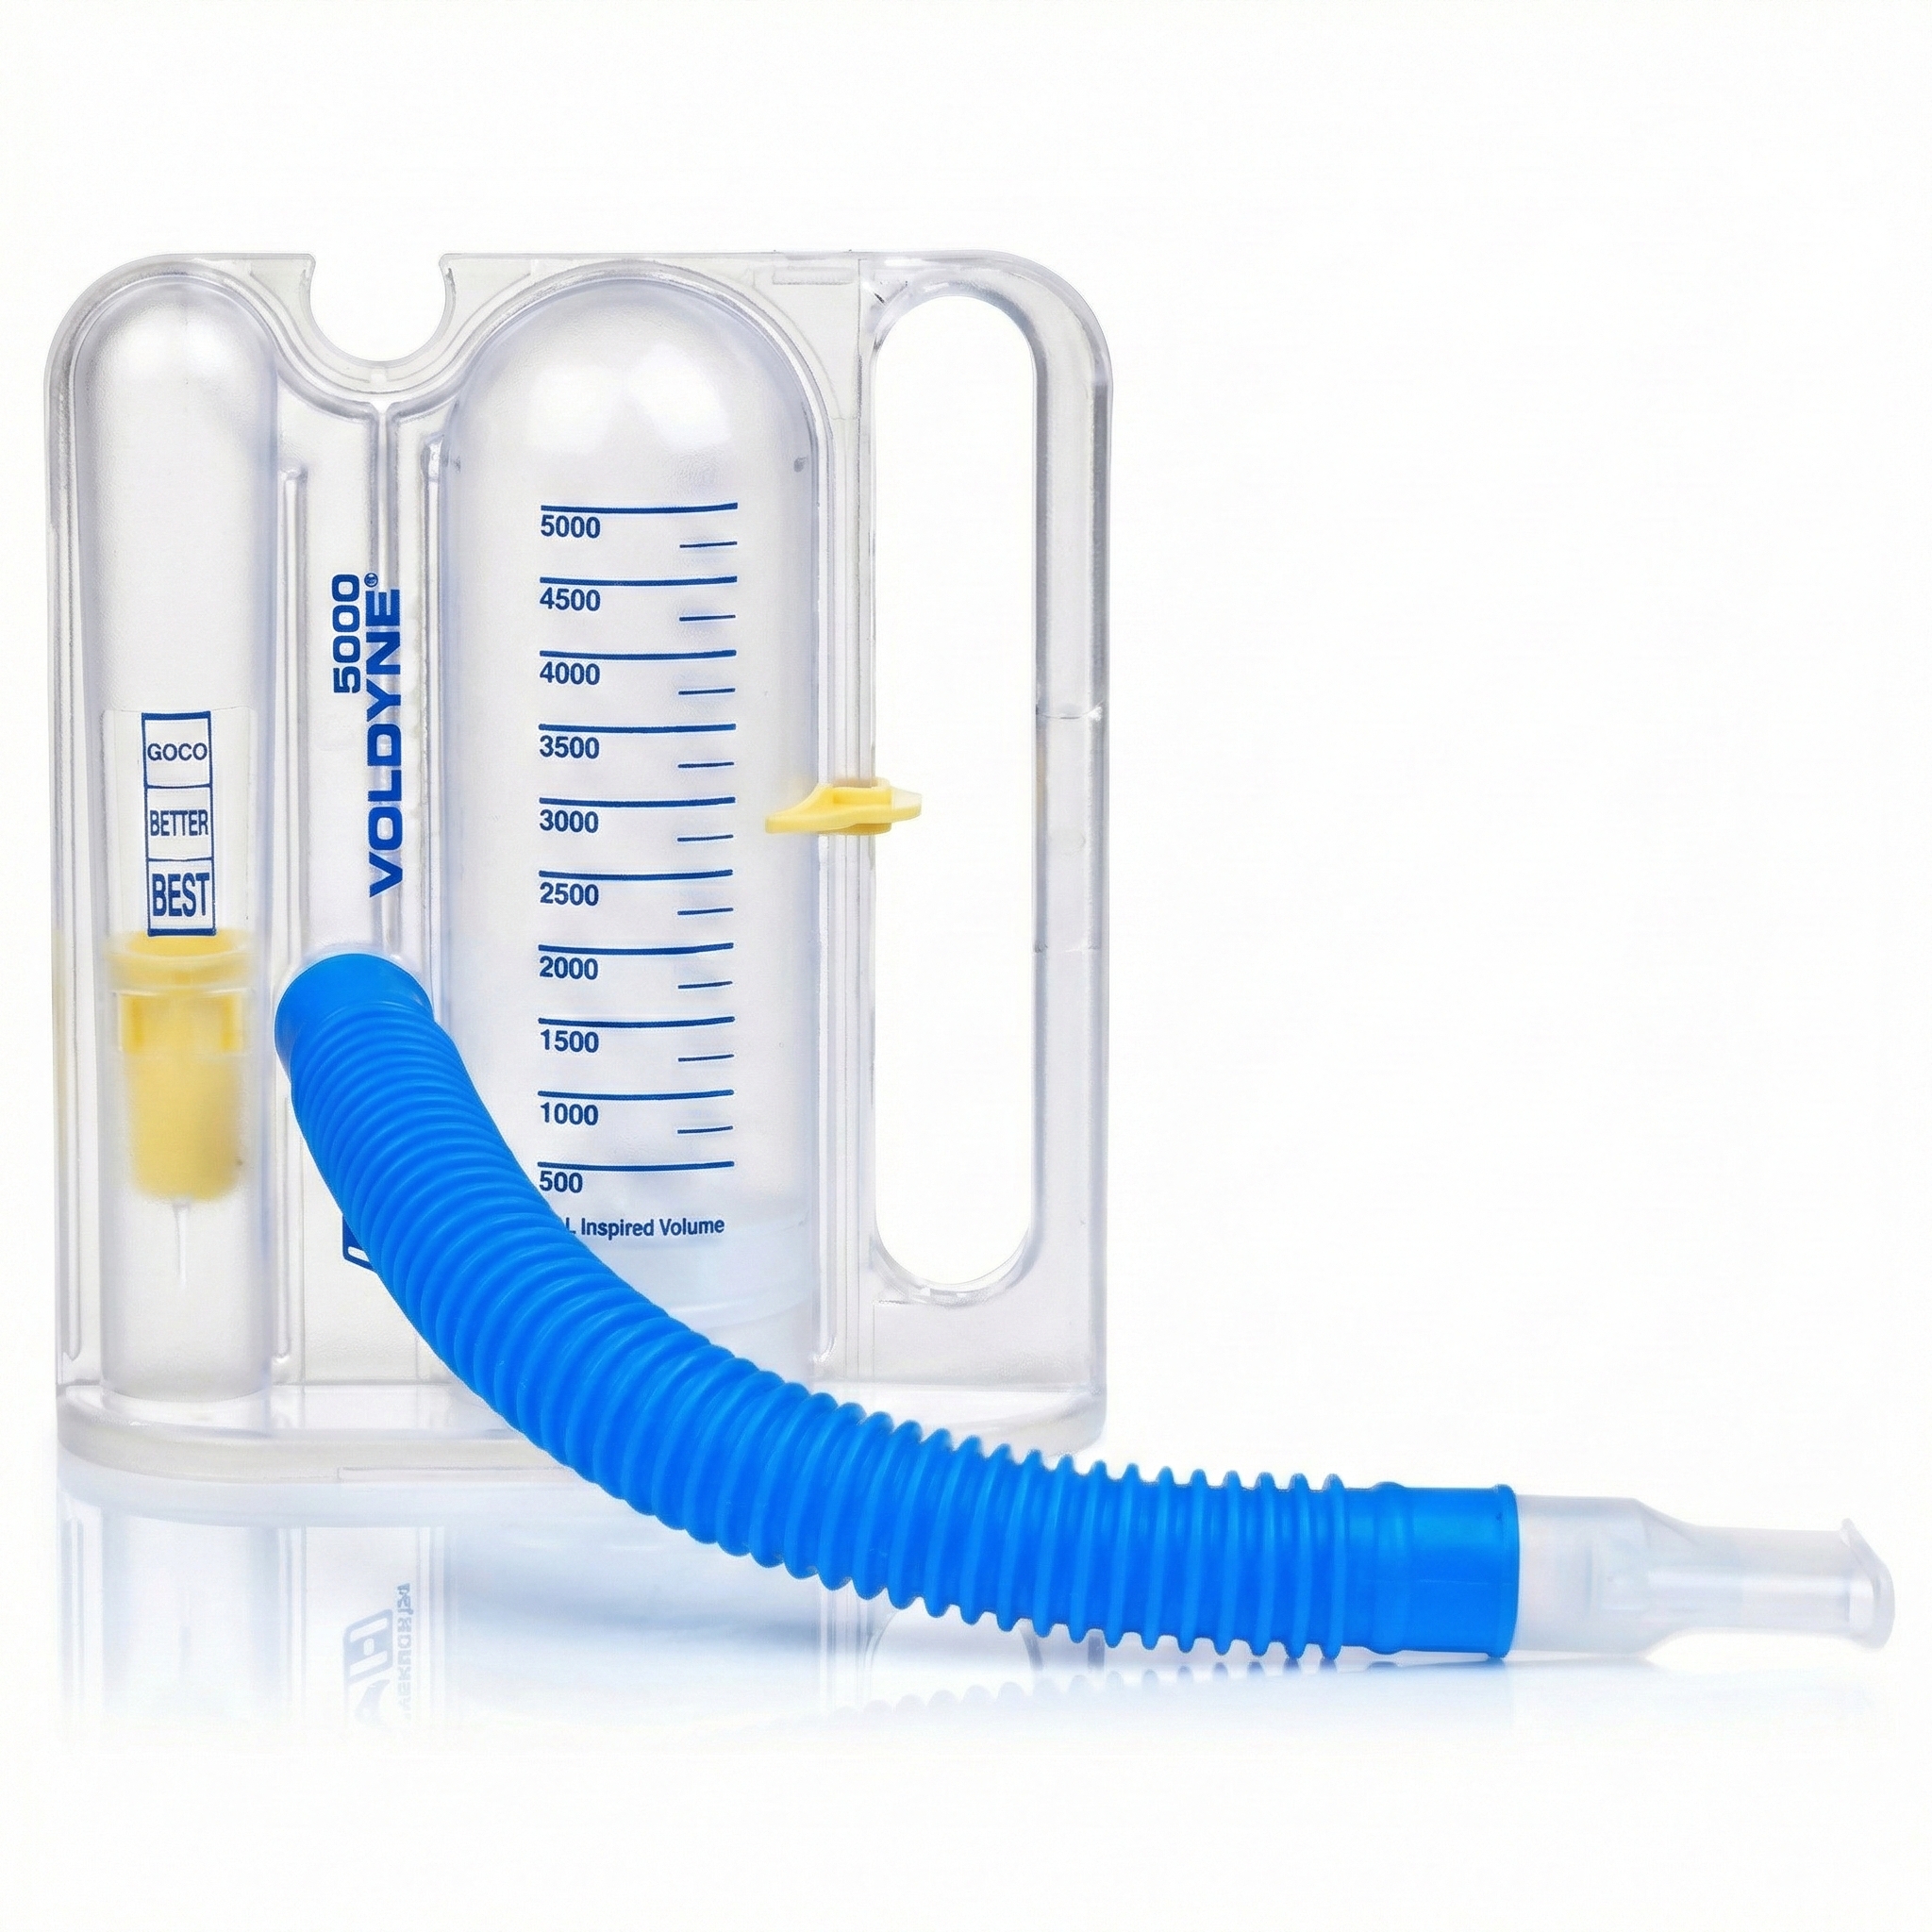
Training with an incentive inspirometer can increase the strength of the diaphragm muscle and improve ventilation. Watch the Kaiser Permanente training video. This device is used to help surgical patient recovery by preventing fluid and mucous accumulation and subsequent pneumonia. Patients diagnosed with asthma and emphysema can also benefit from increasing suction during inhalation and more effectively exchanging air with the alveoli in the lungs (Gilbert, 2019).
Summary of Respiratory Instrumentation
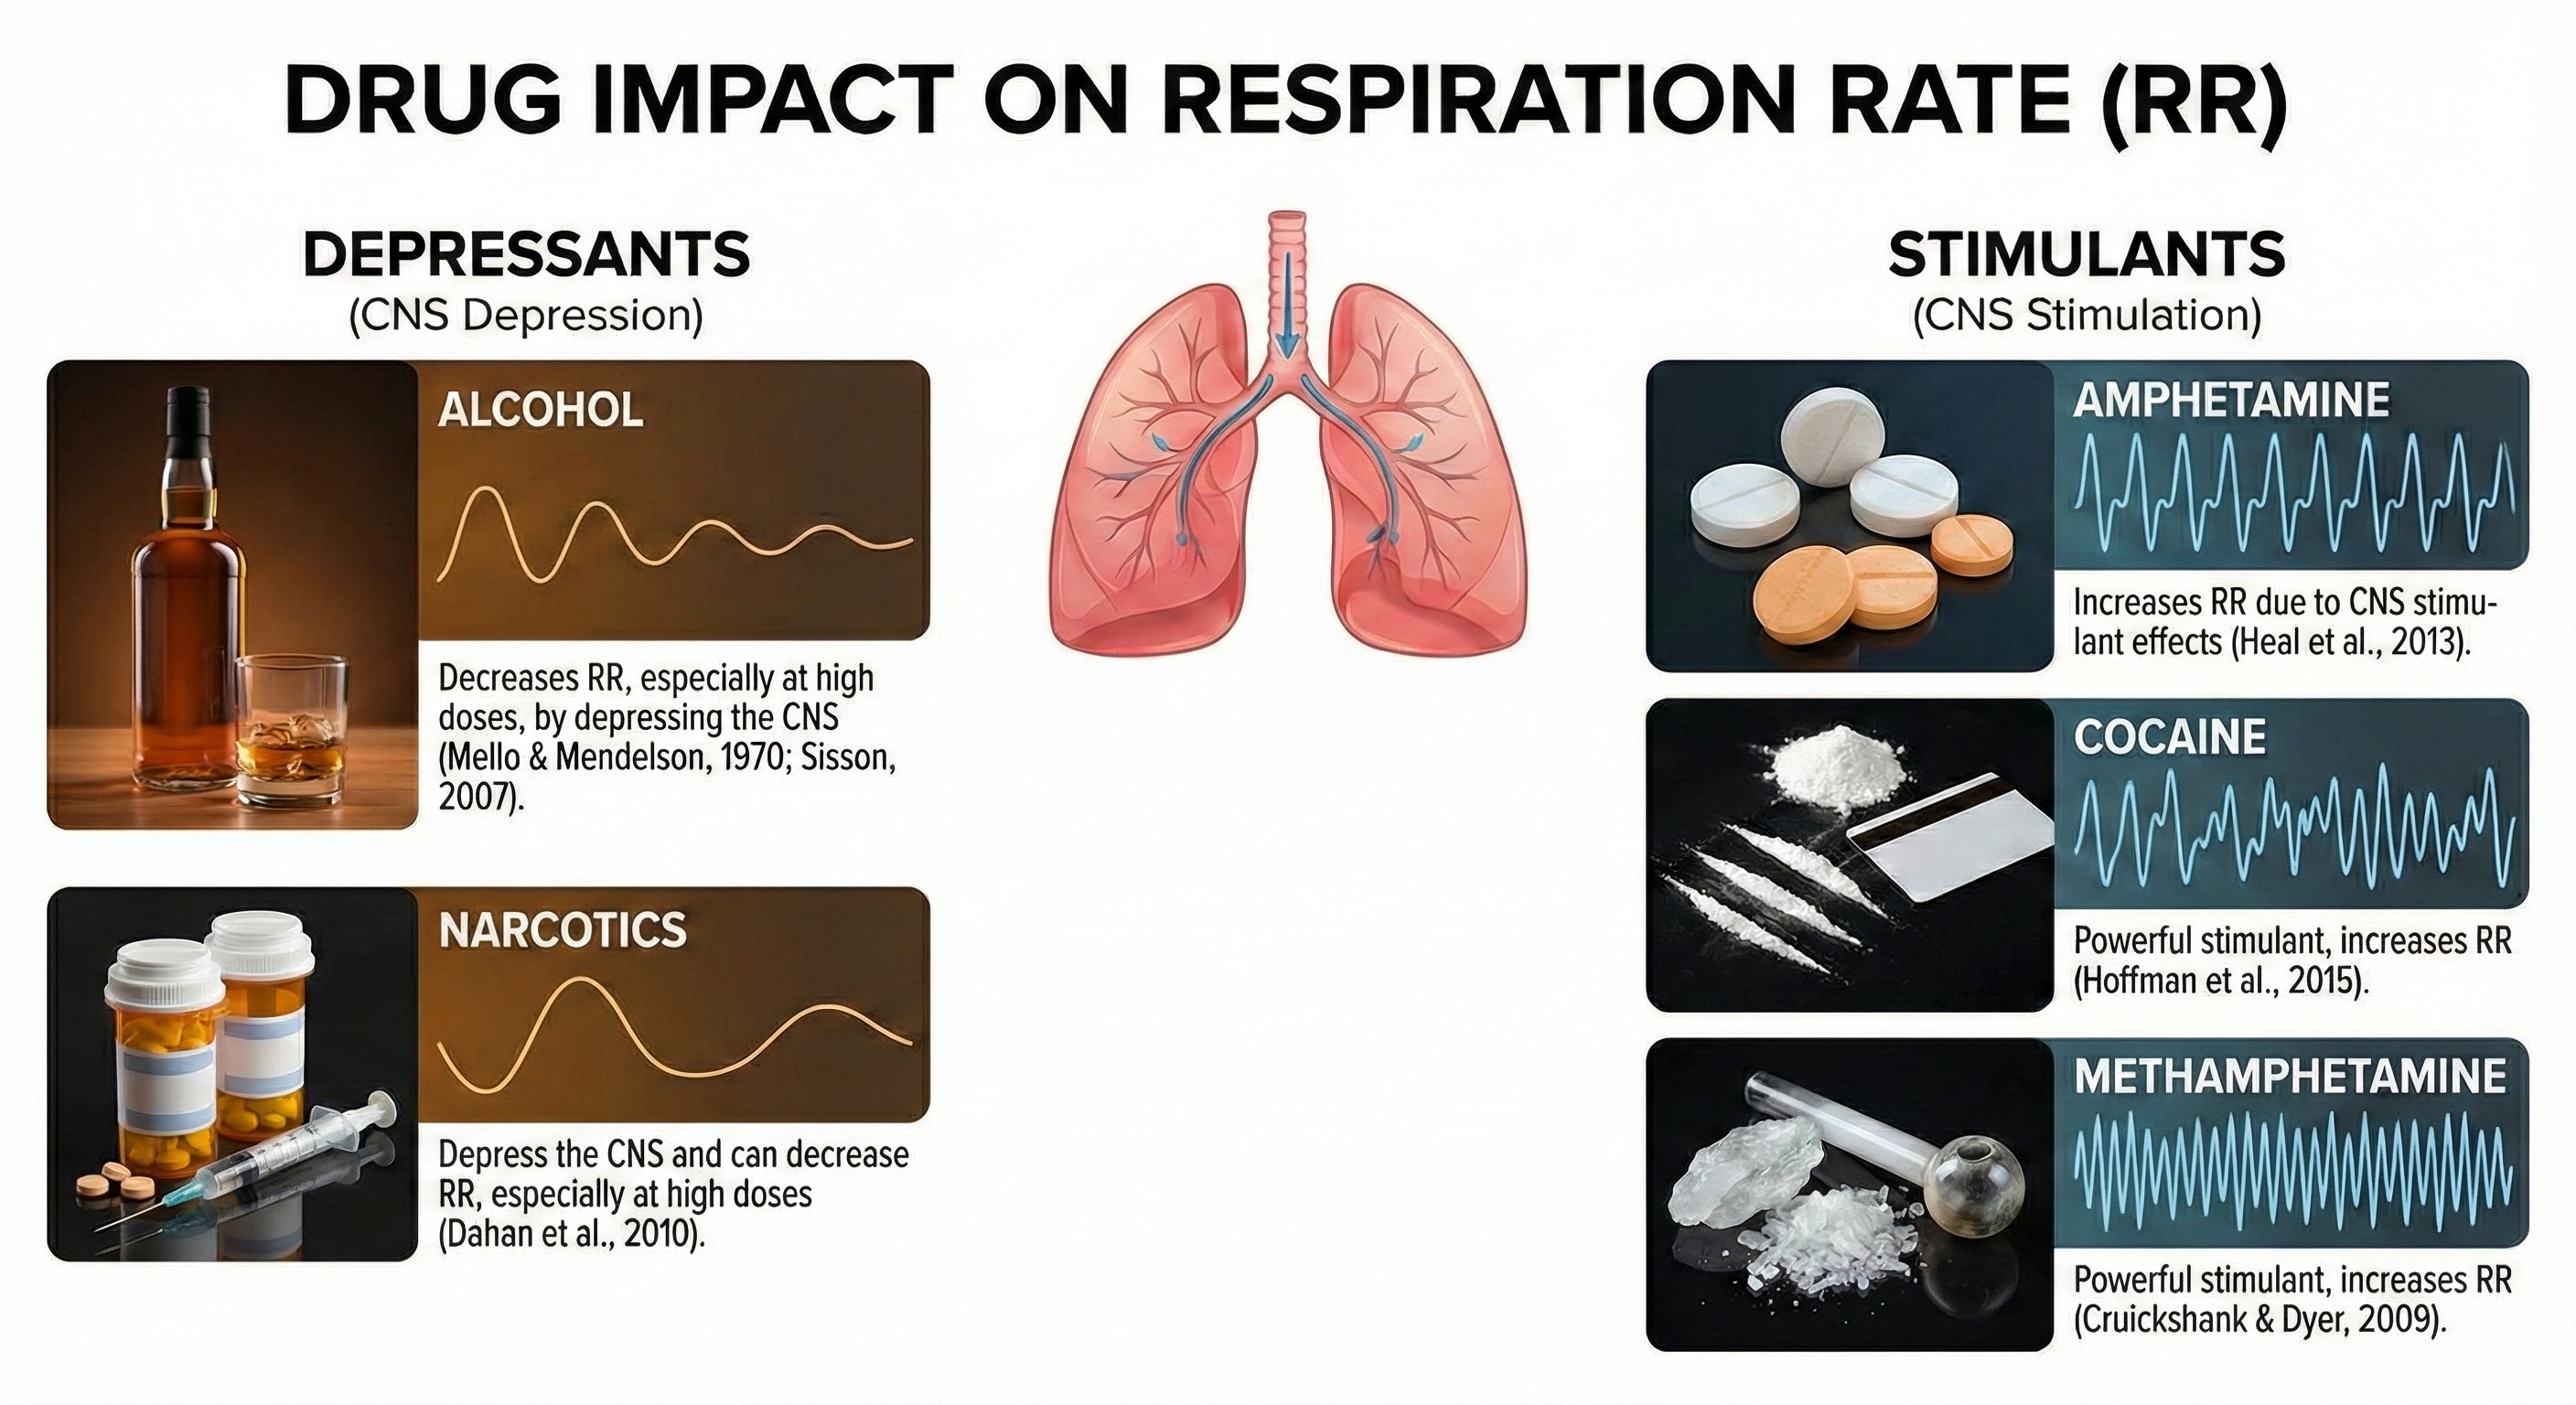
Drug Effects on Respiration
Various substances can significantly alter respiratory patterns and values. Understanding these effects helps clinicians interpret assessment data accurately and identify when medication effects may be confounding biofeedback measurements.
Consider this scenario: John's PO2 is 96%, and he plans to increase it to 99% since he believes that higher values are better. What did John forget?
When SpO2 exceeds 98%, the additional oxygen is primarily dissolved in the plasma. This can produce oxidative stress, vasoconstriction, and tissue injury, especially in critically ill patients. While 100% SpO2 is not harmful in brief or healthy contexts (e.g., post-exercise recovery), in many clinical settings, 99% is preferred to avoid excessive oxygen exposure. The ideal range is 95-98%.
Multiple instruments work together to provide comprehensive respiratory assessment. The respirometer shows breathing mechanics, SEMG reveals muscular effort, capnometry measures gas exchange efficiency, and oximetry monitors oxygen delivery. Each modality contributes unique information, and the most thorough assessments combine several approaches. Remember that drug effects can alter all of these measurements.
Check Your Understanding
- Why might an oxygen saturation of 99-100% be less desirable than 95-98% in some clinical contexts?
- What combination of instruments would provide the most comprehensive breathing assessment?
- How might opioid medications affect respiratory measurements during a biofeedback session?
- What role does the incentive inspirometer play in surgical recovery?
Cutting-Edge Topics in Respiratory Monitoring
Wearable Respiratory Sensors and AI-Powered Pattern Recognition
Recent advances in wearable technology are transforming respiratory monitoring beyond the clinic. Researchers at several universities have developed thin, flexible sensors that can be worn continuously under clothing, capturing breathing patterns during daily activities and sleep. When combined with machine learning algorithms, these devices can detect subtle changes in respiratory mechanics that precede anxiety attacks, asthma exacerbations, or sleep apnea episodes. A 2024 study demonstrated that AI-powered analysis of continuous respiratory data could predict panic attacks up to 15 minutes before symptom onset, providing a window for intervention. These developments suggest a future where biofeedback training extends seamlessly from clinical sessions into everyday life.
The Gut-Breath Connection: Microbiome Influences on Respiratory Chemistry
Emerging research is revealing unexpected connections between gut microbiome composition and respiratory function. Studies published in 2024-2025 have shown that certain gut bacteria produce metabolites that influence chemoreceptor sensitivity to CO2, potentially explaining why some individuals develop chronic hyperventilation patterns while others do not. This research suggests that comprehensive treatment of breathing dysfunction may eventually include microbiome assessment and targeted interventions. While these findings are preliminary, they point toward a more integrated understanding of how body systems interact to shape breathing behavior.
Next-Generation Capnometry: Continuous Non-Invasive Monitoring
Traditional capnometry requires a nasal cannula, which can be uncomfortable during extended monitoring and is susceptible to mouth breathing artifacts. Researchers are now developing transcutaneous CO2 sensors that measure blood CO2 levels directly through the skin. Recent clinical trials have shown these sensors can provide accurate, continuous monitoring without the discomfort or artifacts associated with nasal sampling. For biofeedback applications, this technology could enable more natural breathing during training sessions and more accurate assessment of CO2 regulation throughout daily activities.
Test Yourself
Click on the ClassMarker logo to take 10-question tests over this unit without an exam password.

Review Flashcards on Quizlet
Click on the Quizlet logo to review our chapter flashcards.

Visit the BioSource Software Website
BioSource Software offers Human Physiology, which satisfies BCIA's Human Anatomy and Physiology requirement, and Biofeedback100, which provides extensive multiple-choice testing over BCIA's Biofeedback Blueprint.

Essential Skills
Upon completing this unit, you should be able to explain the respiration signal, healthy breathing, and biofeedback to a client. You should be able to explain sensor attachment to a client and obtain permission to monitor them. You should demonstrate how to select a placement site and attach a respiration sensor to the chest and abdomen, and show how to monitor the accessory muscles to measure breathing effort.
You should be able to perform a tracking test asking your client to take a slow deep breath, and identify breath-holding, gasping, and movement artifacts in the respiration signal and how to remove them from the raw data. You should explain how to identify clavicular breathing, excessive breathing effort, reverse breathing, and thoracic breathing, as well as how posture and clothing can affect breathing.
You should demonstrate how to find your client's resonance frequency and explain why this is important, and demonstrate how to instruct a client to utilize a breathing pacer and the feedback display. You should discuss strategies for slowing down your client's breathing toward 5-7 breaths per minute and demonstrate a respiratory biofeedback training session, including record keeping, goal setting, site selection, baseline measurement, display and threshold setting, coaching, and debriefing at the end of the session.
Finally, you should demonstrate how to select and assign a practice assignment based on training session results and evaluate and summarize client progress during a training session.
Assignment
Now that you have completed this module, describe the method you use to monitor client breathing and the types of measurements you record. If you use a strain gauge to measure breathing, where do you place the strain gauge and why? What precautions do you take when attaching the strain gauge to female clients?
Glossary
capnometric biofeedback: the display of end-tidal CO2 back to the monitored individual.
capnometer: a device that measures end-tidal CO2, the percentage of CO2 in exhaled air at the end of exhalation.
ECG artifact: electrical activity from the heart that contaminates SEMG recordings, particularly when monitoring chest and neck muscles.
electromyograph: an instrument that measures the electrical activity of skeletal muscles.
end-tidal CO2: the percentage of CO2 in exhaled air at the end of exhalation.
HR Max - HR Min: a heart rate variability time-domain metric that calculates the average difference between the highest and lowest heart rates during each respiratory cycle.
incentive inspirometer: a calibrated cylinder with a piston that moves upward as the patient inhales and indicates the volume of air inhaled in a single breath (the incentive).
occult hypoxemia: undetected arterial oxygen saturation below 88%.
oximeter: a device that monitors oxygen saturation from a digit or earlobe.
photoplethysmographic (PPG) sensor: a photoelectric transducer that transmits and detects infrared light that passes through or is reflected off tissue to measure brief changes in blood volume and detect the pulse wave.
pulse oximeter: a device that measures dissolved oxygen in the bloodstream using a photoplethysmograph sensor placed against a finger or earlobe.
relative units of stretch (RUS): a scale from 0-100 used to display the amplified voltage from a respirometer, proportional to length changes in the sensor band.
resonance frequency: the breathing rate at which a system, like the cardiovascular system, can be optimally activated or stimulated, typically between 4.5 and 7 breaths per minute in adults.
respirometer: a flexible sensor band that changes resistance to a current as it expands and contracts during the respiratory cycle, monitoring respiration rate, depth, and pattern.
slippage artifact: the upward or downward movement of a respirometer, often due to thick underlying clothing or inadequate securing.
surface EMG (SEMG): muscle action potentials detected by surface electrodes placed over skeletal muscles and displayed back to the monitored individual.
thermistor: a temperature-sensitive resistor that can detect the temperature shift from inhalation to exhalation when positioned in a nostril's airstream.
torr: a unit of atmospheric pressure, named after Torricelli, which equals 1 millimeter of mercury (mmHg) and is used to measure end-tidal CO2.
References
Andreassi, J. L. (2007). Psychophysiology: Human behavior and physiological response (5th ed.). Lawrence Erlbaum and Associates, Inc.
Cruickshank, C. C., & Dyer, K. R. (2009). A review of the clinical pharmacology of methamphetamine. Addiction, 104(7), 1085-1099. https://doi.org/10.1111/j.1360-0443.2009.02564.x
Dahan, A., Aarts, L., & Smith, T. W. (2010). Incidence, reversal, and prevention of opioid-induced respiratory depression. Anesthesiology, 112(1), 226-238. https://doi.org/10.1097/ALN.0b013e3181c38c25
Fried, R. (1987). The hyperventilation syndrome: Research and clinical treatment. Johns Hopkins University Press.
Gilbert, C. (2012). Pulse oximetry and breathing training. Biofeedback, 40(4), 137-141. https://doi.org/10.5298/1081-5937-40.4.04
Gilbert, C. (2019). A guide to monitoring respiration. Biofeedback, 47(1), 6-11. https://doi.org/10.5298/1081-5937-47.1.02
Hoffman, R. S., Howland, M., Lewin, N. A., Nelson, L. S., & Goldfrank, L. R. (Eds.). (2015). Goldfrank's toxicologic emergencies (10th ed.). McGraw Hill. https://accessemergencymedicine.mhmedical.com/content.aspx?bookid=1163§ionid=64552562
Khazan, I. Z. (2013). The clinical handbook of biofeedback: A step-by-step guide for training and practice with mindfulness. John Wiley & Sons, Ltd.
Lehrer, P. M. (2007). Biofeedback training to increase heart rate variability. In P. M. Lehrer, R. M. Woolfolk, & W. E. Sime (Eds.), Principles and practice of stress management (3rd ed.). The Guilford Press.
Lehrer, P. M., Vaschillo, E., & Vaschillo, B. (2000). Resonant frequency biofeedback training to increase cardiac variability: Rationale and manual for training. Applied Psychophysiology and Biofeedback, 25(3), 177-191. https://doi.org/10.1023/a:1009554825745
MacHose, M., & Peper, E. (1991). The effect of clothing on inhalation volume. Biofeedback and Self-Regulation, 16, 261-265.
Mello, N. K., & Mendelson, J. H. (1970). Experimentally induced intoxication in alcoholics: A comparison between programmed and spontaneous drinking. The Journal of Pharmacology and Experimental Therapeutics, 173(1), 101-116.
Moss, D. (2004). Heart rate variability (HRV) biofeedback. Psychophysiology Today, 1, 4-11.
Peper, E., Groshans, G. H., Johnston, J., Harvey, R., & Shaffer, F. (2016). Calibrating respiratory strain gauges: What the numbers mean for monitoring respiration. Biofeedback, 44(2), 101-105. https://doi.org/10.5298/1081-5937-44.2.06
Peper, E., Harvey, R., Lin, I., Tylova, H., & Moss, D. (2007). Is there more to blood volume pulse than heart rate variability, respiratory sinus arrhythmia, and cardio-respiratory synchrony? Biofeedback, 35(2), 54-61.
Saatchi, R., Holloway, A., Travis, J., Elphick, H., Daw, W., Kingshott, R. N., Hughes, B., Burke, D., Jones, A., & Evans, R. L. (2025). Design, development, and evaluation of a contactless respiration rate measurement device utilizing a self-heating thermistor. Technologies, 13(6), 237. https://doi.org/10.3390/technologies13060237
Shaffer, F., Bergman, S., & Dougherty, J. (1998). End-tidal CO2 is the best indicator of breathing effort [Abstract]. Applied Psychophysiology and Biofeedback, 23(2).
Shaffer, F., & Combatalade, D. C. (2013). Don't add or miss a beat: A guide to cleaner heart rate variability recordings. Biofeedback, 41(3), 121-130.
Shaffer, F., & Ginsberg, J. P. (2017). An overview of heart rate variability (HRV) metrics and norms. Frontiers in Public Health: Family Medicine and Primary Care. https://doi.org/10.3389/fpubh.2017.00258
Shaffer, F., & Meehan, Z. M. (2020). A practical guide to resonance frequency assessment for heart rate variability biofeedback. Frontiers in Neuroscience, 14, 570400. https://doi.org/10.3389/fnins.2020.570400
Shaffer, F., & Moss, D. (2006). Biofeedback. In Y. Chun-Su, E. J. Bieber, & B. Bauer (Eds.), Textbook of complementary and alternative medicine (2nd ed.). Informa Healthcare.
Sisson, J. H. (2007). Alcohol and airways function in health and disease. Alcohol, 41(5), 293-307. https://doi.org/10.1016/j.alcohol.2007.06.003
Sjoding, M. W., Dickson, R. P., Iwashyna, T. J., Gay, S. E., & Valley, T. S. (2020). Racial bias in pulse oximetry measurement. New England Journal of Medicine, 383, 2477-2478. https://doi.org/10.1056/NEJMc2029240
Stern, R. M., Ray, W. J., & Quigley, K. S. (2001). Psychophysiological recording (2nd ed.). Oxford University Press.
Task Force of the European Society of Cardiology and the North American Society of Pacing and Electrophysiology. (1996). Heart rate variability: Standards of measurement, physiological interpretation, and clinical use. Circulation, 93, 1043-1065.