
Research Methods
What You Will Learn in This Chapter
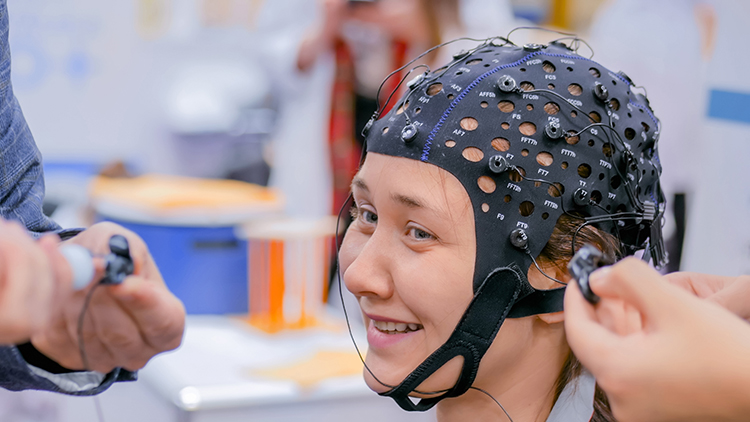
Have you ever wondered why some biofeedback studies make headlines while others gather dust in obscure journals? Or why a treatment that seemed miraculous in one clinic fails to work in another? The answers lie in research methodology, and understanding these principles will transform how you evaluate evidence and design your own clinical assessments.
In this chapter, you will discover the critical differences between experimental and nonexperimental designs and why only experiments can establish cause-and-effect relationships. You will learn about the "gold standard" randomized controlled trial and the challenges researchers face in creating appropriate control conditions for biofeedback studies. We will explore the sobering reality of questionable research practices and what the field is doing to improve scientific integrity. You will master descriptive and inferential statistics, including how to interpret effect sizes that tell you whether a treatment actually matters clinically. Finally, you will understand the five levels of clinical efficacy that guide evidence-based practice in our field.
BCIA Blueprint Coverage: This unit addresses Research methodology (IV).
This unit covers nonexperimental and experimental designs, randomized controlled trials, questionable research practices, case study designs, descriptive and inferential statistics, meta-analysis, the clinical efficacy of established medical practices, and criteria for clinical efficacy. Beth Morling's superb Research Methods in Psychology (5th ed.) served as the primary research design and statistics reference.
Why Research Matters for Your Practice
Research allows us to assess the efficacy of clinical and performance interventions. Peer-reviewed randomized controlled trials (RCTs) and meta-analyses that summarize their results are critical to the credibility of biofeedback and neurofeedback. Here is an uncomfortable truth: practitioners who claim success but refuse to submit their findings to peer review have continually endangered the field's reputation. Our stakeholders demand that we "show our receipts" or not be taken seriously. The field's reputation is critical since it impacts respect for providers, professional referrals, third-party reimbursement, and public demand for our services.
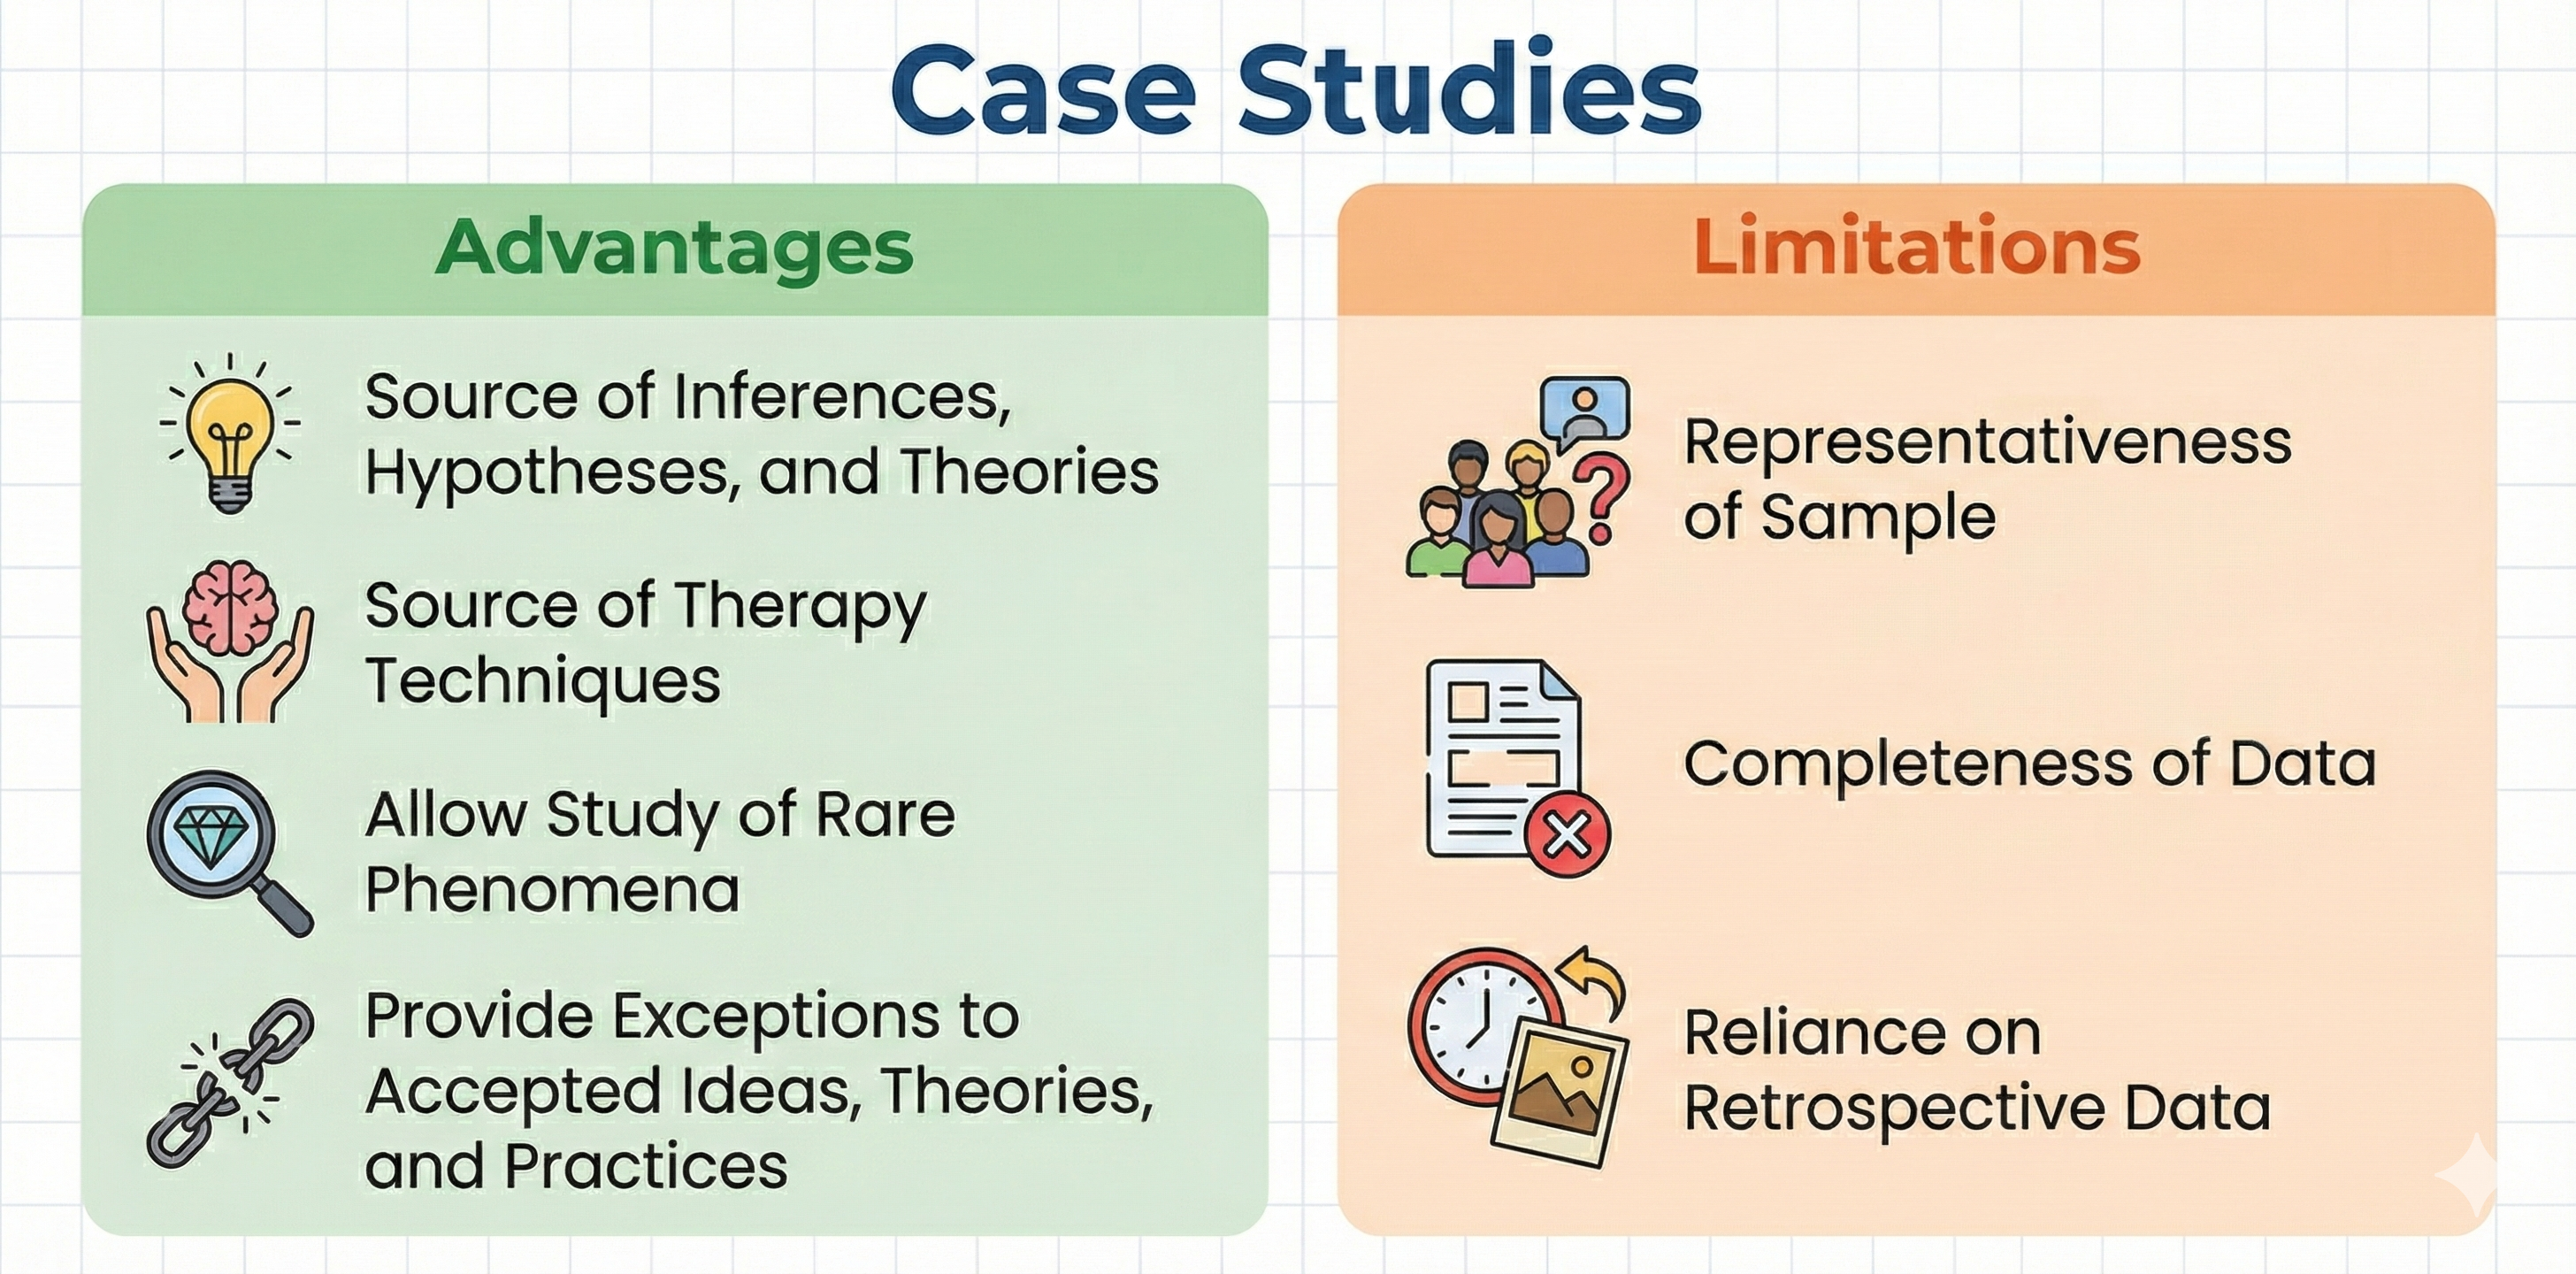
Large-scale randomized controlled trials represent the "gold standard" in research because experiments alone allow us to draw causal conclusions. Due to their expense and time demands, experimental studies exceed the resources of most practitioners. However, you can still integrate the scientific method into your practice. You can utilize nonexperimental techniques like case studies and publish your results in journals like Applied Psychophysiology and Biofeedback. Case studies and case series can generate valuable hypotheses and provide the rationale for RCTs.
Evidence-Based Practice in Biofeedback and Neurofeedback, an Association for Applied Psychophysiology and Biofeedback publication, summarizes the peer-reviewed literature and conservatively assigns efficacy ratings for specific applications. Drs. Inna Khazan, Fred Shaffer, Donald Moss, Randy Lyle, and Saul Rosenthal are the editors of the fourth edition of this industry reference.

Understanding Experimental and Nonexperimental Designs
Why Experiments Support Causal Claims
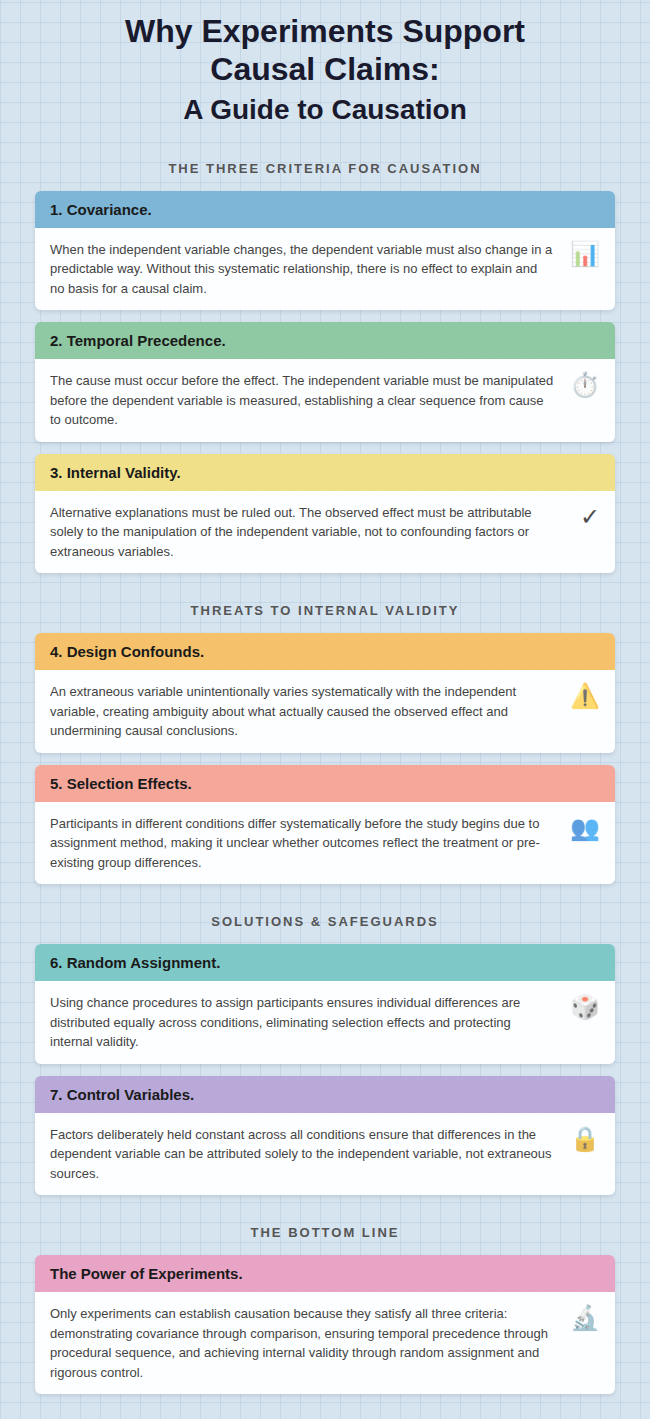
Experiments hold a unique position in the scientific toolkit because they are the only research method capable of unambiguously supporting causal claims. This power stems from their ability to satisfy three essential criteria: covariance, temporal precedence, and internal validity. Covariance means that when the independent variable changes, the dependent variable also changes in a predictable way. Temporal precedence ensures that the cause comes before the effect, meaning the manipulation of the independent variable occurs before the measurement of the dependent variable. Internal validity guarantees that no confounding variables are responsible for the observed relationship. When all three conditions are met, researchers can confidently assert that one variable caused a change in another, moving beyond mere correlation to genuine causation.
Establishing Covariance Through Experimental Comparison
Covariance is perhaps the most intuitively understood criterion for establishing causality. In experimental terms, it means that participants exposed to different levels of the independent variable should exhibit different outcomes on the dependent measure. Without covariance, there is simply no relationship to explain and no basis to claim that the manipulation had any effect. Consider a study testing whether heart rate variability biofeedback reduces test anxiety. If students who receive biofeedback training show the same anxiety levels as students in a control group, there is no covariance, and no causal claim can be made. However, if the biofeedback group shows significantly lower anxiety scores, the difference in the dependent variable depends on which level of the independent variable participants received. This systematic difference provides the first piece of evidence that something meaningful happened.
The Importance of Temporal Precedence
Temporal precedence addresses a deceptively simple requirement: the cause must occur before the effect. In experimental design, this means the independent variable must be manipulated before the dependent variable is measured. This criterion distinguishes experimental research from correlational studies, where all variables are measured simultaneously, leaving uncertainty about which came first. Imagine observing that clients who practice slow breathing also report lower blood pressure. Without experimental manipulation, you cannot determine whether the breathing caused the blood pressure change or whether people with naturally lower blood pressure are simply more inclined to practice breathing exercises. By contrast, an experiment that first trains participants in breathing techniques and then measures their blood pressure afterward establishes a clear temporal sequence. The manipulation precedes the measurement, allowing researchers to infer that the breathing training influenced the outcome.
Internal Validity and Ruling Out Alternative Explanations
Internal validity is the final and arguably most critical criterion for making causal claims. It addresses a fundamental question: is the observed effect truly due to the manipulation of the independent variable, or could some other factor have caused it? A study with strong internal validity eliminates alternative explanations through techniques like random assignment, controlled environments, and consistent procedures. Without internal validity, any claims of causality become speculative because competing explanations cannot be ruled out. For instance, if a neurofeedback study finds that trained participants show improved attention, but those same participants also happened to get more sleep during the study period, sleep becomes an alternative explanation. The improvement might be due to neurofeedback, better sleep, or some combination of both. Strong internal validity requires researchers to control for such possibilities systematically.
How Design Confounds Threaten Valid Conclusions
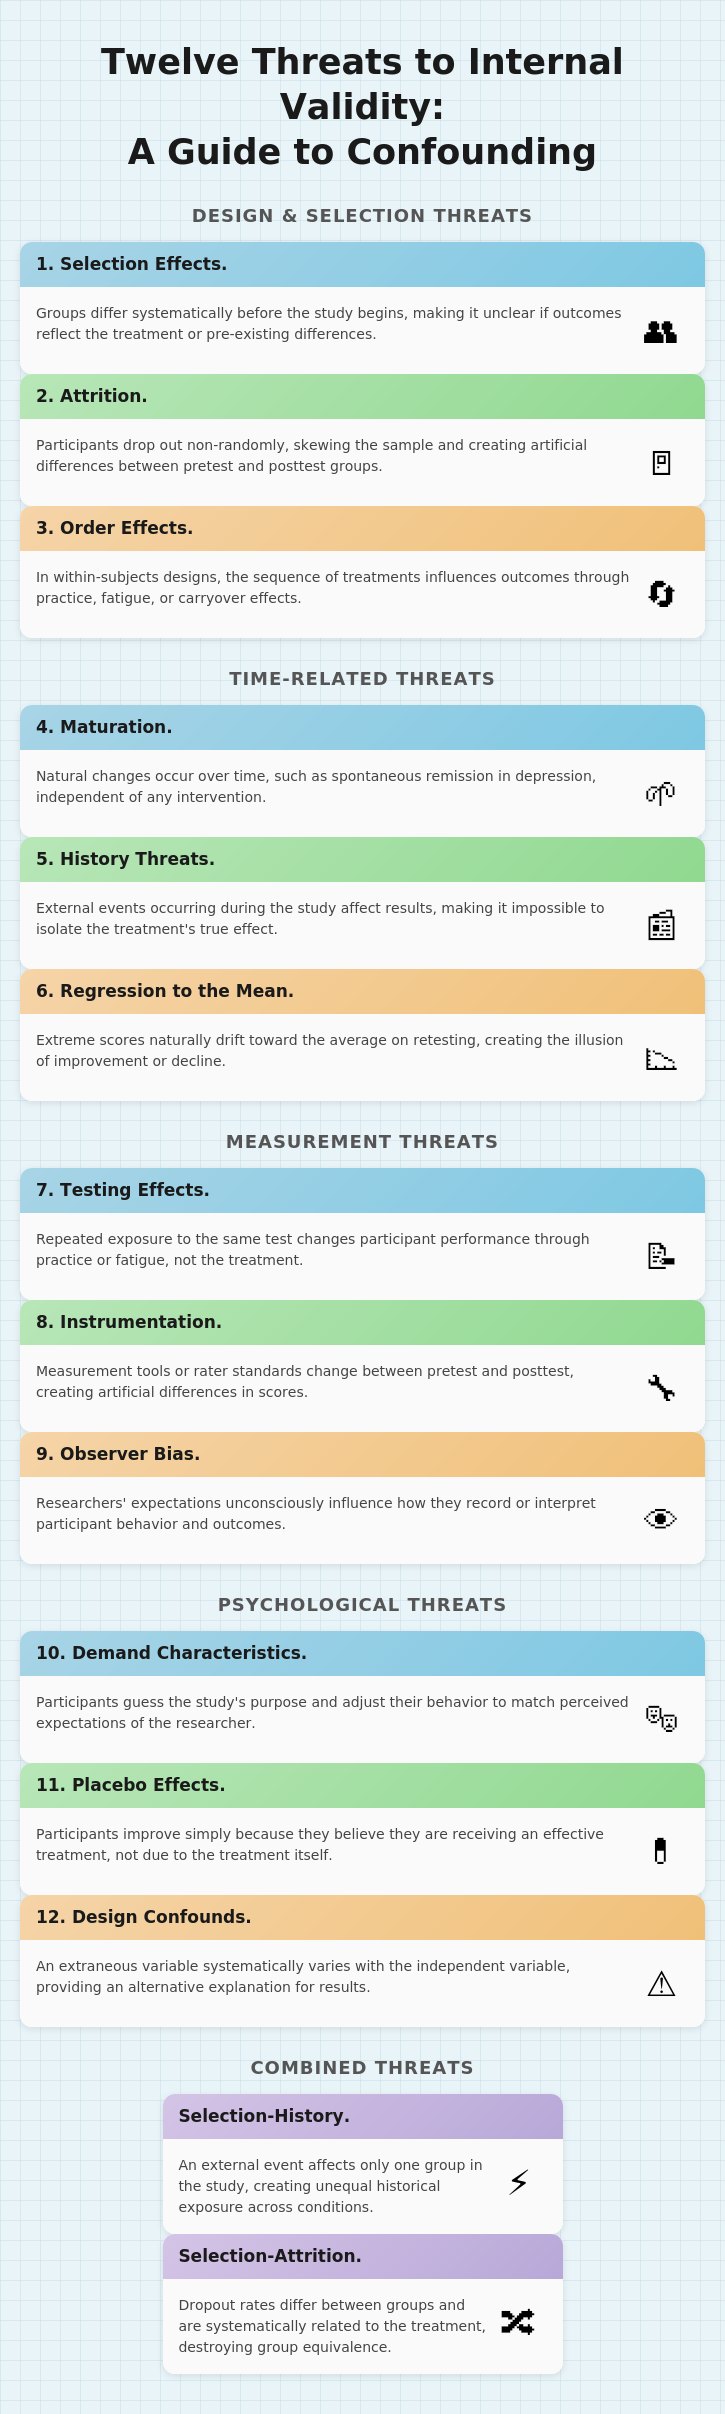
A design confound represents one of the most serious threats to internal validity in experimental research. It occurs when a second variable unintentionally varies systematically with the independent variable, introducing ambiguity about what actually caused the observed effect. Design confounds are often the result of poor planning or oversight during the development of experimental procedures. Consider a scenario where participants in a biofeedback condition are always tested in a quiet, comfortable clinic room, while control participants are tested in a noisy university lab. If the biofeedback group shows greater improvement, it becomes impossible to determine whether the biofeedback training or the quieter environment produced the change. The testing environment becomes a confound because it varies systematically with the levels of the independent variable. To prevent design confounds, researchers must ensure that all aspects of the experimental environment remain constant across conditions, aside from the manipulated variable itself.
Selection Effects and Pre-Existing Differences
Selection effects occur when participants in one condition of an experiment differ systematically from those in another condition due to the method of assignment. This threatens internal validity because observed differences in the dependent variable might be attributed to pre-existing differences between groups rather than the independent variable. A classic example occurs when participants self-select into treatment conditions. If highly motivated clients choose to enroll in an intensive biofeedback program and then show greater improvement than those in a standard treatment group, the result may reflect their initial motivation rather than the program's effectiveness. In the absence of random assignment, groups become confounded with participant characteristics, making causal interpretation ambiguous. Selection effects represent a form of design confound where individual differences, rather than the experimental manipulation, account for differences in outcomes.
Random Assignment as the Solution to Selection Effects
Random assignment is one of the most powerful tools available to researchers for eliminating selection effects. By using a random method, such as flipping a coin, rolling dice, or using a computerized random number generator, researchers ensure that every participant has an equal chance of being assigned to any condition. This procedure distributes individual differences, such as motivation, baseline skill levels, personality traits, and previous experiences, roughly equally across all groups, thereby protecting internal validity.
The essence of random assignment lies in its capacity to prevent systematic differences between conditions before the manipulation occurs. This means that any post-manipulation differences observed in the dependent variable are more likely to result from the manipulation itself rather than from pre-existing differences between participants. Random assignment should not be confused with random sampling, which concerns how participants are selected from a population for external validity purposes.
Control Variables as the Unsung Heroes of Experimental Design
Control variables are the often-unsung heroes of experimental design. While discussions of experiments tend to focus on independent and dependent variables, control variables serve a crucial role in eliminating alternative explanations and strengthening internal validity. A control variable is any factor that a researcher deliberately keeps constant across all experimental conditions. By holding these factors steady, the researcher ensures that differences in the dependent variable can be attributed solely to the manipulation of the independent variable rather than to extraneous sources of variability.
In a well-designed biofeedback study, control variables might include the room temperature, the instructions given to participants, the time of day for testing, the demeanor of the experimenter, and the duration of each session. The deliberate use of control variables elevates an experiment above a simple demonstration, transforming a potentially ambiguous comparison into a test with high internal validity.
Internal and External Validity: Can You Trust Your Results?
Experiments can achieve high internal validity, which is the degree to which you can attribute changes in the dependent variable to the independent variable. Think of internal validity as answering the question: "Did my treatment actually cause this change?"
Experiments attain internal validity by creating at least two independent variable levels and then randomly assigning participants to one or more conditions. Internal validity is important because it establishes a causal relationship between the independent and dependent variables. Without it, you are just guessing about what caused any improvements you observe.
Nonexperimental designs cannot achieve internal validity because they do not control EVs. They may not create IV levels, randomly assign participants to conditions, or both.
A sample is a subset of the target population. Think of it as a smaller group that represents the larger group you want to understand.
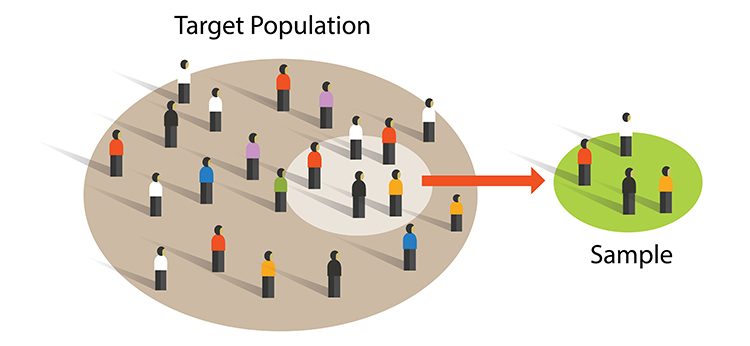
Researchers achieve external validity by using probability sampling to select participants from a population. External validity is the degree to which you can generalize sample findings to the population from which it was drawn. In other words: will your results apply to people beyond your study participants?
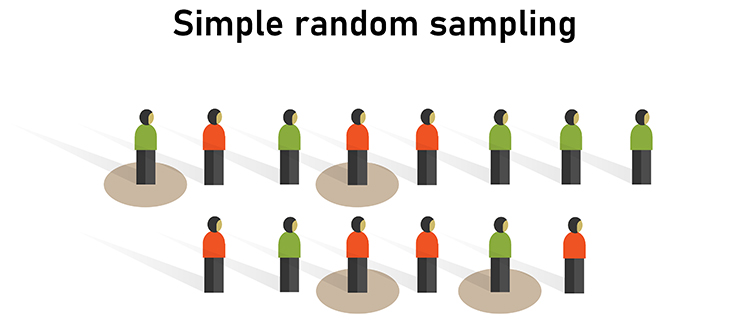
Both experimental and nonexperimental designs can achieve external validity since this depends on the sampling method and not the control of EVs. Random sampling, where each member of a population has an equal chance to be selected, is a prerequisite for external validity.
Confounding: The Hidden Saboteur of Experiments
Picture this scenario: a summer camp counselor removes all sugary foods from the campers' diet, and by the end of the session, the kids are behaving beautifully. The counselor proudly announces that cutting sugar transformed the children's behavior. But wait. Those same kids also spent three weeks adjusting to camp routines, making friends, exhausting themselves with outdoor activities, and getting used to being away from home. Any of those factors could explain the improvement just as easily as the missing sugar. This is confounding in action, and it represents one of the most dangerous traps in experimental research.
A confound is essentially an uninvited guest that crashes your experiment. More precisely, it is any variable other than your independent variable that changes alongside it, creating an alternative explanation for whatever results you observe. The problem is not just that confounds exist; the problem is that they masquerade as real effects. When a confound is present, you cannot determine whether changes in your dependent variable were caused by your manipulation or by this lurking intruder. The entire point of running an experiment is to establish cause and effect, and confounds undermine that goal at its foundation.
What Confounding Attacks: Internal Validity
What confounding attacks is something researchers call internal validity, which refers to the degree to which you can confidently claim that your independent variable actually caused changes in your dependent variable. When internal validity is compromised, your causal conclusions become shaky or outright wrong. You might think your new therapy reduces depression, your teaching method improves test scores, or your energy campaign lowered electricity use, but if confounds are present, those interpretations are built on sand. Strong internal validity means you have ruled out alternative explanations. Weak internal validity means those alternatives are still very much in play.
Selection Effects: When Groups Differ from the Start
One major source of confounding involves characteristics of the participants themselves. Selection effects occur when the people in your different experimental groups differ in systematic ways before your study even begins. Perhaps the students who volunteered for the morning session of your experiment are naturally early risers who are more alert and motivated, while the afternoon group stumbles in groggy and distracted. Any difference you observe between groups might reflect these pre-existing differences rather than your experimental manipulation.
Random assignment, the process of using chance to determine which participants end up in which condition, is the researcher's best weapon against selection effects because it distributes individual differences evenly across conditions. When randomization fails or is impossible, selection becomes a serious threat.
Time-Related Confounds: Maturation, History, and Regression
Time-related confounds present another family of threats. Maturation refers to natural changes that occur within participants simply because time has passed. In clinical settings, this phenomenon often appears as spontaneous remission, where symptoms improve on their own without any treatment. Consider a study evaluating a new therapy for depression. If participants report feeling better after eight weeks, you might credit the therapy, but depression often lifts naturally over time as life circumstances change, social support kicks in, or neurochemical fluctuations stabilize. Without a comparison group, you cannot know whether the therapy helped or whether participants would have improved anyway.
History threats work differently; they involve external events that happen during your study and affect your results. Imagine testing a stress-reduction program during the same week that final exams are canceled. Your participants might report dramatically lower stress, but the cause would be the canceled exams rather than your program.
Regression to the mean adds yet another time-based complication. This statistical phenomenon occurs when you select participants because they scored extremely high or low on some measure, and their scores tend to drift back toward the average on subsequent testing, purely for statistical reasons. That drift can look exactly like improvement or decline caused by your treatment, even though it is simply numbers behaving the way numbers naturally behave.
Measurement-Related Confounds: Testing and Instrumentation
The measurement process itself can become a source of confounding. Testing effects occur when participants change simply because they have taken the same test multiple times. They might get better through practice, or worse through boredom and fatigue, but either way the change has nothing to do with your intervention.
Instrumentation threats arise when your measurement tools or procedures shift between the pretest and posttest. Perhaps your behavioral raters become more lenient over time, or your equipment drifts out of calibration, or you switch to a slightly different version of your questionnaire. These changes in how you measure can create the illusion of change in what you are measuring.
Psychological Confounds: Bias, Demand, and Placebo
Human psychology introduces its own set of confounding influences. Observer bias occurs when researchers' expectations color their observations. An experimenter who believes strongly that cognitive training improves memory might unconsciously rate ambiguous responses more favorably for participants in the training condition.
Demand characteristics emerge when participants figure out what the study is about and adjust their behavior to match those expectations. If people sense that they are supposed to feel less anxious after a relaxation exercise, some will report feeling calmer whether they actually do or not.
Placebo effects represent perhaps the most fascinating confound of all, occurring when participants improve simply because they believe they are receiving an effective treatment. The belief itself triggers genuine changes in the brain and body, making it essential to include placebo control conditions in any study where expectations might influence outcomes.
Why This Matters
Understanding confounding is not just an academic exercise; it is the difference between knowledge and illusion. Every time you read about a study claiming that some intervention works, your first question should be whether the researchers adequately controlled for confounds. Every time you design your own study, you need to anticipate which confounds might sneak in and build safeguards against them. Comparison groups, random assignment, blinding procedures, and careful measurement protocols all exist to keep confounds at bay. Without these protections, even the most well-intentioned research produces conclusions that cannot be trusted. The goal of experimentation is to isolate cause and effect, and confounding is the force that constantly threatens to muddy those waters.
Controlling Physical, Social, and Participant Variables
The Challenge of Extraneous Variability
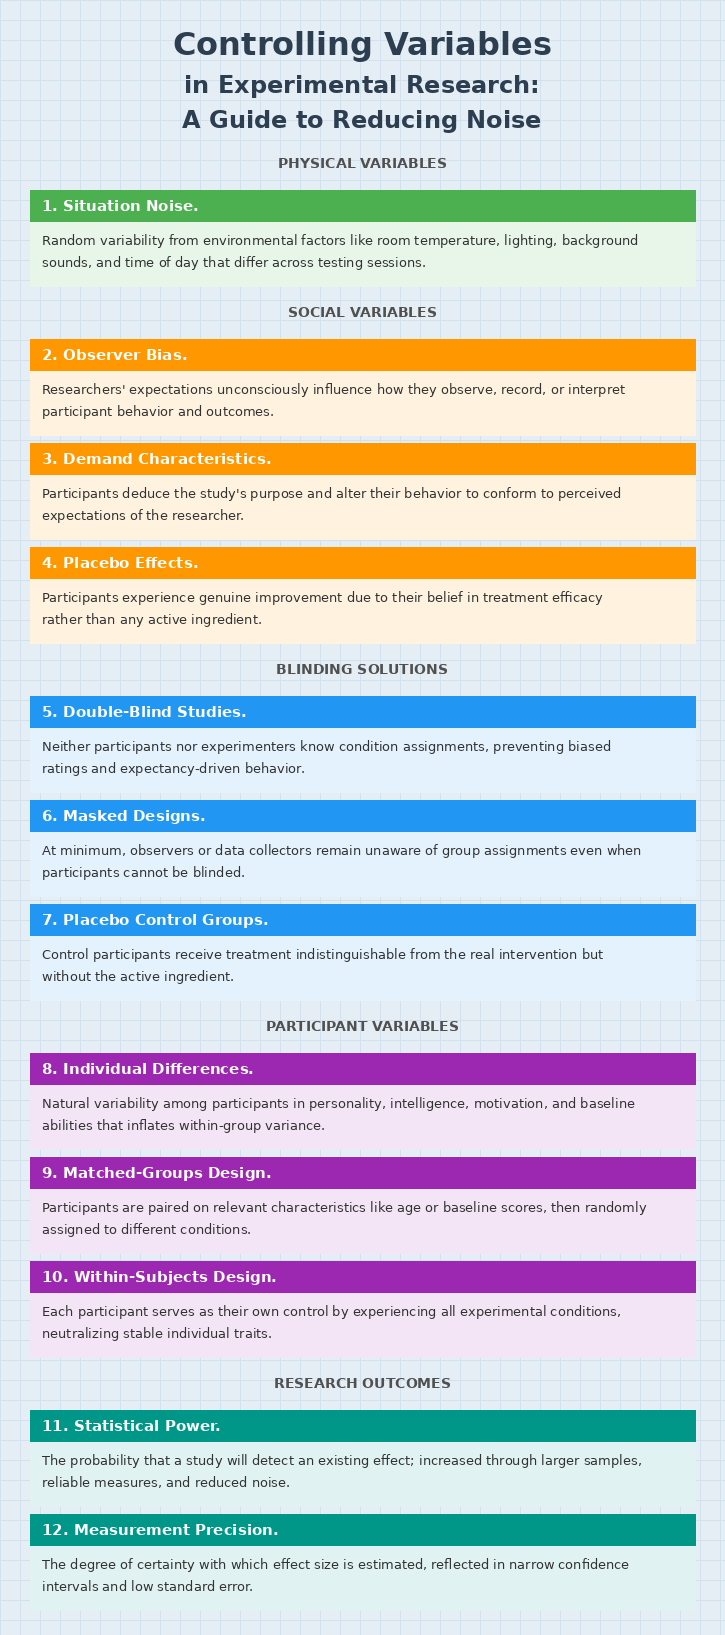
Even when researchers craft strong manipulations and select sensitive measures, experiments can still fail to detect real effects if too much uncontrolled variability clouds the data. This unwanted variability, often called noise or error variance, refers to differences in how individuals respond to the same experimental condition that have nothing to do with the independent variable. When scores within each condition scatter widely due to factors unrelated to the treatment, the statistical comparison between group means becomes murky, and genuine effects may slip beneath the threshold of detection. Researchers must therefore anticipate and control three broad categories of extraneous influence: physical variables arising from the testing environment, social variables stemming from interactions between experimenters and participants, and participant variables rooted in individual differences among the people being studied.
Taming the Physical Environment
Situation noise encompasses the random variability introduced by environmental and contextual factors that differ across testing sessions and participants. Physical variables are aspects of the physical environment like time of day, room size, ambient lighting, background sounds, temperature, and countless other contextual details that subtly shape how people respond. Consider a study examining whether a mindfulness app reduces stress: if one group completes the posttest in a quiet laboratory and another in a bustling campus lounge, the environmental contrast may contaminate the measurement regardless of how effective the intervention actually was.
Researchers can control physical variables through three strategies, listed here in order of preference. Elimination removes the variable entirely, such as soundproofing a room to eliminate auditory distractions. Constancy of conditions keeps the variable about the same for all treatment conditions, such as running all participants in the morning to neutralize time-of-day effects. Balancing distributes the variable's effects evenly across all treatment conditions, such as running half of each condition's participants in the morning and half in the afternoon. When within-subjects designs are feasible, comparing each participant to themselves across conditions helps neutralize these environmental fluctuations, since every person experiences the same contextual backdrop for each measurement.
Managing Social Influences in the Laboratory
Experiments are social situations, and the dynamics between experimenters and participants can introduce systematic distortions that compromise internal validity. Social variables are aspects of the relationships between researchers and participants, and their results can become confounded if these factors differ systematically across treatment conditions.
Two significant social variables are demand characteristics and experimenter bias. Demand characteristics are situational cues that signal expected behavior, much like students packing up their belongings at the end of class signals that dismissal is imminent. In research settings, participants often deduce the study's purpose and alter their behavior to conform to perceived expectations. If individuals sense they are supposed to show improvement from a stress-reduction program, they may underreport symptoms on posttest questionnaires regardless of actual change.
In biofeedback research, simply hooking someone up to impressive-looking equipment might create expectations of improvement, contaminating the results before training even begins.

Experimenter bias (also called observer bias) occurs when a researcher knows the participants' treatment condition and acts, often unconsciously, to confirm the experimental hypothesis. An experimenter who believes that cognitive-behavioral therapy improves mood may unconsciously rate ambiguous facial expressions or verbal tones as more positive after the intervention, creating a feedback loop in which belief becomes measurement.
Consider a biofeedback study comparing breathing rates: an experimenter might unconsciously provide more encouragement to participants in the experimental condition than to those in the control condition, subtly shaping outcomes in ways that have nothing to do with the intervention itself.

A third social threat, the placebo effect, produces genuine changes in participants due to their belief in the treatment's efficacy rather than any active ingredient. Patients given an inert pill but told it is a powerful antidepressant may exhibit real improvement because the brain responds to expectations through endogenous mechanisms such as endorphin release.
Blinding as the Primary Defense Against Social Threats
The most powerful safeguard against observer bias, demand characteristics, and placebo effects is blinding, the practice of concealing condition assignments from key parties in the research process. You can control demand characteristics by performing a single-blind experiment where participants are not told their treatment condition. When single-blinding is combined with keeping experimenters unaware as well, the result is a double-blind experiment, which conceals the participants' treatment condition from both participants and the experimenter, controlling both demand characteristics and experimenter bias simultaneously.

Consider a single-blind biofeedback study of heart failure patients where the experimental and control groups receive the same training using identical screens and practice assignments. The only difference between the groups is their target breathing rate: 6 breaths per minute for the experimental group and 12 breaths per minute for the control group. In a double-blind drug study, the experimental and control groups receive capsules that look and taste identical, and the experimenter does not know whether a subject has received a drug or placebo.
Researchers can further minimize demand characteristics by disguising the true purpose of the study through cover stories, filler tasks, and unobtrusive measures. Neutral, scripted instructions and automated or computer-based assessments help deliver a uniform experience that limits experimenter-participant variability. In clinical and behavioral research, placebo control groups receive a treatment indistinguishable from the real intervention but without the active ingredient, allowing investigators to parse what works due to genuine therapeutic processes from what appears to work due to expectations alone.
There is a challenge specific to biofeedback and neurofeedback research: few double-blind studies exist in these fields because participants can often detect and experience frustration when receiving false feedback. If a display shows heart rate increasing when it is actually decreasing, participants notice the discrepancy. Furthermore, unless biofeedback training is fully automated, training will be ineffective if the experimenter does not know the training goal. An alternative approach is to blind participants and research technicians to the experimental hypothesis rather than to the condition assignment. When a technician does not know which group is expected to perform better, this can reduce, though not eliminate, experimenter bias.
Accounting for Individual Differences Among Participants
Individual differences refer to the natural variability among participants in traits such as personality, intelligence, motivation, baseline skill level, prior experience, and physiological or emotional states. Participant characteristics like baseline heart rate variability or resting breathing rates can become a major source of within-group variability that obscures treatment effects, especially in independent-groups designs. These variables can confound an experiment when associated with the dependent variable, and failure to control these factors results in groups that are not equivalent. Imagine a study on cognitive training: if the sample includes individuals spanning a wide range of baseline abilities, some may improve rapidly while others struggle, not because of the intervention but because of where they started. This heterogeneity inflates variability within each condition, making it harder to detect the average effect of the training.
Researchers can control participant variables through several strategies. One solution is random assignment to treatment conditions, which probabilistically distributes individual differences across groups. Another approach is the matched-groups design, in which participants are paired on relevant characteristics such as age, gender, or baseline scores and then randomly assigned to different conditions. The most powerful approach is often the within-subjects design, where each participant serves as their own control by experiencing all experimental conditions. Because stable individual traits remain constant across conditions, within-subjects designs inherently account for participant variability and typically yield greater statistical power. Researchers can also include participant characteristics as covariates in statistical models to adjust for known sources of variation, helping isolate the effect of the independent variable from background noise.
Building a Fortress of Experimental Control
Controlling physical, social, and participant variables is not about achieving an impossible ideal of perfect uniformity but about systematically reducing unwanted variability so that the signal of the independent variable can emerge clearly from the noise. Physical variables can be controlled through elimination, constancy of conditions, or balancing. Social variables like demand characteristics and experimenter bias can be controlled through single-blind and double-blind procedures, neutral instructions, and placebo controls.
Participant-level threats can be addressed through random assignment, matching participants, employing within-subjects designs, and including covariates in statistical analyses. When these controls are implemented thoughtfully, they increase statistical power, the probability that a study will detect an existing effect, and improve measurement precision, the degree of certainty with which the effect size is estimated.
A well-controlled study that yields a null result can therefore be interpreted with confidence: the absence of an effect likely reflects reality rather than methodological failure. Conversely, a poorly controlled study that produces a significant result may simply be capitalizing on noise. By attending carefully to each category of extraneous variability, researchers construct a fortress of experimental control that protects the integrity of their causal conclusions.
Correlational Studies: Valuable and Non-Experimental
A correlational study is a nonexperimental design because it does not manipulate an IV. These designs only obtain data regarding participant characteristics and performance, with no IVs and only DVs. Scatterplots graphically display the magnitude (from -1 to +1) and direction (negative or positive) of a correlation.
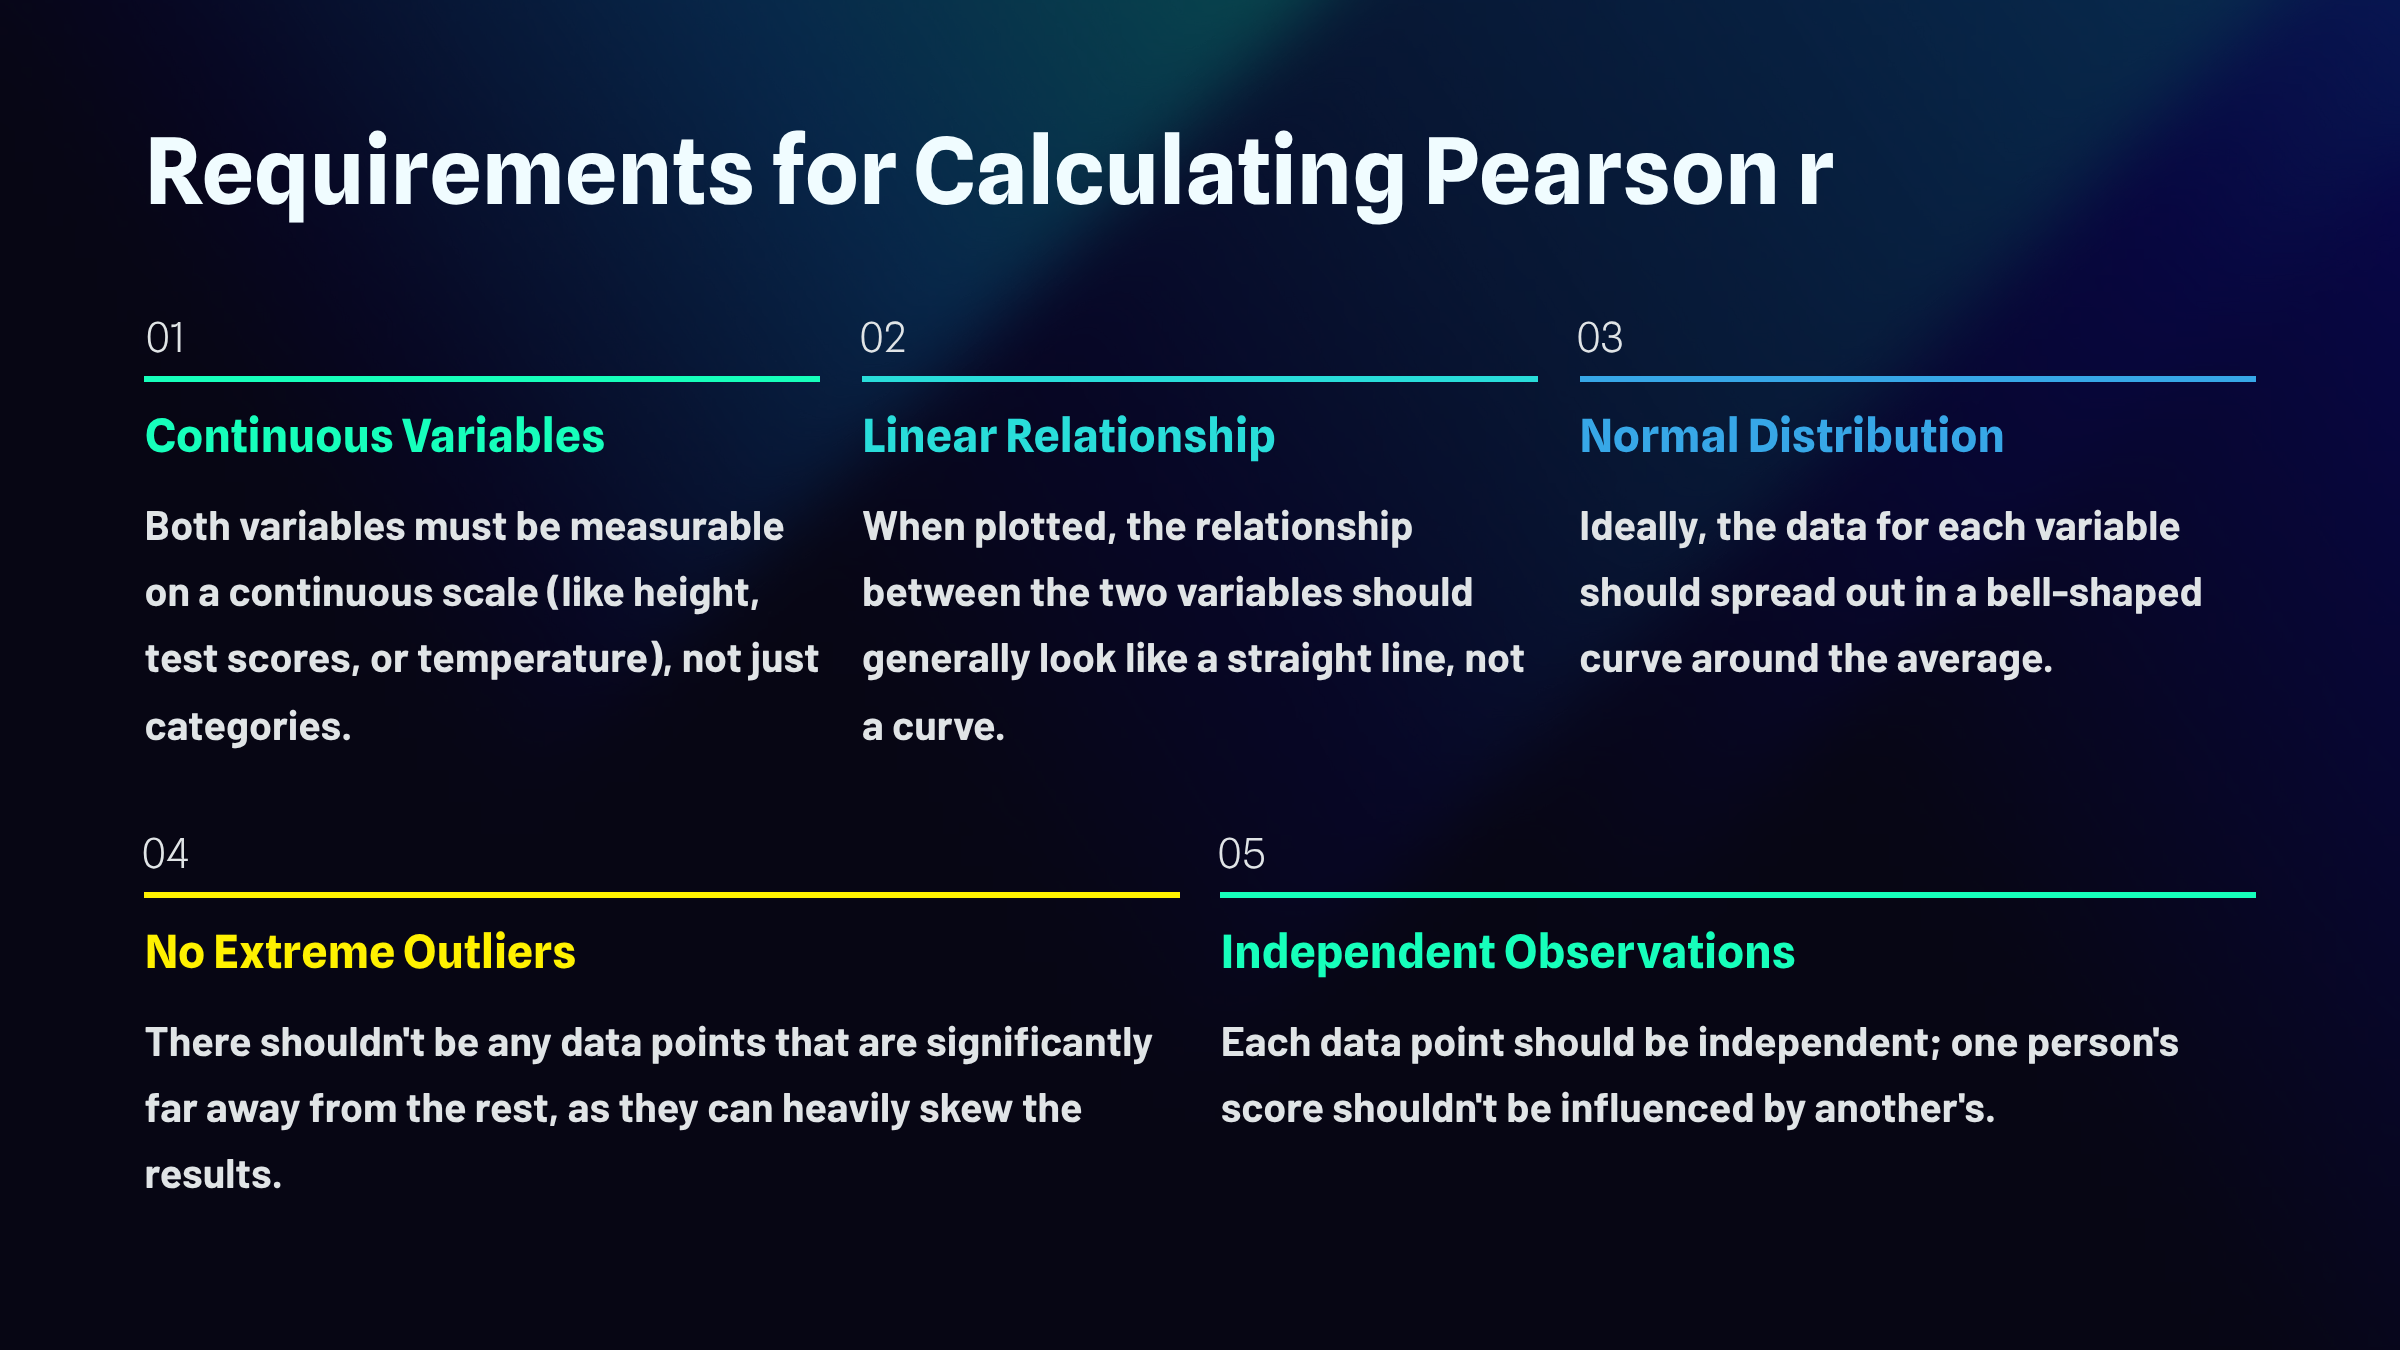
Before you can trust what a correlation coefficient tells you, you need to make sure your data actually meet the conditions that make correlation meaningful in the first place. Think of these as the ground rules that need to be in place before the math can do its job properly.
First, both of your variables need to be continuous, meaning they can take on a wide range of values along a scale. Height works. So do test scores, reaction times, and temperature readings. What doesn't work are categories like "yes or no" or "red, blue, green." You need numbers that can slide up and down, not labels that simply sort things into buckets.
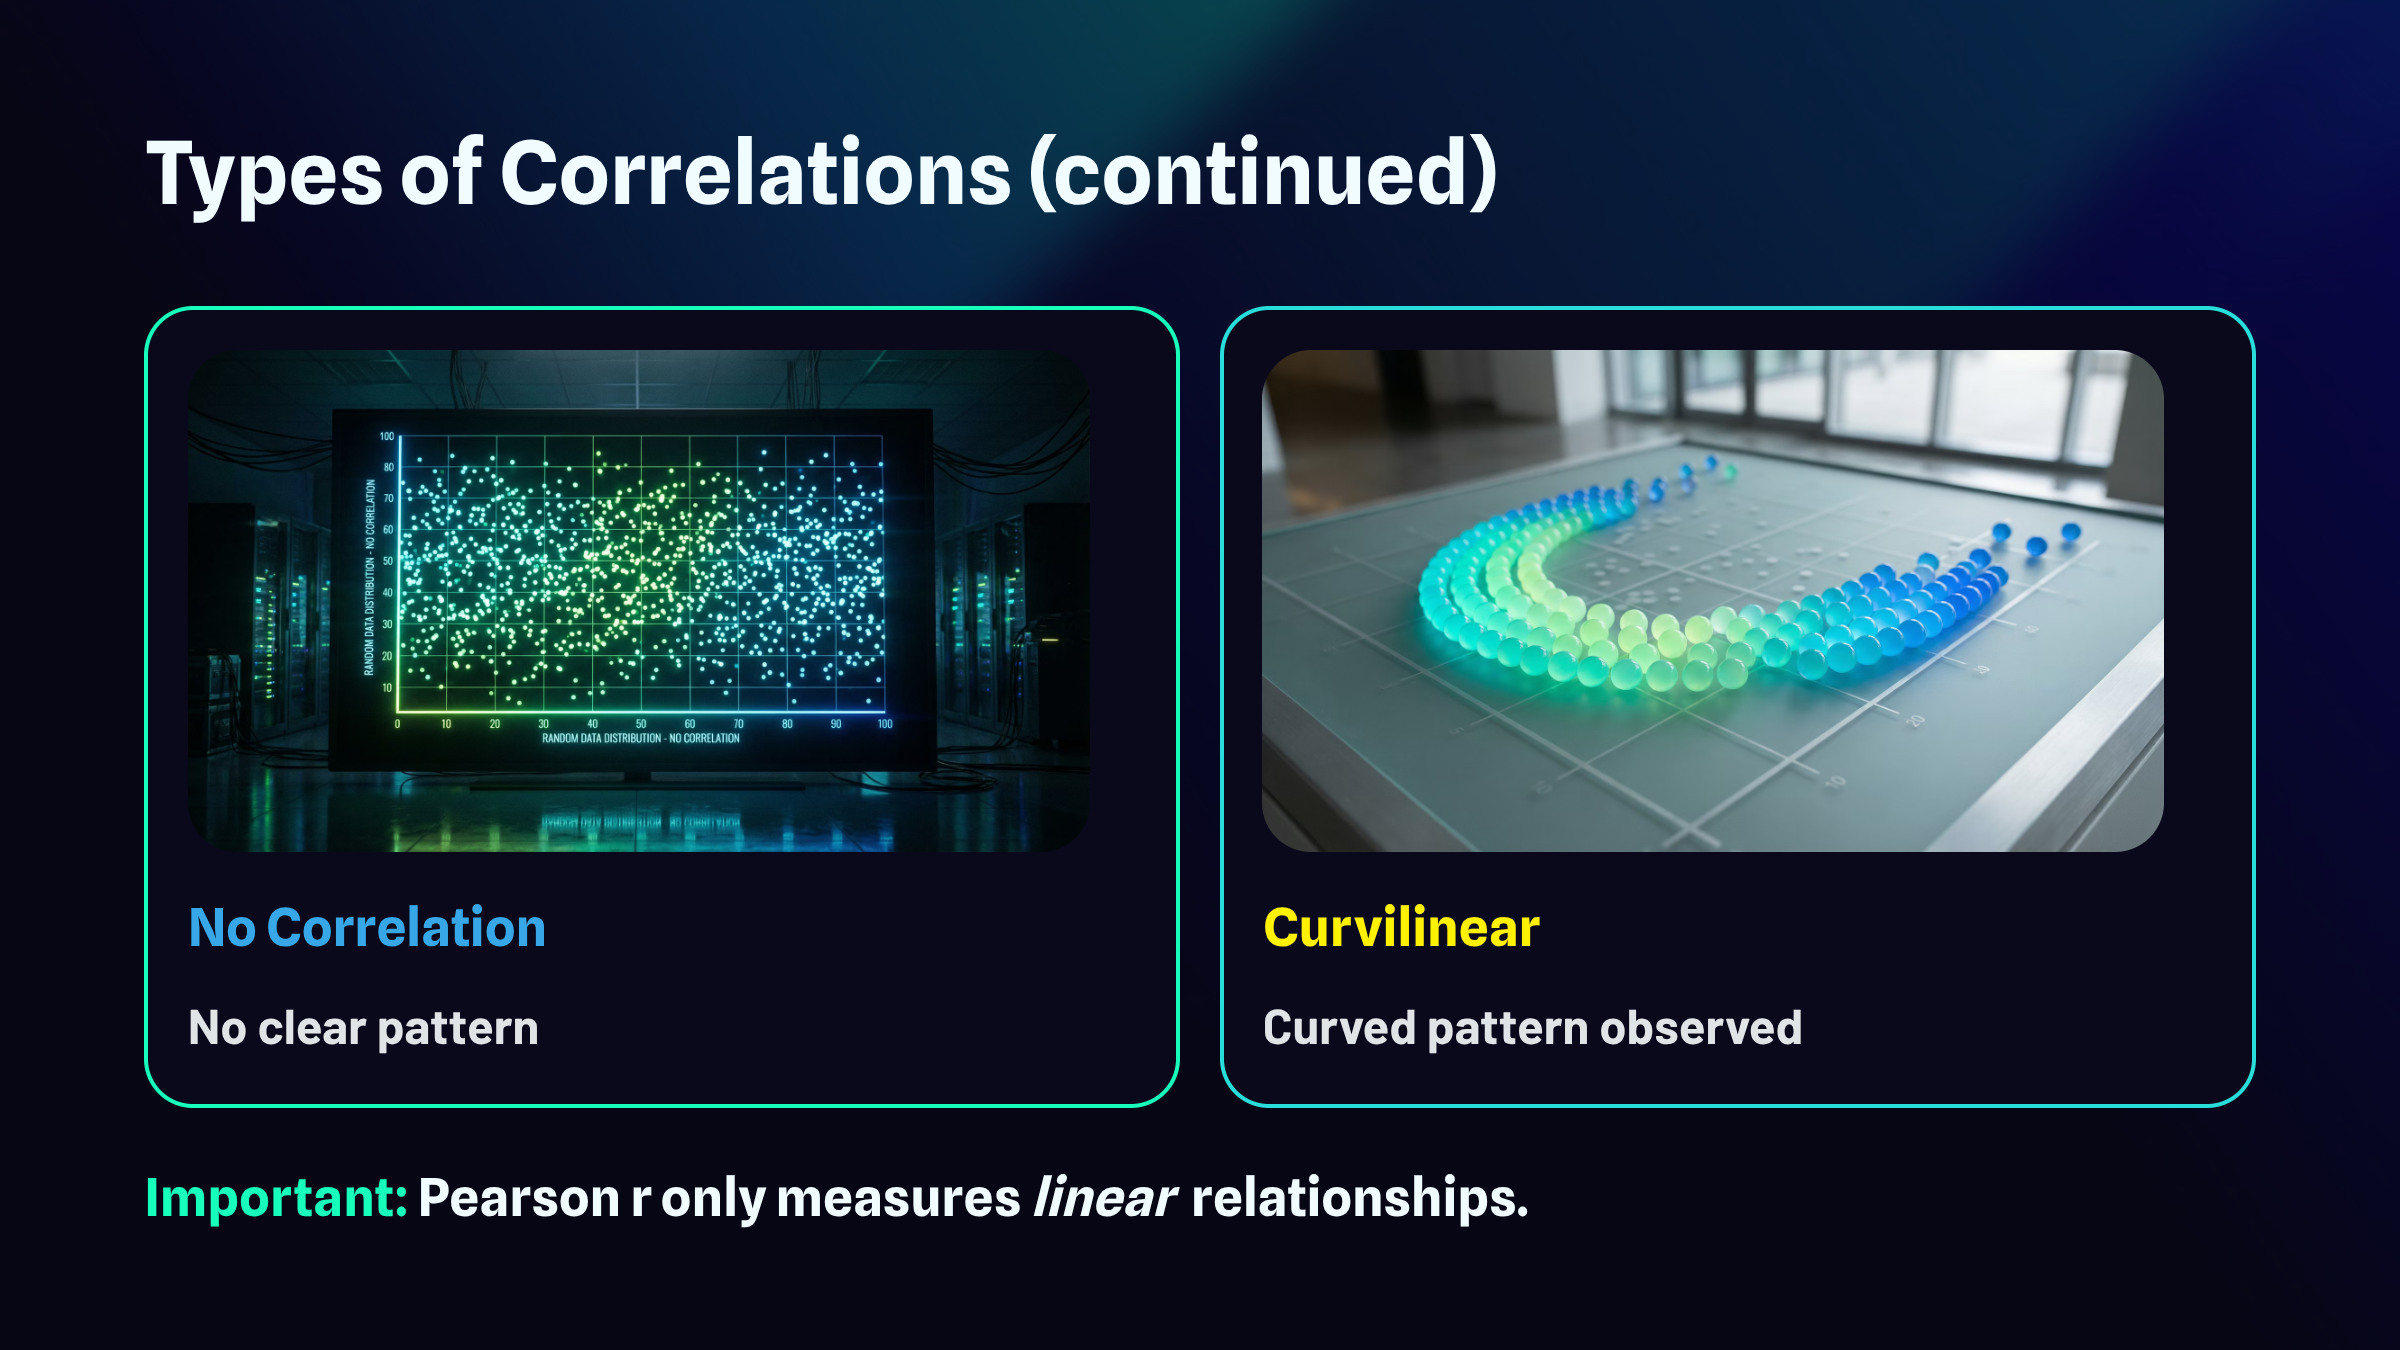
Second, the relationship between your two variables should be roughly linear. If you were to plot all your data points on a graph, you'd want them to cluster around an imaginary straight line, whether that line slopes upward, downward, or stays relatively flat. Correlation isn't designed to detect curved or U-shaped relationships. It's looking for straight-line patterns, and if your data actually follow a curve, the correlation coefficient will completely miss the boat.
Third, ideally both variables should be normally distributed, meaning the scores spread out in that familiar bell-shaped curve with most values clustering near the average and fewer scores appearing at the extremes. When data are badly skewed or lumpy, correlation can become unreliable.
Fourth, watch out for outliers. Even a single data point that sits dramatically far from the pack can yank your correlation in a misleading direction. One person who scored impossibly high or low can make it look like a relationship exists when it doesn't, or hide a relationship that's actually there.
Finally, your observations need to be independent. Each data point should stand on its own, uninfluenced by the others. If one participant's response somehow affected another's, or if you measured the same person multiple times without accounting for it, you've violated this assumption and your results may not mean what you think they mean.
Types of Correlations
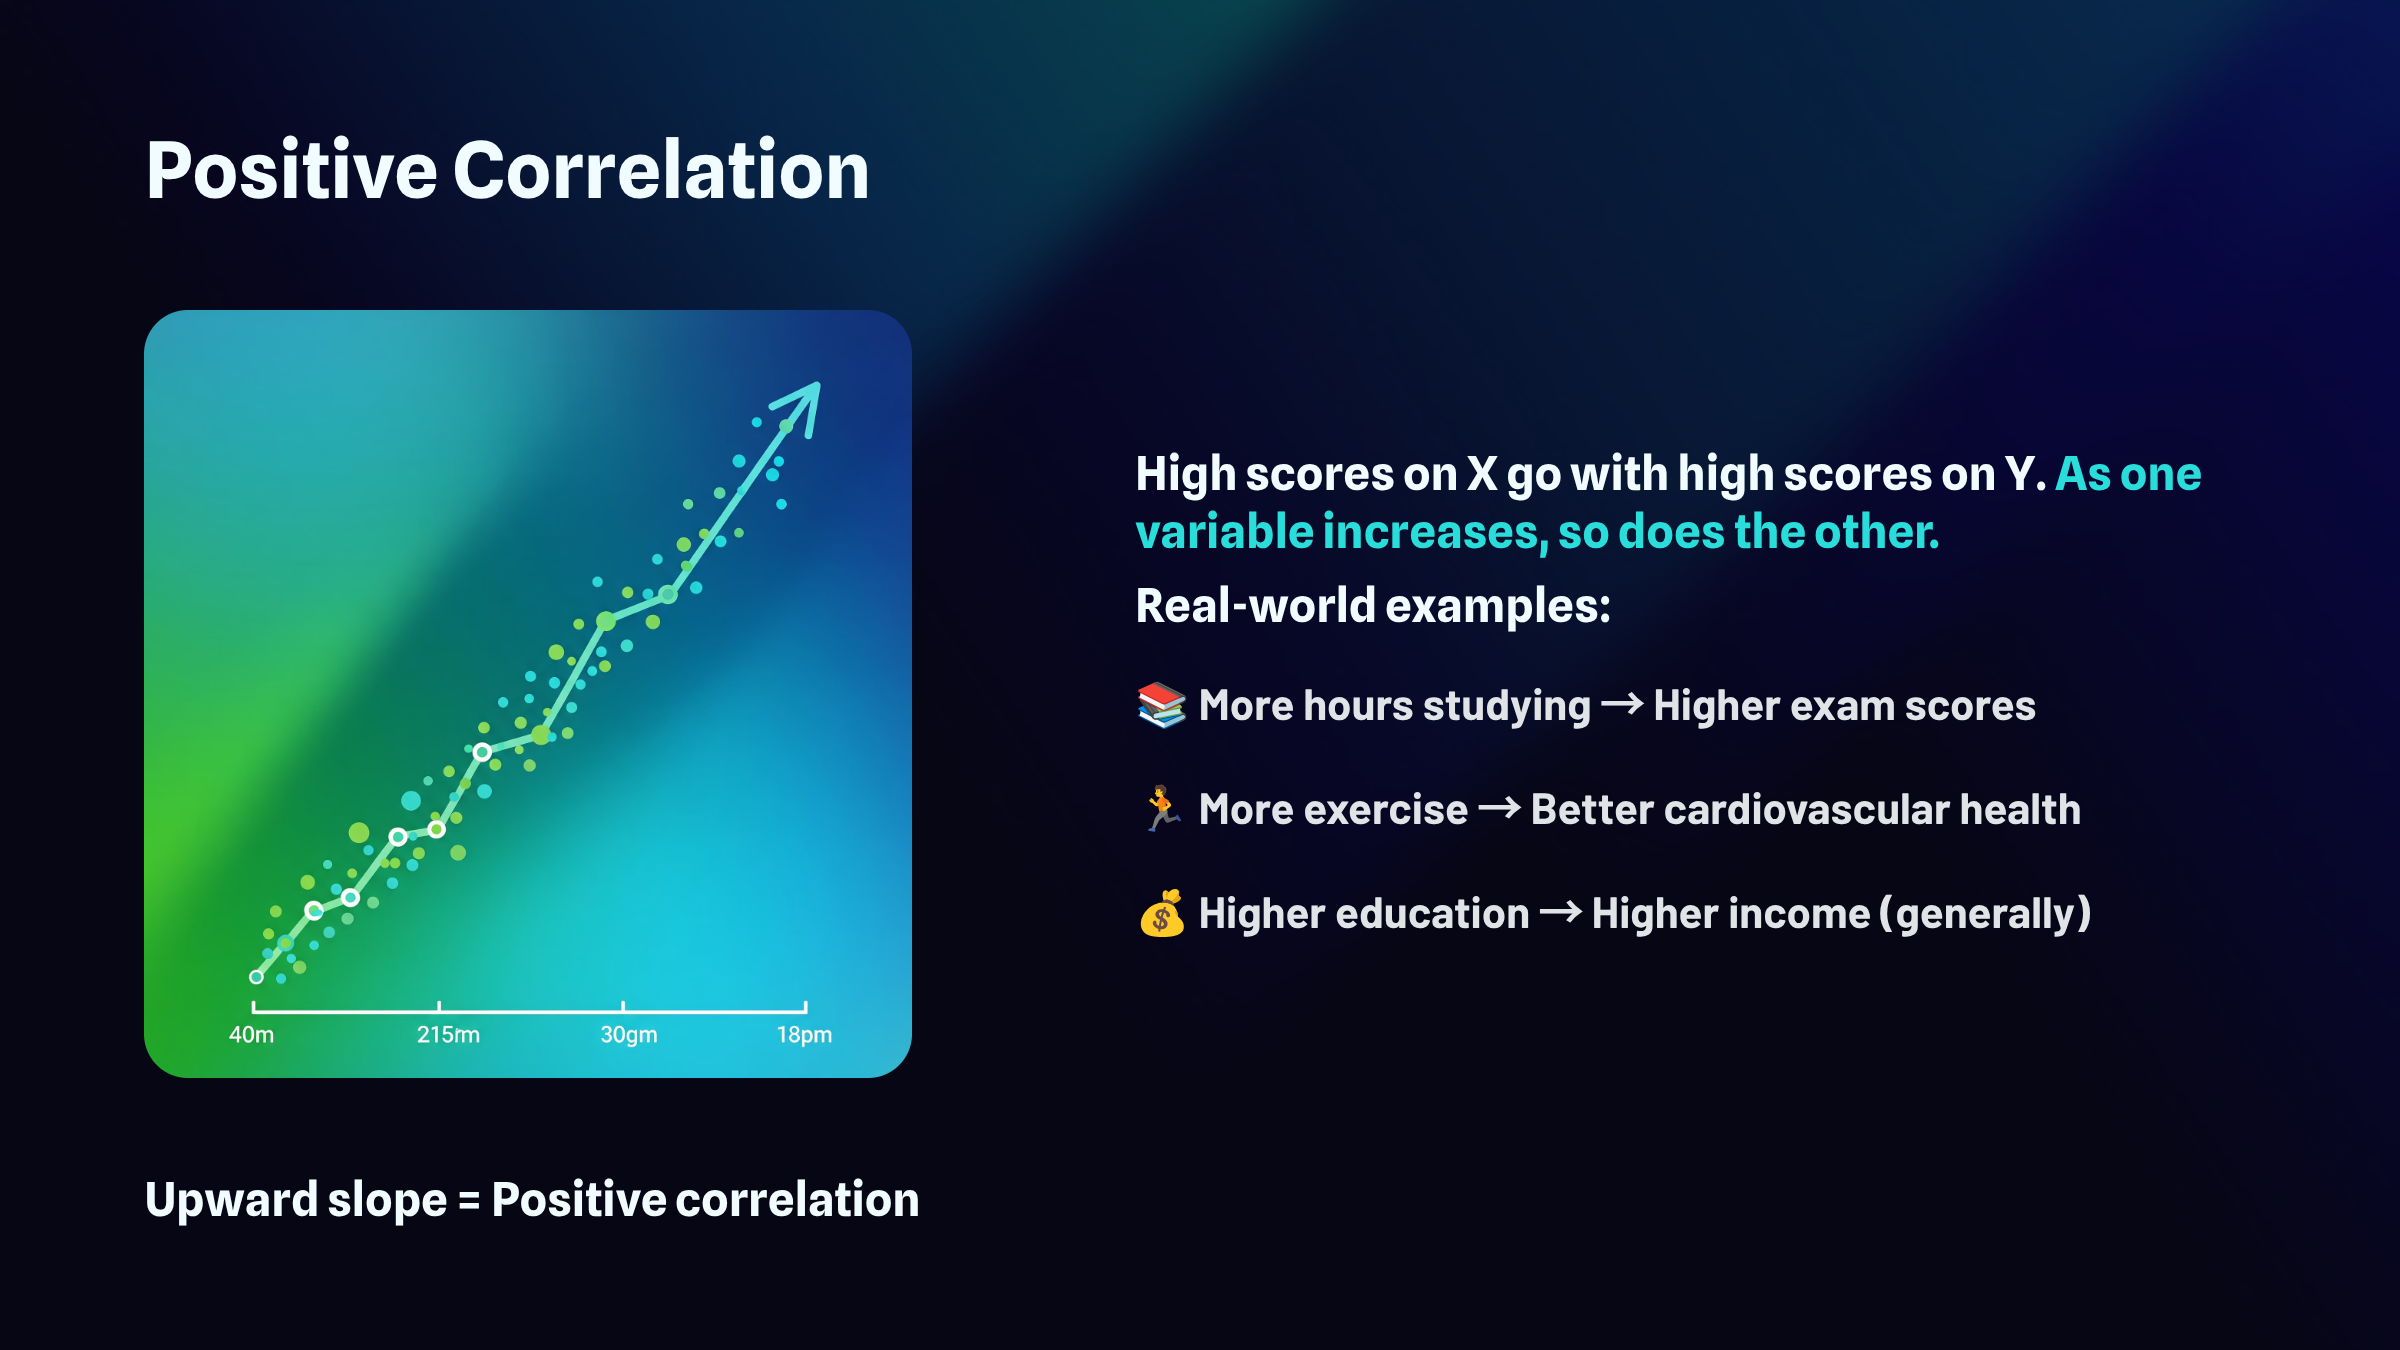
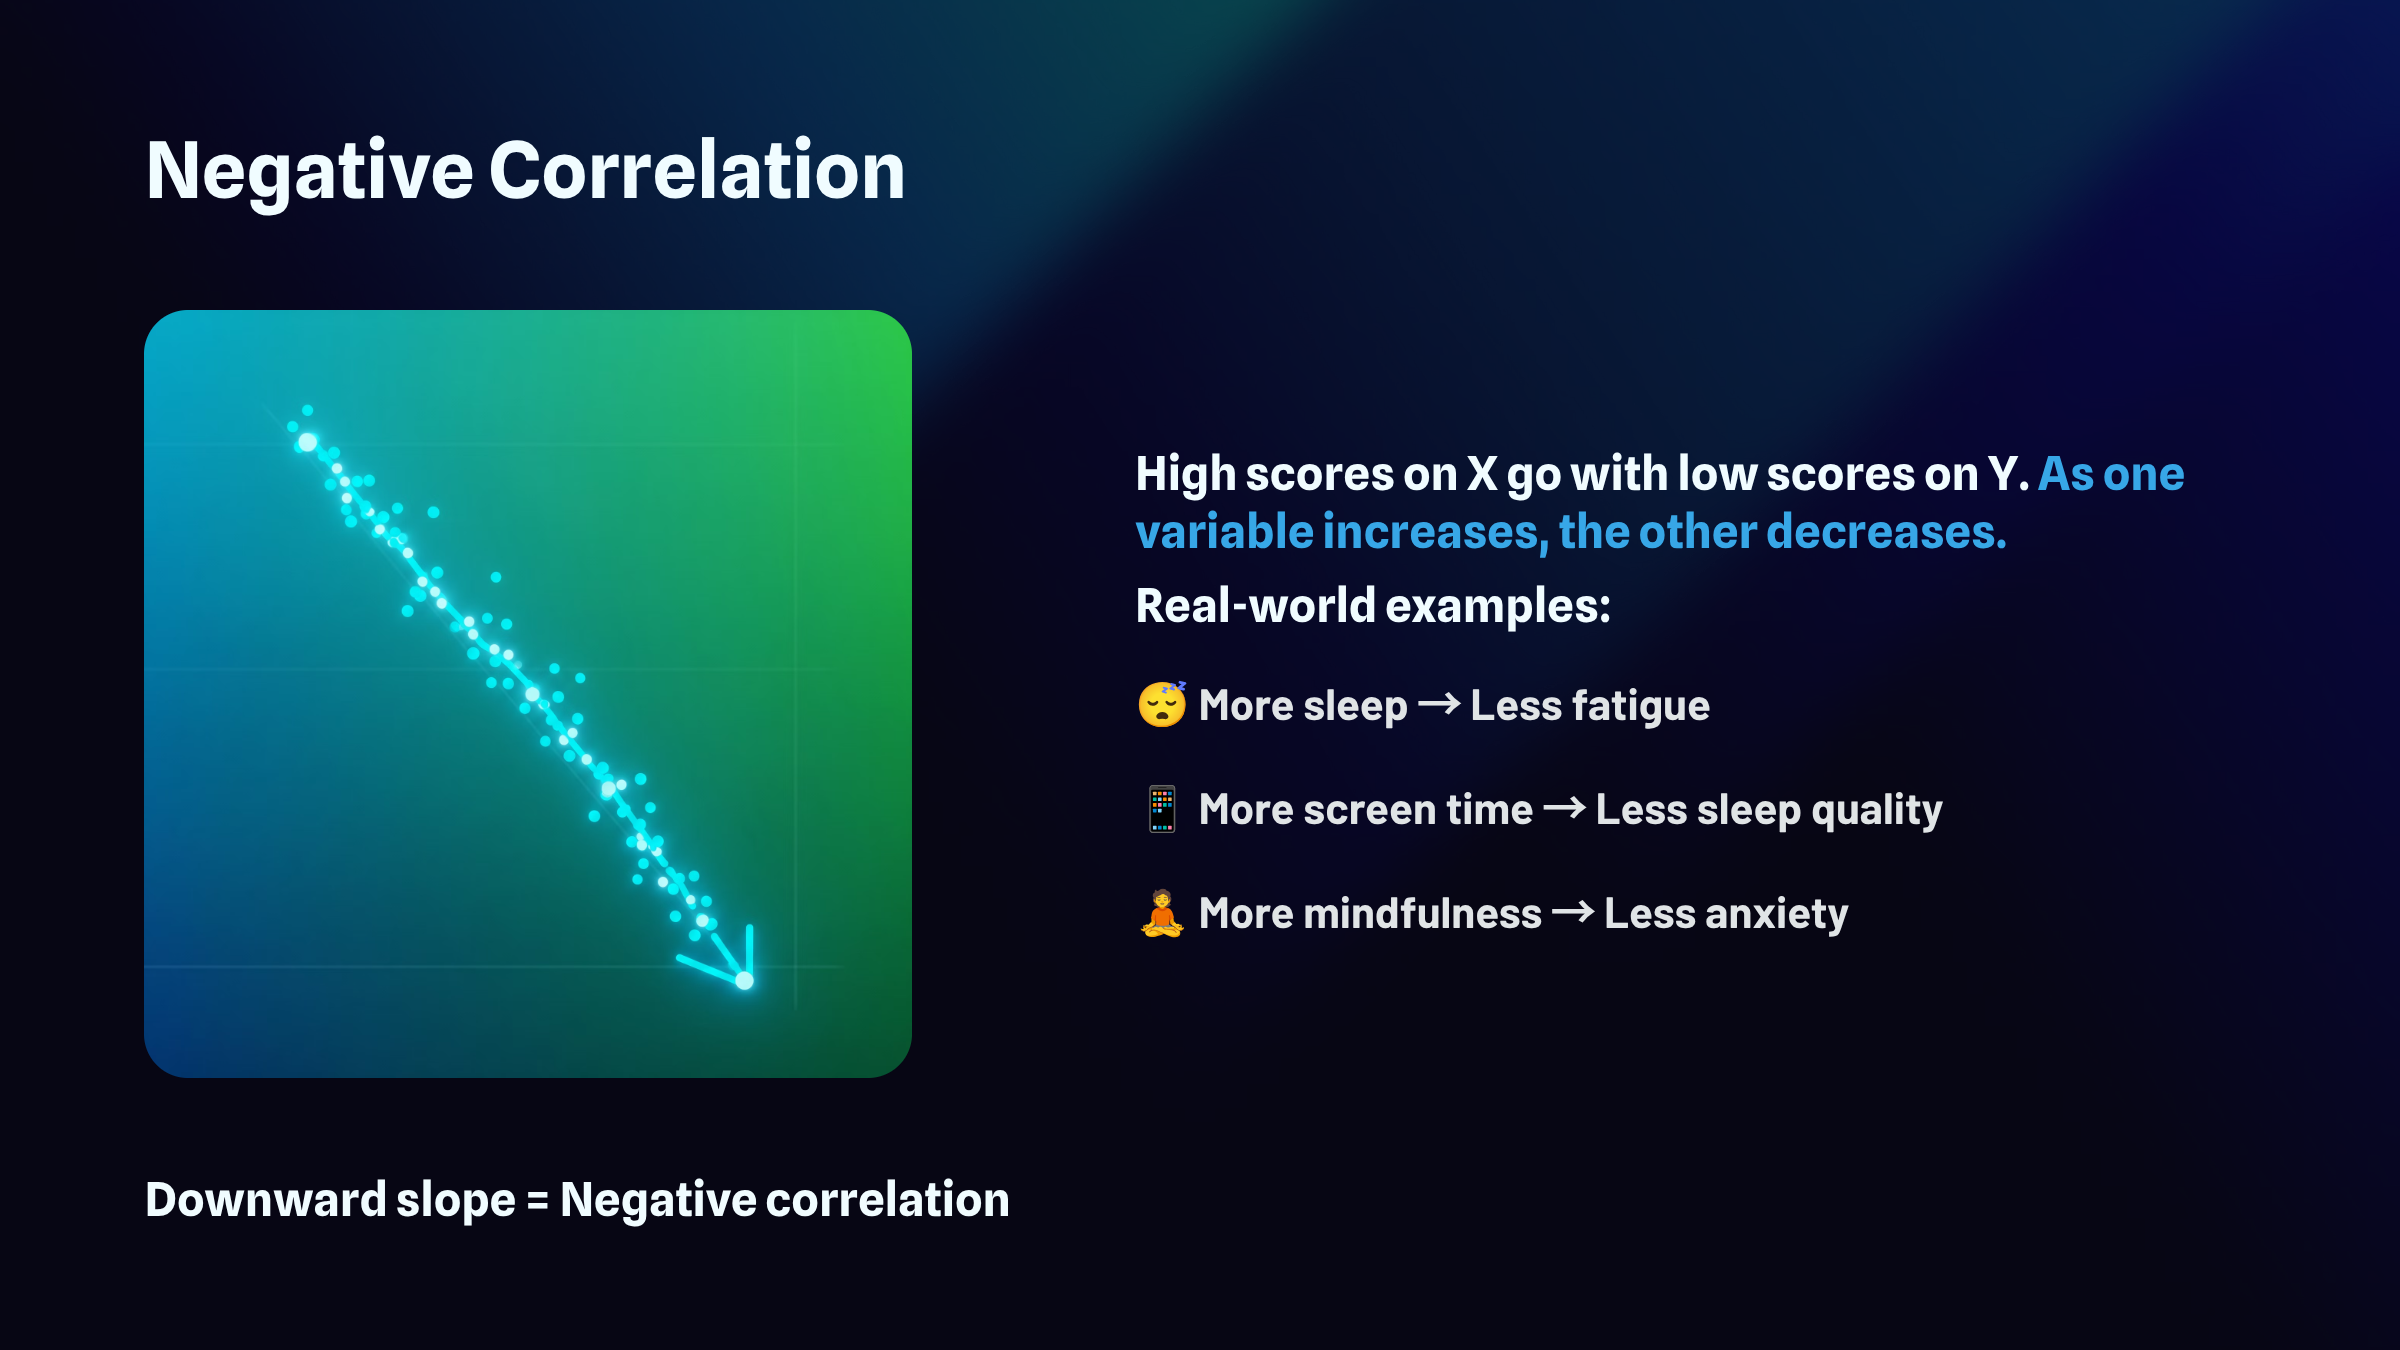
Correlations can be positive, negative, zero, and curvilinear.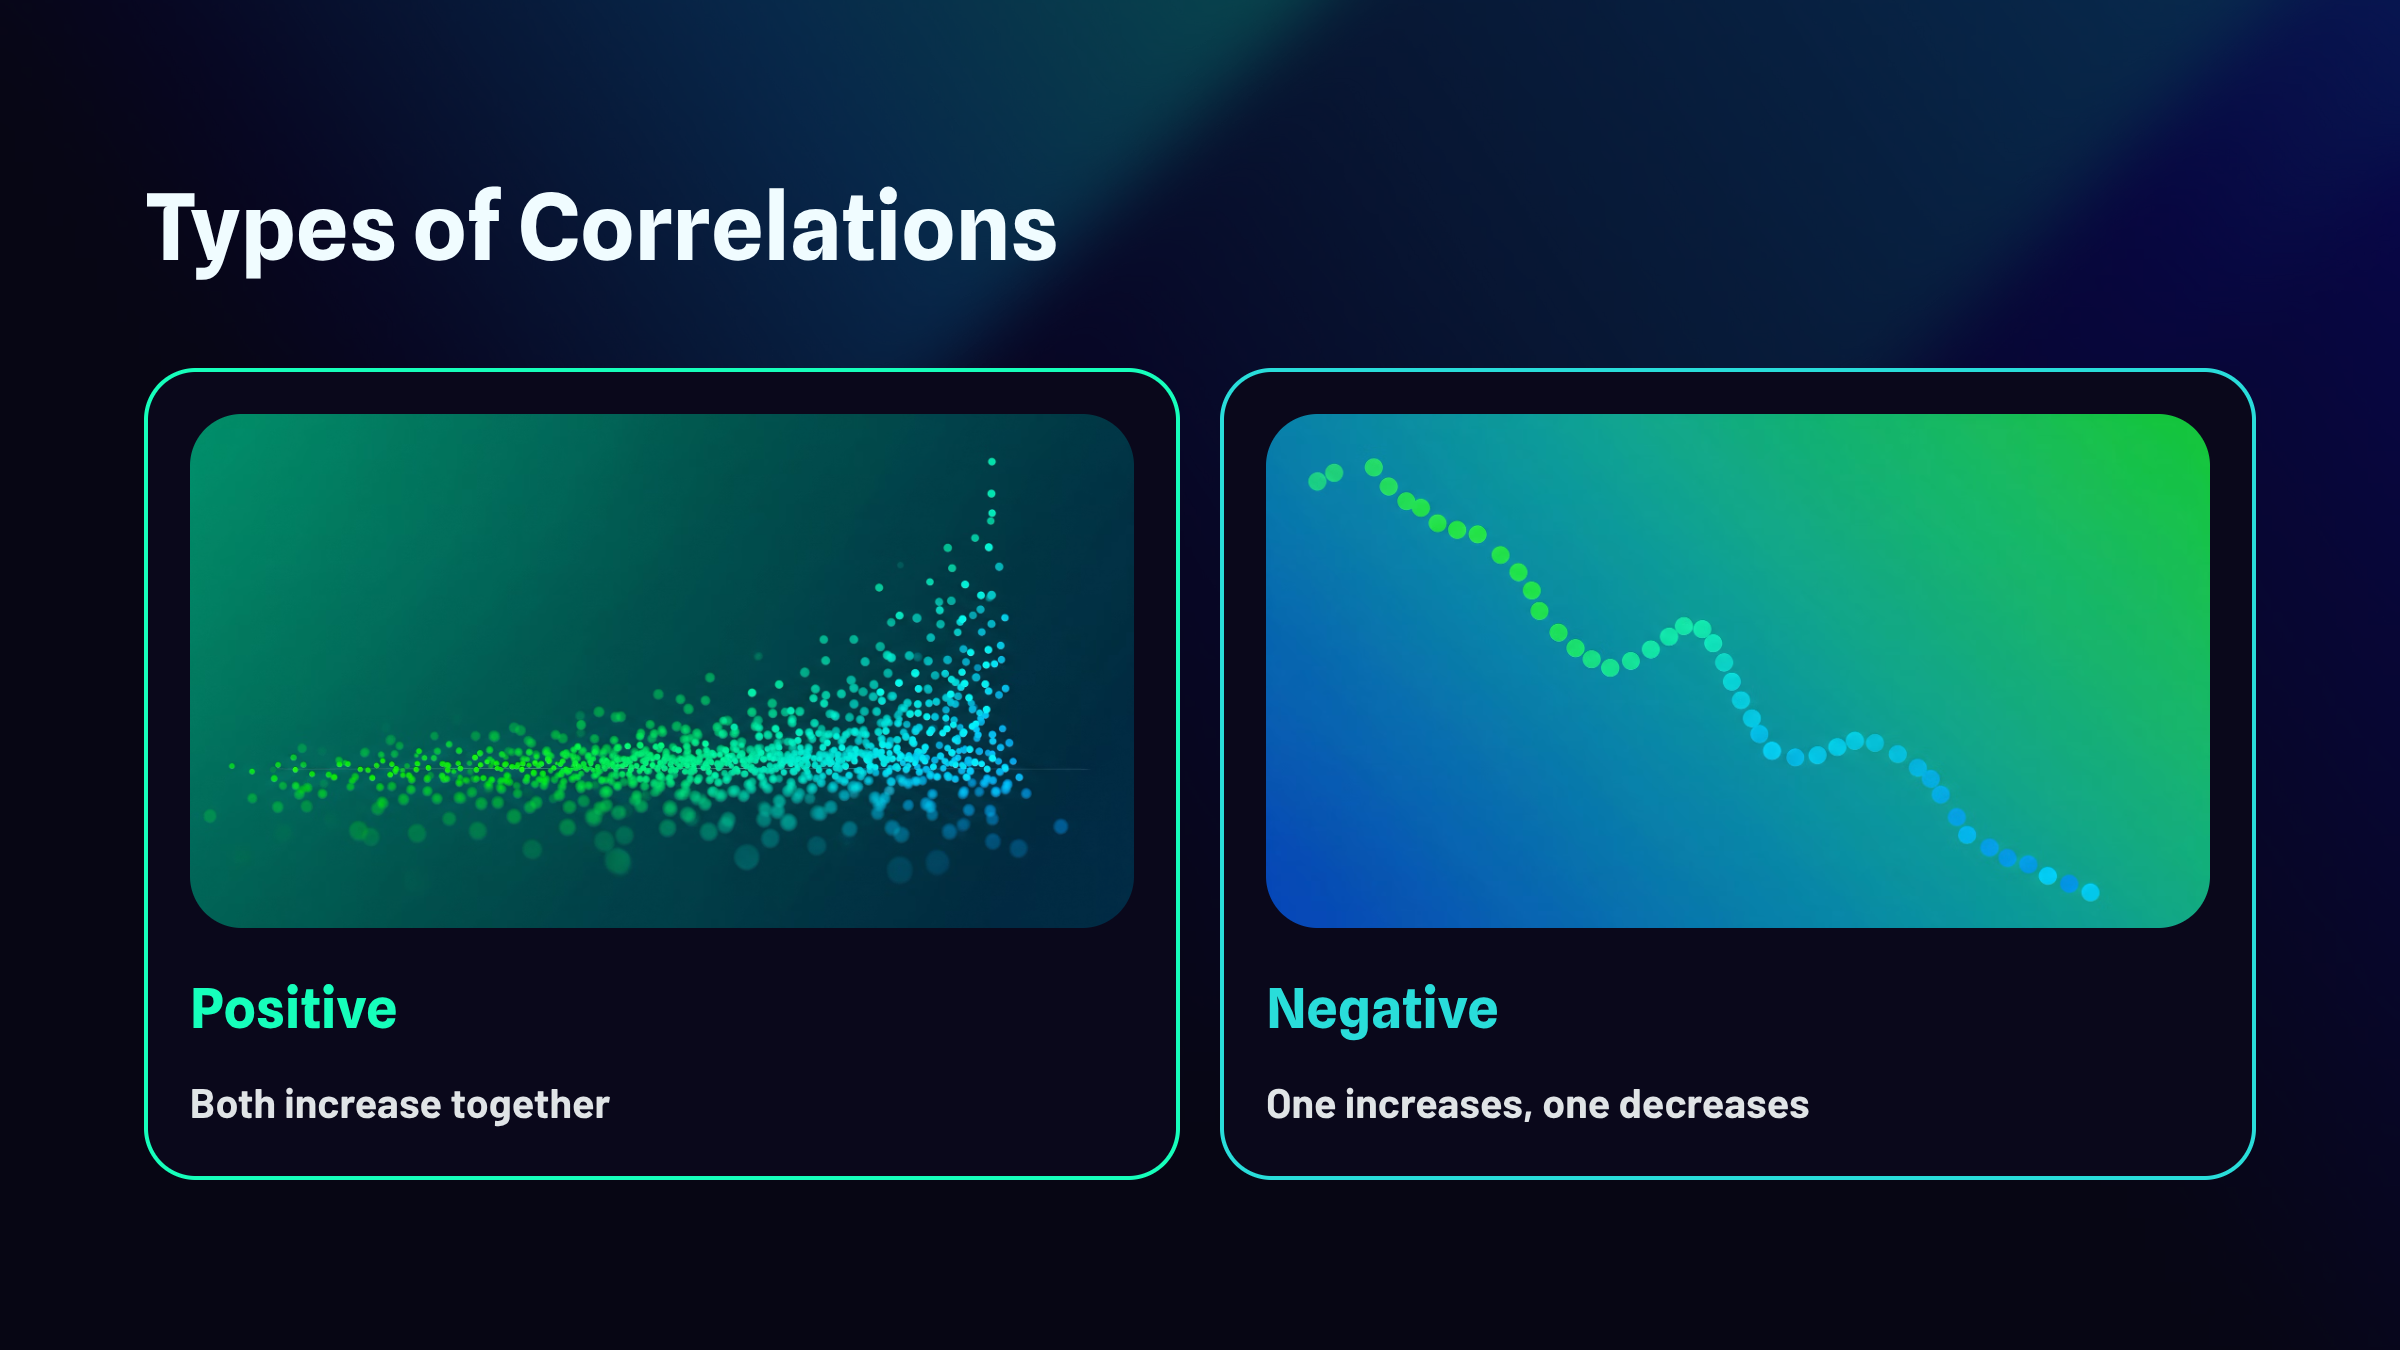
Test-Retest Reliability
Consider an important question in HRV biofeedback: the test-retest reliability of resonance frequency (RF) measurements. The RF is the stimulation rate using techniques like paced breathing or rhythmic skeletal muscle contraction that produces the greatest HRV. Studies addressing this question measure participants' RF at two different points in time, often two weeks apart, and calculate a Pearson r statistic.
Investigators use correlational studies when they cannot or should not manipulate an independent variable. Since the RF is a characteristic that participants bring into an experiment, the test-retest reliability question falls into the "cannot manipulate" category.
A Correlation's Properties
The Pearson r is a single number that captures everything you need to know about a linear correlation. Rather than staring at a scatterplot and guessing whether the relationship looks strong or weak, you can compute this coefficient and get a precise summary. Two properties embedded in this one number tell you different things about the relationship you're examining.
The sign of the correlation, whether it's positive or negative, reveals the direction of the relationship. A positive r means the variables move together in the same direction: as one increases, the other tends to increase as well. A negative r means they move in opposite directions: as one increases, the other tends to decrease.
The magnitude of the correlation, which ranges from 0 to 1 when you ignore the sign, tells you how strong the relationship is. This is where many students get tripped up. A correlation of negative 0.85 is just as strong as a correlation of positive 0.85. The negative sign only indicates direction, not weakness. When evaluating strength, pretend the sign isn't there and focus solely on how close the number is to 1.
The full range of possible r values extends from negative 1.00 to positive 1.00. At the extremes, you find perfect relationships. A correlation of positive 1.00 represents a perfect positive relationship, meaning every single data point falls exactly on a straight line that slopes upward. A correlation of negative 1.00 represents a perfect negative relationship, where every point falls exactly on a line that slopes downward. Right in the middle sits zero, indicating no linear relationship whatsoever. The points scatter randomly with no discernible pattern. Most real-world correlations fall somewhere between these landmarks, capturing relationships that exist but contain plenty of variability around the trend.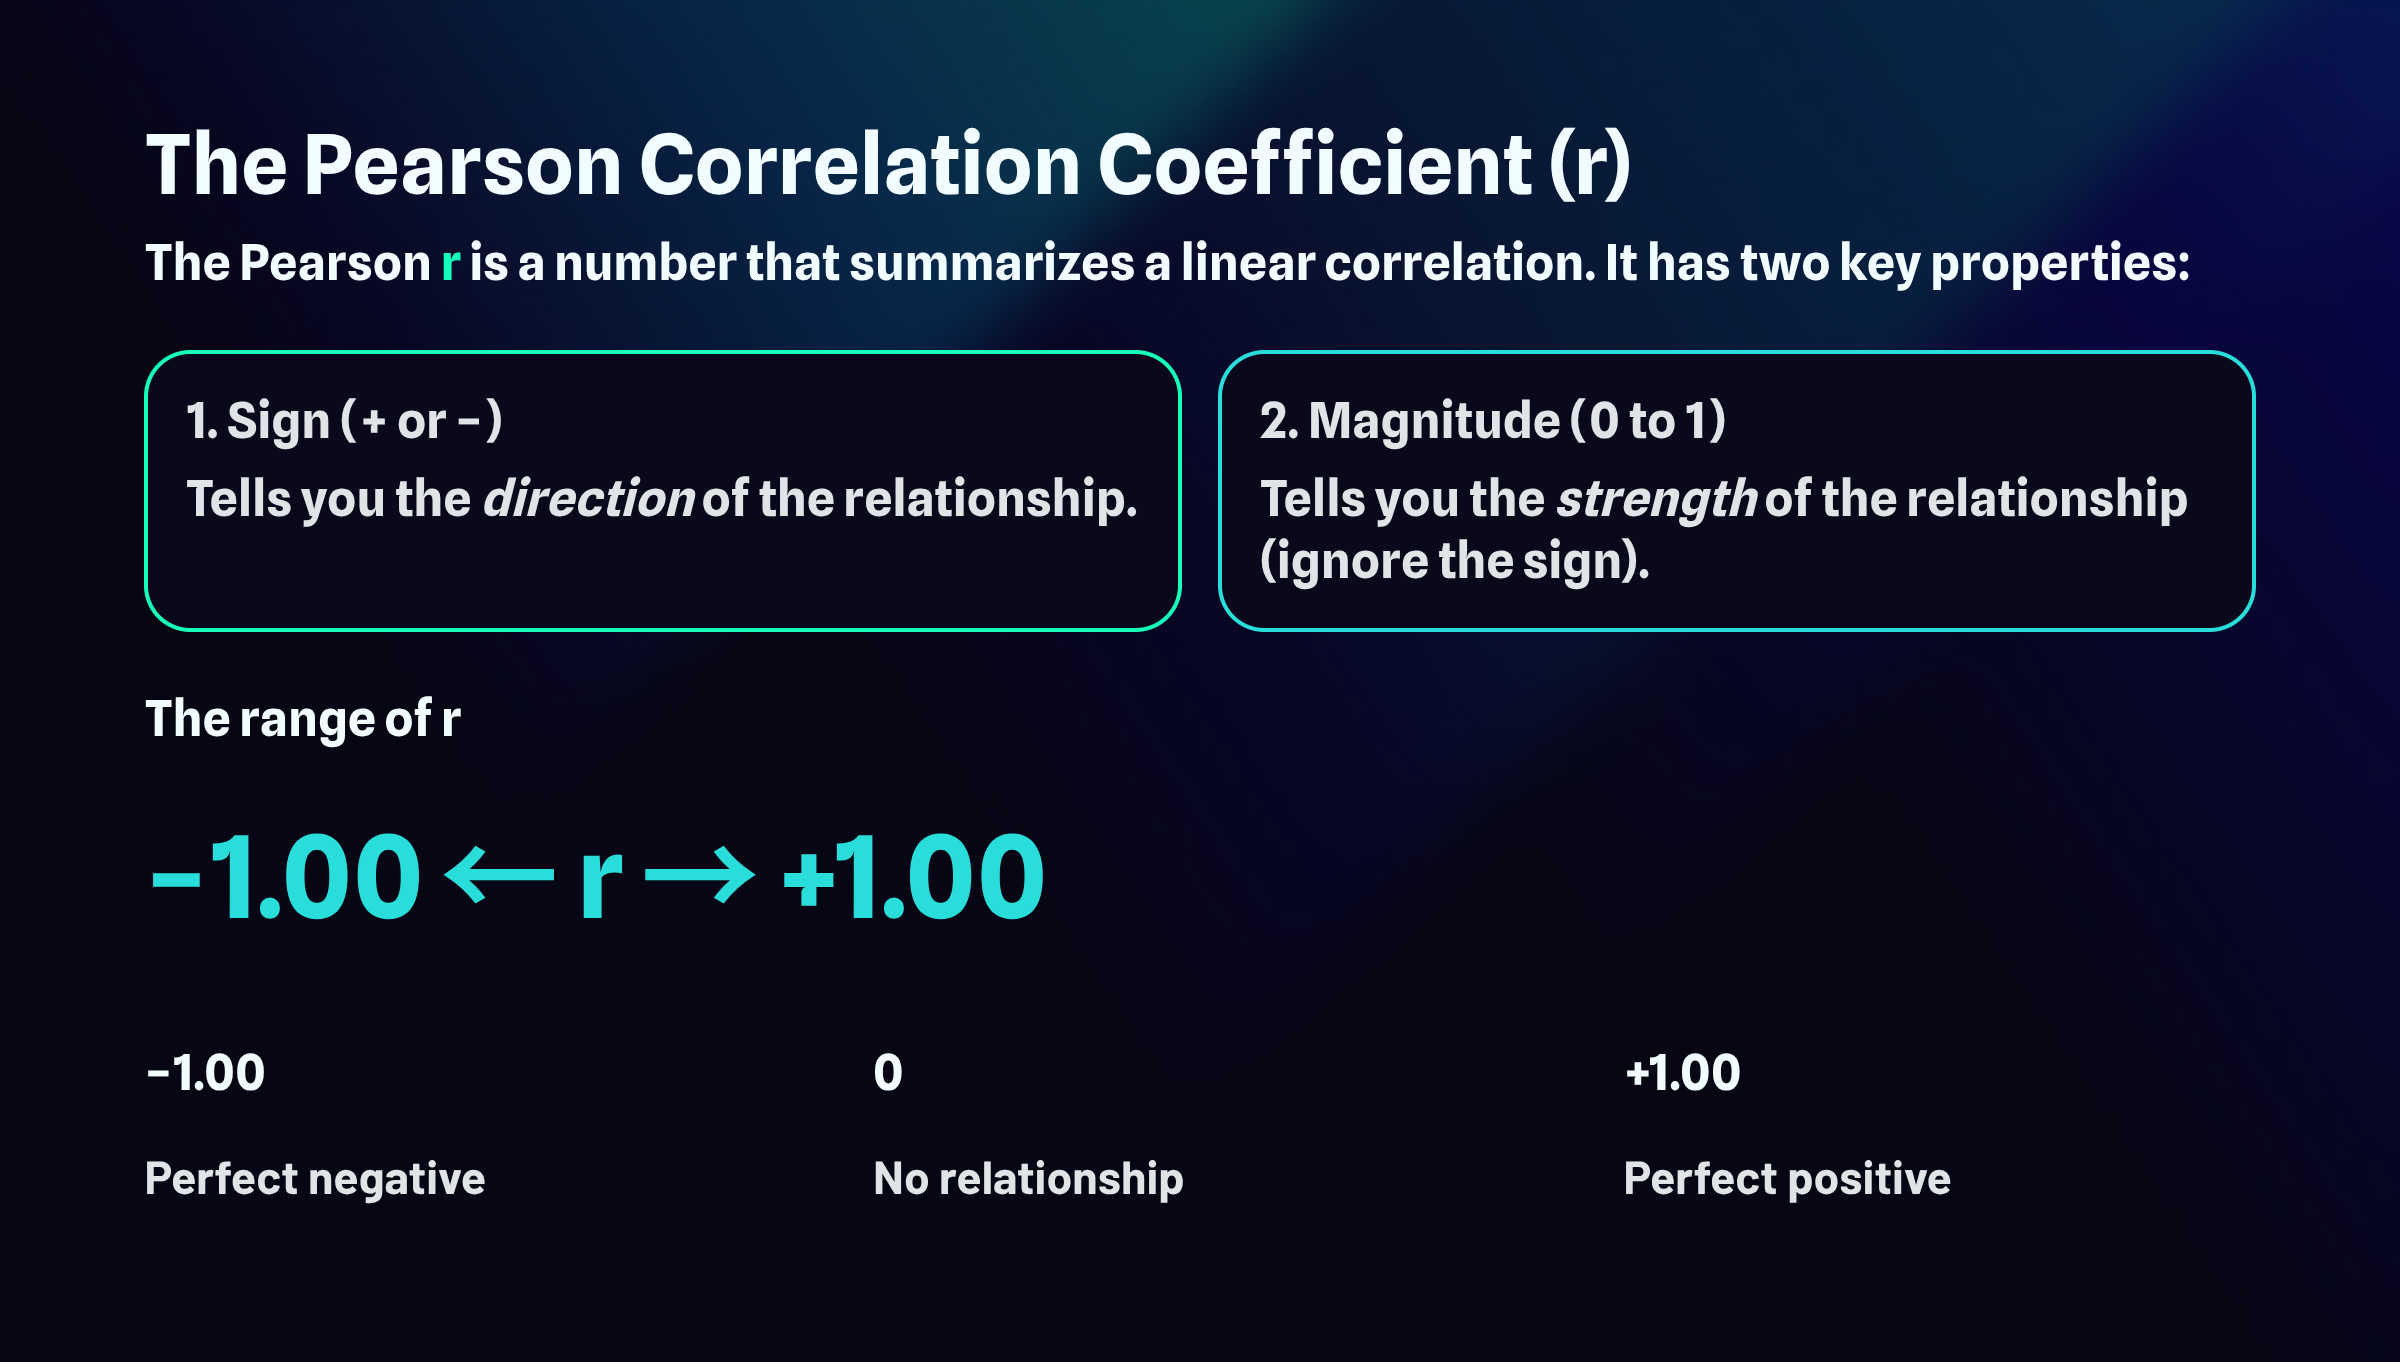
Finally, a correlation's probability is the likelihood of seeing your data assuming the null hypothesis (chance) is already true. Probabilities less than 0.05 could signal a real association between two variables.
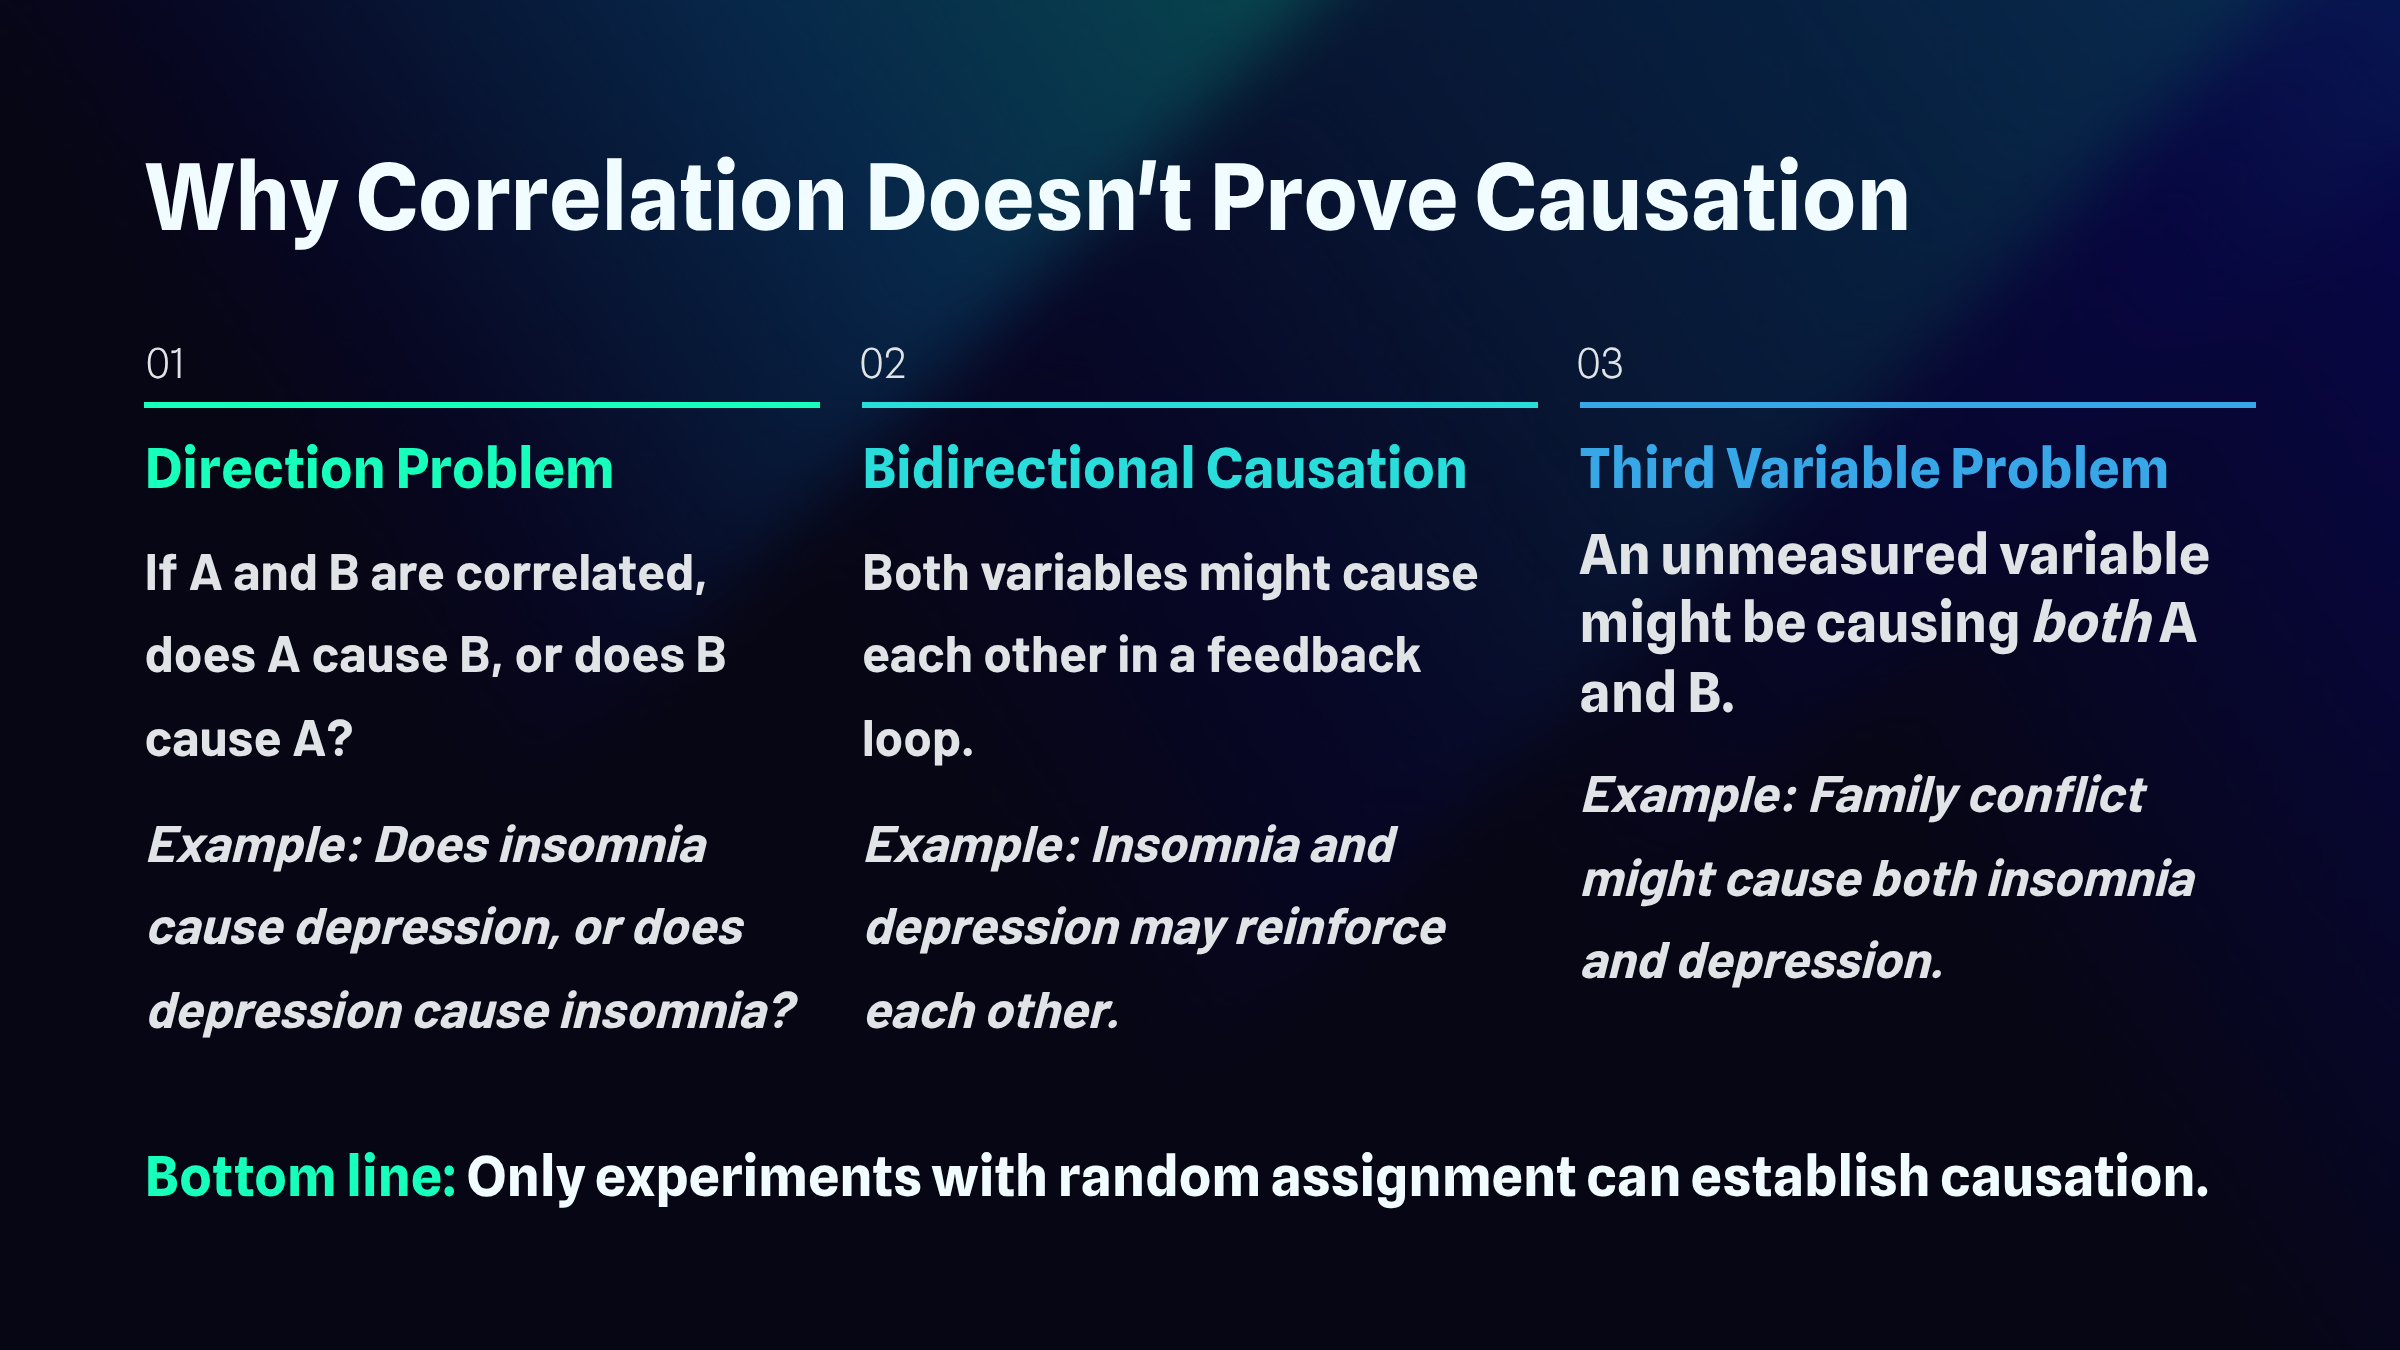
Why Correlation Doesn't Prove Causation
When two variables move together in a predictable pattern, we call that a correlation. But here's where many people stumble: observing that two things are related tells us nothing about whether one actually causes the other. This distinction trips up everyone from casual news readers to seasoned researchers, and understanding why requires examining three fundamental problems: the direction problem, bidirectional causation, and the third-variable problem.
The Direction Problem
Imagine you discover that people who report poor sleep also tend to score higher on measures of depression. Your first instinct might be to conclude that insomnia causes depression, and that interpretation feels intuitive. After all, anyone who has tossed and turned through a sleepless night knows how miserable it feels the next day. But hold on. This is the direction problem. The correlation alone cannot tell you which way the causal arrow points. It's equally plausible that depression causes insomnia. People struggling with depression often experience racing thoughts, early morning awakening, or hypersomnia. The data showing a relationship between sleep problems and depression looks identical regardless of which variable is actually driving the other.
Bidirectional Causation
The plot thickens when you consider that both directions might be true simultaneously. This is bidirectional causation. Insomnia and depression may operate as partners in a destructive dance, each one amplifying the other. Poor sleep disrupts emotional regulation and depletes the cognitive resources needed to cope with stress, making depression worse. Depression, in turn, disrupts sleep architecture and circadian rhythms, making insomnia worse. This feedback loop can trap people in a downward spiral where the original cause becomes impossible to identify. The correlation you observe represents the tangled outcome of mutual influence rather than a clean, one-way causal relationship.
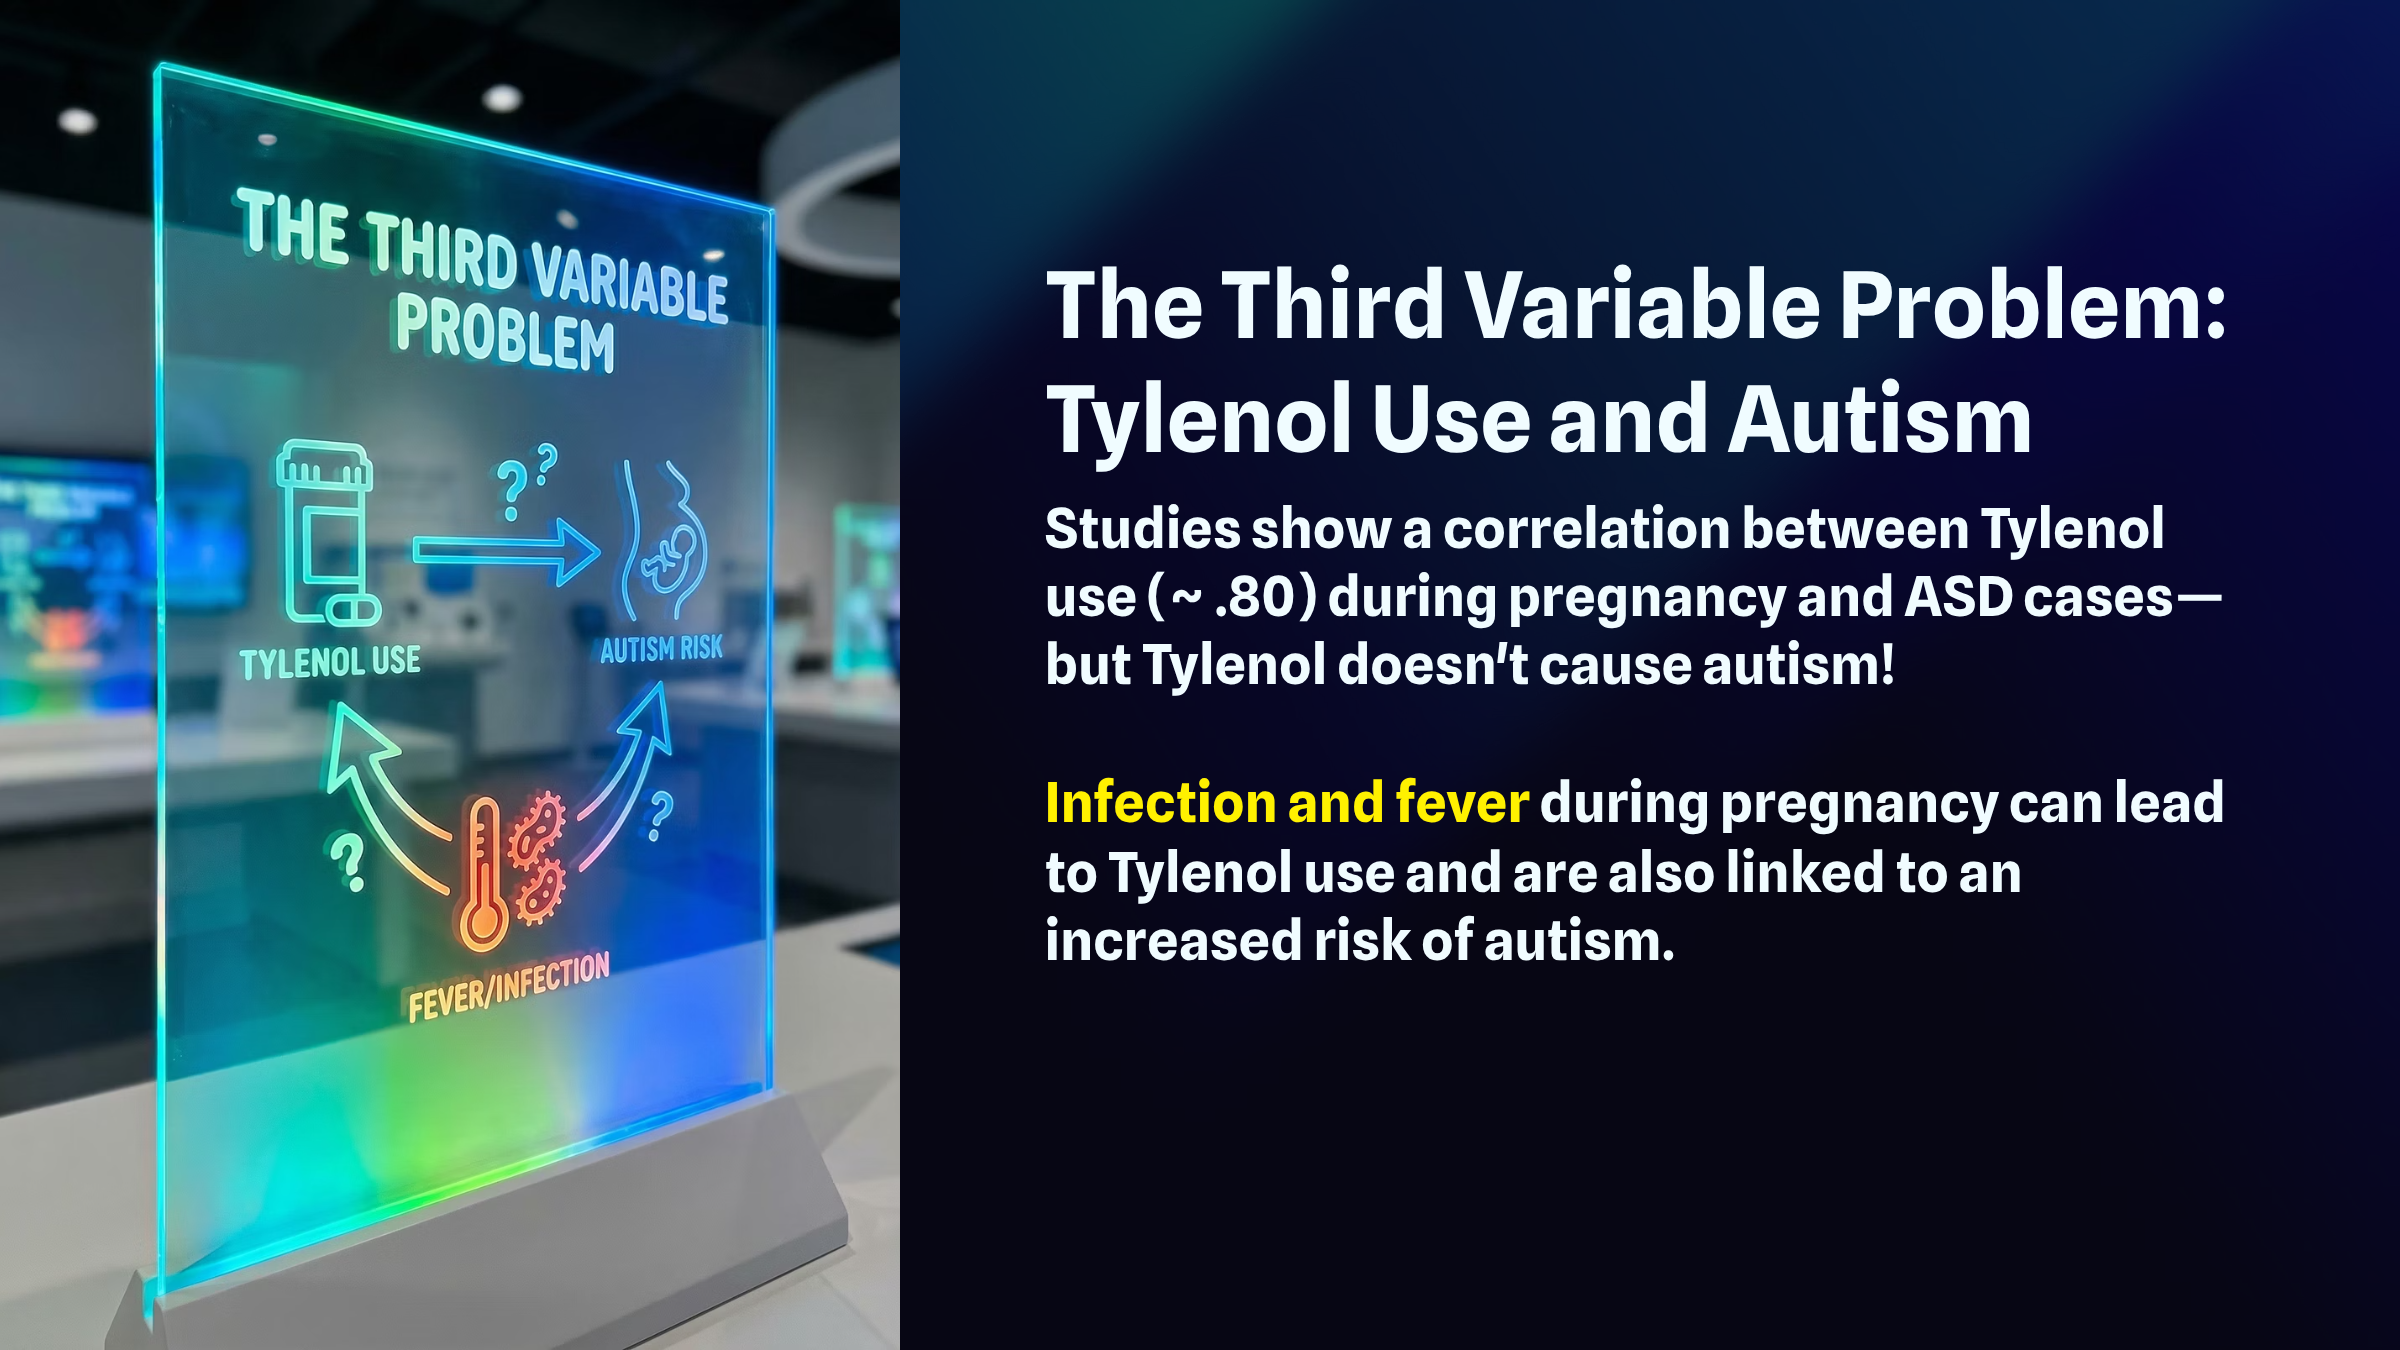
The Third Variable Problem
Perhaps the most insidious threat to causal inference comes from variables lurking outside your analysis entirely. This is the third variable problem. Suppose family conflict is the true culprit behind both insomnia and depression. A chaotic home environment floods the nervous system with stress hormones that interfere with sleep while simultaneously creating the hopelessness and helplessness that characterize depression. In this scenario, insomnia and depression are correlated not because either one causes the other, but because they share a common cause. The relationship between them is essentially a statistical illusion, an artifact of their mutual connection to something you never measured.
The bottom line is that correlational studies, no matter how large or carefully conducted, cannot establish internal validity: that one variable causes another. Only true experiments, where researchers randomly assign participants to different conditions and manipulate variables directly, can rule out these alternative explanations and support genuine causal conclusions.

📺 Watch: Correlation vs. Causality: Freakonomics Movie
Quasi-Experimental Designs: Close but Not Quite
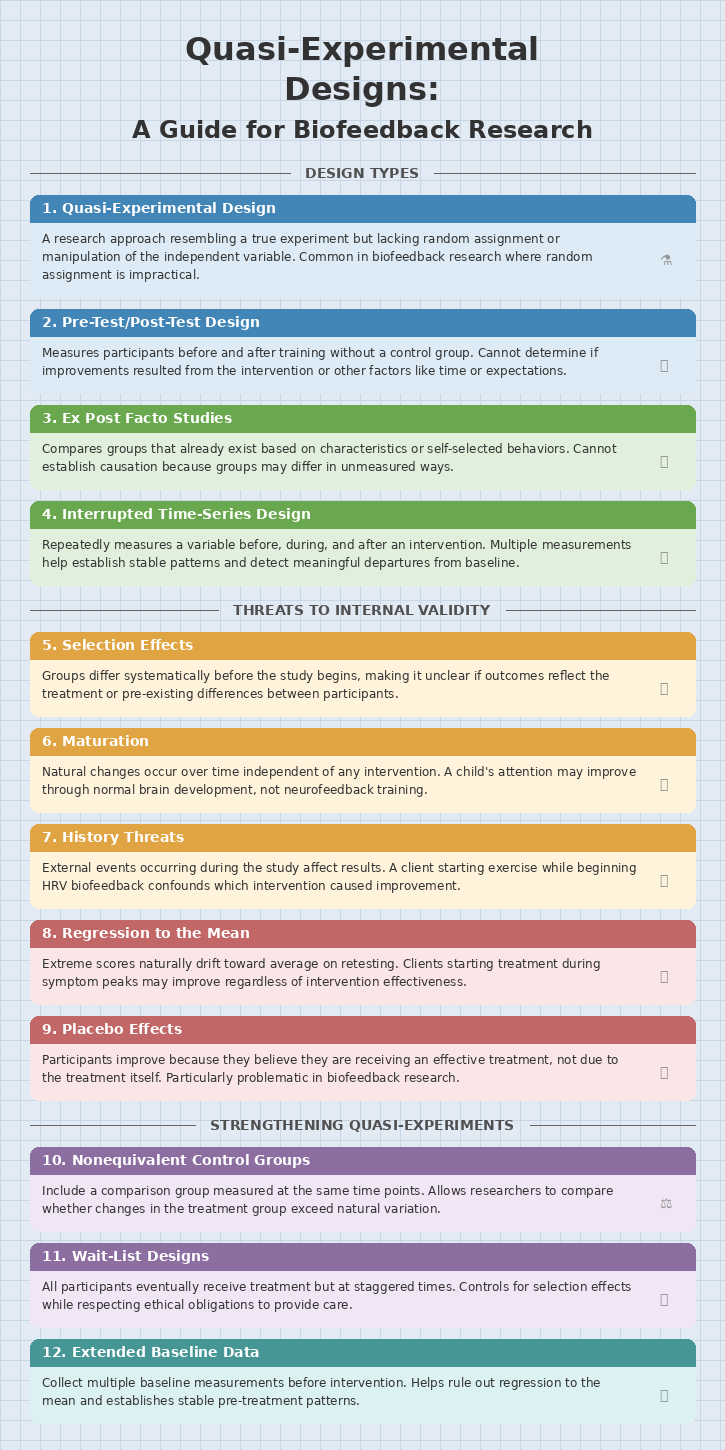
When researchers want to establish that a treatment actually causes an improvement, they ideally conduct a true experiment with random assignment. However, biofeedback practitioners and researchers often face situations where random assignment is impractical or unethical. Enter the quasi-experimental design, a research approach that resembles a true experiment in structure but lacks either the manipulation of the independent variable or the random assignment of participants to conditions.
These designs bridge the gap between experimental rigor and real-world application, allowing researchers to investigate causal questions when traditional methods are not feasible. While quasi-experiments sacrifice some internal validity, they gain external realism by studying phenomena in authentic clinical settings where biofeedback actually takes place.
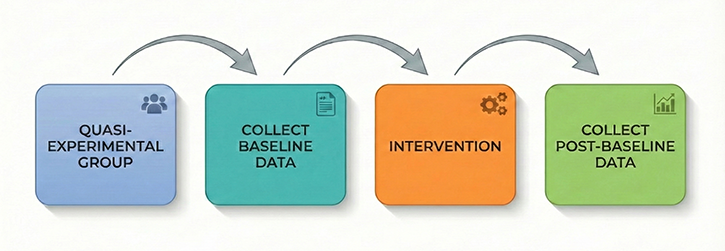
Pre-Test/Post-Test Designs: Measuring Change Without a Control
The most common quasi-experimental approach in biofeedback practice is the pre-test/post-test design, where researchers measure participants on the dependent variable before and after administering training. A practitioner might measure a client's heart rate variability coherence scores before beginning resonance frequency breathing training and again after ten sessions.
While this approach seems intuitive, it contains a fundamental flaw: without a control group receiving no treatment or an alternative intervention, you cannot determine whether observed improvements resulted from the biofeedback itself or from other factors. The client might have improved simply because time passed, because they expected to get better, or because they made other lifestyle changes during the training period.
Threats to Internal Validity: Why Improvements May Not Be What They Seem
Several specific threats undermine the conclusions you can draw from pre-test/post-test designs. Maturation refers to natural changes that occur simply because time passes. A child receiving neurofeedback for attention difficulties may show improvement partly because the brain naturally develops greater self-regulation capacity with age.
History threats involve external events occurring simultaneously with treatment that could influence outcomes. If a client begins HRV biofeedback during the same month they start a new exercise program, any cardiovascular improvements might reflect the exercise rather than the biofeedback.
The placebo effect poses a particularly thorny challenge in biofeedback research because clients who believe they are receiving an effective treatment often show genuine physiological and psychological improvements regardless of the treatment's actual efficacy.
Additionally, regression to the mean creates problems when clients begin training during a symptom peak. A person who starts neurofeedback when their anxiety is at its worst may naturally return toward their average anxiety level over time, creating the illusion that the treatment caused the improvement.
Researchers randomly assign participants to the experimental or control group.
The Confounding Problem in Symptom-Based Research
Confounding becomes especially problematic when the dependent variable is a symptom that naturally waxes and wanes, such as depression, chronic pain, or anxiety. Consider a client who seeks HRV biofeedback training when their depressive symptoms are most severe. By the time they complete training several weeks later, their symptoms may have naturally remitted regardless of any treatment received. This phenomenon, sometimes called "natural recovery" or "spontaneous remission," can make ineffective treatments appear successful.
Researchers address this threat by including nonequivalent control groups, participants who do not receive the treatment but are measured at the same time points. In a nonequivalent control group pretest-posttest design, both groups complete baseline and follow-up assessments, allowing researchers to compare whether changes in the treatment group exceed what occurs naturally in untreated individuals.
Ex Post Facto Studies: Comparing Existing Groups
The Latin phrase "ex post facto" means "after the fact," and ex post facto studies examine differences between groups that already exist based on some characteristic or self-selected behavior. A researcher might compare the HRV of 30-year-olds versus 60-year-olds, or examine stress levels in people who chose biofeedback training versus those who chose mindfulness meditation.
These comparisons seem straightforward, but they contain hidden traps. In the age comparison, the 30-year-olds may differ from 60-year-olds in more ways than age alone; they might have grown up with different dietary habits, exercise patterns, or environmental exposures. In the treatment comparison, individuals who chose biofeedback might differ systematically from those who chose meditation; perhaps they have higher socioeconomic status, greater faith in technology, or more severe baseline symptoms.
Because ex post facto studies do not create independent variable levels through manipulation and do not randomly assign participants to conditions, they cannot establish cause-and-effect relationships between the grouping variable and the outcome.
Interrupted Time-Series Designs: Tracking Change Over Time
A more sophisticated quasi-experimental approach is the interrupted time-series design, which involves repeatedly measuring a variable before, during, and after an intervention. Rather than taking just two measurements, researchers collect data across many time points to establish stable patterns and detect meaningful departures from those patterns.
In biofeedback research, this might involve tracking a client's daily tension headache frequency for several weeks before beginning EMG biofeedback training, continuing to track headaches throughout training, and monitoring for several weeks after training ends. If headache frequency remains stable during baseline, drops sharply when training begins, and stays low afterward, this pattern provides stronger evidence for a treatment effect than a simple pre-post comparison. The multiple baseline measurements help rule out regression to the mean, while the extended observation period makes it easier to identify whether changes align temporally with the intervention.
The Necessity of Experimental Validation
For these reasons, practitioners should exercise caution when making claims about training effectiveness until their protocols have been evaluated by experimental studies capable of ruling out confounding variables. The requirement for impartial experimental validation becomes particularly acute when a practitioner has a financial or reputational stake in a protocol and its related hardware or software.
A clinician who developed a proprietary neurofeedback protocol and sells the associated equipment has strong incentives to believe the protocol works, making it difficult to evaluate outcomes objectively. Independent replication by researchers without conflicts of interest provides the strongest evidence for treatment efficacy.
When evaluating published research on biofeedback interventions, look for studies that include appropriate control groups, use random assignment when possible, measure outcomes with validated instruments, and report effect sizes alongside statistical significance. Experienced researchers understand that statistical significance is the lowest hurdle, since p-values cannot assess whether an outcome is important. Even when treatment effects are statistically significant (p < 0.05), small effect sizes warn that the findings may not be replicable.

Strengthening Quasi-Experimental Designs in Practice
While quasi-experiments cannot achieve the internal validity of true experiments, thoughtful design choices can strengthen causal inferences. Researchers can match participants in treatment and comparison groups on relevant characteristics such as age, symptom severity, and prior treatment history. They can include multiple comparison groups or use wait-list designs where all participants eventually receive treatment but at staggered times.
Statistical techniques like analysis of covariance can adjust for baseline differences between groups. In biofeedback research specifically, practitioners can strengthen their case studies by collecting extended baseline data, using standardized assessment instruments, tracking multiple outcome measures, and following clients for extended periods after training ends.
These strategies do not transform quasi-experiments into true experiments, but they help rule out alternative explanations and build a more compelling case for treatment effects. The goal is not methodological purity but rather honest, rigorous inquiry that acknowledges limitations while extracting the maximum possible insight from the available evidence.
Check Your Understanding: Experimental Design
- Why can only experimental designs establish cause-and-effect relationships between variables?
- Explain the difference between internal validity and external validity. Can a study have one without the other?
- Jane conducted a pre-test/post-test study of HRV biofeedback for anxiety and found significant improvement. What threats to internal validity might explain her results besides the biofeedback itself?
- Why have there been few double-blind biofeedback studies, and what alternatives do researchers have?
- A correlational study finds that people who practice biofeedback have lower blood pressure. Why cannot you conclude that biofeedback causes lower blood pressure?
Randomized Controlled Trials: The Gold Standard
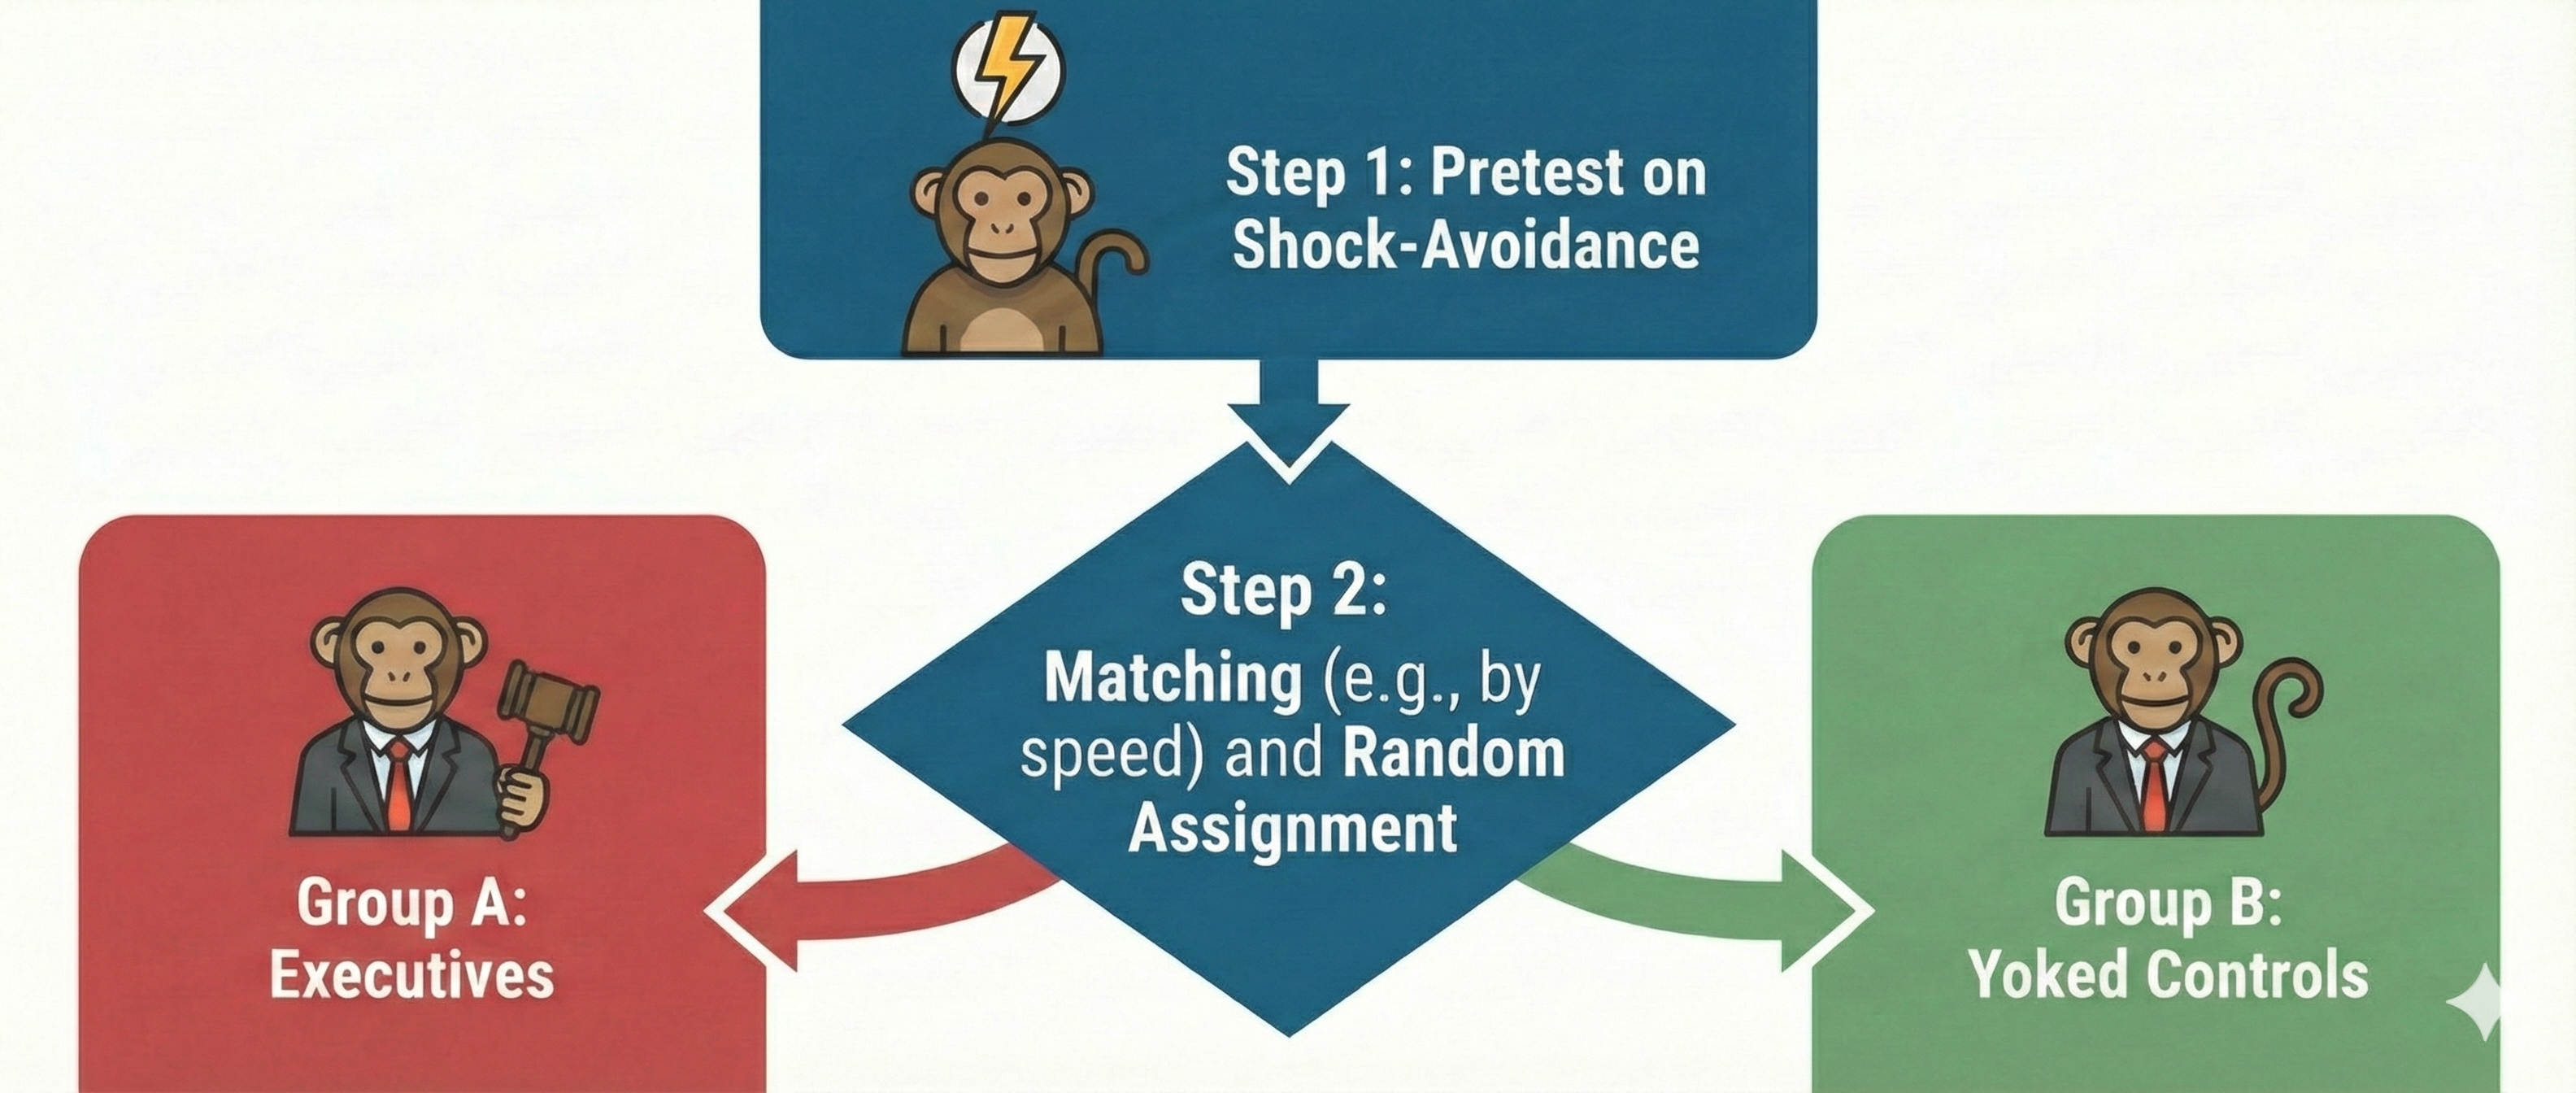
In a randomized controlled trial (RCT), researchers manipulate an independent variable and randomly assign participants to conditions with or without prior matching on participant variables (Bordens & Abbott, 2022). A RCT can achieve strong internal validity because matching and random assignment increase the likelihood that the groups will be identical on relevant participant characteristics at the start of an experiment.
Watch: Randomized Controlled Trials vs. Observational StudiesThe Brady (1958) "Executive Monkey" study is a textbook example of how to confound an experiment, and it offers important lessons that remain relevant today.


The Executive Monkey Study: A Tale of Two Roles
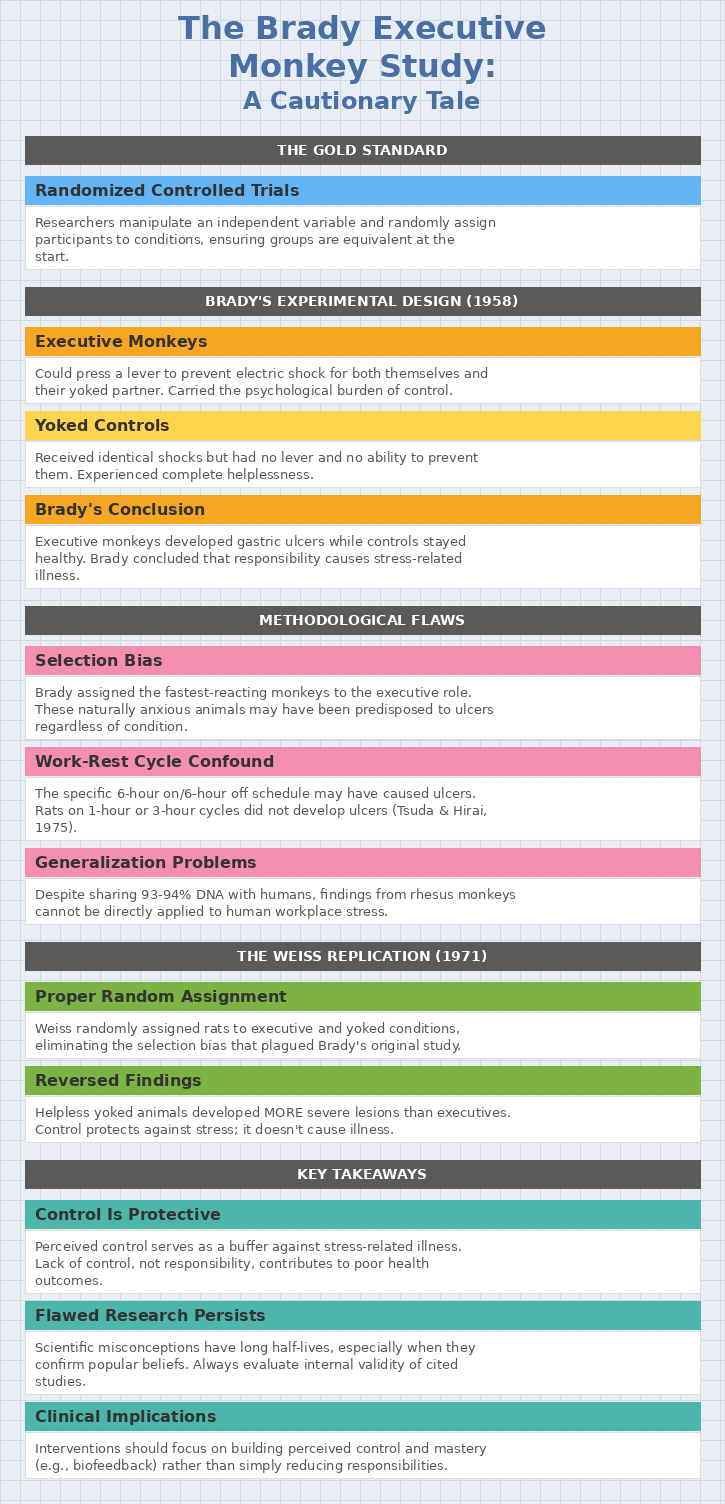
In the 1950s, as scientists were beginning to unravel the mysteries of stress, Joseph Brady conducted a fascinating but deeply flawed series of experiments that would shape psychological research for decades. Picture sixteen rhesus monkeys paired into eight groups, each facing a stark choice. One monkey in each pair, dubbed the executive monkey, sat before a lever that could prevent an impending electric shock. Its partner, the yoked control, faced the same physical threat but had no control over the situation. When a warning light flashed, the executive had a critical five-second window to press the lever and prevent shock for both animals. Failure meant that both monkeys received a painful 0.5-second shock at five milliamperes. These were not brief encounters but grueling six-hour sessions conducted twice daily for weeks on end, with the monkeys isolated in sparse individual cages between trials.
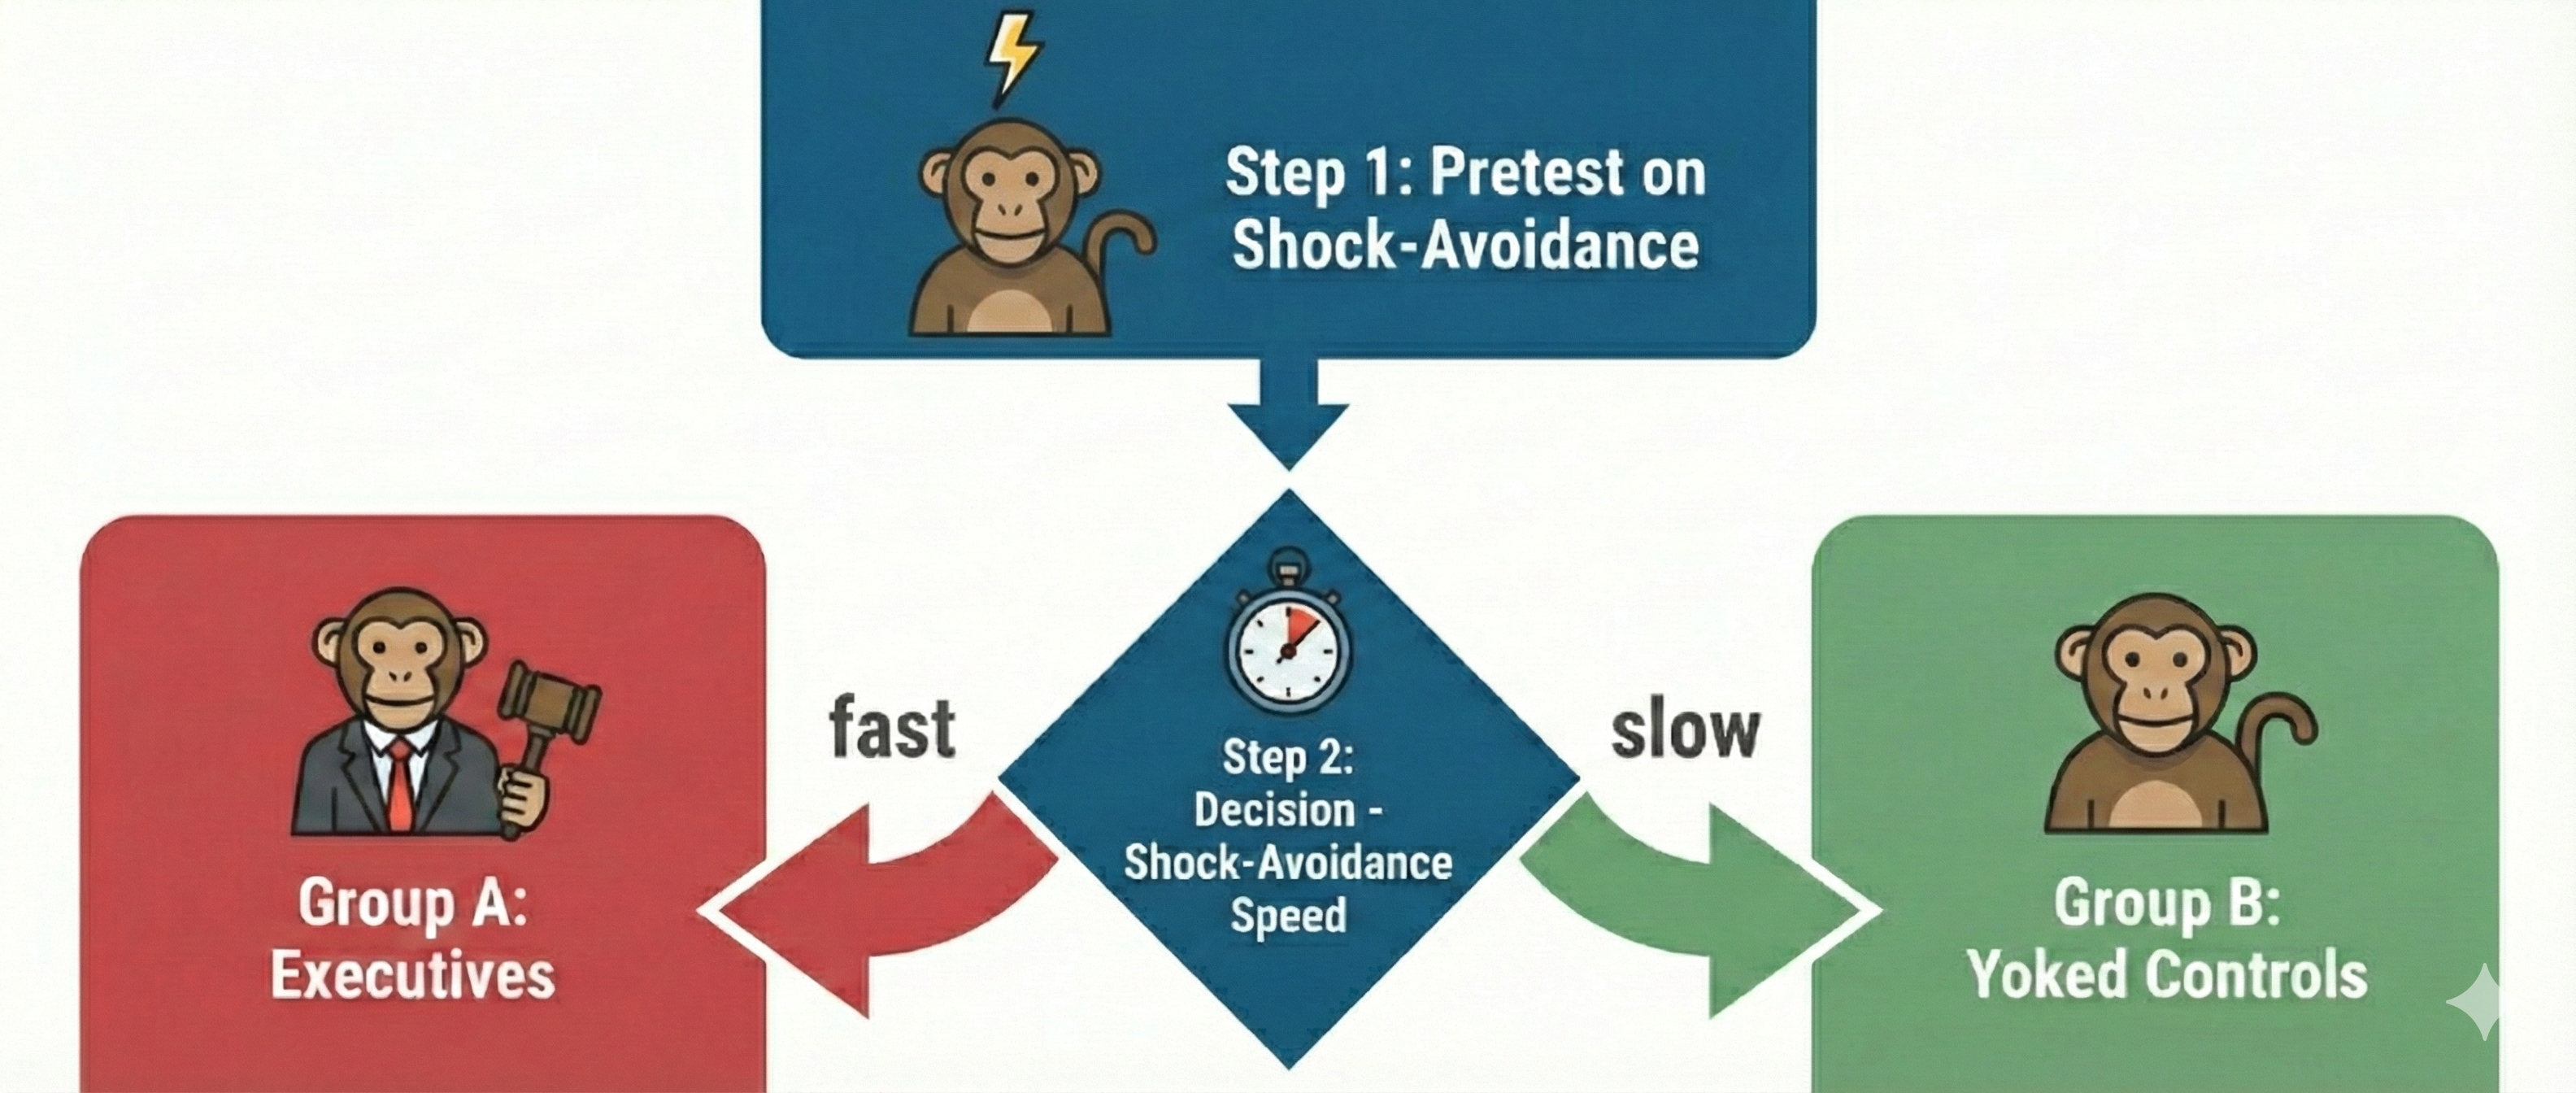
Where Brady Went Wrong: The Fatal Flaw of Selection Bias
Brady's findings seemed clear at first: the executive monkeys developed gastric ulcers at an alarming rate, while their powerless counterparts remained relatively healthy. He concluded that responsibility causes stress-related illness. However, beneath this seemingly straightforward narrative lay a devastating methodological problem.
Brady had pre-tested all monkeys on their reaction times to the warning light and then systematically assigned the fastest responders to the executive role. This introduced selection bias, a methodological flaw in which subjects are not randomly assigned, leading to skewed results. Research by Sines, Cleeland, and Adkins (1963) later revealed that animals more prone to ulcers learned avoidance responses faster than those less susceptible. In other words, Brady's executives were the most reactive, anxious monkeys of the bunch, and they may have been predisposed to develop ulcers regardless of their role. We simply cannot know whether ulcers resulted from executive responsibility or from innate temperamental differences that existed before the experiment began.
Additional Confounds: The Work-Rest Cycle Problem
The selection bias was not Brady's only misstep. Tsuda and Hirai (1975) discovered that the specific six-hour work and six-hour rest cycle Brady employed may have been the true culprit behind ulcer development. When they exposed rats to different schedules, ulcers appeared only under the six-hour cycle; rats on one-hour or three-hour work-rest schedules remained healthy. This finding suggests that Brady's results may have reflected nothing more than an unfortunate scheduling artifact rather than any meaningful relationship between control and illness. Moreover, despite sharing roughly 93-94% of our DNA with rhesus monkeys, the findings could not be generalized to humans. The very premise that workplace responsibility creates ulcers, a notion that infiltrated business and health psychology textbooks for decades, rested on a foundation of methodological quicksand.
The Weiss Replication: Control Protects, It Doesn't Harm
When Jay Weiss (1971) properly replicated the Brady study using rats with random assignment to executive and yoked conditions, he discovered something remarkable: the original findings were completely backwards. Control over stressors actually protected against stress-related illness. The helpless yoked animals, unable to influence their fate, developed more severe gastrointestinal lesions than their lever-pressing counterparts.
Human research has consistently supported this reversal. Langer and Rodin's (1976) groundbreaking work with nursing home residents demonstrated that increased control over daily decisions improved both health and survival rates. More recently, Gale and colleagues (2008) found that individuals with a higher sense of perceived control, the belief in one's ability to influence events, showed lower cardiovascular disease risk and mortality. The scientific consensus now holds that having control serves as a buffer against stress, not a burden.
Lessons for Research and Clinical Practice
The Brady Executive Monkey Study endures as a cautionary tale about the long half-life of flawed research, particularly when it confirms popular beliefs about stress and responsibility. Three essential takeaways emerge from this scientific journey. First, lack of control, not responsibility, contributes to illness. Second, educators and textbook authors often fail to evaluate the internal validity of studies they cite, perpetuating misconceptions across generations of students. Third, scientific misinformation persists stubbornly when it aligns with intuitive narratives.
Consider how this applies to clinical practice: when a client presents with stress-related symptoms and attributes them to workplace responsibility, the properly designed research suggests a different intervention target. Perhaps the real issue is their lack of perceived control over their situation, not their responsibilities themselves. This insight fundamentally shapes therapeutic approaches, suggesting that interventions aimed at building a sense of mastery and control, such as biofeedback training, may prove more effective than simply reducing workload.
Specific and Nonspecific Treatment Effects
Treatment effects can be specific and nonspecific. A specific treatment effect is a measurable symptom change associated with a measurable psychophysiological change produced by biofeedback. For example, there would be a specific treatment effect on airway resistance in a patient diagnosed with asthma if decreased resistance were correlated with increased heart rate variability.
A nonspecific treatment effect is a measurable symptom change not correlated with a specific psychophysiological change. Researchers might report that HRV biofeedback training produced larger reductions in state anxiety (situational anxiety) than Progressive Relaxation. The caveat is that the HRV and state anxiety changes were not correlated. In this case, demand characteristics may have contributed to state anxiety reduction. Since effective biofeedback and accepted medical treatments produce both specific and nonspecific treatment effects, controlling demand characteristics in clinical outcome studies is vital to ensuring internal validity and understanding the mechanisms of action.
The Challenge of Selecting an Appropriate Control Condition
A control group receives a zero level of the independent variable. While placebos are easy to administer in pharmaceutical research, selecting an appropriate control group is challenging in biofeedback research. Weak control conditions can stack the deck in favor of the experimental condition, defeating the purpose of an experiment.

No-biofeedback control groups include baseline-only, waiting list, and relaxation conditions. Participants in a baseline-only condition are only measured on the DVs and receive no treatment. Individuals assigned to a waiting list are measured on the DVs with the expectation of later biofeedback training. Participants in a relaxation condition receive instructions like Autogenic phrases. These three control strategies are not equivalent to the experimental condition because their demand characteristics are often weaker, since none of these controls provide physiological feedback, and their activities are less engaging than biofeedback training.
Biofeedback control groups include noncontingent feedback, reverse contingent feedback, and contingent feedback of an unrelated response.
In noncontingent feedback, participants receive false pre-programmed feedback that may be easy (such as heart rate) or hard (such as slow cortical potentials) to detect. Noncontingent feedback can be frustrating when participants perceive that feedback is inconsistent with internal cues and they cannot learn to control the signal. Since noncontingent feedback is inherently deceptive, researchers must explain this deception during debriefing.
Reverse contingent feedback reinforces physiological changes in the opposite direction as the experimental group, such as HRV down instead of HRV up.
Contingent feedback of an unrelated response reinforces physiological changes in a system that should not powerfully affect the DVs, such as skin conductance down versus HRV up.
Reverse contingent feedback and contingent feedback of an unrelated response can serve as effective control conditions as long as participants experience comparable engagement and training success. Reverse contingent feedback should not be used when the physiological changes could harm participants, such as training HRV down.
Questionable Research Practices: A Crisis of Integrity
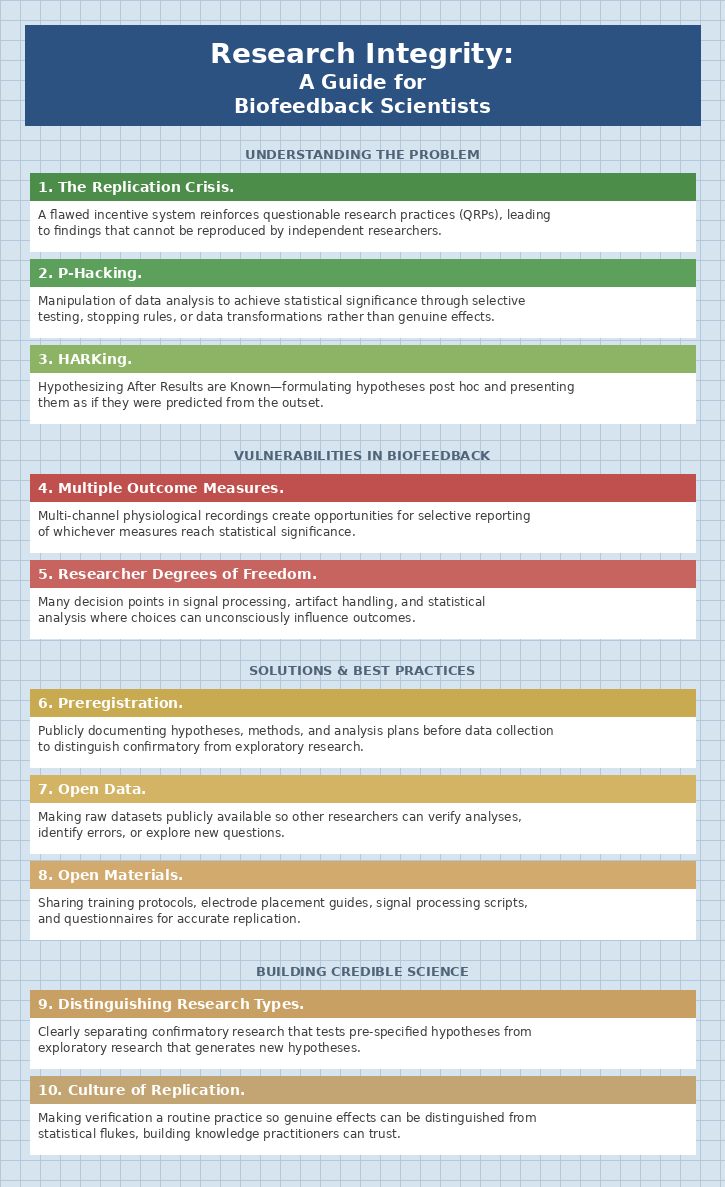
The frequent failure to replicate, or reproduce, results stems from a flawed incentive system that reinforces questionable research practices (QRPs), which are methodological and analytical behaviors that distort the scientific record without necessarily constituting outright fraud (Larson, 2019). In biofeedback and psychophysiology, where researchers often collect multiple physiological measures simultaneously, the temptation to selectively report only those outcomes that reach statistical significance can be particularly strong. When a heart rate variability study measures respiratory sinus arrhythmia, low-frequency power, high-frequency power, and total power, the opportunity exists to report whichever measure happens to show the desired effect while quietly omitting the others.

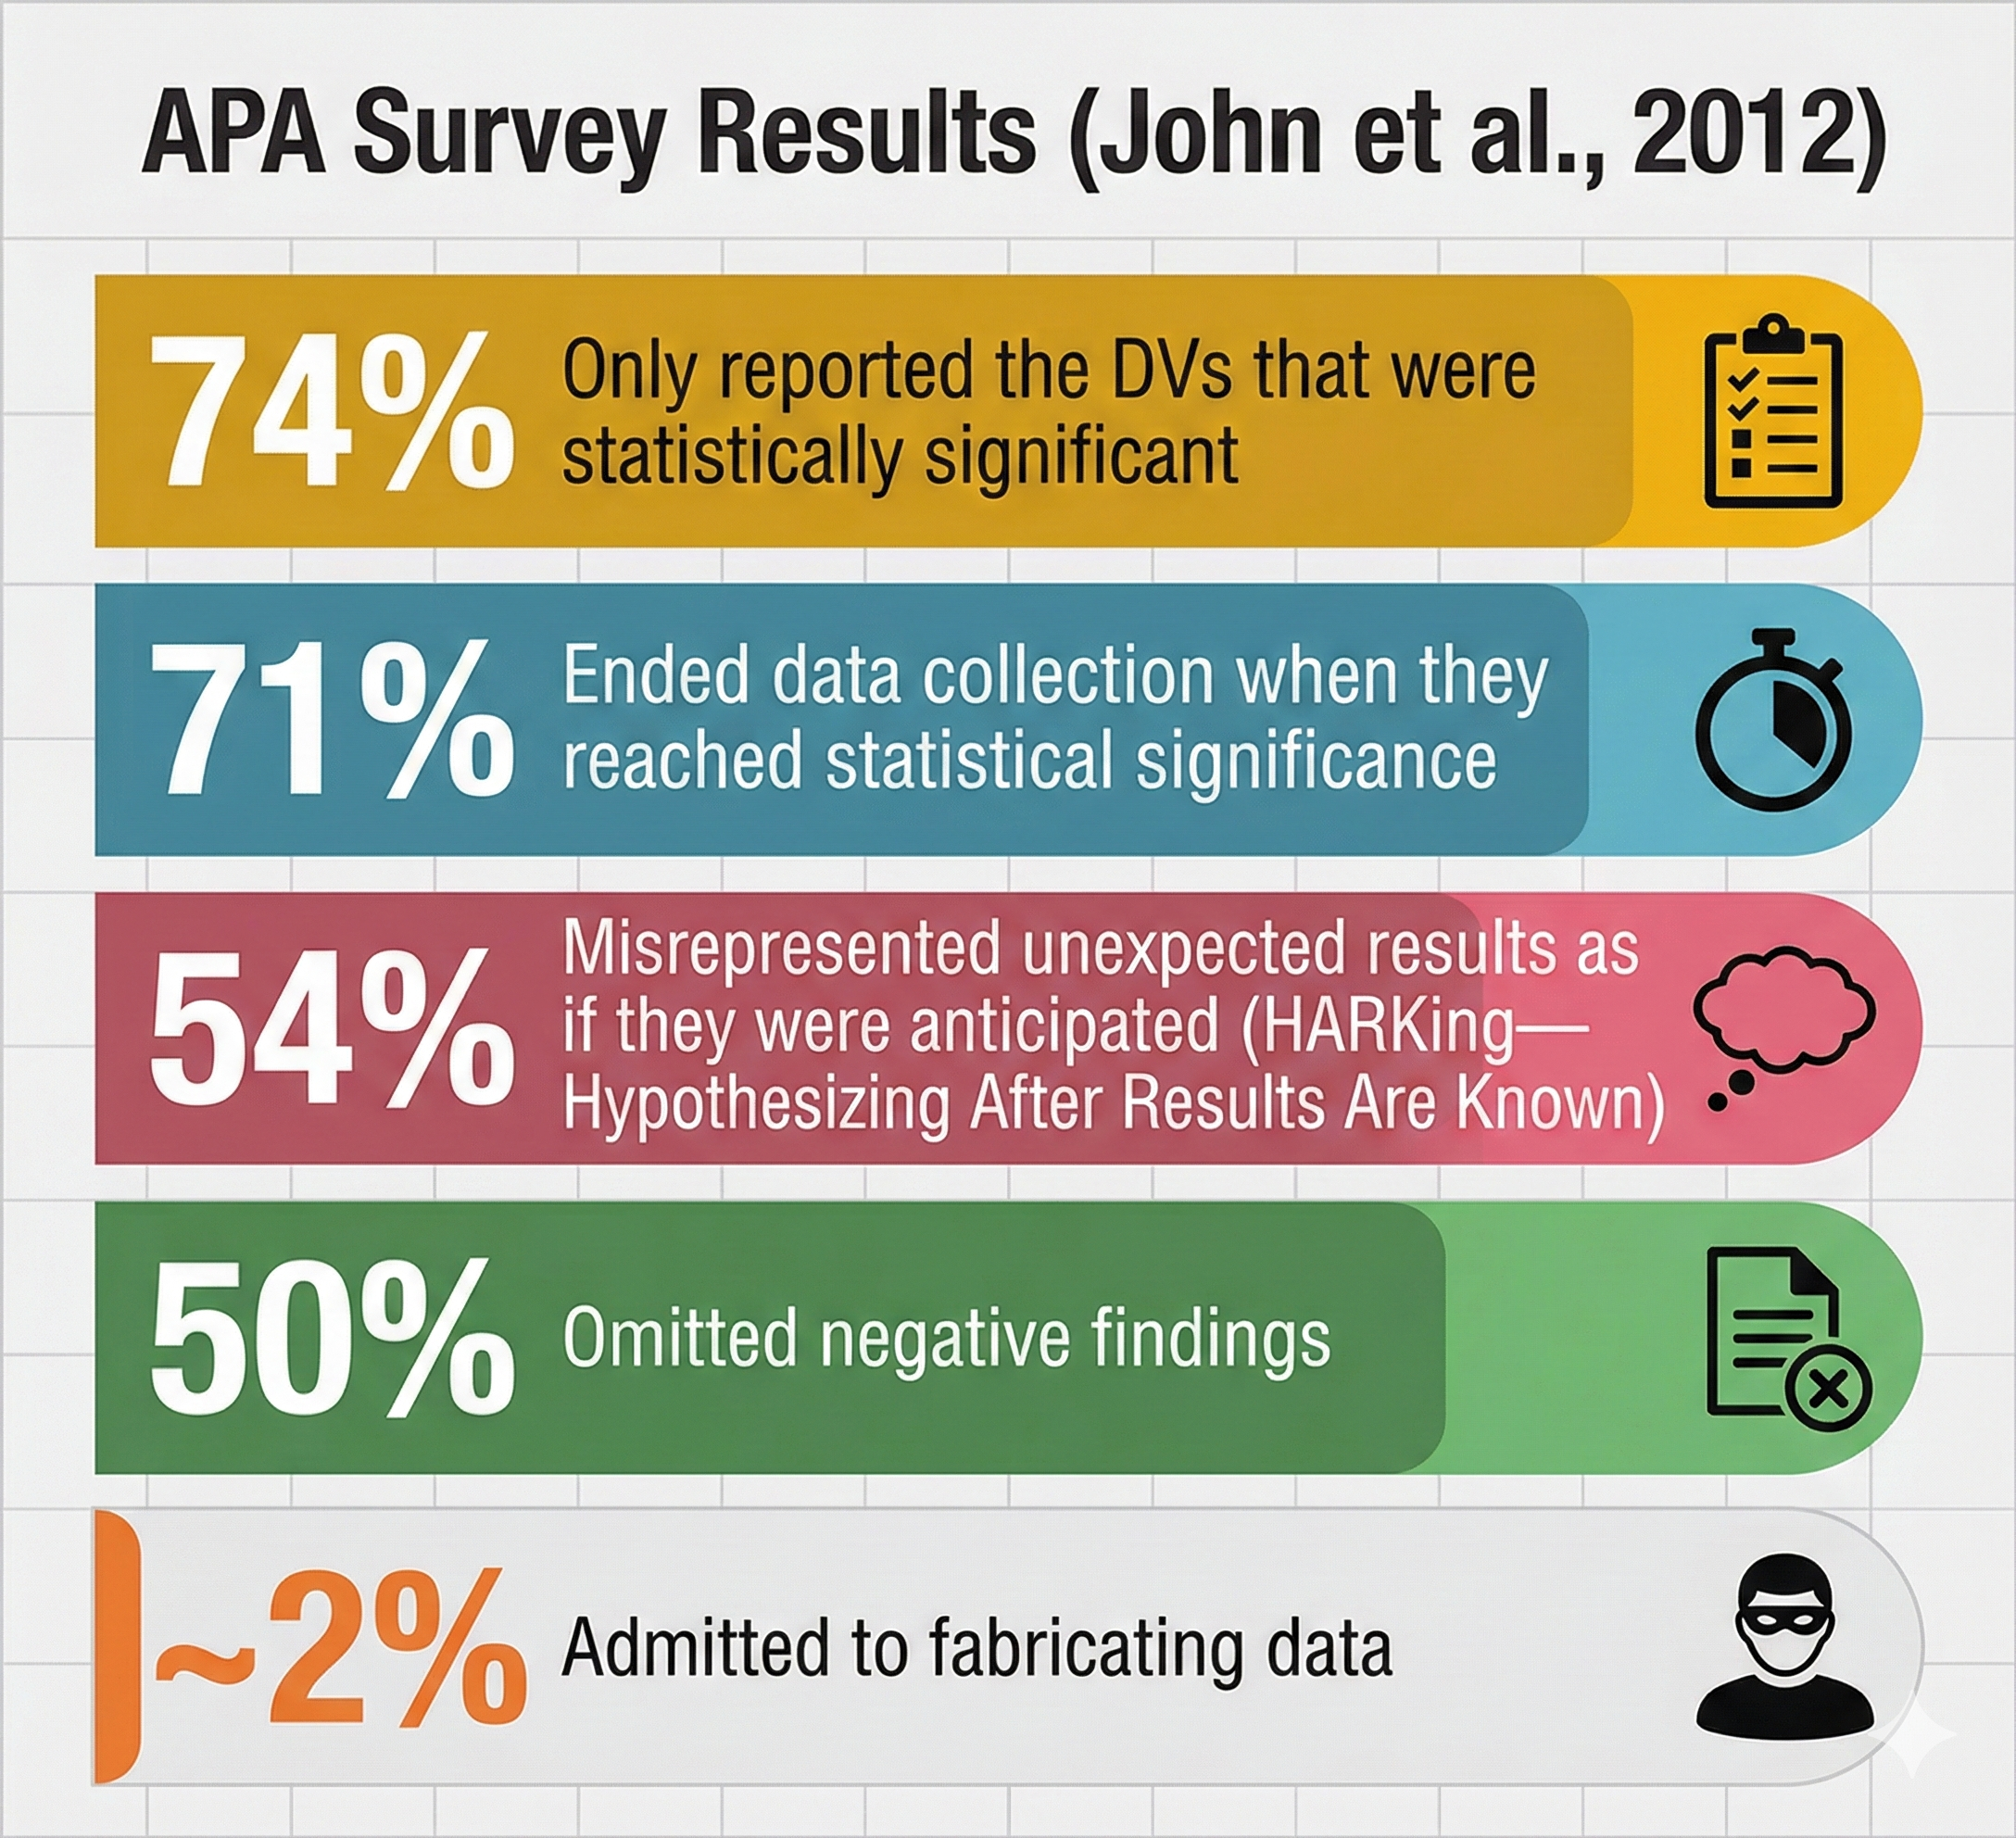
An anonymous survey (John et al., 2012) of 6000 American Psychological Association (APA) members revealed troubling findings. The researchers asked about practices such as failing to report all dependent measures, deciding whether to collect more data after looking at results, selectively reporting studies that "worked," and falsifying data. The results suggested that questionable practices are far more common than most researchers publicly acknowledge.
Understanding the Most Common Questionable Research Practices
Three questionable research practices deserve special attention because of their prevalence and impact on the literature. The first is p-hacking, which refers to the manipulation of data analysis to achieve statistically significant results, typically p less than .05, through selective or iterative analysis strategies rather than through genuine underlying effects. A biofeedback researcher might try multiple ways of defining "responders" to neurofeedback training, test different frequency bands, or exclude participants based on post hoc justifications until something reaches significance. The second problematic practice is HARKing, an acronym for "hypothesizing after the results are known," which occurs when researchers formulate or modify hypotheses after examining the data and then present them as if they had been predicted from the outset.
A researcher who originally hypothesized that alpha neurofeedback would reduce anxiety might discover an unexpected effect on attention and then rewrite the introduction as if attention had been the focus all along. The third issue involves the underreporting of null findings, which contributes to what researchers call the file drawer problem, where studies with non-significant results remain unpublished and invisible to the scientific community, creating a distorted picture of an intervention's true effectiveness.
How Biofeedback Research Is Especially Vulnerable
Psychophysiological research presents unique vulnerabilities to these questionable practices because of the complexity of the data involved. A single biofeedback training session might generate continuous recordings of heart rate, respiration, skin conductance, and multiple channels of electroencephalography, each of which can be analyzed using dozens of different parameters, time windows, and statistical approaches. This abundance of researcher degrees of freedom, the many decision points where analytical choices can influence outcomes, creates fertile ground for unintentional p-hacking.
Even well-meaning researchers can unconsciously gravitate toward the analysis decisions that produce cleaner, more publishable results. The field's historical emphasis on novel therapeutic applications, combined with small sample sizes typical of intensive physiological research, has created conditions where inflated effect sizes and non-replicable findings can flourish unchecked.
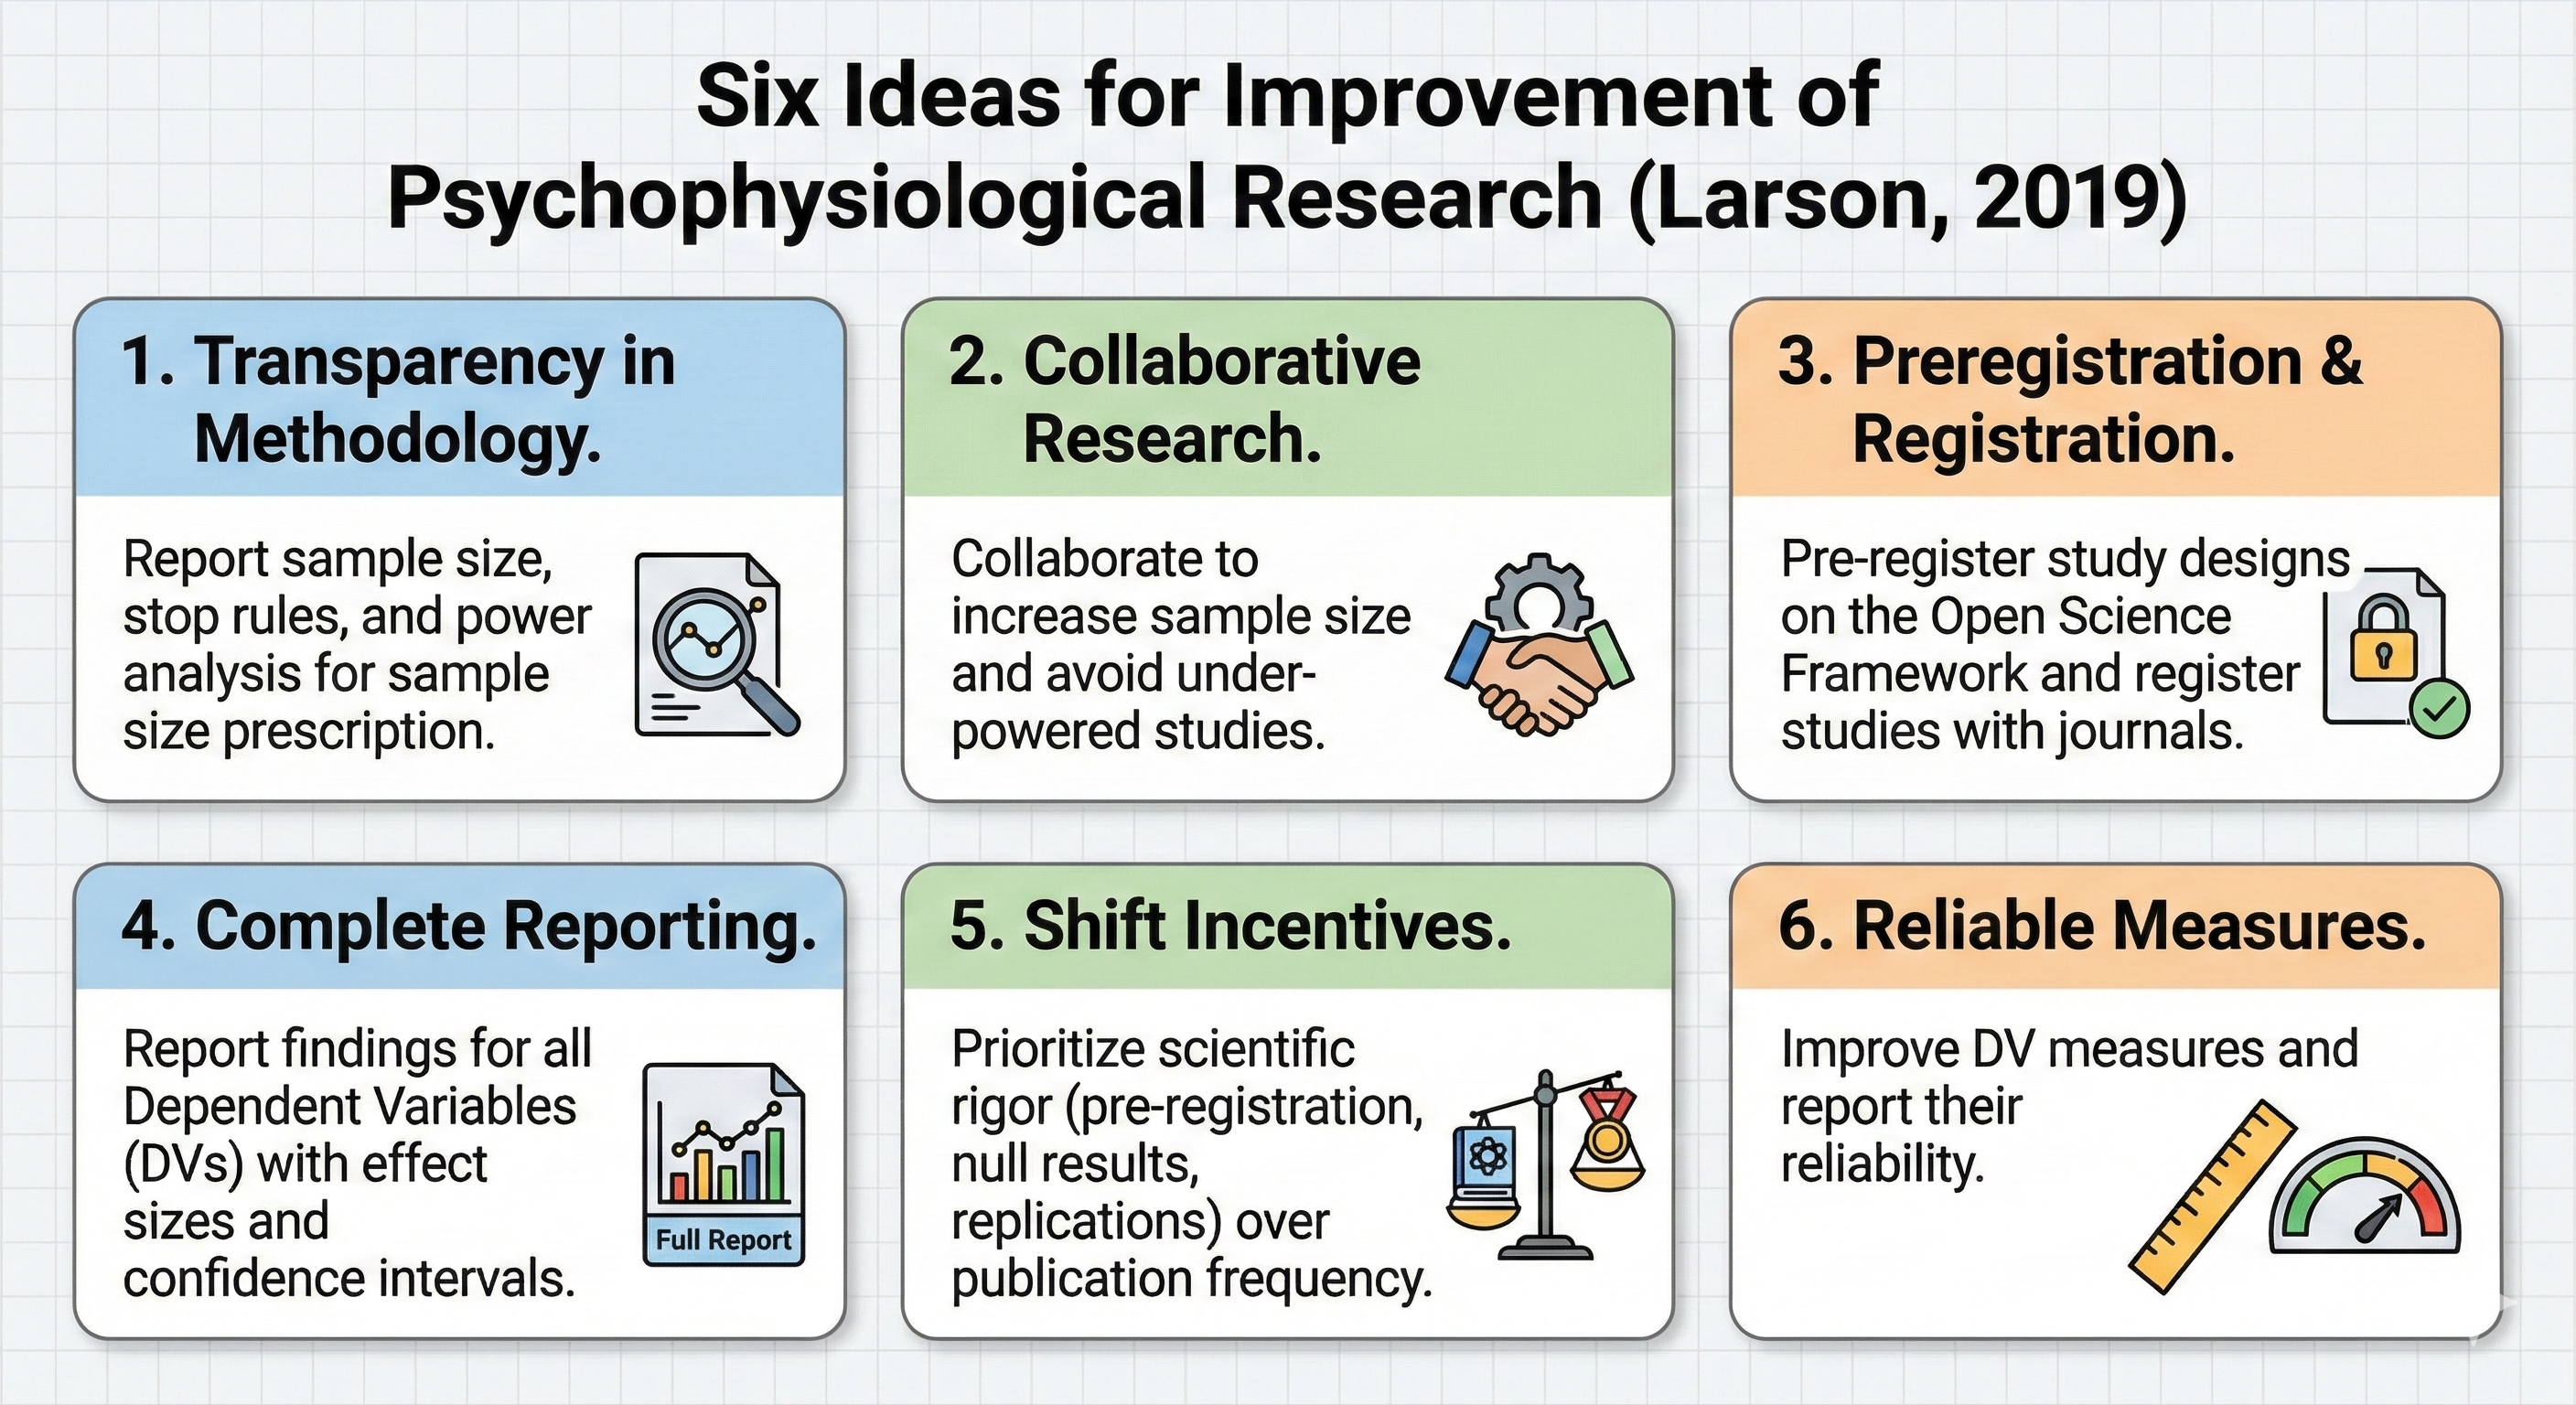
Larson's Recommendations for Improving Research Integrity
Larson (2019) proposed six steps to increase the integrity of psychophysiological research. These include distinguishing between confirmatory research, which tests pre-specified hypotheses, and exploratory research, which generates hypotheses from observed patterns. The recommendations also emphasize pre-registering hypotheses, methods, and analyses before data collection, providing unrestricted public access to materials and data, using study registration to address the file-drawer problem, providing a new model for replication studies, and making methods accessible for reliable replication. Each of these practices addresses a specific vulnerability in the traditional research process and collectively they create a system of accountability that protects both researchers and readers from the consequences of questionable practices.
The Power of Preregistration
Preregistration involves publicly documenting a study's hypotheses, methodology, and planned analyses before data collection begins, creating a time-stamped record that clearly distinguishes confirmatory from exploratory analyses. For biofeedback researchers, this means specifying in advance exactly which physiological measures will serve as primary outcomes, how artifacts will be handled, what statistical tests will be conducted, and how "successful" training will be defined. Platforms like the Open Science Framework provide free repositories where researchers can lock in their analytical decisions before the temptation to modify them arises. The beauty of preregistration is not that it prevents exploratory analysis, which remains valuable for generating new hypotheses, but that it requires such analyses to be labeled honestly rather than dressed up as confirmatory findings.
Open Data and Open Materials
Two additional pillars of transparent research involve sharing the raw materials of scientific inquiry. Open data refers to making datasets publicly available so that other researchers can verify analyses, identify errors, or explore new questions using the same physiological recordings. Open materials encompasses sharing the tools of research, including training protocols, electrode placement guides, signal processing scripts, and questionnaires, so that others can replicate procedures exactly.
For biofeedback research, where the specifics of sensor placement, filtering parameters, and feedback algorithms can dramatically influence outcomes, access to detailed methodological information is essential for meaningful replication. When a neurofeedback study reports impressive clinical improvements but provides no information about how EEG thresholds were set or how sessions were structured, other practitioners cannot determine whether they are implementing the same intervention or something entirely different.
Building a Culture of Replication
The ultimate goal of these transparent practices is to make replication, the repeated testing of research findings to verify their reliability, a routine and valued part of scientific practice rather than an afterthought. When biofeedback researchers embrace preregistration, share their data and materials, and honestly report null findings alongside positive ones, they create the conditions for a self-correcting science where genuine effects can be distinguished from statistical flukes. The field benefits from knowing not just which interventions can produce effects under optimal conditions, but which effects are robust enough to survive attempts at replication by independent laboratories using diverse populations. This shift requires rethinking academic incentive structures that have traditionally rewarded novelty over reliability, but the payoff is a body of knowledge that practitioners can trust when making decisions about patient care.
Small-N Designs: Rigorous Research with Few Participants
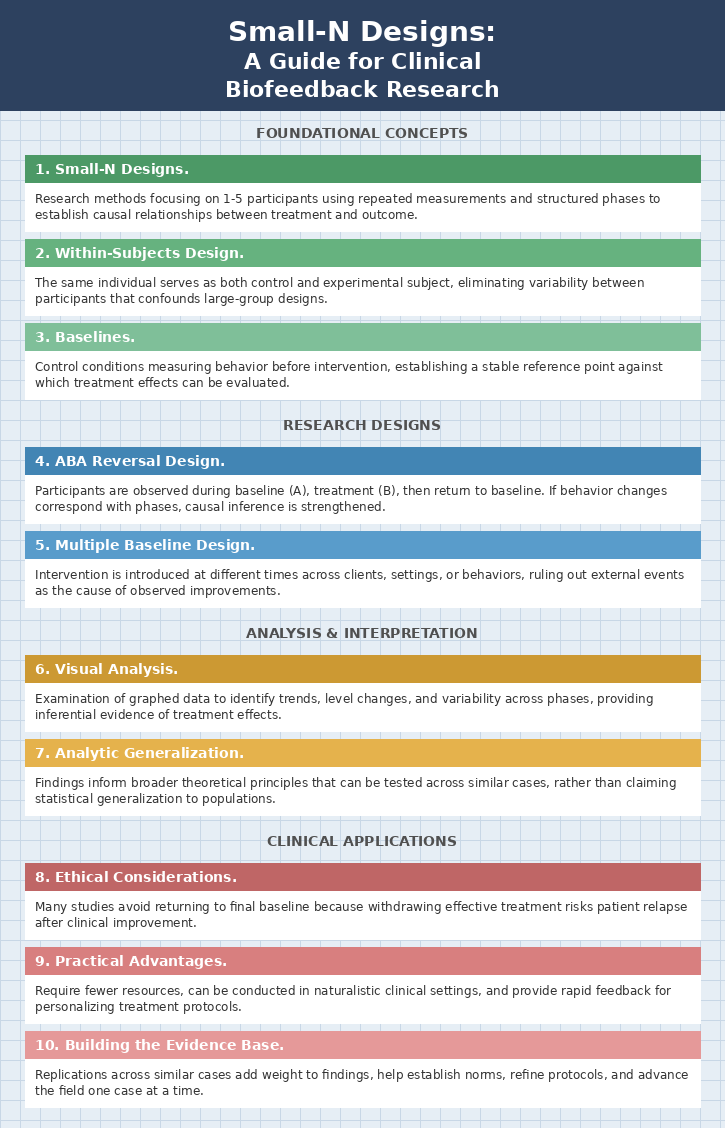
In biofeedback and neurofeedback research, clinicians in private practice face a significant challenge: how can they scientifically evaluate whether their treatments actually work? Conducting randomized controlled trials with dozens or hundreds of participants is typically impractical in clinical settings due to limited resources, small client populations, and ethical concerns about withholding treatment. Fortunately, small-N designs offer a scientifically rigorous alternative. These research methods focus intensively on one to five individuals, using repeated measurements and structured phases to establish causal relationships between treatment and outcome. Rather than comparing groups of participants, small-N designs allow practitioners to demonstrate that changes in a client's symptoms correspond predictably with the introduction of biofeedback training.
The Logic Behind Single-Participant Experiments
At first glance, conducting an experiment with just one participant may seem scientifically limited. However, single-case experiments are rooted in methodological rigor and capable of yielding precise, informative results. The key advantage lies in observing and measuring changes within the same individual over time. Instead of comparing a treatment group to a control group, the researcher observes a single client across different conditions, enabling them to isolate the impact of the intervention more clearly. This within-subjects design enhances experimental control because it eliminates variability between subjects that often confounds large-group designs. Differences in age, personality, medical history, or motivation do not interfere with results when the same individual serves as their own comparison. For biofeedback practitioners, this means that each client's unique characteristics become assets rather than obstacles to scientific inquiry.
Baselines: Establishing a Reference Point
In both large and small-N designs, baselines are control conditions that allow researchers to measure behavior without the influence of the independent variable. A biofeedback clinician might track a client's migraine frequency, anxiety ratings, or heart rate variability patterns for several weeks before beginning training. This baseline phase establishes a stable reference point against which treatment effects can be measured. The stability of the baseline is crucial: if a client's symptoms fluctuate wildly before treatment, it becomes difficult to determine whether subsequent changes result from the intervention or from natural variation. When the baseline is stable and changes occur only after biofeedback training begins, the causal inference becomes much stronger.
The ABA Reversal Design
Small-N researchers often use variations of the ABA reversal design, where participants receive all treatment conditions in sequence. A subject is observed during a control condition (A), then during a treatment condition (B), and finally returns to the control condition. The fundamental requirement for this design is that the treatment effect must be reversible. If behavior worsens when treatment is removed and improves again when it is reintroduced, the researcher can confidently attribute the changes to the intervention rather than to coincidental factors. For example, a neurofeedback practitioner working with a client experiencing chronic headaches could initiate training, observe symptom reduction, then briefly pause sessions to see whether symptoms return. If headaches re-emerge during the withdrawal phase and resolve again upon reintroduction of training, this pattern bolsters the causal link between the neurofeedback intervention and the observed effects.
Ethical Considerations in Reversal Designs
Many clinical reversal studies do not return to a final baseline because it would be unethical to risk patient relapse after treatment has improved their condition. A biofeedback clinician who has successfully reduced a client's panic attacks would understandably hesitate to withdraw treatment simply to demonstrate experimental control. When a reversal study does not end with a baseline condition, researchers cannot definitively rule out the possibility that an extraneous variable, such as seasonal changes, life circumstances, or the mere passage of time, caused the clinical improvement. This ethical tension between scientific rigor and client welfare represents one of the fundamental challenges in clinical research, and it has led to the development of alternative designs that maintain experimental control without requiring treatment withdrawal.
Multiple Baseline Designs: A Solution to the Withdrawal Problem
A multiple baseline design overcomes the ethical problem of withdrawing an effective treatment by never withdrawing it at all. Instead, this approach introduces the intervention at different times across different clients, settings, or target behaviors. Suppose a biofeedback practitioner is treating three clients for attention difficulties using heart rate variability training. By beginning training at different times for each client, the practitioner can rule out external events or seasonal influences as the cause of improvement. If gains in attentional focus and physiological regulation consistently occur only after training begins for each client, regardless of when that training started, the evidence in favor of the protocol's effectiveness becomes substantially stronger. This same principle can be applied within a single client by targeting different symptoms sequentially, such as using biofeedback first to address sleep problems and later to target daytime anxiety.
The Power of Visual Analysis
Visual analysis plays a central role in small-N research, helping practitioners identify trends, level changes, and stability within phases. Biofeedback clinicians can chart session-by-session changes in physiological metrics and self-report outcomes, creating graphical depictions that reveal patterns invisible in raw numbers. Researchers look for changes in level (the overall magnitude of the behavior), trend (whether the behavior is increasing or decreasing over time), and variability (how much the behavior fluctuates from session to session) that coincide with intervention phases. These visual tools not only provide strong inferential evidence but also offer clients tangible representations of their progress, which can foster engagement and adherence to treatment protocols.
Addressing Concerns About Generalizability
Critics of small-N research often raise concerns about generalizability, the extent to which findings from one or a few individuals can be applied to broader populations. This concern is valid but should not overshadow the substantial contributions these designs can make. While a treatment that works exceptionally well for one client may not be equally effective for others with different backgrounds or symptom profiles, small-N studies support what researchers call analytic generalization. Rather than claiming that results apply statistically to a population, practitioners use their findings to inform broader theoretical principles that can be tested across similar cases.
By replicating protocols and sharing findings within professional networks, biofeedback clinicians contribute to a growing practice-based evidence base that collectively strengthens the field.
Practical Advantages for Private Practice
Small-N designs offer several practical advantages that make them ideal for clinicians in private practice. They require fewer resources than large-scale trials, can be conducted in naturalistic clinical settings, and provide rapid feedback for treatment adjustments. The high-frequency data collection that characterizes these designs allows practitioners to observe moment-to-moment changes and identify both short-term and long-term effects. These insights are especially valuable when evaluating biofeedback treatments that need to be personalized to each client's unique physiological patterns and therapeutic goals. Furthermore, the adaptability of small-N designs allows clinicians to make real-time adjustments to protocols, ensuring that the research remains both scientifically sound and clinically meaningful.
Contributing to the Evidence Base
Through structured protocols, careful measurement, and critical analysis, biofeedback clinicians can demonstrate the efficacy of their interventions and contribute to the advancement of the field one case at a time. These replications add weight to individual findings and help establish norms, refine protocols, and identify client characteristics that moderate treatment response. When internal validity is achieved through careful phase design, when findings are replicated across similar cases, and when results are analyzed with appropriate visual or statistical methods, small-N research yields conclusions that are both credible and actionable.
For the biofeedback practitioner in private practice, these designs represent not merely a fallback option when large samples are unavailable, but a powerful methodological tool that enables rigorous, ethical, and clinically relevant research.
Descriptive and Inferential Statistics: Making Sense of Data
Descriptive statistics are numerical summaries that characterize a sample of scores, allowing researchers and clinicians to distill large volumes of raw physiological data into meaningful, interpretable values. In biofeedback practice, you might record hundreds of heart rate variability measurements or thousands of EEG data points during a single training session. Without descriptive statistics, this flood of numbers would be overwhelming and nearly impossible to interpret. Two essential families of descriptive statistics, measures of central tendency and measures of variability, help you reduce this complexity to a few key values that capture the essence of your data.
Finding the Typical Score: Measures of Central Tendency
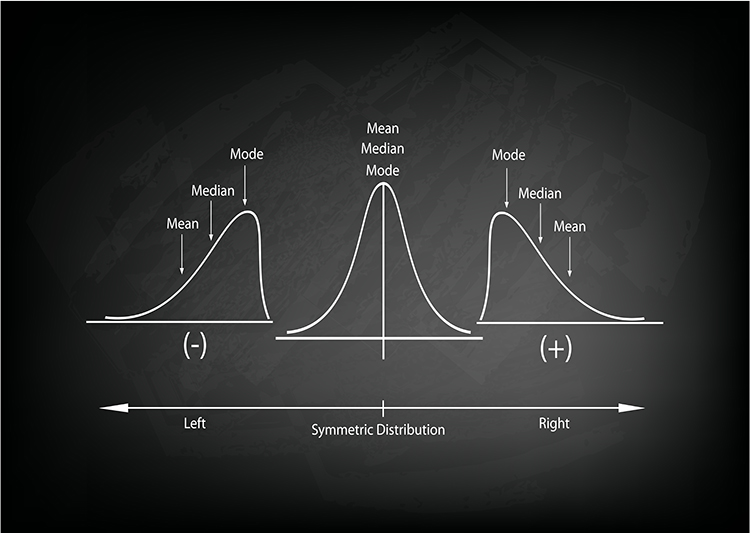
Measures of central tendency describe the typical or central value around which data points cluster. Three primary measures serve this purpose: the mean, median, and mode. In a perfectly symmetrical, bell-shaped distribution, something remarkable happens: all three measures converge at exactly the same point, like three friends arriving at the same party at precisely the same time. This alignment signals that your data are behaving in that ideal, predictable way that makes interpretation straightforward. However, when a distribution is skewed, these measures diverge. In a positively skewed distribution with a tail extends to the right, the mean is pulled higher than the median and mode. In a negatively skewed distribution with a leftward tail, the mean falls below its counterparts. Recognizing these patterns helps you select the most appropriate summary statistic for your biofeedback data.
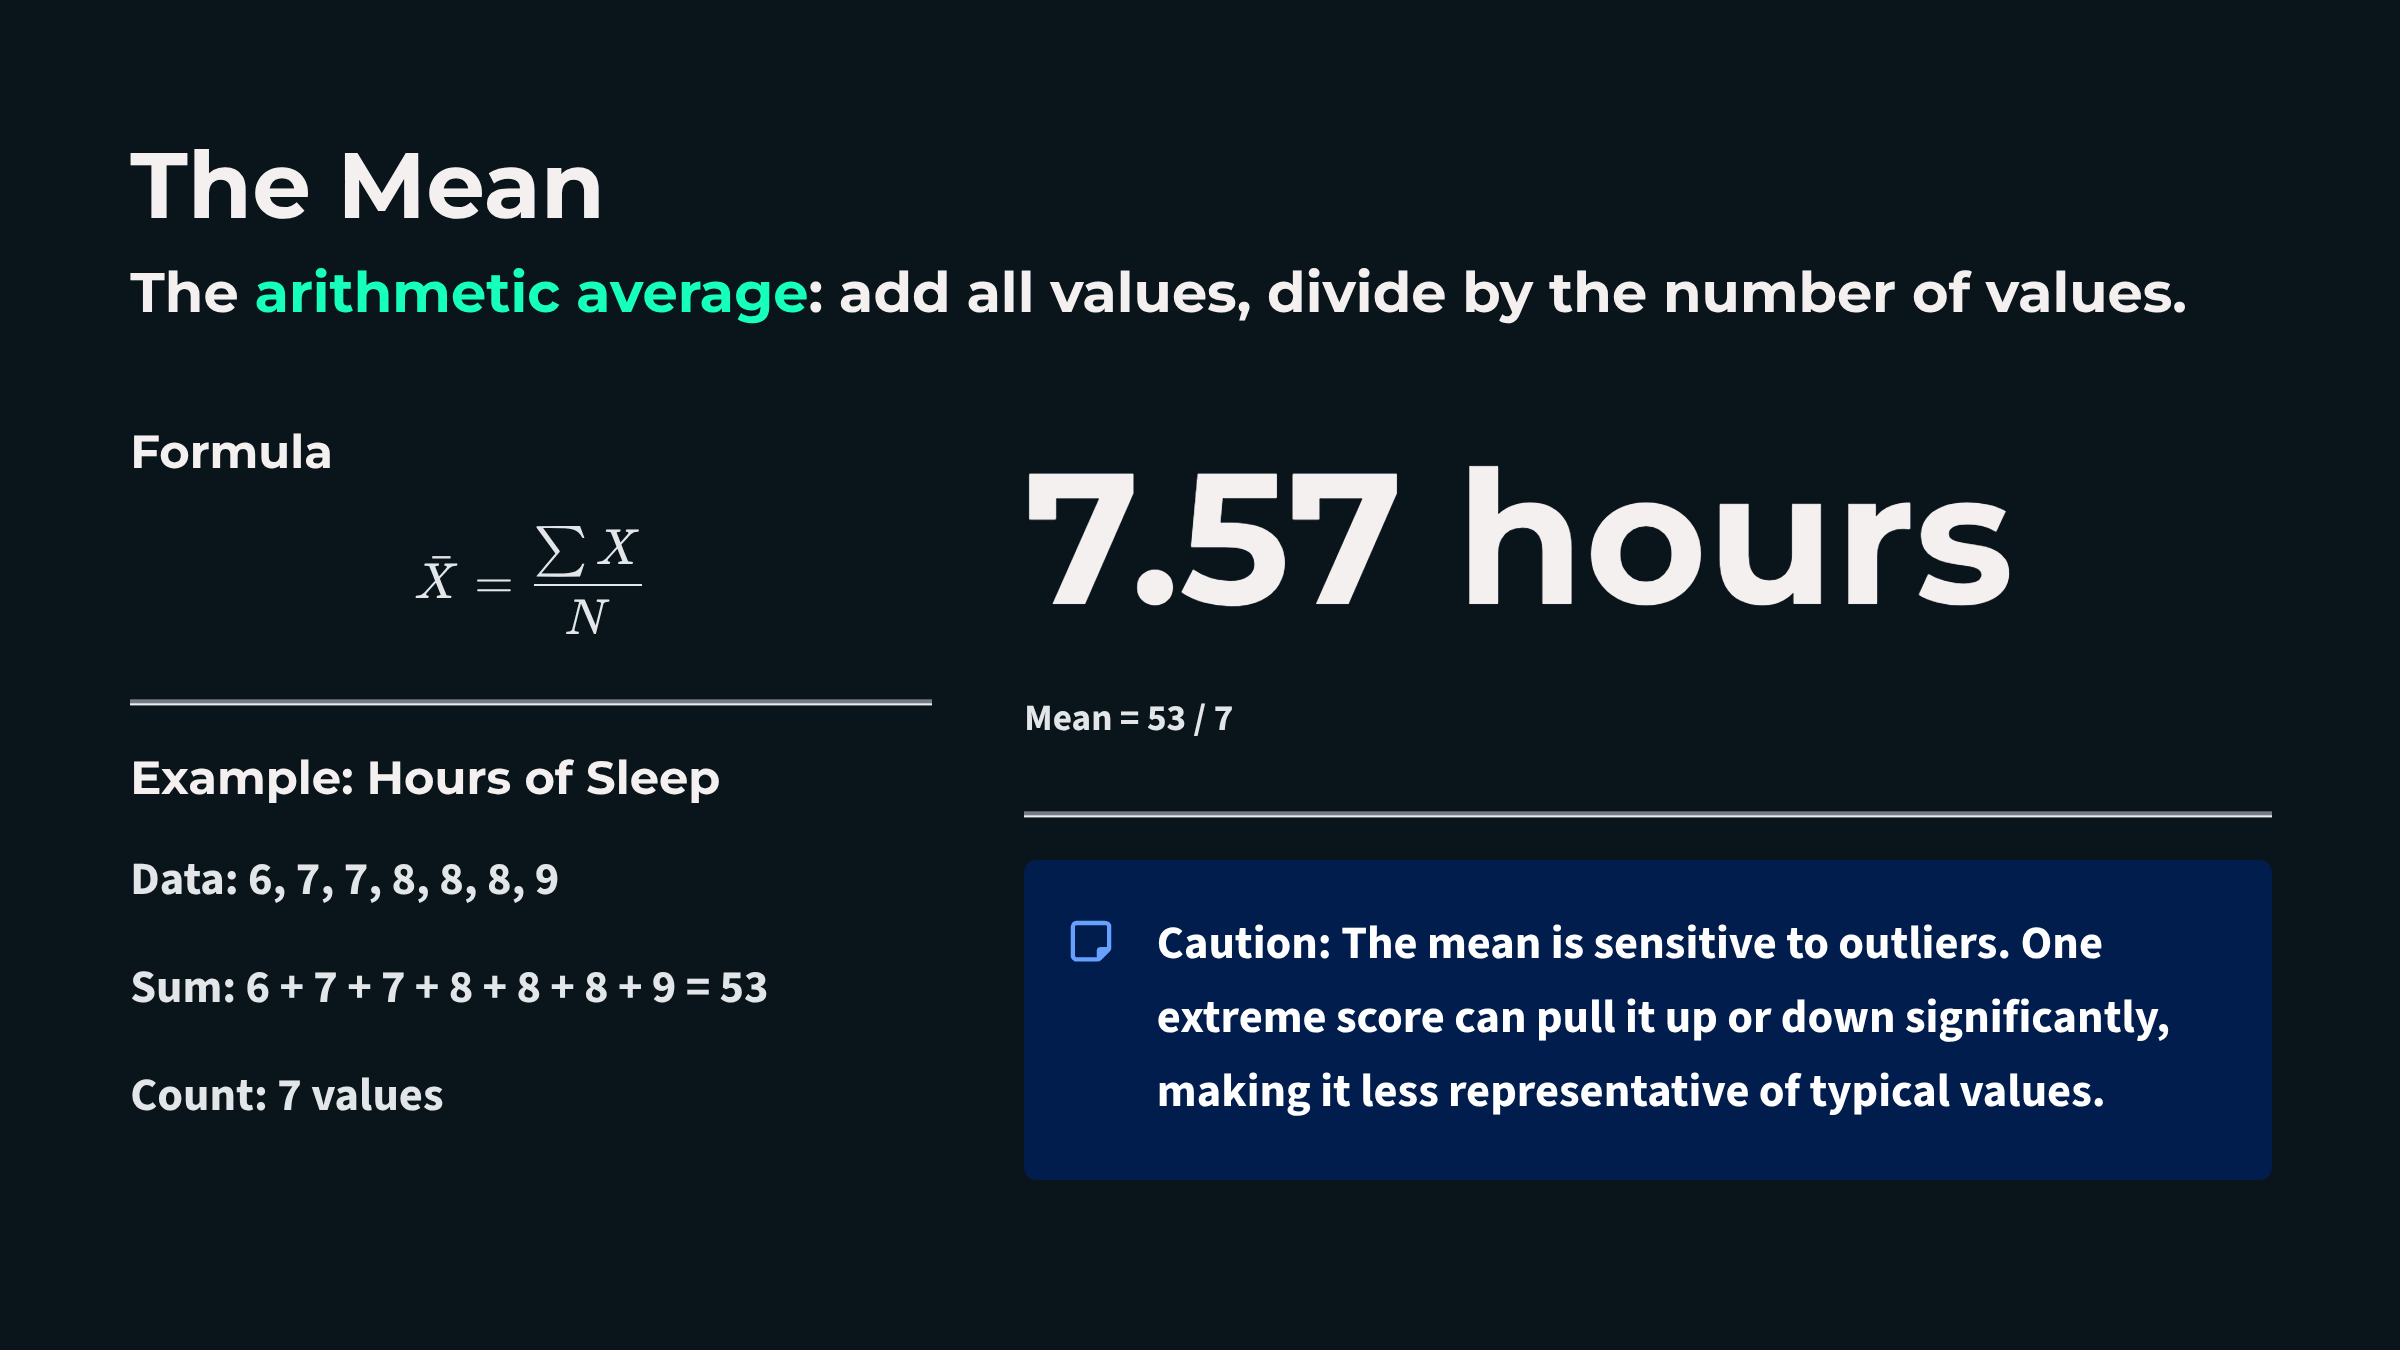
The mean is the arithmetic average, calculated by summing all values and dividing by the number of observations. It remains the most commonly reported measure of central tendency because it incorporates every data point and integrates seamlessly with advanced statistical methods. When you calculate the average skin conductance level across a relaxation training session or compute a client's mean respiratory rate, you are using the mean to summarize their typical physiological state. However, the mean has a significant vulnerability: it is highly sensitive to outliers, or extreme scores. A single unusually high or low value, perhaps from a movement artifact or a moment of distraction, can dramatically shift the mean and render it unrepresentative of the client's actual experience. Think of calculating the average income in a small town where one billionaire has recently moved in; that single extreme value would make it seem like everyone is wealthy when most residents earn modest incomes.
The median divides the sample distribution exactly in half. When you order all observations from smallest to largest, the median is either the middle value or the average of the two central values. The median's greatest strength is its robustness to outliers. No matter how extreme your outliers are, the median remains unperturbed, sitting calmly in the middle of your data like a Zen master maintaining balance regardless of external disruptions.
In biofeedback research, where physiological recordings often contain artifacts or unusual values, the median frequently provides a more accurate representation of typical performance than the mean. When heart rate variability data are skewed by a few episodes of irregular breathing or when respiration rates include outliers from coughing or sighing, the median offers a stable, informative summary.

The mode identifies the most frequently occurring value in a dataset, calculated when there are at least two different sample values. While the mode is less commonly used in biofeedback research involving continuous physiological measurements, it becomes essential when analyzing categorical data such as preferred breathing techniques, most commonly selected relaxation strategies, or predominant EEG frequency bands during training. A dataset may have no mode if no value repeats, or it may be multimodal with multiple peaks, which can reveal meaningful subgroups within your sample.
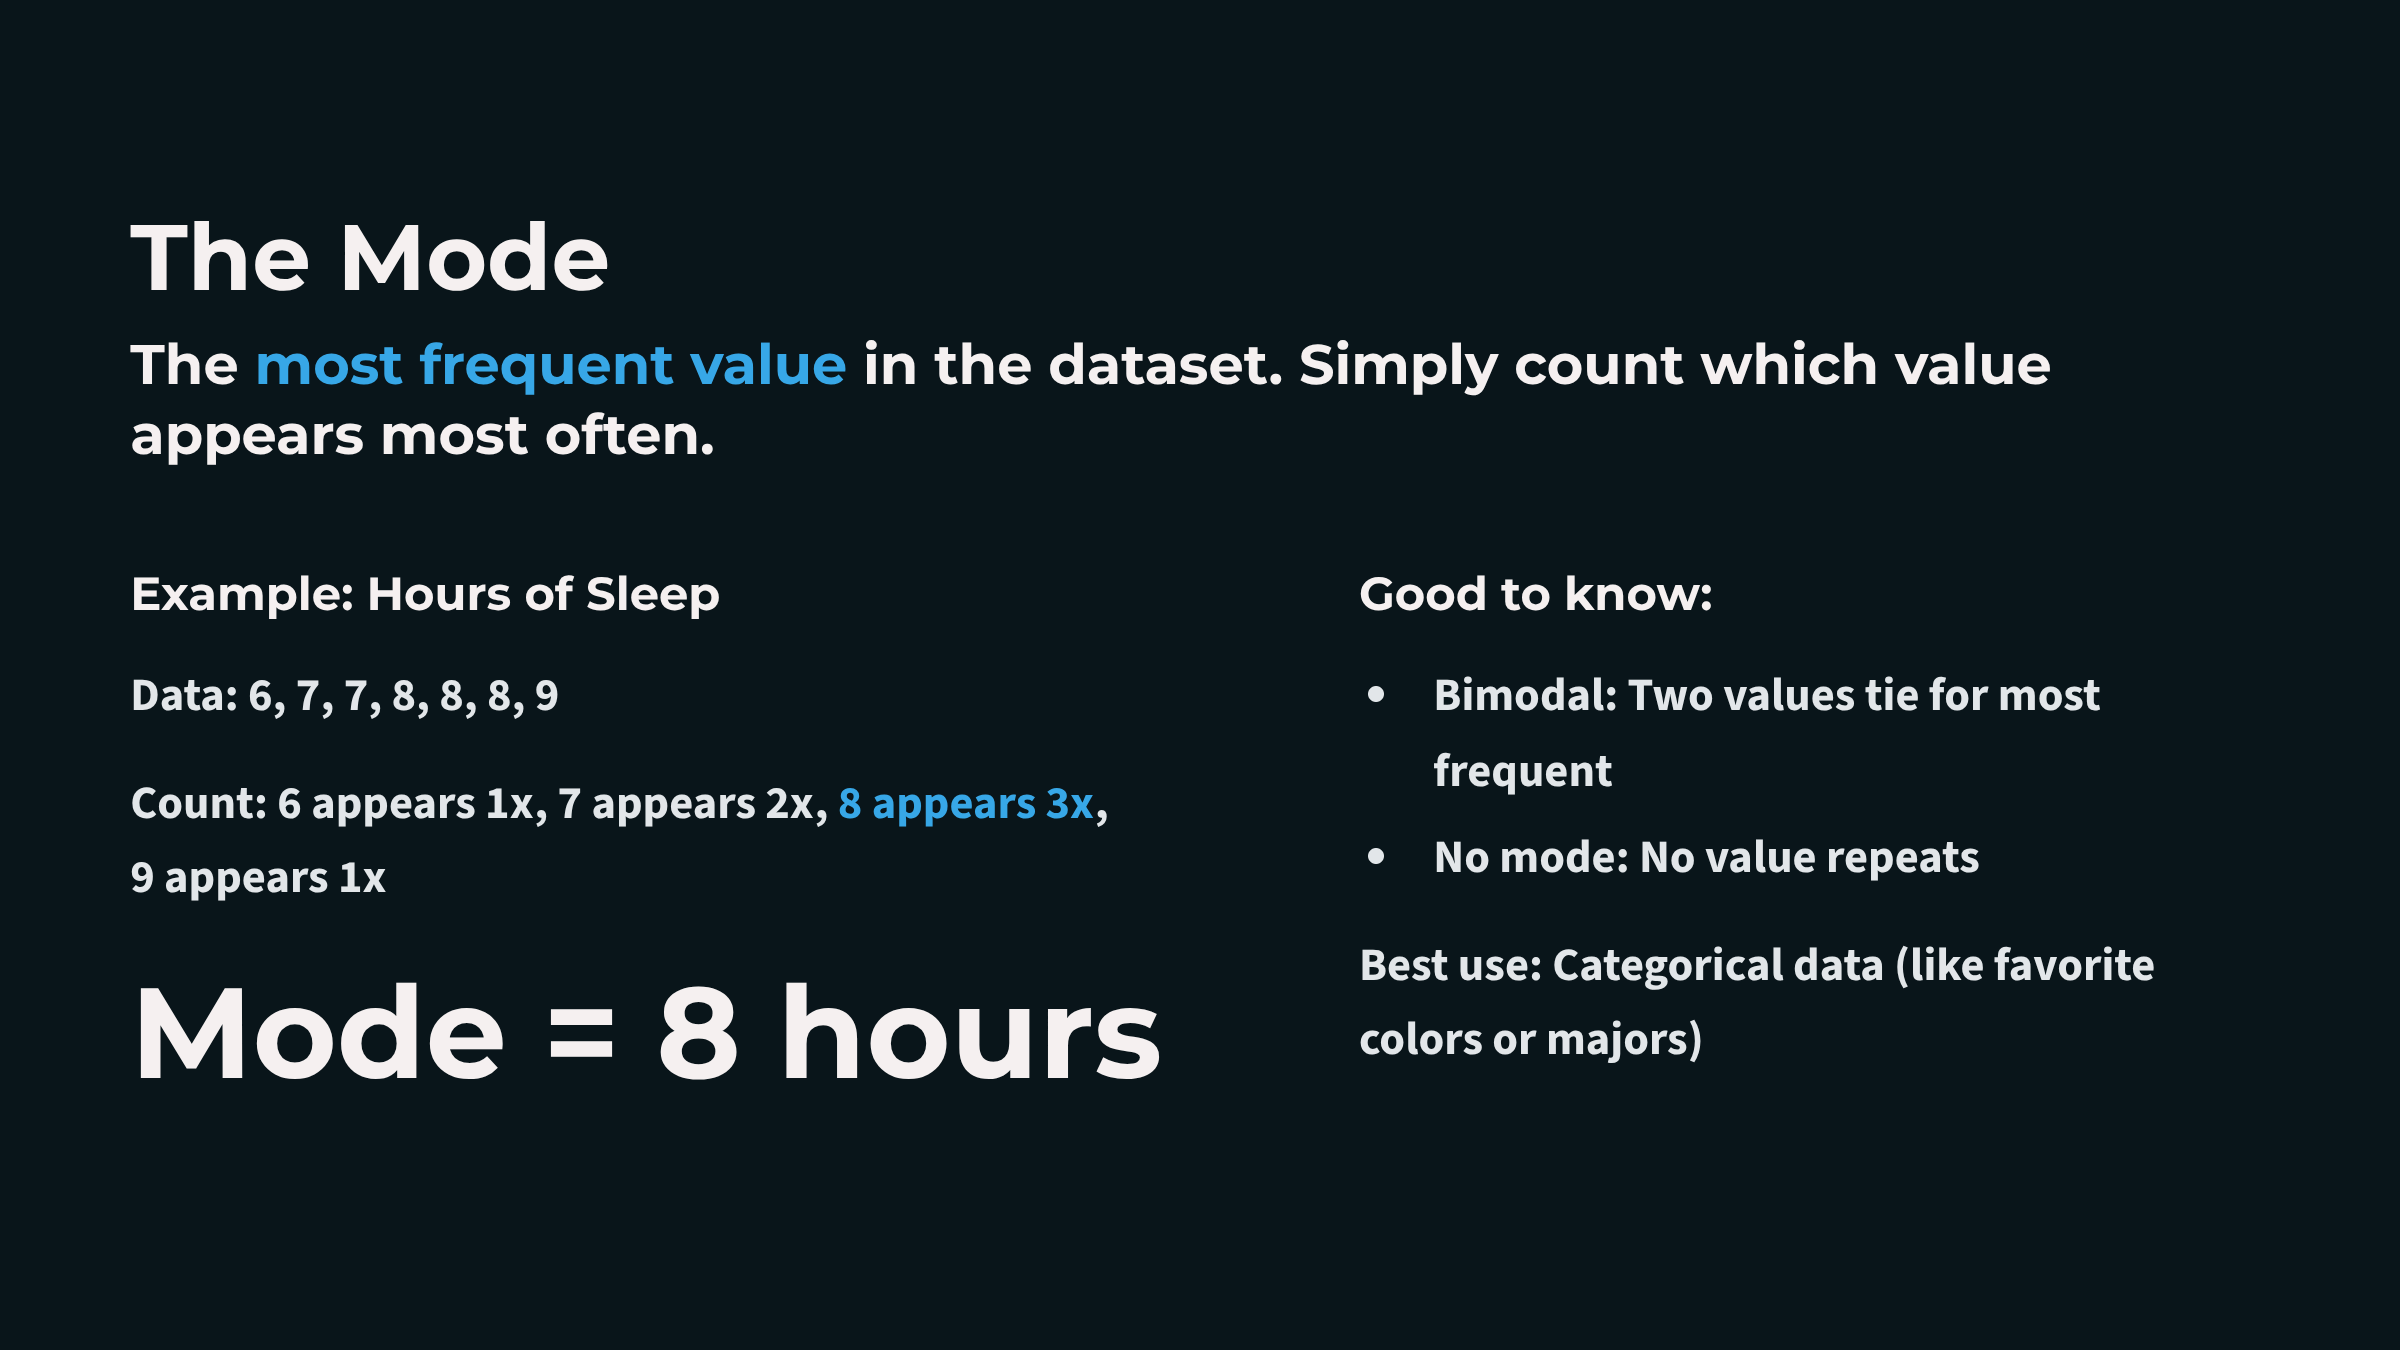
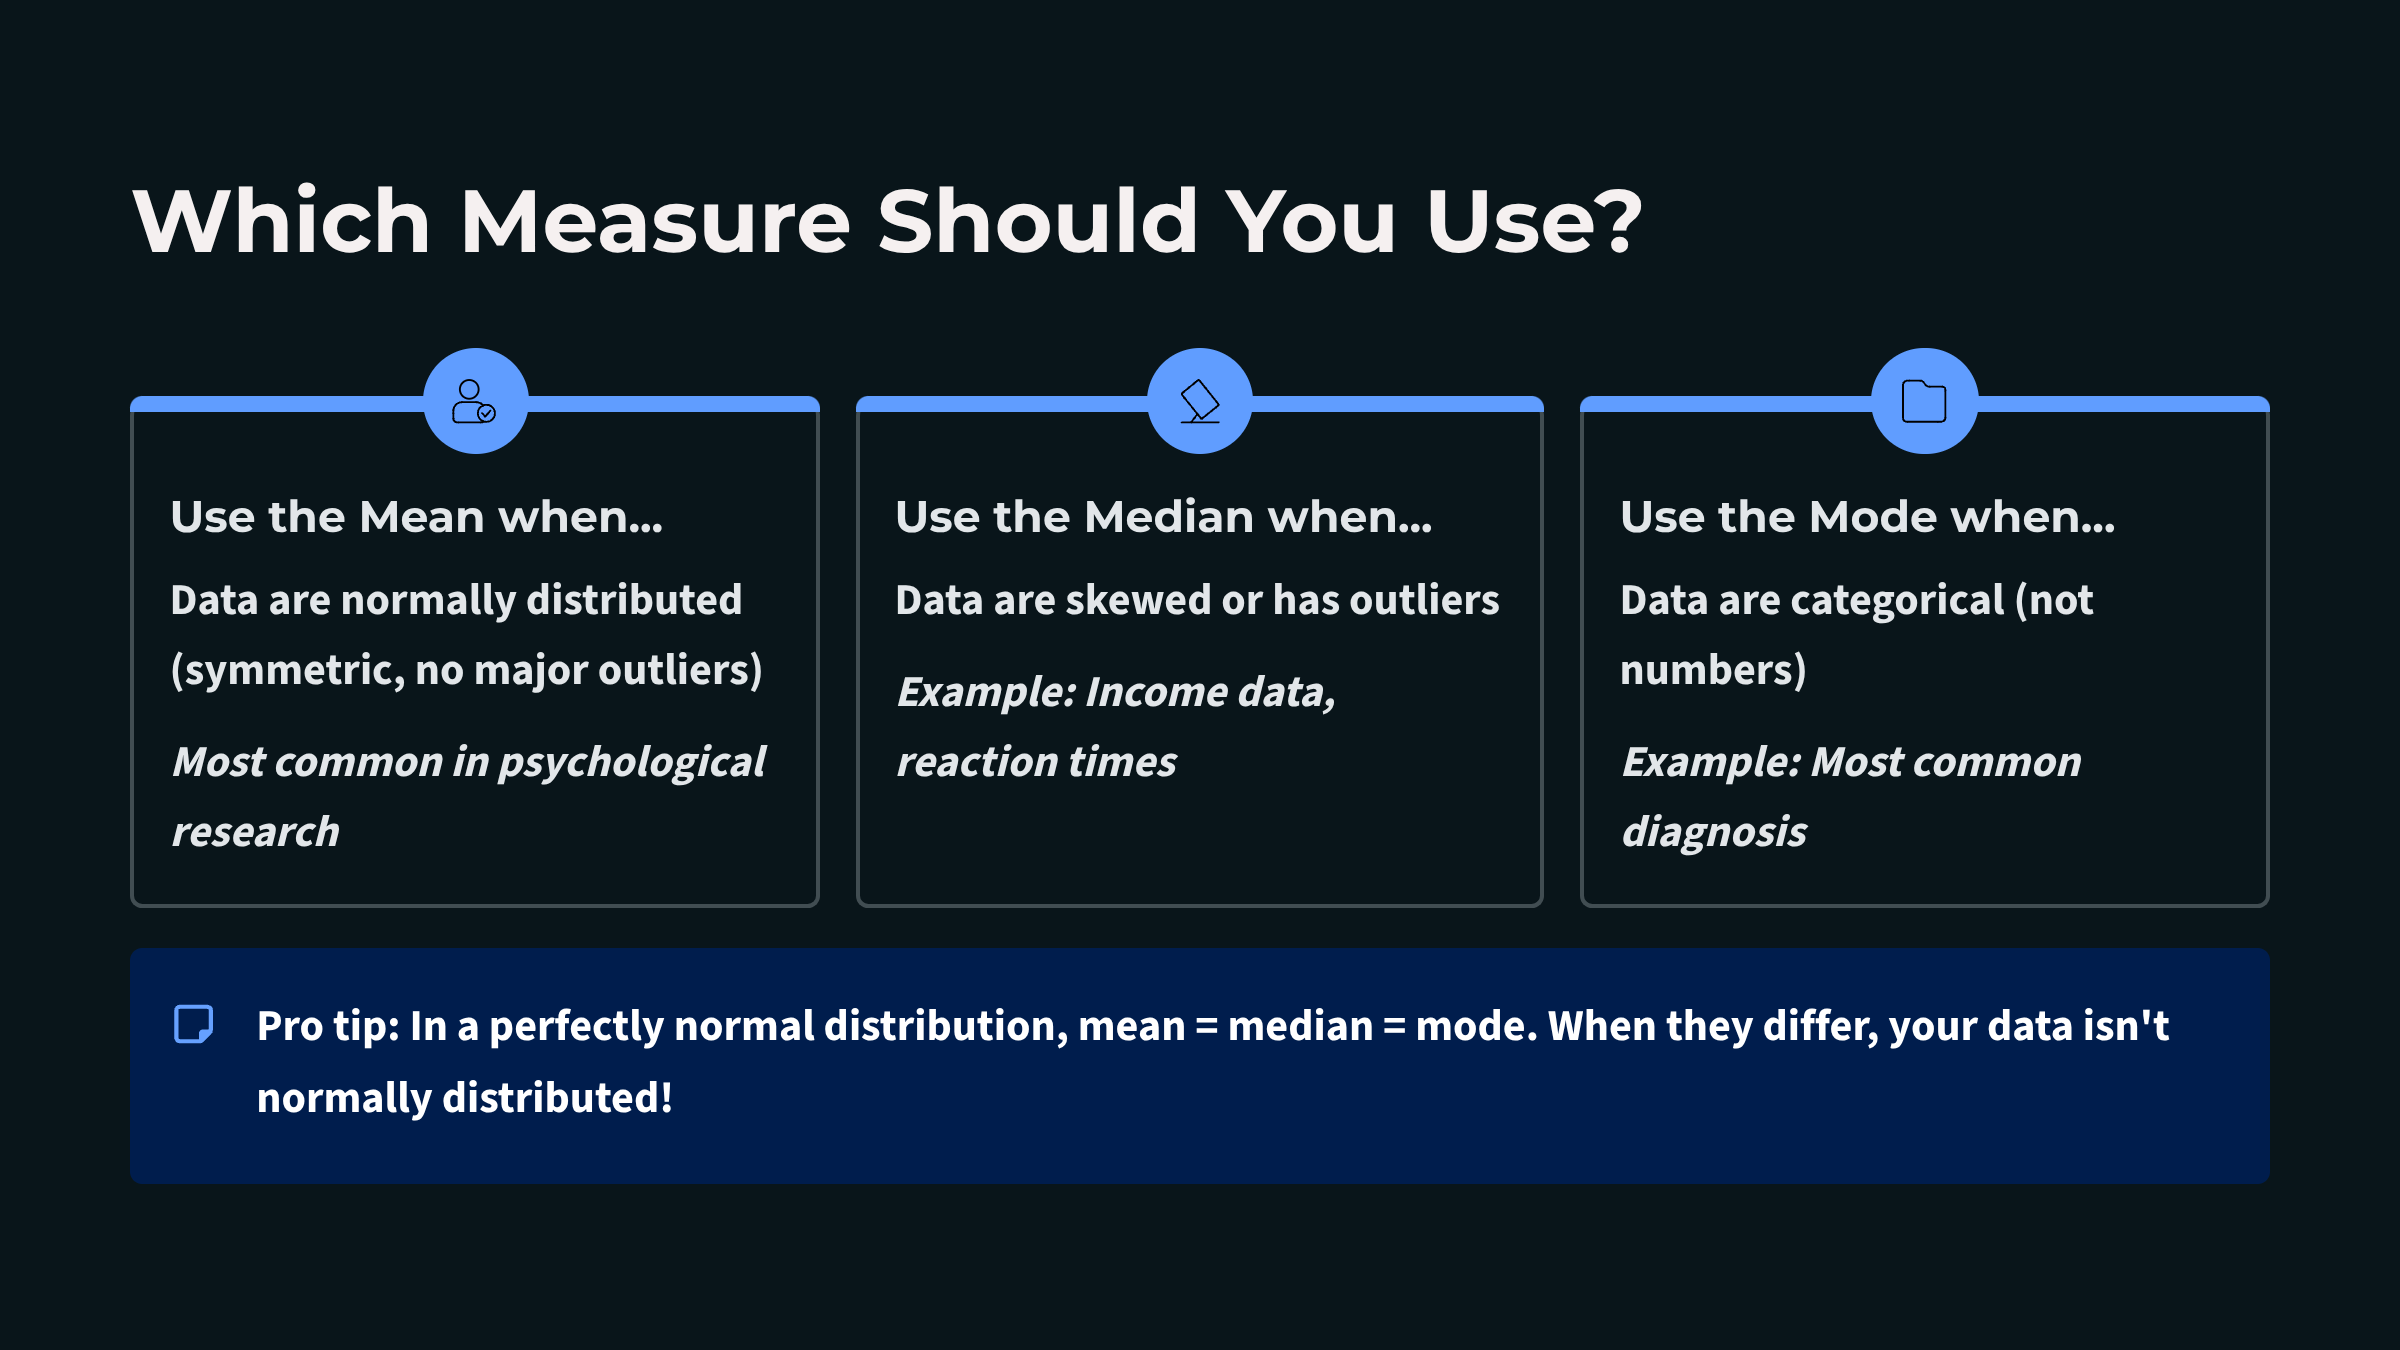
Understanding Dispersion: Measures of Variability
Measures of variability describe the extent to which data points differ from one another and from the central tendency. Two biofeedback clients might both have an average heart rate of 72 beats per minute, but if one client's readings range from 70 to 74 while the other's range from 55 to 95, the interpretation of that identical mean is profoundly different. Variability tells you how consistent the data are and whether the mean adequately summarizes the typical experience. In biofeedback, variability often carries clinical significance: low heart rate variability may indicate autonomic dysfunction, while high session-to-session variability in training outcomes might suggest inconsistent practice or fluctuating baseline states. The three primary measures of variability, the range, standard deviation, and variance, each provide different levels of insight into your data's dispersion.
The range is the simplest measure of variability, calculated by subtracting the smallest value from the largest. For biofeedback data with readings of 62, 68, 75, and 84 beats per minute, the range is 22. While easy to compute and useful for quick assessments, the range has significant limitations. It considers only the two most extreme values and ignores everything between them, making it highly sensitive to outliers and unable to reveal whether data are evenly distributed or tightly clustered. A single artifact or measurement error can dramatically inflate the range even when most values remain stable. For these reasons, the range serves best as a preliminary screening tool rather than a definitive measure of dispersion.

The standard deviation (SD) is a comprehensive measure indicating how far, on average, each data point deviates from the mean. Technically, it is the square root of the average squared deviations from the mean. For a dataset with scores of 2, 4, 4, 4, 5, 5, 7, and 9, the standard deviation equals 2, meaning that values typically differ from the mean by about two units. A small standard deviation indicates that observations cluster tightly around the mean, suggesting consistency among measurements. A large standard deviation implies substantial variability, with scores distributed more widely.
In biofeedback, clinicians use the standard deviation to determine whether a client's physiological measurements differ significantly from normative values. When values follow a normal distribution, approximately 68% of scores fall within one standard deviation of the mean, 95% fall within two standard deviations, and 99.7% fall within three. This 68-95-99.7 rule provides a practical shortcut for understanding how unusual any given measurement might be.
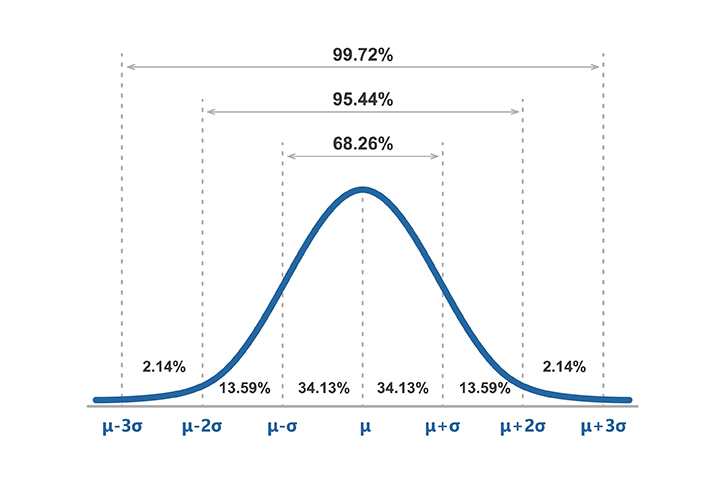
In neurofeedback practice, the standard deviation takes on particular clinical importance through z-score training protocols. These approaches attempt to reduce the real-time discrepancy between a client's instantaneous EEG values and values within a normative database. A z-score expresses how many standard deviations a particular measurement falls above or below the population mean. When a client's theta amplitude is two standard deviations above normal, the z-score training protocol provides feedback designed to bring that value closer to the normative range.

The variance, which is the average squared deviation of scores from their mean and equals the standard deviation squared, underlies these calculations. For the same dataset with scores of 2, 4, 4, 4, 5, 5, 7, and 9, the variance equals 4. While variance is mathematically essential and appears in many statistical formulas, its squared units make it less intuitive to interpret than the standard deviation, which remains in the original measurement units.

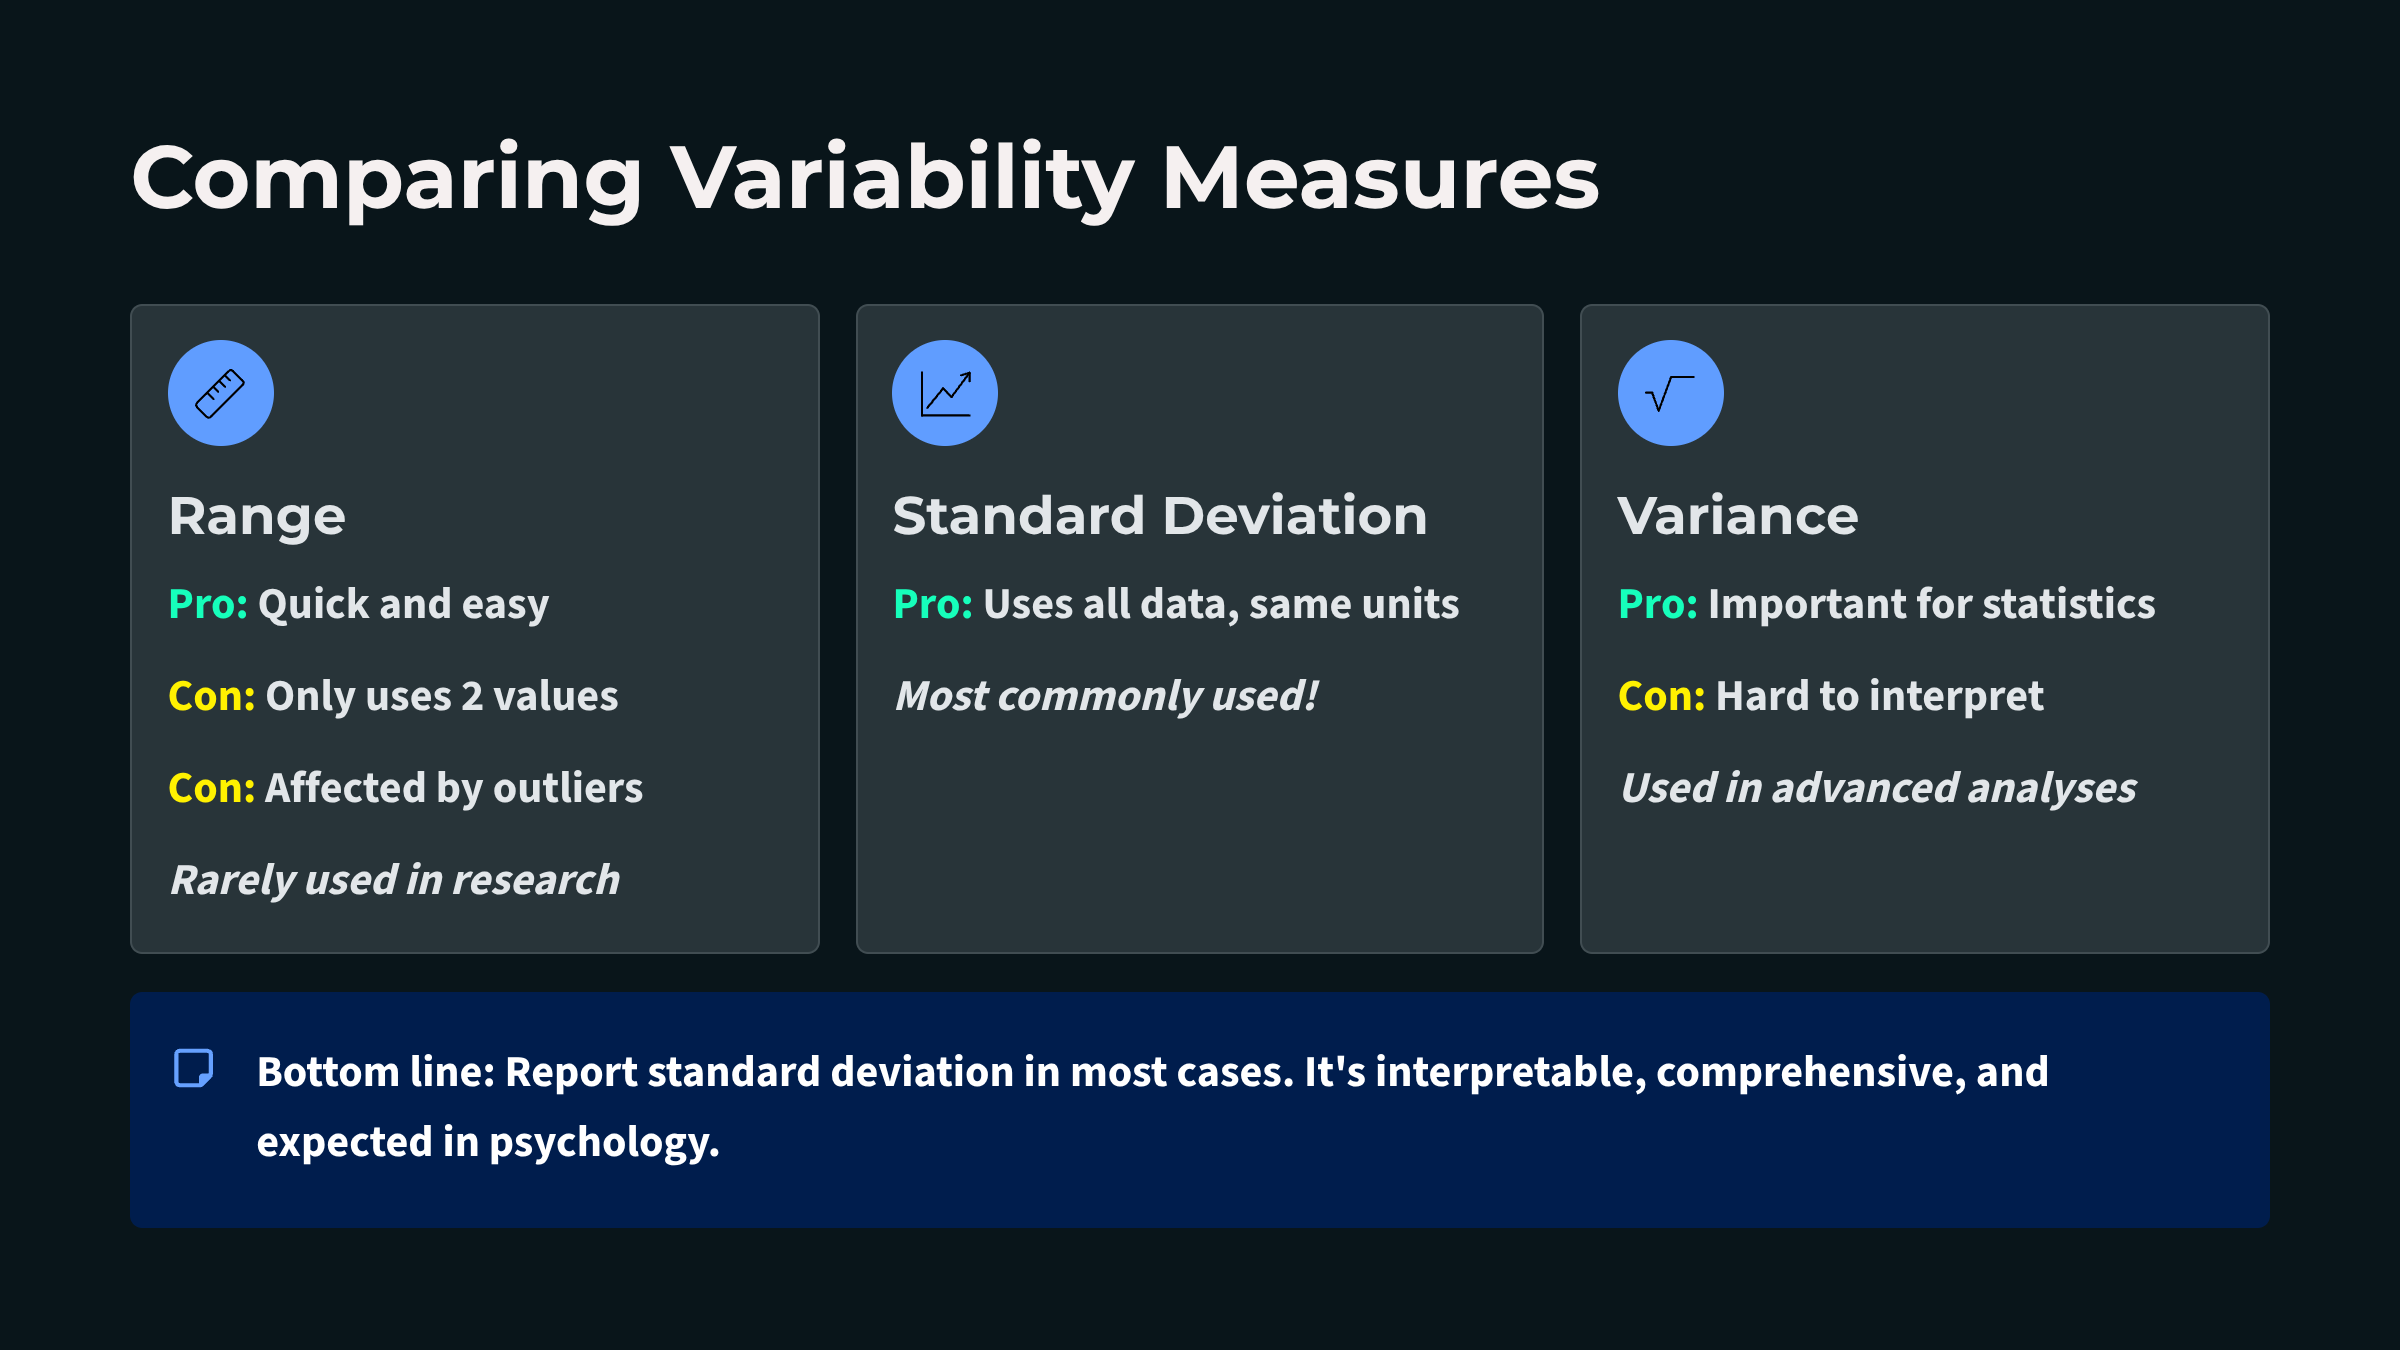 Watch: What Is The Standard Deviation?
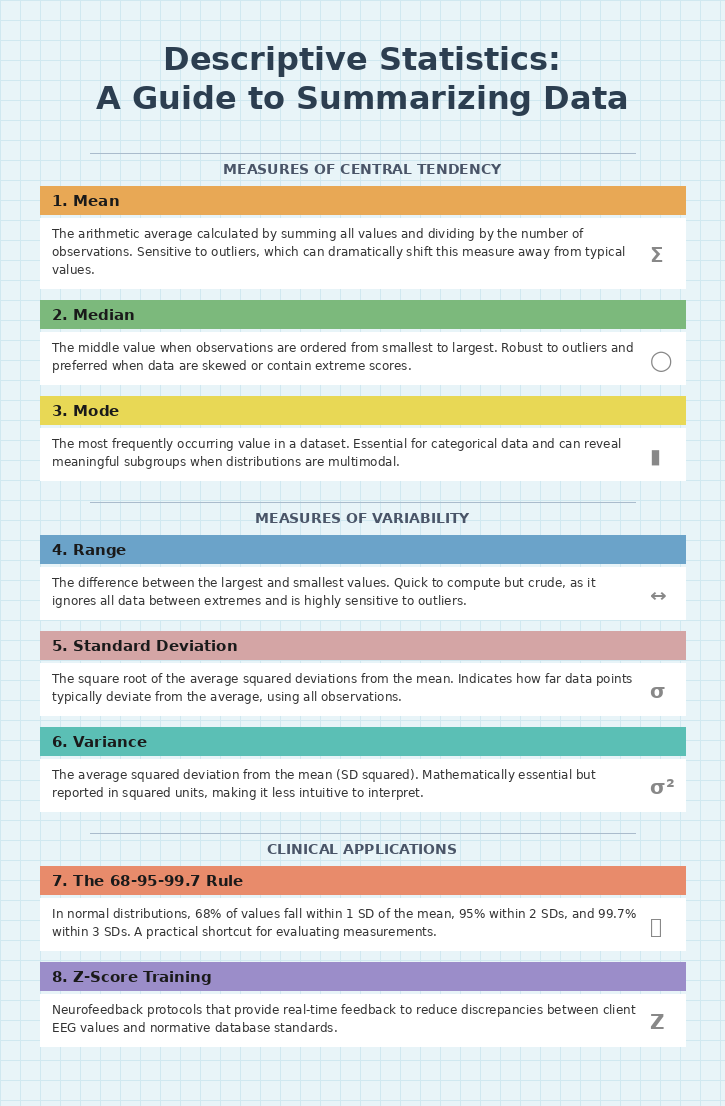
Meta-Analysis: Synthesizing Research Findings
A meta-analysis is a statistical analysis of related studies. A meta-analysis utilizes statistical procedures to combine and quantify data from many experiments using the same operational definitions for independent and dependent variables to calculate a typical effect size (Bordens & Abbott, 2022). In biofeedback research, meta-analyses help clinicians answer practical questions like "Does heart rate variability biofeedback actually reduce anxiety?" by pooling results from dozens of individual studies.
Rather than relying on the findings of any single experiment, which might have been conducted with a small sample or under unique conditions, meta-analyses provide a bird's-eye view of what the research literature reveals when taken as a whole. This synthesis is particularly valuable because individual biofeedback studies often produce conflicting results, and meta-analyses help identify the overall pattern amidst this variability.
Measuring Treatment Effects: How Large Is the Impact?
Effect size indexes the magnitude of an IV's effect on the DV. Researchers measure effect size using percentage and standard deviation approaches. The percentage method calculates the percentage of variability in the DV that the IV can predict. Statistics like r2 and eta2 estimate the strength of association between the IV and DV. Possible values range from 0 to 1.0. A small r equals 0.01, medium equals 0.09, and large is 0.5 or greater. An r of 0.5 means that the IV accounted for 50% of the variability in the DV. The standard deviation approach estimates the degree of change in the DV in standard deviation units.
For example, Cohen's d calculates the effect size for t-tests. Cohen's f estimates effect size for F-tests. A small effect equals 0.2, medium equals 0.5, and large equals 0.8. In biofeedback research, knowing the effect size helps clinicians set realistic expectations: a Cohen's d of 0.5 for neurofeedback treatment of ADHD symptoms means that the average treated client improved more than about 69% of untreated clients.

Power and Precision: Why Study Quality Matters
The quality of a meta-analysis depends heavily on the statistical power and precision of the studies it includes. Statistical power refers to the probability that a study will detect a real effect when one actually exists. A study with low power may fail to find an effect even when the treatment genuinely works, leading to a Type II error, which occurs when researchers incorrectly conclude that no effect exists. Precision refers to how accurately a study estimates the true effect size, reflected in the width of confidence intervals, which are ranges of values within which the true population effect is likely to fall. Narrow confidence intervals indicate precise estimates, while wide intervals suggest considerable uncertainty.
When meta-analyses include many underpowered studies, meaning research with small sample sizes that cannot reliably detect effects, the combined results may still be misleading. Button and colleagues (2013) demonstrated that underpowered studies tend to produce inflated effect sizes when they do find significant results, contributing to what researchers call the replication crisis, the widespread failure to reproduce published findings across studies.
Publication Bias: The Hidden Threat to Accuracy
A meta-analysis may overstate or understate treatment efficacy depending on the representativeness of the selected studies. Treatments may appear more effective than in real-world practice when a meta-analysis excludes unpublished studies that did not achieve statistically significant results. This is called the file drawer effect, named for the tendency of researchers to leave null or negative findings hidden in their file drawers rather than submitting them for publication.
This phenomenon is part of a broader problem called publication bias, the tendency for journals to favor studies with statistically significant findings over those reporting null results. When only positive findings are published, meta-analyses and systematic reviews may overestimate effect sizes, leading to distorted conclusions about treatment effectiveness. For biofeedback practitioners, this means that the published literature may paint an overly optimistic picture of certain interventions. Conversely, treatments may appear less effective than they truly are when a meta-analysis includes studies by inexperienced clinicians and those who utilized inadequate training protocols, such as studies that did not train until a criterion was reached.
Transparency and the Future of Evidence Synthesis
The scientific community has developed several strategies to combat publication bias and improve the reliability of meta-analyses. Researchers are increasingly encouraged to preregister their studies, which means publicly declaring hypotheses, methods, and planned analyses before data collection begins. This practice reduces researcher degrees of freedom, the flexibility researchers have in data collection and analysis that can lead to biased findings.
Some journals now offer Registered Reports, a publication format where peer review occurs before data collection, and acceptance is based on methodological quality rather than outcomes. Null results, when transparently reported, contribute valuable information to meta-analyses by providing a more accurate estimation of effect sizes and informing evidence-based practice. For biofeedback clinicians, understanding these issues helps you become a more critical consumer of research. When evaluating a meta-analysis, consider not only the overall effect size but also whether the authors searched for unpublished studies, assessed publication bias using statistical tools, and included studies with adequate power and proper training protocols.
Check Your Understanding: Meta-Analysis
- Why is effect size often more important than statistical significance when evaluating the clinical value of a treatment?
- What is the file drawer effect, and how might it bias the results of a meta-analysis?
- A meta-analysis reports that neurofeedback for ADHD has a Cohen's d of 0.6. What does this tell you about the treatment's effectiveness?
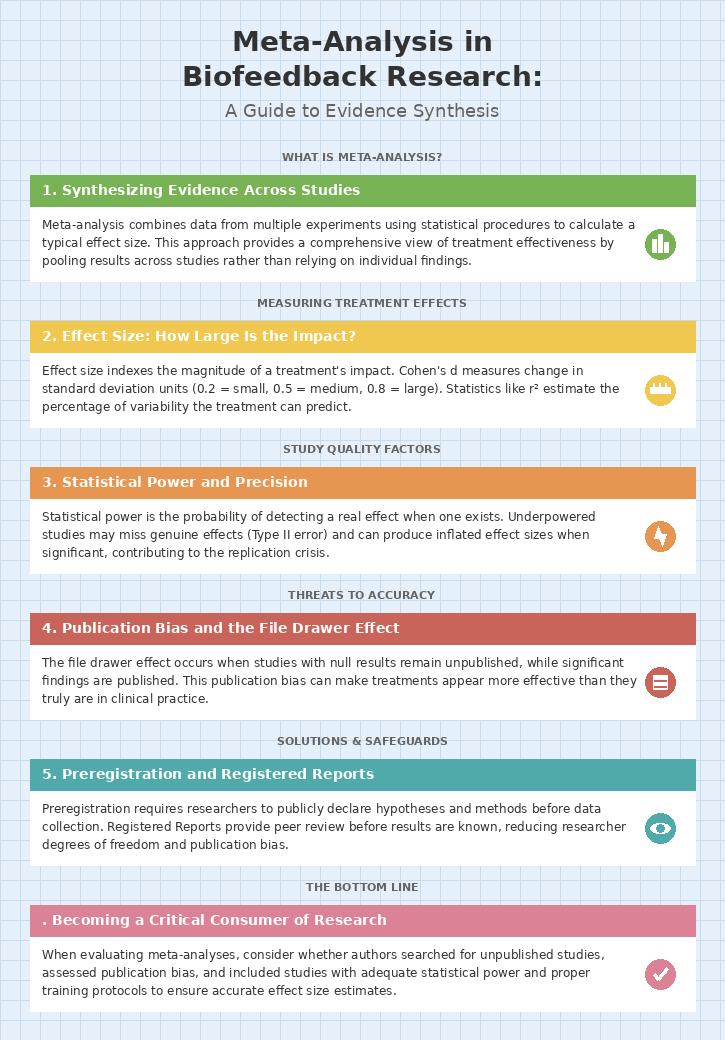
The Clinical Efficacy of Established Medical Practices
Here is a sobering finding that should give us all pause. Prasad et al. (2013) examined 363 studies of an accepted drug or medical procedure published in The New England Journal of Medicine from 2001 to 2010. More than 40% were ineffective or harmful, 38% were beneficial, and 22% had uncertain value.
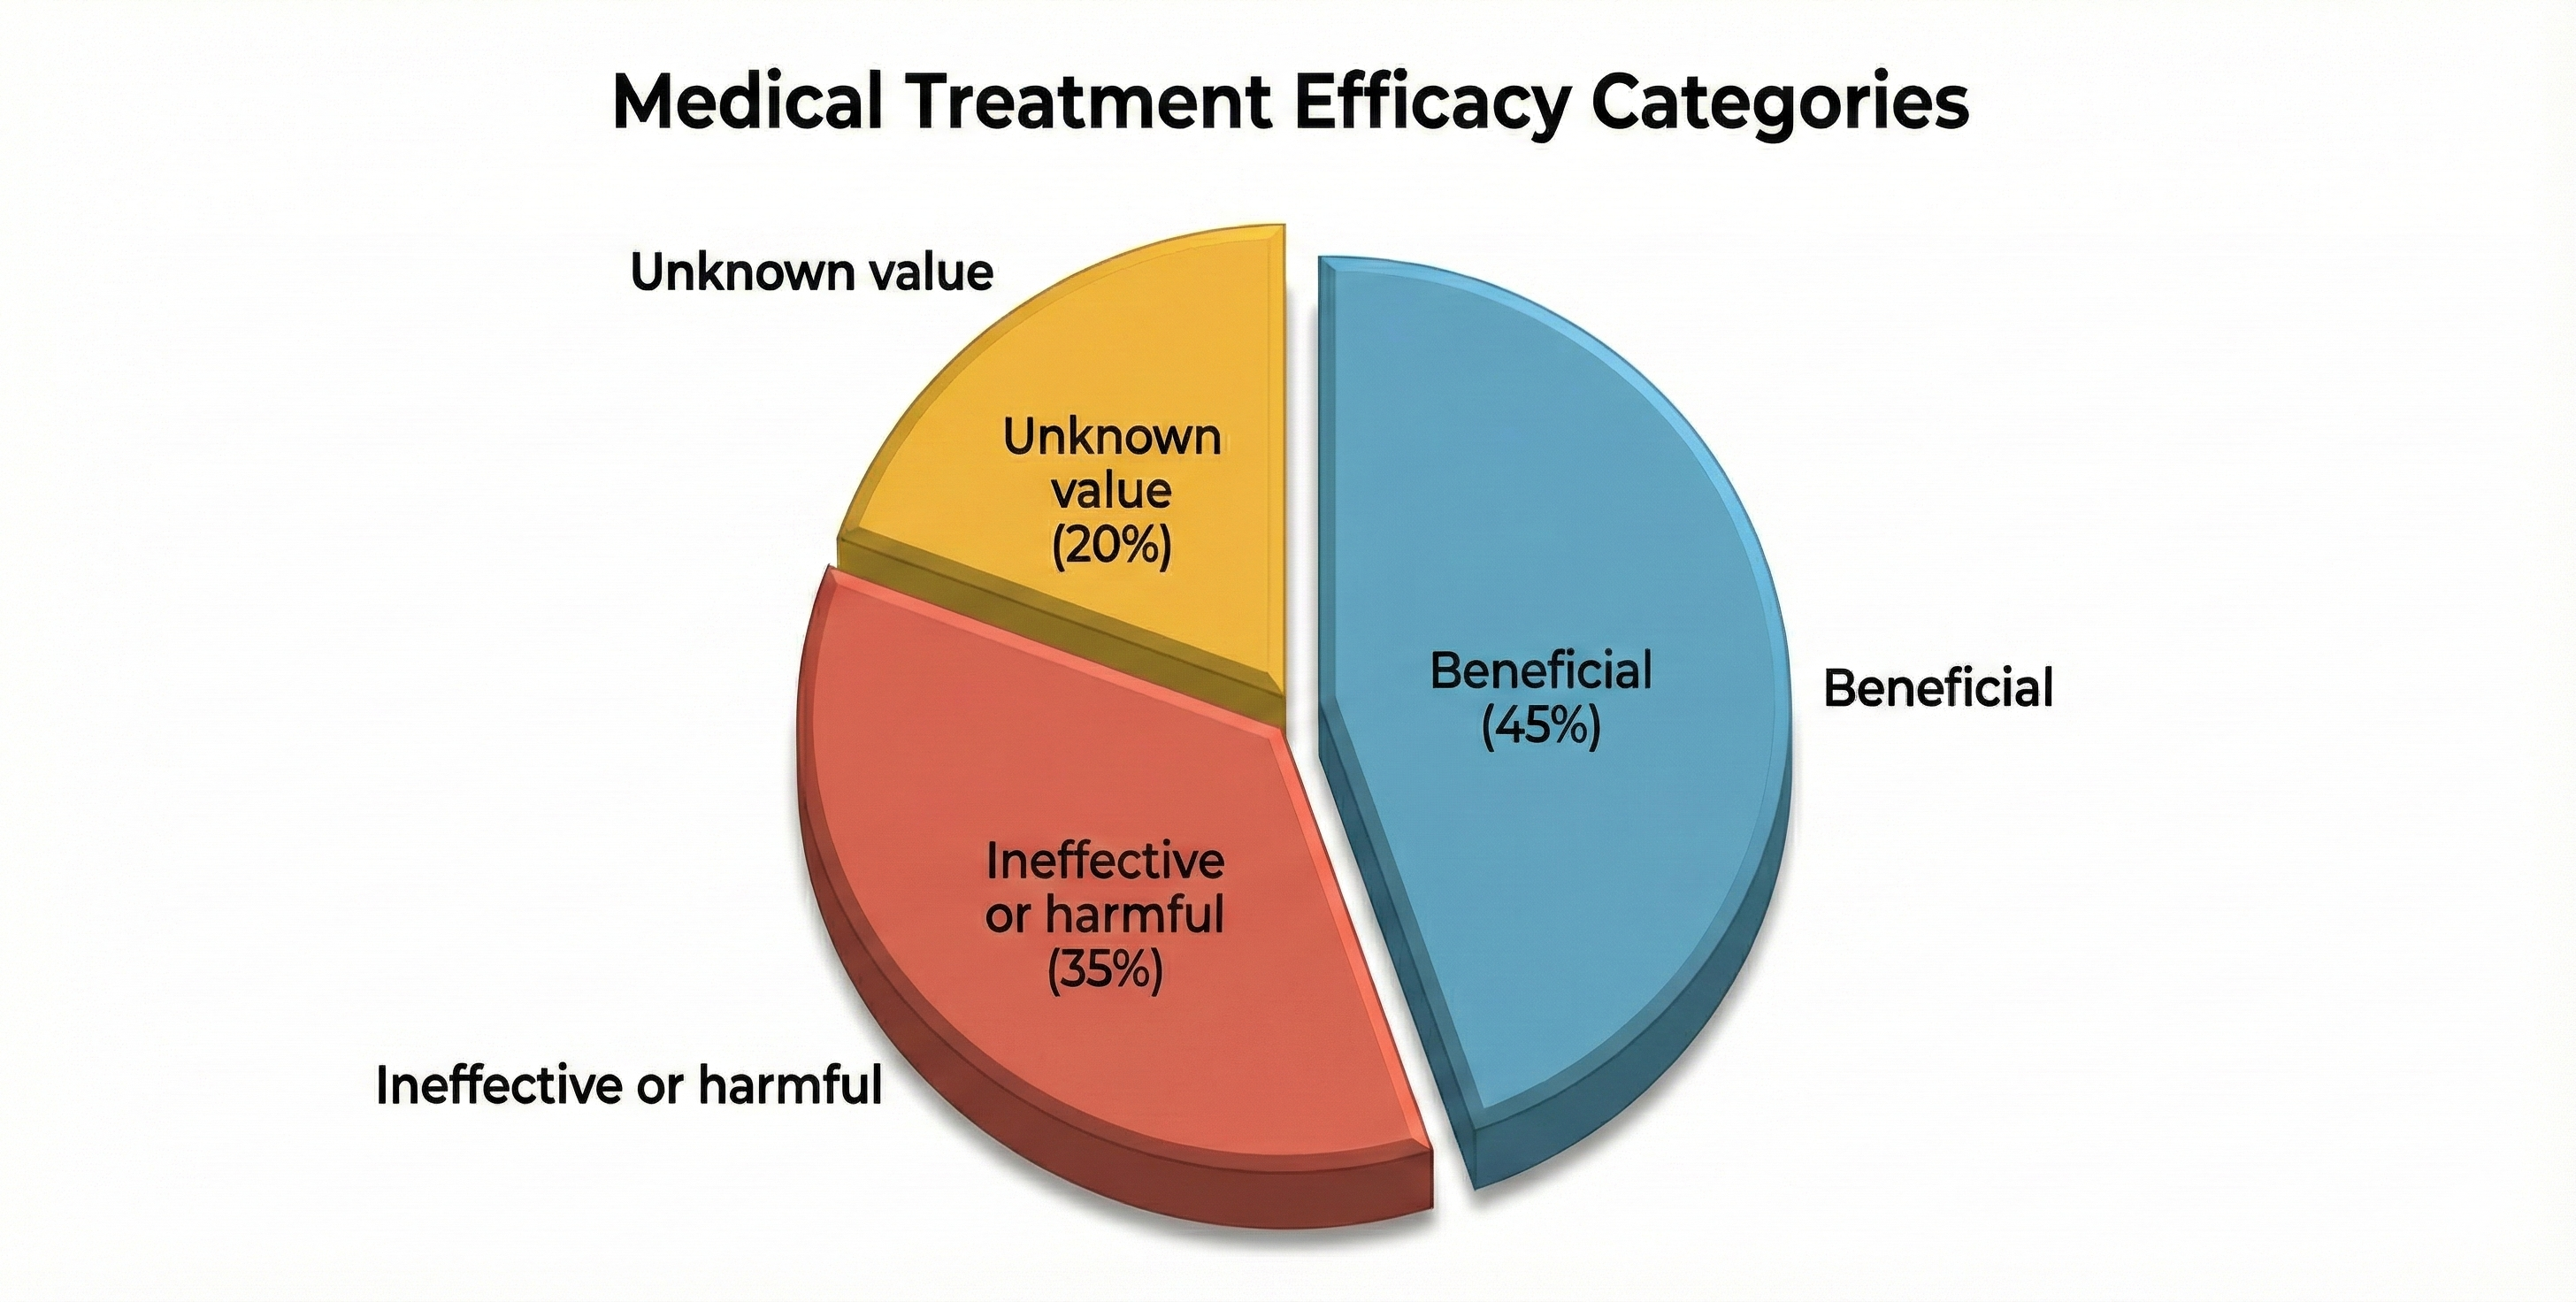
Examples of ineffective or harmful practices included hormone replacement therapy in postmenopausal women and aggressive blood sugar reduction in Type 2 diabetics treated in intensive care, which increased mortality rates.
The authors observed: "Nevertheless, the reversals we have identified at the very least call these practices into question. Some practices ought to be abandoned, whereas others warrant retesting in more powerful investigations. One of the greatest virtues of medical research is our continual quest to reassess it." (p. 796)
Criteria for Clinical Efficacy: The Five Levels
The following guidelines for evaluating the clinical efficacy of biofeedback and neurofeedback interventions were recommended by a joint Task Force and adopted by the Boards of Directors of the Association for Applied Psychophysiology (AAPB) and the International Society for Neuronal Regulation (ISNR) (LaVaque et al., 2002). The Evidence-Based Practice in Biofeedback and Neurofeedback (4th ed.) ratings are discussed in the Applications units.

Level 1: Not Empirically Supported
Supported only by anecdotal reports and/or case studies in non-peer reviewed venues.
Level 2: Possibly Efficacious
At least one study of sufficient statistical power with well-identified outcome measures but lacking randomized assignment to a control condition internal to the study.
Level 3: Probably Efficacious
Multiple observational studies, clinical studies, wait-list controlled studies, and within-subject and intrasubject replication studies that demonstrate efficacy.
Level 4: Efficacious
This level requires that, in comparison with a no-treatment control group, alternative treatment group, or sham (placebo) control utilizing randomized assignment, the investigational treatment is shown to be statistically significantly superior to the control condition or the investigational treatment is equivalent to a treatment of established efficacy in a study with sufficient power to detect moderate differences. Additionally, the studies must have been conducted with a population treated for a specific problem, for whom inclusion criteria are delineated in a reliable, operationally defined manner. The study must have used valid and clearly specified outcome measures related to the problem being treated. The data must be subjected to appropriate data analysis. The diagnostic and treatment variables and procedures must be clearly defined in a manner that permits replication of the study by independent researchers. Finally, the superiority or equivalence of the investigational treatment must have been shown in at least two independent research settings.
Level 5: Efficacious and Specific
The investigational treatment is statistically superior to credible sham therapy, pill, or alternative bona fide treatment in at least two independent research settings.

Glossary
68-95-99.7 rule: the principle that in a normal distribution, approximately 68% of scores fall within one standard deviation of the mean, 95% within two standard deviations, and 99.7% within three.
ABA reversal design: small N design where a baseline is followed by treatment and then a return to baseline.
analytic generalization: using findings from specific cases to inform broader theoretical principles that can be tested across similar cases.
assignment threat: a classic threat to internal validity in which individual differences are not balanced across treatment conditions by the assignment procedure.
assignment-interaction threat: the combination of a selection threat with at least one other threat (history, maturation, testing, instrumentation, statistical regression, or mortality).
balancing: a method of controlling a physical variable by distributing its effects across all treatment conditions (running half of each condition's participants in the morning and half in the evening).
baseline: a control condition in which participants receive a zero level of the independent variable (sitting quietly without receiving feedback about physiological performance).
baseline-only control condition: participants sit quietly without receiving feedback about their physiological performance.
bidirectional causation: reason that correlation does not imply causation. Each of two variables could influence the other.
blinding: concealing condition assignments from participants, experimenters, or both to control for demand characteristics and experimenter bias.
case study: a nonexperimental descriptive study of a participant's experiences, observable behaviors, and archival records kept by an outside observer.
Cohen's d: a standardized effect size measure that expresses the difference between group means in standard deviation units, where 0.2 is small, 0.5 is medium, and 0.8 is large.
confidence intervals: ranges of values within which the true population effect is likely to fall.
confirmatory research: research that tests pre-specified hypotheses.
confound: any variable other than the independent variable that changes alongside it, creating an alternative explanation for observed results.
confounding: loss of internal validity when an extraneous variable systematically changes across the experimental conditions.
constancy of conditions: controlling a physical variable by keeping it constant across all treatment conditions (running all participants in the evening).
contingent feedback: feedback of a participant's actual physiological performance.
contingent feedback of an unrelated response: feedback that reinforces physiological changes in a system that should not powerfully affect the dependent variables.
control group: in an experiment, a group that receives a zero-level of the independent variable (placebo or wait-list).
control variables: factors that a researcher deliberately keeps constant across all experimental conditions to eliminate alternative explanations.
correlational study: a nonexperimental procedure in which the researcher does not manipulate an independent variable and only records data concerning traits or behaviors (investigating the relationship between body mass index and severity of low back pain).
covariance: the criterion for causality requiring that when the independent variable changes, the dependent variable also changes in a predictable way.
covariates: participant characteristics included in statistical models to adjust for known sources of variation.
demand characteristics: situational cues (like placing EEG sensors on a client's forehead) that signal expected behavior (increased attention).
dependent variable (DV): the outcome measure the experimenter uses to assess the change in behavior produced by the independent variable (airway resistance could be used to measure the effectiveness of HRV training for asthma).
design confound: a threat to internal validity that occurs when a second variable unintentionally varies systematically with the independent variable.
detectable noncontingent feedback: noncontingent feedback that a participant can detect as false when the display fails to mirror voluntary behavior like muscle bracing.
direction problem: the inability to determine from a correlation alone which variable causes the other.
double-blind crossover experiment: an experimental approach using a double-blind design where participants start with one treatment and conclude with an alternative treatment (controls demand characteristics, experimenter bias, and individual differences).
double-blind experiment: the experimenter and participant do not know the condition to which the participant has been assigned to control demand characteristics and experimenter bias.
effect size: magnitude of an IV's effect on the DV.
elimination: controlling a physical variable by removing it (soundproofing a room).
error variance: unwanted variability in data due to factors unrelated to the independent variable.
ex post facto study: quasi-experimental design in which a researcher compares participants on pre-existing characteristics.
executive monkey: in Brady's study, the monkey assigned to press a lever to prevent shock for both itself and its yoked partner.
experimenter bias: confounding occurs when the researcher knows the participants' treatment condition and acts in a manner that confirms the experimental hypothesis.
exploratory research: research that generates hypotheses from observed patterns in data.
external validity: the degree to which sample findings can be generalized to the population from which it was drawn.
extraneous variable (EV): variable not controlled by the experimenter (room temperature).
file drawer effect: excluding unpublished studies that did not obtain significant treatment effects from a meta-analysis or systematic review.
file drawer problem: the tendency for studies with non-significant results to remain unpublished, creating a distorted picture of treatment effectiveness.
gastric ulcers: erosions in the stomach lining that served as the dependent variable in Brady's Executive Monkey study.
generalizability: the extent to which findings from one or a few individuals can be applied to broader populations.
HARKing: hypothesizing after the results are known; formulating or modifying hypotheses after examining data and presenting them as if predicted from the outset.
history threat: a classic threat to internal validity that occurs when an event outside the experiment threatens internal validity by changing the DV.
independent variable (IV): the variable (antecedent condition) an experimenter intentionally manipulates (HRV or SEMG biofeedback).
individual differences: natural variability among participants in traits such as personality, intelligence, motivation, baseline skill level, and prior experience.
instrumentation threat: a classic threat to internal validity in which changes in the measurement instrument or procedure threaten internal validity.
internal validity: the degree to which the experiment can demonstrate that changes in the dependent variable across treatment conditions are due to the independent variable.
interrupted time-series design: a quasi-experimental design involving repeatedly measuring a variable before, during, and after an intervention to detect meaningful departures from baseline patterns.
large N designs: studies that examine the performance of groups of participants.
level 1: not empirically supported.
level 2: possibly efficacious.
level 3: probably efficacious.
level 4: efficacious.
level 5: efficacious and specific.
magnitude: the strength of a correlation, ranging from 0 to 1 when the sign is ignored, indicating how closely data points cluster around a line.
matched-groups design: a design in which participants are paired on relevant characteristics and then randomly assigned to different conditions.
maturation threat: a classic threat to internal validity that occurs when physical or psychological changes in participants threaten internal validity by changing the dependent variable.
mean: arithmetic average and the most commonly reported measure of central tendency.
measurement precision: the degree of certainty with which an effect size is estimated, reflected in the width of confidence intervals.
measures of central tendency: descriptive statistics (mean, median, and mode) that describe the typical sample score.
measures of variability: descriptive statistics (range, standard deviation, and variance) that describe the dispersion of scores within a sample and allow us to compare different samples.
median: the score that divides a sample distribution in half. It is the middle score or the average of two middle scores.
meta-analysis: a statistical analysis that combines and quantifies data from many experiments that use the same operational definitions for their independent and dependent variables to calculate an average effect size.
mode: the most frequent score calculated when there are at least two different sample values.
mortality threat: a classic threat to internal validity that occurs when participants drop out of experimental conditions at different rates.
multimodal: a distribution with multiple peaks, indicating more than one most frequently occurring value.
multiple baseline design: a small-N design that introduces intervention at different times across different clients, settings, or target behaviors to demonstrate treatment effects without withdrawing treatment.
N: number of participants.
no-biofeedback control group: control condition in which participants do not receive physiological feedback.
noise: unwanted variability in data due to factors unrelated to the independent variable.
noncontingent feedback: false pre-programmed feedback that does not reflect the participant's actual physiological performance.
nonequivalent control group pretest-posttest design: a quasi-experimental design where treatment and comparison groups complete baseline and follow-up assessments without random assignment.
nonequivalent control groups: comparison participants who do not receive treatment but are measured at the same time points as the treatment group, without random assignment.
nonspecific treatment effect: a measurable symptom change not correlated with a specific psychophysiological change.
normal distribution: a symmetrical bell-shaped distribution where most values cluster near the average and fewer scores appear at the extremes.
observational studies: nonexperimental procedures like naturalistic observation and correlational studies.
observer bias: when researchers' expectations unconsciously influence their observations and measurements of participants.
open data: making datasets publicly available so other researchers can verify analyses, identify errors, or explore new questions.
open materials: sharing research tools including protocols, scripts, and questionnaires so others can replicate procedures exactly.
outliers: extreme scores that can dramatically affect statistical measures like the mean.
p-hacking: manipulation of data analysis to achieve statistically significant results through selective or iterative analysis strategies rather than genuine effects.
participant characteristics: personal attributes like baseline physiological values that can become a source of within-group variability.
Pearson r: a statistical procedure that calculates the strength of the relationship (from -1.0 to +1.0) between pairs of variables measured using interval or ratio scales.
perceived control: the belief in one's ability to influence events, which research shows serves as a buffer against stress.
personality variables: personal aspects of participants or experimenters like anxiety or warmth.
physical variables: properties of the physical environment like time of day, room size, or noise.
placebo control groups: groups receiving treatment indistinguishable from the real intervention but without the active ingredient.
placebo effect: genuine physiological or psychological changes in participants due to their belief in a treatment's efficacy rather than any active ingredient.
placebo response: associatively conditioned homeostatic response.
precision: how accurately a study estimates the true effect size, reflected in the width of confidence intervals.
pre-registration: submission of a study on the Open Science Framework before data collection.
pre-test/post-test design: researchers measure participants on the DV at least twice, before and after administering training.
probability: in correlation, the likelihood that an association between variables is due to chance; values less than 0.05 may signal a real association.
publication bias: the tendency for journals to favor studies with statistically significant findings over those reporting null results.
quasi-experimental design: a research approach that resembles a true experiment but lacks either manipulation of the independent variable or random assignment of participants to conditions.
questionable research practices (QRPs): methodological and analytical behaviors that distort the scientific record without necessarily constituting outright fraud.
random assignment: using chance to determine which participants end up in which condition, ensuring every participant has an equal chance of being assigned to any condition.
random sample: a subset of a target population selected using an unbiased method so that every member of the population has an equal chance to be chosen.
random sampling: selecting participants from a population so that each member has an equal chance to be selected, a prerequisite for external validity.
randomized controlled trial (RCT): researchers manipulate an independent variable and randomly assign participants to conditions, with or without prior matching on participant variables.
range: the difference between the lowest and highest values.
Registered Reports: a publication format where peer review occurs before data collection, and acceptance is based on methodological quality rather than outcomes.
registration: submission of study design to a journal before data collection for Stage 1 and Stage 2 peer review.
regression to the mean: the statistical phenomenon where extreme scores tend to drift back toward the average on subsequent testing.
relaxation control condition: participants receive a non-biofeedback relaxation procedure.
replication: the repeated testing of research findings to verify their reliability.
replication crisis: the widespread failure to reproduce published findings across studies, often attributed to underpowered studies and questionable research practices.
researcher degrees of freedom: the many decision points in data collection and analysis where choices can influence outcomes.
resonance frequency (RF): the stimulation rate using techniques like paced breathing that produces the greatest heart rate variability.
reverse contingent feedback: feedback that trains participants to produce changes that are the reverse of those shaped by a clinical protocol (beta decrease and theta increase in children diagnosed with ADHD).
sample: selected subset of a target population.
selection bias: a methodological flaw in which subjects are not randomly assigned to conditions, leading to skewed results.
selection effects: when participants in one condition of an experiment differ systematically from those in another condition due to the method of assignment.
selection interactions: the combination of a selection threat with at least one other threat (history, maturation, testing, instrumentation, statistical regression, or subject mortality).
sign: the property of a correlation indicating whether the relationship is positive (variables move together) or negative (variables move in opposite directions).
single-blind experiment: participants are not told their treatment condition.
situation noise: random variability introduced by environmental and contextual factors that differ across testing sessions.
skewed: a distribution where values are not symmetrically distributed around the mean, with a tail extending to one side.
small N designs: studies involving one or two participants.
social variables: aspects of the relationships between researchers and participants like demand characteristics and experimental bias.
specific treatment effect: a measurable symptom change associated with a measurable psychophysiological change produced by biofeedback.
spontaneous remission: natural improvement in symptoms without treatment, a form of maturation threat.
standard deviation: the square root of the average squared deviations from the mean.
state anxiety: situational anxiety that varies based on current circumstances, as opposed to trait anxiety.
statistical power: the probability that a study will detect an effect when one actually exists.
statistical regression threat: a classic threat to internal validity that occurs when participants are assigned to conditions using extreme scores. The measurement procedure is not wholly reliable. Participants are retested using the same method to show change on the DV. The scores of both extreme groups tend to regress to the mean on the second measurement so that high scorers are lower and low scorers are higher on the second testing.
temporal precedence: the criterion for causality requiring that the cause occurs before the effect.
test-retest reliability: the consistency of measurements taken at two different points in time.
testing effects: changes in participants simply because they have taken the same test multiple times.
testing threat: a classic threat to internal validity that occurs when prior exposure to a measurement procedure affects performance during the experiment.
third variable problem: a reason that correlation does not mean causation. A hidden variable may affect both correlated variables. For example, alcohol abuse could both disrupt sleep and increase depression.
Type II error: incorrectly concluding that no effect exists when one actually does.
underpowered studies: research with sample sizes too small to reliably detect effects, which tend to produce inflated effect sizes when significant.
underreporting of null findings: the failure to publish studies with non-significant results, contributing to the file drawer problem.
variance: the average squared deviation of scores from their mean.
visual analysis: examining graphed data to identify trends, level changes, and stability within phases in small-N research.
wait-list control group: participants are measured like the experimental group(s) but are placed on a waiting list for an experimental treatment.
wait-list designs: quasi-experimental designs where all participants eventually receive treatment but at staggered times.
within-subjects design: a design where each participant serves as their own control by experiencing all experimental conditions.
yoked control: in Brady's study, the monkey that received the same shocks as the executive monkey but had no control over preventing them.
z-score training: a neurofeedback protocol that reinforces in real-time closer approximations of client EEG values to those in a normative database.
Test Yourself
Click on the ClassMarker logo to take 10-question tests over this unit without an exam password.

Review Flashcards on Quizlet
Click on the Quizlet logo to review our chapter flashcards.

Visit the BioSource Software Website
BioSource Software offers Human Physiology, which satisfies BCIA's Human Anatomy and Physiology requirement, and Biofeedback100, which provides extensive multiple-choice testing over the Biofeedback Blueprint.

Assignment
Now that you have completed this unit, consider how you could use the case study approach in your clinical practice to assess treatment efficacy. What dependent variables would you track? How would you establish a baseline? What threats to internal validity would you need to acknowledge when interpreting your results?
References
Bordens, K. S., & Abbott, B. B. (2022). Research design and methods: A process approach (11th ed.). McGraw Hill.
Brady, J. V. (1958). Ulcers in "executive" monkeys. Scientific American, 199(4), 95-100. https://psycnet.apa.org/doi/10.1038/scientificamerican1058-95
Campbell, D. T. (1957). Factors relevant to the validity of experiments in social settings. Psychological Bulletin, 54, 297-312. https://psycnet.apa.org/doi/10.1037/h0040950
Campbell, D. T., & Stanley, J. T. (1966). Experimental and quasi-experimental designs for research. Rand McNally.
John, L. K., Loewenstein, G., & Prelec, D. (2012). Measuring the prevalence of questionable research practices with incentives for truth-telling. Psychological Science, 23, 524-432. https://doi.org/10.1177/0956797611430953
Khazan, I., Shaffer, F., Moss, D., Lyle, R., & Rosenthal, S. (2023). Evidence-based practice in biofeedback and neurofeedback (4th ed.). Association for Applied Psychophysiology and Biofeedback.
Larson, M. J. (2019, March 13-16). How can we improve the rigor and replicability of applied psychophysiology? [Keynote address]. Association for Applied Psychophysiology and Biofeedback Annual Meeting, Denver, CO, United States.
LaVaque, T. J., Hammond, D. C., Trudeau, D., Monastra, V., Perry, J., Lehrer, P., Matheson, D., & Sherman, R. (2002). Template for developing guidelines for the evaluation of the clinical efficacy of psychophysiological evaluations. Applied Psychophysiology and Biofeedback, 27(4), 273-281. https://dx.doi.org/10.1023/A:1021061318355
Morling, B. (2025). Research methods in psychology (5th ed.). Norton.
Myers, A., & Hansen, C. (2012). Experimental psychology (7th ed.). Wadsworth.
Peniston, E. G., & Kulkosky, P. J. (1990). Alcoholic personality and alpha-theta brainwave training. Medical Psychotherapy, 3, 37-55.
Prasad, V., Vandross, A., Toomey, C., Cheung, M., Rho, J., Quinn, S., . . . Vifu, A. (2013). A decade of reversal: An analysis of 146 contradicted medical practices. Mayo Clinic Proceedings, 88(8), 790-798. https://doi.org/10.1016/j.mayocp.2013.05.012
Weiss, J. M. (1972). Psychological factors in stress and disease. Scientific American, 226(6), 104-113. https://doi.org/10.1038/scientificamerican0672-104
Wickramasekera, I. A. (1988). Clinical behavioral medicine: Some concepts and procedures. Plenum Press.
Wickramasekera, I. A. (1999). How does biofeedback reduce clinical symptoms and do memories and beliefs have biological consequences? Toward a model of mind-body healing. Applied Psychophysiology and Biofeedback, 24(2), 91-105. https://doi.org/10.1023/a:1022201710323
Yaremko, R. M., Harari, H., Harrison, R. C., & Lynn, E. (1982). Reference handbook of research and statistical methods in psychology: For students and professionals. Harper & Row.
Yucha, C. B., & Montgomery, D. (2008). Evidence-based practice in biofeedback and neurofeedback (2nd ed.). Association for Applied Psychophysiology and Biofeedback.
Zerr, C. L. (2021). Personal communication regarding probability testing.