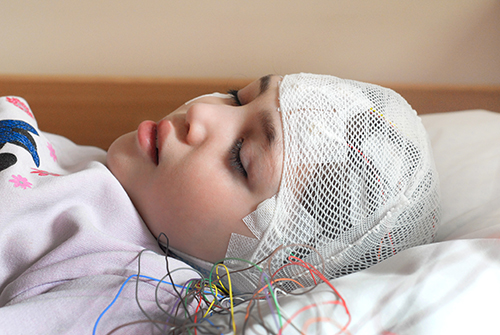
EEG Anatomy
What You Will Learn
This chapter takes you inside the brain's electrical symphony, from the roughly 100 billion neurons that generate brain signals to the surface electrodes that capture them. You will learn how the electroencephalograph (EEG) records the postsynaptic potentials of large pyramidal neurons arranged in cortical columns, and why action potentials contribute little to the scalp signal. You will discover how neurons communicate through excitatory and inhibitory potentials that sum at the axon hillock to determine whether a neuron fires. You will explore the thalamocortical networks that generate EEG rhythms ranging from slow delta waves to fast gamma oscillations, and understand why different frequency bands correlate with different behavioral states. The clinical significance of brainwave patterns for conditions like ADHD, anxiety, and traumatic brain injury will become clear, as will the role of neuroplasticity in making neurofeedback training possible.
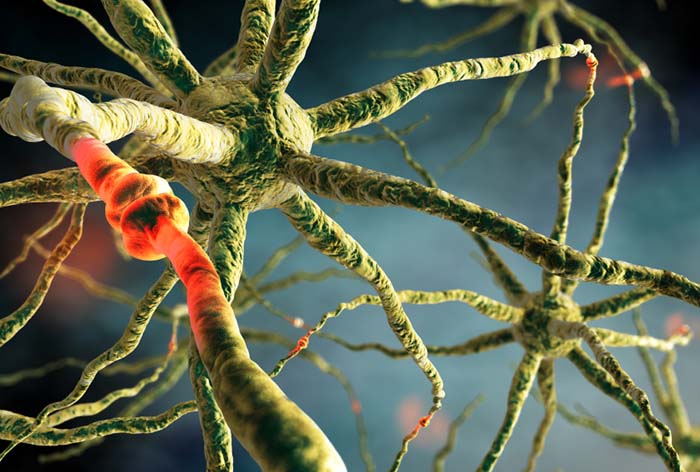
The brain uses a sophisticated communication and command-and-control system that monitors and manages interactions between roughly 100 billion neurons, each with 5,000 to 10,000 synaptic connections, for as many as 500 trillion synapses in adults (Breedlove & Watson, 2020).
The EEG records the excitatory postsynaptic potentials (EPSPs) and inhibitory postsynaptic potentials (IPSPs) propagated by the apical dendrites of large pyramidal cells. These neurons are arranged in thousands of cortical columns. Local field potentials, the aggregate effect of interconnected neuron firing and modulation by glial cells, regulate neuron excitability and firing.
Neuroplasticity, the remodeling of neurons and neural networks with experience, is responsible for learning and memory and makes neurofeedback training possible. Think of it this way: every time you learn a new skill or form a new memory, your brain physically rewires itself. This same capacity allows clients to reshape their own brainwave patterns through neurofeedback.
The EEG records the EPSPs and IPSPs in the dendrites of pyramidal cells in the upper cortical layers. Neurons work in partnership with glial cells, which produce SCPs. There are multiple generators of the EEG rhythms that are studied and shaped by neurofeedback professionals. Intracellular and extracellular studies provide evidence of a corticothalamic network responsible for various EEG rhythms.
The simplest way to divide the cortex is into the frontal and posterior cortex. The frontal cortex (frontal lobe) specializes in action, ranging from cognition, emotion, and autonomic control to movements and speech. The posterior cortex (parietal, temporal, and occipital lobes) is concerned with perception and memory.
The prefrontal cortex (PFC), which is the cortex rostral to the motor association cortex, directs the cognitive and emotional processes called perception-action cycles that adapt (and preadapt) us to our environment. The PFC predicts and creates the future. Working in cooperation with networked brain structures, the PFC marshals its executive functions of planning, attention, working memory, and decision making to develop innovative and sophisticated actions to pursue future goals (Fuster, 2015).
The nervous system uses bottom-up (feedforward) and top-down (feedback) processing to maintain homeostasis. The interconnectedness of neural networks is best illustrated by the relationship between the thalamus and cortex. Ascending thalamocortical neurons distribute sensory information to appropriate cortical (and subcortical) regions. Descending corticothalamic neurons convey instructions to the thalamus.
BCIA Blueprint Coverage
EEG anatomy and physiology is not part of the BCIA Biofeedback Blueprint. We cover it to provide a more comprehensive introduction to biofeedback and neurofeedback.
This unit covers Neurons, What Is the EEG?, Local Versus Global Decision-making, and Connectivity.
🎧 Listen to the Full Chapter Lecture
Neurons: The Brain's Messengers
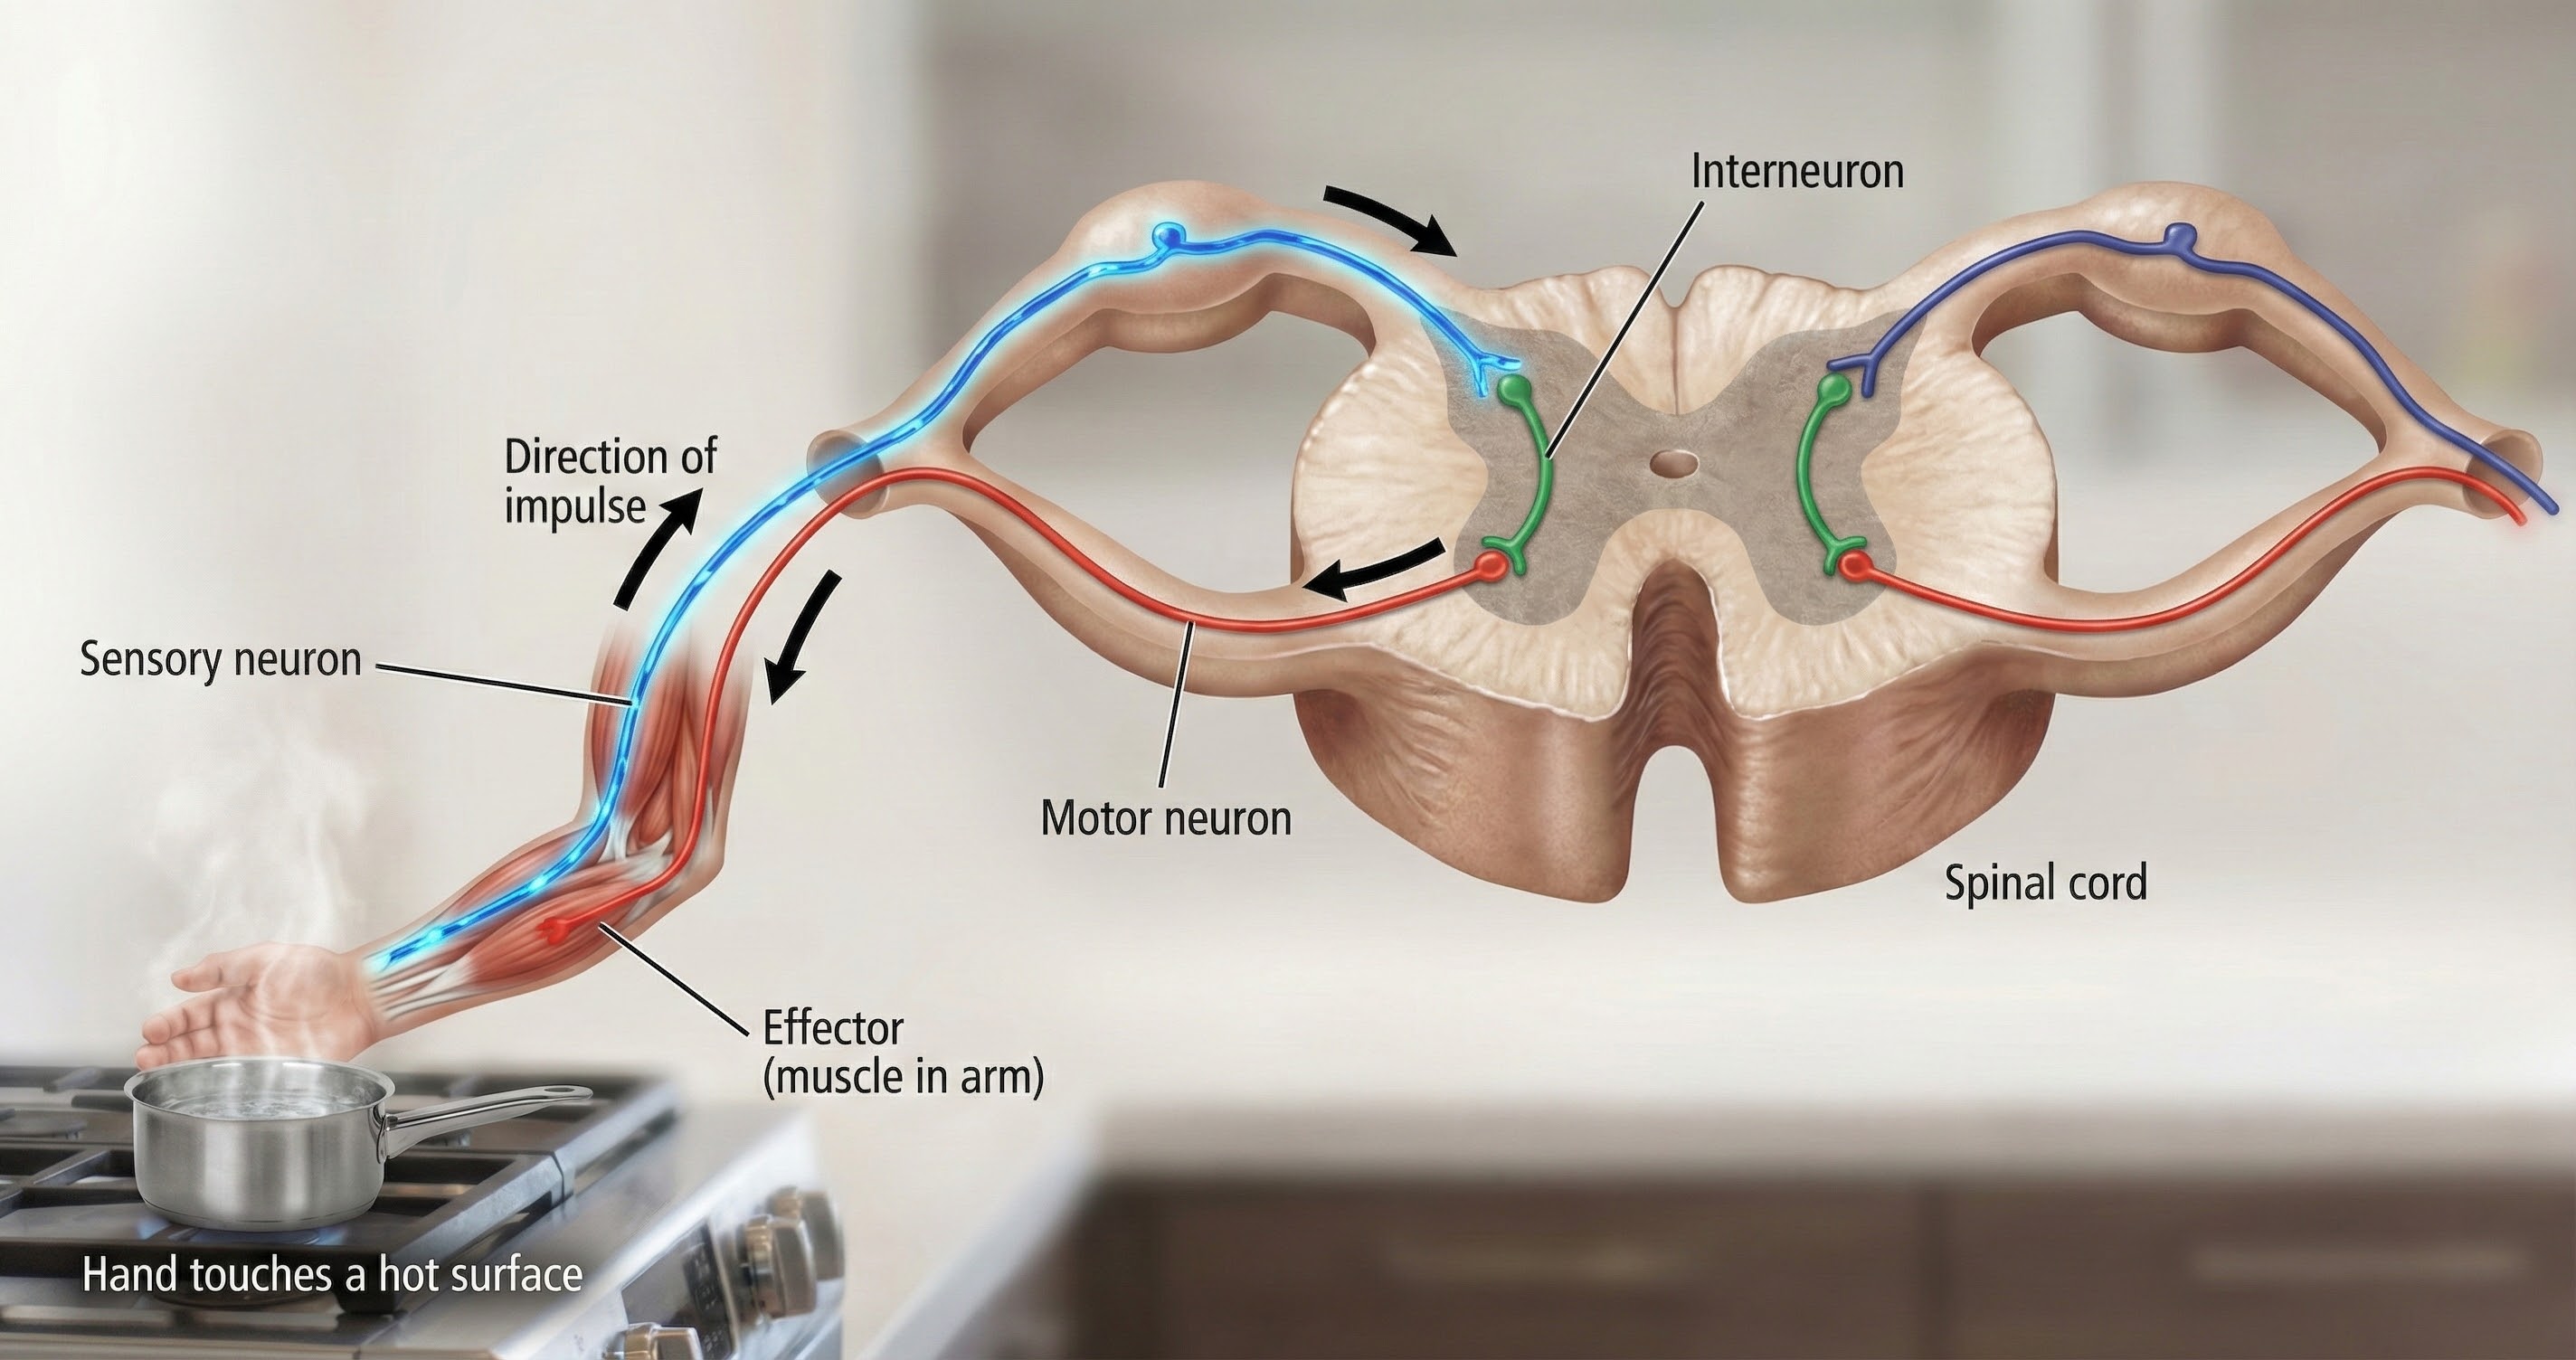
We can divide neurons into three major types based on their function: sensory, motor, and interneurons.
Sensory Neurons Bring Information In
Sensory neurons are specialized for sensory intake. They are called afferent because they transmit sensory information towards the central nervous system (brain and spinal cord). Imagine standing at a busy intersection: your sensory neurons are constantly relaying information about traffic sounds, exhaust smells, and the pressure of the sidewalk beneath your feet.
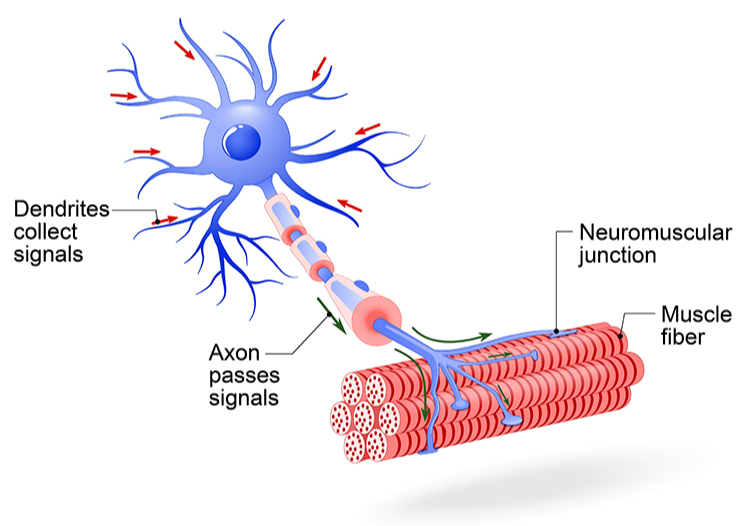
Motor Neurons Send Commands Out
Motor neurons convey commands to glands, muscles, and other neurons. They are called efferent because they transmit information towards the periphery. When you decide to wave at a friend across the street, motor neurons carry that command from your brain to the muscles in your arm.
Interneurons Make the Connections
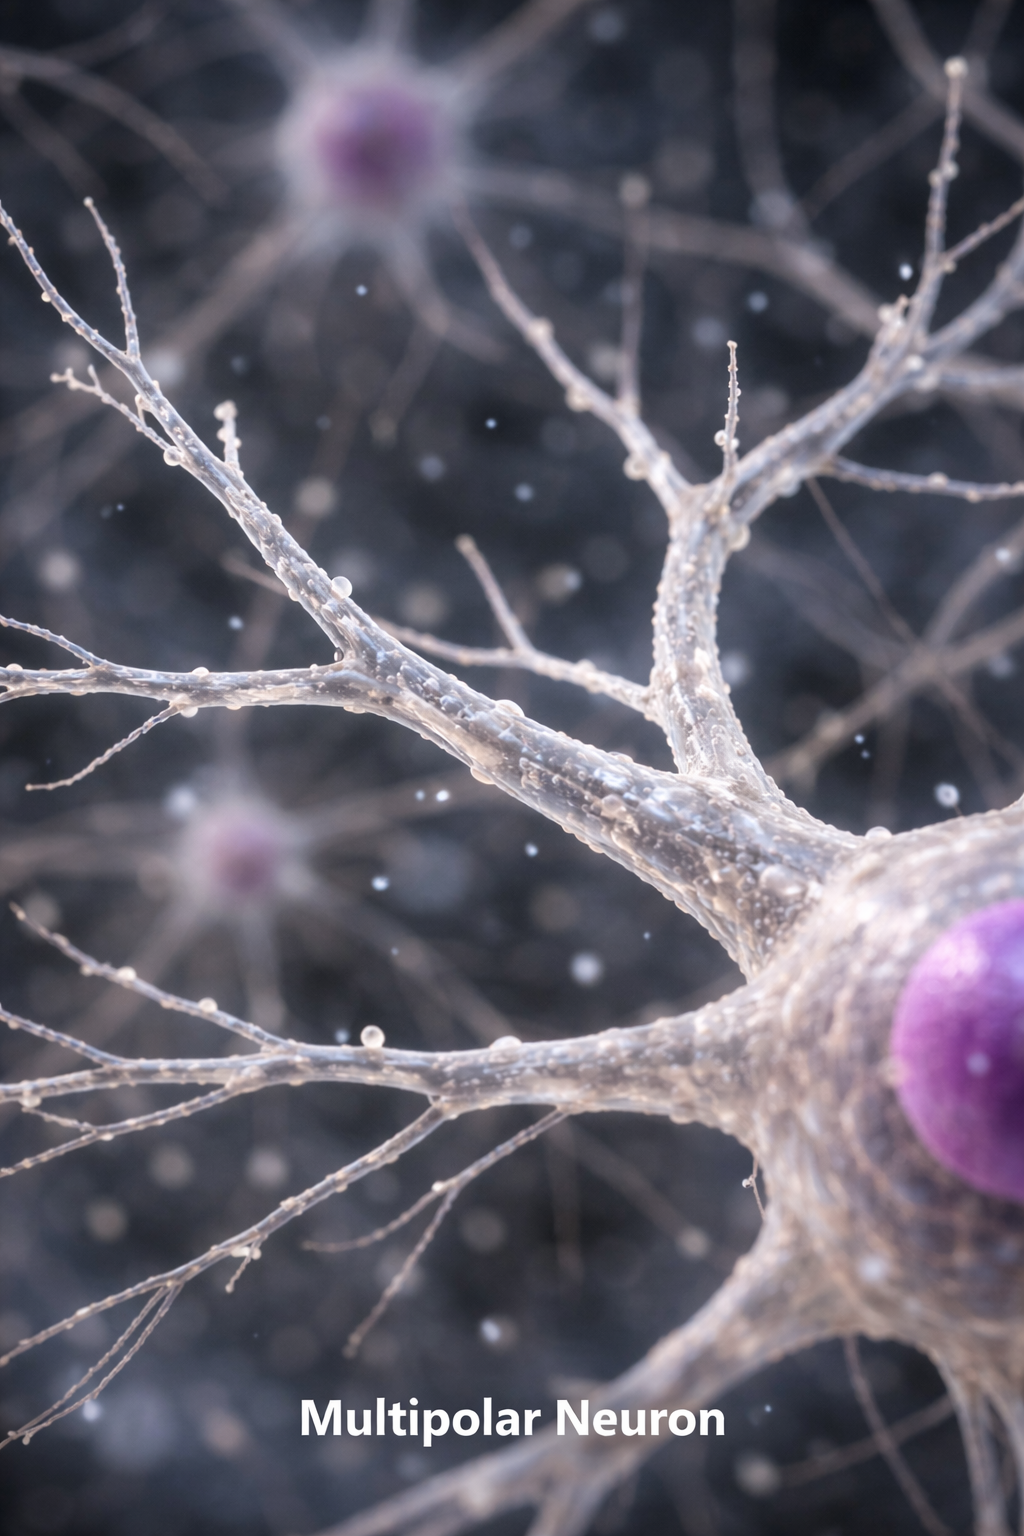
Interneurons provide the integration required for decisions, learning and memory, perception, planning, and movement. They have short processes (i.e., axons and dendrites) analyze incoming information, and distribute their analysis with other neurons in their network. Interneurons are entirely confined to the central nervous system (CNS), account for most of its neurons, and comprise most of the brain (Breedlove & Watson, 2023).
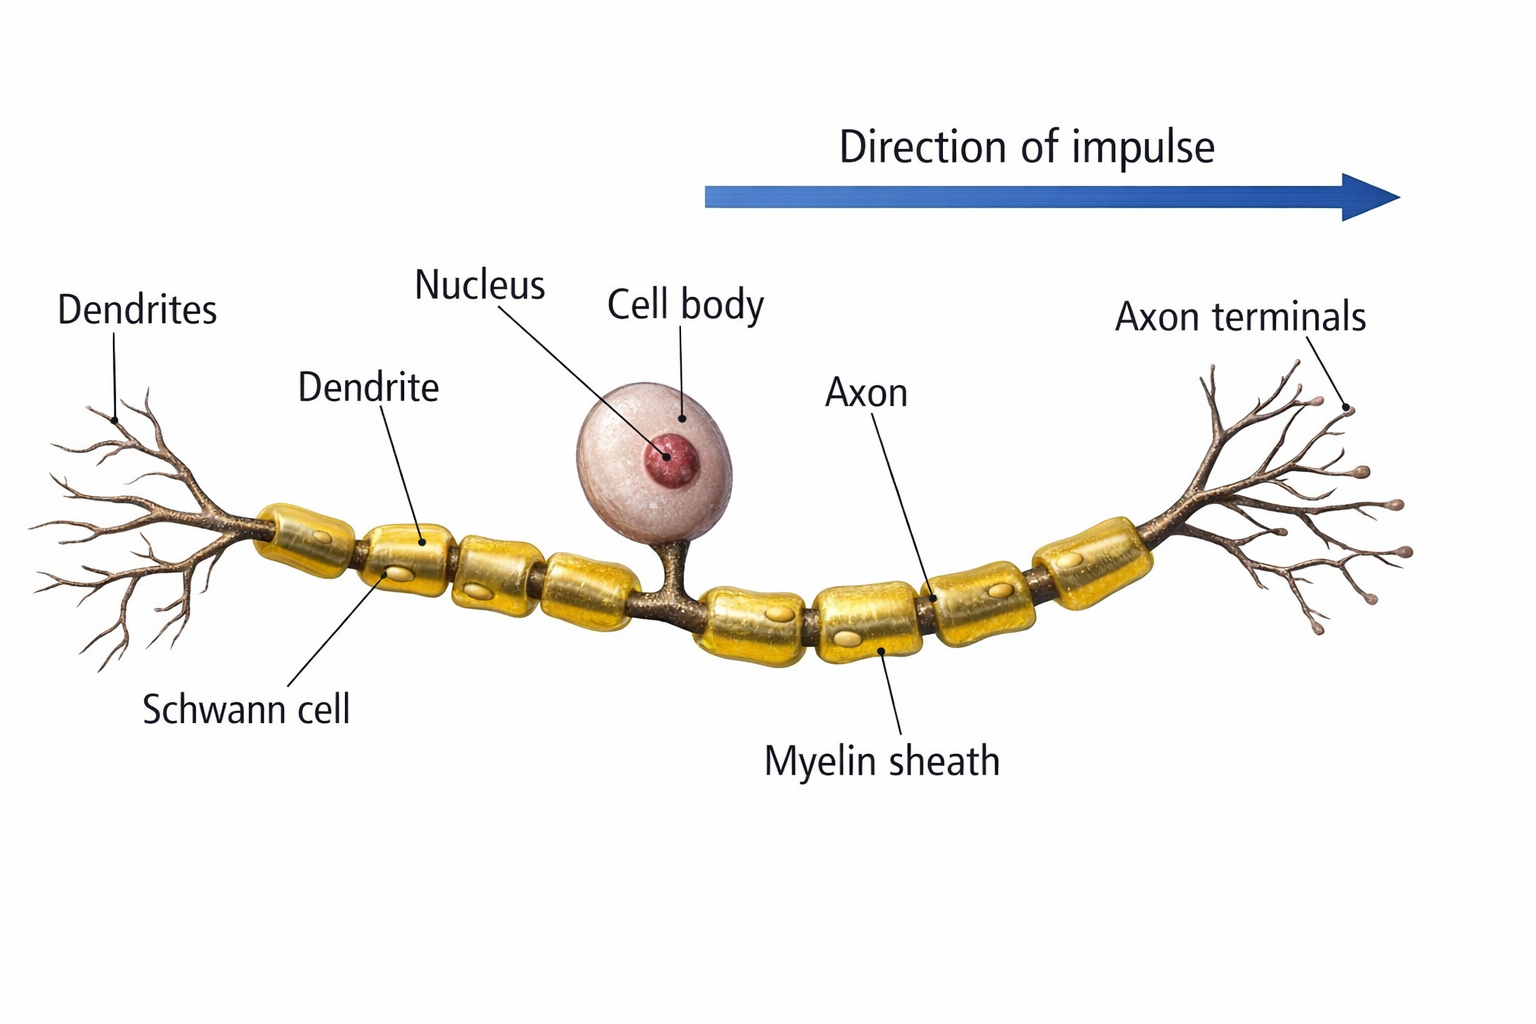
Neuron Structure: Five Essential Parts
While neurons have over 200 different designs to perform specialized jobs in the nervous system, they generally have five structures: a cell body or soma, dendrites, an axon and axon hillock, and terminal buttons.
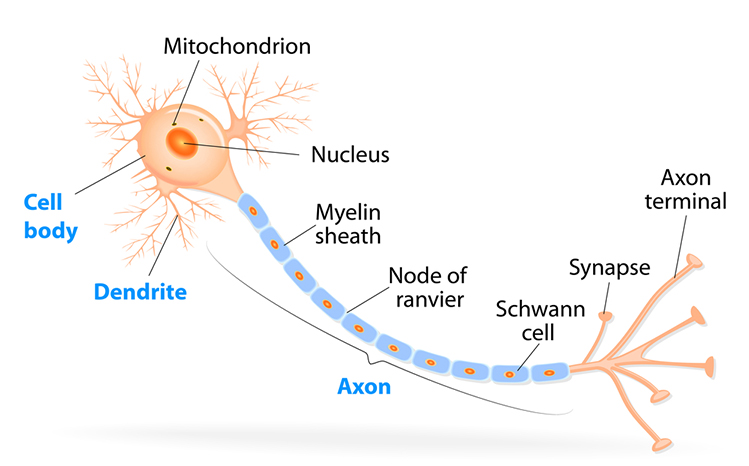
The cell body or soma contains the machinery for a neuron's life processes. It receives and integrates EPSPs and IPSPs, small graded positive and negative changes in membrane potential generated by axons. The cell body of a typical neuron is 20 μm in diameter, and its spherical nucleus, which contains chromosomes comprised of DNA, is 5-10 μm across.
Dendrites are branched structures designed to receive messages from other neurons via axodendritic synapses (junctions between axons and dendrites), determining whether the axon hillock will initiate an action potential.
Thousands of dendritic spines, mushroom-shaped protrusions where axons typically form synapses, dot the dendrite surface.
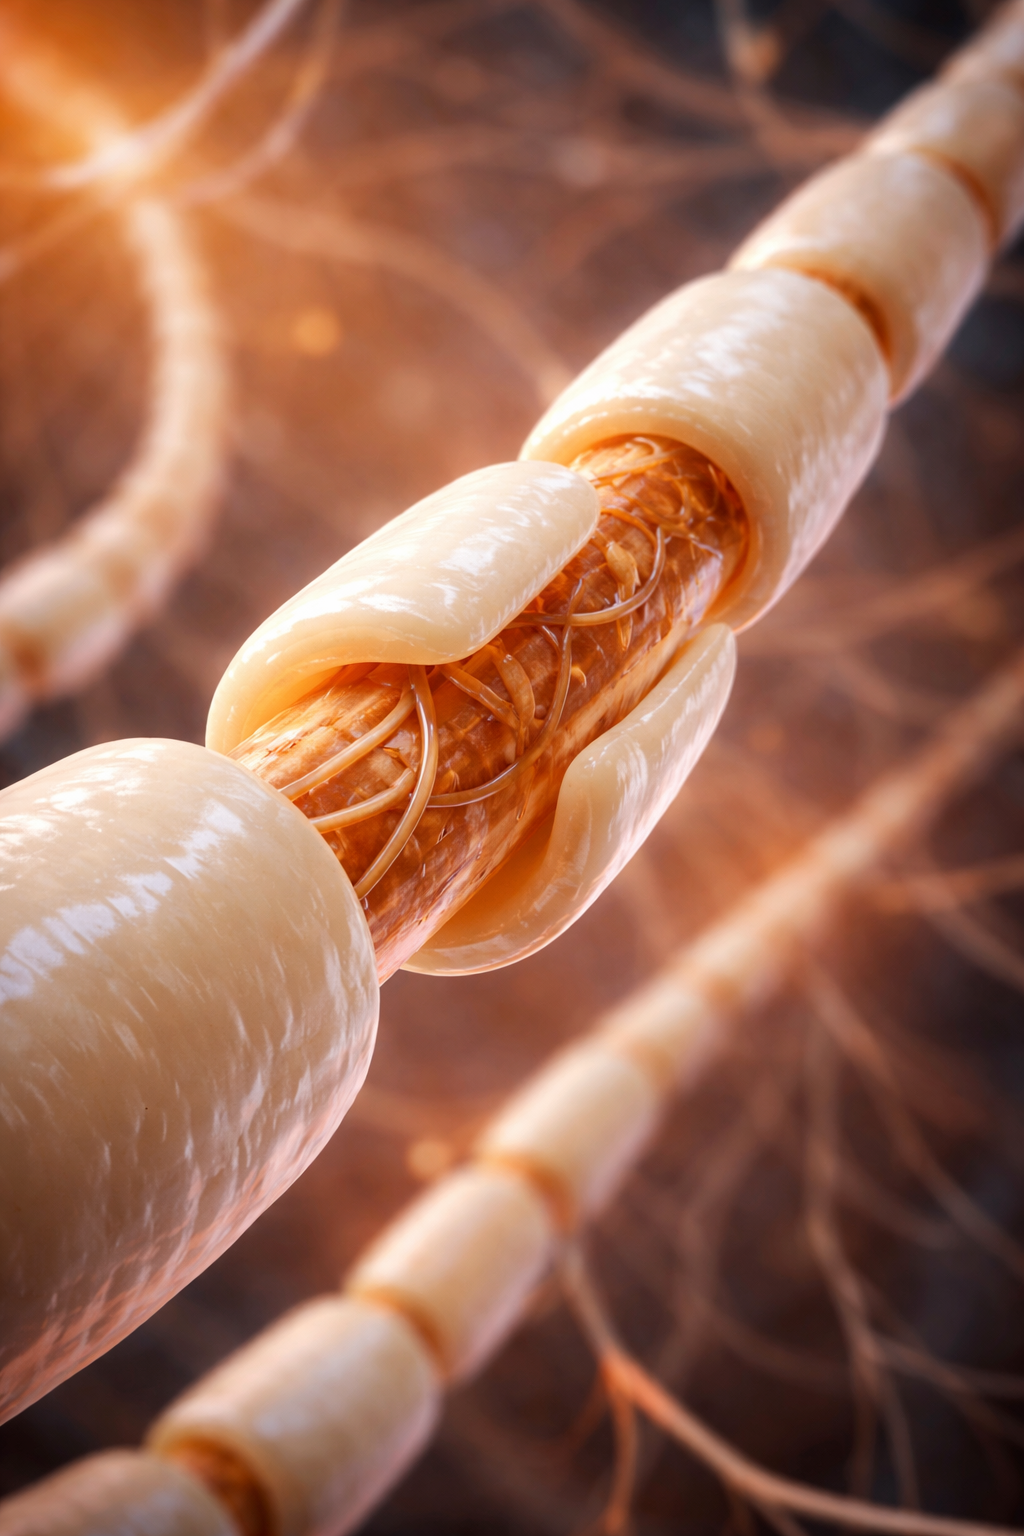
The axon is a long, thin fiber that conveys messages to other neurons, muscles, and glands via electrical signals called action potentials. Some axons are wrapped in a fatty insulation called myelin, produced by glial cells (oligodendrocytes in the CNS and Schwann cells in the peripheral nervous system). Myelin dramatically speeds signal transmission by forcing action potentials to jump between gaps in the myelin sheath called nodes of Ranvier.
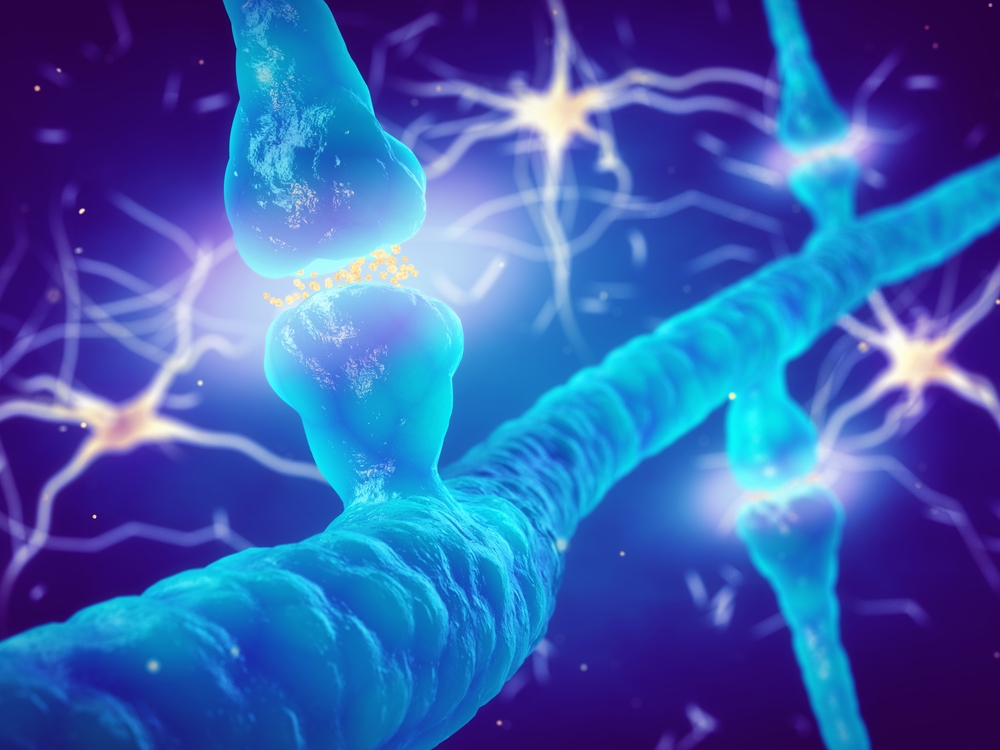
Terminal buttons are the buds located on the ends of axon branches that form synapses and release neurochemicals to other neurons.

🎧 Listen to a mini-lecture on Anatomy of a Neuron
Consider Nathaniel, a 42-year-old accountant who came to your office after a mild traumatic brain injury from a car accident. His post-concussion symptoms included difficulty concentrating, fatigue, and word-finding problems. Understanding that his symptoms likely reflect disrupted communication among his 100 billion neurons, rather than massive cell death, helps explain why neurofeedback training might help restore normal network function.
Generating the Signals: EPSPs and IPSPs
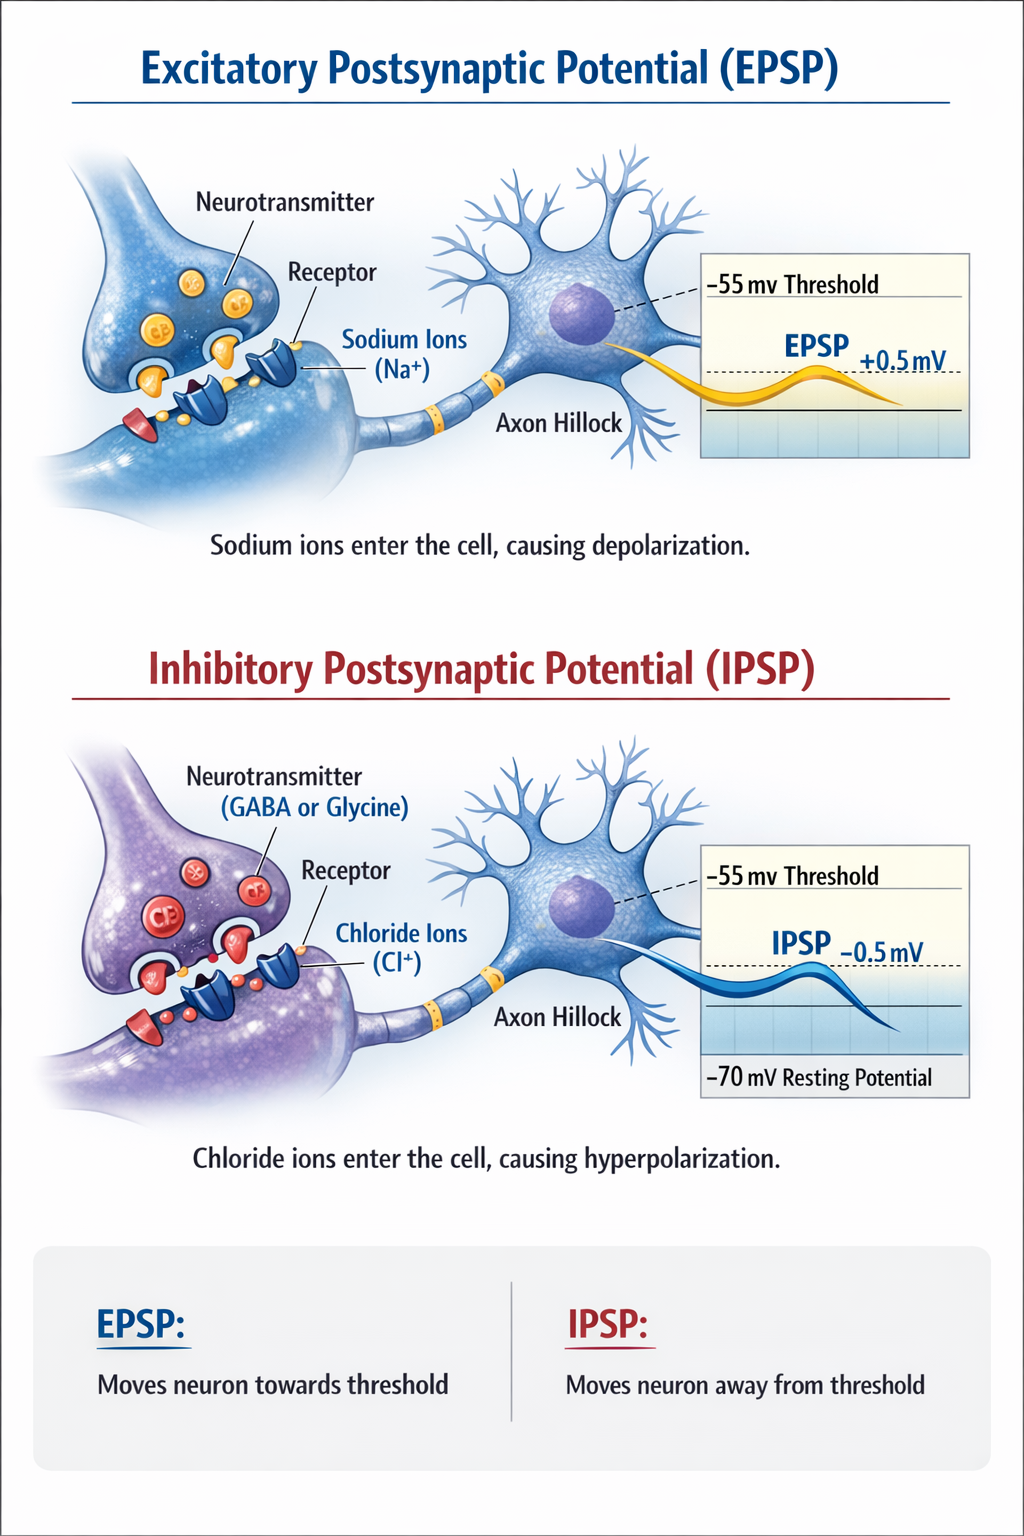
Neurons communicate through tiny voltage changes called postsynaptic potentials. When a neurotransmitter binds to a receptor and causes positive sodium ions to enter the cell, it produces an excitatory postsynaptic potential (EPSP). Each EPSP depolarizes the axon hillock by about 0.5 mV, pushing the neuron towards its threshold of excitation.
An inhibitory postsynaptic potential (IPSP) is a hyperpolarization that makes the membrane potential more negative and pushes the neuron away from its excitation threshold. At most inhibitory synapses, IPSPs are produced when neurotransmitters like GABA or glycine bind to receptors and cause negative chloride ions to enter the cell.
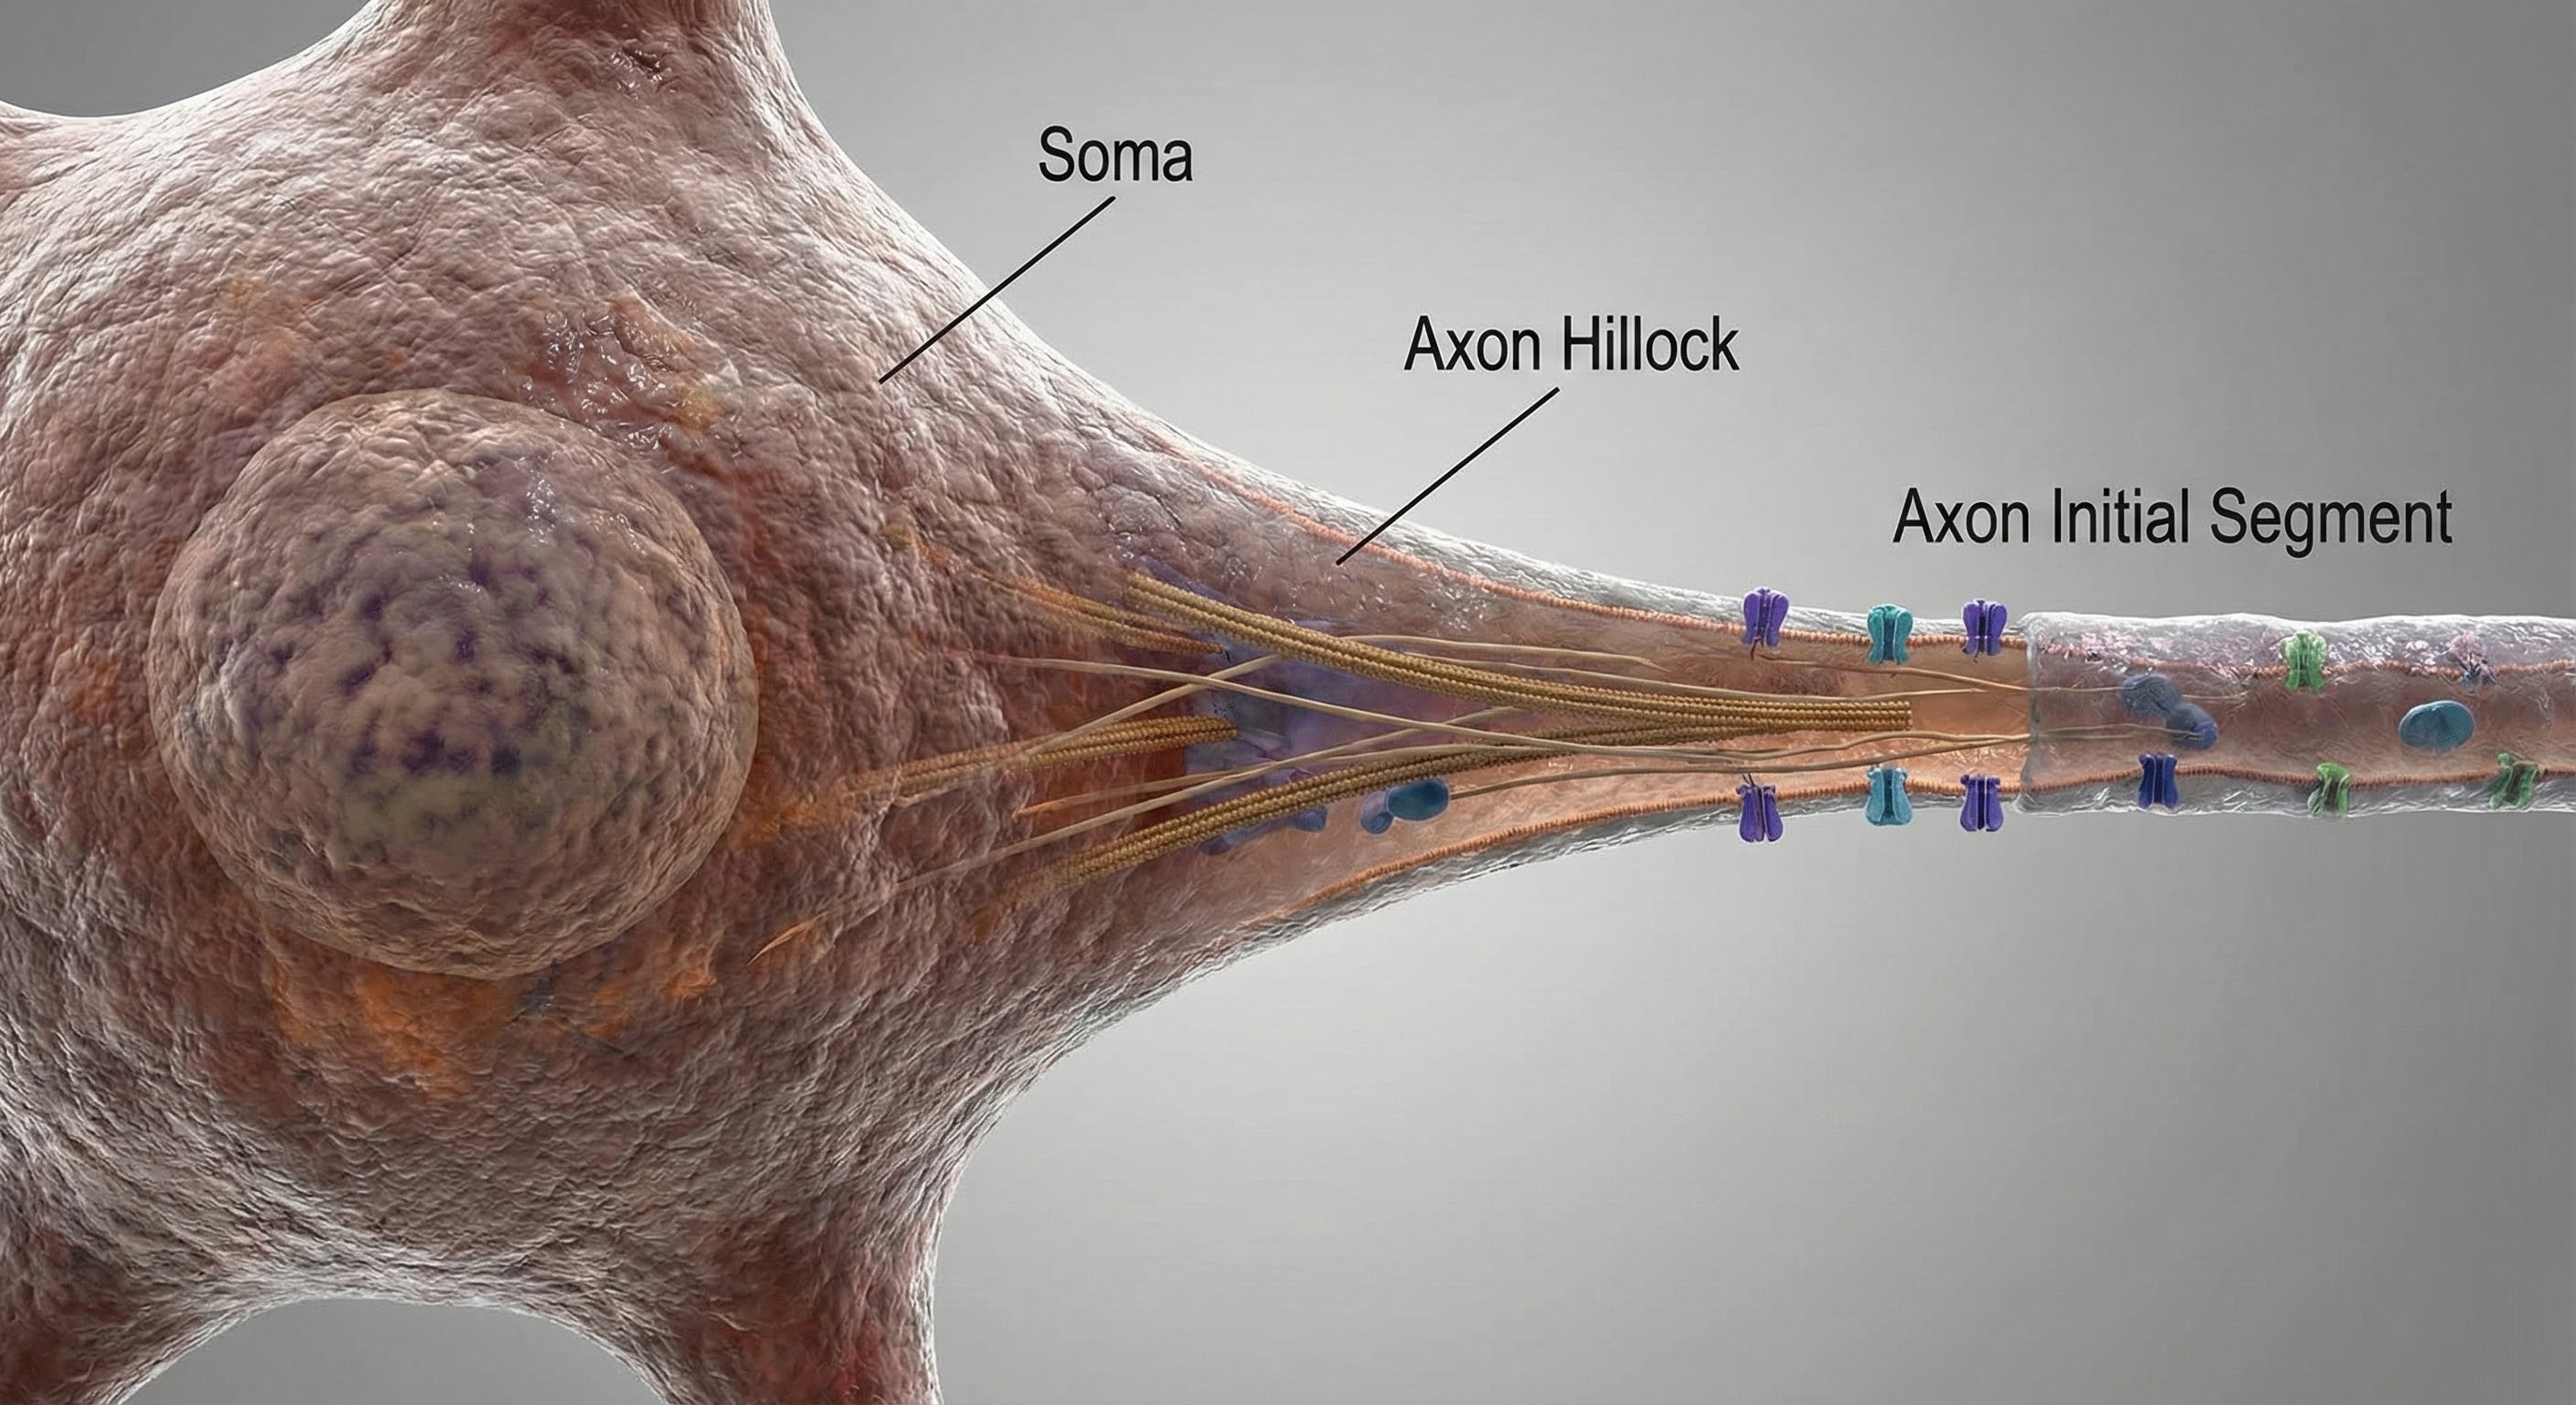
Integration at the Axon Hillock: The Decision Point
Integration is the summation of EPSPs and IPSPs at the unmyelinated axon hillock. This is where the neuron "decides" whether to fire.
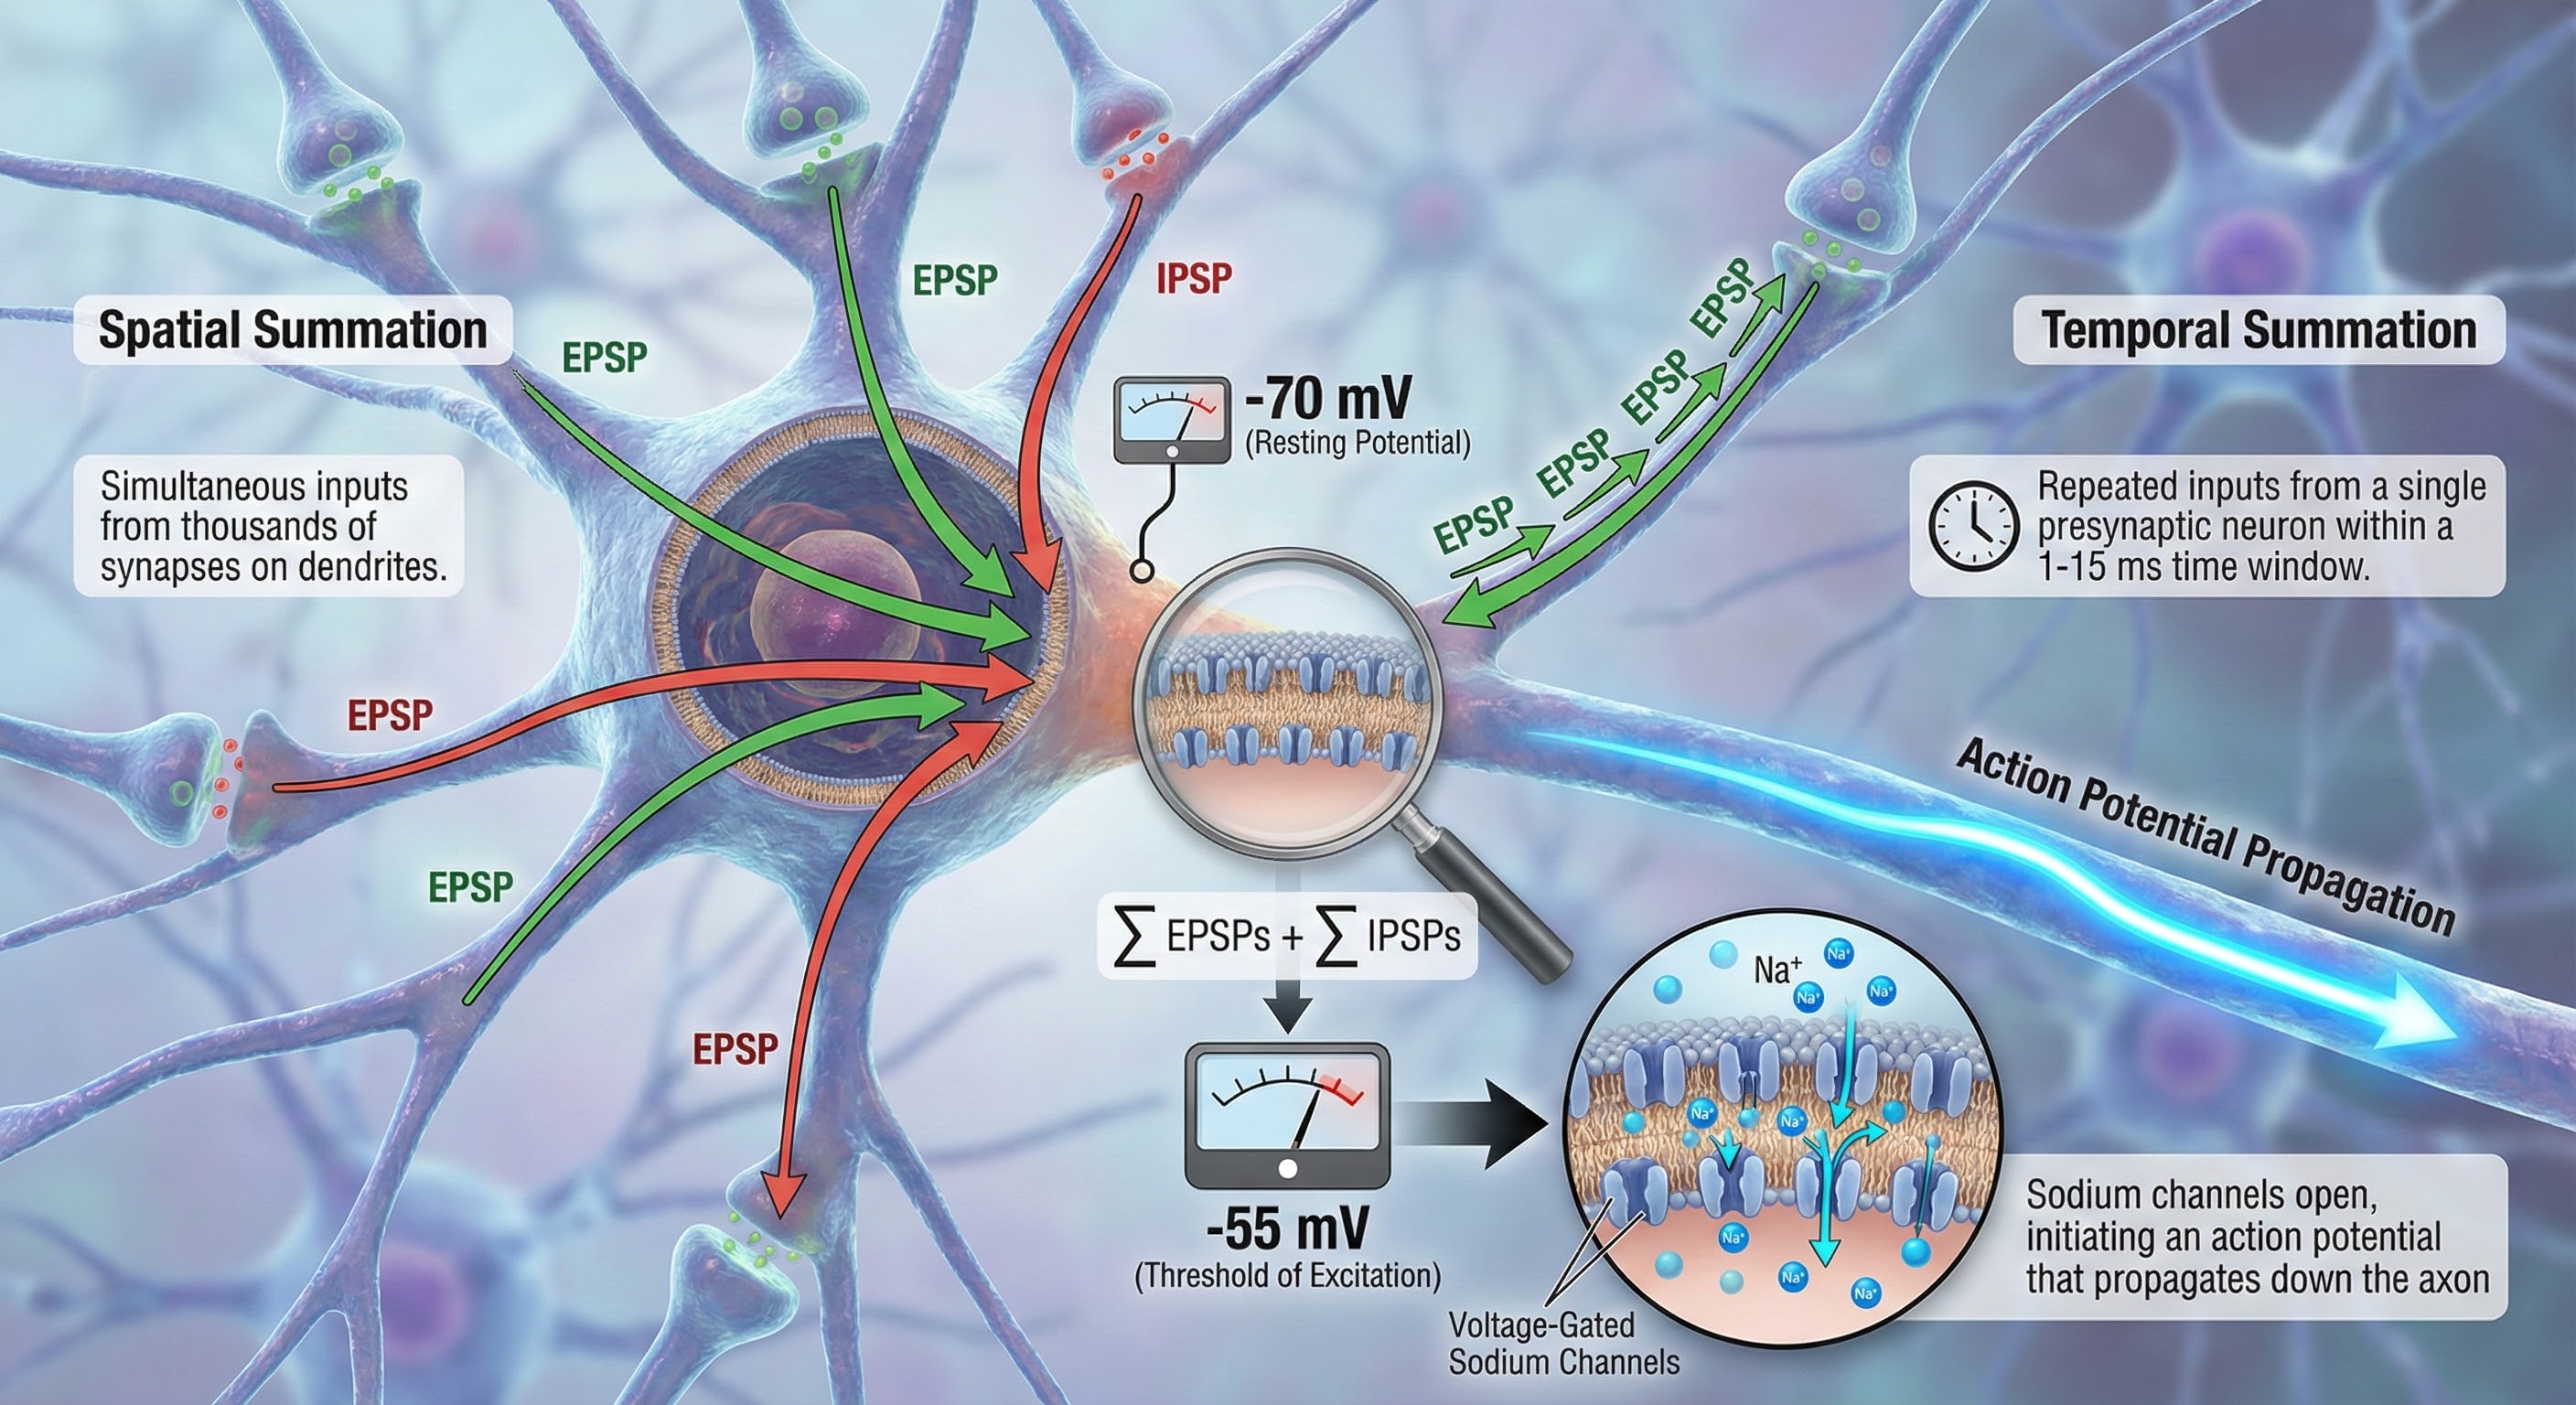
The axon hillock uses two methods to sum EPSPs and IPSPs: spatial and temporal summation. In spatial summation, the axon hillock adds postsynaptic potentials (PSPs) from thousands of synapses on dendrites. In temporal summation, the axon hillock combines PSPs from presynaptic neurons that repeatedly fire within a 1-15-ms time window.
Suppose the summated EPSPs and IPSPs move the axon hillock from a resting potential of -70 mV to a threshold of excitation of -55 mV. In that case, sodium channels in the axon hillock membrane open, and an action potential propagates down the axon.
🎧 Listen to a mini-lecture on Action Potentials
Neurons are the fundamental information-processing units of the nervous system, with sensory neurons bringing information in, motor neurons sending commands out, and interneurons making the complex connections that enable cognition. Each neuron integrates thousands of excitatory and inhibitory inputs at its axon hillock to determine whether to fire an action potential.
Check Your Understanding
- What is the difference between afferent and efferent neurons, and why are these terms useful for understanding information flow in the nervous system?
- Explain how spatial and temporal summation work together at the axon hillock to determine whether a neuron fires.
- How does neuroplasticity make neurofeedback training possible?
What Is the EEG?
The scalp EEG is the voltage difference between two recording sites recorded over time. Unlike a simple voltmeter that gives you a single number, the EEG continuously tracks how voltage changes from moment to moment, creating the familiar wavy lines that neurofeedback practitioners analyze.
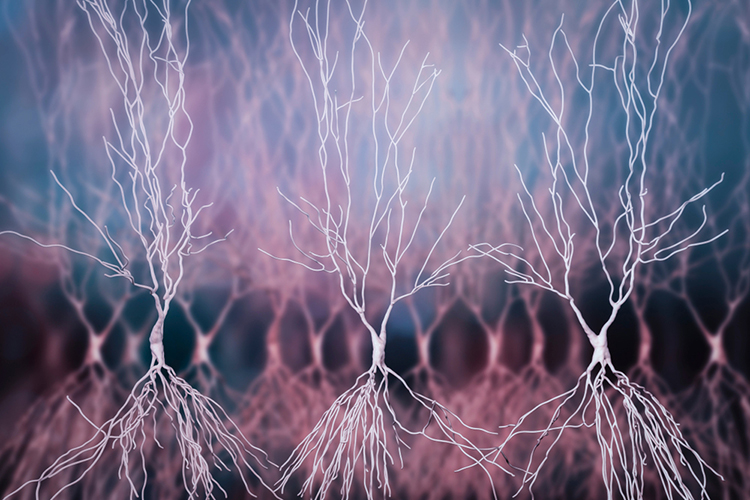
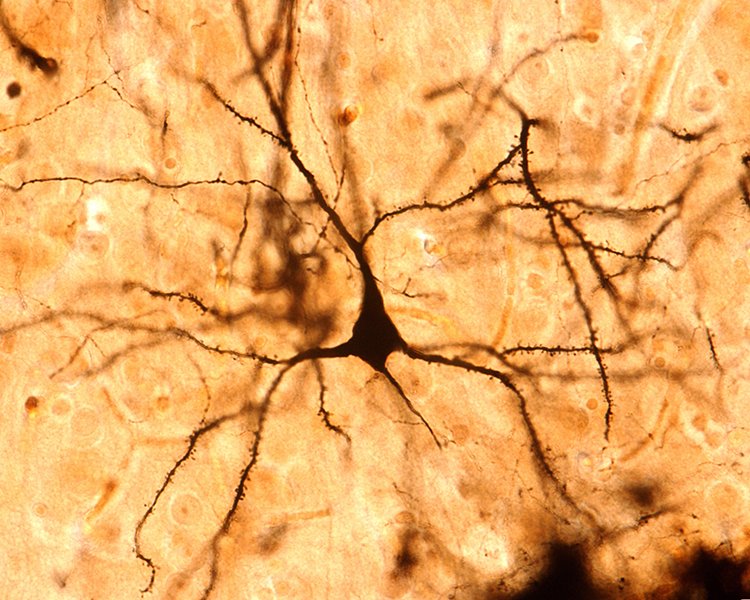
The EEG is primarily generated by large pyramidal neurons located in layers 3 and 5 of the 2-4.5-mm-thick cortical gray matter. Excitatory postsynaptic potentials (EPSPs) and inhibitory postsynaptic potentials (IPSPs) in apical dendrites create extracellular electrical dipoles that project to scalp electrodes. Action potentials, which typically project away from the scalp, do not contribute significantly to the EEG signal.

The image below shows a pyramidal neuron revealed using Golgi silver chrome staining method. Note that the apical dendrite arises from the cell body. Basilar dendrites feature an extensive network of spines.
Local activity is a composite of local and network influences. Network communication systems and local cortical functions show different characteristics across the cortex and produce unique and specific EEG patterns in other regions.
The Two Fundamental Properties of EEG: Amplitude and Frequency
Every EEG signal possesses two fundamental properties that clinicians and researchers must understand: amplitude and frequency.
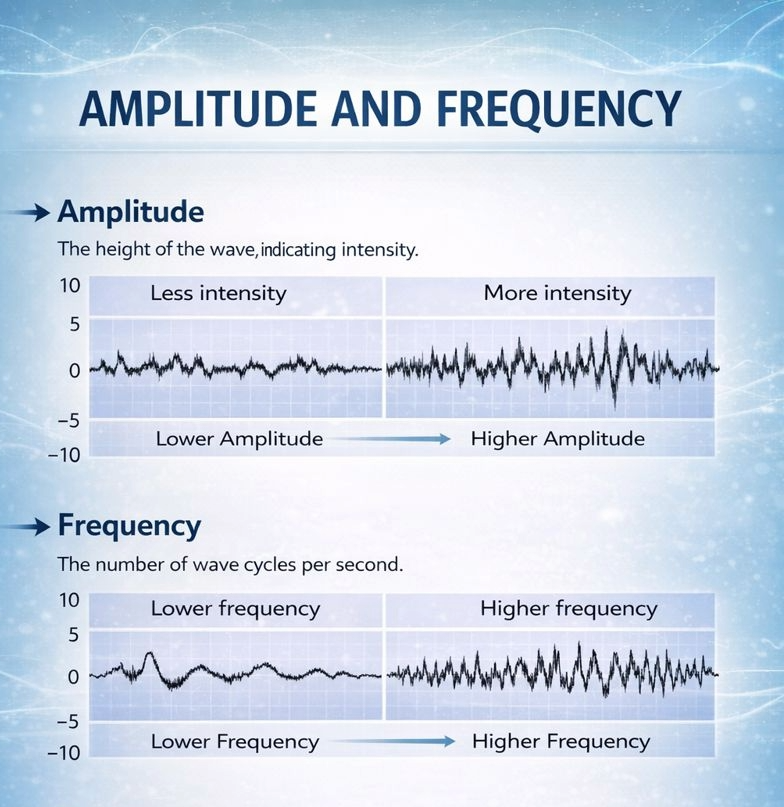
Amplitude refers to the voltage or "height" of the EEG waveform, measured in microvolts (μV), and reflects how many neurons are firing synchronously and how strongly they are activated. Amplitude can also be expressed as power in picowatts (pW), which represents the energy carried by the signal and is particularly useful in quantitative EEG analysis where power spectral density calculations are performed. Amplitude is analyzed in the so-called time domain, which refers to the up and down changes in amplitude that occur over time.
Not surprisingly, the analysis of EEG frequency is said to be done in the so-called frequency domain. Frequency refers to how many complete wave cycles occur per second, measured in Hertz (Hz), and indicates the speed of the underlying neural oscillations. These two properties are independent of each other, meaning a signal can be high in amplitude but slow in frequency, or low in amplitude but fast in frequency, in any combination. Together, amplitude and frequency form the basic language through which we read the brain's electrical activity.
Amplitude deserves particular clinical attention because abnormal values can signal underlying pathology. The adult EEG typically shows amplitudes ranging from approximately 10 to 100 μV depending on the recording site, the individual's state of arousal, and the frequency band being measured. Posterior alpha rhythms in relaxed adults commonly reach 40 to 50 μV, while beta activity over frontal regions may measure only 10 to 20 μV. When amplitude falls significantly below age-appropriate norms, clinicians should consider possible causes including cortical atrophy, subdural fluid collections, skull defects affecting signal conduction, or medication effects. An abrupt drop in amplitude during a recording session may indicate a sudden change in cerebral perfusion, elevation of the head, an artifact of non-cerebral origin, or the onset of a pathological process requiring immediate medical evaluation.
Developmental changes in amplitude follow predictable patterns that inform clinical interpretation. Infants and young children typically show higher amplitude EEG activity in the slow frequencies than adults because their skulls are thinner and offer less resistance to electrical signals, and because their brains have not yet developed the more differentiated, desynchronized patterns characteristic of mature cortical function. As children mature into adolescence and adulthood, overall amplitude tends to decrease and show the greatest amplitude in the middle alpha frequency band, while the complexity and regional differentiation of EEG patterns increases. Older adults may show further amplitude reductions, particularly in posterior alpha activity, reflecting normal age-related changes in cortical function. Clinicians must therefore always interpret amplitude values against age-appropriate normative standards rather than applying a single criterion across the lifespan.
Frequency, the second fundamental property of the EEG, describes the rate at which neural oscillations cycle, measured in Hertz (Hz) where one Hertz equals one complete cycle per second. The scalp EEG captures frequencies ranging from near-DC slow cortical potentials below 0.1 Hz to gamma oscillations exceeding 100 Hz, though clinical and neurofeedback applications typically focus on the range from approximately 0.5 to 50 Hz. This frequency spectrum has been divided into named bands that correspond roughly to different functional states: delta (0.5 to 4 Hz), theta (4 to 8 Hz), alpha (8 to 12 Hz), beta (12 to 30 Hz), and gamma (above 30 Hz). These boundaries represent conventions rather than sharp biological divisions, and different authorities may define the bands slightly differently, but the general framework provides an essential vocabulary for describing and analyzing brain activity.
The clinical significance of frequency extends far beyond simple categorization. The dominant frequency in a given brain region reflects the underlying state of neural networks and can shift dramatically with changes in arousal, attention, cognitive demand, or pathology. A healthy adult sitting quietly with eyes closed will typically show a dominant frequency in the alpha range over posterior regions, but opening the eyes or performing mental arithmetic will cause this rhythm to attenuate and give way to faster beta activity. Sleep produces the opposite shift, with progressively slower frequencies dominating as the individual moves from drowsiness through light sleep into the deep slow-wave stages characterized by high-amplitude delta. These frequency shifts reflect fundamental changes in how neural networks are organized and communicating.
Abnormalities in frequency patterns carry important diagnostic information. Generalized slowing of the EEG, where frequencies shift toward the delta and theta range across all brain regions, may indicate metabolic encephalopathy, medication effects, or diffuse cerebral dysfunction. Focal slowing confined to one brain region suggests localized pathology such as a tumor, stroke, or area of cortical injury. Conversely, excessive fast activity may reflect anxiety, medication effects (particularly from benzodiazepines or barbiturates), or hyperarousal states. The relationship between frequency and brain state also has therapeutic implications: neurofeedback training often targets specific frequency bands to help clients shift their brain activity toward patterns associated with improved attention, reduced anxiety, or better sleep. Understanding frequency is therefore not merely an academic exercise but a practical clinical skill essential for both assessment and intervention.
Source of the Scalp EEG: Pyramidal Cells in Cortical Columns
The scalp EEG results from the summation of large areas of gray matter activity. Gray matter refers to cortical tissue in which neuron cell bodies and their dendrites are located. Areas are polarized synchronously due to the input of oscillatory or transient evoked activity. These areas comprise thousands of cortical columns, consisting of large pyramidal cells aligned perpendicularly to the cortical surface.
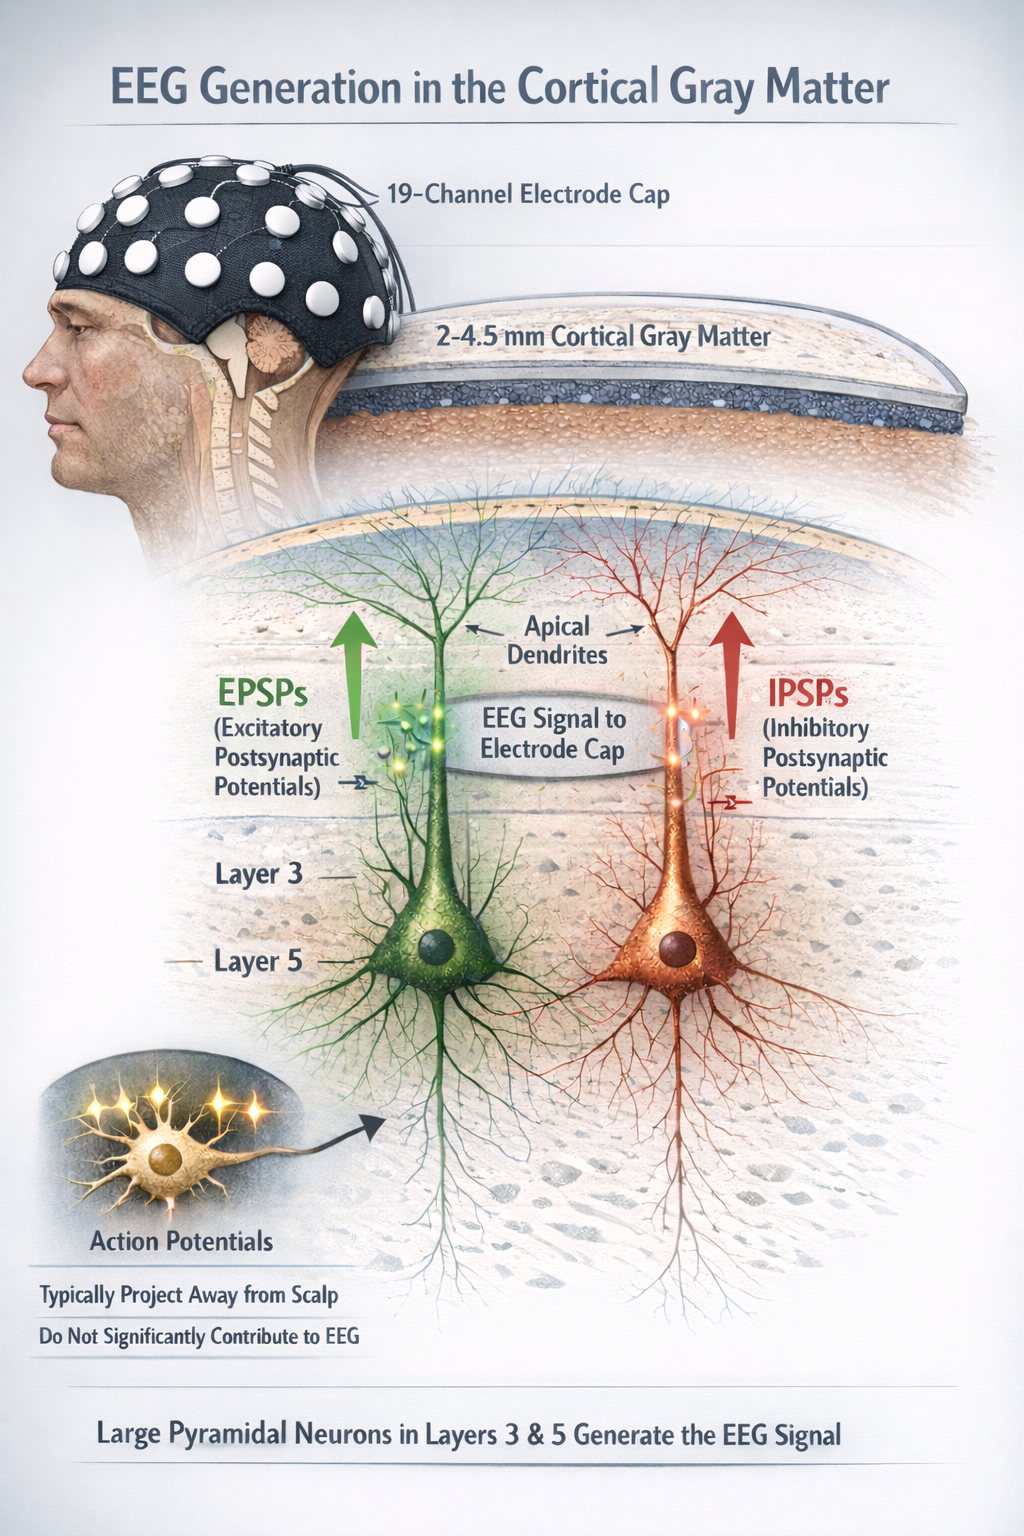
The synchronous activity of large pyramidal neurons networked in cortical columns creates the EEG.
The Architecture of Brain Rhythms: A Story of Distance and Speed
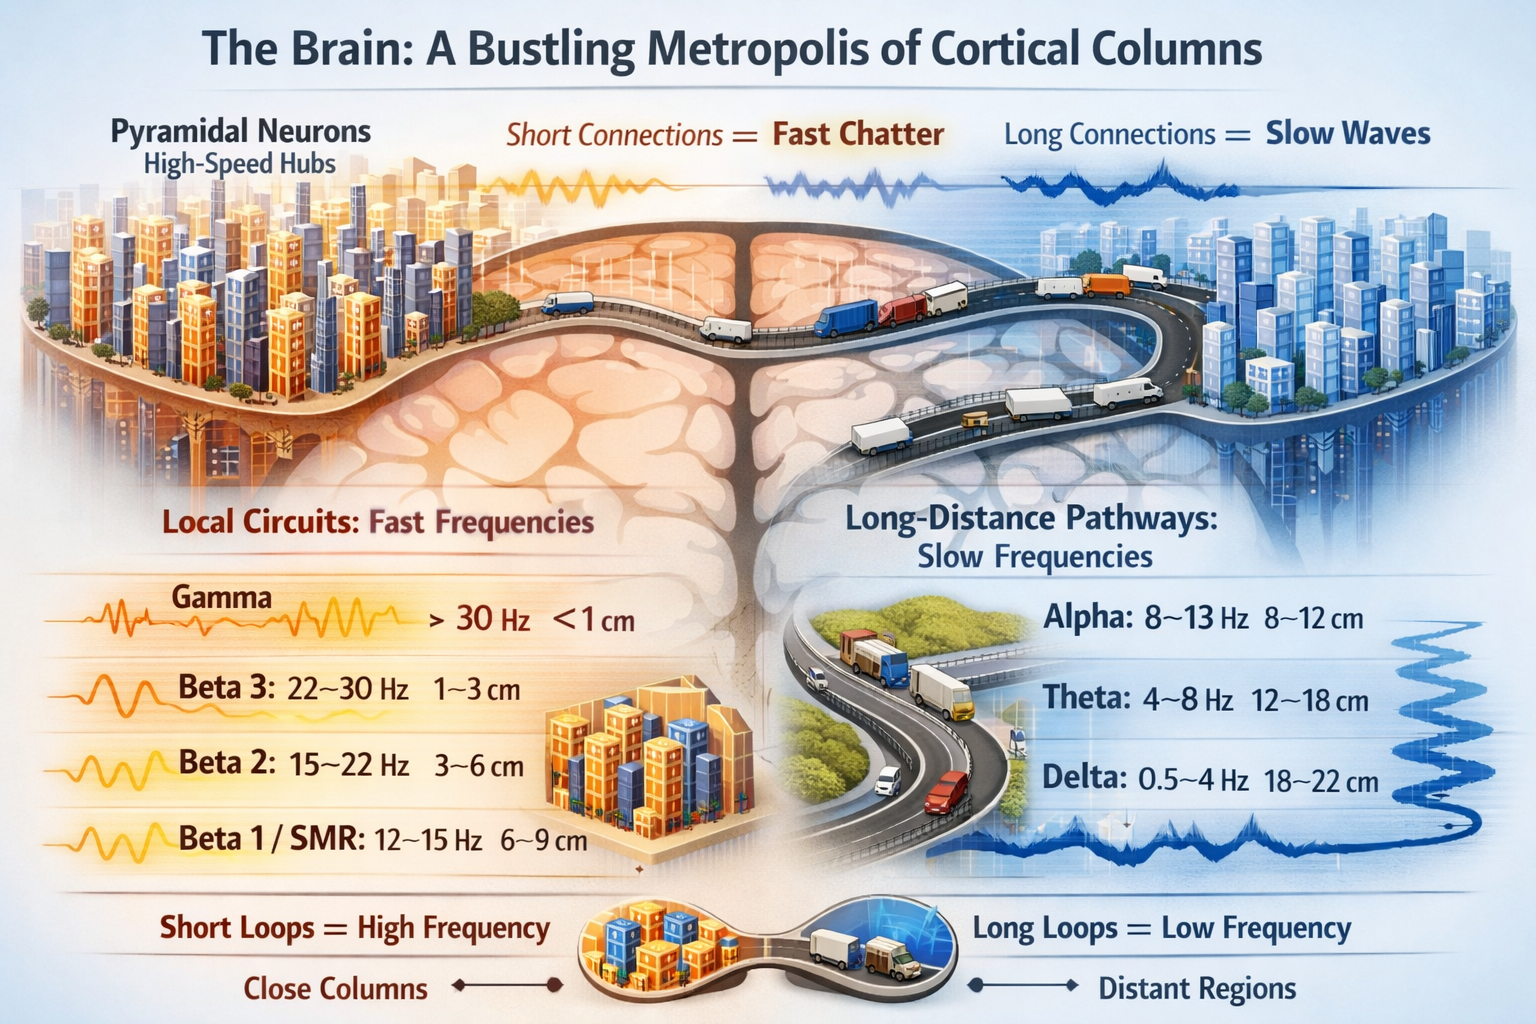
The human cortex operates like a vast communications network, where pyramidal neurons function as the primary relay stations. These neurons do not work in isolation. Instead, they organize themselves into vertical arrangements called cortical columns, each column containing thousands of cells that fire in coordinated patterns. Understanding how these columns communicate with one another reveals one of the brain's most elegant design principles: the relationship between distance and frequency.
Why Distance Determines Frequency
The brain's electrical rhythms emerge from a surprisingly simple constraint. When neurons in one cortical column send signals to neurons in another column, those signals must travel down axons, reach their destination, and return. The time required for this round trip determines how quickly the cycle can repeat. Short connections allow rapid cycling, producing high-frequency oscillations. Long connections require more travel time, generating slower rhythms.
This principle forms the foundation of the two-compartmental model of EEG coherence, which demonstrates that the physical length of the axonal loop inversely determines the frequency it can support (Nunez, 1995; Thatcher et al., 1986). A signal traveling a short distance can complete many cycles per second, while a signal crossing the entire brain completes far fewer cycles in the same time period. The brain essentially operates as a frequency hierarchy, with different rhythms reflecting different spatial scales of communication.
The Slow Waves: Continental Communication
The slowest brain rhythms connect the most distant regions, functioning like transcontinental telephone lines that link far-flung territories.
Delta waves (0.5 to 4 Hz) represent the longest communication loops in the brain, spanning distances of 18 to 22 centimeters. These waves effectively connect the entire anterior and posterior cortex, linking frontal regions to occipital areas in a global loop (Thatcher et al., 2008). When delta activity dominates, the brain coordinates activity across its full extent, a pattern most prominent during deep sleep when widespread neural synchronization supports memory consolidation and restoration.
Theta waves (4 to 8 Hz) operate on somewhat shorter loops, typically 12 to 18 centimeters. These rhythms often center on limbic structures, particularly the hippocampus and its connections to the cortex. Theta oscillations prove essential for memory integration, creating the temporal framework within which new information becomes bound to existing knowledge. When you struggle to recall where you left your keys, the theta rhythm helps orchestrate the search through distributed memory stores.
Alpha waves (8 to 12 Hz) resonate over distances of approximately 8 to 12 centimeters, reflecting the specific thalamocortical loops that coordinate sensory readiness (Klimesch, 2013). The thalamus, sitting deep in the brain's center, maintains reciprocal connections with cortical regions, and alpha rhythms emerge from the cycling of signals through these loops.
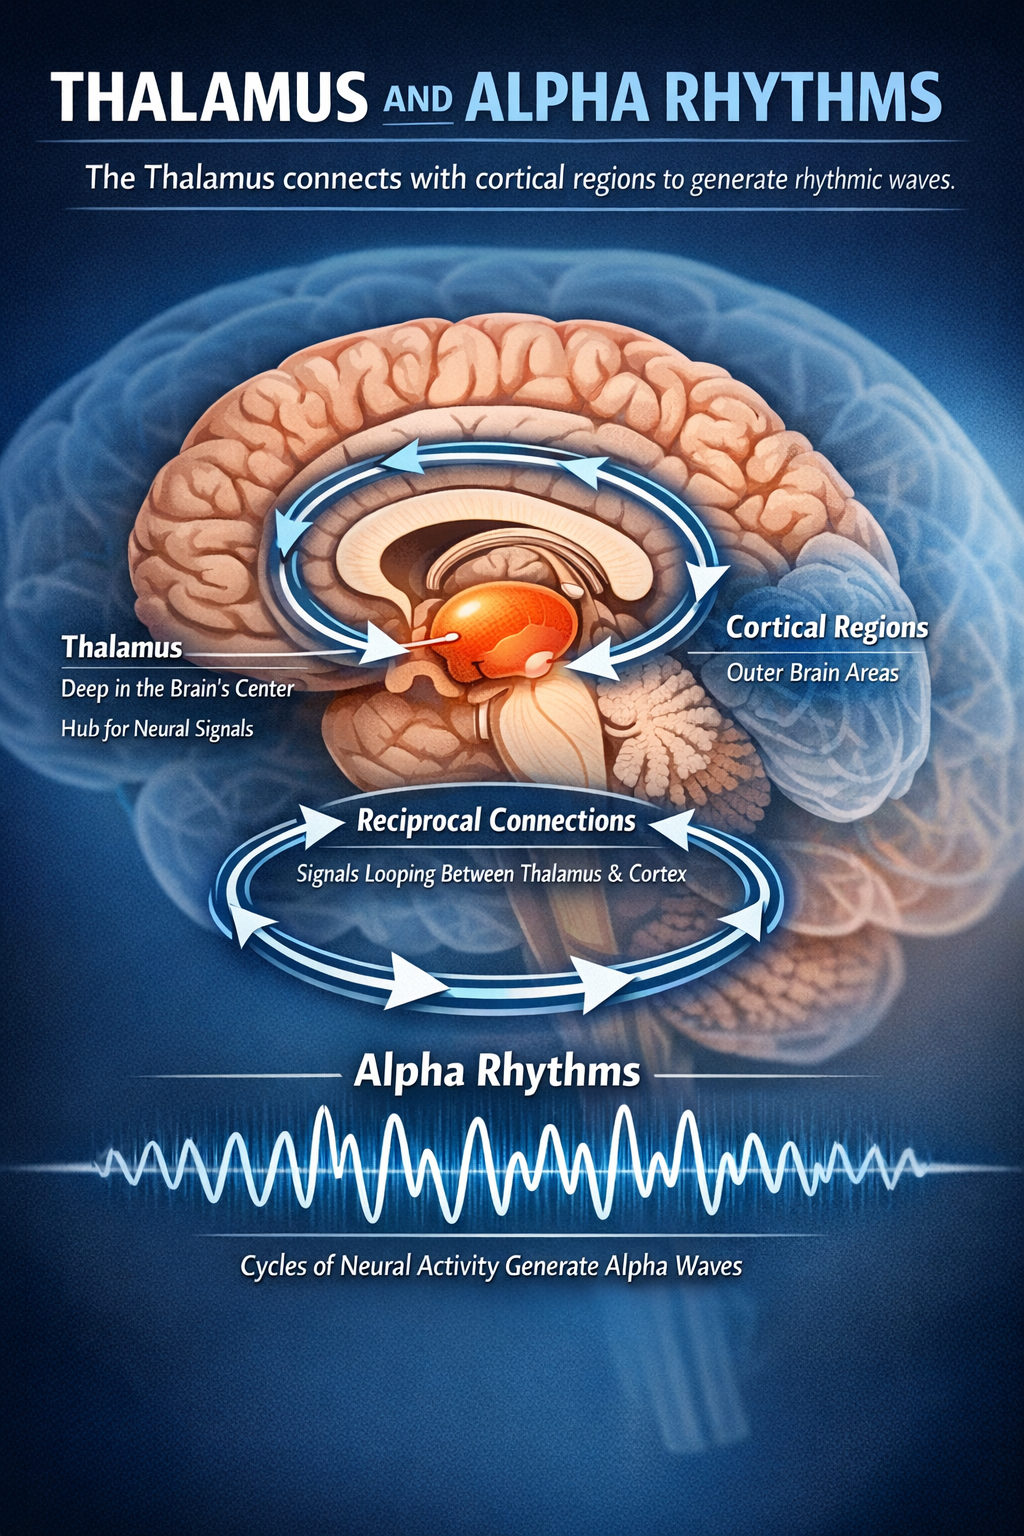
Alpha represents something like the brain's neutral idling state, present when you are awake but not actively processing demanding information. Close your eyes in a quiet room, and alpha amplitude typically increases over your occipital cortex, reflecting reduced visual processing demands.
The Fast Waves: Neighborhood Networks
As communication distances shorten, frequencies accelerate. The brain's faster rhythms reflect increasingly local processing, analogous to conversations between neighbors rather than long-distance phone calls.
The sensorimotor rhythm (SMR), oscillating between 12 and 15 Hz, represents a specialized loop within the motor cortex. These oscillations travel moderate distances of 6 to 9 centimeters and appear most prominently when motor regions remain in a state of relaxed readiness. The SMR increases when you inhibit movement, reflecting the motor cortex maintaining preparedness without executing action.
Beta waves encompass a range of frequencies that slice the cortex into progressively tighter functional circles. Beta 1 (12 to 15 Hz) connects regions approximately 6 centimeters apart, while Beta 2 (15 to 23 Hz) tightens the loop to 3 to 6 centimeters. Beta 3 (23 to 30 Hz) represents highly localized processing with loop distances of only 1 to 3 centimeters (Nunez & Silberstein, 2000). These increasingly fast rhythms support focused attention and active cognitive processing, with higher beta frequencies reflecting more concentrated, localized neural computation.
Gamma: The Binding Frequency
Gamma waves (frequencies above 30 Hz) represent the fastest oscillations the brain produces, flashing between cortical columns separated by mere millimeters, less than one centimeter apart. These rapid local oscillations serve a critical function: binding detailed sensory features into coherent perceptual wholes (Buzsáki, 2006).
Consider what happens when you see a red apple. Different cortical regions process the apple's color, shape, texture, and location. Gamma oscillations synchronize neural firing across these nearby columns, binding these separate features into your unified perception of a single object. Without this rapid local coordination, sensory experience might fragment into disconnected attributes rather than cohering into recognizable objects and scenes.
The gamma band thus solves what neuroscientists call the binding problem: how does the brain combine distributed processing into unified conscious experience? The answer lies partly in these hyper-local, high-frequency oscillations that synchronize neighboring neural populations with millisecond precision.
The Frequency Hierarchy in Perspective
The brain's frequency architecture reveals a fundamental organizing principle. Global coordination requires slow rhythms because signals must travel far. Local processing generates fast rhythms because signals cycle rapidly over short distances. Between these extremes, intermediate frequencies support intermediate spatial scales of communication.
This organization means that different brain states emphasize different frequency bands. Deep sleep amplifies delta, reflecting widespread slow coordination. Relaxed wakefulness features prominent alpha, idling in thalamocortical loops. Active problem solving increases beta power as localized regions engage intensively. Perceptual binding recruits gamma to synchronize neighboring columns.
Understanding this distance-frequency relationship transforms how we interpret EEG recordings. When we observe increased theta over frontal regions, we recognize that longer-range circuits involving limbic structures have become more active. When we see enhanced gamma at posterior sensors, we understand that local binding operations in visual cortex have intensified. The frequencies themselves encode information about the spatial scale of the brain's ongoing computations.
The Orchestra in Your Head
Understanding the Brain's Electrical Rhythms
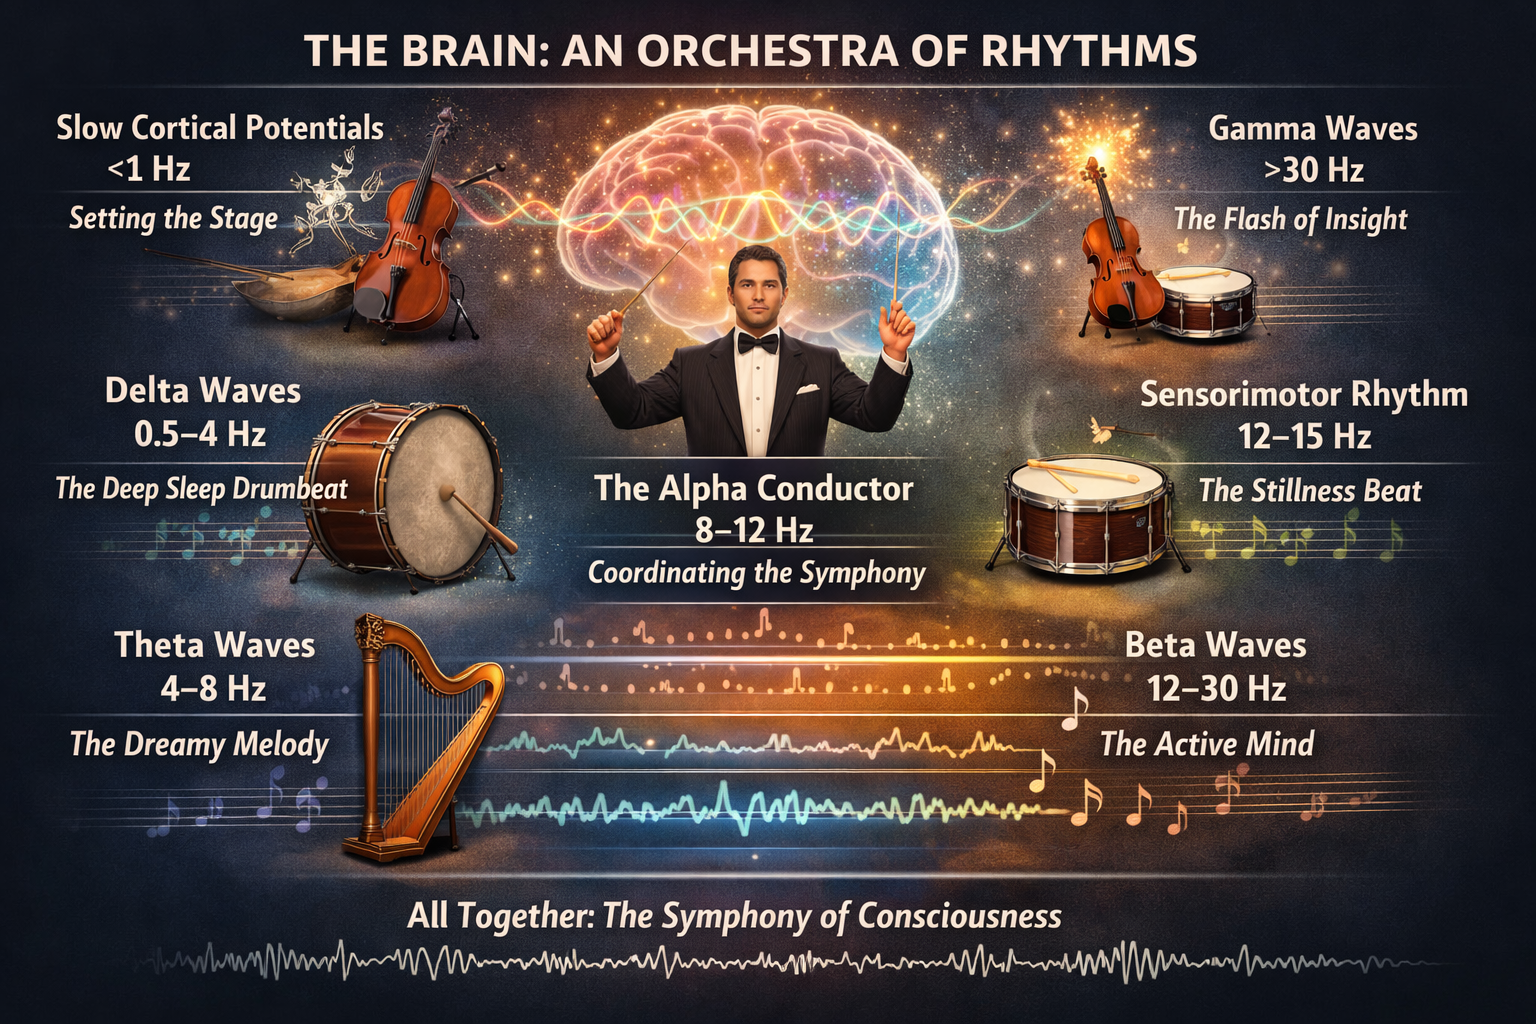
We often think of the brain as a single, buzzing machine, but it behaves more like an orchestra playing multiple scores at once. Different sections produce different frequencies, and together they create the symphony of consciousness. Yet every orchestra needs a conductor, and emerging research suggests that the alpha rhythm, also called the posterior dominant rhythm, may play exactly this coordinating role. Evidence indicates that spontaneous modulations of the alpha rhythm function like a central pacemaker, coordinating rhythmical activity in widely distributed cortical areas through synchronization (Ben-Simon et al., 2008). Large-scale communication between brain regions appears to be rhythmically modulated by alpha oscillations, which provide the temporal windows necessary for coordinating activity across large patches of cortex (Chapeton et al., 2019). Understanding these rhythms is like learning to read the sheet music of the mind itself.
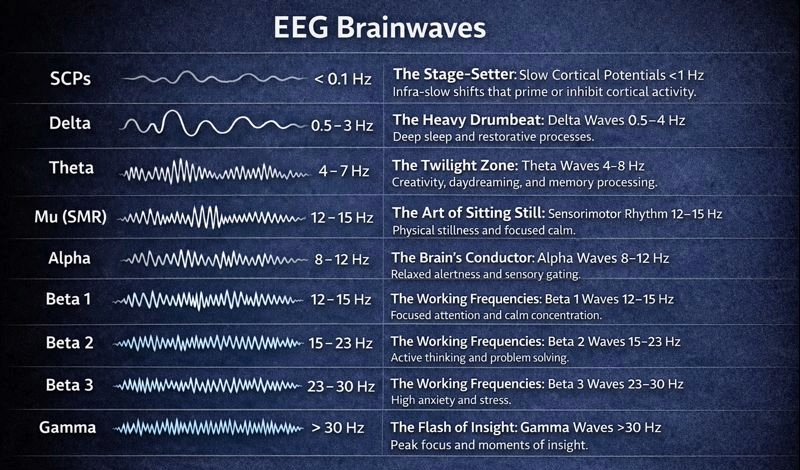
The Stage-Setter: Slow Cortical Potentials <1 Hz
The deepest, slowest rhythm in your brain is not really a rhythm at all. Slow Cortical Potentials (SCPs) are infra-slow voltage shifts that do not oscillate like typical waves but instead drift gradually over seconds or even minutes, like a tide rather than a wave. Picture them as setting the stage before the music begins.
These potentials originate from the depolarization of apical dendrites in large populations of cortical pyramidal neurons, but here is where it gets interesting: glial cells called astrocytes also play a starring role, regulating the chemical environment around neurons (Birbaumer et al., 1990). For decades, scientists thought glia were just the brain's packing material. Now we know they are active participants in regulating cortical excitability.
Functionally, SCPs act like a volume knob for your cortex. A negative shift lowers the threshold for neuronal firing, essentially priming your brain to respond. Think of it as an athlete tightening their muscles in the starting blocks, ready to explode into action. A positive shift does the opposite, raising that threshold and putting the brakes on neural activity. This relates directly to behavioral states: negative shifts mark the mobilization of resources, while positive shifts correlate with behavioral inhibition or strategic resource allocation (Elbert, 1993).
The Heavy Drumbeat: Delta Waves 0.5–4 Hz
Delta is the heavy, rolling drumbeat of the brain. If you are a healthy adult reading this while awake, you should not be producing much delta at all. These slow, powerful rhythms belong primarily to the deepest stages of sleep, specifically Stage 3 and Stage 4, where your brain enters its most restorative mode.
Anatomically, delta emerges from a carefully choreographed dance between the thalamus and cortex, specifically involving the hyperpolarization of thalamocortical cells. The thalamus, which normally acts as the brain's relay station for sensory information, essentially goes quiet, allowing the cortex to generate these massive, synchronized waves (Amzica & Steriade, 1998).
Here is why delta matters even though you are not conscious to appreciate it. During deep sleep, your brain activates the glymphatic system, flushing out metabolic waste products that accumulated during the day, including the amyloid proteins implicated in Alzheimer's disease. Delta is also critical for consolidating declarative memory, the stuff you need to remember for exams (Diekelmann & Born, 2010). When delta shows up during wakefulness, however, it usually signals trouble. Cortical deafferentation, where the cortex becomes "disconnected" from sensory input, produces waking delta. This happens in pathological conditions like white matter lesions or traumatic brain injury. If your professor notices excessive delta in your waking EEG, that is a red flag, not a sign of deep relaxation.
The Twilight Zone: Theta Waves 4–8 Hz
Theta is the rhythm of the subconscious, the gatekeeper of memory, and the frequency of that delicious drowsy state when you are just about to fall asleep in a boring lecture (no judgment). This oscillation relies heavily on loops connecting the cortex to the hippocampus and limbic system, the brain's emotional and memory centers (Klimesch, 1999).
You have definitely experienced theta. It is the twilight state where reality starts to blur, when you are zoning out, daydreaming, or drifting off during a long drive. Your eyes might still be open, but your attention has turned inward. In this sense, theta represents a kind of mental wandering.
But do not dismiss theta as the brain on vacation. It is functionally critical for synaptic plasticity and memory encoding. When you are deeply navigating a complex emotional idea or struggling to retrieve a difficult memory, your brain enters a theta state to facilitate communication between distant regions that normally do not talk much (Hasselmo, 2005). This is why theta is considered a hallmark of creativity and emotional processing. The same frequency that makes you zone out in class also allows you to connect seemingly unrelated ideas into novel solutions. Some of your best insights probably emerged from theta states, whether you realized it or not.
The Brain's Conductor: Alpha Waves 8–12 Hz
Alpha is arguably the most famous brain rhythm, and for good reason. Clinically known as the posterior dominant rhythm, it represents the main oscillatory activity expressed by the waking brain at rest (Niedermeyer, 1997). But alpha does far more than simply mark relaxation. Emerging evidence suggests that alpha oscillations function as a central coordinator, modulating large-scale communication throughout the brain.
The coordinating role of alpha becomes clear when we examine cross-frequency coupling, the phenomenon where slower oscillations modulate faster ones. Research has demonstrated that low-frequency oscillations like alpha may coordinate long-range communication between different brain regions, while higher-frequency gamma activity remains more spatially restricted to local circuits (Voytek et al., 2010). The phase of ongoing alpha oscillations is coupled to high gamma amplitude, suggesting that alpha rhythmically modulates local cortical activity (Voytek et al., 2010). This coupling acts as a selection mechanism, allowing the brain to route information flexibly between regions depending on task demands.
Anatomically, alpha is dominant in the posterior cortex, particularly in the occipital and parietal lobes where visual and spatial processing occur. The rhythm is generated by reverberating thalamocortical loops, feedback circuits between the thalamus and cortex that create a stable oscillation when the brain is not actively processing external information (Barry et al., 2007). Recent intracranial recordings have revealed that alpha propagates as traveling waves from higher-order cortical areas toward lower-order ones, suggesting that alpha contributes to feedback processing within and across brain regions (Halgren et al., 2019).
Alpha functions as a sensory gate. Try this experiment: close your eyes right now. If someone were measuring your EEG, they would see alpha power surge dramatically in your visual cortex. By blocking visual input, you have effectively told your brain to switch from external processing to internal mode. Alpha is the "do not disturb" sign your visual cortex hangs on its door. Conversely, when you open your eyes and engage with a task, alpha "desynchronizes," meaning it breaks up and disappears to let sensory information flood in. This is called alpha blocking, and it was one of the first EEG phenomena ever described.
The conductor metaphor extends further when we consider how alpha rhythmically controls access to information processing. When alpha power increases, gamma power in the same region typically decreases, and when alpha falls during task engagement, gamma activity increases (Spaak et al., 2012; Sauseng et al., 2009). This reciprocal relationship allows alpha to gate which information gets processed and when. Athletes and experienced meditators often cultivate high resting alpha to maintain a state of "restful alertness," a paradox that makes perfect sense once you understand what alpha does (Lagopoulos et al., 2009). They remain mentally available and ready to respond without being overwhelmed by sensory noise. It is relaxation without drowsiness, attention without anxiety, the conductor holding the baton poised before the downbeat.
The Art of Sitting Still: Sensorimotor Rhythm 12–15 Hz
The Sensorimotor Rhythm (SMR) sits right next to alpha in frequency but serves a completely different function. While alpha is about visual gating, SMR is about motor inhibition. It oscillates between 12 and 15 Hz over the sensorimotor strip, that band of cortex running across the top of your head like a headband.
SMR originates from the ventrobasal nuclei of the thalamus communicating with the motor cortex, and it represents something elegant: the ability to be physically still while remaining mentally sharp (Sterman, 1996). Picture a cat crouched perfectly motionless, watching a bird. Every muscle is controlled, no unnecessary twitches, pure focused stillness. That cat is generating serious SMR.
Neurofeedback practitioners discovered something remarkable about this rhythm. Barry Sterman, while training cats to increase SMR in the 1970s, accidentally discovered that these cats became resistant to seizures. This finding led to SMR training as a treatment for epilepsy and later for attention deficit hyperactivity disorder (ADHD). The logic is intuitive once you understand the rhythm: SMR training reinforces the brain's ability to suppress impulsive motor movement, exactly what hyperactive individuals struggle with (Egner & Gruzelier, 2004). By learning to produce more SMR, people can literally train their brains to sit still and focus.
The Working Frequencies: The Beta Spectrum 12–30 Hz
When you actively engage with the world, you shift into beta. But beta is not a single frequency; it is an entire spectrum divided into three distinct bands, each reflecting a different level of cognitive intensity.
Beta 1 (12–15 Hz), sometimes called low beta, overlaps with SMR but distributes more frontally across the brain. This is the frequency of relaxed focus or pleasant musing. You generate Beta 1 when reading a novel for pleasure, performing a routine task, or having an easy conversation. You are engaged but not stressed, attentive but not straining (Rangaswamy et al., 2002). Anatomically, this rhythm involves shorter cortico-cortical loops than alpha, allowing for faster local processing without the metabolic expense of higher frequencies.
Beta 2 (15–23 Hz), or mid-beta, is the sweet spot of active cognition. This is almost certainly what you are generating right now as you try to understand and remember this information. Beta 2 signifies an externally oriented state of mind, optimal for problem solving, judgment, and analytical thinking (Egner & Gruzelier, 2004). It represents your brain actively working on something, and working efficiently.
Beta 3 (23–30 Hz), or high beta, is where things get uncomfortable. While Beta 3 can represent highly complex integration of information, it is more frequently associated with anxiety, rumination, and stress (Price & Budzynski, 2009). This is the sound of a brain that refuses to shut off, looping through worry or maintaining hypervigilance. It consumes enormous metabolic energy. Chronic high beta is exhausting and unsustainable, yet many anxious individuals spend much of their waking life in this range, their neurons firing frantically even when there is nothing productive to accomplish. Understanding this frequency helps explain why anxiety feels so physically draining even when you are just sitting there thinking.
The Flash of Insight: Gamma Waves >30 Hz
At the peak of the frequency spectrum sits gamma, the brain's binding rhythm. Unlike slower waves driven by the thalamus, gamma is generated locally by interneurons, specifically fast-spiking GABAergic cells, interacting with pyramidal cells within cortical columns. This is neural activity happening at the local level, within specific brain regions rather than across the whole cortex (Buzsáki & Wang, 2012).
Gamma's function is what neuroscientists call "cognitive binding," and understanding it helps solve one of the deepest puzzles of perception. When you look at an apple, different parts of your visual cortex process its color (red), shape (round), and movement (rolling across the table). But you do not perceive three separate features; you perceive one unified apple. How does the brain stitch these distributed processes into a single coherent experience? The answer appears to be gamma. Brief bursts of gamma synchrony link the neurons processing different features, binding them together into unified perception.
Here is where the conductor relationship becomes especially clear. Gamma bursts do not occur randomly; they are organized by slower rhythms. The phase of alpha oscillations modulates when and where gamma activity occurs, creating a hierarchical structure where the conductor (alpha) coordinates the fast, local activity (gamma) of the individual musicians (Voytek et al., 2010). Behaviorally, gamma bursts are associated with "Aha!" moments, those flashes of insight when everything suddenly clicks. It accompanies peak concentration and high-level information processing. That moment when you finally solve a difficult equation, when a joke suddenly makes sense, when disparate pieces of a puzzle fall into place: gamma is firing. It is the localized flash of neural activity that marks understanding itself.
The Orchestra Together
None of these rhythms operate in isolation. At any given moment, your brain produces all of them simultaneously, in different proportions and at different locations. The ratio of theta to beta might indicate how drowsy you are versus how engaged. The amount of alpha over your visual cortex reveals whether you are processing the external world or turning inward. Gamma bursts ride on slower theta and alpha waves during memory encoding, a phenomenon called cross-frequency coupling that allows local processing to coordinate with global brain states. In this orchestra, alpha appears to serve as the conductor, its phase modulating when faster rhythms can fire and coordinating communication across distant brain regions.
Understanding these rhythms gives you a new vocabulary for describing your own mental states. That foggy feeling after a bad night's sleep? Your brain is probably generating more delta and theta than it should during waking hours. That jittery anxiety before an exam? You might be stuck in high beta while your alpha conductor has lost control of the orchestra. That calm, alert focus during a really good study session? Alpha and low beta are probably in healthy balance, with gamma bursts occurring in precise coordination with alpha phase. The orchestra in your head is always playing. Now you can start to hear the music.
Navigating the Spectrum of Brain Rhythms
When you first observe the continuous flow of electrical activity generated by the brain, the sheer complexity of the signal can feel overwhelming. To manage this chaotic stream of data, scientists utilize electroencephalography, a non-invasive monitoring method used to record electrical activity of the brain along the scalp, to capture and interpret these signals (Niedermeyer & Lopes da Silva, 2005). As you begin to analyze this data, you will likely rely on frequency bands, which are specific ranges of oscillatory speed measured in Hertz that serve as a convenient shorthand for categorization (Buzsáki, 2006). It is common practice to discuss brain waves in terms of delta, theta, alpha, beta, and gamma ranges, yet it is crucial to recognize that these boundaries are somewhat artificial creations that evolved from historical observation and usage rather than distinct biological laws.
The Pitfalls of Frequency-Based Labels
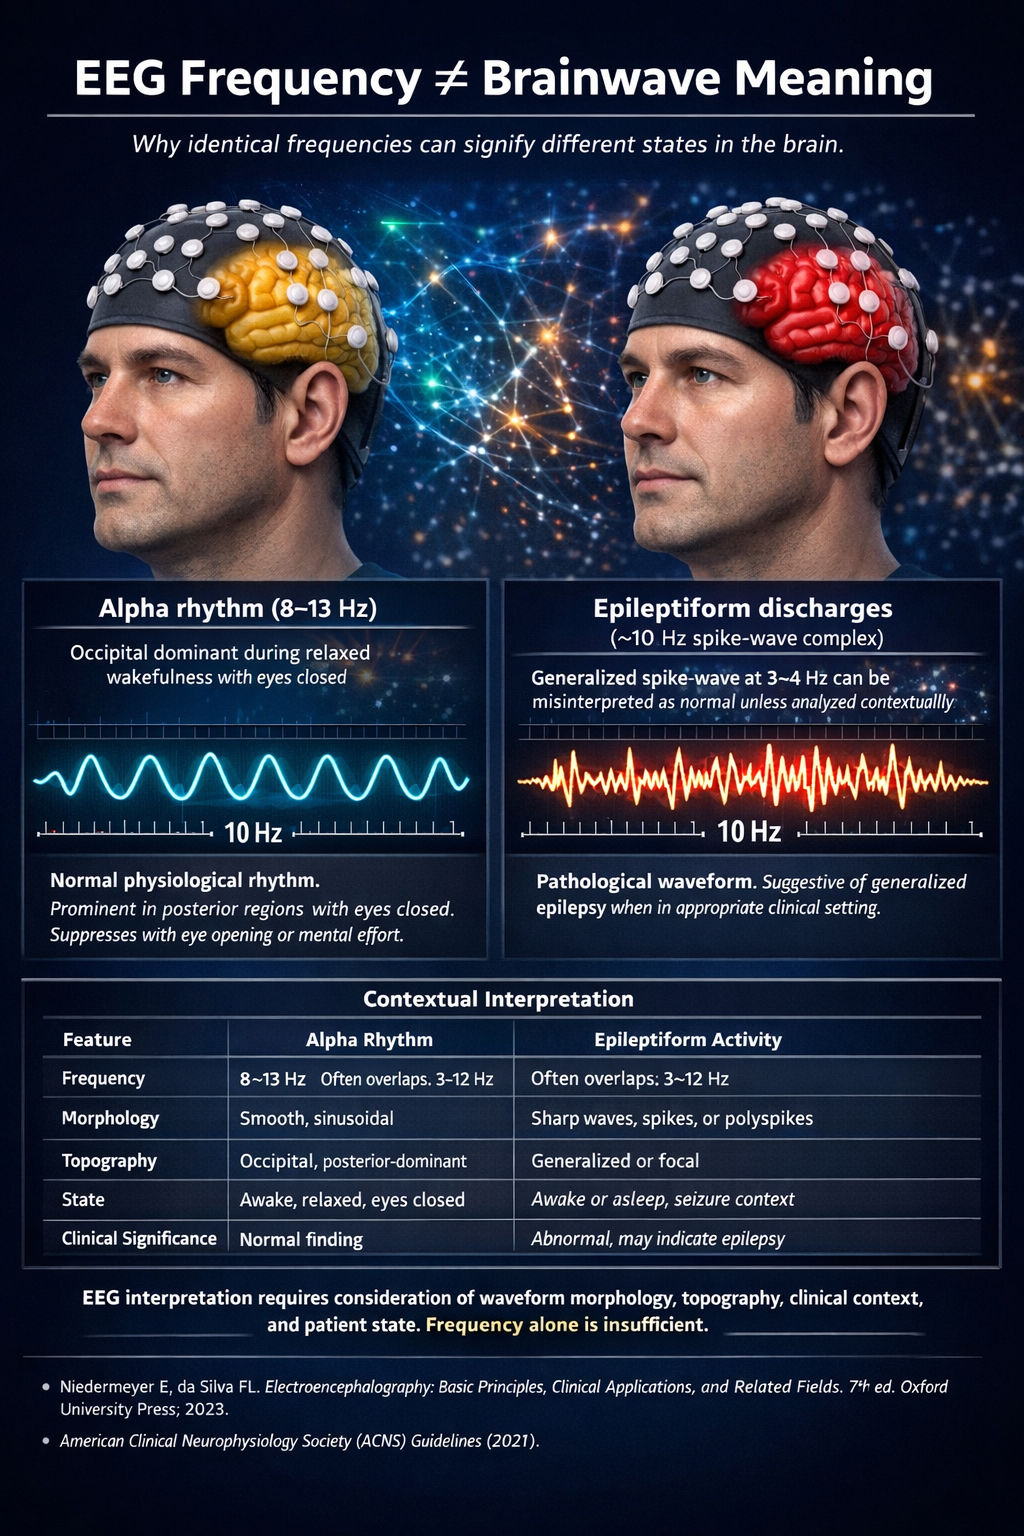
The labels we assign to these bands can be helpful descriptors, but they also possess the power to mislead an uncritical observer. A specific frequency does not inherently carry a single, universal meaning across the entire brain. For example, you might identify a rhythm oscillating at 10 Hz and immediately label it as alpha activity, which is traditionally linked to a relaxed and wakeful state. However, if you examine the topography, or the spatial distribution of the activity across the scalp, you might discover that this rhythm is located over the motor cortex rather than the visual cortex (Nunez & Srinivasan, 2006). In this specific location, that same 10 Hz frequency is actually a mu rhythm, which represents a functionally distinct network state related to movement control rather than visual idling (Pineda, 2005). This discrepancy highlights why relying solely on a frequency number can lead to erroneous conclusions about the subject's cognitive state.
Accurate Classification Requires Holistic Evaluation
To classify an EEG rhythm accurately, you must look beyond the raw numbers and engage in a holistic evaluation that includes the waveform morphology, defined as the visual shape and structure of the signal including its amplitude, phase, and sharpness (Kane et al., 2017). A rhythmic oscillation looks fundamentally different from a sharp spike or a complex wave, even if they share temporal similarities. Furthermore, the analysis requires strict attention to the measurement conditions and the activity occurring during the specific epoch, which is a specific time window or segment of EEG data selected for analysis (Tong & Thakor, 2009). The context of the recording, such as whether the subject is asleep, performing a math problem, or hyperventilating, fundamentally alters how you must interpret the frequency and shape of the wave. True understanding of neural oscillations demands that you treat "bands" not as rigid containers, but as flexible guides within a much broader context of physiological evidence.
The Delta Band and Its Functional Significance
The slowest oscillations in the brain's electrical repertoire belong to the Delta band, which encompasses frequencies ranging from approximately 0.5 to 4 Hz (Amzica & Steriade, 1998). These large, rolling waves dominate the EEG during the deepest stages of non-rapid eye movement sleep, where they reflect the synchronized activity of vast neuronal populations temporarily disconnected from sensory input and conscious awareness (Steriade et al., 1993). During this profound state of neural quiet, the brain engages in critical restorative processes including memory consolidation, synaptic homeostasis, and metabolic waste clearance through the recently discovered glymphatic system (Xie et al., 2013). When you observe prominent Delta activity in a sleeping individual, you are witnessing the brain in its most intensive maintenance mode, performing the cellular housekeeping that sustains healthy cognitive function during waking hours.
However, the presence of Delta waves during wakefulness tells an entirely different story and should immediately capture your clinical attention. In an alert adult, excessive Delta activity often signals underlying pathology such as focal brain lesions, metabolic encephalopathy, or the effects of sedating medications (Kaplan & Rossetti, 2011). The interpretation shifts dramatically based on context, and this principle applies across all frequency bands. In infants and young children, Delta activity during wakefulness is developmentally normal because the immature brain has not yet established the faster rhythms characteristic of adult cortical function (Bell & Cuevas, 2012). This developmental consideration reminds us that normative standards for EEG interpretation must always account for the age of the individual being assessed.
Theta Rhythms and the Landscape of Internal Processing
Moving up the frequency spectrum, the Theta band occupies the range from approximately 4 to 8 Hz and plays a fascinating role in bridging unconscious and conscious mental operations (Cavanagh & Frank, 2014). Theta oscillations become particularly prominent during drowsiness and light sleep, creating that characteristic slowing of the EEG as an individual transitions from alert wakefulness toward slumber (Santamaria & Chiappa, 1987). Yet theta activity is far from merely a marker of reduced arousal. Research has revealed that frontal midline theta rhythms surge during demanding cognitive tasks that require sustained attention, working memory maintenance, and executive control (Onton et al., 2005). When you concentrate intensely on solving a complex problem or holding multiple pieces of information in mind simultaneously, theta oscillations generated in the anterior cingulate cortex and medial prefrontal regions coordinate the neural networks necessary for these effortful mental operations (Mitchell et al., 2008).
The hippocampus, that seahorse-shaped structure buried deep within the temporal lobes, generates its own distinctive theta rhythm that serves as the backbone of spatial navigation and episodic memory formation (Buzsáki, 2002). When a rat explores a new environment or when a human mentally navigates through a familiar space, hippocampal theta provides the temporal scaffolding upon which place cells and grid cells encode spatial information (Ekstrom et al., 2005). This same rhythm appears to orchestrate the encoding and retrieval of autobiographical memories, binding together the disparate sensory and emotional elements of an experience into a coherent memory trace (Lega et al., 2012). The theta band thus illustrates beautifully how a single frequency range can serve multiple distinct functions depending on the brain region generating the rhythm and the behavioral state of the organism.
Alpha Oscillations and the Idling Brain
Perhaps no EEG rhythm has captured scientific attention quite like the Alpha band, spanning approximately 8 to 12 Hz, which holds the distinction of being the first brain rhythm ever recorded in a human subject (Berger, 1929). When Hans Berger placed electrodes on the scalp of his son Klaus in the 1920s, he observed these prominent oscillations waxing and waning with the opening and closing of the eyes, establishing the foundational observation that alpha rhythms dominate the posterior regions of the brain when the visual system is not actively processing external input (Niedermeyer, 1997). This phenomenon, known as alpha blocking or alpha desynchronization, occurs because the arrival of visual information disrupts the synchronized idling pattern of the occipital cortex and replaces it with the desynchronized activity associated with active sensory processing (Pfurtscheller & Lopes da Silva, 1999).
Contemporary understanding has moved well beyond viewing alpha simply as an "idling rhythm" reflecting cortical rest. Researchers now recognize that alpha oscillations play an active role in gating information flow and inhibiting task-irrelevant brain regions (Jensen & Mazaheri, 2010). When you direct your attention to a particular location in space or focus on a specific sensory modality, alpha power increases over the cortical regions processing irrelevant information while decreasing over regions relevant to your current focus (Foxe & Snyder, 2011). This mechanism of functional inhibition through alpha synchronization allows the brain to filter out distracting input and allocate processing resources efficiently. Individual differences in alpha characteristics, including peak frequency and amplitude, correlate with cognitive processing speed, memory capacity, and even personality traits, suggesting that the alpha rhythm serves as a fundamental parameter of brain organization that shapes cognitive capabilities (Grandy et al., 2013).
The Beta Band and Active Cortical Engagement
The Beta band, encompassing frequencies from approximately 12 to 30 Hz, reflects cortical states characterized by active engagement, alertness, and motor control (Engel & Fries, 2010). When you prepare to execute a voluntary movement, beta oscillations decrease over the motor cortex in a phenomenon called event-related desynchronization, allowing the motor command to proceed without the constraining influence of the resting beta rhythm (Pfurtscheller & Berghold, 1989). Following the completion of the movement, beta power rebounds dramatically in what is termed beta rebound or post-movement beta synchronization, which appears to reflect the active suppression of the motor system and the return to a stable resting state (Jurkiewicz et al., 2006). This pattern of beta suppression followed by rebound provides a clear neurophysiological marker of motor processing that has proven valuable in clinical applications including brain-computer interfaces and the assessment of movement disorders.
Beyond motor function, beta oscillations appear to play a crucial role in maintaining the current cognitive set or status quo (Engel & Fries, 2010). Elevated beta activity has been associated with the preservation of ongoing sensory and cognitive states against potential disruption, leading some researchers to propose that beta represents a "stay the course" signal that resists change in favor of stability (Spitzer & Haegens, 2017). This perspective helps explain why excessive beta activity is observed in conditions characterized by cognitive rigidity, including anxiety disorders and Parkinson's disease (Jenkinson & Brown, 2011). In anxiety, heightened beta may reflect hypervigilance and difficulty disengaging from threat-monitoring, while in Parkinson's disease, pathological beta synchronization in the basal ganglia contributes to the characteristic difficulty initiating and executing voluntary movements (Little & Brown, 2014). Neurofeedback interventions targeting beta modulation have shown promise in addressing these clinical conditions by training individuals to regulate their own cortical rhythms toward healthier patterns (Hammond, 2011).
Gamma Oscillations and the Binding Problem
At the fastest end of the conventional EEG spectrum, the Gamma band includes frequencies above approximately 30 Hz, with most research focusing on the 30 to 100 Hz range, though some definitions extend gamma to frequencies exceeding 200 Hz (Uhlhaas et al., 2011). These rapid oscillations present unique measurement challenges because their small amplitudes make them vulnerable to contamination by muscle artifact, which can produce electrical activity in similar frequency ranges (Muthukumaraswamy, 2013). Despite these technical difficulties, gamma oscillations have emerged as a central topic in cognitive neuroscience because they appear intimately connected to conscious perception, attention, and the binding together of information processed in different brain regions (Singer, 2001).
The binding problem asks how the brain integrates the many separate features of a perceived object, processed in anatomically distinct cortical areas, into a unified conscious experience. When you perceive a red ball bouncing across a room, separate brain regions process its color, shape, motion, and spatial location, yet you experience a single coherent object rather than disconnected attributes (Treisman, 1996). Gamma oscillations have been proposed as a potential mechanism for solving this binding problem through temporal coding, wherein neurons processing different features of the same object fire in synchrony at gamma frequencies while neurons processing features of different objects fire out of phase (Gray et al., 1989). This theory of binding through gamma synchronization remains debated, but substantial evidence supports the role of gamma oscillations in attentional selection, working memory maintenance, and the formation of conscious percepts (Fries, 2015). Disruptions of gamma oscillations have been documented in conditions including schizophrenia and autism spectrum disorder, suggesting that impairments in this high-frequency rhythm may contribute to the cognitive and perceptual difficulties experienced by individuals with these conditions (Uhlhaas & Singer, 2010).
Cross-Frequency Coupling and Neural Communication
The frequency bands we have examined do not operate in isolation but instead interact continuously through a phenomenon called cross-frequency coupling, whereby the activity in one frequency band modulates or coordinates with activity in another (Canolty & Knight, 2010). The most extensively studied form of cross-frequency coupling involves the phase-amplitude coupling between slower theta oscillations and faster gamma bursts, wherein gamma activity increases at particular phases of the theta cycle (Tort et al., 2010). This hierarchical organization appears to serve as a mechanism for organizing information processing across multiple temporal scales, with slower rhythms providing the broad temporal framework within which faster rhythms carry specific content (Lisman & Jensen, 2013). In the hippocampus, the phase of theta oscillations determines when gamma bursts occur, and different gamma frequencies locked to different theta phases may carry distinct types of information related to memory encoding versus retrieval (Colgin et al., 2009).
Cross-frequency coupling also occurs between other frequency pairs including delta-theta, alpha-gamma, and beta-gamma, each potentially serving distinct functional roles in coordinating neural activity across brain regions and temporal scales (Hyafil et al., 2015). Abnormalities in cross-frequency coupling have been identified in various neurological and psychiatric conditions, suggesting that disruptions in this hierarchical organization of brain rhythms may contribute to cognitive dysfunction (de Hemptinne et al., 2013). For practitioners of neurofeedback, an appreciation of cross-frequency coupling provides important context for understanding how training one frequency band might produce effects on other bands through their interconnected dynamics. The brain's rhythms exist not as independent channels but as an integrated orchestra where each section influences and responds to the others.
Individual Differences and Clinical Considerations
As you develop expertise in interpreting brain rhythms, you must cultivate an appreciation for the substantial individual differences that exist in EEG characteristics across the healthy population. The individual alpha frequency, defined as the peak frequency within the alpha band, varies across individuals from approximately 8 to 12 Hz and tends to decrease with age while increasing with higher cognitive ability (Klimesch, 1999). This individual alpha frequency appears to serve as a kind of personal tempo for cognitive processing, influencing the speed at which an individual can sample and integrate information from the environment (Samaha & Postle, 2015). Two individuals might both show robust alpha activity, yet if one has a peak frequency of 9 Hz and another peaks at 11 Hz, their cognitive processing characteristics will differ in meaningful ways that influence performance on various tasks.
Clinical assessment of EEG rhythms requires careful comparison against age-appropriate normative databases that account for the systematic changes in EEG characteristics across the lifespan (John et al., 1988). Infants show predominantly slow activity that gradually gives way to faster rhythms as cortical maturation proceeds through childhood and adolescence (Saby & Marshall, 2012). Older adults typically show slowing of the alpha rhythm and increases in slow-wave activity compared to younger adults, reflecting normal age-related changes in brain function that must be distinguished from pathological slowing (Klimesch, 1999). Medication effects, caffeine consumption, sleep deprivation, and countless other factors can temporarily alter EEG characteristics, requiring that clinicians gather thorough information about the conditions under which a recording was obtained before drawing conclusions about underlying brain function (Barry et al., 2005). The skilled EEG interpreter brings together knowledge of frequency bands, topography, morphology, context, individual differences, and developmental norms to construct a complete picture of the brain's electrical activity and its functional significance.
Consider David, a 52-year-old executive who came for neurofeedback complaining of chronic anxiety that interfered with his sleep and work performance. His assessment revealed elevated high beta (25-35 Hz) at frontal sites, consistent with the hyperarousal pattern often seen in anxiety disorders. By training him to reduce high beta while increasing SMR at central sites, you addressed both the excessive cortical arousal and the motor restlessness that accompanied his anxiety. After 25 sessions, David reported significant improvement in both sleep quality and his ability to remain calm during stressful meetings.
EEG frequency bands reflect different states of brain activation and different generators. Delta predominates during deep sleep and can indicate pathology when present in the waking state. Theta is associated with creativity and memory but excess theta indicates underarousal. Alpha reflects relaxed alertness and is generated by thalamocortical loops. SMR indicates motor stillness and is often a target for neurofeedback training. Beta reflects active cognitive engagement, while high beta may indicate anxiety or hyperarousal.
Check Your Understanding
- Why might excessive frontal theta in an adult indicate problems with attention?
- What is the clinical significance of the theta/beta ratio, and why does age matter when interpreting it?
- How does the SMR relate to motor activity, and why is it a common target for neurofeedback training?
- What does excessive high beta at frontal sites typically indicate?
- Why should clinicians use an EMG inhibit when up-training beta?
Connectivity: How Brain Regions Communicate
The brain's power comes not from any single region but from the intricate patterns of communication between regions. Modern neuroscience has revealed that the brain is organized into networks that can be studied using measures of functional connectivity derived from EEG and other imaging modalities.
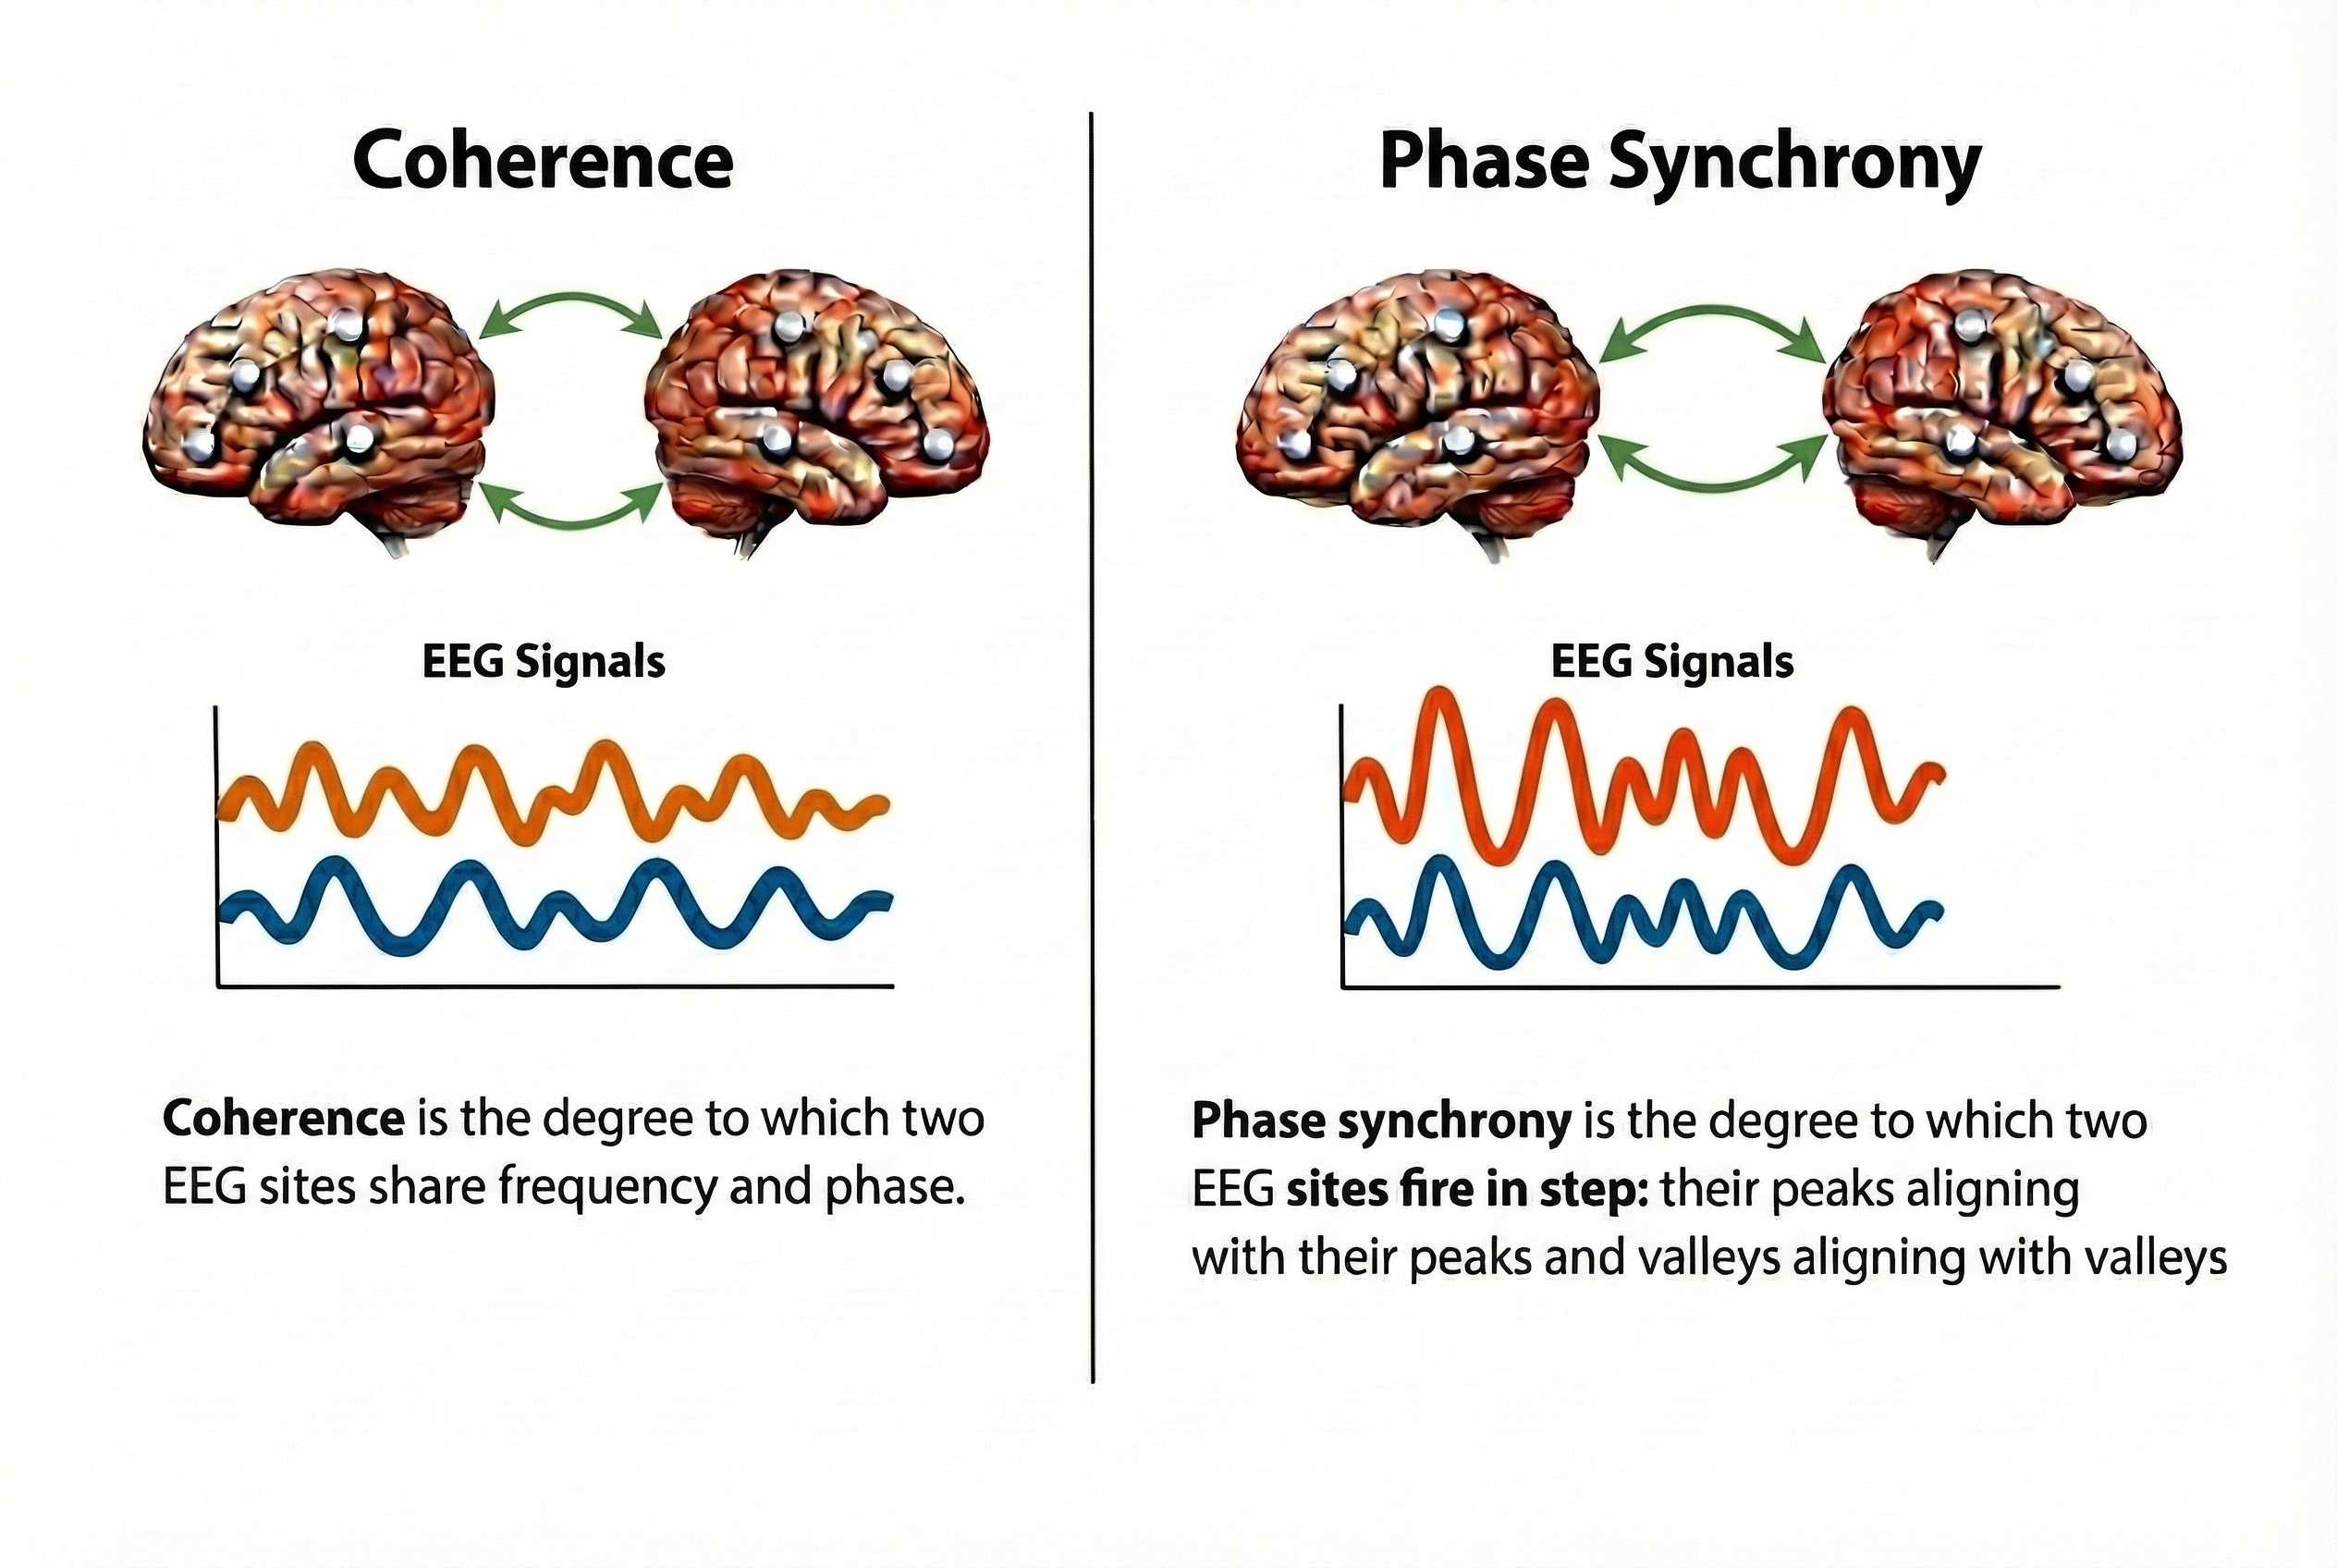
Coherence measures the degree to which two EEG signals share the same frequency content and maintain a consistent phase relationship. High coherence between two sites suggests they are functionally connected. Phase synchrony measures whether brain regions are activating at the same time, which is crucial for coordinated information processing.
Disrupted connectivity patterns have been identified in numerous clinical conditions. In ADHD, researchers often find reduced coherence between frontal and parietal regions, suggesting a disconnect between executive control areas and attention networks. In depression, asymmetric alpha activity between left and right frontal regions reflects imbalanced approach and withdrawal systems.
Neurofeedback can target connectivity as well as amplitude. Training to increase coherence between specific sites may help strengthen functional connections, while training to reduce excessive coherence may help regions operate more independently when appropriate.
Maria, a 34-year-old marketing manager, sought neurofeedback for persistent difficulty concentrating after a mild concussion sustained in a car accident eighteen months earlier. Standard amplitude-based assessment showed only subtle abnormalities, but connectivity analysis revealed a striking pattern: coherence between her left frontal and left parietal regions had dropped to the 12th percentile compared to age-matched norms. This reduced frontal-parietal coherence suggested that her executive control networks were not communicating efficiently with her attention networks, explaining why she could start tasks but struggled to maintain focus. Treatment targeted increasing coherence between F3 and P3 while simultaneously training SMR at C3 to support motor quieting. After 30 sessions, her coherence measures had normalized to the 45th percentile, and she reported that her concentration had returned to pre-injury levels. Her case illustrates how connectivity measures can reveal dysfunction invisible to traditional amplitude assessment and how targeting network communication can produce clinical improvement.
The brain's computational power emerges from communication between regions rather than from any single area operating in isolation. Coherence measures the degree to which two EEG signals share frequency content and maintain a stable phase relationship, providing an index of functional connectivity between sites. Phase synchrony captures whether regions activate at the same time, which is essential for coordinated information processing. Clinical conditions including ADHD, depression, and traumatic brain injury show characteristic disruptions in connectivity patterns that can serve as both diagnostic markers and treatment targets. Neurofeedback protocols can target connectivity directly by training to increase coherence between underconnected regions or decrease excessive coupling where more independent operation would be beneficial.
Check Your Understanding
- How does coherence differ from amplitude as an EEG measure, and what does high coherence between two sites suggest about their functional relationship?
- Why might reduced frontal-parietal coherence contribute to attention difficulties in ADHD?
- What does frontal alpha asymmetry reveal about emotional processing, and how is this pattern typically interpreted in depression?
- How can neurofeedback target connectivity rather than just amplitude, and when might this approach be clinically indicated?
- Why is phase synchrony important for coordinated information processing across brain regions?
Cutting-Edge Topics in EEG Research
Infant Brain Development Revealed Through EEG Microstates
A 2025 international collaboration using EEG to study infant brain development made surprising discoveries about how neural networks organize during the first two years of life. Researchers found that infants' brains show characteristic "microstates," brief snapshots of large-scale brain activity that transition from one pattern to another. As babies grow, these network transitions become increasingly rapid, reflecting the brain's growing capacity for flexible information processing. Unlike fMRI, which is too slow to capture these rapid changes, EEG's millisecond temporal resolution revealed that network development accelerates dramatically during infancy, with the most rapid changes occurring during the first year. These findings could lead to earlier detection of developmental disorders and more targeted early interventions.
The Extracellular Matrix and Synaptic Plasticity
While neurons have long been the focus of learning and memory research, a 2024 study published in Cell Reports revealed that the extracellular matrix surrounding synapses plays a crucial role in brain plasticity. Researchers found that clusters of chondroitin sulfates (molecules better known for their role in joint cartilage) collect around active synapses and influence whether connections strengthen or weaken. This "peri-synaptic matrix" provides a new mechanism for understanding how the brain encodes and stores information, and it suggests potential new targets for treatments aimed at enhancing learning or recovering function after brain injury. The finding underscores that even after decades of research, fundamental aspects of how the brain changes with experience are still being discovered (Chelini et al., 2024).
Test Yourself
Click on the ClassMarker logo to take 10-question tests over this unit without an exam password.

Review Flashcards on Quizlet
Click on the Quizlet logo to review our chapter flashcards.

Visit the BioSource Software Website
BioSource Software offers Human Physiology, which satisfies BCIA's Human Anatomy and Physiology requirement, and Biofeedback100, which provides extensive multiple-choice testing over BCIA's Biofeedback Blueprint.

Assignment
Now that you have completed this unit, how would you explain the relationship between local field potentials and the EEG? How does anatomy explain why the EEG is comprised of EPSPs and IPSPs instead of action potentials?
Glossary
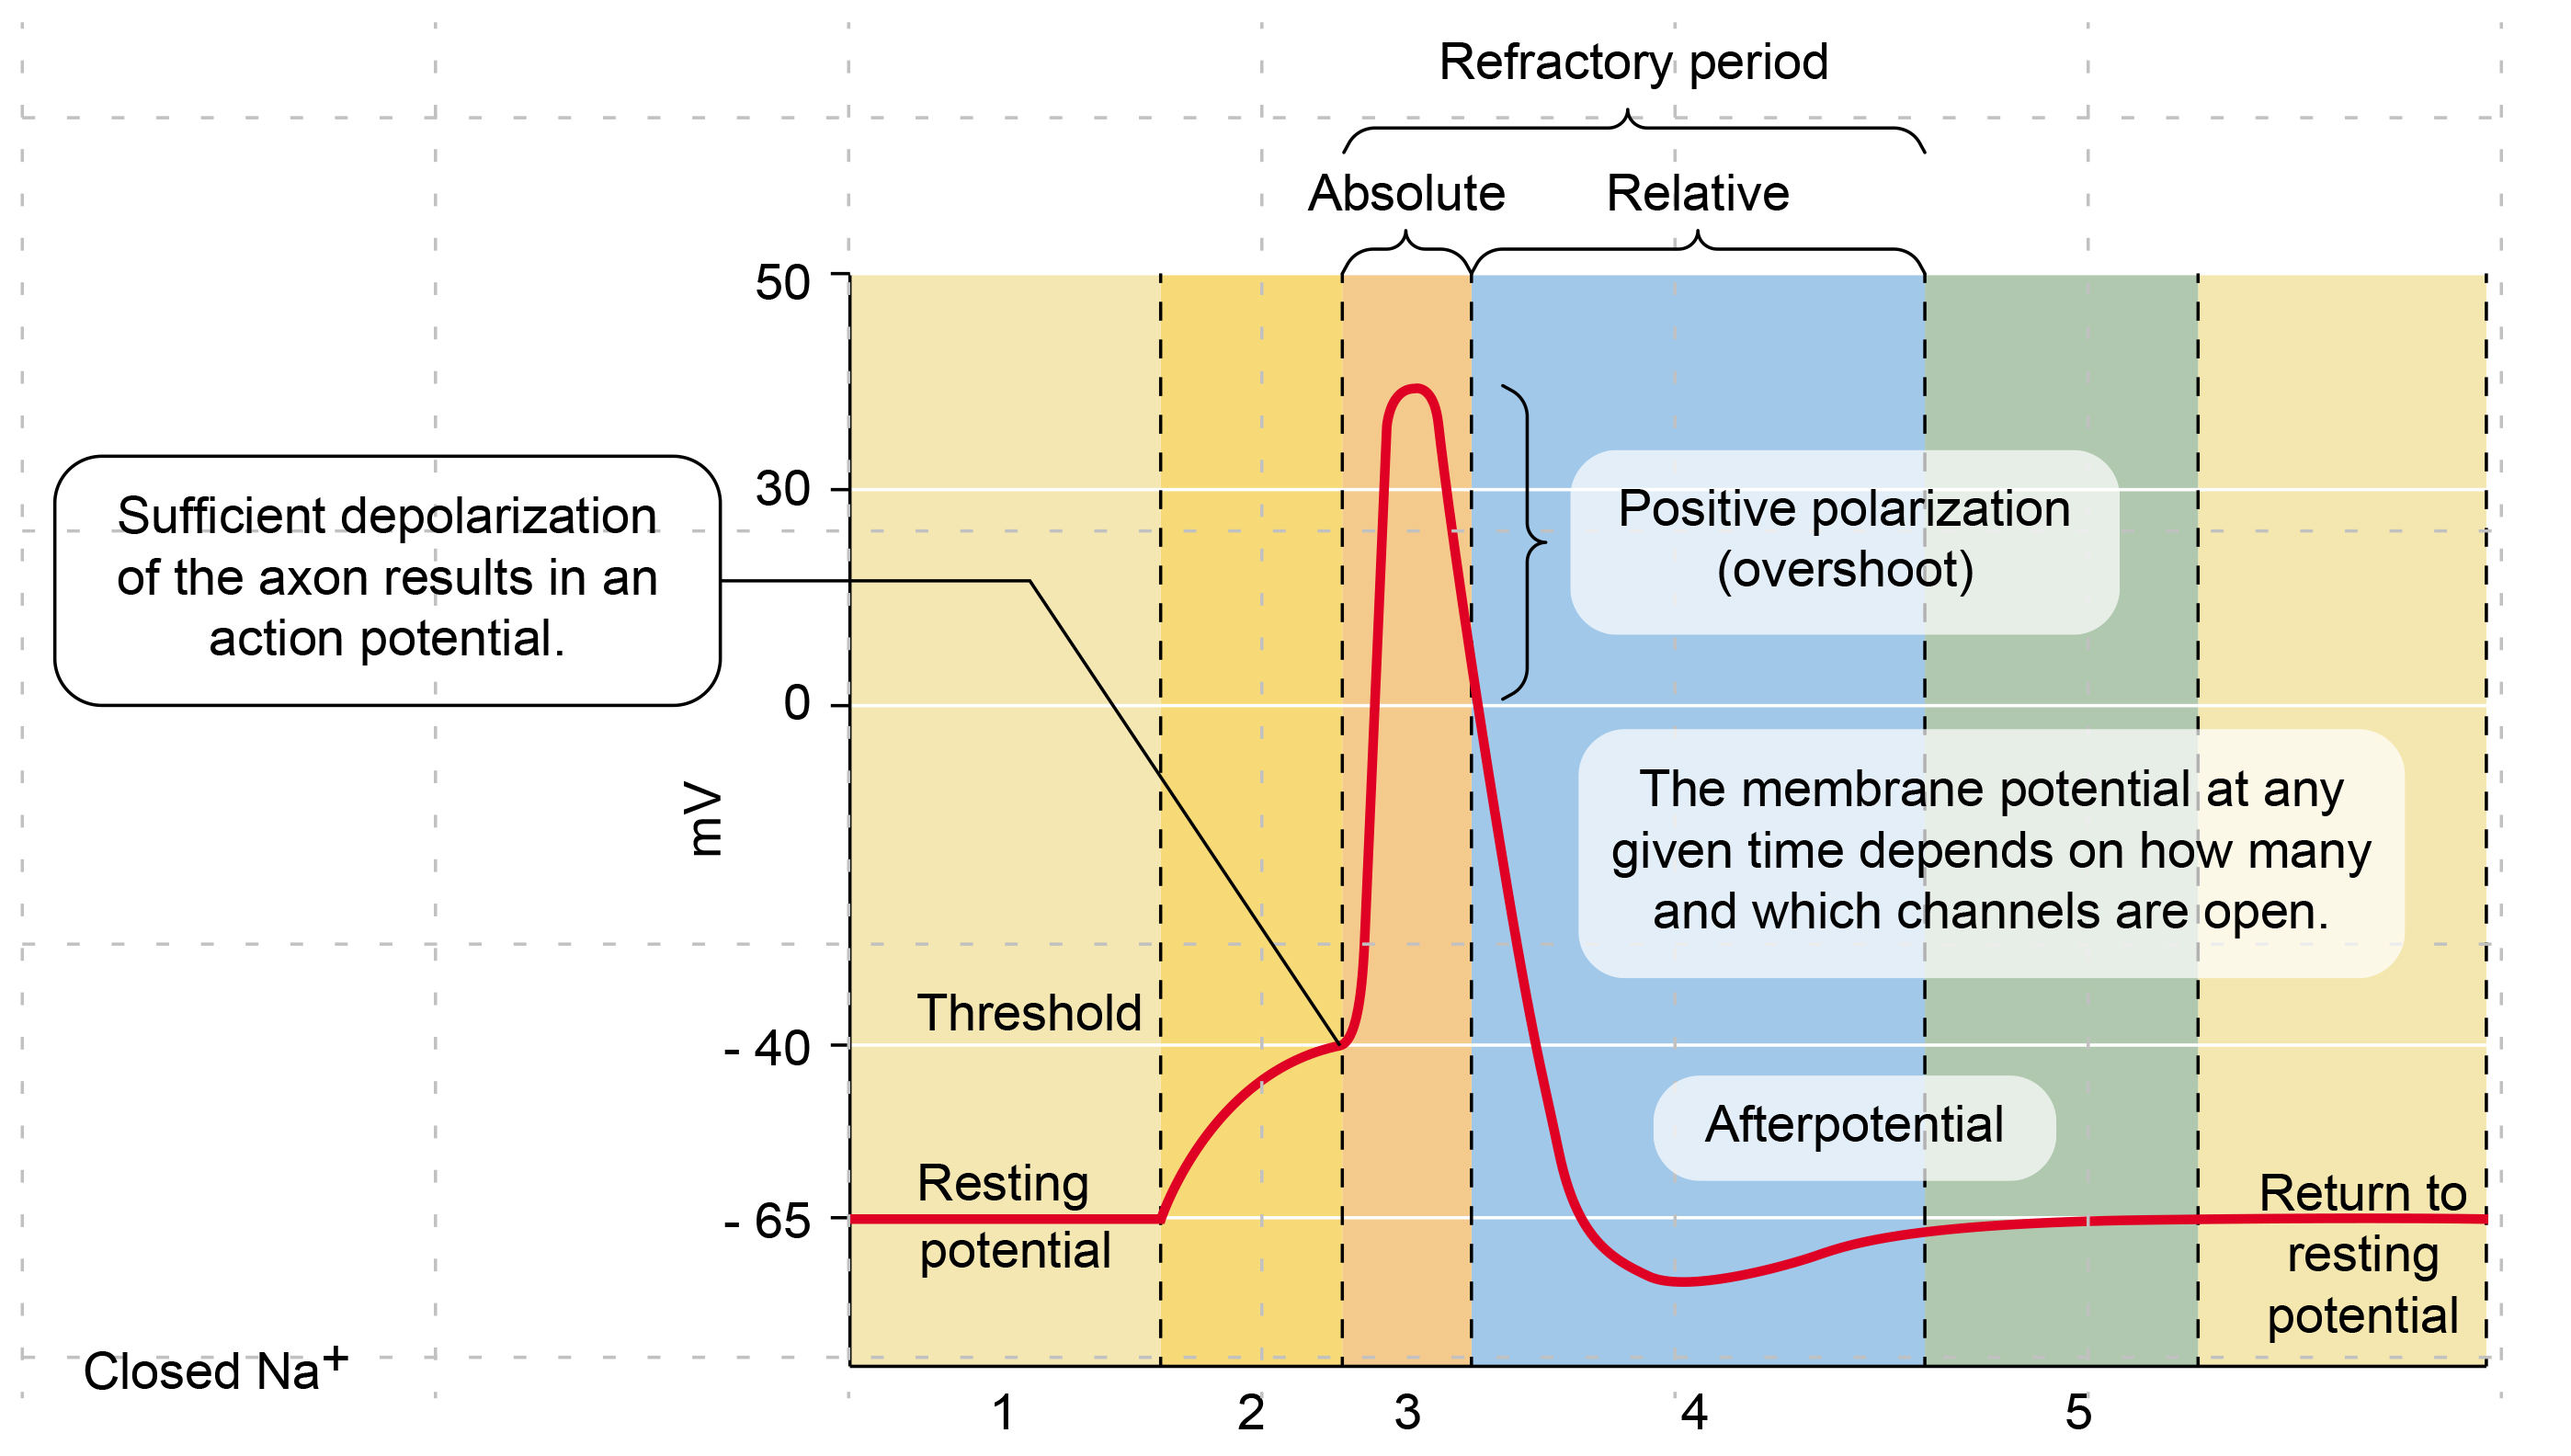
action potential: an all-or-none electrical signal that propagates down an axon when the axon hillock reaches its threshold of excitation, typically lasting less than 2 ms.
afferent: a sensory neuron that transmits information towards the central nervous system.
alpha 1 (low alpha): the 8-10 Hz portion of the alpha band, sometimes associated with underarousal.
alpha 2 (high alpha): the 10-12 Hz portion of the alpha band, associated with calm alertness.
alpha blocking: the rapid attenuation or disappearance of alpha rhythm when the eyes open or during active cognitive engagement, reflecting the shift from internal processing to external sensory engagement.
alpha rhythm: 8-12 Hz activity generated by thalamocortical loops, dominant posteriorly during relaxed wakefulness with eyes closed.
amplitude: the voltage or "height" of an EEG waveform measured in microvolts (μV), reflecting the number and synchrony of neurons firing; values significantly below age-appropriate norms or abrupt drops during recording may indicate pathology warranting medical investigation.
axon: a long, thin fiber extending from the cell body that conducts action potentials to terminal buttons.
axon hillock: the unmyelinated region where the axon emerges from the cell body, where EPSPs and IPSPs are integrated to determine whether an action potential will be initiated.
beta band: the range of EEG frequencies from approximately 12 to 30 Hz, associated with active cortical engagement, alertness, and motor control.
beta rebound: the dramatic increase in beta power following completion of a motor movement, reflecting active suppression of the motor system and return to a stable resting state; also called post-movement beta synchronization.
beta rhythm: 12-30 Hz activity associated with arousal and attention generated by brainstem mesencephalic reticular stimulation. Can be divided into beta 1 (12-15 Hz), beta 2 (15-23 Hz), and beta 3 (23-30 Hz).
binding problem: the neuroscientific puzzle of how the brain integrates separate features of a perceived object, processed in anatomically distinct cortical areas, into a unified conscious experience.
cell body or soma: a structure containing machinery for cell life processes that receives and integrates EPSPs and IPSPs from axons.
coherence: a measure of the degree to which two EEG signals share the same frequency content and maintain a consistent phase relationship.
cortical columns: vertical arrangements of neurons in the cortex, each containing thousands of cells that fire in coordinated patterns and serve as fundamental functional units of cortical organization.
cross-frequency coupling: the phenomenon whereby activity in one frequency band modulates or coordinates with activity in another, such as when gamma bursts occur at specific phases of theta oscillations.
delta rhythm: 0.05-3 Hz oscillations generated by thalamocortical neurons during stage 3 sleep, associated with pathology when present in the waking adult EEG.
dendrite: a branched structure designed to receive messages from other neurons via axodendritic synapses.
dendritic spines: protrusions on the dendrite shaft where axons typically form synapses.
depolarize: to make the membrane potential less negative by making the inside of the neuron more positive with respect to its outside.
dominant frequency: the frequency at which EEG activity shows the greatest power or amplitude in a given brain region, reflecting the primary oscillatory state of underlying neural networks and shifting with changes in arousal, attention, or cognitive demand.
efferent: a motoneuron that transmits information towards the periphery.
electroencephalogram (EEG): the voltage difference between at least two electrodes, recording EPSPs and IPSPs occurring primarily in dendrites in pyramidal cells located in macrocolumns in the upper cortical layers.
electroencephalography: a non-invasive monitoring method used to record electrical activity of the brain along the scalp.
epoch: a specific time window or segment of EEG data selected for analysis.
event-related desynchronization: the decrease in oscillatory power in a specific frequency band during preparation for or execution of a task, such as the reduction in beta power over motor cortex before voluntary movement.
excitatory postsynaptic potential (EPSP): a brief positive shift in a postsynaptic neuron's potential produced when neurotransmitters bind to receptors and cause positive sodium ions to enter the cell.
frontal cortex: the most anterior cortical lobe specialized in action, cognition, emotion, and autonomic control.
frequency: the number of complete wave cycles occurring per second in an EEG signal, measured in Hertz (Hz), indicating the speed of neural oscillations and serving as the basis for categorizing brain activity into delta, theta, alpha, beta, and gamma bands.
frequency bands: specific ranges of oscillatory speed measured in Hertz that serve as categories for EEG analysis, including delta, theta, alpha, beta, and gamma.
functional inhibition: the mechanism by which alpha synchronization suppresses processing in task-irrelevant brain regions, allowing efficient allocation of cognitive resources to relevant areas.
gamma band: the range of EEG frequencies above approximately 30 Hz, associated with cognitive binding, conscious perception, attention, and integration of information across brain regions.
gamma rhythm: EEG activity frequencies above 30 Hz associated with feature binding and higher cognitive functions.
glial cells: nonneural cells that guide, insulate, and repair neurons and provide structural, nutritional, and information-processing support. Glial cells generate slow cortical potentials.
glymphatic system: the brain's waste clearance system that becomes active during deep sleep, flushing out metabolic waste products including amyloid proteins implicated in Alzheimer's disease.
hippocampus: a limbic structure in the medial temporal lobe involved in theta activity, endocrine stress response control, explicit memory formation, and navigation.
Hertz (Hz): the unit of frequency measurement equal to one complete wave cycle per second, used to quantify the speed of EEG oscillations; named after German physicist Heinrich Hertz.
hyperpolarize: a negative shift in membrane potential due to the loss of positive ions or gain of negative ions.
individual alpha frequency: the peak frequency within the alpha band for a specific individual, varying from approximately 8 to 12 Hz across persons and correlating with cognitive processing speed and memory capacity.
inhibitory postsynaptic potential (IPSP): a brief negative shift in a postsynaptic neuron's potential produced when cations leave or anions enter a neuron, hyperpolarizing the cell.
integration: the addition of EPSPs and IPSPs at the axon hillock through spatial and temporal summation.
interneurons: neurons that receive input from and distribute output to other neurons, confined to the CNS and providing integration for cognition and movement.
local field potential (LFP): the aggregate electrical signal produced by firing of interconnected pyramidal neurons within cortical columns, modulated by glial cells.
motor neurons: efferent neurons that convey commands to glands, muscles, and other neurons.
mu rhythm: 7-11 Hz waves resembling wickets appearing over central or centroparietal sites (C3 and C4), associated with motor cortex regulation.
myelin: fatty insulation around axons that speeds signal transmission by forcing action potentials to jump between gaps called nodes of Ranvier.
neuroplasticity: the remodeling of neurons and neural networks with experience, enabling learning, memory, and neurofeedback training.
nodes of Ranvier: gaps between myelinated axon segments where the axon membrane is exposed and action potentials are regenerated.
perception-action cycles: the cognitive and emotional processes directed by the prefrontal cortex that adapt us to our environment.
phase synchrony: a measure of whether brain regions are activating at the same time, crucial for coordinated information processing.
phase-amplitude coupling: a form of cross-frequency coupling wherein the amplitude of faster oscillations (such as gamma) is modulated by the phase of slower oscillations (such as theta), organizing information processing across temporal scales.
picowatts (pW): a unit of power equal to one trillionth of a watt (10⁻¹² watts), used to express EEG amplitude as signal power rather than voltage; particularly useful in quantitative EEG analysis and power spectral density calculations.
polarized: made more negative, as when cortical columns hyperpolarize during inhibitory input.
posterior dominant rhythm (PDR): the alpha rhythm visible posteriorly, developing from about 4 Hz at 4 months to 10+ Hz in adults.
prefrontal cortex (PFC): the cortex rostral to the motor association cortex directing cognitive and emotional processes.
pyramidal neurons: large neurons with triangular cell bodies found in all cortical layers except layer 1, representing the primary cortical output neurons whose EPSPs and IPSPs generate the EEG.
resting potential: a neuron's electrical charge at rest, typically about -70 millivolts.
sensorimotor rhythm (SMR): 12-15 Hz activity over the sensorimotor strip that increases with stillness and decreases with movement.
sensory neurons: afferent neurons specialized for sensory intake that transmit information towards the CNS.
slow cortical potentials (SCPs): DC shifts representing global changes in cortical excitability that modulate faster EEG rhythms, with negative shifts lowering the threshold for neuronal firing and positive shifts raising it.
spatial summation: the addition of EPSPs and IPSPs over a neuron's surface from thousands of synapses.
temporal summation: the addition of EPSPs and IPSPs over time when postsynaptic potentials are generated within a 1-15 ms window.
temporal coding: a theory proposing that neurons processing different features of the same object fire in synchrony at gamma frequencies while neurons processing features of different objects fire out of phase, potentially solving the binding problem.
terminal buttons: the buds on axon branch ends that form synapses and release neurotransmitters.
thalamus: a forebrain structure above the hypothalamus that receives, filters, and distributes most sensory information and contributes to multiple EEG rhythms.
thalamocortical loops: reciprocal feedback circuits between the thalamus and cortex that generate stable oscillations including alpha rhythms when the brain is not actively processing external information.
theta rhythm: 4-7 Hz rhythms generated by a cholinergic septohippocampal system, associated with memory and sometimes with underarousal.
theta/beta ratio: the ratio of theta to beta power, used to assess alertness and sometimes elevated in ADHD.
threshold of excitation: the membrane potential at which an axon initiates an action potential, nominally -40 to -55 millivolts.
topography: the spatial distribution of EEG activity across the scalp, essential for accurate rhythm classification since the same frequency can represent different functional states depending on location.
two-compartmental model: a model of EEG coherence demonstrating that the physical length of axonal loops inversely determines the frequency they can support, with shorter connections producing higher frequencies and longer connections producing slower rhythms.
waveform morphology: the visual shape and structure of an EEG signal including its amplitude, phase, and sharpness, used in conjunction with frequency and topography for accurate rhythm classification.
References
Amzica, F., & Lopes da Silva, F. H. (2018). Cellular substrates of brain rhythms. In D. L. Schomer & F. H. Lopes da Silva (Eds.), Niedermeyer's electroencephalography: Basic principles, clinical applications, and related fields (7th ed.). Oxford University Press.
Amzica, F., & Steriade, M. (1998). Electrophysiological correlates of sleep delta waves. Electroencephalography and Clinical Neurophysiology, 107(2), 69-83.
Barry, R. J., Clarke, A. R., Johnstone, S. J., & Brown, C. R. (2005). Clinical implications of resting EEG alpha activity. International Journal of Psychophysiology, 55, 311-322.
Barry, R. J., Clarke, A. R., Johnstone, S. J., Magee, C. A., & Rushby, J. A. (2007). EEG differences between eyes-closed and eyes-open resting conditions. Clinical Neurophysiology, 118(12), 2765-2773.
Bear, M. F., Connors, B. W., & Paradiso, M. A. (2020). Neuroscience: Exploring the brain (4th ed.). Lippincott Williams & Wilkins.
Bell, M. A., & Cuevas, K. (2012). Using EEG to study cognitive development: Issues and practices. Journal of Cognition and Development, 13(3), 281-294.
Breedlove, S. M., & Watson, N. V. (2023). Behavioral neuroscience (10th ed.). Sinauer Associates, Inc.
Bullmore, E., & Sporns, O. (2009). Complex brain networks: Graph theoretical analysis of structural and functional systems. Nature Reviews Neuroscience, 10, 186-198. https://doi.org/10.1038/nrn2575
Buzsáki, G. (2006). Rhythms of the brain. Oxford University Press.
Buzsáki, G., & Wang, X.-J. (2012). Mechanisms of gamma oscillations. Annual Review of Neuroscience, 35, 203-225.
Canolty, R. T., & Knight, R. T. (2010). The functional role of cross-frequency coupling. Trends in Cognitive Sciences, 14(11), 506-515.
Carlson, N. R., & Birkett, M. A. (2021). Physiology of behavior (13th ed.). Pearson Education, Inc.
Chelini, G., et al. (2024). Focal clusters of peri-synaptic matrix contribute to activity-dependent plasticity and memory in mice. Cell Reports. https://doi.org/10.1016/j.celrep.2024.114112
Collura, T. F. (2014). Technical foundations of neurofeedback. Taylor & Francis.
Colgin, L. L., Denber, T., Fyhn, M., Hafting, T., Bonnevie, T., Jensen, O., Moser, M.-B., & Moser, E. I. (2009). Frequency of gamma oscillations routes flow of information in the hippocampus. Nature, 462, 353-357.
de Hemptinne, C., Ryapolova-Webb, E. S., Air, E. L., Garcia, P. A., Miller, K. J., Ojemann, J. G., Ostrem, J. L., Galifianakis, N. B., & Bhattacharyya, P. B. (2013). Exaggerated phase-amplitude coupling in the primary motor cortex in Parkinson disease. Proceedings of the National Academy of Sciences, 110(12), 4780-4785.
Demos, J. N. (2019). Getting started with neurofeedback (2nd ed.). W. W. Norton & Company.
Diekelmann, S., & Born, J. (2010). The memory function of sleep. Nature Reviews Neuroscience, 11(2), 114-126.
Egner, T., & Gruzelier, J. H. (2004). EEG biofeedback of low beta band components: Frequency-specific effects on variables of attention and event-related brain potentials. Clinical Neurophysiology, 115(1), 131-139.
Elbert, T. (1993). Slow cortical potentials reflect the regulation of cortical excitability. In W. C. McCallum & S. H. Curry (Eds.), Slow potential changes in the human brain (pp. 235-251). Plenum Press.
Engel, A. K., & Fries, P. (2010). Beta-band oscillations: Signalling the status quo? Current Opinion in Neurobiology, 20(2), 156-165.
Evans, J. R., & Abarbanel, A. (1999). Introduction to quantitative EEG and neurofeedback. Academic Press.
Foxe, J. J., & Snyder, A. C. (2011). The role of alpha-band brain oscillations as a sensory suppression mechanism during selective attention. Frontiers in Psychology, 2, 154.
Fries, P. (2015). Rhythms for cognition: Communication through coherence. Neuron, 88(1), 220-235.
Fuster, J. M. (2015). The prefrontal cortex (5th ed.). Academic Press.
Grandy, T. H., Werkle-Bergner, M., Chicherio, C., Schmiedek, F., Lövdén, M., & Lindenberger, U. (2013). Peak individual alpha frequency qualifies as a stable neurophysiological trait marker in healthy younger and older adults. Psychophysiology, 50(6), 570-582.
Gray, C. M., König, P., Engel, A. K., & Singer, W. (1989). Oscillatory responses in cat visual cortex exhibit inter-columnar synchronization which reflects global stimulus properties. Nature, 338, 334-337.
Halgren, M., Ulbert, I., Bastuji, H., Fabó, D., Erőss, L., Rey, M., Devinsky, O., Doyle, W. K., Mak-McCully, R., Halgren, E., Wittner, L., Chauvel, P., Ber, G., Deco, G., Bhattacharya, P. B., & Cash, S. S. (2019). The generation and propagation of the human alpha rhythm. Proceedings of the National Academy of Sciences, 116(47), 23772-23782.
Hammond, D. C. (2011). What is neurofeedback: An update. Journal of Neurotherapy, 15(4), 305-336.
Hasselmo, M. E. (2005). What is the function of hippocampal theta rhythm? Linking behavioral data to phasic properties of field potential and unit recording data. Hippocampus, 15(7), 936-949.
Hughes, S. W., & Crunelli, V. (2005). Thalamic mechanisms of EEG alpha rhythms and their pathological implications. The Neuroscientist, 11(4), 357-372. https://doi.org/10.1177/1073858405277450
Hyafil, A., Giraud, A.-L., Fontolan, L., & Gutkin, B. (2015). Neural cross-frequency coupling: Connecting architectures, mechanisms, and functions. Trends in Neurosciences, 38(11), 725-740.
Jenkinson, N., & Brown, P. (2011). New insights into the relationship between dopamine, beta oscillations and motor function. Trends in Neurosciences, 34(12), 611-618.
Jensen, O., & Mazaheri, A. (2010). Shaping functional architecture by oscillatory alpha activity: Gating by inhibition. Frontiers in Human Neuroscience, 4, 186.
John, E. R., Ahn, H., Prichep, L., Trepetin, M., Brown, D., & Kaye, H. (1988). Developmental equations for the electroencephalogram. Science, 210, 1255-1258.
Jurkiewicz, M. T., Gaetz, W. C., Bostan, A. C., & Bhattacharya, P. B. (2006). Post-movement beta rebound is generated in motor cortex: Evidence from neuromagnetic recordings. NeuroImage, 32(3), 1281-1289.
Kane, N., Acharya, J., Benickzy, S., Caboclo, L., Finnigan, S., Kaplan, P. W., Shibasaki, H., Pressler, R., & van Putten, M. J. A. M. (2017). A revised glossary of terms most commonly used by clinical electroencephalographers and updated proposal for the report format of the EEG findings. Clinical Neurophysiology Practice, 2, 170-185.
Kaplan, P. W., & Rossetti, A. O. (2011). EEG patterns and imaging correlations in encephalopathy: Encephalopathy part II. Journal of Clinical Neurophysiology, 28(3), 233-251.
Kim, J., Imaizumi, K., Jurjut, O., Kelley, K. W., Wang, D., Thete, M. V., Hudacova, Z., Amin, N. D., Levy, R. J., Scherrer, G., & Pasca, S. P. (2025). Human assembloid model of the ascending neural sensory pathway. Nature, 642, 143-153. https://doi.org/10.1038/s41586-025-08808-3
Klimesch, W. (1999). EEG alpha and theta oscillations reflect cognitive and memory performance: A review and analysis. Brain Research Reviews, 29(2-3), 169-195.
Klimesch, W. (2013). An algorithm for the EEG frequency architecture of consciousness and brain body coupling. Frontiers in Human Neuroscience, 7, 766.
Kraus, D., et al. (2011). Minimum EEG voltages in children and adults. Clinical Neurophysiology.
Kropotov, J. D. (2009). Quantitative EEG, event-related potentials and neurotherapy. Academic Press.
Lagopoulos, J., Xu, J., Rasmussen, I., Vik, A., Malhi, G. S., Eliassen, C. F., Arntsen, I. E., Saether, J. G., Hollup, S., Holen, A., Davanger, S., & Ellingsen, Ø. (2009). Increased theta and alpha EEG activity during nondirective meditation. The Journal of Alternative and Complementary Medicine, 15(11), 1187-1192.
Lisman, J. E., & Jensen, O. (2013). The theta-gamma neural code. Neuron, 77(6), 1002-1016.
Little, S., & Brown, P. (2014). The functional role of beta oscillations in Parkinson's disease. Parkinsonism & Related Disorders, 20(Suppl 1), S44-S48.
Monastra, V. J., Lubar, J. F., Linden, M., VanDeusen, P., Green, G., Wing, W., Phillips, A., & Fenger, T. N. (1999). Assessing attention deficit hyperactivity disorder via quantitative electroencephalography: An initial validation study. Neuropsychology, 13(3), 424-433. https://doi.org/10.1037/0894-4105.13.3.424
Muthukumaraswamy, S. D. (2013). High-frequency brain activity and muscle artifacts in MEG/EEG: A review and recommendations. Frontiers in Human Neuroscience, 7, 138.
Niedermeyer, E. (1997). Alpha rhythms as physiological and abnormal phenomena. International Journal of Psychophysiology, 26(1-3), 31-49.
Niedermeyer, E., & Lopes da Silva, F. H. (Eds.). (2005). Electroencephalography: Basic principles, clinical applications, and related fields (5th ed.). Lippincott Williams & Wilkins.
Nunez, P. L. (1995). Neocortical dynamics and human EEG rhythms. Oxford University Press.
Nunez, P. L., & Silberstein, R. B. (2000). On the relationship of synaptic activity to macroscopic measurements: Does co-registration of EEG with fMRI make sense? Brain Topography, 13(2), 79-96.
Nunez, P. L., & Srinivasan, R. (2006). Electric fields of the brain: The neurophysics of EEG (2nd ed.). Oxford University Press.
Pfurtscheller, G., & Berghold, A. (1989). Patterns of cortical activation during planning of voluntary movement. Electroencephalography and Clinical Neurophysiology, 72(3), 250-258.
Pineda, J. A. (2005). The functional significance of mu rhythms: Translating "seeing" and "hearing" into "doing." Brain Research Reviews, 50(1), 57-68.
Price, J., & Bhattacharya, P. B. (2009). Neurofeedback treatment of drug-resistant epilepsy: A historical review. NeuroRegulation, 1(3-4), 277-288.
Rangaswamy, M., Porjesz, B., Chorlian, D. B., Wang, K., Jones, K. A., Bauer, L. O., Rohrbaugh, J., O'Connor, S. J., Kuperman, S., Reich, T., & Begleiter, H. (2002). Beta power in the EEG of alcoholics. Biological Psychiatry, 52(8), 831-842.
Saby, J. N., & Marshall, P. J. (2012). The utility of EEG band power analysis in the study of infancy and early childhood. Developmental Neuropsychology, 37(3), 253-273.
Samaha, J., & Postle, B. R. (2015). The speed of alpha-band oscillations predicts the temporal resolution of visual perception. Current Biology, 25(22), 2985-2990.
Sauseng, P., Klimesch, W., Heise, K. F., Gruber, W. R., Holz, E., Karim, A. A., Glennon, M., Gerloff, C., Birbaumer, N., & Hummel, F. C. (2009). Brain oscillatory substrates of visual short-term memory capacity. Current Biology, 19(21), 1846-1852.
Singer, W. (2001). Consciousness and the binding problem. Annals of the New York Academy of Sciences, 929(1), 123-146.
Spaak, E., Bonnefond, M., Maier, A., Leopold, D. A., & Jensen, O. (2012). Layer-specific entrainment of gamma-band neural activity by the alpha rhythm in monkey visual cortex. Current Biology, 22(24), 2313-2318.
Spitzer, B., & Haegens, S. (2017). Beyond the status quo: A role for beta oscillations in endogenous content (re)activation. eNeuro, 4(4), ENEURO.0170-17.2017.
Steriade, M. (2005). Cellular substrates of brain rhythms. In E. Niedermeyer & F. Lopes da Silva (Eds.), Electroencephalography: Basic principles, clinical applications, and related fields (5th ed.). Lippincott Williams & Wilkins.
Steriade, M., Nuñez, A., & Amzica, F. (1993). A novel slow (< 1 Hz) oscillation of neocortical neurons in vivo: Depolarizing and hyperpolarizing components. The Journal of Neuroscience, 13(8), 3252-3265.
Sterman, M. B. (1996). Physiological origins and functional correlates of EEG rhythmic activities: Implications for self-regulation. Biofeedback and Self-Regulation, 21(1), 3-33.
Sterman, M. B. (2000). EEG markers for attention deficit disorder: Pharmacological and neurofeedback applications. Child Study Journal, 30(1), 1-24.
Thatcher, R. W., Krause, P. J., & Hrybyk, M. (1986). Cortico-cortical associations and EEG coherence: A two-compartmental model. Electroencephalography and Clinical Neurophysiology, 64(2), 123-143.
Thatcher, R. W., North, D., & Biver, C. (2008). Development of cortical connections as measured by EEG coherence and phase delays. Human Brain Mapping, 29(12), 1400-1415.
Thompson, M., & Thompson, L. (2016). The biofeedback book: An introduction to basic concepts in applied psychophysiology (2nd ed.). Association for Applied Psychophysiology and Biofeedback.
Tong, S., & Thakor, N. V. (Eds.). (2009). Quantitative EEG analysis methods and clinical applications. Artech House.
Tort, A. B. L., Komorowski, R., Eichenbaum, H., & Kopell, N. (2010). Measuring phase-amplitude coupling between neuronal oscillations of different frequencies. Journal of Neurophysiology, 104(2), 1195-1210.
Treisman, A. (1996). The binding problem. Current Opinion in Neurobiology, 6(2), 171-178.
Uhlhaas, P. J., & Singer, W. (2010). Abnormal neural oscillations and synchrony in schizophrenia. Nature Reviews Neuroscience, 11(2), 100-113.
Uhlhaas, P. J., Pipa, G., Neuenschwander, S., Wibral, M., & Singer, W. (2011). A new look at gamma? High- (>60 Hz) γ-band activity in cortical networks: Function, mechanisms and impairment. Progress in Biophysics and Molecular Biology, 105(1-2), 14-28.
Voytek, B., Canolty, R. T., Shestyuk, A., Crone, N. E., Parvizi, J., & Knight, R. T. (2010). Shifts in gamma phase-amplitude coupling frequency from theta to alpha over posterior cortex during visual tasks. Frontiers in Human Neuroscience, 4, 191.
Xie, L., Kang, H., Xu, Q., Chen, M. J., Liao, Y., Thiyagarajan, M., O'Donnell, J., Christensen, D. J., Bhattacharya, P. B., Bhattacharya, P. B., & Nedergaard, M. (2013). Sleep drives metabolite clearance from the adult brain. Science, 342(6156), 373-377.
Zhang, H., Watrous, A., Patel, A., & Jacobs, J. (2018). Theta and alpha oscillations are traveling waves in the human neocortex. Neuron. https://doi.org/10.1016/j.neuron.2018.05.019
Return to Top